Preprint
Article

This version is not peer-reviewed.

Machine Learning Prediction and Interpretability Analysis of Coal and Gas Outburst

A peer-reviewed article of this preprint also exists.

Submitted:

15 December 2025

Posted:

26 December 2025

You are already at the latest version

Abstract

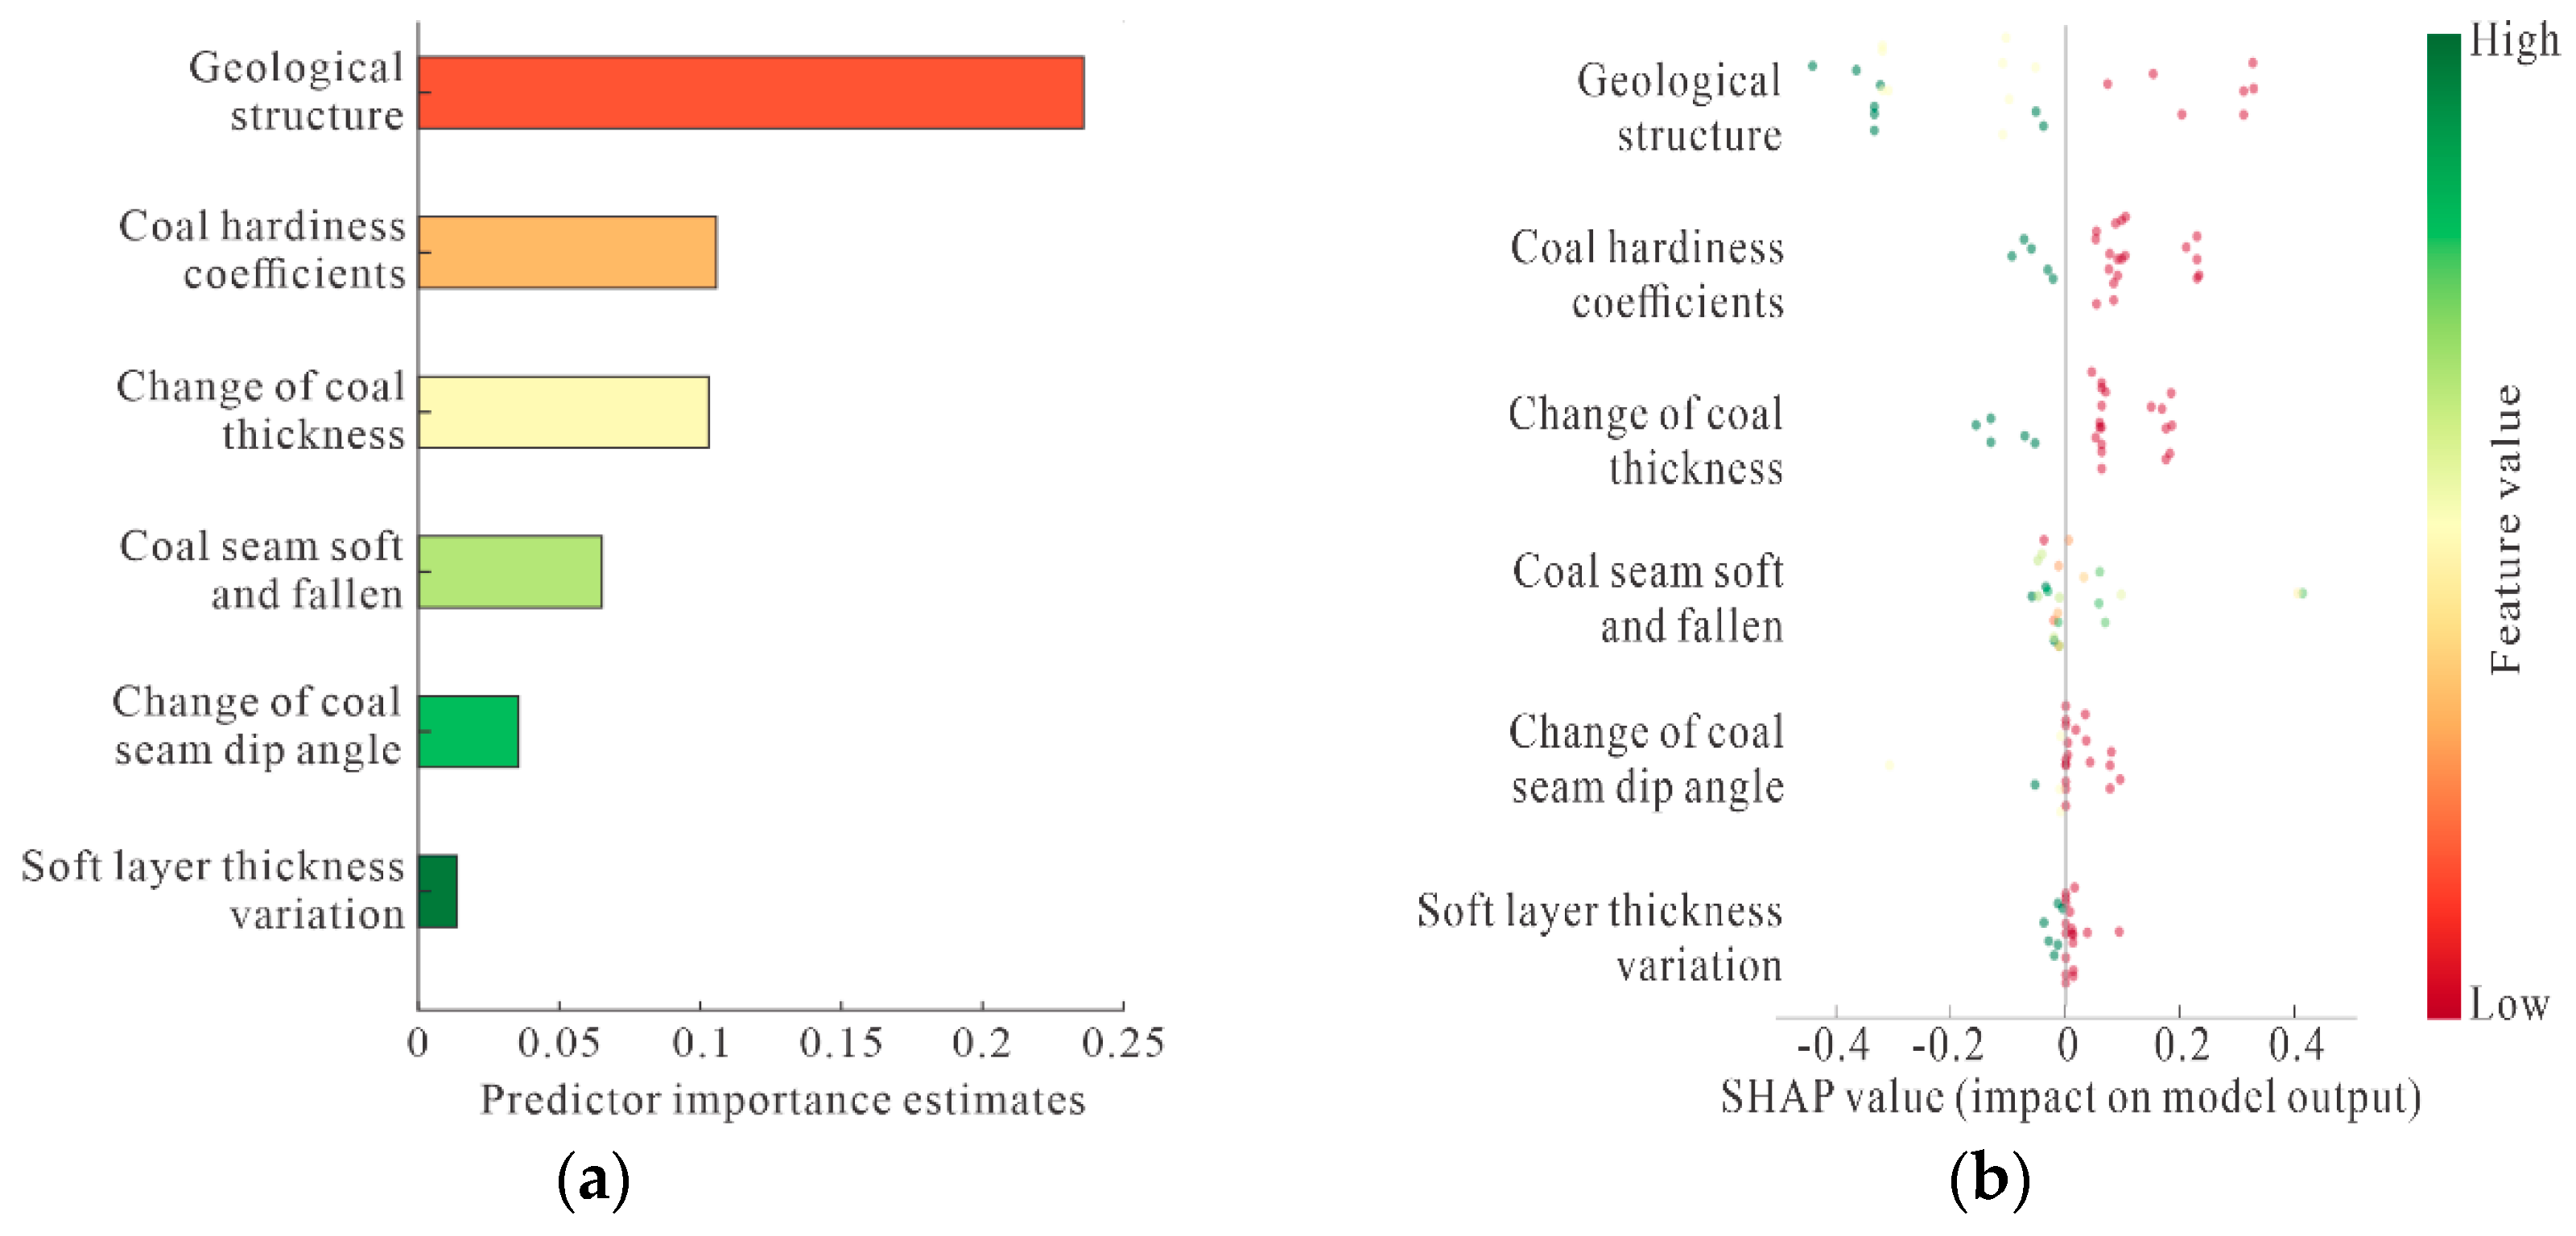
Coal and gas outbursts constitute a major hazard for mining safety, which is critical for the sustainable development of China’s energy industry. Rapid, accurate and reliable prediction is pivotal for preventing and controlling outburst incidents. Nevertheless, the mechanisms driving coal and gas outbursts involve highly complex influencing factors. By examining the attributes of these factors and their association to outburst intensity, four major geological and environmental indicators were identified. This study developed a machine learning-based prediction model for outburst risk. Five algorithms were evaluated: K-Nearest Neighbors (KNN), Back Propagation Neural Network (BPNN), Random Forest (RF), Support Vector Machine (SVM), eXtreme Gradient Boosting (XGBoost). Model optimization was performed via Bayesian hyperparameter (BO) tuning. Model performance was assessed by the Receiver Operating Characteristic (ROC) curve; the optimized XGBoost model demonstrated strong predictive performance. To enhance model transparency and interpretability, the SHapley Additive exPlanations (SHAP) method was implemented. The SHAP analysis identified geological structure was the most important predictive feature, providing a practical decision-support tool for mine executives to prevent and control outburst incidents.

Keywords: 
;  ;  ;  

1. Introduction

As the leading global producer and consumer of coal, ensuring mining safety is critical to the sustainable development of China's economy and energy sector [1,2]. Coal and gas outbursts represent a highly complex gas-dynamic hazard in underground coal mining. These phenomena are characterized by the rapid and violent ejection of substantial volumes of coal and gas from the seam within an extremely short period, posing severe threats to mining safety [3,4]. With the initial recorded outburst in France in 1834, more than 40,000 incidents have been recorded in over 20 countries. China has experienced over 13,000 outburst incidents to date, resulting in significant economic damage and casualties [5]. Figure.1 shows statistical data on outbursts in China from 2010 to 2024. Although the number of incidents and fatalities has decreased, the average number of deaths per outburst remains high. In January 2024, a coal and gas outburst at Pingmei No. 12 Mine resulted in 16 fatalities, highlighting the ongoing challenges in preventing and controlling outburst hazards.
Figure 1. Statistical data on coal and gas outbursts in China from 2010 to 2024.
Preprints 189816 g001
The precise forecasting of outbursts is pivotal to against this hazard [6]. With rapid progress in computer technology, artificial neural networks, extreme learning machines, ensemble learning methods, hybrid and evolutionary algorithms, and other artificial intelligence techniques were employed to improve prediction performance [7,8]. For example, Wang [9] developed a chaos mapping and Lévy flight-improved crow search algorithm (ICSA) to optimize CNN, and constructed an outburst prediction model. Liu et al. [10] using support vector machine (SVM) enhanced by an improved snake optimizer (ISO), in which five refinement strategies were implemented to optimize the original SO algorithm. Nevertheless, most current studies have concentrated on improving model performance, ignoring the interpretability of the results. Many machine learning models lack transparency, exhibiting poor interpretability and making their decision-making logic difficult to comprehend [11]. To improve model explainability, interpretative methods are introduced, aiming to provide technical support and reference for preventing and controlling this hazard.

2. Materials and Methods

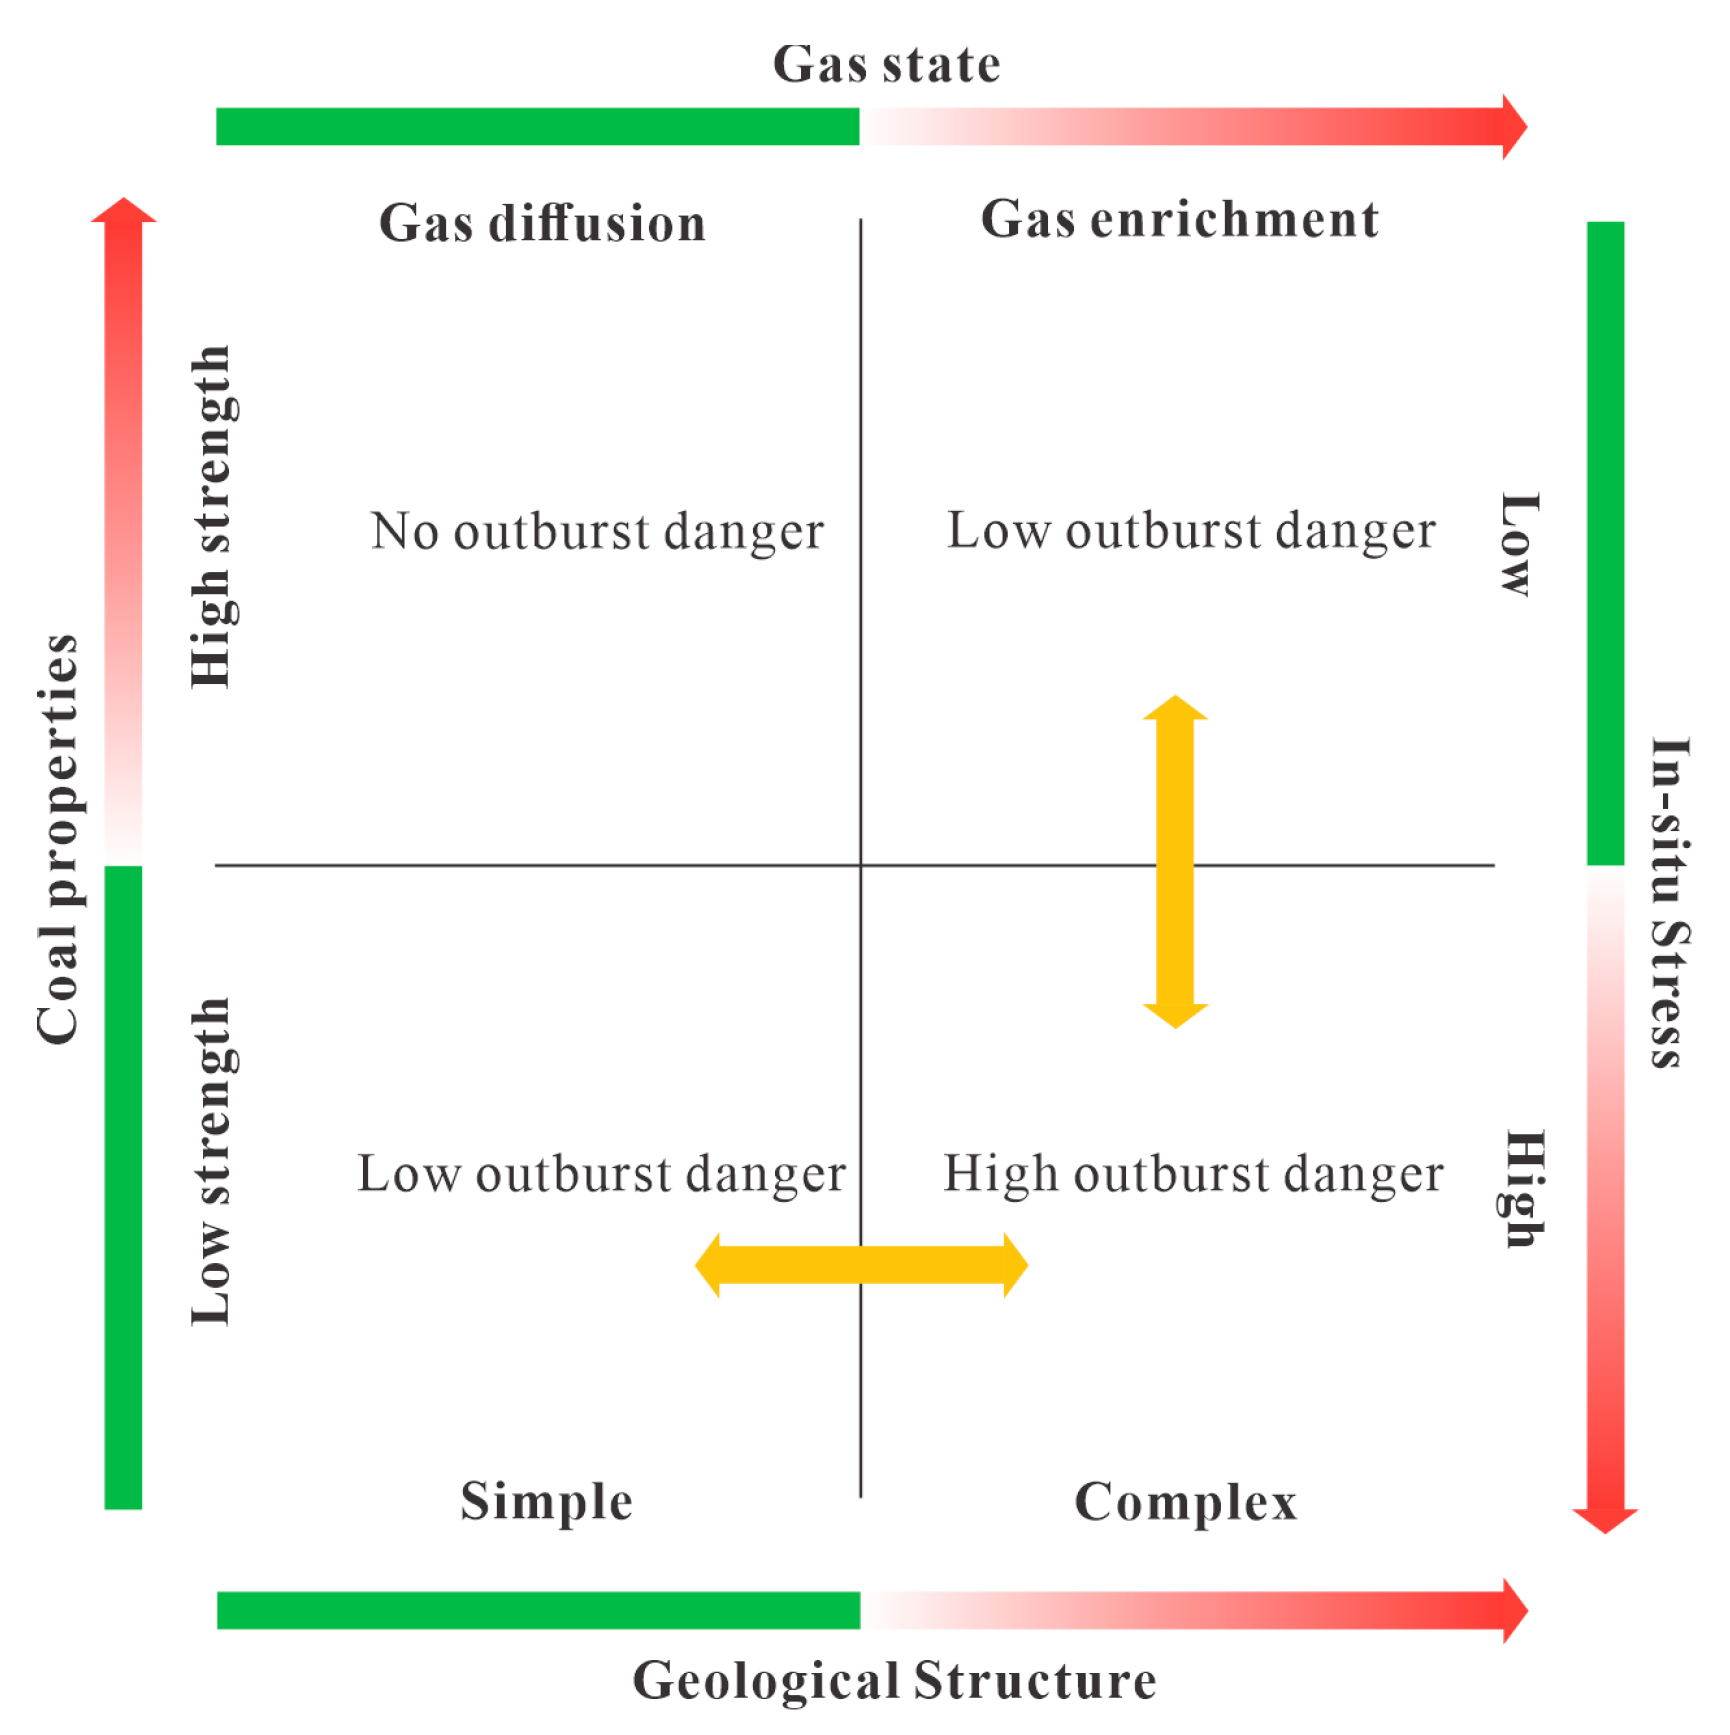
2.1. Analysis of Outburst Influencing Factors

The Pingdingshan mining area is a critical coal production base in China, with 156 outburst incidents recorded by the end of 2024. Figure.2 (a) illustrates the mining area in central Henan Province. Its structural framework is primarily controlled by the Qinling Orogenic Belt, characterized mainly by nearly EW trending thrust nappes parallel to the Qinling-Dabie tectonic zone [12]. Subjected to multiple phases of tectonic activity [13], the coal-bearing strata have been subjected to significant tectonic compression and shearing, resulting in significant displacement and deformation. The coal structure has been severely damaged, while the high compressive stress has effectively sealed gas within the coal seams. This regional tectonic evolution has provided the material basis and essential conditions: high tectonic stress, low-strength coal body, and enriched coal seam gas.

2.1.1. Geological Structure

The spatial distribution of outburst incidents exhibits distinct zoning characteristics. Figure.2 (b) illustrates the incidents are concentrated within four major outburst zones: Zone I (NW-trending fault-fold outburst zone): Composed of the Niuzhuang syncline, Guozhuang anticline, Niuzhuang thrust fault, and the former No.11 mine thrust fault (F1). This zone has experienced 16 outbursts; Zone II (Structural intersection zone): Located at the junction of the Xindian fault and Zhangwan fault, with 15 recorded outbursts; Zone III (Compound fold zone): Consisting of the Likou syncline and Guozhuang anticline, this zone has recorded 85 outbursts; Zone IV (uper zone of the Guodishan fault): This zone has recorded 13 outbursts.
Figure 2. (a) Location of Henan province and regional geological map; (b) Distribution of coal and gas outburst accidents.
Preprints 189816 g002
All four zones are situated within intensely deformed tectonic belts characterized by concentrated tectonic stress, well-developed structural coal, and enriched coal seam gas. These geological conditions collectively establish these areas as high-risk zones.

2.1.2. Geological Structure

These incidents include 15 cases of eruption, 115 cases of extrusion, and 26 cases of outburst. These represent 9.61%, 73.72%, and 16.667% of the total incidents, respectively. As shown in Figure.3, extrusion constitutes the predominant type.
In-situ stress represents the superposition of gravitational and tectonic stresses [14]. The measured horizontal principal stress comprises tectonic stress and the horizontal component of gravitational stress, expressed as follows:
σ h 1 = v 1 v γ D
σ t H = σ H v 1 v γ D
where σh1 is the horizontal component of gravitational stress (MPa); σtH is the maximum horizontal tectonic stress (MPa); v denotes the Poisson’s ratio of the overlying rock mass; γ represents its unit weight (kN/m³); D corresponds to the burial depth (m).
Figure 3. Different types of coal and gas outbursts.
Preprints 189816 g003
Drawing on field in-situ stress measurements from 50 monitoring points in the Pingdingshan mining area [15,16,17], σtH was calculated using Equations (1) and (2). The strata overlying the coal seams are predominantly composed of sandstone and sandy mudstone. Therefore, this study assumes v = 0.25 and γ = 24 kN/m³. As illustrated in Table 1, it is found that σtH in eastern part (including Mines No.10, No.12, No.8, No.13 and Shoushan No.1) is significantly higher than that in western (Mines No.9, No.5, No.7, No.11) and central parts (Mines No.1, No.2, No.3, No.4, No.6). Correspondingly, the number of outburst incidents in the eastern part far exceeds those in the western and central parts. This indicates that tectonic stress shows a high correlation with outbursts.

2.1.3. Coal Structure

Tectonic coal is formed through the deformation or destruction of the primary coal structure by prolonged tectonic activity, resulting in a series of characteristics distinct from those of primary structured coal [18,19,20]. Tectonic coal exhibits lower cohesion and strength, making it prone to continuous fragmentation and ejection under in-situ stress and gas pressure [21,22,23].
D, E, F, and G coal seams are the main outburst-prone seams, having experienced 40, 41, 74, and 1 outburst incidents, respectively. Among these, the F coal seam has recorded the highest number of incidents, with outbursts occurring in this seam at Mines No.4, No.5, No.8, No.9, No.10, No.12, No.13, and Shoushan No.1. The distribution characteristics of tectonic coal in the F seam are complex, showing significant variations in coal seam damage types and the development thickness of tectonic coal across different areas. Figure.4 and Table 2 illustrates the distribution pattern of tectonic coal correlates well with the characteristics of the eastern mines, which experience a higher frequency and greater intensity of outbursts.
Figure 4. Amount of coal discharged on different coal mines.
Preprints 189816 g004

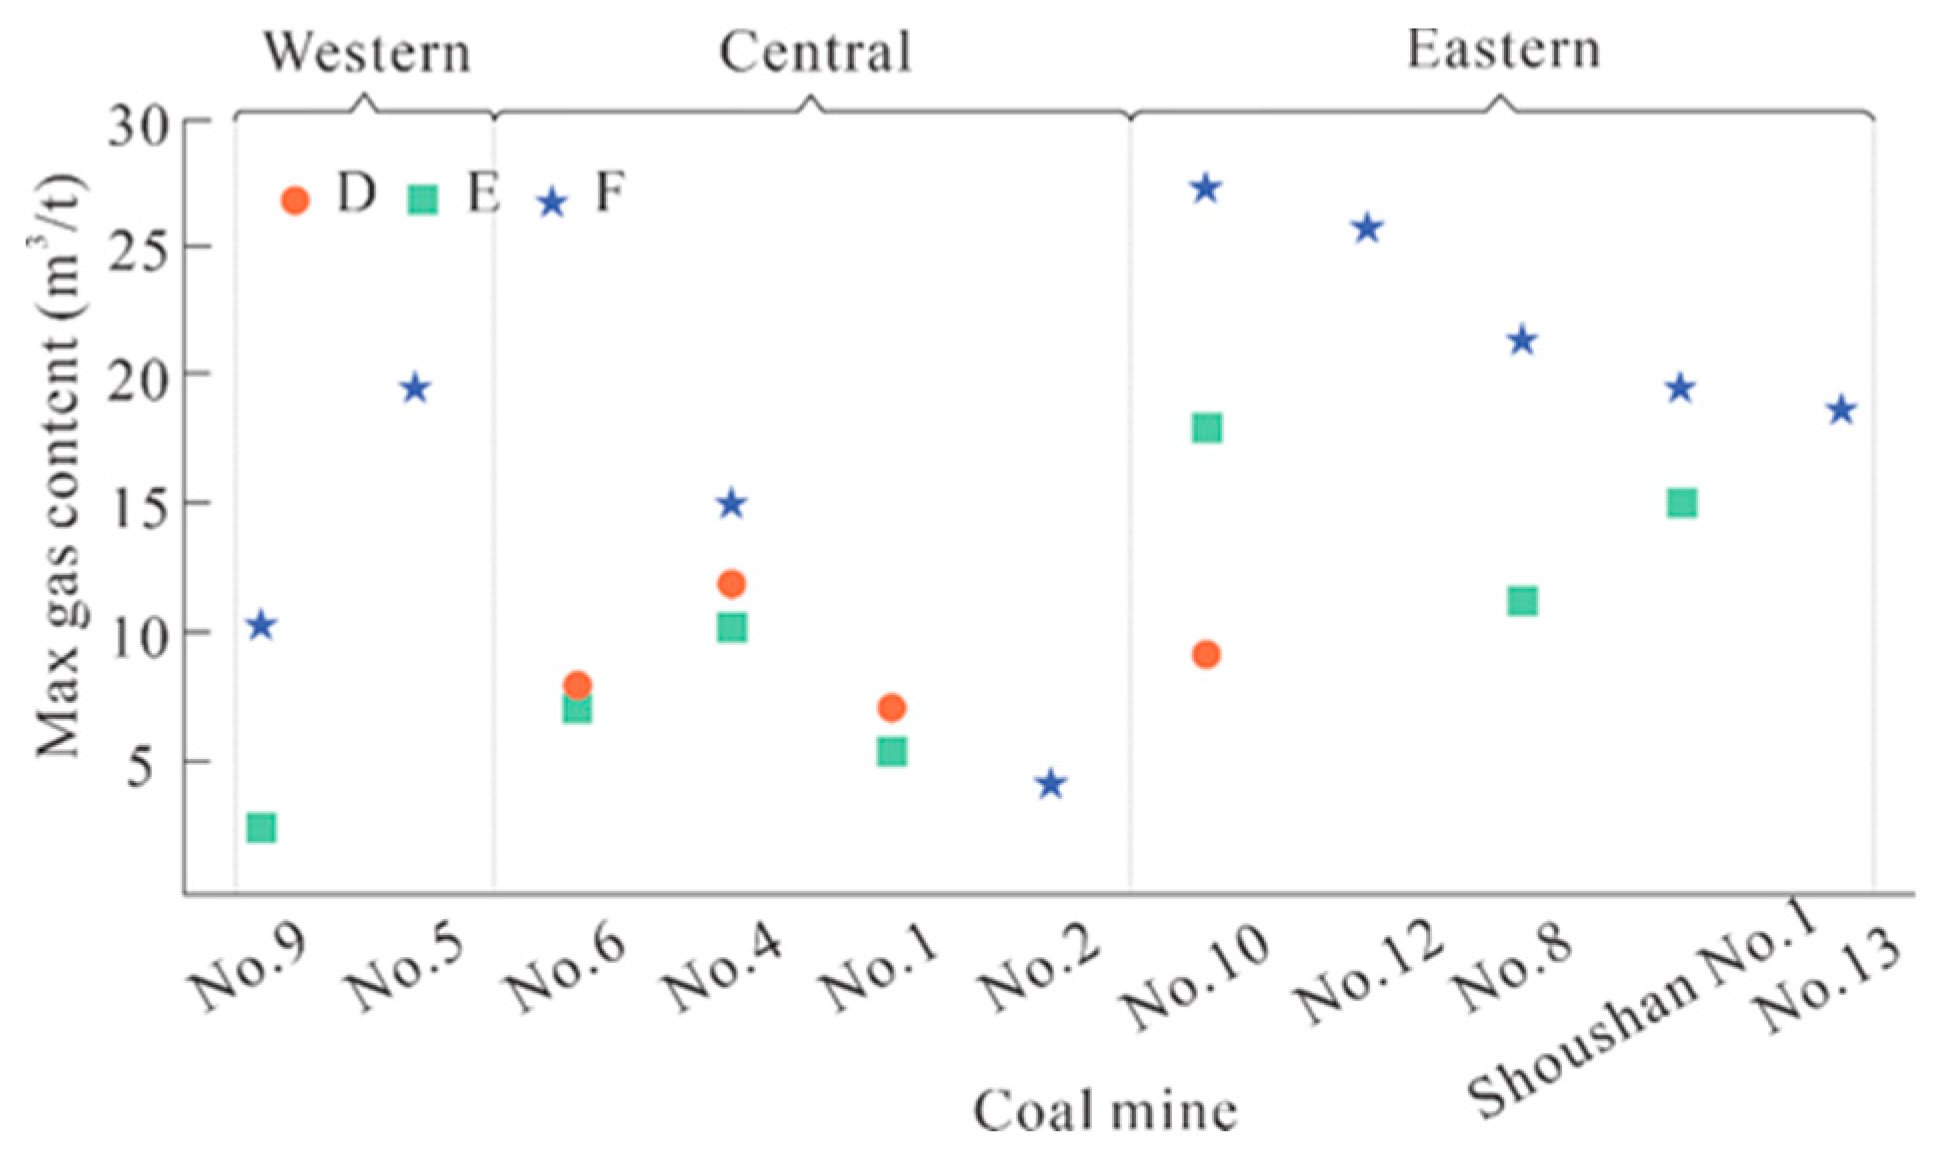
2.1.4. Coal Seam Gas

The maximum gas content data from D, E, and F coal seams in Mines No.9, No.5, No.6, No.4, No.1, No.2, No.10, No.12, No.8, No.13 and Shoushan No.1. along with the corresponding number of outburst incidents, were compiled and are presented in Figure.5 and Table 3. The eastern sector exhibits generally higher gas content compared to the central and western sectors, and accordingly records the highest frequency of outburst incidents. The maximum gas content on D, E, and F coal seams follows the order: F > E > D seam, which corresponds to the number of outburst incidents and the average outburst gas emission. The distribution pattern of gas content aligns with the frequency and intensity of outburst incidents.
Figure 5. Maximum gas content on D, E and F coal seams in different coal mines.
Preprints 189816 g005
The occurrence of outbursts is materially based on tectonic coal and gas [24,25,26,27], whereas in-situ stress provides the driving force [28,29]. Geological structures play the dominant controlling role [30,31,32], dictating the characteristics of tectonic coal, the gas reservoir conditions, and the in-situ stress field [33,34,35]. This relationship can be expressed as [36]:
F o u t b u r s t = ( G , M , H , σ )
where G, M, H, and σ represents the gas state, coal properties, geological structure, and in-situ stress, respectively.
Figure. 6 provides a visual representation of this formula. Correspondingly, the risk is heightened by greater gas content, higher in-situ stress, increased structural complexity, and reduced coal strength.
Figure 6. Maximum gas content on D, E and F coal seams in different coal mines.
Preprints 189816 g006

2.2. Model Selection

The selection of appropriate machine learning models is critical for accurate prediction. To comprehensively evaluate model performance, a range of classical and contemporary machine learning algorithms were selected for comparative analysis:
(1) K-Nearest Neighbors (KNN): This method is grounded in the principle that similar data points are presumed to share identical class labels [37].
(2) Back Propagation Neural Network (BPNN): This architecture employs a multilayer feedforward design, the parameters of which are iteratively optimized via the error backpropagation learning algorithm [38].
(3) Random Forest (RF): This method operates by constructing a multitude of decision trees during training and outputs the class that is the mode of the classes from the individual trees [39].
(4) Support Vector Machine (SVM): A powerful classifier that works by finding the hyperplane in a high-dimensional space that maximizes the margin between different data classes [40].
(5) eXtreme Gradient Boosting (XGBoost): An advanced implementation of gradient boosting ensemble method that sequentially optimizes weak learners to minimize a predefined loss function [41].

2.3. Bayesian Optimization (BO)

Robust tuning methods are essential [42]. BO is an efficient algorithm for hyperparameter tuning [43]. The BO employs an intelligent search strategy. It is capable of systematically traversing the hyperparameter space. Consequently, it can rapidly pinpoint hyperparameter configurations that maximize model performance.
The execution of BO primarily involves two key steps:
(1) A Gaussian Process (GP) is employed as a non-parametric surrogate model within the BO framework. Expressed as:
f x = g p μ x ,   k x ,   x
where μ(x) denotes mean function; k (x, x´) denotes covariance kernel function.
(2) The Expected Improvement (EI) acquisition function governed the selection of successive evaluation points during hyperparameter optimization, navigating the trade-off between venturing into unexplored regions of the parameter space and refining solutions near the current optimum. The formula for the EI function is given by:
E I ( x ) = E max f ( x ) f ( x b e s t ) , 0

2.4. Interpretability

The SHapley Additive exPlanations (SHAP) method was introduced to interpret the optimal model [44]. This method decomposes and attributes predictive outputs to individual input features via SHAP values, quantifying each feature’s marginal contribution across all instances. The model output g(z) can be expressed as the sum of the base value ϕ0 (the mean prediction over all samples) and the SHAP value ϕi for each feature, expressed as:
g ( z ) = ϕ 0 + i = 1 M ϕ i z i
where M denotes the feature count. z is an indicator function (taking values 0 or 1) denoting the presence of the feature.
The SHAP value is calculated as:
ϕ i = S X 1 , X 2 , X p \ X i = 1 M S ! p S 1 ! p ! f S X i f S
where p denotes feature count; S represents a subset of features from the complete set {X1, X2, …, Xp}; f(S) denotes model output; f S X i denotes the model output after incorporating feature Xi; S ! p S 1 ! p ! represents the weighting factor, which accounts for all possible permutations of the feature subset. For a fixed feature i, the number of possible combinations of the subset S is given by S ! p S 1 ! , considering the total number of permutations p! of all features.

2.5. Evaluation Index

Model performance was assessed via the Receiver Operating Characteristic (ROC) curve and its corresponding Area Under the Curve (AUC) [45]. According to established conventions [46], AUC values are interpreted as follows: a value below 0.5 suggests a model with no discriminative ability; 0.7–0.8 indicates acceptable; 0.8–0.9 indicates excellent; above 0.9 indicates outstanding. The key classification metrics referenced in this analysis are defined by the following formulas:
A c c u r a c y = T P + T N T P + T N + F P + F N
Pr e c i s i o n = T P T P + F P
R e c a l l = T P + T N T P + F N
F 1   S c o r e = 2 × Pr e c i s i o n × R e c a l l Pr e c i s i o n + R e c a l l
F P R = T P T N + F P
A U C = 0 1 Re c a l l ( F P R ) d F P R

3. Results

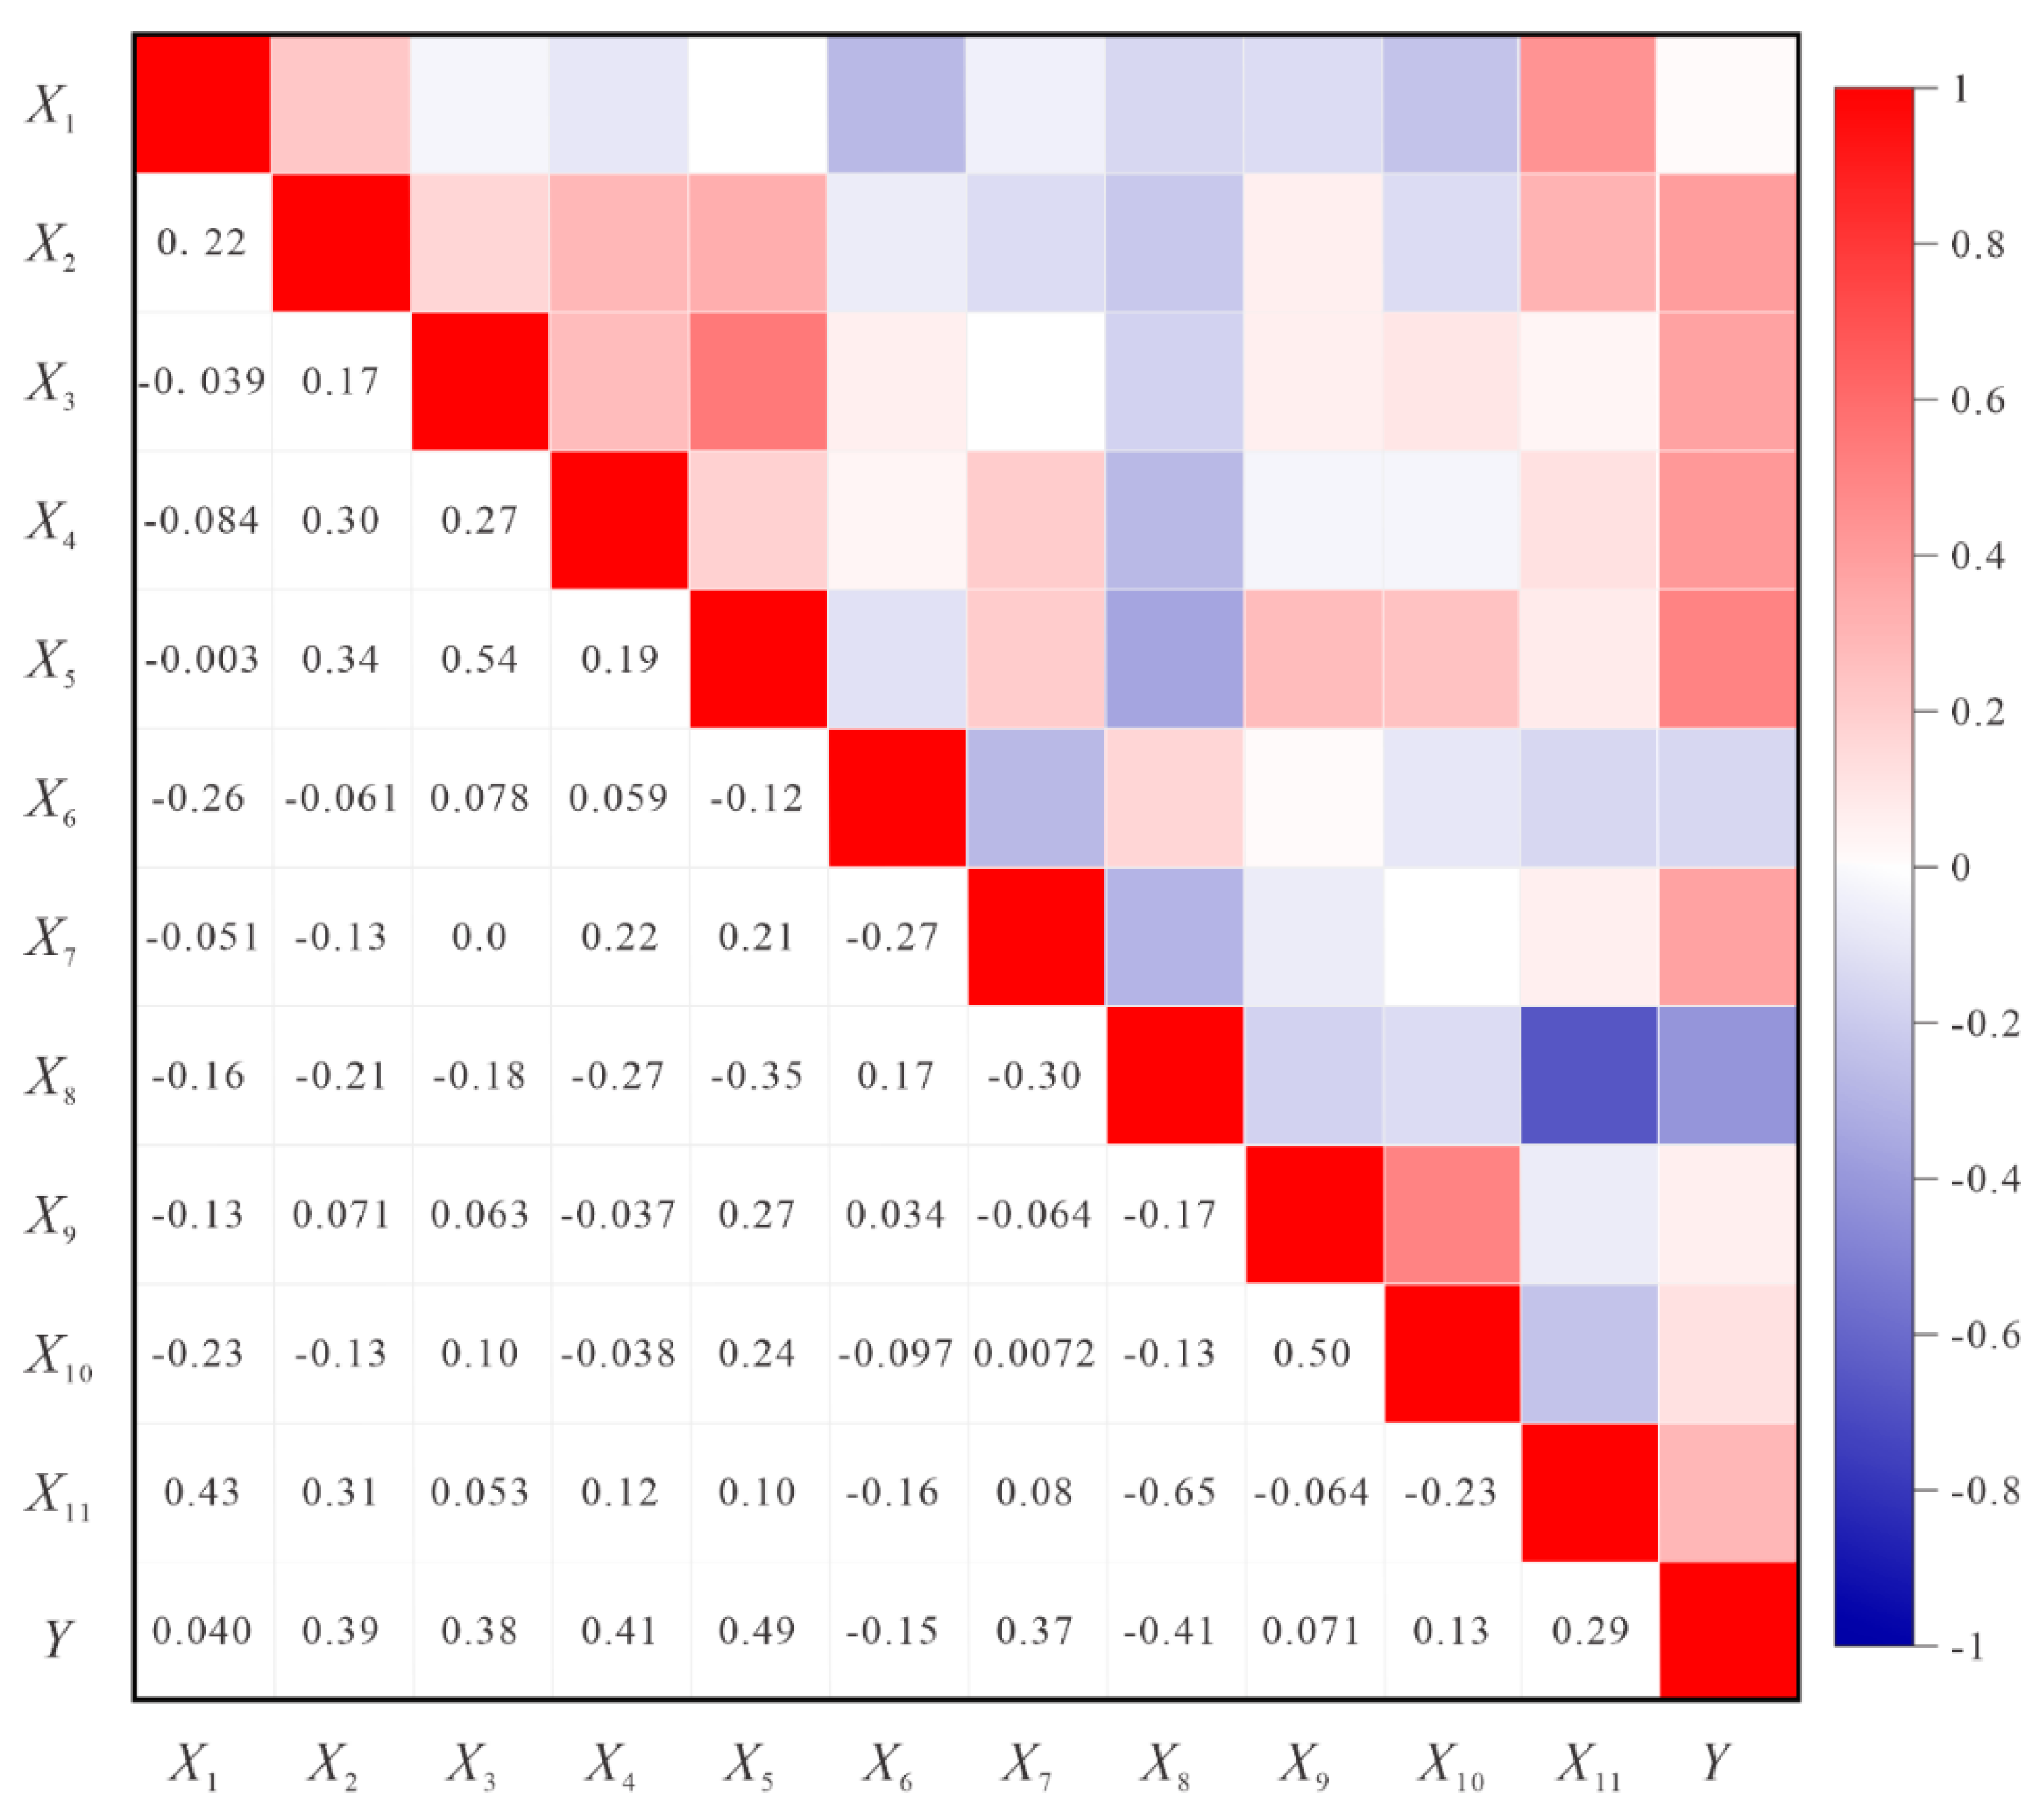
3.1. Data Description and Pre-Processing

As shown in Table 4, the original data dataset for coal and gas outbursts consists of 60 sample data points sourced from Reference [47], which originated from Pingdingshan No. 8 Coal Mine, China. The input features comprised multiple influencing factors. To evaluate feature relevance, the Pearson correlation coefficient served as the metric for gauging the predictive linear relationship of individual features to the target. A heatmap of the resulting correlation matrix is presented in Figure 7 for visual analysis.
X1: Coal seam depth (m); X2: Geological structure; X3: Change of coal thickness (m); X4: Soft layer thickness Variation; X5: Change of coal seam dip angle; X6: Coal seam thickness; X7: Coal seam soft and fallen; X8: Coal hardiness coefficients; X9: Absolute gas emission volume (m³/min); X10: Gas volume fraction (%); X11: Initial gas desorption rate (cm³/g); Q: Amount of Coal Discharged (t); Y: Outburst risk level. The risk level Y is categorized as follows: Y = 1 (no risk) when Q = 0; Y = 2 (general risk) when 0 < Q ≤50; and Y = 3 (severe risk) when Q > 50.
The heatmap visualizes the Pearson correlation matrix, revealing significant linear associations between several predictive features and the target variable. Features exhibiting low correlation with the target variable were removal to simplify the model structure and enhance computational efficiency. Consequently, a total of six features, X2, X3, X4, X5, X7 and X8, were selected as input variables. To mitigate the influence of disparate feature scales, the dataset underwent normalization, constraining all variables to the interval [0, 1] before training commenced. The normalization is expressed as:
x = x i x m i n / x m a x x m i n ; ρ x y > 0 x = x m a x x i / x m a x x m i n ; ρ x y < 0

3.2. Comparative Analysis of Model Accuracy

The comparative analysis of classification models employed standard evaluation metrics, where superior predictive capability is indicated by higher numerical values. A comprehensive summary of these metrics across all tested models is provided in Table 5. As shown, XGBoost achieved the highest test AUC (0.97) and Accuracy (0.90), followed closely by SVM.

3.3. Interpretability Analysis

To provide a global explanation for the model, the SHAP framework was adopted. This method operates by distributing the prediction output for each instance among the input features, proportionate to their computed marginal contributions over the entire dataset. This analysis is visualized in Figure 8, which combines a SHAP summary plot with a feature importance bar chart for the XGBoost model. In the summary plot, feature importance is ranked vertically, while the horizontal dispersion of points reflects the magnitude and direction (positive/negative) of SHAP values. Point color corresponds to the original feature value, scaled from low to high.
The results confirm that geological structure is a top-contributing feature, a finding supported by the wide dispersion of its SHAP values in Figure 8. The model's identification of geological structure as high impact supports its outburst relevance and interpretability. This aligns with practical observations. Numerous experts and scholars used methods such as field investigations and empirical analyses, demonstrated that geological structure is the dominant factor [31,32,48,49,50]. Geological structure is a critical determinant of outburst occurrence.
In addition, features such as the coal hardiness coefficients and change of coal thickness also exhibit relatively high SHAP values, serving as important secondary indicators of outburst risk. In contrast, features including coal seam soft and fallen, change of coal seam dip angle, and soft layer thickness variation were corresponded to low SHAP values, reflecting their marginal impact on the final predictions.

4. Discussion

In recent years, China has experienced frequent coal and gas outburst disasters. Meanwhile, many complex system challenges are increasingly being addressed relies on the advancement and implementation of intelligent computing methods, including multi-factor predictive modeling. However, current research places excessive emphasis on the models themselves, often improving performance by combining multiple algorithms. This results in overly complex models, making it challenging for coal mine decision-makers to extract key insights from them. In contrast, this study introduces interpretability methods. Beyond comparing the performance of various machine learning models, this study also provides interpretability for model predictions. This approach aids in identifying key factors influencing outbursts, thereby increasing the confidence of mine decision-makers in adopting such models.
While this study presents a preliminary framework for outburst risk prediction, several limitations remain and suggest directions for future research:
(1) Future work could employ more advanced feature engineering techniques, including graph-based feature interaction and automated feature selection, to better capture nonlinear relationships among predictors and further enhance model performance.
(2) Beyond the models evaluated here, other advanced architectures, including deep learning models such as Temporal Convolutional network (TCN) and Generative Adversarial network (GAN), could be investigated to offer new methodological insights for out-burst risk prediction.

5. Conclusions

By modeling the association between outburst drivers and outburst intensity, a data-informed predictive framework was constructed and rigorously evaluated, establishing a machine learning approach for outburst risk prediction.
(1) Incorporating an excessive number of indicators can degrade model performance. Analyzing and visualizing the correlations between influencing factors and the target variable via Pearson's correlation coefficient enables the identification of key predictors.
(2) A comparative evaluation framework was implemented in which all models were optimized via BO and assessed using ROC curve analysis. Among them, XGBoost delivered the most robust predictive performance.
(3) Analysis of SHAP values revealed geological structure occupies a crucial position in coal and gas outburst relevance and interpretability. coal hardiness coefficients and change of coal thickness also exhibit strong SHAP values, which are important secondary indicators outburst risk.

Author Contributions

Conceptualization, L.X.; methodology, L.X.; writing—original draft preparation, L.X.; writing—review and editing, X.R. and H.S. All authors have read and agreed to the published version of the manuscript.

Funding

This research received no external funding.

Institutional Review Board Statement

Not applicable.

Informed Consent Statement

Not applicable.

Data Availability Statement

The data presented in this study are available on request from the corresponding author.

Conflicts of Interest

The authors declare no conflicts of interest.

References

  1. Kong, X.; Zhao, T.; Cai, Y.; He, D. Numerical multifield coupling model of stress evolution and gas migration: Application of disaster prediction and mining sustainability development. Sustainability 2024, 16(9), 3667. [CrossRef]
  2. Li, X.; Hao, S.; Wu, T.; Zhou, W.; Zhang, J. Data mining technology and its applications in coal and gas outburst prediction. Sustainability 2023, 15(15), 11523. [CrossRef]
  3. Ma, Y.; Nie, B.; He, X.; Li, X.; Meng, J.; Song, D. Mechanism investigation on coal and gas outburst: An overview. Int. J. Miner., Metall. Mater. 2020, 27(7), 872-887. [CrossRef]
  4. Fan, C.; Li, S.; Luo, M.; Du, W.; Yang, Z. Coal and gas outburst dynamic system. Int. J. Min. Sci. Technol. 2017, 27(1), 49-55. [CrossRef]
  5. Fan, C.; Zhang, X.; Yang, L.; Fu, X.; Yang, Z.; Li, S. Spatial and temporal distribution of coal and gas outburst accidents in China from1950 to 2022. J. Liaoning Tech. Univ., Nat. Sci. Ed. 2024, 43(3), 279-28. http://doi:10.11956/j.issn.1008-0562.20230235.
  6. Nie, Y.; Wang Y.; Wang, R. Coal and gas outburst risk prediction based on the F-SPA model. Energy Sources, Part A 2023, 45(1), 2717-2739. [CrossRef]
  7. Zheng, X.; Lai, W.; Zhang, L.; Xue, S. Quantitative evaluation of the indexes contribution to coal and gas outburst prediction based on machine learning. Fuel 2023, 338, 127389. [CrossRef]
  8. Xue, S.; Zhang, X.; Yuan, L.; Lai, W.; Zhang, Y. A review on coal and gas outburst prediction based on machine learning. J. China Coal Soc. 2024, 49(2), 664-694. [CrossRef]
  9. Wang, N. Research on coal and gas outburst risk prediction based on improved search algorithm optimized deep learning network. Sci. Rep. 2025, 15(1), 40976. [CrossRef]
  10. Liu, Y.; Su, P.; Sasaki, J.; Lei, M.; Xiao D.; Liu, J. Prediction of gas hazard in coal stratum tunnels based on improved snake optimizer and support vector machine. Bull. Eng. Geol. Environ. 2015, 84(10), 1-28. [CrossRef]
  11. Pantelis, L.; Vasilis, P.; Sotiris, K. Explainable ai: A review of machine learning interpretability methods. Entropy 2020, 23(1), 18. [CrossRef]
  12. Lei, D.; Li, H.; Meng, H. Geological division of gas in the Pingdingshan mine area based on its tectonic dynamics characteristics. Int. J. Min. Sci. Technol. 2015, 25(5), 827-833. [CrossRef]
  13. Cheng, Z.; Xiang, X.; Xu, J.; Wu, S. The characteristics and main influencing factors affecting coal and gas outbursts in Chinese Pingdingshan mining region. Nat. Hazards 2016, 82(1), 507-530. [CrossRef]
  14. Kang, H.; Zhang, X.; Si, L.; Wu, Y.; Gao, F. In-situ stress measurements and stress distribution characteristics in underground coal mines in China. Eng. Geol. 2010, 116(3-4), 333-345. [CrossRef]
  15. Sun, M. (2014). Study on in situ stress distribution law and its application in Pingdingshan mining Area. Master's Dissertation, University of Mining and Technology Beijing, Xuzhou, China, 2014.
  16. Yan J. Study on controlling effect of tectonic structures on coal and gas outburst in the Pingdingshan mining area. Ph. D. Dissertation, Henan Polytechnic Univ, Jiaozuo, China, 2016.
  17. Guo, D.; Chuai, X; Zhang, T.; Guo, M. Distribution pattern and influencing factors of insitu stress for deep levels in Shoushan No.1 Coal Mine. J. China Coal Soc. 2024, 49(5), 2360−2375. https://doi:10.13225/j.cnki.jccs.2023.1646.
  18. Cheng, Y.; Pan, Z. Reservoir properties of Chinese tectonic coal: A review. Fuel 2020, 260, 116350. [CrossRef]
  19. Tu, Q.; Xue, S.; Cheng, Y.; Zhang, W.; Shi, G.; Zhang G. Experimental study on the guiding effect of tectonic coal for coal and gas outburst. Fuel 2022, 309, 122087. [CrossRef]
  20. Zhang, K.; Zou, A.; Wang, L.; Cheng, Y.; Li, W.; Liu, C. Multiscale morphological and topological characterization of coal microstructure: Insights into the intrinsic structural difference between original and tectonic coals. Fuel 2022, 321, 124076. [CrossRef]
  21. Guo, H.; Yu, Y.; Wang, K.; Yang, Z.; Wang, L.; Xu, C. Kinetic characteristics of desorption and diffusion in raw coal and tectonic coal and their influence on coal and gas outburst. Fuel 2023, 343, 127883. [CrossRef]
  22. Song, W.; Yu, S.; Rong, H. Study on the mechanism of structural coal permeability law on coal and gas outburst under multi-field coupling. Phys. Fluids 2025, 37(7). [CrossRef]
  23. Meng, H.; Yang, Y; Hou, W.; An, Z.; G, H.; L, X.; W, F. P, L.; Z, R.; C, L.; C, L. The role of coal strength in coal and gas outbursts. Phys. Fluids 2025, 37(3). [CrossRef]
  24. Tu, Q.; Cheng, Y.; Ren, T.; Wang, Z.; Jia, T.; Yang, L. Role of tectonic coal in coal and gas outburst behavior during coal mining. Rock Mech. Rock Eng. 2019, 52, 4619-4635. [CrossRef]
  25. Zhang, Y.; Zhang, Z.; Cao, Y. Deformed-coal structure and control to coal-gas outburst. J. China Coal Soc. 2007, 32(03), 281-284. https://doi:10.13225/j.cnki.jccs.2007.03.04.
  26. Peng, S.; Xu, J.; Yang, H.; Liu, D. Experimental study on the influence mechanism of gas seepage on coal and gas outburst disaster. Saf. Sci. 2012, 50(4), 816-821. [CrossRef]
  27. Sa, Z.; Liu, J.; Li, J.; Zhang, Y. Research on effect of gas pressure in the development process of gassy coal extrusion. Saf. Sci. 2019, 115, 28-35. [CrossRef]
  28. Han, J.; Zhang, H.; Li, S.; Song, W. The characteristic of in situ stress in outburst area of China. Saf. Sci. 2012, 50(4), 878-884. [CrossRef]
  29. Guo, D.; Chuai, X.; Zhang, J.; Zhang, G. “Controlling effect of tectonic stress field on coal and gas outburst,” J. China Coal Soc. 2023, 48(8), 3076-3090. https://doi:10.13225/j.cnki.jccs.2022.1435.
  30. Shepherd, J.; Rixon, L.; Griffiths, L. Outbursts and geological structures in coal mines: a review. Int. J. Rock Mech. Min. Sci. 1981, 18(4), 267–283. [CrossRef]
  31. Guo, D.; Han, D.; Wang, X. Outburst-prone tectonophysical environment and its applications. Chin. J. Eng. 2002, 24(06), 581-584+592. https://doi:10.13374/j.issn1001-053x.2002.06.001.
  32. Yan, J.; Feng, X.; Guo, Y.; Jia, T.; Tan, Z. Discussion on the main control effect of geological structures on coal and gas outburst. ACS omega 2025, 8(1), 835-845. [CrossRef]
  33. Ju, Y.; Luxbacher, K.; Li, X.; Wang, G.; Yan, Z.; Wei, M.; Yu, L. Micro-structural evolution and their effects on physical properties in different types of tectonically deformed coals. Int. J. Coal Sci. Technol. 2014, 1, 364-375. [CrossRef]
  34. Yan, J. Zhang, X.; Zhang, Z. Research on geological control mechanism of coal-gas outburst. J. China Coal Soc. 2013, 38(7), 1174-1178. [CrossRef]
  35. Feng, C.; Li, X.; Yang, R.; Cai, J.; Sui, H.; Xie, H.; Wang, Z. The geological factors affecting gas content and permeability of coal seam and reservoir characteristics in Wenjiaba block, Guizhou province. Sci. Rep. 2023, 13(1), 18992. [CrossRef]
  36. Wang, G.; Cheng, W.; Xie, J.; Chen, J. Study on the effect of gas in the coal and gas outburst. China Saf. Sci. J. 2010, 20(9), 116–20. [CrossRef]
  37. Zhang, S. Challenges in KNN classification. IEEE Trans. Knowl. Data Eng. 2021, 34(10), 4663-4675. [CrossRef]
  38. Buscema, M. Back propagation neural networks. Subst. UseMisuse 1998, 33(2), 233-270. [CrossRef]
  39. Biau, G.; Scornet, E. A random forest guided tour. Test 2016, 25(2), 197-227. [CrossRef]
  40. Jair, C.; Farid, G.; Lisbeth, R.; Asdrubal, L. A comprehensive survey on support vector machine classification: Applications, challenges and trends. Neurocomputing 2020, 408, 189-215. [CrossRef]
  41. Chen, T.; Guestrin, C. XGBoost: A scalable tree boosting system. In Proc. 22nd ACM SIGKDD International Conference on Knowledge Discovery and Data Mining (eds Krishnapuram, B et al.) 2016, 785–794. [CrossRef]
  42. Bischl, B.; Binder, M.; Lang, M.; Pielok, T.; Richter, J.; Coors, S.; Thomas, J.; Ullmann, T.; Becker, M.; Boulesteix, A.; Deng, D.; Lindauer, M. Hyperparameter optimization: Foundations, algorithms, best practices, and open challenges. Wiley Interdiscip. Rev.-Data Mining Knowl. Discov. 2013, 13(2), e1484. [CrossRef]
  43. Wang, X.; Jin, Y.; Schmitt, S.; Olhofer, M. Recent advances in Bayesian optimization. ACM Comput. Surv. 2023, 55(13s), 1-36. [CrossRef]
  44. Guy, V.; Anton, L.; Maximilian, S.; Dan, S. On the tractability of SHAP explanations. J. Artif. Intell. Res. 2022, 74, 851-886. [CrossRef]
  45. Bradley, A. The use of the area under the ROC curve in the evaluation of machine learning algorithms. Pattern Recognit. 1997, 30(7), 1145-1159. [CrossRef]
  46. Huang, J.; Ling, C. Using AUC and accuracy in evaluating learning algorithms. IEEE Trans. Knowl. Data Eng. 2005, 17(3), 299-310. [CrossRef]
  47. Xie, X.; G.; Fu, Xue, Y.; Zhao, Z.; Chen, P.; Lu, B.; Jiang, S. Risk prediction and factors risk analysis based on IFOA-GRNN and apriori algorithms: Application of artificial intelligence in accident prevention. Process Saf. Environ. Prot. 2019, 122, 169-184. [CrossRef]
  48. Aguado, M.; Nicieza, C. Control and prevention of gas outbursts in coal mines, Riosa–Olloniego coalfield, Spain. Int J Coal Geol. 2007, 69(4), 253-266. [CrossRef]
  49. Fisne, A.; Esen, O. Coal and gas outburst hazard in Zonguldak Coal Basin of Turkey, and association with geological parameters. Nat. Hazards 2014, 74(5), 1363-1390. [CrossRef]
  50. Black, D. Review of coal and gas outburst in Australian underground coal mines. Int. J. Min. Sci. Technol. 2019, 29(6), 815-824. [CrossRef]
Figure 7. Feature correlation heat map.
Preprints 189816 g007
Figure 8. (a) SHAP analysis of the XGBoost model; (b) Global importance of XGBoost.
Preprints 189816 g008
Table 1. σtH on different tectonic stress field (Mpa).
Tectonic Stress Field Western Central Eastern
σtH (Max) 18.54 25.91 56.83
σtH (Min) 5.02 9.86 9.28
σtH (Avg) 10.6 17.72 27.4
Number of accidents 15 16 125
Table 2. Distribution pattern of tectonic coal on different coal mines.
Coal Mine Distribution Patterns of Tectonic Coal
Mine No.11 Tectonic coal is generally not well-developed, with localized occurrences of type III-IV tectonic coal.
Mine No.9, No.5 Wrinkle structures are commonly observed, with the thickness of the tectonic coal is stable.
Mine No.8 The coal seam exhibits significant structural damage, with well-developed tectonic coal extensively present.
Mine No.12, No.10 Tectonic coal is most pronounced, exhibiting distinct layering, and is locally developed throughout the entire seam.
Western Part of Mine No.13 Tectonic coal is not well-developed, and type III-IV tectonic coal is developed near faults.
Eastern Part of Mine No.13 and Shoushan No.1 The coal seam shows substantial damage, with thick, distinctly layered tectonic coal present.
Table 3. Number of outbursts on D, E and F coal seams in different coal mines.
Coal mines No.9 No.5 No.6 No.4 No.1 No.10 No.12 No.8 Shoushan No.1 No.13 Avg Gas Emission per Incident/(m3)
D 3 11 1 25 567.8
E 17 23 1 3784.4
F 2 13 1 8 28 17 1 4 10869.5
Table 4. Original data for coal mine No. 8.
Number X1 X2 X3 X4 X5 X6 X7 X8 X9 X10 X11 Q Y
1 535 3 3 1 1 5.4 1 0.32 0.66 0.4 11.23 19.7 2
2 522 3 1 3 1 4.8 1 0.35 1.93 0.5 10.17 16 2
3 584 3 1 1 5 3.2 3 0.2 2.38 0.53 12.06 132 3
4 484 3 3 1 3 4.81 1 0.53 5.25 0.5 4.75 12 2
5 566 5 1 1 1 3.5 1 0.51 0.36 0.2 9 30 2
6 463 1 1 3 1 4.81 3 0.26 6.24 0.6 4.8 46 2
7 490 3 1 1 1 4.81 1 0.49 6.24 0.6 7.81 28 2
8 424 1 1 1 1 3.65 3 0.51 0.47 0.27 8.53 6 2
9 535 3 1 1 1 5.2 3 0.29 3.68 0.49 17.14 62 3
10 566 5 3 3 3 3.5 1 0.38 1.04 0.75 8.57 144.6 3
11 563.4 5 1 1 1 3.7 1 0.57 0.76 0.4 8.76 53 3
12 564 5 1 1 1 3.7 1 0.57 0.7 0.38 7.24 0 1
13 485 5 3 5 3 3.3 1 0.11 7.8 1.2 19.65 450 3
14 482 3 1 1 1 3.4 1 0.14 7.6 1.3 18.64 0 1
15 623 3 3 1 3 4.5 1 0.35 0.44 0.3 14.27 22 2
16 584 3 1 1 3 3.2 1 0.24 2.32 0.5 11.86 0 1
17 557.6 1 1 1 1 3.1 3 0.54 0.52 0.4 11.38 43 2
18 557.6 1 3 1 1 3.4 3 0.15 0.78 0.6 18.85 240 3
19 557.6 1 1 1 1 3.2 3 0.46 0.36 0.5 9.48 0 1
20 486 1 1 1 1 3.5 3 0.29 0.33 0.38 12.56 22 2
21 529.8 3 1 3 1 4.3 3 0.67 0.42 0.32 11.48 5 2
22 583 1 1 1 1 4.5 3 0.43 1.15 0.7 9.18 10 2
23 583 1 1 1 1 4.7 1 0.46 1.05 0.66 9.24 0 1
24 533 5 3 3 3 4.1 3 0.23 0.34 0.2 12.57 440 3
25 530 5 1 1 1 4.1 1 0.36 0.32 0.18 12.38 0 1
26 622 3 1 1 1 3 1 0.32 2.31 0.5 20.19 64 3
27 573 1 1 1 1 4.1 3 0.5 0.79 0.34 7.33 16 2
28 537.9 3 1 1 3 5.3 1 0.19 0.22 0.8 23.91 138 3
29 562 3 1 1 1 5.25 1 0.47 4.5 0.5 14.28 12.5 2
30 540 1 1 1 1 4.8 1 0.31 0.62 0.32 12.33 0 1
31 540 1 1 3 1 4.8 3 0.27 0.52 0.3 12.05 8 2
32 457 1 1 1 3 3.5 3 0.15 1.95 0.6 5.09 478 3
33 460 1 1 1 1 3.5 1 0.38 1.38 0.52 4.68 0 1
34 589 3 1 1 1 3.2 3 0.24 2.1 0.6 11.05 4.6 2
35 636.4 5 3 3 5 3.2 3 0.15 3.08 0.46 18.25 396 3
36 584 3 1 1 5 3.2 3 0.25 2.94 0.7 14.18 215 3
37 564.6 5 1 1 1 3.5 1 0.48 0.78 0.6 9.27 44 2
38 480 1 1 1 1 4.81 1 0.53 5.25 0.5 4.75 0 1
39 840 7 3 3 5 4.5 3 0.17 1.15 0.25 23.52 551 3
40 838 5 1 1 1 4.5 1 0.26 1.03 0.25 20.86 0 1
41 566 5 1 3 1 3.5 1 0.51 0.48 0.6 7.93 55 3
42 620 1 1 1 1 3 1 0.34 1.83 0.46 18.75 0 1
43 800 5 1 3 1 3.3 3 0.18 0.42 0.22 15.89 190 3
44 820 5 1 1 1 4.5 1 0.21 1.22 0.28 20.31 0 1
45 614 1 1 1 1 4.5 1 0.55 5.4 0.3 9.87 7 2
46 697 1 1 1 1 4.1 1 0.35 0.58 0.12 15.91 14 2
47 629 3 1 1 1 4.5 1 0.34 0.99 0.18 15.67 32 2
48 490 3 1 1 1 3.2 1 0.51 0.85 0.15 14.32 34 2
49 652 1 1 1 1 4 1 0.54 0.5 0.52 12.03 5 2
50 820 7 1 1 1 4.5 1 0.19 1.22 0.3 24.71 115 3
51 554 1 3 3 1 5.4 1 0.28 0.35 0.3 15.47 27 2
52 482 3 3 1 3 4.81 1 0.53 6.24 0.6 4.75 20 2
53 550 1 1 1 1 5.4 1 0.4 0.28 0.25 10.48 0 1
54 606 1 3 1 1 2 1 0.41 0.34 0.45 7.99 16 2
55 557.6 3 3 1 3 3 3 0.24 1.5 0.5 21.06 180 3
56 563 1 1 1 1 3.5 1 0.55 0.42 0.35 6.21 0 1
57 487 3 3 1 3 4.81 1 0.53 5.25 0.5 4.75 10 2
58 583 1 3 1 1 4.8 1 0.34 1.24 0.75 10.34 20 2
59 580 1 1 1 1 3.4 1 0.26 2.7 0.52 12.27 0 1
60 520 3 1 3 1 4.5 1 0.26 1.38 0.4 12.74 45.5 2
Table 5. Summary of model performance.
Models AUC Accuracy Precision Recall F1 score
KNN 0.80 0.88 0.84 0.8 0.82
BPNN 0.88 0.88 0.97 0.84 0.85
RT 0.74 0.54 0.69 0.59 0.51
SVM 0.94 0.91 0.89 0.89 0.89
XGBoost 0.97 0.90 0.93 0.97 0.95
Disclaimer/Publisher’s Note: The statements, opinions and data contained in all publications are solely those of the individual author(s) and contributor(s) and not of MDPI and/or the editor(s). MDPI and/or the editor(s) disclaim responsibility for any injury to people or property resulting from any ideas, methods, instructions or products referred to in the content.
Copyright: This open access article is published under a Creative Commons CC BY 4.0 license, which permit the free download, distribution, and reuse, provided that the author and preprint are cited in any reuse.
Prerpints.org logo

Preprints.org is a free preprint server supported by MDPI in Basel, Switzerland.

Subscribe

Disclaimer

Terms of Use

Privacy Policy

Privacy Settings

© 2026 MDPI (Basel, Switzerland) unless otherwise stated