1. Introduction
Perceptual decision-making is the cognitive process by which sensory information is gathered, integrated, and transformed into goal-directed behavior [
1]. This process allows individuals to navigate complex environments by transforming ambiguous sensory inputs into purposeful actions [
2]. Unlike simple stimulus recognition, perceptual decision-making involves accumulating evidence over time and resolving uncertainty before committing to a choice [
3,
4]. Understanding the neural mechanisms that underlie this transformation from perception to action is essential particularly when decisions must be made rapidly or under conditions of degraded sensory input [
5,
6].
The computational demands of perceptual decision-making become particularly evident when sensory information is degraded or ambiguous [
7,
8] . This process involves complex interactions between sensory processing areas and higher-order cognitive control regions, with the efficiency of these interactions determining both the speed and accuracy of decisions [
9]. The neural mechanisms supporting these interactions have become a central focus of cognitive neuroscience research, as they provide insights into how the brain adapts to varying environmental demands.
Neural oscillations, rhythmic electrical activities generated spontaneously or in response to stimuli in the central nervous system, are vital to sensory-cognitive functions [
10,
11]. These oscillations serve as a fundamental mechanism for coordinating neural activity across distributed brain networks, enabling efficient information processing and communication between brain regions [
12,
13]. Among these oscillatory patterns, the theta rhythm is particularly relevant to behavior and cognition [
14,
15,
16]. Theta oscillations, prominent in the hippocampus of rodents during voluntary behaviors, also appear across multiple human brain regions and are implicated in attention and memory processes [
17,
18,
19]. They are especially significant in distributed brain networks beyond the hippocampus [
10,
20,
21].
The functional significance of theta oscillations extends across multiple cognitive domains, including working memory maintenance, attention allocation, and cognitive control [
22,
23]. During demanding cognitive tasks, theta oscillations appear to synchronize activity across frontal and parietal brain regions, facilitating the integration of information necessary for complex decision-making [
20,
24]. This synchronization may serve as a temporal framework that coordinates the timing of neural processing across different brain areas, ensuring that relevant information is available when needed for decision formation [
25].
Recent studies have emphasized the role of theta oscillations in perceptual decision-making, particularly within frontal and parietal cortical networks. Frontal theta power reliably increases with task engagement and cognitive demand [
26] and is associated with higher-order cognitive functions including conflict monitoring, error detection, and executive control [
24,
27,
28]. These findings suggest that frontal theta oscillations may serve as a neural marker of cognitive control engagement, reflecting the brain's attempt to optimize performance under challenging conditions. Functional connectivity studies further indicate that frontal-parietal theta coherence increases during decision-making, suggesting that theta-band synchronization facilitates communication between these regions [
29,
30]. Recent causal evidence using transcranial magnetic stimulation demonstrates that lateral prefrontal theta oscillations actively drive computational mechanisms for conflict expectation and cognitive resource allocation [
31], suggesting theta plays a proactive role in cognitive control rather than merely reflecting processing difficulty.
The temporal dynamics of theta oscillations during decision-making reveal distinct phases of cognitive processing. Early theta responses, occurring within the first 200 ms after stimulus presentation, appear to reflect initial sensory processing and attention allocation [
17]. Later theta activity, particularly in frontal regions, has been associated with evidence accumulation and decision formation processes [
26]. This temporal organization suggests that theta oscillations provide a dynamic framework for coordinating different stages of perceptual decision-making, from initial sensory analysis to final response selection.
Decision confidence constitutes a fundamental metacognitive process in perceptual decision-making, representing the subjective evaluation of decision accuracy that influences subsequent behavioral adjustments and learning mechanisms [
32]. Neuroimaging investigations have identified prefrontal cortical regions as critical substrates for confidence judgments and metacognitive monitoring. Selective manipulations of prefrontal activity using neurofeedback can alter confidence reports without affecting perceptual accuracy [
33], while prefrontal lesions impair confidence calibration despite preserved decision performance [
32], demonstrating dissociable neural substrates for decision-making and metacognition evidence indicates that theta-band oscillations may constitute a neurophysiological mechanism mediating the relationship between cognitive control processes and metacognitive evaluation. Specifically, prefrontal theta activity demonstrates significant associations with metacognitive adequacy, exhibiting positive correlations with the capacity to discriminate between accurate and inaccurate decisions [
34]. Central frontal theta oscillations have been proposed to function as a neural broadcasting system that signals cognitive control demands based on internal assessments of decision quality [
35]. These findings suggest that enhanced frontal theta activity associated with clear sensory evidence and efficient cognitive control engagement may reflect both successful task performance and elevated decision confidence.
Despite these findings, important questions remain about the temporal dynamics of theta oscillations during perceptual decision-making particularly how these dynamics unfold over time and vary with stimulus clarity. Although theta responses have been linked to conflict detection, working memory load, and decision-related activity [
17,
29], the extent to which stimulus degradation influences theta power and coherence across different cortical regions remains unclear. Furthermore, the relationship between theta oscillations and decision confidence a critical aspect of perceptual decision-making, has received limited attention in the literature [
36].
2. Materials and Methods
2.1. Dataset
EEG data were obtained from a previously published study [
37] that investigated oscillatory network dynamics during face and house image perception. The original experimental procedures are summarized below, followed by a description of the analytical methods used for theta oscillation analysis in the current study.
2.2. Participants
The study included twenty-six neurologically healthy volunteers, comprising 21 males and five females, aged between 22 and 38 years, with a mean age of 26.3 years and a standard deviation of 4.7 years. Prior to participation, each volunteer provided written informed consent. The study protocol was approved by the Institutional Review Board of Georgia State University. Data from three participants were excluded from the final analyses due to either poor behavioral performance or excessive EEG artifacts and noise that could not be reliably corrected.
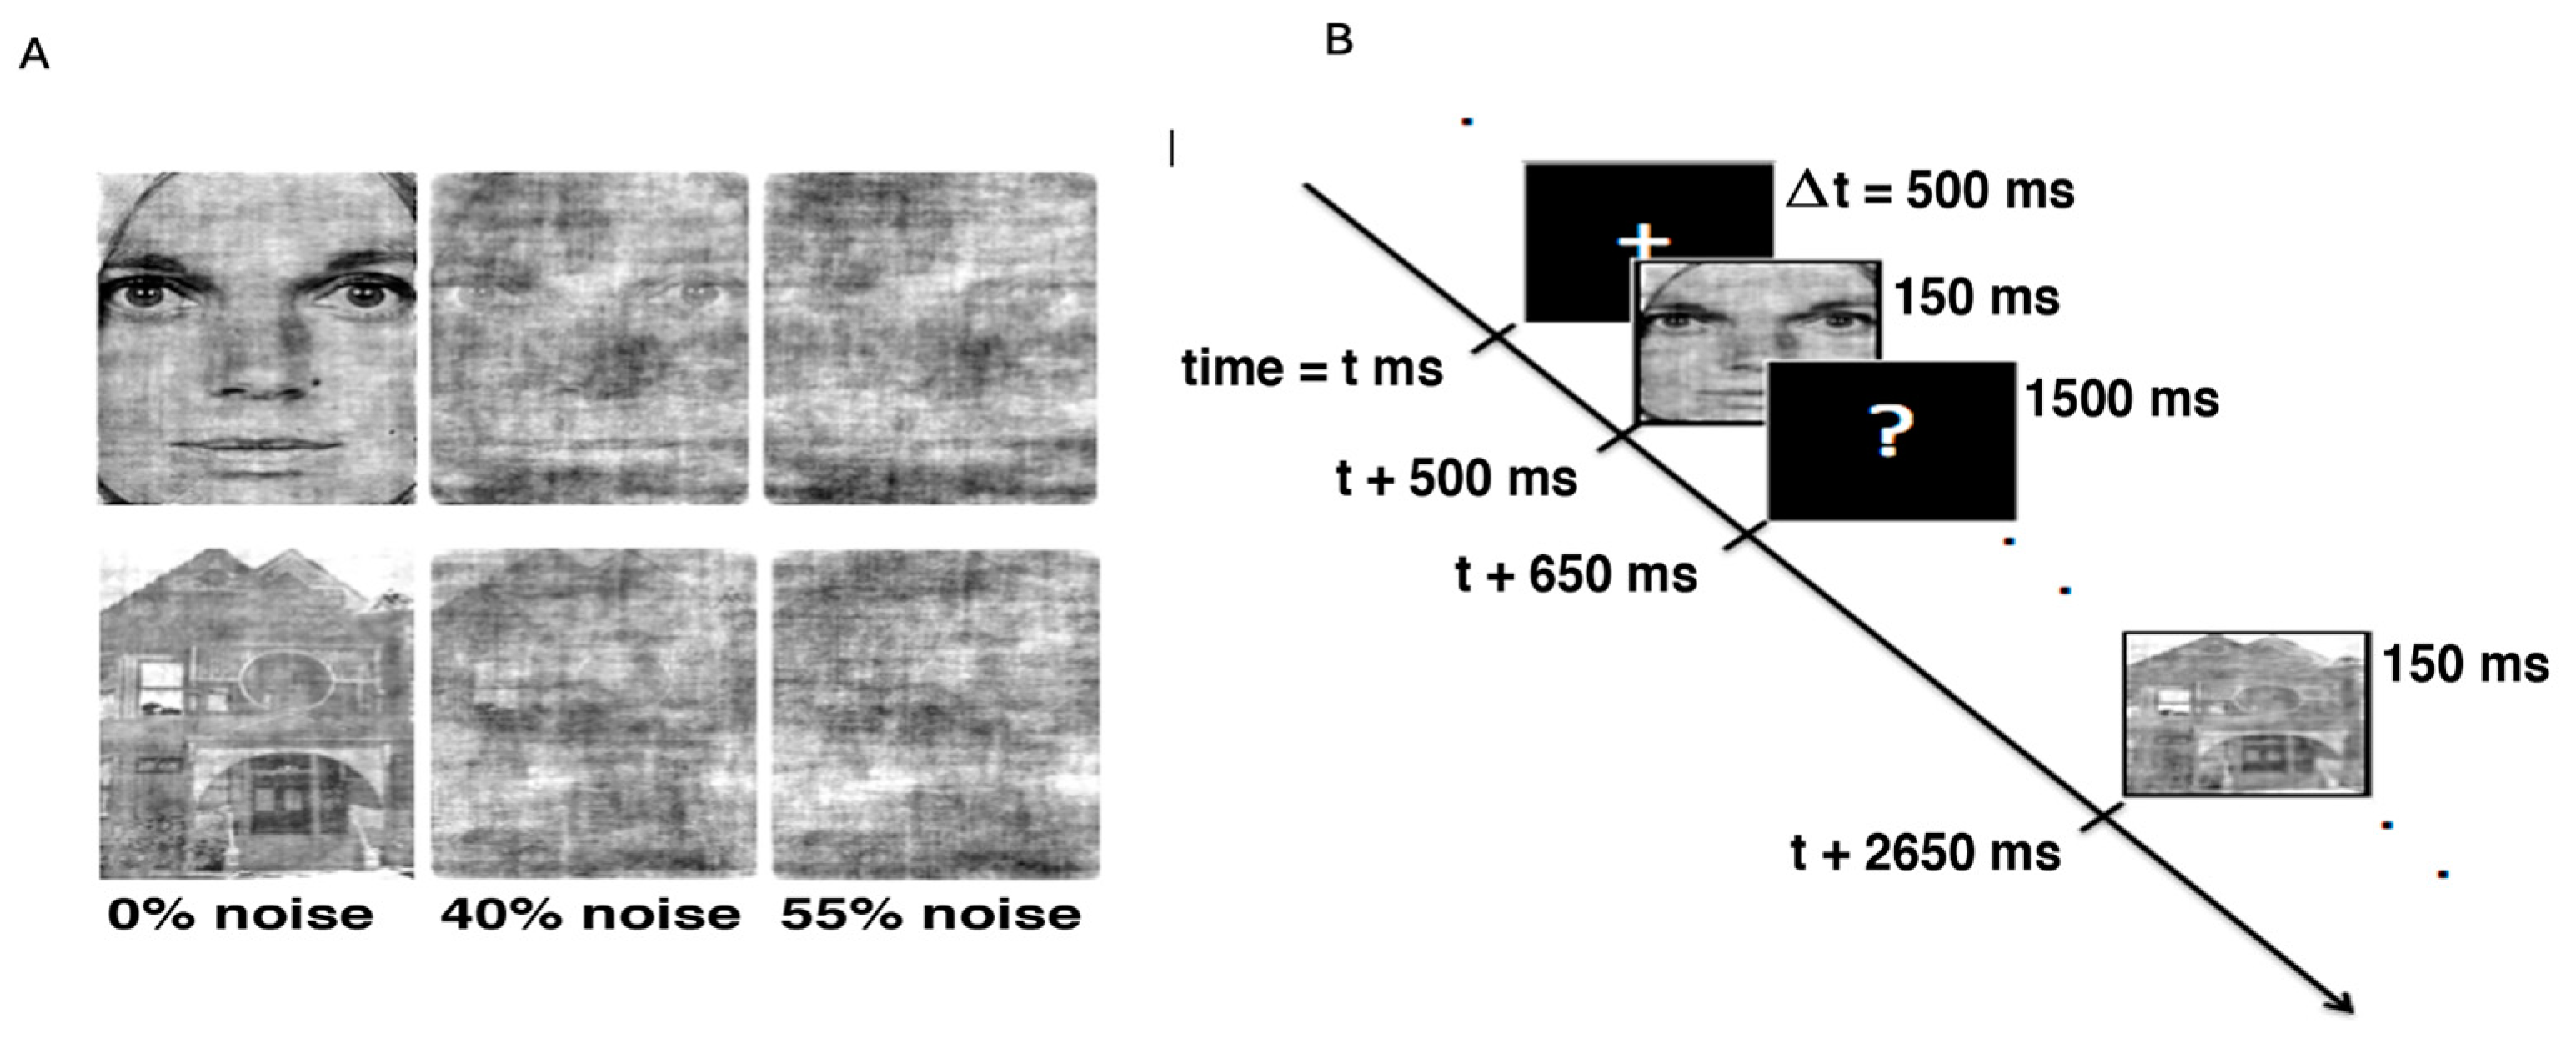
2.3. Stimuli
The experimental stimuli consisted of a total of 28 images, evenly divided between faces and houses (14 images per category). Face images were sourced from the Ekman series [
38]. For each image, Fast Fourier Transforms (FFT) were computed, generating 28 magnitude matrices and 28 phase matrices. An average magnitude matrix was then calculated across all images. New images were created by performing an inverse FFT (IFFT) using this average magnitude matrix combined with the phase matrix of each individual image. The phase matrix used for the IFFT followed a linear arrangement to preserve the essential spatial structure of the original images.
2.4. Experimental Design
Before starting the experimental task, participants were given a brief explanation of the task paradigm. They were seated in a darkened room, with the only source of light coming from the experimenter’s computer screen, and maintained a viewing distance of approximately 60 cm using a chin rest. A schematic of the experimental paradigm is shown in
Figure 1. The experiment consisted of four blocks, each containing 168 trials, resulting in a total of 672 trials, with 224 trials for each noise level. On each trial, a small fixation cross (“+”) was displayed at the center of the screen for 500 ms. This was followed by the presentation of a stimulus for 150 ms, after which a black screen with a question mark (“?”) appeared for 1500 ms. During this interval, participants were allowed to indicate their decision identifying the stimulus as either a face or a house by pressing the corresponding key on the keyboard.
2.5. Data Acquisition and Preprocessing
EEG signals were recorded using a 64-channel system from Brain Vision LLC (
www.brainvision.com), with analog signals digitized at a sampling rate of 500 Hz. Electrode impedances were maintained below 10 kΩ throughout the recordings. Participants were instructed to minimize eye blinks, head movements, and swallowing during the experiment. The EEG data were digitally band-pass filtered between 1 and 100 Hz and notch filtered at 60 Hz to remove line noise. Ocular artifacts, such as blinks, were corrected using independent component analysis (ICA). Data from three participants were excluded from further analyses due to either excessive EEG artifacts and noise or poor behavioral performance. All preprocessing procedures were carried out using Brain Vision Analyzer 2.0 (
www.brainproducts.com).
2.6. Data Analysis
2.6.1. EEG Recording and Initial Preprocessing
EEG data were collected using a 64-channel Brain Vision system with a 500 Hz sampling rate. Electrode impedance was maintained below 10 kΩ throughout the recording session to ensure optimal signal quality. The data were bandpass filtered between 1–100 Hz during acquisition, with a 60 Hz notch filter applied to eliminate electrical line noise. Independent component analysis (ICA) was subsequently used to correct for ocular artifacts using Brain Vision Analyzer 2.0, providing systematic removal of eye movement and blink-related contamination from the neural signals.
2.6.2. Epoching and High-Pass Filtering
Continuous EEG data were epoched into segments based on stimulus onset, with analysis focused exclusively on post-stimulus intervals to capture task-related neural responses. Following initial epoching, a high-pass filtering procedure was implemented using a 10th-order FIR filter with a 3 Hz cutoff frequency and zero-phase distortion characteristics, implemented via the filtfilt function to ensure temporal precision. The cutoff frequency was normalized relative to the Nyquist frequency (fs/2), and filter coefficients were generated using the fir1 function with 'high' specification. This 3 Hz high-pass filter effectively eliminated slow-wave artifacts and low-frequency noise while preserving the integrity of theta-band oscillations (3-7 Hz) and higher-frequency neural signals.
2.6.3. Time-Frequency Analysis
Time–frequency wavelet spectra were generated to visualize theta power distributions across electrodes and time points for each experimental condition. Theta oscillation analysis focused on the 3–7 Hz frequency band, consistent with recent literature defining theta activity within this range [
39]. The temporal analysis was restricted to post-stimulus intervals to capture task-specific neural responses without contamination from pre-stimulus baseline activity. The temporal window of interest extended from stimulus onset through 400 ms post-stimulus, with specific focus on the 100-300 ms interval identified through systematic examination of grand average event-related potential patterns across participants.
Time-frequency decomposition was performed using complex Morlet wavelet transform. The complex Morlet wavelet analysis employed a central frequency parameter (ω₀) and computed spectral matrices across trials for each electrode pair. Auto- and cross-spectra were calculated by taking the wavelet transform of individual trials and computing the complex conjugate products, with final spectral estimates obtained by averaging across trials. Two complementary analytical approaches were implemented to provide methodological validation and comprehensive characterization of theta dynamics.
The first method involved ERP-based analysis, wherein event-related potentials were computed by averaging EEG signals across trials for each participant and experimental condition. Current source density transformation was subsequently applied to these averaged ERPs using a spherical spline algorithm, and theta band power was extracted from the resulting CSD-transformed data.
The second approach employed single-trial analysis, where CSD transformation was applied directly to individual trials prior to any averaging procedures, with theta power values extracted and subsequently averaged across trials for each participant to yield robust estimates of oscillatory activity.
2.6.4. Current Source Density (CSD) Transformation
Current source density transformation was implemented using the established CSD Toolbox [
40], employing spherical spline interpolation with default parameters optimized for 64-channel electrode configurations. This transformation served the critical function of eliminating volume conduction effects and reference electrode artifacts, thereby enhancing spatial resolution and ensuring that observed neural activity patterns reflected genuine local current sources rather than spurious electrical conduction through brain tissue and scalp.
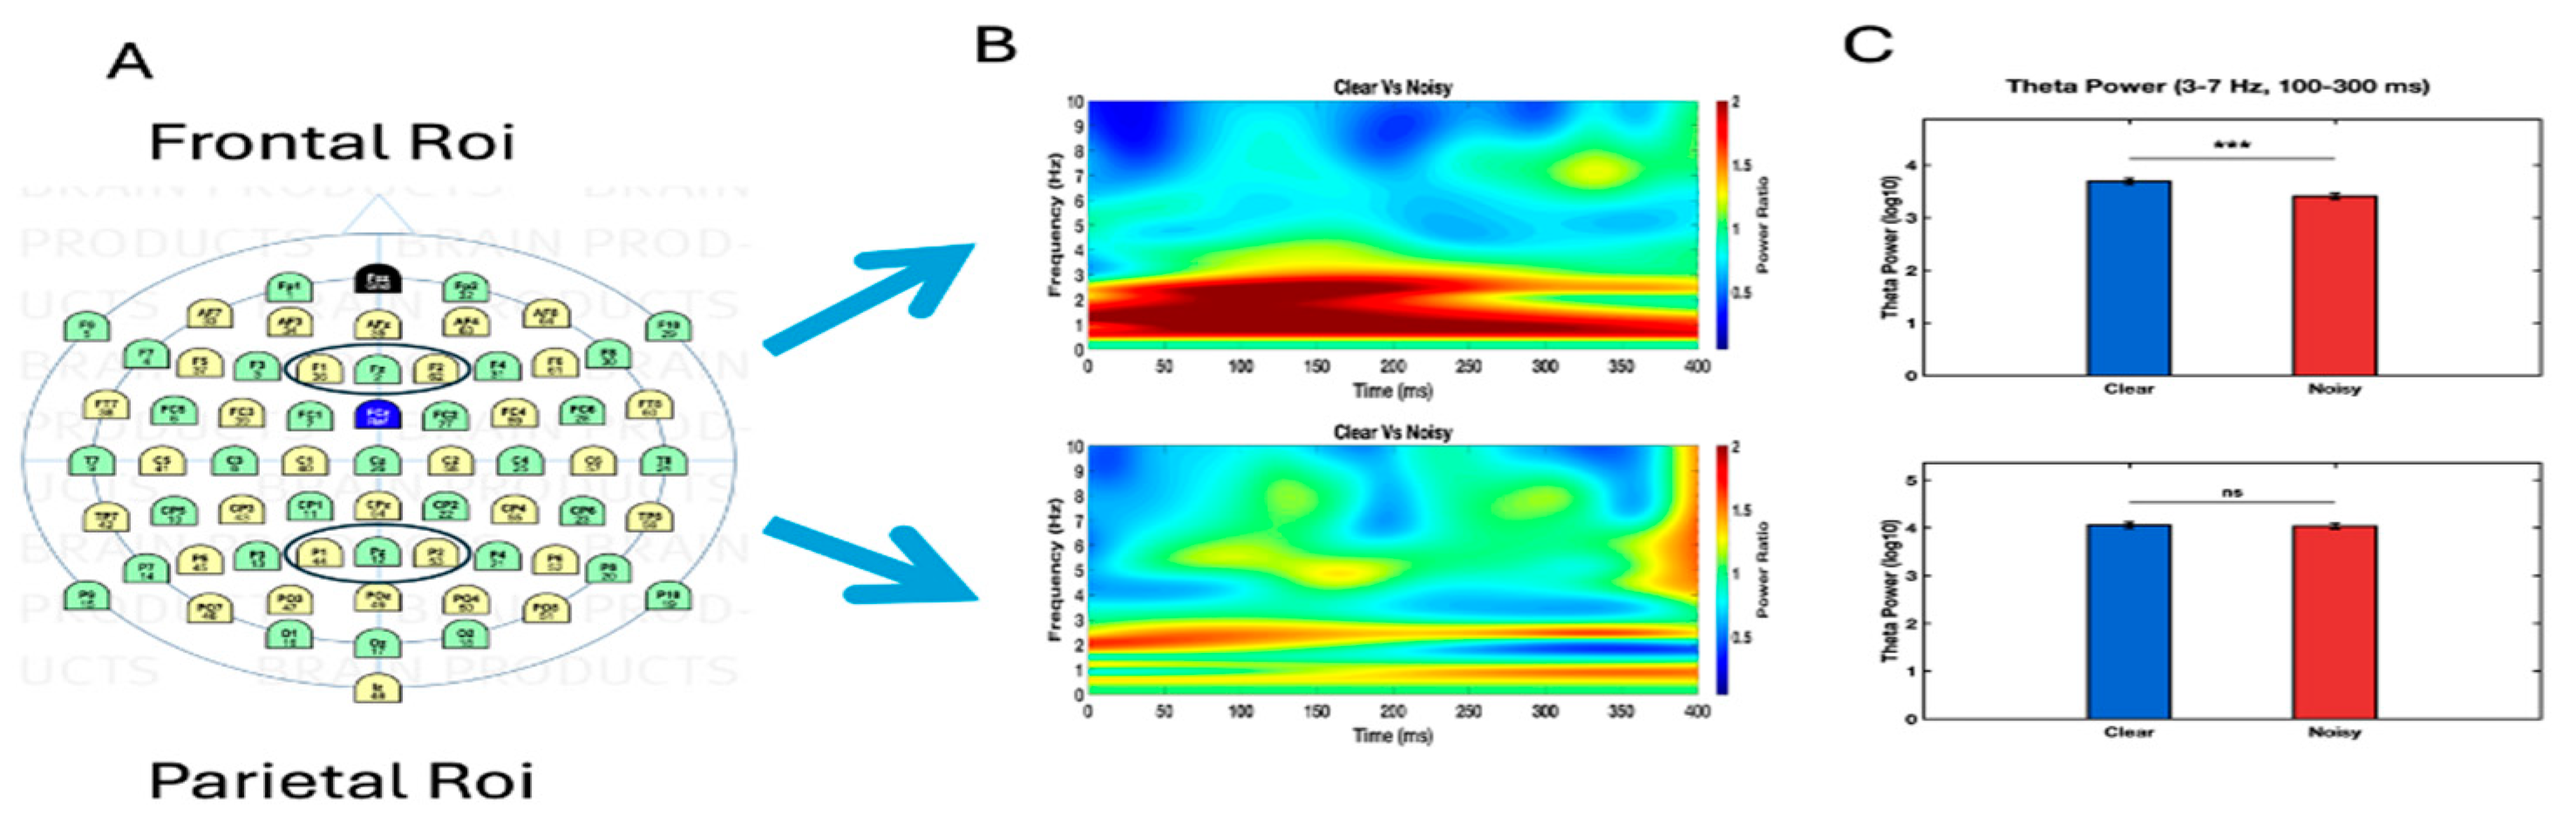
2.6.5. Functional Connectivity Analysis
Imaginary coherence analysis was conducted between electrode pairs representing frontal (F1, Fz, F2) and parietal (P1, Pz, P2) regions to characterize inter-regional neural communication patterns during post-stimulus processing. The coherence and imaginary coherence calculations were performed using the spectral matrices obtained from the complex Morlet wavelet transform.
Coherence was computed as: , where S(i,j) represents the cross-spectral density between electrode pairs i and j, and S(i,i), S(j,j) represent the respective auto-spectral densities. Imaginary coherence was calculated as: , extracting the imaginary component of the normalized cross-spectrum to specifically measure phase-lagged connectivity while excluding zero-lag interactions that may arise from volume conduction. Analysis was restricted to post-stimulus intervals within the 3-7 Hz theta frequency range to maintain consistency with power analysis parameters and focus on task-relevant neural dynamics.
The combination of CSD transformation and imaginary coherence analysis provided a dual artifact removal approach, with CSD transformation eliminating volume conduction effects and imaginary coherence specifically excluding zero-lag interactions that may arise from spurious electrical conduction. This conservative analytical framework ensured that observed connectivity patterns reflected genuine phase-lagged neural communication between brain regions during task performance.
2.6.6. Statistical Analysis
Statistical comparisons between experimental conditions employed Wilcoxon signed-rank tests, selected for their non-parametric properties and robustness to distributional assumptions typical of neurophysiological data.The significance threshold was established at p < 0.05 for all primary analyses.
2.6.7. Induced Oscillatory Activity Analysis
To characterize non-phase-locked neural responses, induced power and coherence were computed by decomposing total oscillatory activity into evoked (phase-locked) and induced (non-phase-locked) components. This decomposition enables examination of flexible, stimulus-related neural dynamics that are not revealed by conventional event-related potential (ERP) analyses.Induced power was computed as the difference between single-trial power (calculated from individual trials) and evoked power (derived from trial-averaged ERPs):
Induced Power = Single-trial Power - Evoked Power
3. Results
3.1. Theta Power Analysis
3.1.1. Method Comparison: ERP-Based vs Single-Trial Analysis
Both analytical approaches revealed significant theta modulation by stimulus clarity, though they differed in sensitivity and effect magnitude. The ERP-based analysis demonstrated robust frontal theta increases for clear versus noisy stimuli during the 100-300 ms post-stimulus window. This effect was large and statistically significant (
p < 0.001), with clear stimuli showing higher theta power than noisy stimuli. Parietal regions showed no significant differences between conditions (
p = 0.62), confirming the frontal specificity of theta modulation.
Figure 2
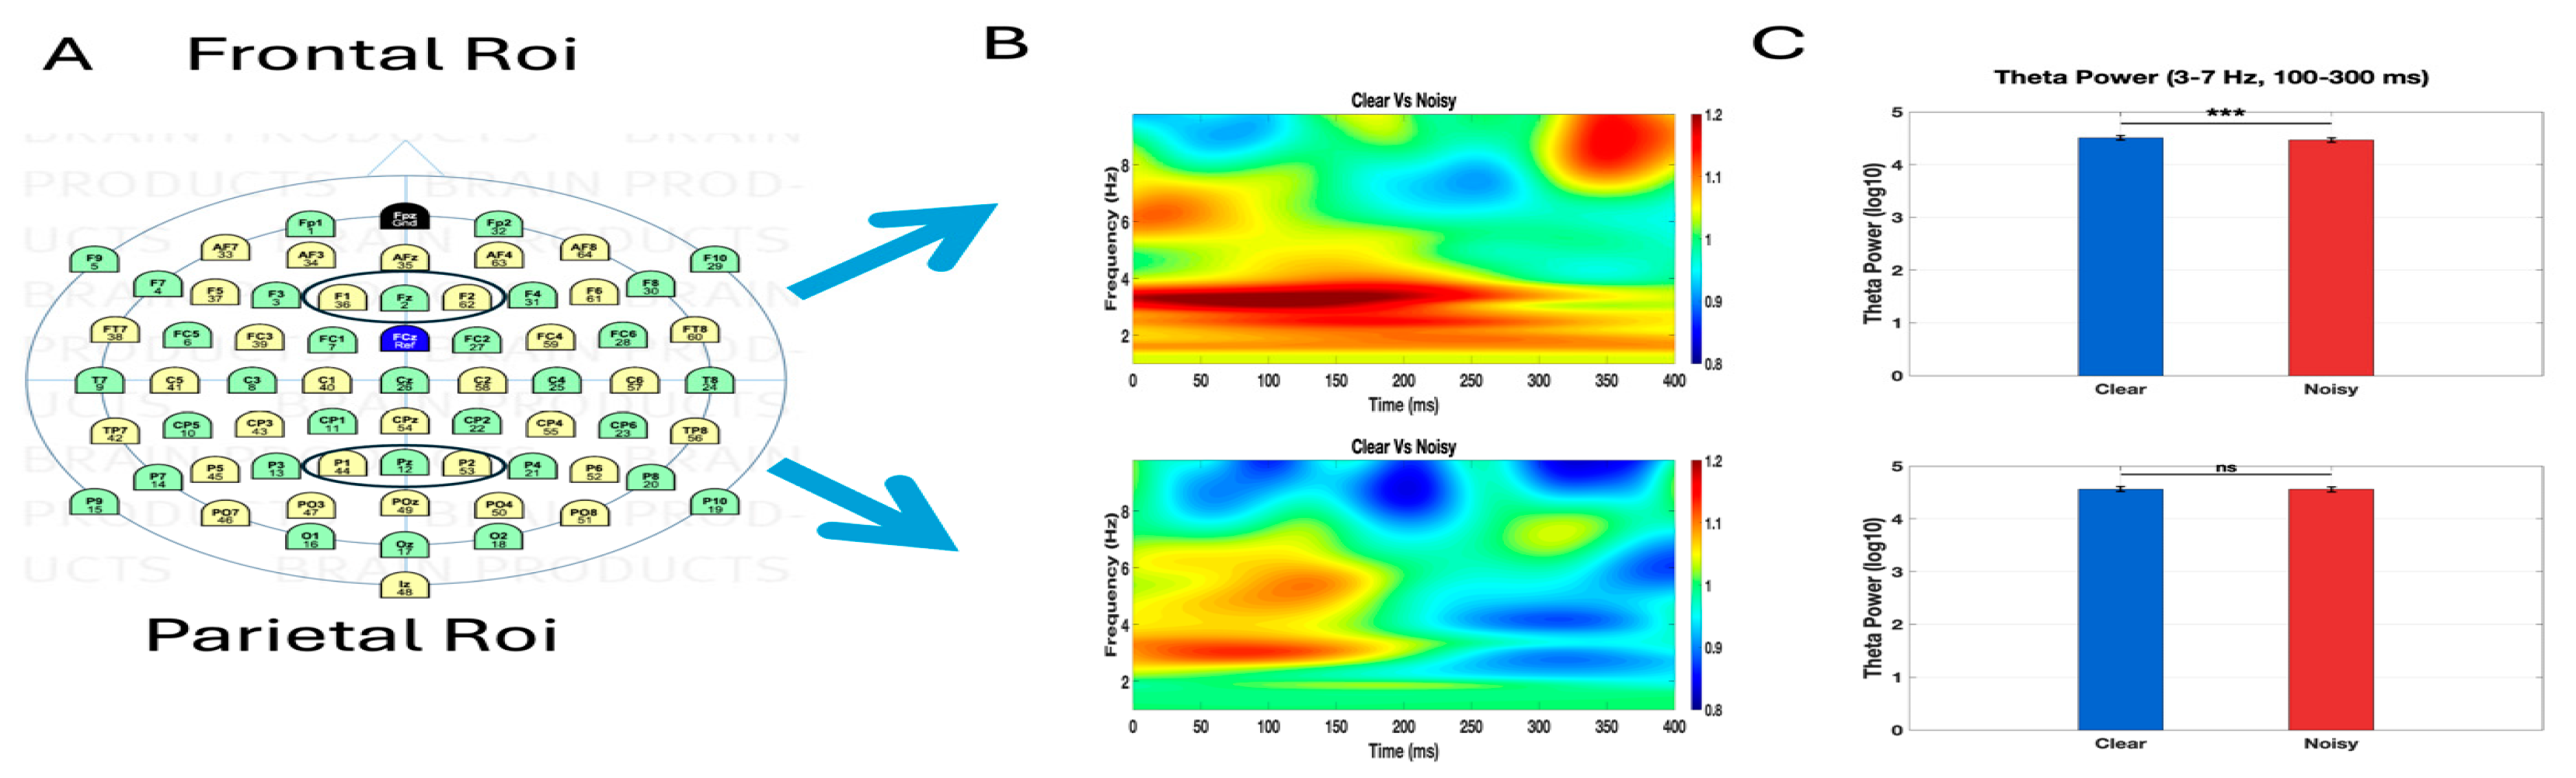
The single-trial analysis yielded more conservative but consistent findings. Frontal regions again exhibited significant theta modulation (
p < 0.001), though with smaller effect sizes reflecting the conservative nature of this approach. Parietal regions remained non-significant (
p = 0.99), maintaining the frontal specificity pattern observed in the ERP-based analysis. These results validate theta modulation effects across both analytical methods while demonstrating that ERP-based approaches provide greater sensitivity for detecting stimulus-related neural changes.
3.1.2. Temporal Dynamics
Theta power differences evolved systematically throughout the post-stimulus period. Differences emerged rapidly within 100 ms of stimulus presentation, peaked between 150-250 ms, and sustained throughout the entire 400 ms analysis window. This temporal progression aligns with established stages of perceptual processing and cognitive control engagement, suggesting that theta oscillations reflect dynamic attentional resource allocation during decision-making under varying stimulus clarity.
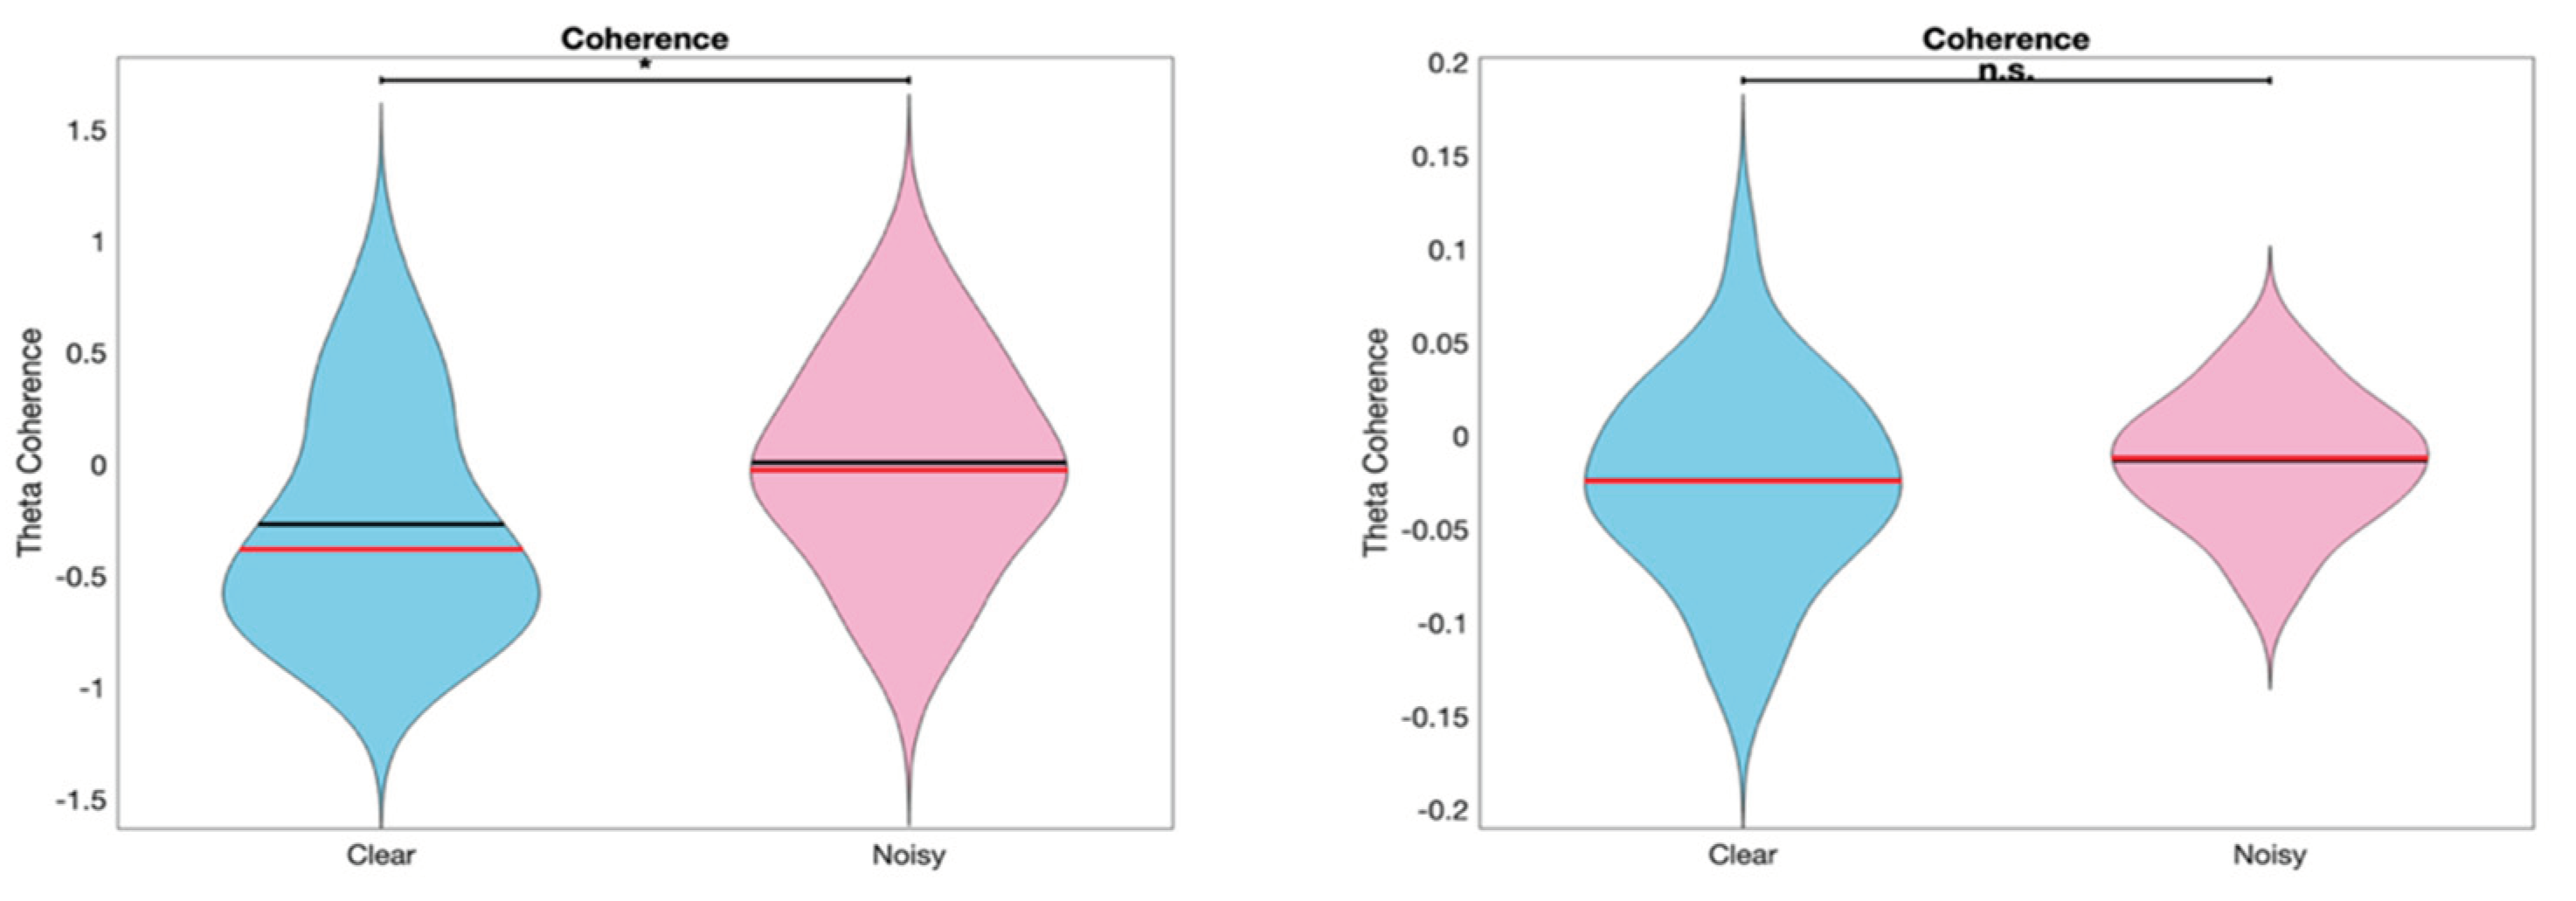
3.2. Frontal-Parietal Connectivity Analysis
The imaginary coherence analysis revealed a striking dissociation between task-evoked and intrinsic connectivity patterns. ERP-based imaginary coherence analysis demonstrated significant differences between clear and noisy face conditions (
p = 0.0133), with clear faces exhibiting negative imaginary coherence values while noisy faces showed values near zero. This pattern indicates that stimulus clarity specifically modulates task-evoked neural synchronization between frontal and parietal regions during perceptual decision-making, reflecting dynamic coordination mechanisms that adapt to stimulus properties.
In contrast, single-trial imaginary coherence analysis showed no significant differences between clear and noisy conditions (p > 0.05), suggesting that intrinsic network connectivity patterns remain remarkably stable across different levels of stimulus clarity. This dissociation reveals that the brain employs distinct mechanisms for neural communication: task-evoked synchronization that dynamically adjusts to stimulus demands and intrinsic connectivity that maintains stable communication channels regardless of external stimulus characteristics.
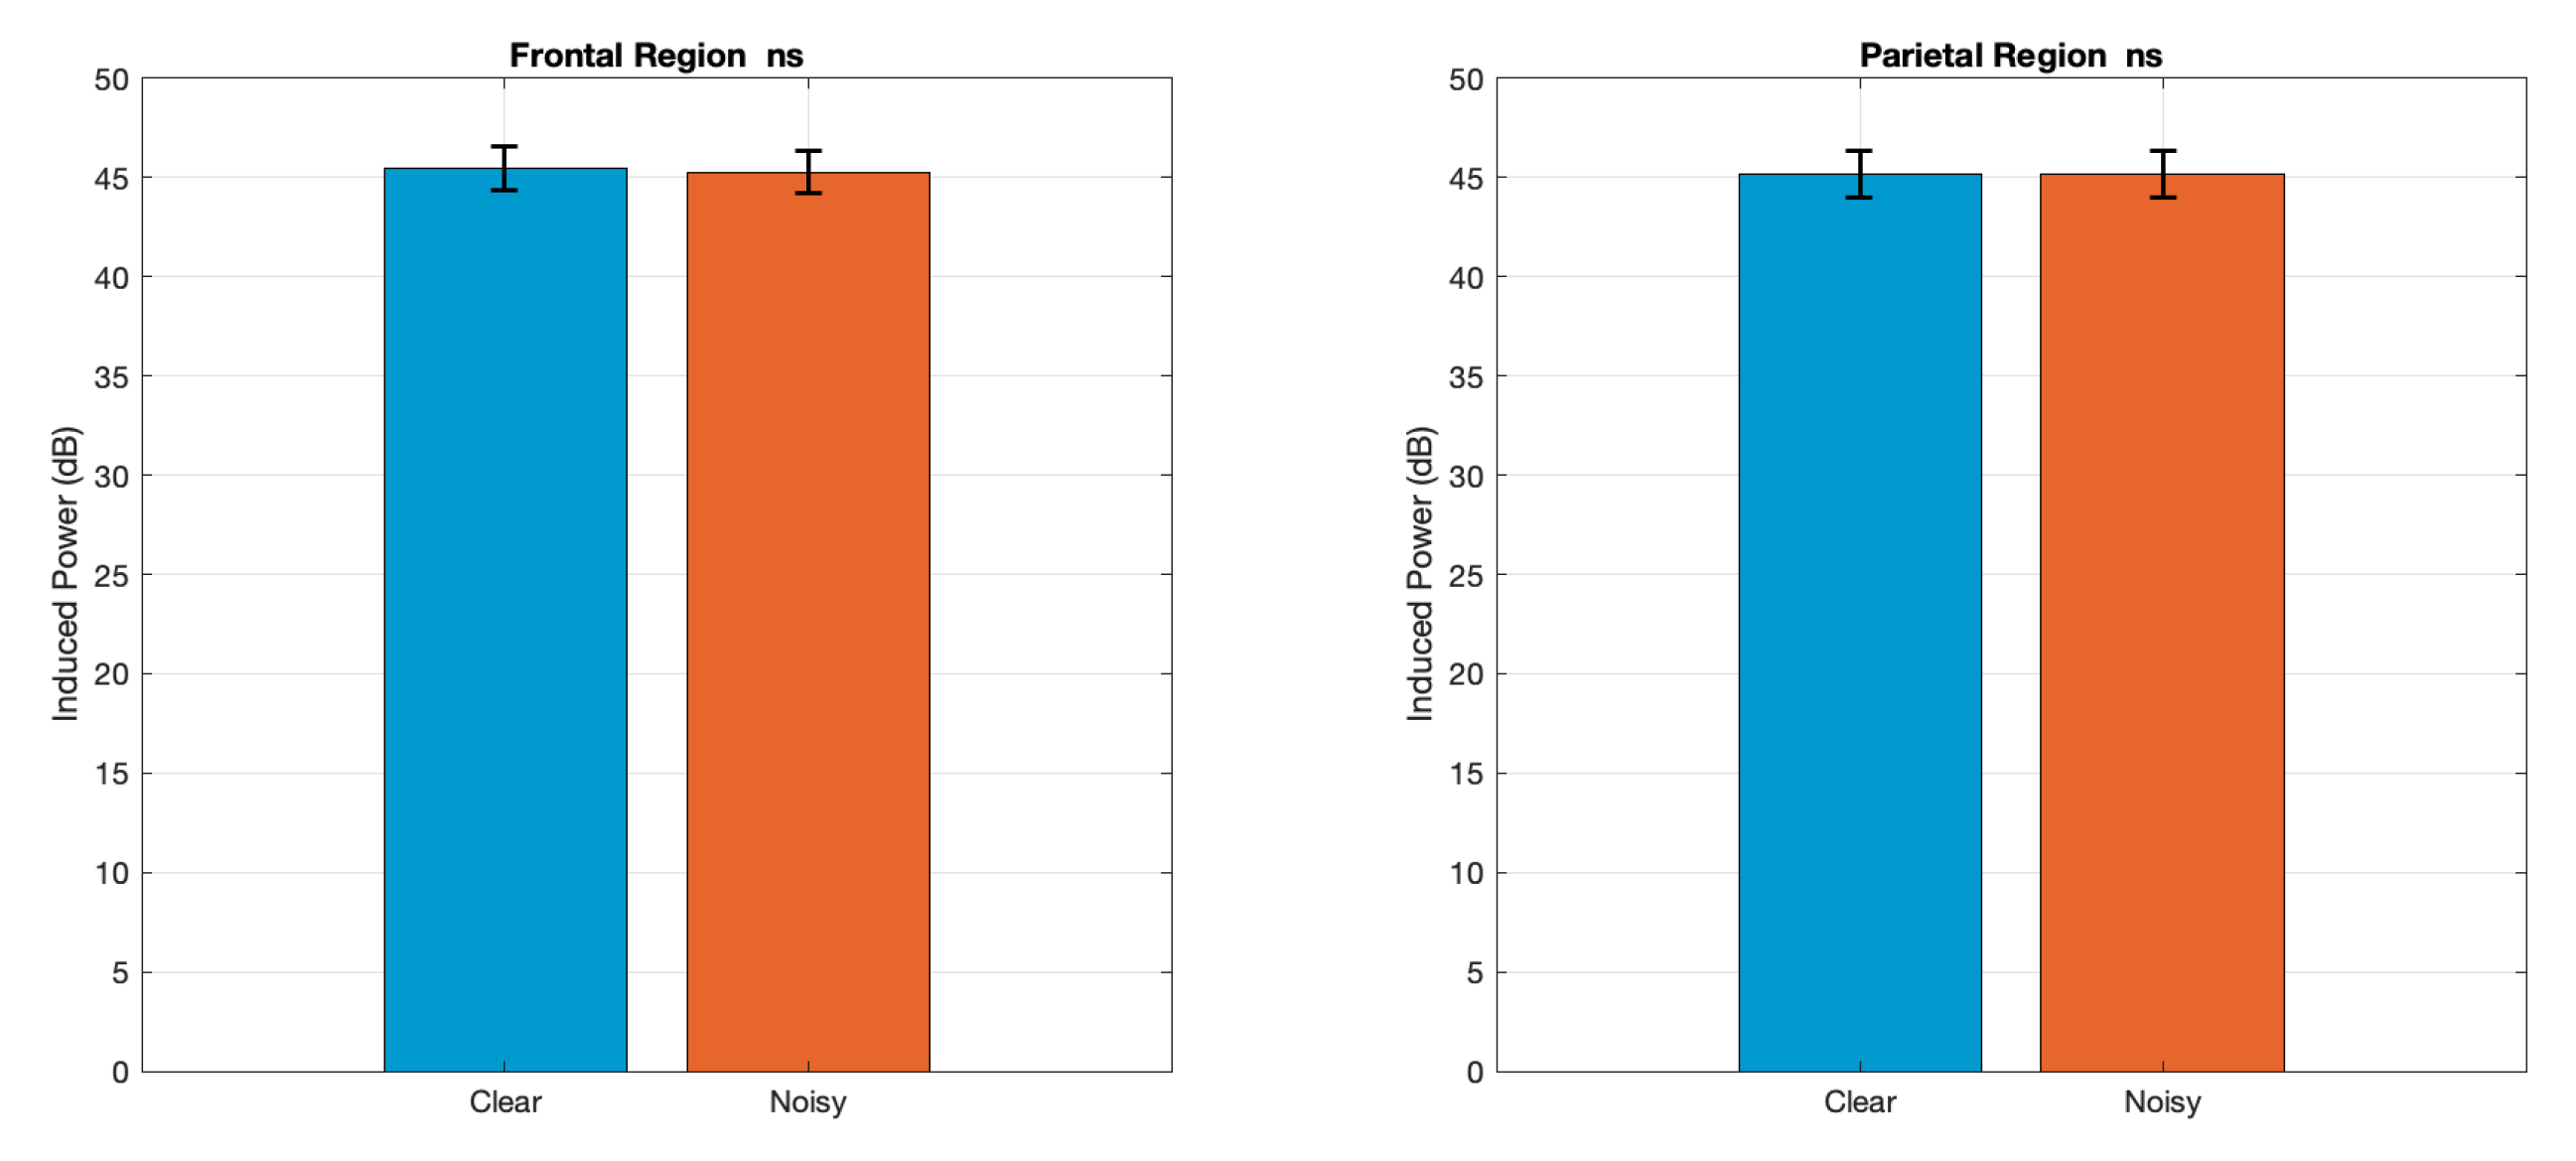
3.3. Induced Oscillatory Activity
3.3.1. Induced Theta Power
Induced power in the theta band did not significantly differ between Clear and Noisy conditions in either the Frontal (
p = 0.0625) or Parietal (
p = 1.0000) regions. Although the Frontal region showed a slight numerical increase in power for the Clear condition, this difference did not reach statistical significance. The results suggest that the clarity of the stimulus did not substantially modulate induced oscillatory power in these regions.
4. Discussion
Our results demonstrate that theta oscillations particularly in frontal regions play a critical role in visual perceptual decision-making, with power modulated by stimulus clarity. The finding that clear stimuli evoked higher frontal theta power than noisy stimuli was initially counterintuitive, as one might expect greater cognitive effort for ambiguous decisions. However, this pattern suggests that theta activity may reflect effective cognitive engagement and confident decision-making, rather than increased effort due to ambiguity. This interpretation aligns with recent theoretical frameworks proposing that frontal theta reflects the successful implementation of cognitive control rather than simply increased effort [
26,
41]. Clear stimuli may enable more efficient engagement of decision-making mechanisms, resulting in enhanced theta power that reflects optimal cognitive processing [
42].
A key finding of this study is the dissociation between task-evoked and intrinsic connectivity patterns. The significant imaginary coherence differences observed in ERP-based analysis, but not in single-trial analysis, reveal that stimulus clarity specifically modulates stimulus-locked neural coordination while leaving intrinsic network communication intact. While Thatcher [
43] warned about artifactual coherence from signal averaging, our ERP-based analysis using CSD transformation and imaginary coherence captured genuine stimulus-locked synchronization. The absence of coherence differences in single-trial analysis indicates that intrinsic connectivity patterns remain stable, while task-evoked coordination dynamically adapts to stimulus properties.
This pattern suggests that the brain employs distinct mechanisms for adapting to task demands: task-evoked synchronization that dynamically adjusts to stimulus properties, and intrinsic connectivity that maintains stable communication channels regardless of stimulus characteristics. This dissociation aligns with emerging frameworks distinguishing between evoked and intrinsic neural responses [
44,
45].
Both ERP-based and single-trial analyses demonstrated significant frontal theta power increases for clear versus noisy stimuli, with effects emerging within 100 ms and sustaining throughout the 400 ms analysis window. Frontal regions consistently dominated theta-band responses across both analytical methods, while parietal regions showed minimal modulation by stimulus clarity, suggesting that frontal areas implement primary cognitive control mechanisms during perceptual decision-making under uncertainty. Recent studies have demonstrated that frontal theta power during task preparation reflects cognitive effort allocation [
46] and that theta dynamics track the developmental trajectory of cognitive control from childhood to adulthood [
47], further supporting theta's role as a marker of control engagement rather than mere difficulty.
Additionally, non-phase-locked oscillatory activity showed selective effects, with induced imaginary coherence significantly higher for clear stimuli, while induced power remained unchanged, suggesting that stimulus clarity primarily affects inter-regional communication rather than local oscillatory strength. These findings are consistent with recent research showing that inter-trial phase coherence at theta frequency integrates temporal and spectral features for effective change detection [
48] and supports conscious access to visual information through phase-locked responses [
49], suggesting that theta synchronization facilitates both sensory discrimination and perceptual awareness.
This study demonstrates the importance of distinguishing between different types of neural connectivity in EEG research [
50,
51]. The two analytical approaches revealed distinct aspects of neural connectivity, with ERP-based coherence capturing stimulus-locked synchronization patterns that reflect coordinated network responses to task demands, while single-trial coherence measured intrinsic connectivity patterns that operate independently of stimulus timing, revealing baseline communication architecture between brain regions. These complementary methods demonstrate that neural networks operate through both dynamic, stimulus-driven synchronization and stable intrinsic connectivity, providing different but valuable perspectives on network function.
The dual artifact removal approach combining CSD transformation with imaginary coherence analysis provides a conservative measure of genuine inter-regional communication. Furthermore, the comparison between ERP-based and single-trial approaches reveals that these methods capture fundamentally different aspects of brain function, each providing valuable but distinct insights into neural connectivity. These findings collectively demonstrate that theta oscillations serve as dynamic markers of cognitive control engagement, with frontal regions playing a dominant role in adapting neural responses to varying perceptual demands.
5. Conclusions
The present study demonstrates that frontal theta oscillations play a central role in perceptual decision-making, with both power and connectivity patterns selectively modulated by stimulus clarity. Clear stimuli elicited stronger frontal theta responses than noisy stimuli, a finding that emerged rapidly within 100 ms and persisted throughout the decision-making window. Rather than reflecting increased effort under ambiguity, frontal theta activity here appears to index effective cognitive engagement and confident decision-making when perceptual evidence is reliable. This interpretation is consistent with frameworks positioning theta as a neural marker of adaptive control, bridging sensory input with higher-order executive processes.
Equally important, our connectivity analyses revealed a dissociation between task-evoked and intrinsic neural communication. ERP-based coherence measures showed that stimulus clarity dynamically modulated frontal–parietal synchronization, whereas single-trial analyses indicated that intrinsic connectivity remained stable across conditions. This pattern highlights the complementary roles of flexible, stimulus-driven coordination and stable, ongoing communication in supporting perceptual decisions. Such findings underscore the brain’s capacity to balance adaptive responsiveness to external demands with the preservation of baseline network integrity.
Methodologically, this study illustrates the value of combining ERP-based and single-trial approaches with conservative connectivity measures such as current source density and imaginary coherence. ERP-based analyses proved highly sensitive to robust, time-locked effects, while single-trial analyses captured trial-level variability and stable connectivity properties. Taken together, these results provide new insight into how frontal theta oscillations support perceptual decision-making, while also advancing methodological perspectives on how to integrate different analytical approaches in EEG research. By demonstrating the distinct but complementary contributions of task-evoked and intrinsic dynamics, the study emphasizes both the flexibility and stability of neural mechanisms that underlie decision-making under varying perceptual demands.
Author Contributions
Rashmi Parajuli: Conceptualization, Methodology, Formal analysis, Writing original draft, Writing review and editing. Eleanor Flynn: Methodology, Formal analysis. Mukesh Dhamala: Conceptualization, Methodology, Supervision, Funding acquisition, Writing review and editing. All authors have read and agreed to the published version of the manuscript.
Data Availability Statement
Code and data for one representative figure will be shared on the Open Science Framework (OSF) repository (link will be provided upon publication) to support reproducibility.
Acknowledgments
We thank Ganesh B. Chand and Bidhan Lamichhane for collecting the original EEG dataset. The co-author EF was supported by an NSF REU program.
Conflicts of Interest
The authors declare no conflicts of interest.
References
- Green, N.; Heekeren, H.R. Perceptual decision making: a bidirectional link between mind and motion. Prog Brain Res 2009, 174, 207–218. [Google Scholar]
- Maksimenko, V.A.; Kuc, A.; Frolov, N.S.; Khramova, M.V.; Pisarchik, A.N.; Hramov, A.E. Dissociating Cognitive Processes During Ambiguous Information Processing in Perceptual Decision-Making. Front. Behav. Neurosci. 2020, 14, 95. [Google Scholar] [CrossRef] [PubMed]
- Kelly, S.P.; O'Connell, R.G. Internal and External Influences on the Rate of Sensory Evidence Accumulation in the Human Brain. J. Neurosci. 2013, 33, 19434–19441. [Google Scholar] [CrossRef]
- Stone, C.; Mattingley, J.B.; Bode, S.; Rangelov, D. Distinct neural markers of evidence accumulation index metacognitive processing before and after simple visual decisions. Cereb. Cortex 2024, 34. [Google Scholar] [CrossRef] [PubMed]
- Heekeren, H.R.; Marrett, S.; Ungerleider, L.G. The neural systems that mediate human perceptual decision making. Nat. Rev. Neurosci. 2008, 9, 467–479. [Google Scholar] [CrossRef] [PubMed]
- Summerfield, C.; de Lange, F.P. Expectation in perceptual decision making: neural and computational mechanisms. Nat Rev Neurosci 2014, 15, 745–756. [Google Scholar] [CrossRef]
- Ratcliff, R.; McKoon, G. The Diffusion Decision Model: Theory and Data for Two-Choice Decision Tasks. Neural Comput. 2008, 20, 873–922. [Google Scholar] [CrossRef]
- Shin, S.; Oh, J.; Kim, S.K.; Lee, Y.-S.; Kim, S.J. Quantitative dynamics of neural uncertainty in sensory processing and decision-making during discriminative learning. Exp. Mol. Med. 2025, 57, 1078–1088. [Google Scholar] [CrossRef]
- Gold, J.I.; Shadlen, M.N. The Neural Basis of Decision Making. Annu. Rev. Neurosci. 2007, 30, 535–574. [Google Scholar] [CrossRef]
- Başar, E. Brain oscillations in neuropsychiatric disease. Dialog- Clin. Neurosci. 2013, 15, 291–300. [Google Scholar] [CrossRef]
- van Bree, S.; et al. Processes and measurements: a framework for understanding neural oscillations in field potentials. Trends in Cognitive Sciences 2025, 29, 448–466. [Google Scholar] [CrossRef]
- Fries, P. Rhythms for Cognition: Communication through Coherence. Neuron 2015, 88, 220–235. [Google Scholar] [CrossRef]
- Luo, Y.; et al. Oscillatory mechanisms of intrinsic human brain networks. NeuroImage 2024, 298, 120773. [Google Scholar] [CrossRef] [PubMed]
- Kahana, M.J. The Cognitive Correlates of Human Brain Oscillations. J. Neurosci. 2006, 26, 1669–1672. [Google Scholar] [CrossRef]
- Klimesch, W. EEG alpha and theta oscillations reflect cognitive and memory performance: a review and analysis. Brain Res. Rev. 1999, 29, 169–195. [Google Scholar] [CrossRef] [PubMed]
- Tan, E.; Troller-Renfree, S.V.; Morales, S.; Buzzell, G.A.; McSweeney, M.; Antúnez, M.; Fox, N.A. Theta activity and cognitive functioning: Integrating evidence from resting-state and task-related developmental electroencephalography (EEG) research. Dev. Cogn. Neurosci. 2024, 67, 101404. [Google Scholar] [CrossRef]
- Clayton, M.S.; Yeung, N.; Kadosh, R.C. The roles of cortical oscillations in sustained attention. Trends Cogn. Sci. 2015, 19, 188–195. [Google Scholar] [CrossRef] [PubMed]
- Mitchell, D.J.; et al. Frontal-midline theta from the perspective of hippocampal "theta". Prog Neurobiol 2008, 86, 156–185. [Google Scholar] [CrossRef]
- Guth, T.A.; Brandt, A.; Reinacher, P.C.; Schulze-Bonhage, A.; Jacobs, J.; Kunz, L. Theta-phase locking of single neurons during human spatial memory. Nat. Commun. 2025, 16, 7402. [Google Scholar] [CrossRef]
- Sauseng, P.; Klimesch, W. What does phase information of oscillatory brain activity tell us about cognitive processes? Neurosci. Biobehav. Rev. 2008, 32, 1001–1013. [Google Scholar] [CrossRef]
- Navi, F.F.T.; Heysieattalab, S.; Raoufy, M.R.; Sabaghypour, S.; Nazari, M.; Nazari, M.A. Adaptive closed-loop modulation of cortical theta oscillations: Insights into the neural dynamics of navigational decision-making. Brain Stimul. 2024, 17, 1101–1118. [Google Scholar] [CrossRef] [PubMed]
- Sauseng, P.; Griesmayr, B.; Freunberger, R.; Klimesch, W. Control mechanisms in working memory: A possible function of EEG theta oscillations. Neurosci. Biobehav. Rev. 2010, 34, 1015–1022. [Google Scholar] [CrossRef]
- Herweg, N.A.; Solomon, E.A.; Kahana, M.J. Theta Oscillations in Human Memory. Trends Cogn. Sci. 2020, 24, 208–227. [Google Scholar] [CrossRef]
- Kapetaniou, G.E.; Vural, G.; Soutschek, A. Frontoparietal theta stimulation causally links working memory with impulsive decision making. Cortex 2025, 185, 240–249. [Google Scholar] [CrossRef] [PubMed]
- Lisman, J.E.; Jensen, O. The Theta-Gamma Neural Code. Neuron 2013, 77, 1002–1016. [Google Scholar] [CrossRef]
- Cavanagh, J.F.; Frank, M.J. Frontal theta as a mechanism for cognitive control. Trends Cogn. Sci. 2014, 18, 414–421. [Google Scholar] [CrossRef]
- Cavanagh, J.F.; Zambrano-Vazquez, L.; Allen, J.J.B. Theta lingua franca: A common mid-frontal substrate for action monitoring processes. Psychophysiology 2012, 49, 220–238. [Google Scholar] [CrossRef]
- Nigbur, R.; Ivanova, G.; Stürmer, B. Theta power as a marker for cognitive interference. Clin. Neurophysiol. 2011, 122, 2185–2194. [Google Scholar] [CrossRef]
- Rajan, A.; Siegel, S.N.; Liu, Y.; Bengson, J.; Mangun, G.R.; Ding, M. Theta Oscillations Index Frontal Decision-Making and Mediate Reciprocal Frontal–Parietal Interactions in Willed Attention. Cereb. Cortex 2019, 29, 2832–2843. [Google Scholar] [CrossRef]
- Siegel, M.; Donner, T.H.; Engel, A.K. Spectral fingerprints of large-scale neuronal interactions. Nat. Rev. Neurosci. 2012, 13, 121–134. [Google Scholar] [CrossRef] [PubMed]
- Martínez-Molina, M.P.; Valdebenito-Oyarzo, G.; Soto-Icaza, P.; Zamorano, F.; Figueroa-Vargas, A.; Carvajal-Paredes, P.; Stecher, X.; Salinas, C.; Valero-Cabré, A.; Polania, R.; et al. Lateral prefrontal theta oscillations causally drive a computational mechanism underlying conflict expectation and adaptation. Nat. Commun. 2024, 15, 1–16. [Google Scholar] [CrossRef] [PubMed]
- Fleming, S.M.; Dolan, R.J. The neural basis of metacognitive ability. Philos Trans R Soc Lond B Biol Sci 2012, 367, 1338–1349. [Google Scholar] [CrossRef] [PubMed]
- Cortese, A.; Amano, K.; Koizumi, A.; Kawato, M.; Lau, H. Multivoxel neurofeedback selectively modulates confidence without changing perceptual performance. Nat. Commun. 2016, 7, 13669. [Google Scholar] [CrossRef]
- Wokke, M.E.; Cleeremans, A.; Ridderinkhof, K.R. Sure I'm Sure: Prefrontal Oscillations Support Metacognitive Monitoring of Decision Making. J Neurosci 2017, 37, 781–789. [Google Scholar] [CrossRef]
- Wokke, M.E.; Achoui, D.; Cleeremans, A. Action information contributes to metacognitive decision-making. Sci. Rep. 2020, 10, 1–15. [Google Scholar] [CrossRef]
- Wynn, S.C.; Townsend, C.D.; Nyhus, E. The role of theta and gamma oscillations in item memory, source memory, and memory confidence. Psychophysiology 2024, 61, e14602. [Google Scholar] [CrossRef]
- Chand, G.B.; Lamichhane, B.; Dhamala, M. Face or House Image Perception: Beta and Gamma Bands of Oscillations in Brain Networks Carry Out Decision-Making. Brain Connect. 2016, 6, 621–631. [Google Scholar] [CrossRef]
- Ekman, P.; Friesen, W.V. Pictures of facial affect; Consulting Psychologists’ Press: Palo Alto, CA, USA, 1976. [Google Scholar]
- Ostrowski, J.; Rose, M. Increases in pre-stimulus theta and alpha oscillations precede successful encoding of crossmodal associations. Sci. Rep. 2024, 14, 1–14. [Google Scholar] [CrossRef]
- Kayser, J.; Tenke, C.E. Principal components analysis of Laplacian waveforms as a generic method for identifying ERP generator patterns: II. Adequacy of low-density estimates. Clin. Neurophysiol. 2006, 117, 369–380. [Google Scholar] [CrossRef] [PubMed]
- Cooper, P.S.; Wong, A.S.; Fulham, W.; Thienel, R.; Mansfield, E.; Michie, P.T.; Karayanidis, F. Theta frontoparietal connectivity associated with proactive and reactive cognitive control processes. NeuroImage 2015, 108, 354–363. [Google Scholar] [CrossRef]
- Hajihosseini, A.; Holroyd, C.B. Frontal midline theta and N200 amplitude reflect complementary information about expectancy and outcome evaluation. Psychophysiology 2013, 50, 550–562. [Google Scholar] [CrossRef] [PubMed]
- Thatcher, R.W. Coherence, Phase Differences, Phase Shift, and Phase Lock in EEG/ERP Analyses. Dev. Neuropsychol. 2012, 37, 476–496. [Google Scholar] [CrossRef]
- Bressler, S.L.; Menon, V. Large-scale brain networks in cognition: emerging methods and principles. Trends Cogn. Sci. 2010, 14, 277–290. [Google Scholar] [CrossRef]
- Sadaghiani, S.; Kleinschmidt, A. Brain Networks and α-Oscillations: Structural and Functional Foundations of Cognitive Control. Trends Cogn. Sci. 2016, 20, 805–817. [Google Scholar] [CrossRef]
- Arnau, S.; Liegel, N.; Wascher, E. Frontal midline theta power during the cue-target-interval reflects increased cognitive effort in rewarded task-switching. Cortex 2024, 180, 94–110. [Google Scholar] [CrossRef]
- Morales, S.; Buzzell, G.A. EEG time-frequency dynamics of early cognitive control development. Dev. Cogn. Neurosci. 2025, 73, 101548. [Google Scholar] [CrossRef]
- Xia, C.; Li, J.; Yan, R.; Su, W.; Liu, Y. Contribution of inter-trial phase coherence at theta, alpha, and beta frequencies in auditory change detection. Front. Neurosci. 2023, 17, 1224479. [Google Scholar] [CrossRef] [PubMed]
- Kurita, Y.; Urakawa, T.; Araki, O. Theta phase coherence in visual mismatch responses involved in access processing to visual awareness. Front. Hum. Neurosci. 2023, 17, 1051844. [Google Scholar] [CrossRef]
- Bastos, A.M.; Schoffelen, J.-M. A Tutorial Review of Functional Connectivity Analysis Methods and Their Interpretational Pitfalls. Front. Syst. Neurosci. 2015, 9, 175. [Google Scholar] [CrossRef] [PubMed]
- Friston, K.J. Functional and Effective Connectivity: A Review. Brain Connectivity 2011, 1, 13–36. [Google Scholar] [CrossRef]
|
Disclaimer/Publisher’s Note: The statements, opinions and data contained in all publications are solely those of the individual author(s) and contributor(s) and not of MDPI and/or the editor(s). MDPI and/or the editor(s) disclaim responsibility for any injury to people or property resulting from any ideas, methods, instructions or products referred to in the content. |
© 2025 by the authors. Licensee MDPI, Basel, Switzerland. This article is an open access article distributed under the terms and conditions of the Creative Commons Attribution (CC BY) license (http://creativecommons.org/licenses/by/4.0/).