Preprint
Article

This version is not peer-reviewed.

Comprehensive Transcriptomic Analysis and Biomarker Prioritization of Hydroxyprogesterone in Breast Cancer

A peer-reviewed article of this preprint also exists.

Submitted:

09 December 2025

Posted:

24 December 2025

You are already at the latest version

Abstract

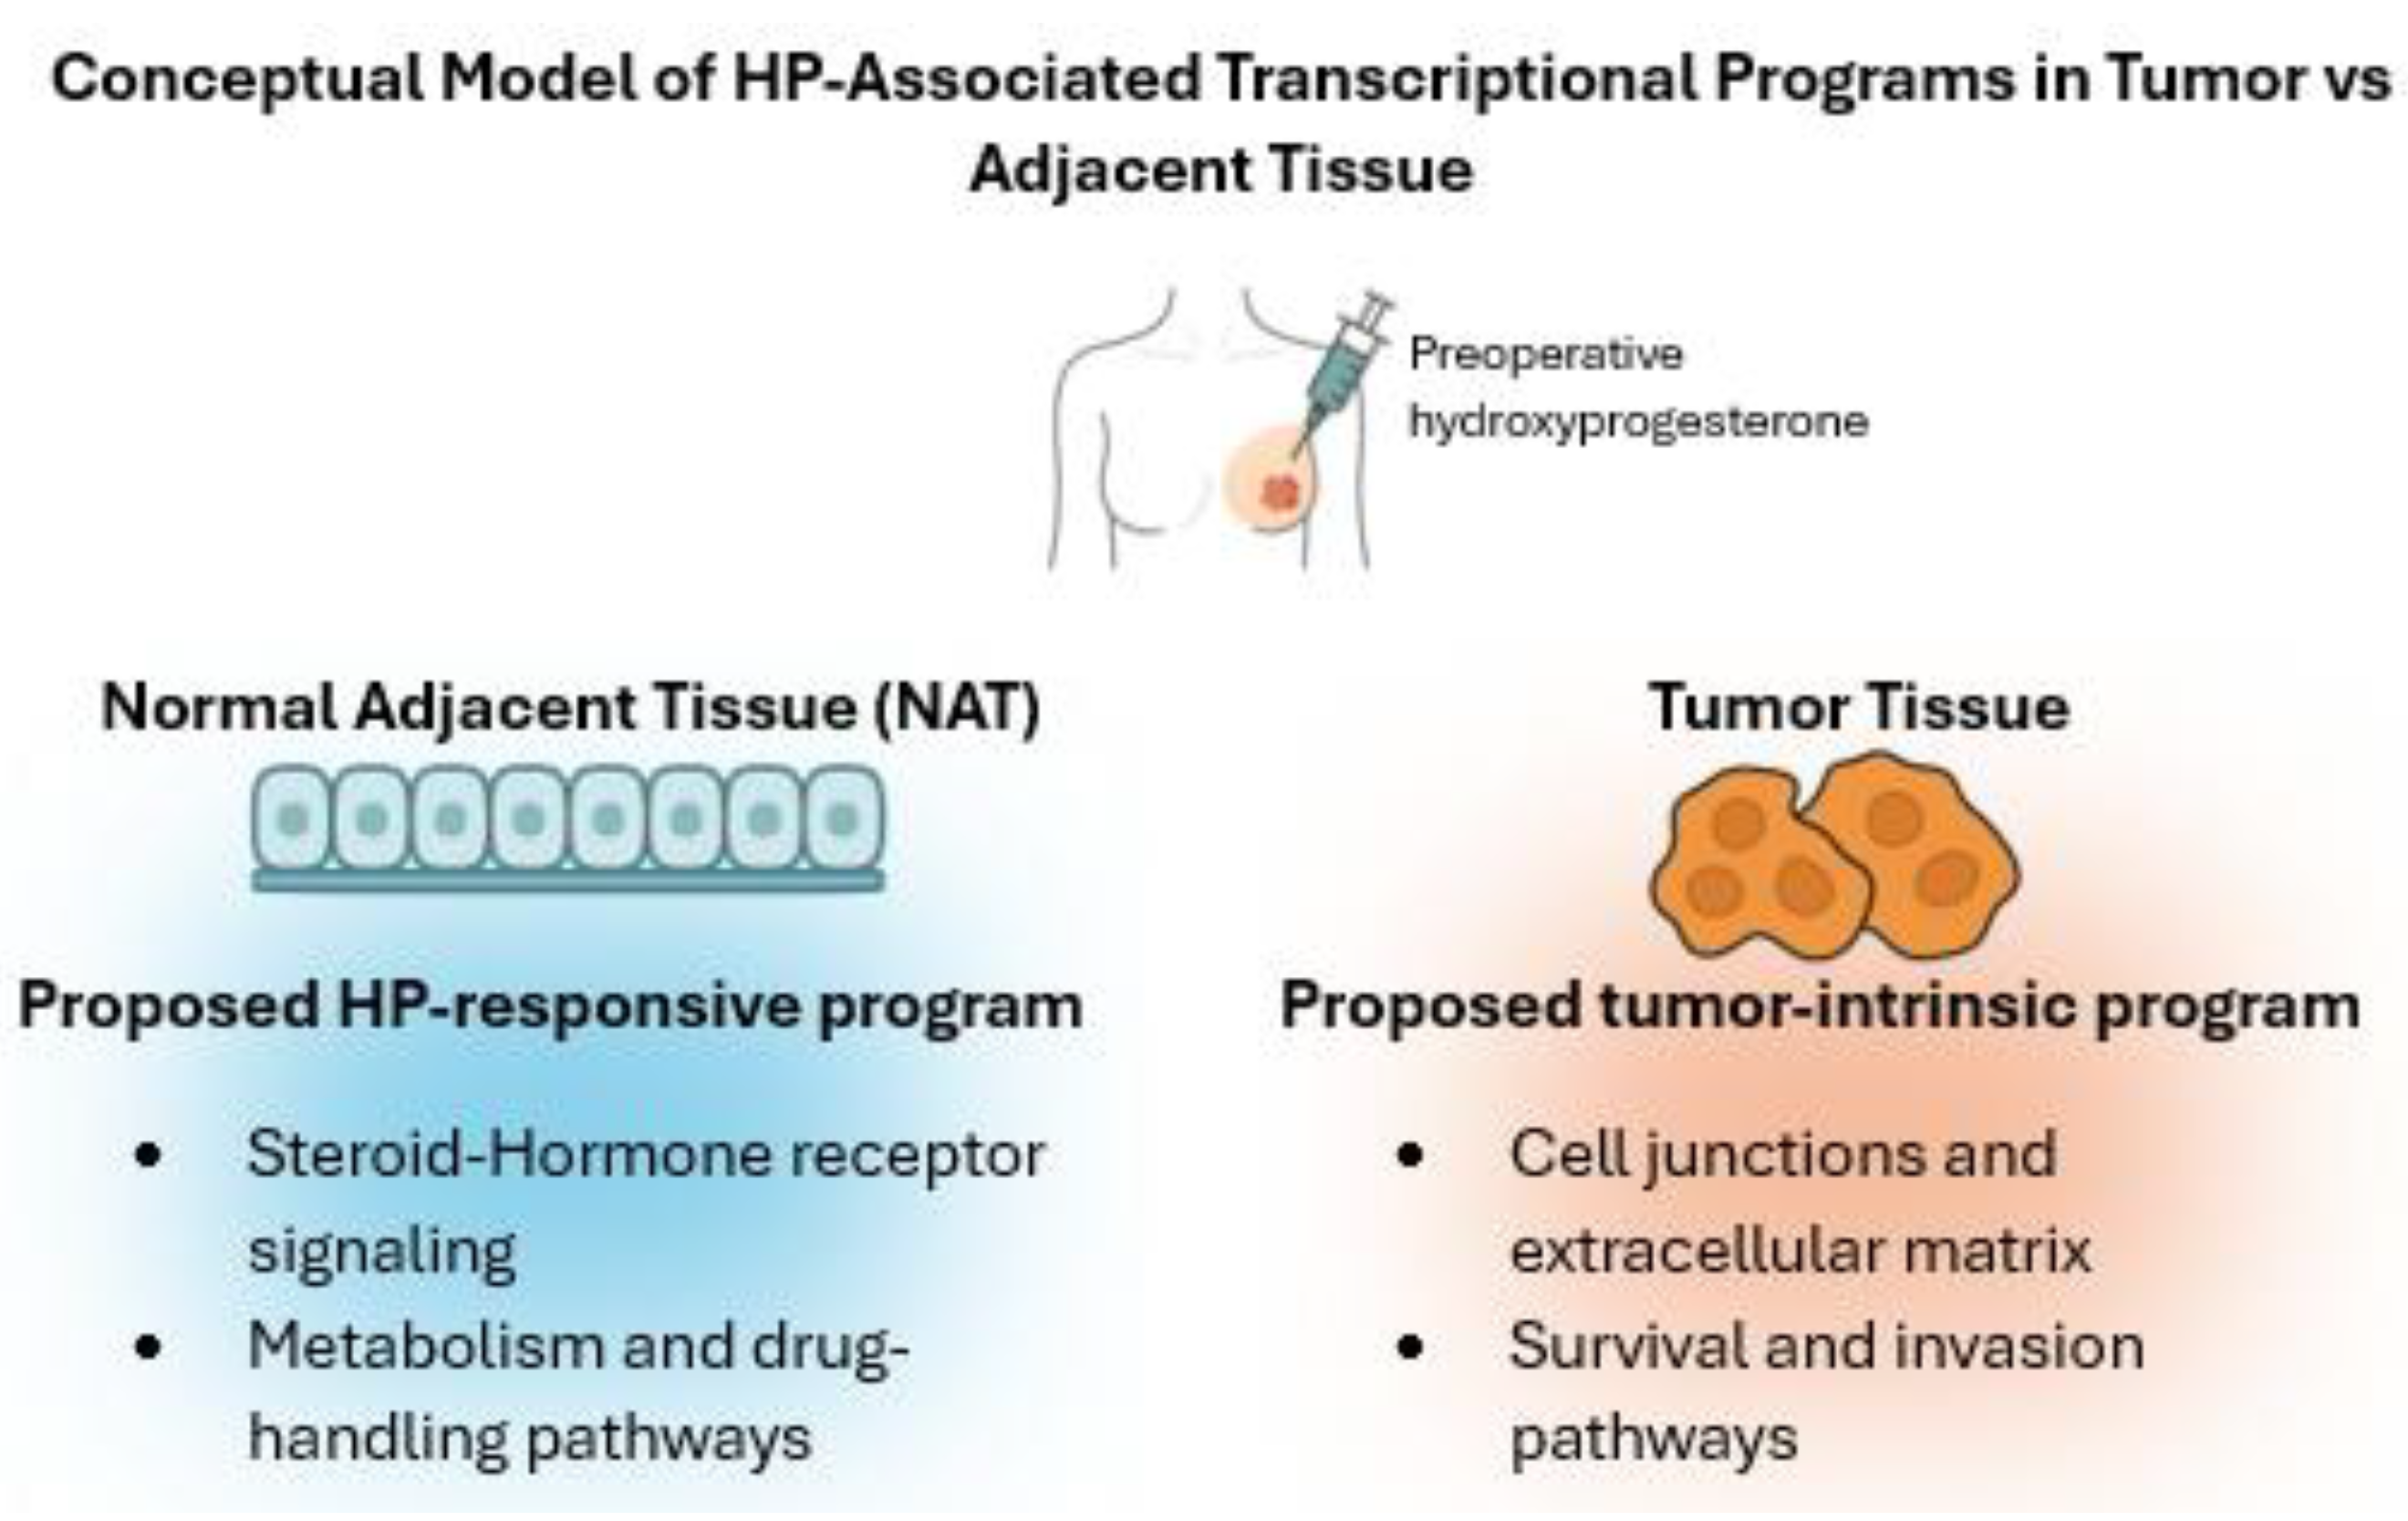
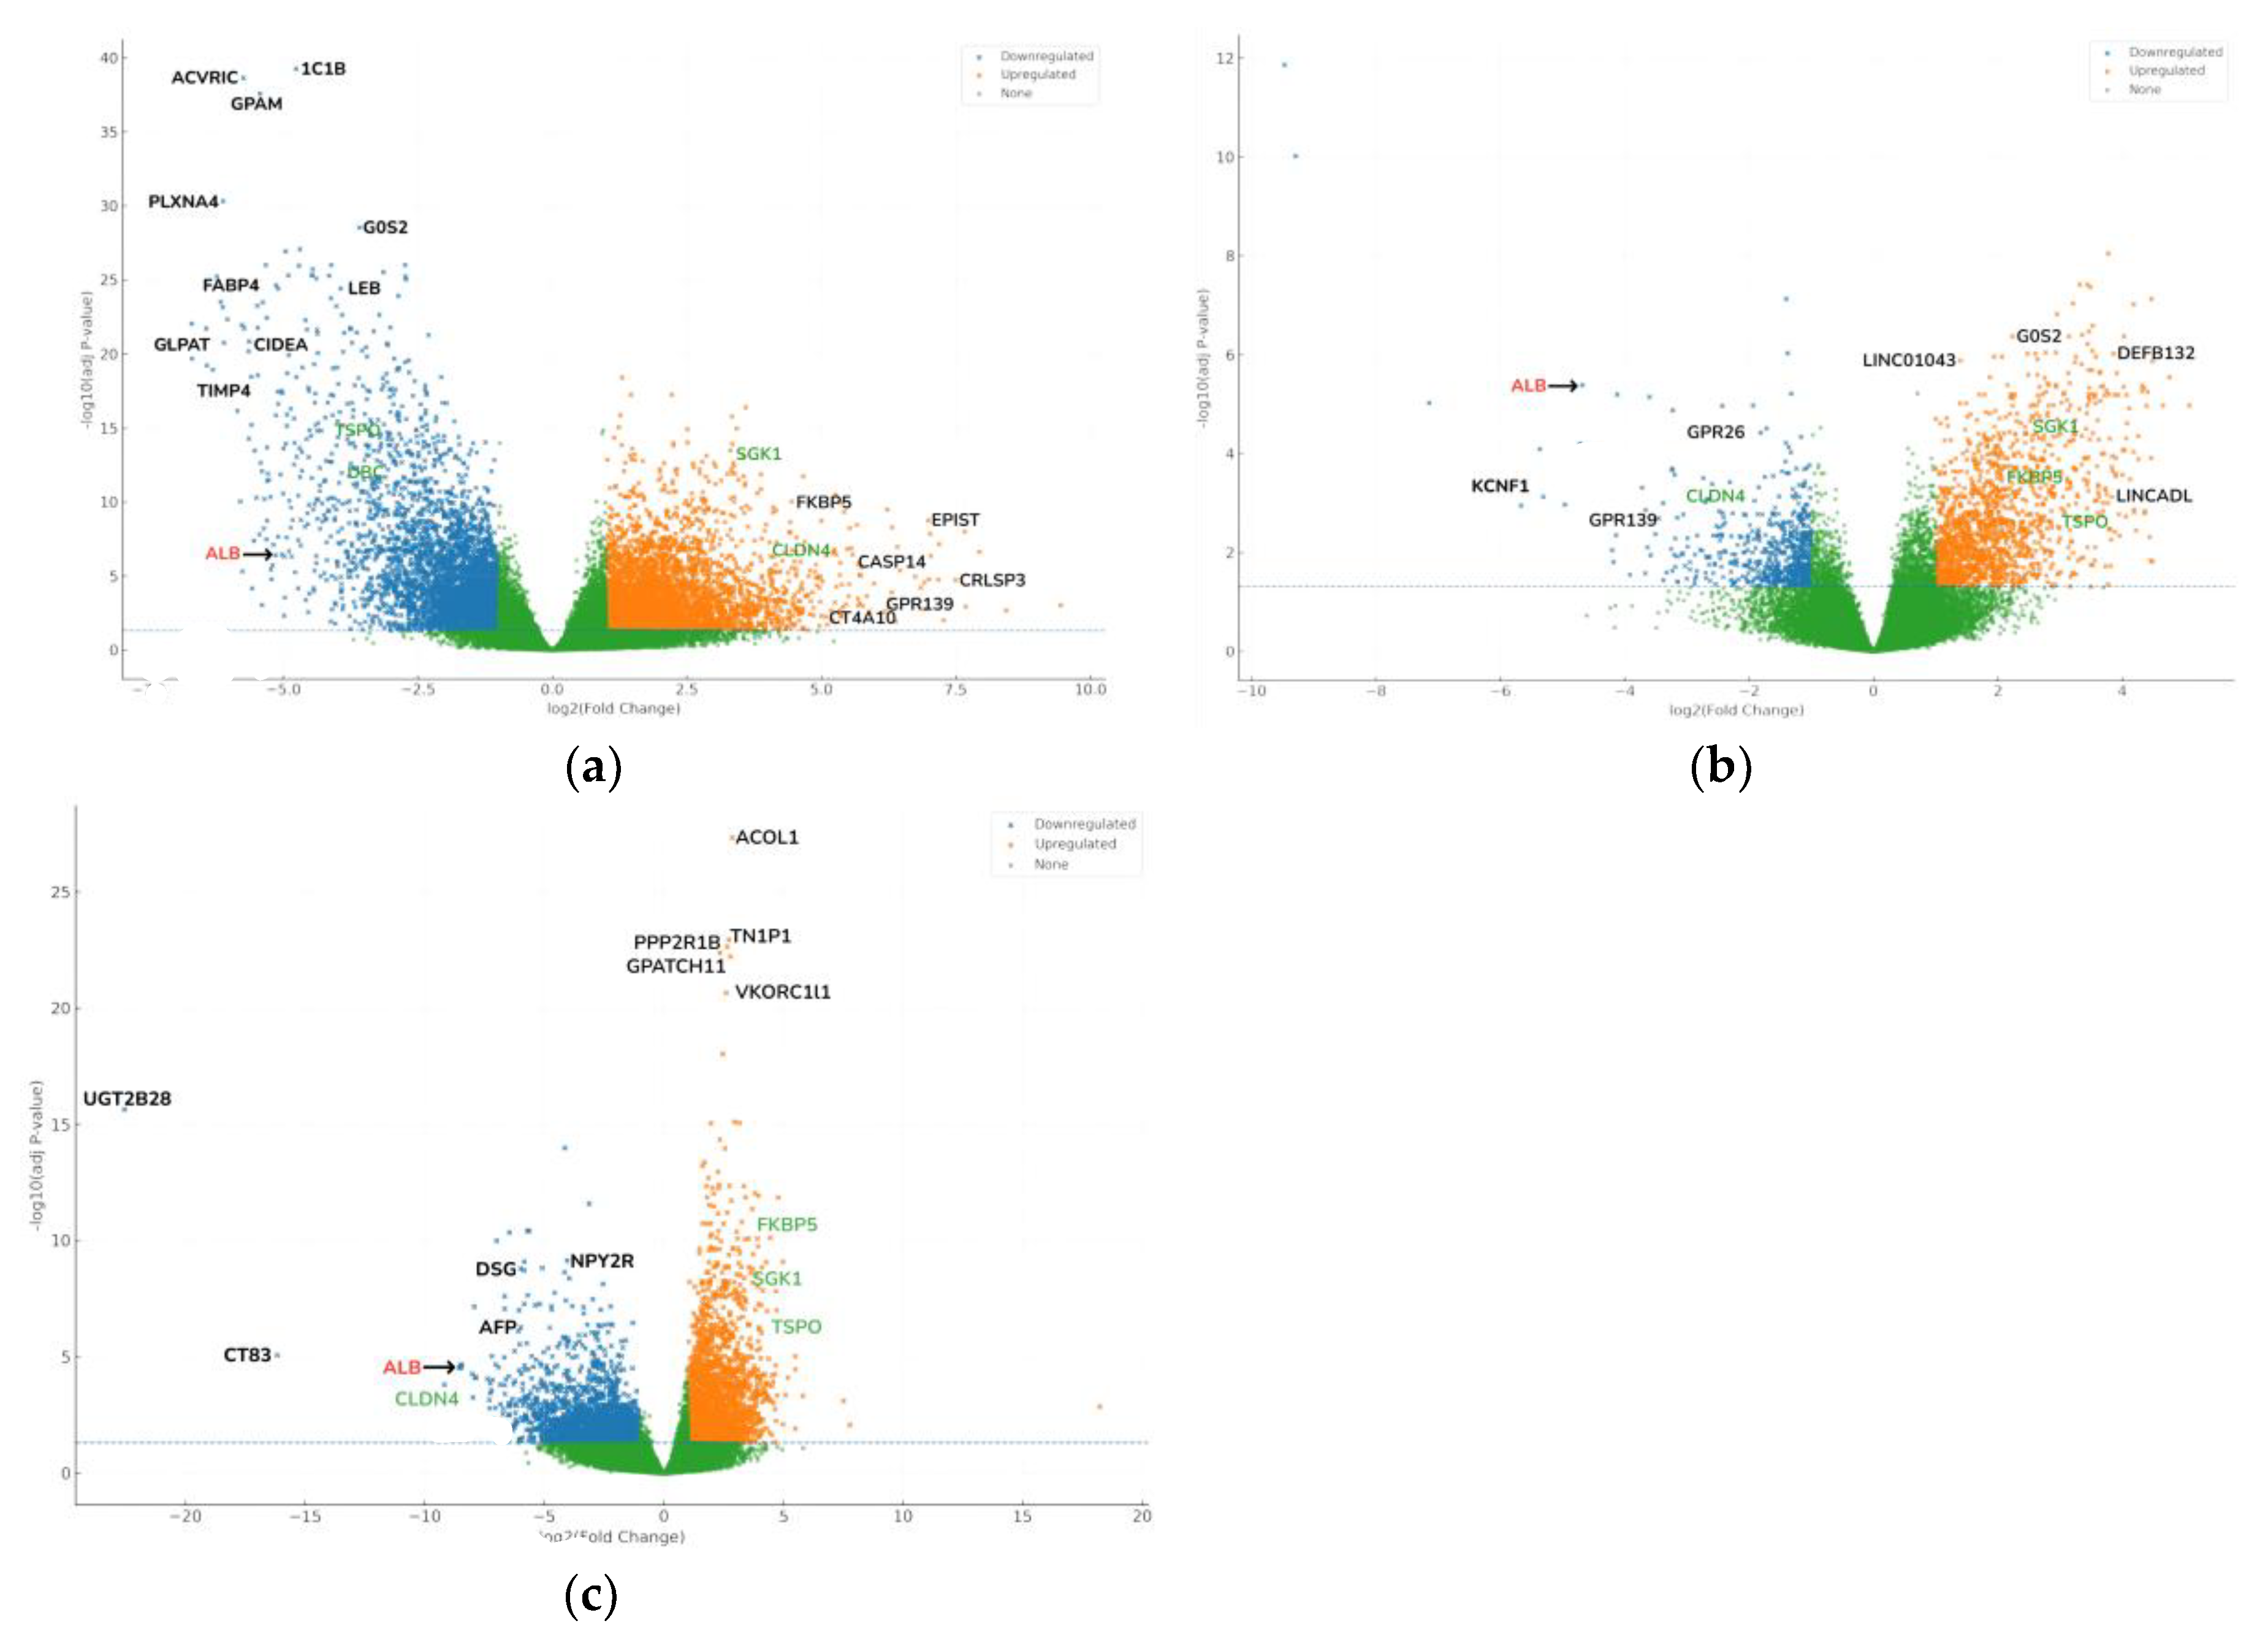
Hydroxyprogesterone (HP) is a synthetic progestogen widely used in obstetric care, and its potential influence on breast cancer biology has become an emerging area of interest. Despite its clinical use, the molecular mechanisms by which HP affects tumor tissue remain insufficiently explored. In this study, transcriptomic profiling was performed to investigate gene expression changes associated with HP in operable breast cancer. Pre-operative 17-OHPC exposure was associated, in normal adjacent tissue (NAT), with activation of steroid-hormone and lipid/xenobiotic-metabolism programs and crosstalk to PI3K–Akt and NF-κB. In NAT, these pathways showed the largest absolute log2 fold-change (|log2FC|); significance is reported as FDR throughout (e.g., FKBP5↑ with HP). In tumor tissue, the dominant signal reflected tight-junction/apical-junction and ECM-receptor remodeling (e.g., CLDN4↑). We prioritized FKBP5 (HP pharmacodynamics) and CLDN4 (tumor baseline) as the main candidates; TSPO and SGK1 are reported as exploratory. These findings provide mechanistic insight into HP’s molecular effects in breast cancer and suggest potential applications in biomarker perioperative management.

Keywords: 
;  ;  ;  ;  

1. Introduction

Breast cancer remains the most prevalent malignancy in women worldwide and a leading cause of cancer-related mortality. In 2020 alone, 2.3 million new cases and approximately 685,000 deaths were reported, accounting for 16% of all female cancer deaths [1,2,3]. While incidence is higher in developed regions, mortality disproportionately affects transitioning countries due to delayed diagnosis and limited access to effective therapies [4,5]. Global projections estimate that annual breast cancer cases may surpass 3 million by 2040, highlighting the urgent need for enhanced prevention, early detection, and biomarker-driven treatment strategies [3].
Hormonal signaling plays a critical role in breast cancer pathogenesis. Estrogen receptors (ERα/ERβ) and progesterone receptors (PR-A/PR-B) regulate gene transcription, cell proliferation, and tumor progression. Estrogen primarily drives tumorigenesis through both genomic and non-genomic pathways, while progesterone exerts complex effects, sometimes promoting survival and proliferation [6,7]. Hydroxyprogesterone (HP), a bioactive PR ligand widely used in obstetric care, has emerged as a compound of interest in breast cancer biology. Experimental evidence suggests that HP and related progestogens modulate tumor metabolism, attenuate glycolysis, and influence anti-inflammatory signaling pathways, potentially impacting therapy response and resistance mechanisms [8,9,10]. Recent advances in precision oncology emphasize the utility of transcriptomics in unraveling hormone-driven tumor biology. Transcriptome profiling captures dynamic gene expression, alternative splicing, and non-coding RNA activity, providing real-time molecular insights beyond static genomic mutations [11]. Clinically, transcriptomic assays like Oncotype DX and MammaPrint have demonstrated utility in risk stratification and guiding endocrine therapy in ER-positive breast cancer [12,13]. Throughout, “HP+” denotes pre-operative 17-OHPC exposure and “HP−” denotes no exposure. When integrated with co-expression network analysis, transcriptomics facilitates biomarker discovery by connecting expression changes to functional protein targets with translational relevance [14].
Short-window pre-operative exposure to 17α-hydroxyprogesterone caproate (17-OHPC) may differentially affect normal adjacent tissue (NAT) and tumor; therefore, we profiled matched tumor/NAT transcriptomes to map exposure-linked signals. Our goals were (i) to delineate HP-associated transcriptional programs in each tissue and (ii) to assess whether these programs align with two complementary axes—steroid-hormone/lipid–drug-metabolism in NAT versus tight-junction/ECM remodeling in tumor. As an exploratory, hypothesis-generating analysis, we prioritized candidate biomarkers using a predefined rubric and summarized module-level trends with Weighted Gene Co-expression Network Analysis (WGCNA) and pathway enrichment.
Figure 1. Conceptual model of HP-associated transcriptional programs in tumor vs adjacent tissue. Credit: Sketched by the author in Samsung Notes; redrawn in Microsoft Word and vector-cleaned with ChatGPT (OpenAI) from the original author sketch.
Preprints 188908 g001

2. Materials and Methods

2.1. Study Design and Overview

This study was designed to explore the molecular effects of hydroxyprogesterone (HP) on operable breast cancer using an integrative bioinformatics approach. The primary goal was to identify transcriptomic alterations induced by HP treatment and to prioritize potential biomarkers with functional relevance. The research utilized publicly available RNA-seq data from the Sequence Read Archive (SRA) project ERP135222, which contains HP-exposed and non-exposed samples from tumor and NAT tissue collected from patients exposed or unexposed to HP prior to surgery [15].
To capture the complexity of HP’s effects, we categorized samples into four biologically relevant groups: Tumor HP+, Tumor HP−, NAT HP+, and NAT HP−. This scheme enables within-tissue HP contrasts (Tumor HP+ vs Tumor HP−; NAT HP+ vs NAT HP−) and cross-tissue comparisons (Tumor vs NAT). Table 1 summarizes patient/sample counts. Based on the source article’s clinical summary, HP-exposed patients (n = 18; 58.6 ± 2.8 y) were evenly distributed across ER+PR±HER2-, HER2+, and ER-PR-HER2- groups (6/18 each; 33.3%). Unexposed patients (n = 13; 58.5 ± 9.7 y) included 4/13 (30.8%) ER+PR±HER2-, 8/13 (61.5%) HER2+ (of which 6 ER+HER2+ and 2 ER-HER2+), and 1/13 (7.7%) ER-PR-HER2-.
The overall workflow, as shown in Figure 2, combined transcriptome profiling, differential expression analysis, functional enrichment, and co-expression network construction, thereby providing a multi-scale evaluation of HP’s influence on breast cancer biology.

2.2. Dataset Description and Sample Grouping

The dataset included 31 women diagnosed with operable breast cancer. Among these patients, 18 received a single intramuscular dose of 500 mg HP within 15 days prior to surgery, while 13 underwent surgery without hormonal exposure. Multiple core biopsies were collected, encompassing pre-surgical and post-resection specimens for both tumor and NAT [15].
In total, 31 tumor samples and 10 NAT samples were analyzed, providing a robust framework for distinguishing HP-related transcriptional changes. RNA was extracted using TRIzol reagent (Invitrogen) and purified with the PureLink RNA Mini Kit (Invitrogen) to ensure high-quality RNA suitable for sequencing [16]. Library preparation employed the Illumina TruSeq RNA Sample Preparation Kit, and samples were sequenced on paired-end Illumina platforms, generating transcriptomic data suitable for downstream bioinformatics analysis. This dataset design enabled biologically and clinically meaningful comparisons. Differences between tumors and NAT were assessed within each treatment group, while the influence of HP exposure was examined within both tumor and non-tumor contexts.

2.3. Data Preprocessing

High-quality transcriptomic data is critical for reliable downstream analyses. Raw sequencing data, initially in. SRA formats were retrieved from the SRA and converted to standard paired-end FASTQ files using the SRA Toolkit (fasterq-dump) [17]. Conversion integrity was verified by confirming read pair consistency and file sizes.
Next, adapter trimming and quality filtering were conducted using Trim Galore, which incorporates Cutadapt and FastQC [18,19]. This step removed adapter sequences, low-quality bases (Phred < 20), and ambiguous poly-N regions. Post-trimming quality checks using FastQC confirmed that retained reads achieved mean Phred scores ≥30 and preserved >90% of their original base content.

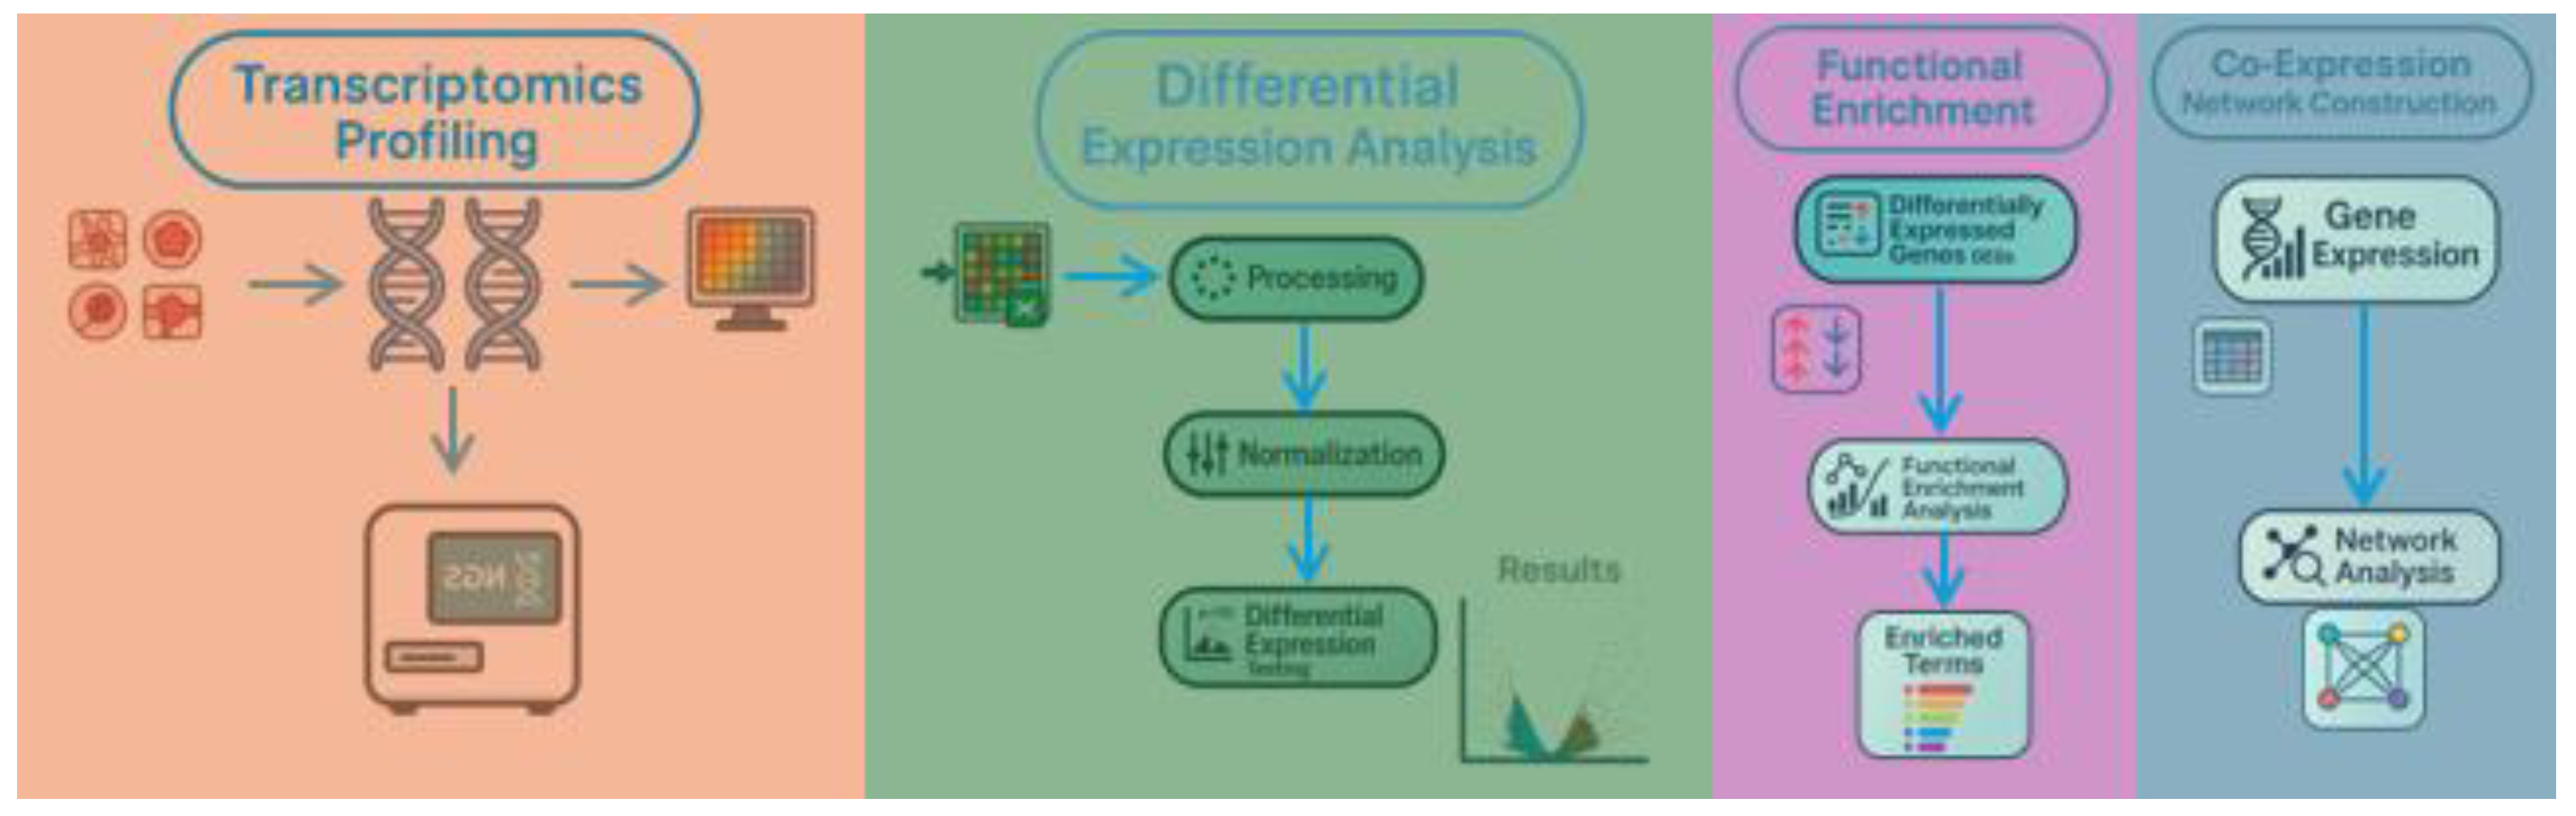
2.4. Alignment and Quantification

The filtered reads were aligned to the human reference genome GRCh38 using HISAT2 [20], a splice-aware aligner that efficiently handles mammalian transcriptomes. Reference indices were generated from the GRCh38 FASTA sequence and its corresponding GTF annotation file to support precise, exon-aware mapping. Alignment quality metrics, including overall mapping rates and the percentage of uniquely aligned reads, were reviewed to ensure consistency across samples. Gene-level quantification was performed using featureCounts [21], which generated a matrix of raw read counts for each gene in each sample.

2.5. Differential Expression Analysis

Differential expression analysis was performed to identify genes modulated by HP exposure and tissue type. Raw count matrices were normalized using DESeq2 [22] and edgeR [23], which apply the median-of-ratios and TMM (trimmed mean of M-values) methods, respectively.
Comparisons were performed between tumor tissues with and without HP exposure, between NAT with and without HP exposure, and between tumor and NAT under both treatment and untreated conditions. This approach enabled the identification of genes that were specifically influenced by hormonal exposure and those that were characteristic of the tumor environment itself.
Low-expression genes (fewer than 10 counts in ≥3 samples) were filtered out. Genes meeting an adjusted p-value (FDR) < 0.05 and |log2 fold change| > 1 were considered significantly differentially expressed (DEGs). The final DEG lists represented high-confidence transcriptional changes for downstream pathway and network analyses [22,23]. An interaction design was considered in exploratory analyses to examine context-dependent HP effects.

2.6. Functional Enrichment Analysis

To interpret the biological significance of the DEGs, both Overrepresentation Analysis (ORA) and Gene Set Enrichment Analysis (GSEA) were performed. Gene Ontology (GO) terms across biological processes (BP), molecular functions (MF), and cellular components (CC), as well as KEGG pathways, were assessed for enrichment using the clusterProfiler R package [24]. ORA identified overrepresented pathways among discrete DEG lists, while GSEA detected coordinated shifts in predefined gene sets across the entire expression ranking [25]. For GSEA, significance was defined as FDR q < 0.25 (primary), with q < 0.05 providing a systems-level view of hormone-driven transcriptomic alterations.

2.7. Co-Expression Network Construction (WGCNA)

WGCNA for downstream pathway and network analyses [26] was applied to identify modules of co-expressed genes associated with tissue phenotype and HP treatment. Variance-stabilized counts from DESeq2 served as the input matrix, and low-variance genes were filtered out to reduce noise.
A soft-thresholding power (β) was selected based on the scale-free topology criterion to produce a biologically meaningful network. Modules were detected using hierarchical clustering and the dynamic tree-cut algorithm, and module eigengenes were correlated with clinical traits. Modules showing significant associations with HP exposure or tumor phenotype were selected for hub gene identification.

2.8. Transcriptome-Based Biomarker Prioritization

Candidate biomarkers were prioritized by integrating differential expression, network centrality, and biological validation. High-confidence DEGs that also functioned as hub genes within significant co-expression modules were assessed in curated databases, including DisGeNET [27], Human Protein Atlas [28], and GeneCards [29], to evaluate their known functional roles and clinical relevance. Candidate selection criteria: Genes were prioritized by (i) DE significance in prespecified contrasts, (ii) biological plausibility for progestin signaling, (iii) concordance across GO/KEGG/GSEA, and (iv) WGCNA module membership (kME) in HP− or tumor-enriched modules.
Genes that were consistently supported across these layers were considered top-priority transcriptomic biomarkers. This multi-tiered strategy ensured that shortlisted biomarkers were both statistically robust and clinically meaningful, providing a foundation for downstream studies.

3. Results

3.1. Quality Control and Read Statistics

Before downstream analyses, we performed RNA-seq QC to confirm sequencing depth and normalization across tumor and NAT. Per-sample gene-assigned reads showed consistent depth (mean ± SD, 41.3 ± 2.5 million; range 37.6–45.2 million; n = 41). After normalization (variance-stabilized counts for PCA; DESeq2-normalized counts for differential expression), per-sample median log2(CPM+1) values were tightly aligned (Δmedian < 1), indicating no global depth bias (see Supplementary Figure S1A–B). Mapping-rate panels are omitted because unique/multi-mapping logs were not available in the shared dataset. Gene-biotype composition was stable across samples (protein-coding predominated, with modest IG and lncRNA fractions; rRNA ~1–2% and other classes each <2%), with similar profiles in HP-exposed and unexposed groups.

3.2. Mapping Efficiency and Gene Coverage

Trimmed reads were aligned to the human reference genome GRCh38 using HISAT2 [20], and feature-level quantification was carried out with featureCounts [21]. Although explicit alignment summary logs were unavailable, normalized gene expression patterns and mapped gene distributions confirmed high alignment quality.
Group-level sequencing metrics were comparable across tissues. Tumor libraries yielded an average of 42.8 million raw reads per sample with normalized median counts of 23.4 and an estimated rRNA content of 2.2%. NAT libraries averaged 39.2 million raw reads with normalized median counts of 22.9 and rRNA content of 1.9%. These values indicate uniform depth and low rRNA contamination across groups, supporting reliable downstream differential expression and network analyses.
The results for read depth and rRNA content showed clear similarity across the research groups, as the genes per sample ranged between 17,000 and 17,500, which is a reasonable number consistent with the expectations for the tissue transcriptome, ensuring full and appropriate coverage for functional analysis. As for quantification, the gene biotype was used, while for read summarization, GRCh38 was applied as follows: 20,014 coding protein genes, 16,086 lncRNAs, 15,206 pseudogenes. In addition, several smaller RNA categories were represented, such as: misc RNA (2,219), snRNA (1,910), miRNA (1,877), and snoRNA (942). Other categories included in these results at this stage were: unknown (1,026), immunoglobulin loci (IG; 214), T-cell receptor loci (TR; 196), rRNA (53), scaRNA (49), mitochondrial tRNA (22), Artifact (19), ribozyme (8), sRNA (7), mitochondrial rRNA (5), vault_RNA (2), and scRNA (1). It was clear that the dominant categories were Protein-coding, lncRNA, and pseudogene, and featureCounts were used to characterize the universe features of all the categories. No rRNA features were considered in the downstream expression analysis and functional analysis.

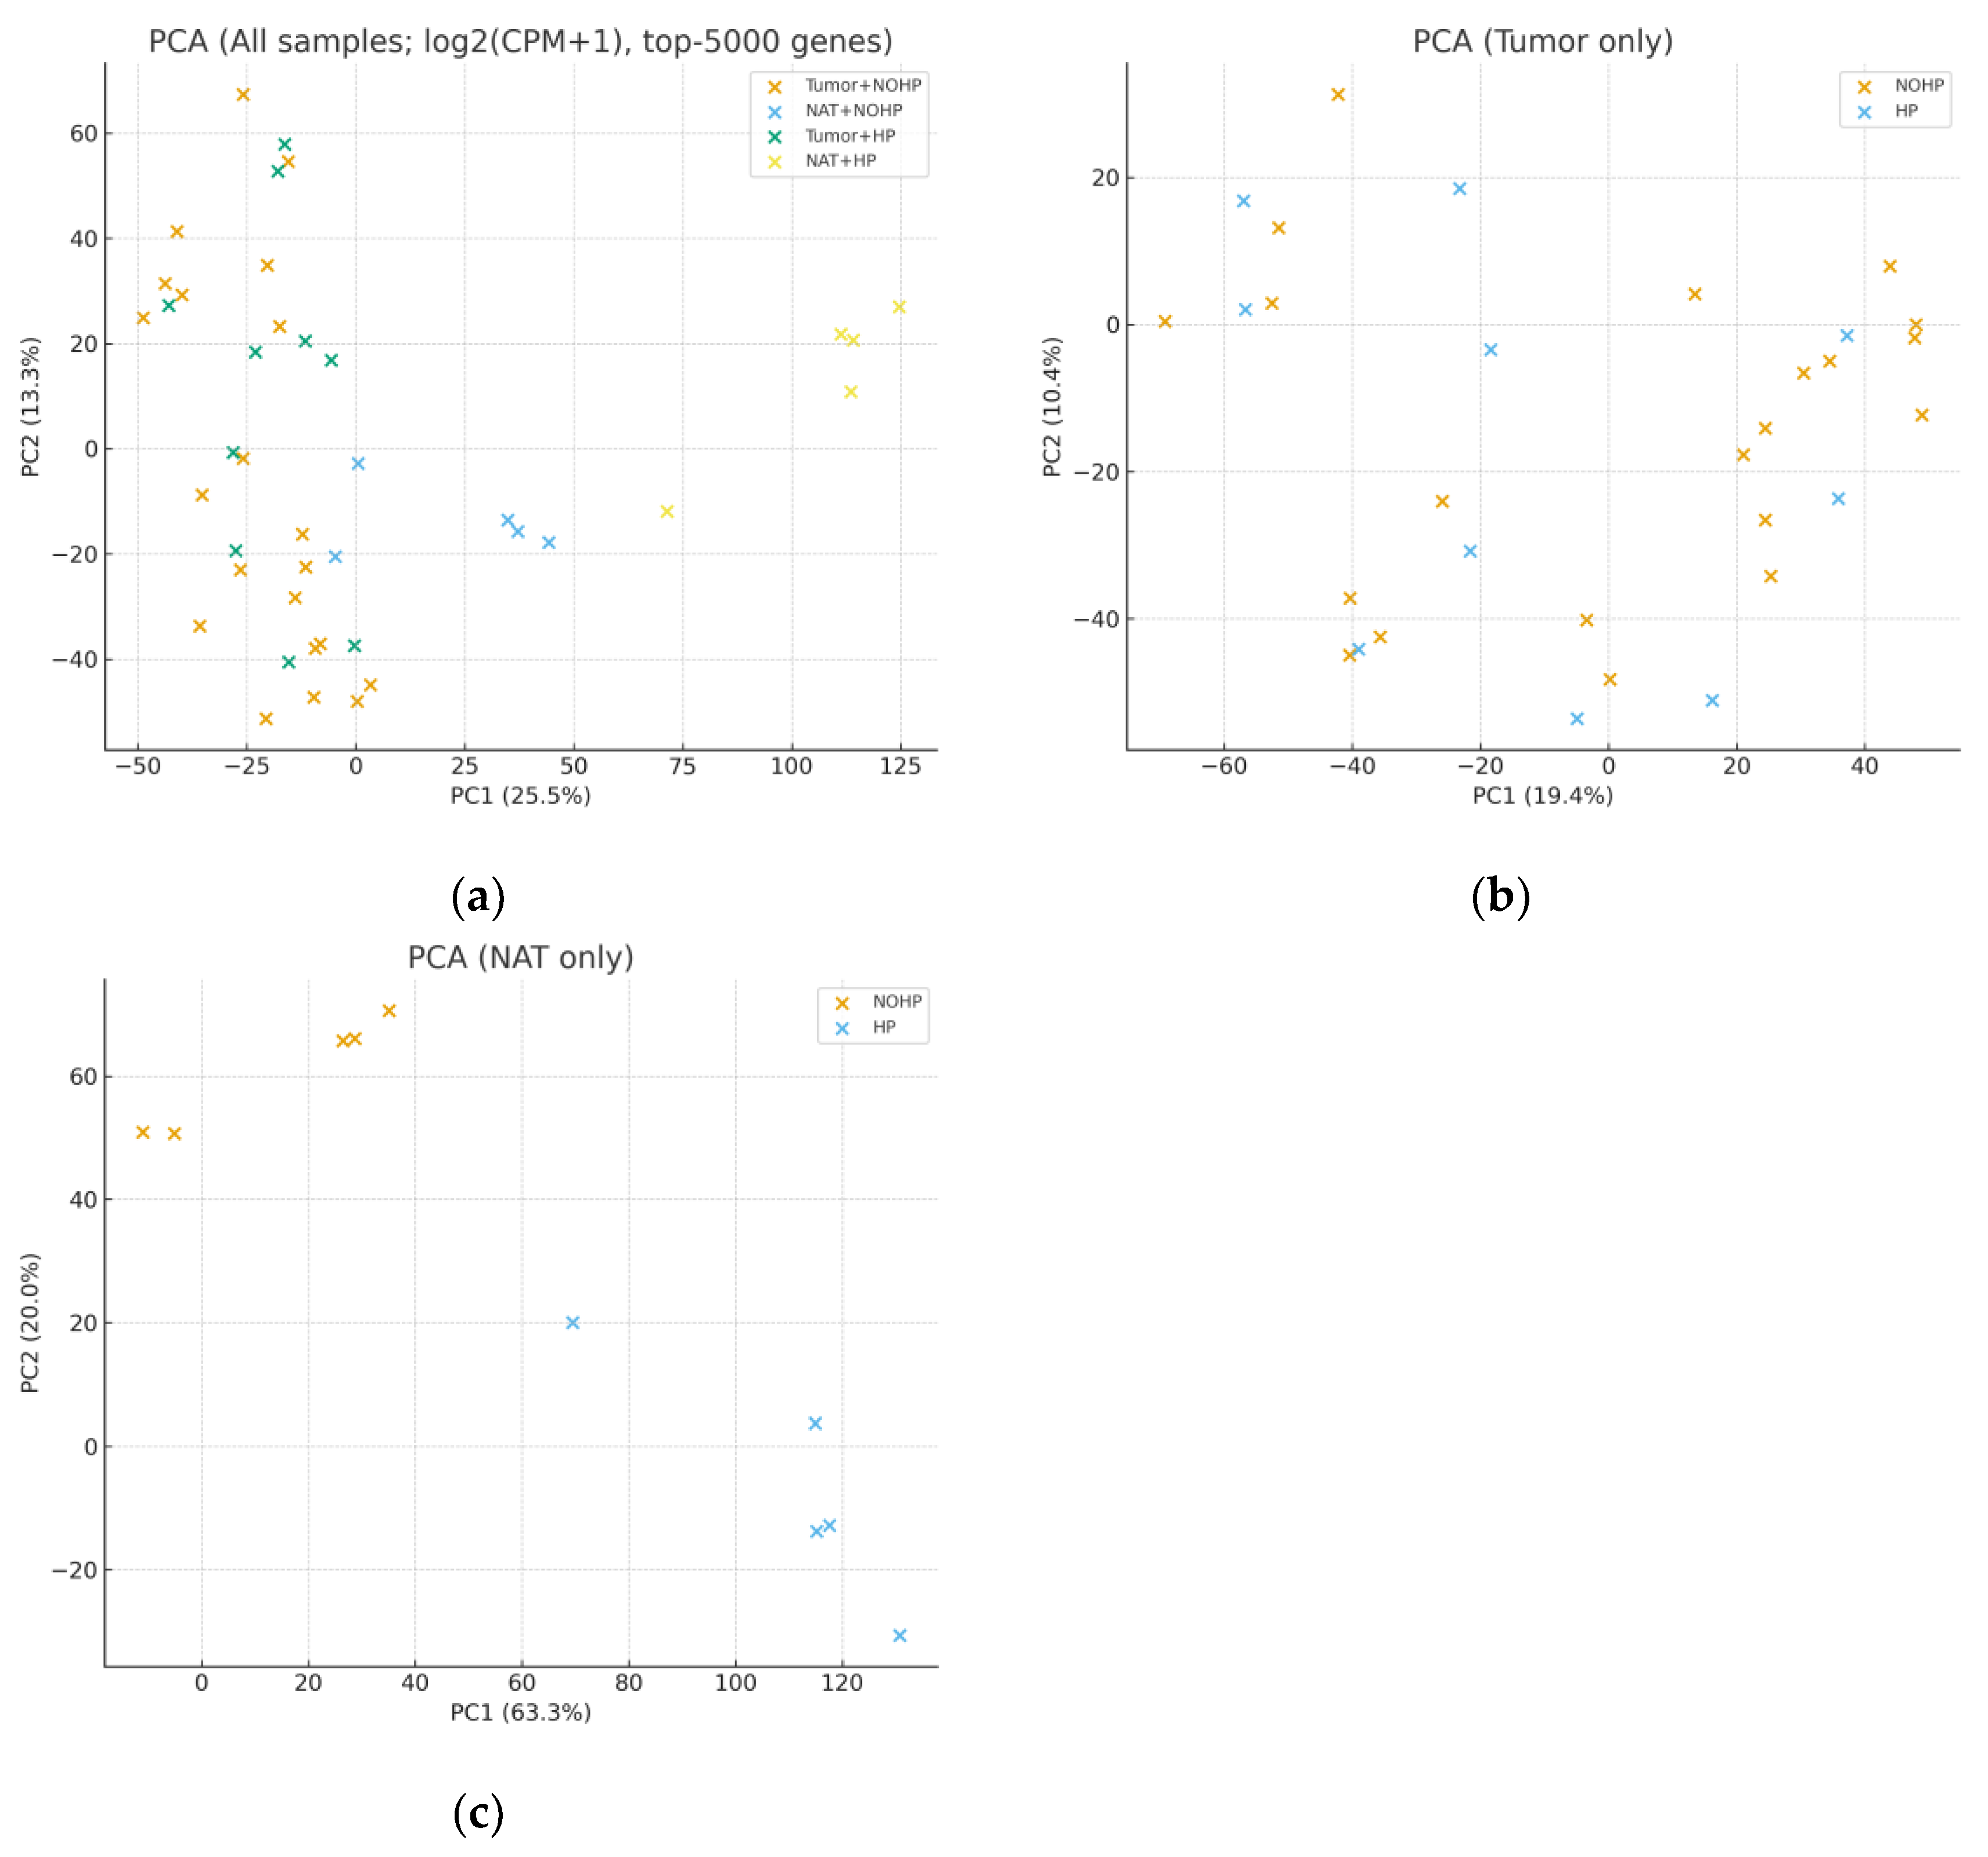
3.3. Transcriptomic Distributions and Principal Component Analysis (PCA)

The global expression patterns were further explored using log2-transformed count distributions and dimensionality reduction. Boxplots of normalized gene count confirmed uniform expression across tumor and NAT groups without extreme outliers, reflecting consistent RNA extraction and library preparation—expression distribution quality check. Sample-wise boxplots of log2(normalized counts + 1) showed tightly aligned medians and interquartile ranges across all libraries, with only sporadic high-value outliers expected for highly expressed genes. Distributions for tumor and NAT largely overlapped; NAT exhibited a modestly higher central tendency in some samples, but differences were minor after normalization. The uniform spread and absence of systematic shifts indicate effective normalization, comparable library complexity, and minimal batch effects, supporting the validity of subsequent differential expression, enrichment, and network analyses.
Heatmaps of the top 30 most variable genes in Figure 3 revealed clear sample clustering patterns. Tumor and NAT displayed distinct global signatures, highlighting biologically meaningful differences. The number of detected genes per sample, summarized in Figure 3, reinforced the robustness of transcriptomic coverage across all 41 samples. For the per-sample gene detection, the complexity of the library was quantified as the number of genes with non-zero counts after filtering. It showed a unique unimodal distribution with around 36-37 K features and 31 K to 38.5 K for spanning across samples. The results showed that all the libraries analyzed were perfectly centered around the middle, with only one tail recorded and no abnormal patterns or secondary modes, which clearly indicates the absence of any specific batch structure among the tissues or any of the treatment groups. The data revealed high and distinct uniformity for both protein-coding and non-coding genes in GRCh38, which supported the stability and robustness of downstream differential expression enrichment, functional, and network analysis.
PCA provided an unsupervised assessment of transcriptomic divergence between groups, as shown in Figure 4. Tumor NATs are separated clearly along the first principal component, reflecting intrinsic differences in malignant and non-malignant transcriptional programs. HP-treated tumor samples demonstrated a moderate directional shift along the second component, suggesting that hydroxyprogesterone induces consistent, tissue-specific transcriptomic modulation, consistent with prior perioperative hormone modulation studies [30,31]. PC1 separates Tumor vs NAT (25.5% of variance); HP exposure separates NAT along PC2 (13.3%), while the HP shift on PC2 is modest and not significant.

3.4. Differential Expression and Functional Insights

Differential gene expression (DGE) analysis was conducted across tumor versus NAT, HP-treated versus untreated samples, and within each tissue type stratified by treatment. Normalized count matrices generated by DESeq2 and edgeR revealed a clear separation of gene expression profiles, and Figure 5 illustrates the magnitude and significance of transcriptional differences. Significant DEGs: Tumor vs NAT = 9,177; Tumor HP+ vs Tumor HP = 2,452; NAT HP+ vs NAT HP = 5,622.
The largest differences were between tumor and NAT, characterized by tight-junction/ECM remodeling and metabolic shifts, with NF-κB–linked inflammatory crosstalk present but secondary to these programs. Consistently, CLDN4 was higher in tumors (log2FC = +1.873, FDR = 1.43×10⁻⁴) [26]. HP exposure led to moderate but biologically meaningful expression shifts. In adjacent tissue, HP increased FKBP5 (log2FC = +2.129, FDR = 0.0158) and other steroid-responsive signals, with enrichment for fatty-acid/xenobiotic/cholesterol gene sets; in tumors, HP effects were smaller, consistent with findings reported in 2018 by Chatterjee et al. [30]. NAT showed the clearest HP-aligned changes, particularly steroid/PPAR–lipid/xenobiotic responses (e.g., FKBP5), consistent with non-canonical progesterone effects [32,33,34].
Functional enrichment analyses using GO, KEGG, and GSEA provided systems-level insights into these transcriptional patterns. Tumor samples were enriched in cell cycle, DNA replication, and oncogenic signaling pathways. HP treatment enhanced pathways related to oxidative stress response, Inflammatory pathways, and NF-κB-related pathways, steroid biosynthesis, and extracellular matrix remodeling [25,26,35]. These findings support the hypothesis that hydroxyprogesterone influences both intrinsic tumor programs and the tumor microenvironment.
The scientific framework used in the study indicates two main complementary and important axes in the biology of breast cancer, with clear specificity. The first axis is the HP-responsive steroid/PPAR–lipid–xenobiotic pathway, which appears more prominent and evident in the adjacent tissue, where the pharmacodynamic readout is strong and profound. As for the second axis, the intrinsic pathway of the tumor is driven by epithelial junction and ECM-remodeling signals, which form the basis for invasion and survival [30,34]. What distinguishes this model and the dual perspective for reviewing the data is that it leads to avoiding the single gene tunnel vision and also directs attention to the level of the dual pathways by focusing on the different cellular functional pathways in breast cancer [35].
In this scheme, a strong compartment for specific HP engagement [36]. FKBP5 increased with HP in NAT. The corresponding tumor effect was limited and did not remain robust to multiple testing. This is precisely the expected result of asymmetry if the HP is reprogrammed and changed primarily perioperatively, reprograms steroid/PPAR signaling and xenobiotic/lipid handling in non-malignant epithelial or stromal settings [34]. Existing tumors will remain temporarily stabilized within their oncogenic circuitry [30]. In the HP-enriched WGCNA module, FKBP5 has a membership that supports its essential role as an immediate pharmacodynamics readout in place of a downstream spectator. Effectively, FKBP5 represents a concrete and tangible target for validation in mRNA, qPCR, protein, or IHC and patient satisfaction (HP+ vs HP) studies over time to track when HP’s effects begin and how long they last.
In comparison, CLDN4 represents a primary tumor pathway of epithelial junction remodeling and ECM interaction [37]. In the tumor vs NAT comparison, the elevations are substantial and statistically robust. CLDN4 is embedded in tight-junction/ECM pathways and is in a tumor-enriched WGCNA neighborhood that aligns with cancer invasion-competent adhesion states. To support and add independent confirmation for CLDN4, we need to perform an independent experiment using qPCR. The function of CLDN4 acts like a bridge or an anchor for a specific phenotype of the malignant epithelial: simply, it combines and integrates with integrin/tetraspanin signaling at the membrane, organizes barrier properties and polarity of the membrane in addition to keeping up with the transcriptional hallmark of the epithelial remodeling that facilitates dissemination [38,39]. Accordingly, while FKBP5 serves as a measure of HP exposure in pre-tumoral tissue, CLDN4 represents the baseline for tumor structure that HP is not expected to alter on its own.
TSPO and SGK1 are considered as exploratory hypothesis candidates to widen the mechanistic study coverage. Both TSPO and SGK1 show steroid/PPAR–lipid/xenobiotic pathway binding tendencies that are clearly consistent and relevant to hydroxyprogesterone, but statistically, they appear to be modestly significant and more dependent on the biological context. In addition, its biological functions fill the gap left by the primary candidates and are strongly supported by statistics. TSPO links signals responsible for cholesterol transport in mitochondria as well as cellular stress responses, providing a pathway through which metabolic and oxidation-reduction processes can be modulated to alter the nature of cellular motility and sensitivity to treatment; SGK1, a steroid-responsive kinase that biologically emanates from PI3K-AKT, is a potential channel for a wide range of hormonally mediated signals responsible for ion transport and cellular control of junctions [40]. The network diagram of the proteins indicates a regulatory bridge between CLDN4, WNK4, and SGK1, providing a mechanistic pathway from FKBP5 and SGK1 steroid signaling to CLDN4 junction reorganization [41,42,43]. Thus, we conclude that these secondary nodes may help to demonstrate biologically that this complex pathological system functions as a single unit with a highly interconnected system along the lines of steroid → junction/ECM → mitochondrial/ion transport, and not merely as a system based on isolated and noisy genes operating independently without any complex biological system consisting of an interlocking set of interconnected pathways.
It is worth noting that the statistical data indicates a variability in gene sets, especially those related to the subtype. These cellular effects are dependent on the compartment and exposure (e.g., FKBP5↑ in NAT with HP; CLDN4↑ in tumors; TSPO lower in tumors than NAT. This leads us to conclude that some of the identified genes may have a significant and guaranteed relationship within certain strata (ER/PR status, grade, HP exposure timing/dose). The conclusion is that there are two motivations regarding interpretation and design for the future. First, future and upcoming analyses should maintain and emphasize the survival of interaction terms (e.g., tissue × HP, ER status × HP) and avoid any secondary side effects due to genetic subgroups in an exaggerated manner. Second, the validity and strength of hypotheses related to subgroups should be pre-verified instead of relying on clinically related signals.
Together, these findings support a coherent working model. Primary markers—FKBP5 and CLDN4 carry the headline: FKBP5 reports on the HP-engaged steroid/PPAR axis in adjacent tissue, while CLDN4 reports on tumor epithelial remodeling that underlies invasion. Exploratory markers TSPO and SGK1 extend the map to mitochondrial stress and kinase-driven ion-junction control, providing explanatory links between endocrine cues and barrier/ECM phenotypes. This division of labor clarifies why HP’s most visible transcriptomic imprint lies in motility/stress-handling nodes outside the tumor core, whereas the tumor state remains dominated by adhesion and survival pathways.

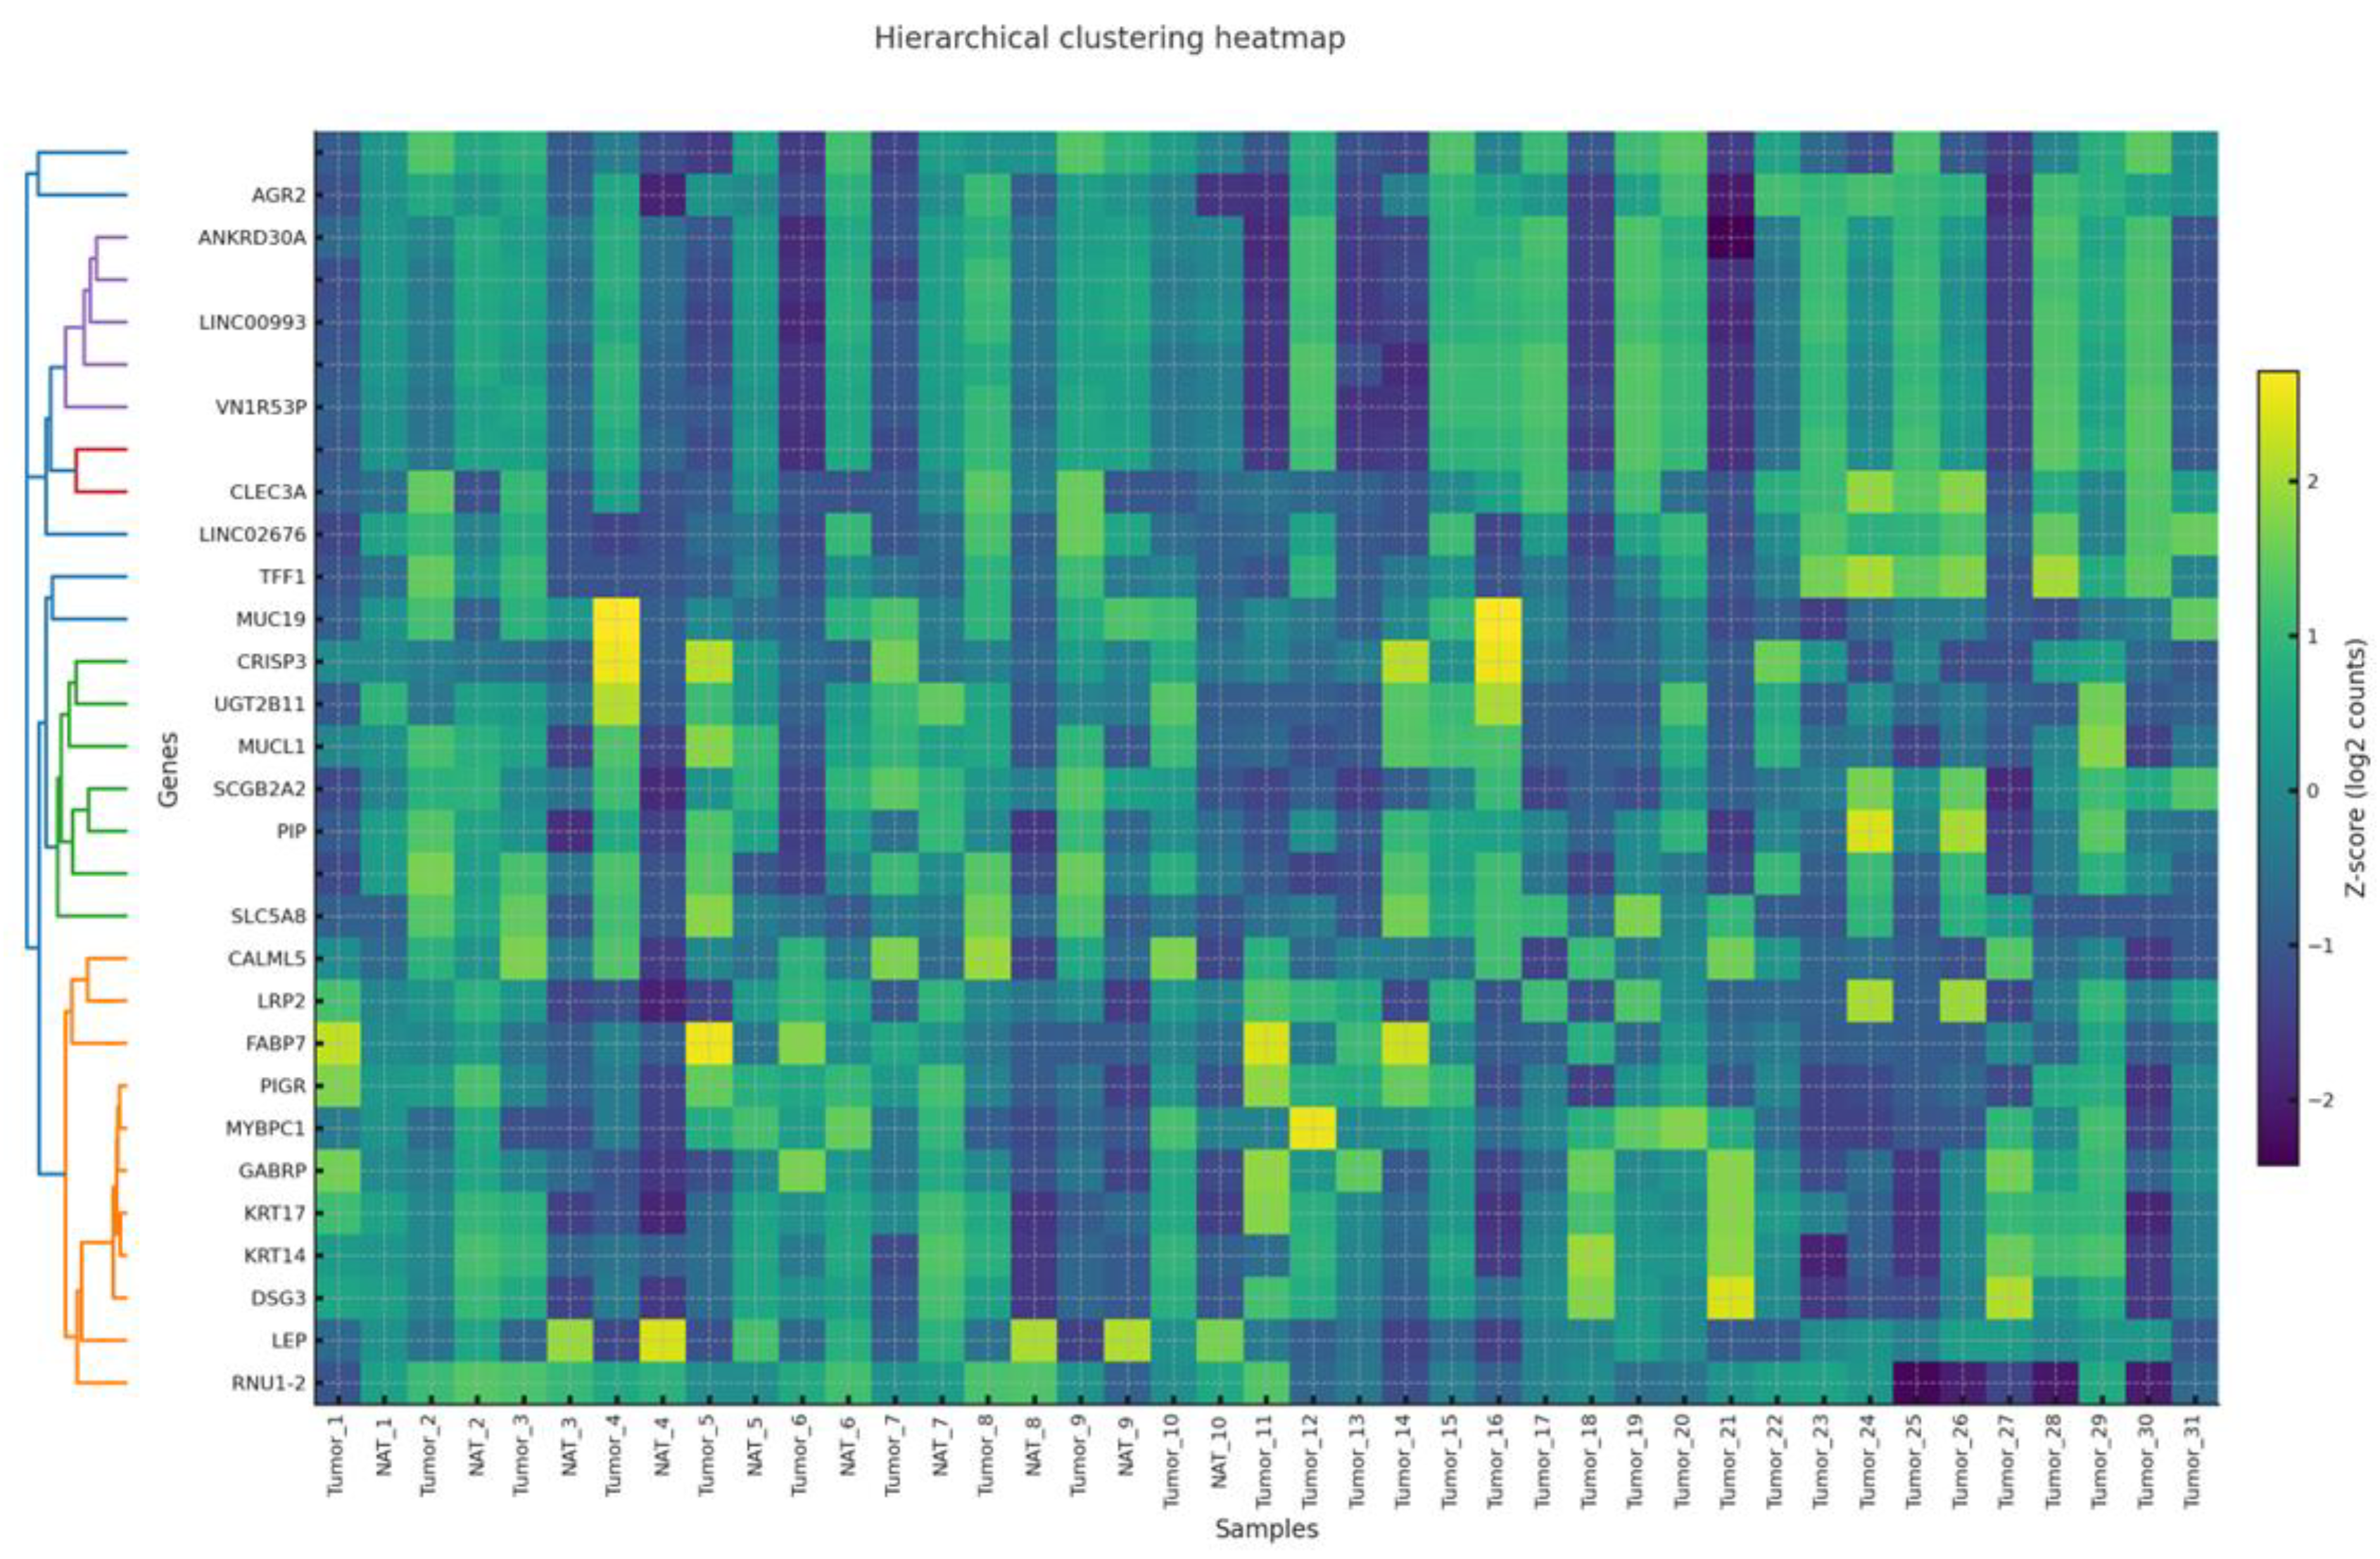
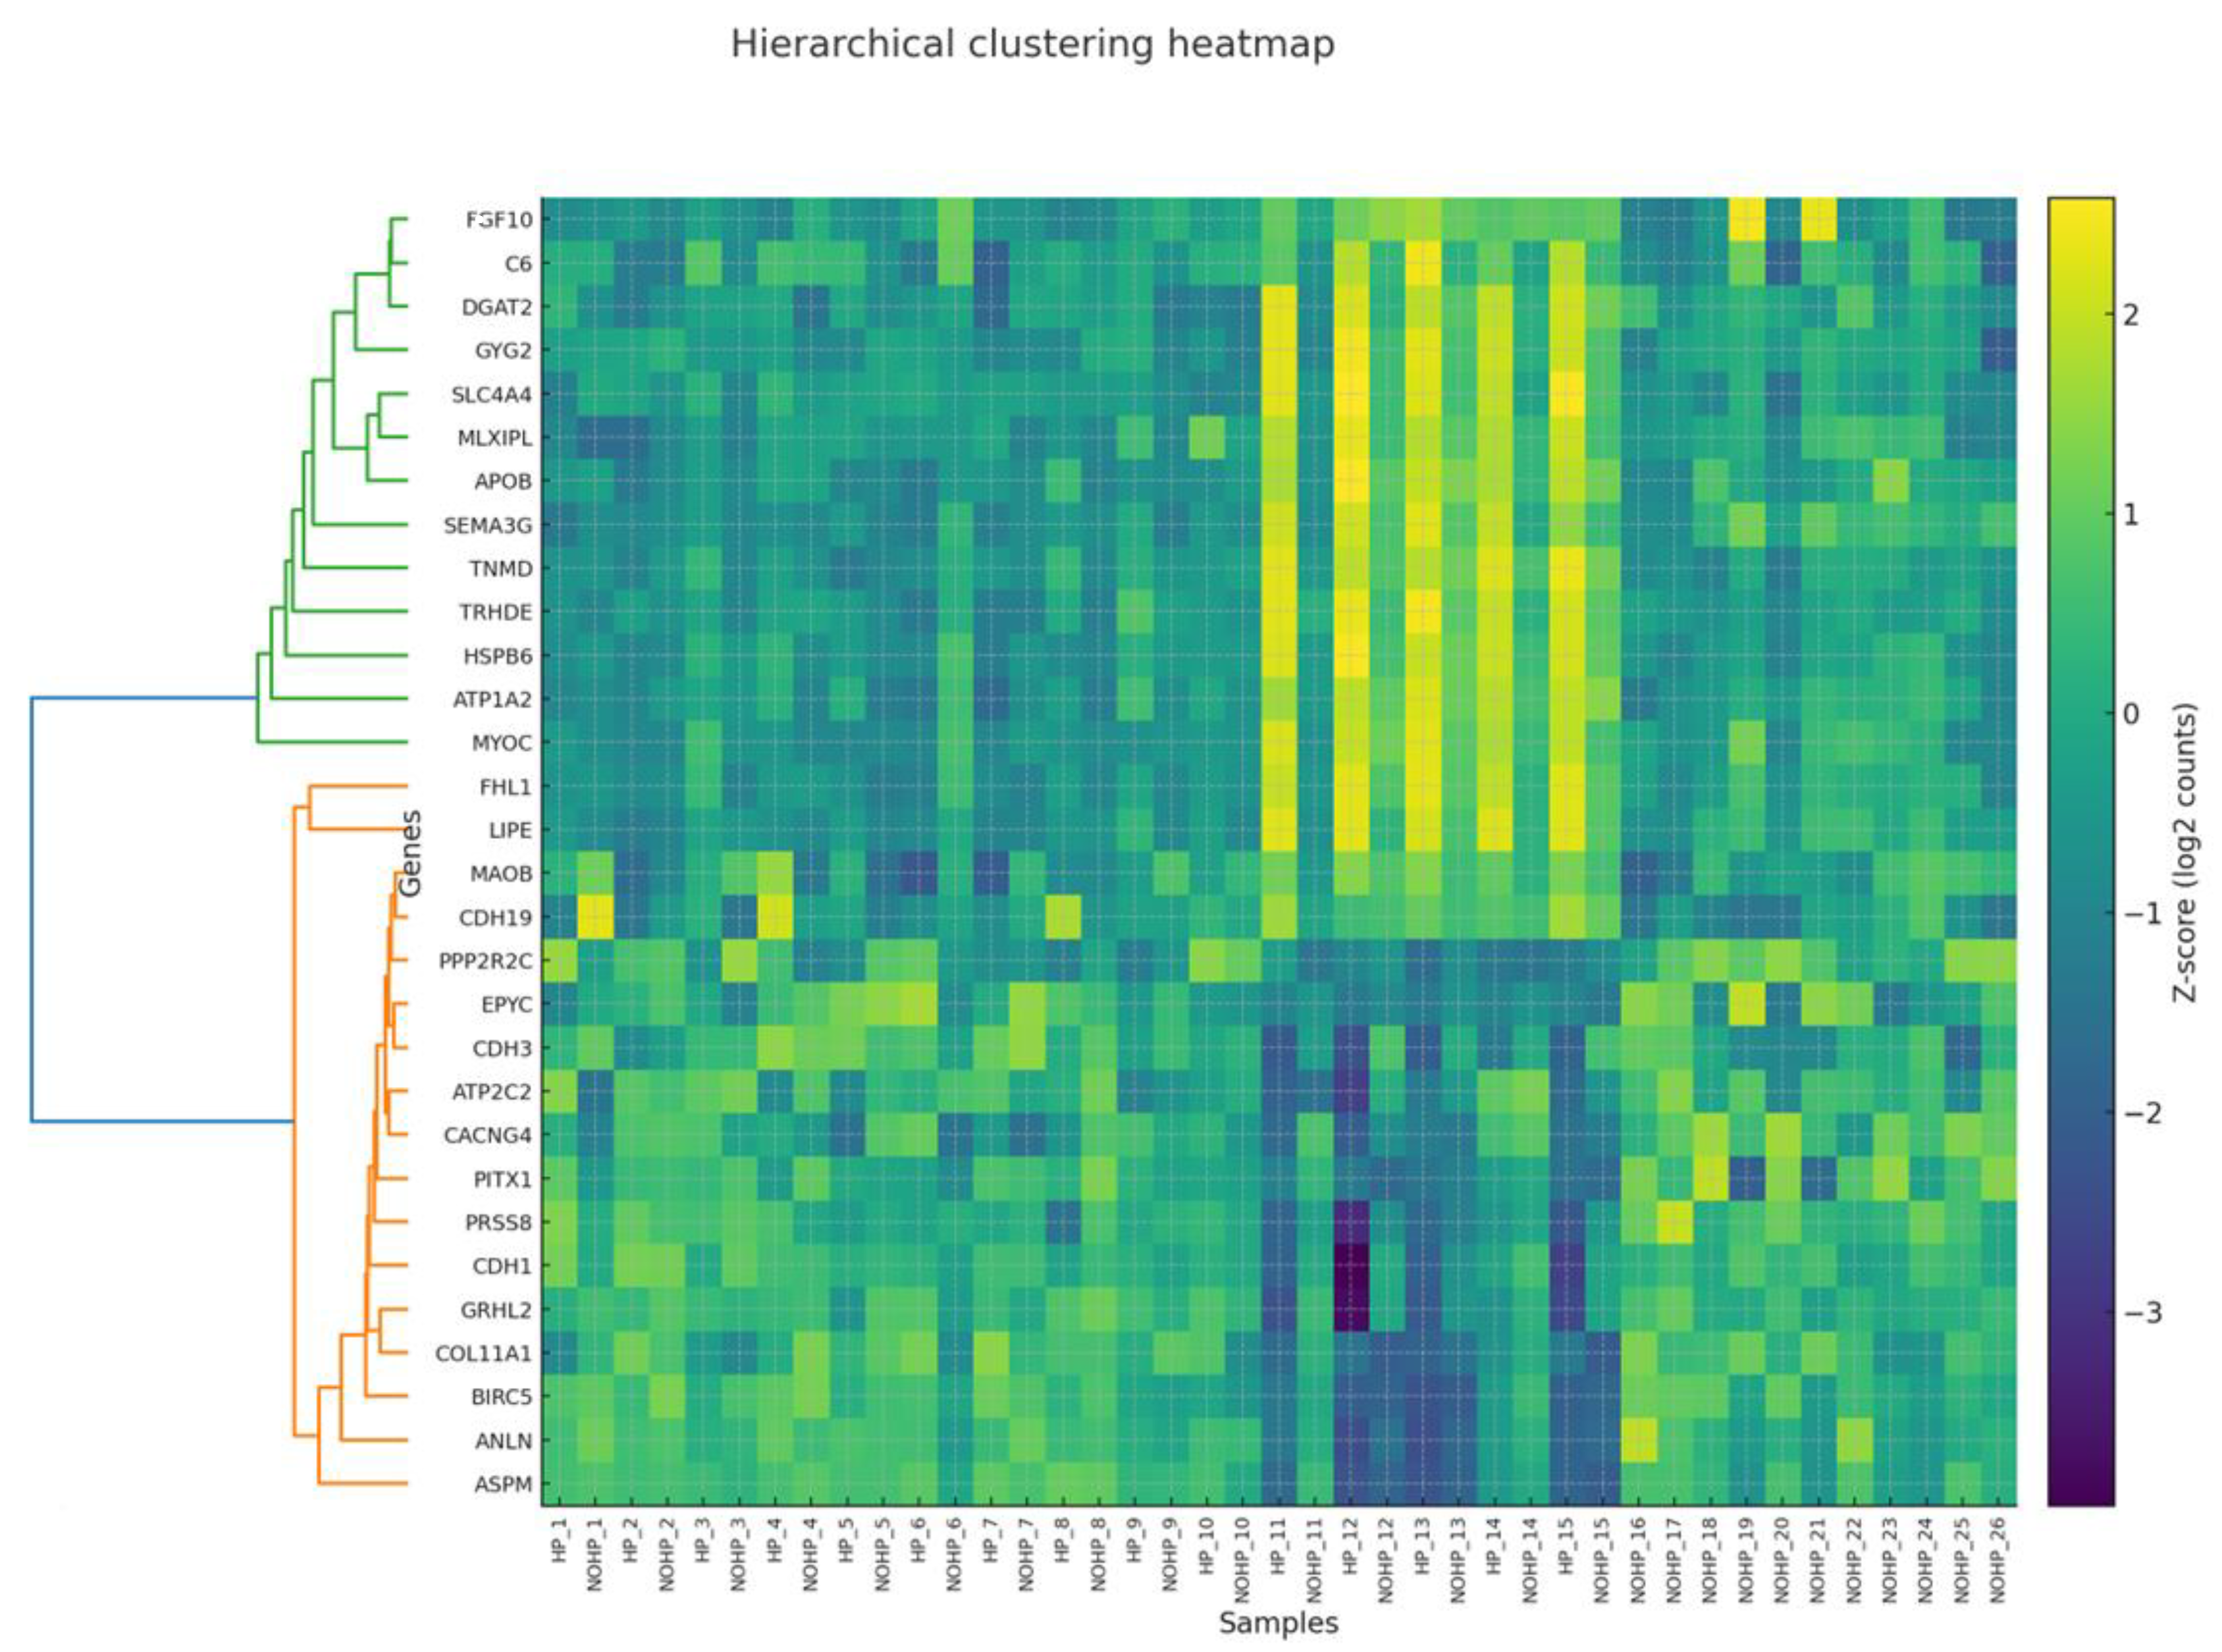
3.5. Co-Expression Modules and Hub Genes (WGCNA)

WGCNA revealed higher-order gene modules associated with tumor biology and HP treatment. Hierarchical clustering of variance-stabilized expression values identified multiple co-expressed modules, visualized in Figure 6 and Figure 7 and summarized in Table 2 and Table 3. Module–trait correlations. In the Tumor vs NAT network, the turquoise module (putative Tumor-axis) showed a strong positive association with Tumor (r = 0.85, BH-p = 1.41×10⁻¹¹), whereas the black module (putative NAT-axis) was negatively associated (r = −0.70, BH-p = 9.46×10⁻⁷). Additional modules had weaker associations (e.g., blue: r = −0.37, BH-p = 0.039). In the Tumor HP+ vs Tumor HP network, the top association with HP exposure was observed for the black module (r = −0.33, p = 0.035, BH-p = 0.118), followed by turquoise (r = 0.31, p = 0.050, BH-p = 0.118). Thus, the two principal modules defining the dual-axis model (Tumor-axis = turquoise; NAT-axis = black) are quantitatively supported in Tumor–NAT stratification, while HP effects within tumor are nominal and do not survive multiple-testing correction.
WGCNA found the presence of two hub structures with distinct characteristics. The HP-sensitive module (Hub 1; HP+ vs HP) is centered on PRKG1 and its direct effectors in cytoskeletal control (VASP, ACTA1, TNNT1) and excitation–contraction/Ca2+ handling (PLN), together with the large-conductance Ca2+-activated K+ channel complex (KCNMA1/KCNMB2/KCNMB4). This configuration shows consistency with the NO–sGC–cGMP–PKG axis, which regulates actin dynamics and cell motility via VASP phosphorylation, while BK-channel activity links ionic/mechanical cues to invasive behavior [44,45]. Peripheral connections (ABCA6, RASGRP3, BARX2) indicate their role in coupling with lipid/xenobiotic transport and Ras–ERK/PI3K signal entry points, confirming that hydroxyprogesterone (HP) can modulate and shift in parallel with the metabolic handling of lipids and stressors [46,47,48].
On the other hand, the tumor-vs- NAT module (Hub 2) encapsulates canonical epithelial breast-cancer programs: steroid signaling and chaperone dependence (ESR1, HSP90AA1) [49], integrin/tetraspanin-organized adhesion and invasion (ITGA5 with CD151/TM4SF5 neighborhood) [24], stemness and therapy tolerance (PROM1/CD133) [50], and transporter/secretome remodeling (ABCC8, PATE-family/LY6 cluster). Considering the two hubs, Hub 2 represents the baseline tumor architecture that sustains proliferation, survival, and dissemination, while Hub 1 reflects an HP-tunable cytoskeleton/ion-channel–lipid module that can modulate motility and stress adaptation.
In the case of integrating both networks together, we conclude that they support a solid and coherent model. Considering the adjacent tissue (and HP-responsive tumor contexts), HP primarily engages a cGMP–PKG–VASP/actin axis [44,45] with BK-channel and lipid-transport crosstalk [52], while at the same time, the cellular biological properties of the tumor remain under the control of ER/HSP90 signaling [49], integrin-ECM remodeling, stemness, and nutrient transport. In this context, the division of labor explains why HP exposure is most visible in motility and stress-handling nodes (Hub 1), while core endocrine and adhesion programs (Hub 2) define the tumor state. The direct readouts of this dual model and the perturbations for validation include, for example: pVASP(Ser239) and cGMP as PKG pharmacodynamic markers in HP+ samples; migration/invasion assays ± PKG or BK-channel modulators; and correlation of ITGA5/CD151, PROM1, and SLC1A5-like transporters with invasive and metabolic phenotypes [38,50,51,52].
Modules correlated with tumor status were enriched for cell cycle regulation, proteostasis, and epithelial differentiation. Modules linked to HP exposure included genes involved in oxidative stress, extracellular matrix dynamics, and Inflammatory pathways, and NF-κB is related [6]. WGCNA highlighted module-level structure rather than generic hubs, a tumor-enriched tight-junction/ECM module containing CLDN4, and an HP-enriched steroid/PPAR–lipid module containing FKBP5 [34]. TSPO and SGK1 showed contextual connections and are treated as exploratory; this pattern aligns with reports that progestins engage steroid-responsive metabolic programs with NF-κB–linked inflammatory cross-talk [30,40]. These co-expression modules highlight the systems-level impact of HP, linking stress adaptation, Inflammatory pathways, and NF-κB, which are related, and remodeling to specific hub genes that represent plausible biomarkers or regulatory nodes.

3.8. Clinical Implications and Biomarker Potential

HP primarily reprograms adjacent tissue toward a steroid/PPAR–lipid/xenobiotic response (e.g., FKBP5 ↑), whereas tumor tissue shows tight-junction/ECM remodeling (e.g., CLDN4 ↑). Practically, FKBP5 is the leading pharmacodynamic candidate for monitoring HP engagement (adjacent/peripheral compartments), CLDN4 informs tumor epithelial remodeling, which should serve as a complementary context readout (e.g., perioperative risk stratification or supportive interpretation of exposure), ideally confirmed at the protein/serum level and interpreted alongside inflammatory markers and clinical covariates.
This discovery-level study (41 libraries across Tumor HP+/HP− and NAT HP+/HP−) lacks power for interaction terms and precise effect-size estimates. Per-sample ER/PR/HER2 status and exact dose-to-resection intervals were not uniformly available, so residual confounding (e.g., PR competence, dosing/timing) cannot be excluded. We therefore treat HP-aligned findings as hypothesis-generating.

4. Conclusions

This re-analysis study supports a dual-axis model of peri-operative 17-OHPC (HP): a steroid/PPAR–lipid/xenobiotic program most evident in NAT and a tight-junction/ECM-remodeling program dominating the tumor. HP-related shifts are strong in NAT but modest in tumor, consistent with bulk heterogeneity and short pre-operative exposure. These results nominate FKBP5 (exposure readout in NAT) and CLDN4 (tumor context) for orthogonal validation. Limitations include modest sample size and incomplete subtype metadata; findings are hypothesis-generating and warrant prospective studies with per-sample PR status and dose-to-resection timing.

Supplementary Materials

The following supporting information can be downloaded at the website of this paper posted on Preprints.org.

Author Contributions

Conceptualization was led by Prof. Dr. Şükrü Tüzmen, who also contributed to the overall project vision and hypothesis formulation with Abdallah Rafi. Investigation, including data collection and experimental procedures, was carried out by Abdallah Rafi, and Prof. Dr. Osman Sezerman reviewed the study methodology and provided feedback on the bioinformatics workflow. Resources, such as materials and analysis tools, were provided by Abdallah Rafi and Prof. Dr. Osman Sezerman reviewed the bioinformatics analyses to ensure methodological accuracy and robustness. Writing—original draft preparation—was done by Abdallah Rafi, with all authors contributing to writing—review and editing—Ensuring accuracy and clarity, was done by Prof. Dr. Şükrü Tüzmen and Abdallah Rafi. Visualization, including figures and graphical representations of data, was managed by Prof. Dr. Şükrü Tüzmen. Supervision of the research team and oversight of project milestones were performed by Prof. Dr. Şükrü Tüzmen and Assoc. Prof. Dr. Fikret Dirilenoğlu. Project administration, including coordination and communication among team members, was handled by Prof. Dr. Şükrü Tüzmen.

Funding

This research received no external funding.

Institutional Review Board Statement

Not applicable.

Informed Consent Statement

Not applicable.

Author Statement

We confirm that no human subjects were recruited and no human experiments were conducted in this study. The analyses were performed exclusively on publicly available and non-identifiable human transcriptomic datasets obtained from established repositories.

Data Availability Statement

The original contributions presented in this study are included in the article. Further inquiries can be directed to the corresponding author.

Conflicts of Interest

The authors declare no conflicts of interest.

Abbreviations

The following abbreviations are used in this manuscript:
BP Biological Process (Gene Ontology)
CC Cellular Component (Gene Ontology)
DEG Differentially Expressed Gene
ER Estrogen Receptor
ER stress Endoplasmic Reticulum Stress
FC Fold Change
FDR False Discovery Rate
GO Gene Ontology
GRCh38 Genome Reference Consortium Human Build 38
GSEA Gene Set Enrichment Analysis
HP Hydroxyprogesterone
log2FC Log2 Fold Change
MF Molecular Function (Gene Ontology)
NAT Normal Adjacent Tissue
ORA Overrepresentation Analysis
PR Progesterone Receptor
QC Quality Control
RNA-seq RNA Sequencing
rRNA Ribosomal RNA
TMM Trimmed Mean of M-values
WGCNA Weighted Gene Co-expression Network Analysis

References

  1. Sha, R.; Kong, X.; Li, X.; Wang, Y. Global Burden of Breast Cancer and Attributable Risk Factors in 204 Countries and Territories, from 1990 to 2021: Results from the Global Burden of Disease Study 2021. Biomark Res 2024, 12, 87. [Google Scholar] [CrossRef]
  2. Arnold, M.; Morgan, E.; Rumgay, H.; Mafra, A.; Singh, D.; Laversanne, M.; Vignat, J.; Gralow, J.R.; Cardoso, F.; Siesling, S.; et al. Current and Future Burden of Breast Cancer: Global Statistics for 2020 and 2040. The Breast 2022, 66, 15–23. [Google Scholar] [CrossRef] [PubMed]
  3. Kim, J.; Harper, A.; McCormack, V.; Sung, H.; Houssami, N.; Morgan, E.; Mutebi, M.; Garvey, G.; Soerjomataram, I.; Fidler-Benaoudia, M.M. Global Patterns and Trends in Breast Cancer Incidence and Mortality across 185 Countries. Nat Med 2025, 31, 1154–1162. [Google Scholar] [CrossRef] [PubMed]
  4. Wilkinson, L.; Gathani, T. Understanding Breast Cancer as a Global Health Concern. The British Journal of Radiology 2022, 95, 20211033. [Google Scholar] [CrossRef] [PubMed]
  5. Freeman, J.Q.; Li, J.L.; Fisher, S.G.; Yao, K.A.; David, S.P.; Huo, D. Declination of Treatment, Racial and Ethnic Disparity, and Overall Survival in US Patients With Breast Cancer. JAMA Netw Open 2024, 7, e249449. [Google Scholar] [CrossRef]
  6. Teklemariam, A.B.; Muche, Z.T.; Agidew, M.M.; Mulu, A.T.; Zewde, E.A.; Baye, N.D.; Adugna, D.G.; Maru, L.; Ayele, T.M. Receptor Tyrosine Kinases and Steroid Hormone Receptors in Breast Cancer: Review of Recent Evidences. Metabolism Open 2024, 24, 100324. [Google Scholar] [CrossRef]
  7. Chakravorty, G.; Ahmad, S.; Godbole, M.S.; Gupta, S.; Badwe, R.A.; Dutt, A. Deciphering the Mechanisms of Action of Progesterone in Breast Cancer. Oncotarget 2023, 14, 660–667. [Google Scholar] [CrossRef]
  8. Rodrigues, I.; Fernandes, R.; Ferreira, A.; Pereira, D.; Fernandes, R.; Soares, R.; Luís, C. Is Progesterone Receptor a Neglected Feature in Breast Cancer? A Retrospective Study Analysing the Clinicopathological Characteristics of Breast Cancer Based on Progesterone Receptor Status. Clinical Breast Cancer 2025, 25, e331–e340. [Google Scholar] [CrossRef]
  9. Health Centre (Cube 34B), University of Calabria 87030 Arcavacata di Rende (CS) Italy.; Aquila, S. 17 Hydroxyprogesterone Progesterone Receptor B Signalling Disrupts the Metabolic Reprogramming in Breast Cancer Cell Lines. J Oncology 2022, 2.
  10. Fedotcheva, T.A.; Fedotcheva, N.I.; Shimanovsky, N.L. Progesterone as an Anti-Inflammatory Drug and Immunomodulator: New Aspects in Hormonal Regulation of the Inflammation. Biomolecules 2022, 12, 1299. [Google Scholar] [CrossRef]
  11. Tsimberidou, A.M.; Fountzilas, E.; Bleris, L.; Kurzrock, R. Transcriptomics and Solid Tumors: The next Frontier in Precision Cancer Medicine. Seminars in Cancer Biology 2022, 84, 50–59. [Google Scholar] [CrossRef]
  12. Van De Stolpe, A.; Verhaegh, W.; Blay, J.-Y.; Ma, C.X.; Pauwels, P.; Pegram, M.; Prenen, H.; De Ruysscher, D.; Saba, N.F.; Slovin, S.F.; et al. RNA Based Approaches to Profile Oncogenic Pathways From Low Quantity Samples to Drive Precision Oncology Strategies. Front. Genet. 2021, 11, 598118. [Google Scholar] [CrossRef]
  13. Ji, J.-H.; Ahn, S.G.; Yoo, Y.; Park, S.-Y.; Kim, J.-H.; Jeong, J.-Y.; Park, S.; Lee, I. Prediction of a Multi-Gene Assay (Oncotype DX and Mammaprint) Recurrence Risk Group Using Machine Learning in Estrogen Receptor-Positive, HER2-Negative Breast Cancer—The BRAIN Study. Cancers 2024, 16, 774. [Google Scholar] [CrossRef]
  14. Hristova, V.A.; Chan, D.W. Cancer Biomarker Discovery and Translation: Proteomics and Beyond. Expert Review of Proteomics 2019, 16, 93–103. [Google Scholar] [CrossRef]
  15. ERP135222 - SRA - NCBI. Available online: https://www.ncbi.nlm.nih.gov/sra/?term=ERP135222.
  16. PureLink RNA Mini Kit - US. Available online: https://www.thermofisher.com/us/en/home/life-science/dna-rna-purification-analysis/rna-extraction/rna-types/total-rna-extraction/purelink-rna-mini-kit.html.
  17. Home - SRA - NCBI. Available online: https://www.ncbi.nlm.nih.gov/sra.
  18. Krueger, F.; James, F.; Ewels, P.; Afyounian, E.; Schuster-Boeckler, B. FelixKrueger/TrimGalore: V0.6.7 - DOI via Zenodo 2021.
  19. Babraham Bioinformatics - FastQC A Quality Control Tool for High Throughput Sequence Data. Available online: https://www.bioinformatics.babraham.ac.uk/projects/fastqc/.
  20. Kim, D.; Paggi, J.M.; Park, C.; Bennett, C.; Salzberg, S.L. Graph-Based Genome Alignment and Genotyping with HISAT2 and HISAT-Genotype. Nat Biotechnol 2019, 37, 907–915. [Google Scholar] [CrossRef] [PubMed]
  21. Liao, Y.; Smyth, G.K.; Shi, W. featureCounts: An Efficient General Purpose Program for Assigning Sequence Reads to Genomic Features. Bioinformatics 2014, 30, 923–930. [Google Scholar] [CrossRef] [PubMed]
  22. Love, M.I.; Huber, W.; Anders, S. Moderated Estimation of Fold Change and Dispersion for RNA-Seq Data with DESeq2. Genome Biol 2014, 15, 550. [Google Scholar] [CrossRef]
  23. Robinson, M.D.; McCarthy, D.J.; Smyth, G.K. edgeR : A Bioconductor Package for Differential Expression Analysis of Digital Gene Expression Data. Bioinformatics 2010, 26, 139–140. [Google Scholar] [CrossRef]
  24. Yu, G.; Wang, L.-G.; Han, Y.; He, Q.-Y. clusterProfiler: An R Package for Comparing Biological Themes Among Gene Clusters. OMICS: A Journal of Integrative Biology 2012, 16, 284–287. [Google Scholar] [CrossRef] [PubMed]
  25. Subramanian, A.; Tamayo, P.; Mootha, V.K.; Mukherjee, S.; Ebert, B.L.; Gillette, M.A.; Paulovich, A.; Pomeroy, S.L.; Golub, T.R.; Lander, E.S.; et al. Gene Set Enrichment Analysis: A Knowledge-Based Approach for Interpreting Genome-Wide Expression Profiles. Proc. Natl. Acad. Sci. U.S.A. 2005, 102, 15545–15550. [Google Scholar] [CrossRef]
  26. Langfelder, P.; Horvath, S. WGCNA: An R Package for Weighted Correlation Network Analysis. BMC Bioinformatics 2008, 9, 559. [Google Scholar] [CrossRef]
  27. Piñero, J.; Ramírez-Anguita, J.M.; Saüch-Pitarch, J.; Ronzano, F.; Centeno, E.; Sanz, F.; Furlong, L.I. The DisGeNET Knowledge Platform for Disease Genomics: 2019 Update. Nucleic Acids Research 2019, gkz1021. [Google Scholar] [CrossRef]
  28. Uhlén, M.; Fagerberg, L.; Hallström, B.M.; Lindskog, C.; Oksvold, P.; Mardinoglu, A.; Sivertsson, Å.; Kampf, C.; Sjöstedt, E.; Asplund, A.; et al. Tissue-Based Map of the Human Proteome. Science 2015, 347, 1260419. [Google Scholar] [CrossRef]
  29. Stelzer, G.; Rosen, N.; Plaschkes, I.; Zimmerman, S.; Twik, M.; Fishilevich, S.; Stein, T.I.; Nudel, R.; Lieder, I.; Mazor, Y.; et al. The GeneCards Suite: From Gene Data Mining to Disease Genome Sequence Analyses. CP in Bioinformatics 2016, 54. [Google Scholar] [CrossRef]
  30. Chatterjee, S.; Chaubal, R.; Maitra, A.; Gardi, N.; Dutt, A.; Gupta, S.; Badwe, R.A.; Majumder, P.P.; Pandey, P. Pre-Operative Progesterone Benefits Operable Breast Cancer Patients by Modulating Surgical Stress. Breast Cancer Res Treat 2018, 170, 431–438. [Google Scholar] [CrossRef]
  31. Kovalchuk, A.; Ilnytskyy, Y.; Rodriguez-Juarez, R.; Katz, A.; Sidransky, D.; Kolb, B.; Kovalchuk, O. Growth of Triple Negative and Progesterone Positive Breast Cancer Causes Oxidative Stress and Down-Regulates Neuroprotective Transcription Factor NPAS4 and NPAS4-Regulated Genes in Hippocampal Tissues of TumorGraft Mice—an Aging Connection. Front. Genet. 2018, 9, 58. [Google Scholar] [CrossRef] [PubMed]
  32. González-Espinoza, A.; Zamora-Fuentes, J.; Hernández-Lemus, E.; Espinal-Enríquez, J. Gene Co-Expression in Breast Cancer: A Matter of Distance. Front. Oncol. 2021, 11, 726493. [Google Scholar] [CrossRef]
  33. Yadav, N.; Sunder, R.; Desai, S.; Dharavath, B.; Chandrani, P.; Godbole, M.; Dutt, A. Progesterone Modulates the DSCAM-AS1/miR-130a/ESR1 Axis to Suppress Cell Invasion and Migration in Breast Cancer. Breast Cancer Res 2022, 24, 97. [Google Scholar] [CrossRef] [PubMed]
  34. Winkler, J.; Abisoye-Ogunniyan, A.; Metcalf, K.J.; Werb, Z. Concepts of Extracellular Matrix Remodelling in Tumour Progression and Metastasis. Nat Commun 2020, 11, 5120. [Google Scholar] [CrossRef] [PubMed]
  35. Barabási, A.-L.; Gulbahce, N.; Loscalzo, J. Network Medicine: A Network-Based Approach to Human Disease. Nat Rev Genet 2011, 12, 56–68. [Google Scholar] [CrossRef]
  36. Wochnik, G.M.; Rüegg, J.; Abel, G.A.; Schmidt, U.; Holsboer, F.; Rein, T. FK506-Binding Proteins 51 and 52 Differentially Regulate Dynein Interaction and Nuclear Translocation of the Glucocorticoid Receptor in Mammalian Cells. Journal of Biological Chemistry 2005, 280, 4609–4616. [Google Scholar] [CrossRef] [PubMed]
  37. Murakami-Nishimagi, Y.; Sugimoto, K.; Kobayashi, M.; Tachibana, K.; Kojima, M.; Okano, M.; Hashimoto, Y.; Saji, S.; Ohtake, T.; Chiba, H. Claudin-4-Adhesion Signaling Drives Breast Cancer Metabolism and Progression via Liver X Receptor β. Breast Cancer Res 2023, 25, 41. [Google Scholar] [CrossRef]
  38. Hemler, M.E. Tetraspanin Proteins Promote Multiple Cancer Stages. Nat Rev Cancer 2014, 14, 49–60. [Google Scholar] [CrossRef]
  39. Selvaraj, V.; Stocco, D.M.; Tu, L.N. Minireview: Translocator Protein (TSPO) and Steroidogenesis: A Reappraisal. Molecular Endocrinology 2015, 29, 490–501. [Google Scholar] [CrossRef]
  40. Papadopoulos, V.; Fan, J.; Zirkin, B. Translocator Protein (18 kDa): An Update on Its Function in Steroidogenesis. J Neuroendocrinology 2018, 30, e12500. [Google Scholar] [CrossRef]
  41. Günzel, D.; Yu, A.S.L. Claudins and the Modulation of Tight Junction Permeability. Physiological Reviews 2013, 93, 525–569. [Google Scholar] [CrossRef]
  42. Kahle, K.T.; MacGregor, G.G.; Wilson, F.H.; Van Hoek, A.N.; Brown, D.; Ardito, T.; Kashgarian, M.; Giebisch, G.; Hebert, S.C.; Boulpaep, E.L.; et al. Paracellular Cl- Permeability Is Regulated by WNK4 Kinase: Insight into Normal Physiology and Hypertension. Proc. Natl. Acad. Sci. U.S.A. 2004, 101, 14877–14882. [Google Scholar] [CrossRef] [PubMed]
  43. Lashhab, R.; Essuman, G.; Chavez-Canales, M.; Alexander, R.T.; Cordat, E. Expression of the Kidney Anion Exchanger 1 Affects WNK4 and SPAK Phosphorylation and Results in Claudin-4 Phosphorylation. Heliyon 2023, 9, e22280. [Google Scholar] [CrossRef] [PubMed]
  44. Tao, Y.; Gu, Y.-J.; Cao, Z.-H.; Bian, X.-J.; Lan, T.; Sang, J.-R.; Jiang, L.; Wang, Y.; Qian, H.; Chen, Y.-C. Endogenous cGMP-Dependent Protein Kinase Reverses EGF-Induced MAPK/ERK Signal Transduction through Phosphorylation of VASP at Ser239. Oncology Letters 2012, 4, 1104–1108. [Google Scholar] [CrossRef]
  45. Zuzga, D.S.; Pelta-Heller, J.; Li, P.; Bombonati, A.; Waldman, S.A.; Pitari, G.M. Phosphorylation of Vasodilator-stimulated Phosphoprotein Ser239 Suppresses Filopodia and Invadopodia in Colon Cancer. Intl Journal of Cancer 2012, 130, 2539–2548. [Google Scholar] [CrossRef] [PubMed]
  46. Gai, J.; Ji, M.; Shi, C.; Li, W.; Chen, S.; Wang, Y.; Li, H. FoxO Regulates Expression of ABCA6, an Intracellular ATP-Binding-Cassette Transporter Responsive to Cholesterol. The International Journal of Biochemistry & Cell Biology 2013, 45, 2651–2659. [Google Scholar] [CrossRef]
  47. Nagy, Z.; Kovács, I.; Török, M.; Tóth, D.; Vereb, G.; Buzás, K.; Juhász, I.; Blumberg, P.M.; Bíró, T.; Czifra, G. Function of RasGRP3 in the Formation and Progression of Human Breast Cancer. Mol Cancer 2014, 13, 96. [Google Scholar] [CrossRef]
  48. Yang, D.; Tao, J.; Li, L.; Kedei, N.; Tóth, Z.E.; Czap, A.; Velasquez, J.F.; Mihova, D.; Michalowski, A.M.; Yuspa, S.H.; et al. RasGRP3, a Ras Activator, Contributes to Signaling and the Tumorigenic Phenotype in Human Melanoma. Oncogene 2011, 30, 4590–4600. [Google Scholar] [CrossRef] [PubMed]
  49. Trepel, J.; Mollapour, M.; Giaccone, G.; Neckers, L. Targeting the Dynamic HSP90 Complex in Cancer. Nat Rev Cancer 2010, 10, 537–549. [Google Scholar] [CrossRef]
  50. Al-Hajj, M.; Wicha, M.S.; Benito-Hernandez, A.; Morrison, S.J.; Clarke, M.F. Prospective Identification of Tumorigenic Breast Cancer Cells. Proc. Natl. Acad. Sci. U.S.A. 2003, 100, 3983–3988. [Google Scholar] [CrossRef]
  51. Ge, L.; Hoa, N.T.; Wilson, Z.; Arismendi-Morillo, G.; Kong, X.-T.; Tajhya, R.B.; Beeton, C.; Jadus, M.R. Big Potassium (BK) Ion Channels in Biology, Disease and Possible Targets for Cancer Immunotherapy. International Immunopharmacology 2014, 22, 427–443. [Google Scholar] [CrossRef]
  52. Cormerais, Y.; Massard, P.A.; Vucetic, M.; Giuliano, S.; Tambutté, E.; Durivault, J.; Vial, V.; Endou, H.; Wempe, M.F.; Parks, S.K.; et al. The Glutamine Transporter ASCT2 (SLC1A5) Promotes Tumor Growth Independently of the Amino Acid Transporter LAT1 (SLC7A5). Journal of Biological Chemistry 2018, 293, 2877–2887. [Google Scholar] [CrossRef] [PubMed]
Figure 2. Integrated workflow combining transcriptome profiling, differential expression, functional enrichment, and network analysis. Credit: Sketched by the author in Samsung Notes; redrawn in Microsoft Word and vector-cleaned with ChatGPT (OpenAI) from the original author sketch.
Preprints 188908 g002
Figure 3. Heatmap of the top 30 most variable genes across tumor and NAT.
Preprints 188908 g003
Figure 4. (a) All samples. Tissue drives the major axis (PC1 = 25.5%; PC2 = 13.3%). HP’s contribution was quantified on PC2 within tissue: in NAT, HP vs HP- showed a significant shift; in tumor, the shift was not significant. (b) Tumor only. Tumor samples colored by HP status show substantial overlap (panel-specific variance: PC1 = 19.4%, PC2 = 10.4%). (c) NAT only. NAT samples colored by HP status show clear separation (panel-specific variance: PC1 = 63.3%, PC2 = 20.0%). Consistent with panel a, the HP shift within NAT is significant. HP = hydroxyprogesterone; Adjacent HP = NAT from HP-treated patients; Adjacent HP = NAT from untreated patients; Tumor HP = tumor tissue from HP-treated patients; Tumor HP = tumor tissue from untreated patients.
Preprints 188908 g004
Figure 5. (a) Volcano plot comparing tumor and NAT samples. The x-axis represents log2 fold change, and the y-axis represents –log10 adjusted p-value; (b) Volcano plot showing differential expression between hydroxyprogesterone-treated and untreated tumor samples; (c) Volcano plot illustrating differential expression in NAT with and without hydroxyprogesterone treatment.
Preprints 188908 g005
Figure 6. Gene dendrogram and module colors for the Tumor vs NAT comparison.
Preprints 188908 g006
Figure 7. Gene dendrogram and module colors for the HP+ vs HP− comparison.
Preprints 188908 g007
Table 1. Sample grouping details.
Group Tissue type HP exposure Sample count
NAT HP− NAT Not exposed 5
NAT HP+ NAT Exposed 5
Tumor HP− Tumor Not exposed 13
Tumor HP+ Tumor Exposed 18
Table 2. WGCNA module summary for tumor vs NAT.
Module color Gene count Example hub gene
Black 14 MAGEA11
Blue 201 PAX6
Brown 96 ABCC8
Cyan 24 C1orf106
Green 43 ITGA5
Grey 70 PATE3
Red 78 PROM1
Turquoise 258 HSP90AA1
Yellow 82 ESR1
Table 3. WGCNA module summary for HP+ vs HP.
Module color Gene count Example hub gene
Black 57 BARX2
Blue 187 ACTA1
Brown 101 RASGRP3
Cyan 21 ABCA6
Green 47 PRKG1
Grey 72 SH2D6
Red 78 PROM1
Turquoise 251 KIF5B
Yellow 84 SLC1A5
Disclaimer/Publisher’s Note: The statements, opinions and data contained in all publications are solely those of the individual author(s) and contributor(s) and not of MDPI and/or the editor(s). MDPI and/or the editor(s) disclaim responsibility for any injury to people or property resulting from any ideas, methods, instructions or products referred to in the content.
Copyright: This open access article is published under a Creative Commons CC BY 4.0 license, which permit the free download, distribution, and reuse, provided that the author and preprint are cited in any reuse.
Prerpints.org logo

Preprints.org is a free preprint server supported by MDPI in Basel, Switzerland.

Subscribe

Disclaimer

Terms of Use

Privacy Policy

Privacy Settings

© 2026 MDPI (Basel, Switzerland) unless otherwise stated