
Submitted:
15 July 2023
Posted:
18 July 2023
You are already at the latest version
Abstract
Bromodomain (BRD)-containing proteins are involved in many biological processes, most notably epigenetic regulation of transcription, and BRD protein dysfunction has been linked to many diseases, including tumorigenesis. However, the role of BRD proteins in the pathogenesis of uterine fibroids (UFs) is entirely unknown. The present study aimed to determine the expression pattern of BRD9 protein in UFs and matching myometrium and further assess the impact of BRD9 inhibitors on UF phenotype and epigenetic/epitranscriptomic changes. Our studies demonstrated that the levels of BRD9 were significantly upregulated in UFs compared to matched myometrium, suggesting that the aberrant BRD protein expression may contribute to the pathogenesis of UFs. We then evaluated the potential roles of BRD9 using its specific inhibitor I-BRD9. Targeted inhibition of BRD9 suppressed the UF tumorigenesis with increased apoptosis and cell cycle arrest, decreased cell proliferation, and extracellular matrix deposition in UF cells. The latter is the key hallmark of UFs. Unbiased transcriptomic profiling coupled with downstream bioinformatics analysis further and extensively demonstrated that targeted inhibition of BRD9 impacted the cell cycle- and ECM-related biological pathways, reprogrammed the UF cell epigenome and epitranscriptome, and altered miRNA-mediated gene regulation in UFs. Taken together, our data support the critical role of BRD9 in UF cells and the strong interconnection between BRD9 and other pathways controlling the UF progression. Targeted inhibition of BRD proteins might provide a non-hormonal treatment option for this most common benign tumor in women of reproductive age.
Keywords:
Uterine fibroids
; BRD9 inhibitors
; Cell proliferation
; Extracellular Matrix
; Transcriptome
; Epigenome
; m6A regulators
; Epitranscriptome
1. Introduction
Uterine Fibroids (UFs) are the most common benign tumor in women of reproductive age. UFs are heterogeneous in composition, size, and number among individual women and within the same individual. UFs occur in ~77% of women overall and are clinically manifest in ~25% by age 45 [1,2,3]. Although benign, these tumors are nonetheless associated with significant morbidity; they are the primary indicator of hysterectomy, and a major source of gynecologic and reproductive dysfunction, ranging from menorrhagia and pelvic pain to infertility, recurrent miscarriage, and pre-term labor [4]. Accordingly, the annual US healthcare costs associated with UFs have been estimated at ~$34 billion. Uterine fibroids thus represent significant societal health and financial burden.
A significant body of foundational data supports a key role in epigenetic dysregulation of gene expression in tumorigenesis. In UFs, several studies have implicated dysregulation of epigenetic modifications, including alterations in DNA methylation, histone modification, and non-coding RNAs in the pathogenesis of UFs [5,6]. Notably, as the “readers” of lysine acetylation, Bromodomains (BRD)-containing proteins are responsible for transducing regulatory signals from acetylated lysine residues into various biological phenotypes. BRD proteins can have a wide variety of functions via multiple gene regulatory mechanisms [7,8,9,10,11,12,13,14]. The four members of the Bromodomain and Extra Terminal (BET) Proteins including BRD2, BRD3, BRD4, and BRDT, share a common domain consisting of two N-terminal bromodomains, that bind to acetylated lysine residues on histones. In addition, the role and function of non-BET BRD proteins have been identified [15,16]. These readers provide scaffolds to attract components of the transcriptional machinery to histone acetylation marks [17].
Epigenetic-targeted therapy has been applied in the treatment of various diseases, including tumorigenesis. Therefore, the development and use of small chemical inhibitors are fundamental and critical to the preclinical evaluation of BRD proteins as targets. Recent studies demonstrated that pharmacological inhibition of BET and non-BET BRD proteins results in the repression of downstream gene expression, thereby modulating various physiological conditions [18,19]. However, the role and mechanism of BRDs in the pathogenesis of UFs are entirely unknown. Recently, studies on non-BET protein BRD9 have attracted more attention from researchers due to its functional role in tumorigenesis. Accordingly, the present study aimed to determine whether and how non-BET BRD9 protein contributes to abnormal UF growth, with important implications for developing novel treatment options for this most common type of reproductive tumor.
2. Materials and methods
2.1. Sample collection and experimental design
The study was approved by the University of Chicago’s Institutional Review Board (IRB 20-1414). Fibroid tissues were consistently collected from peripheral parts of large intramural fibroid lesions (>5 cm in diameter) with care to avoid areas of apparent necrosis, bleeding, or degeneration. Myometrium tissues were collected at least 2 cm away from the closest fibroid lesion. Patients underwent the informed consent process and documented informed consent forms were collected and stored. Only those records that indicated that the patient had not used any hormonal treatment for at least three months prior to the surgery date were included. These fibroids have a white, pear-shaped appearance.
Experimental design and bioinformatics analyses are shown in Figure S1.
2.2. Cells and Reagents
The immortalized human uterine fibroid (UF) cell line (HuLM) and immortalized human uterine smooth muscle (UTSM) cells were generous gifts from Dr. Darlene Dixon. The cells were cultured and maintained in phenol red-free, 10% fetal bovine serum Dulbecco’s Modified Eagle Medium: Nutrient Mixture F-12. In addition, BRD9 inhibitor, I-BRD9, was purchased from Selleck Chemical (Cat# S7835, Houston TX, USA). The range of doses tested was 1-25 µM.
2.3. Protein extraction and Western Blot analysis
Cells were collected and lysed in RIPA lysis buffer with protease and phosphatase inhibitor cocktail (Thermo Scientific, Waltham, MA). The protein lysates from UF and adjacent myometrial tissues were prepared as described previously [20]. The protein was quantified using the Bradford method (Bio-Rad Protein Assay kit). The information about primary antibodies, including antibody dilution and source of antibodies, is listed in Table 1. The antigen-antibody complex was detected with Trident Femto Western HRP substrate (GeneTex, Irvine, CA). Specific protein bands were visualized using ChemiDoc XRS þ molecular imager (Bio-Rad, Hercules, CA). Band signals were quantified using the NIH ImageJ software (version 1.52r, U. S. National Institutes of Health, Bethesda, Maryland, USA).
2.4. Proliferation assay
Cell proliferation was measured using a trypan blue exclusion assay. Cells were seeded into 12-well tissue culture plates and treated with the BRD9 inhibitor (I-BRD9) at a dose range of 1-25 µM for 48 hr. An equal amount of DMSO was used as vehicle control. After treatment, the cells were trypsinized and collected by centrifuge. The cells were resuspended in a serum-free medium. An equal volume of 0.4% trypan blue and cell suspension was mixed and applied to a hemacytometer for cell counting. Viable cells were unstained. This assay was performed three times in triplicate.
2.6. Measurement of Cell Cycle Phase Distribution
Cell cycle distribution was determined by flow cytometric analysis as described previously [21]. Briefly, UF cells were cultured in DMEM/F12 medium containing 5 µM of I-BRD9 for 24h. Control cells were cultured in a medium containing an equal amount of DMSO. Cells were then washed with PBS, fixed in 70% ethanol, and hypotonically lysed in 1 ml of DNA staining solution [0.05 mg/ml PI (Sigma) and 0.1%Triton X-100]. Cells were acquired at 12 µl/min on a LSRFortessa (Special Order Research Product, BD Biosciences) running DIVA v.8.0.2. Propidium iodide was excited by a 50mw 561 laser and the signal was collected through a 585/15 bandpass filter. Cell cycle analysis was performed using the Watson model included within FlowJo v10.8.1.
2.7. RNA-sequencing
To determine the mechanism underlying the inhibitory effect of BRD9 inhibition on the UFs, the HuLM cells were treated with BRD9 inhibitor I-BRD9 (5 µM, n=4), and DMSO vehicle control (n=4) for 48 hr. RNA was isolated using Trizol. RNA quality and quantity were assessed using the Agilent bio-analyzer. Strand-specific RNA-SEQ libraries were prepared using a TruSEQ total RNA-SEQ library protocol (Illumina provided). Library quality and quantity were assessed using the Agilent bio-analyzer and libraries were sequenced using an Illumina NovaSEQ6000 (illumine provided reagents and protocols).
2.8. Transcriptome Profiles Analysis
2.8.1. Transcriptome Data Analysis
The classical alignment-based mapper STAR, version 2.6.1d (GitHub, Inc., San Francisco, CA, USA) (23) was used to map sequencing reads to a human reference transcriptome. The results of STAR mapping were quantified by Salmon, version 1.4.0. Then, Bioconductor (https://bioconductor.org/packages/release/bioc/html/tximport.html, accessed on October 27, 2021) was used to read Salmon outputs into the R environment. Annotation data from Gencode V34 was used to summarize data from transcript-level to gene-level. A variety of R packages was used for this analysis. All graphics and data wrangling were handled using the tidyverse suite of packages. All packages used are available from the Comprehensive R Archive Network (CRAN), Bioconductor.org, or Github.
2.8.2. Differential gene expression analysis
To identify the differentially expressed genes (DEGs) between treatment and control groups, we selected three different methods: DESeq2 [22], edgeR [23], and Limma + voom [24]. For these three methods, we used a cutoff −1.5 > fold-change > 1.5 and a p-value of 0.05. In addition, Benjamini and Hochberg’s (BH) method was performed to control the false discovery rate of all the genes with an adjusted P-value less than 0.05.
2.8.3. Pathway Analysis of DEGs
We used GSEA Desktop Application v4.3.2 to perform gene set enrichment analysis (GSEA). We chose Hallmark and C2 curated gene sets from MSigDB to compare the impaired pathways between I-BRD9 and DMSO. A total of 1000 permutations were performed using gene-sets and the pathways with an FDR-P value ≤ 0.05 were chosen as significantly enriched.
2.8.4. Functional and Regulatory Enrichment Analysis
Comprehensive gene list enrichment analysis for regulation machinery was carried out using the EnrichR [25] package in R. We used ENCODE Histone Modifications 2015 for histone modification enrichment and TargetScan microRNA for microRNAs enrichment in EnrichR to determine the mechanisms underlying the regulation of DEGs.
2.9. RNA extraction and quantitative real-time polymerase chain reaction (qRT-PCR)
Total RNA was isolated using Trizol reagent (Invitrogen, California USA). The concentration of total RNA was determined using NanoDrop (Thermo Scientific, Waltham, MA). One microgram of total RNA from each sample was reverse transcribed to complementary DNA (cDNA) using the High-Capacity cDNA Transcription Kit (Thermo Scientific, Waltham, MA).
Quantitative Real-time PCR was performed to determine the mRNA expression of genes as described previously [26]. Primers were purchased from Integrated DNA Technologies (IDT, Coralville, Iowa) with primer sequences shown in Table 2. An equal amount of cDNA from each sample was added to the Master mix containing appropriate primer sets and SYBR green supermix (Bio-Rad) in a 20 µl reaction volume. All samples were analyzed in triplicates. Real-time PCR analyses were performed using a Bio-Rad CFX96. Cycling conditions including denaturation at 95˚C for 2 min. followed by 40 cycles of 95˚C for 5s and 60˚C for 30s then 65˚C for 5s. The synthesis of a DNA product of the expected size was confirmed by melting curve analysis. 18S ribosomal RNA values (internal control) were used to normalize the expression data and normalized values were used to create data graphs. Negative control has been performed by running the reaction without cDNA.
2.10. Statistical analysis
All experiments were conducted with at least three biological replicates. A comparison of 2 groups was carried out using the student t-test for parametric distribution and Mann Whitney test for nonparametric distribution. Comparison of multiple groups was carried out by analysis of variance (ANOVA) followed by a post-test using Tukey for parametric distribution and Kruskal-Wallis test followed by a post-test Dunns for nonparametric distribution, using GraphPad Prism 9 Software. Data were presented as mean ± standard error (SE). In figures, *, **, ***, and **** indicate, p < 0.05, <0.01, <0.001, and <0.0001, respectively.
3. Results
3.1. The level of BRD9 protein is aberrantly upregulated in uterine fibroids
We first measured the levels of BRD9 protein in human UFs (n=21, UFs from 7 patients) and matched myometrial tissues (n=7) . The uterus from each individual case (case 1-7) contain multiple UFs. As shown in Figure 1A,B, among 21 UFs analyzed, 81% (17/21, p<0.01) exhibited the upregulation of BRD9 compared to matched myometrium. The BRD9 levels exhibited differences between UFs from the same uterus. For example, the expression levels of BRD9 in UF#2 are much higher than UF#1 for case 1. Similar findings can be observed for case 2 and case 3, suggesting the heterogenous characteristic of UFs regarding the BRD9 expression. In addition, the expression of BRD9 showed a marked upregulation in the UF cell line (HuLM) compared to the myometrial cell line (UTSM) (Figure 1C,D), suggesting the aberrant BRD protein expression may contribute to the pathogenesis of UFs (p<0.0001).
3.2. Inhibition of BRD9 showed decreased cell proliferation and anti-fibrotic characteristics in uterine fibroid cells
To validate the anti-proliferative effect of BRD9 inhibitors on UF cell proliferation, we selected IBRD9 ( the potent BRD9 inhibitor) in our in vitro cell model to assess its effect on UF cell growth. The trypan blue exclusion assay was performed in HuLM cell line treated with the dose ranges from 1–25 µM. Treatment with BRD9 inhibitor (I-BRD9) for 48 h showed a dose-dependent inhibitory effect on the proliferation of UF cells (Figure 2A). In addition, we measured PCNA levels in response to I-BRD9 treatment within a concentration range of 1 - 25 µM in HuLM cells. As shown in Figures 2B (up panel), I-BRD9 treatment decreased PCNA levels in a dose-dependent manner, further demonstrating the anti-proliferative effect of BRD9 inhibition. Next, to determine if the BRD9 inhibitor exerts an anti-fibrotic effect via decreasing extracellular matrix (ECM) protein levels, we measured fibronectin (FN) levels in the presence or absence of I-BRD9. Compared to vehicle control, IBRD9 induced a dose-dependent decrease in FN protein levels (Figures 2B, lower panel)
3.3. Inhibition of BRD9 induced apoptosis, necrosis, and cell cycle arrest in uterine fibroid cells
I-BRD9 treatment resulted in the increased accumulation of cells in the G1 phase and a corresponding decrease in the S phase, indicating the blockade of G1 progression (Figure 2C). The percentage of cells in the G1 phase was increased significantly from 51.5% to 59.0% in response to 5 µM I-BRD9 treatment. Accordingly, the percentage of cells in the S phase significantly decreased from 19.9% to 15.8% in response to I-BRD9 treatment. These results are consistent with the observation that I-BRD9 suppressed cell proliferation, concomitantly with a decrease in the levels of PCNA in HuLM cells.
Moreover, we evaluated the effect of BRD9 inhibitors on apoptosis and necrosis in HuLM cells. As shown in Figures S2A,B, the percentage of cells undergoing early apoptotic cell death increased from 0.9% in the control cells to 1.4% and 1.7% in HuLM cells following 24 h treatment with 1 and 5 µM I-BRD9, respectively. In addition, I-BRD9 exhibited an increase in late apoptosis from 3.7% in the control cells to 6% and 7% in 1 and 5 µM of I-BRD9 treatment, respectively. In addition, the percentage of cells undergoing necrosis increased from 2% in the control cells to 2.5% and 7.1% in HuLM cells after 24 h treatment with 1 and 5 µM of I-BRD9 treatments, respectively (Figure S2).
3.4. BRD9 inhibition causes extensive changes in the UF cell transcriptome
3.4.1. Differentially expressed genes upon I-BRD9 Treatment
To further investigate the mechanistic basis for the inhibitory action of I-BRD9 in UF cells, RNA-sequencing analysis was performed in control (n=4) and I-BRD9 (n=4) treated HuLM cells. Three different programs, including DESeq2, EdgeR, and limma, were used to characterize the differentially expressed genes (DEGs) for the RNA-seq data set. As there are marked differences between the different algorithms, we obtained three sets of DEGs with considerable variability. In this regard, we used the intersection of three sets representing a conservative estimate of DEGs for downstream analysis. As shown in Figure 3A, the I-BRD9 treatment yielded 2179 DEGs (1056 down, 1123 up). Heatmap analysis demonstrated a distinct expression pattern in HuLM cells treated with I-BRD9 (Figure 3B) compared to the control group. Volcano plot analysis revealed the distribution of changes in response to I-BRD9 (Figure 3C).
3.4.2. Enrichment pathway analysis
We then investigated the DEGs between control and I-BRD9 groups. Reactome analysis revealed that genes downregulated by I-BRD9 treatment were enriched for pathways, including DNA synthesis/replication, cell cycle progression (S phase, G1/S transition, cell cycle checkpoints)(Figure 3D, left panel). The analysis also demonstrated that genes commonly upregulated by I-BRD9 treatment were enriched for Hallmark pathways, including activation of Matrix metalloproteinases, degradation of the extracellular matrix, and extracellular matrix organization, which are the hallmarks for uterine fibroid disease (Figure 3D, right panel).
To further determine the molecular mechanism underlying IBRD9-induced cell cycle arrest. We compared the expression of cell cycle and apoptosis-related genes between control and I-BRD9-treated HuLM cells. RNA-seq analysis demonstrated that cell cycle and apoptosis-related gene expression levels, including CCND1, CDK2, CDK3, CCND3, CCND6, PCNA, and Bcl2 were downregulated in response to I-BRD9 treatment (Figure 4), while the expression levels of genes encoding cyclin-dependent kinase inhibitors, including CDKN1B and CDKN1C, were significantly upregulated by BRD9 inhibition (Figure 4). We have validated the RNA expression of several cell cycle-related genes, including CDK2, CCND1, CCND3, and PCNA by real-time PCR. The results were consistent with RNA-seq data (Figure S3A).
Several studies have demonstrated that abnormal ECM accumulation and remodeling are critical for UFs [27,28,29,30]. The excessive ECM deposition and production can contribute to mechanotransduction, therefore regulating downstream signaling leading to the pathogenesis of UFs [31,32,33]. With Reactome analysis, we demonstrated that I-BRD9 could activate matrix metalloproteinases, degrade the ECM, and alter the ECM organization as shown in Figure 5. RNA-seq analysis demonstrated that gene expression levels of members of metzincin superfamily- matrix metalloproteinases, including MMP2, MMP11, MMP15, MMP16, MMP17 and MMP24 were upregulated in response to I-BRD9 treatment; while the expression levels of genes encoding collagen type XIII alpha 1 chain (Col13A1), collagen type XVI alpha 1 chain (Col16A1) and collagen type XVII alpha 1 chain (Col17A1) were downregulated by targeted inhibition of BRD9 (Figure 5). We validated the expression of several ECM-related genes by qPCR. The results are consistent with RNA-seq data as shown in Figure S3B.
3.4.3. Inhibition of BRD9 altered the gene expression correlating to epigenetic modifications
To investigate the relation between I-BRD9-induced DEGs and epigenome alterations in UF cells, we performed enrichment analysis of epigenetic histone markers using the Enrichr web server. As shown in Figure 6, up-DEGs between control and I-BRD9-treated HuLM cells were associated with H4K27me3 and H3K9me3, among others. Genes repressed by I-BRD9 were correlated with H3K27me3, and H3K4me3 (Figure 12). These studies indicate that inhibition of BRD9 may reshape the UF chromatin to a favorable state.
We performed targeted gene analysis using our RNA-seq data and found that the RNA expression of several epigenetic genes was altered in response to I-BRD9 treatment. These altered genes included EZH2, SUV39H1, SUV39 H2, DNMT1, DMMT3B, and SIRT2 (Figure 7). These analyses suggest that I-BRD9 treatment may alter the transcriptome via multiple epigenetic mechanisms.
3.4.4. Inhibition of BRD9 altered gene expression associated with miRNA regulation
We used TargetScan microRNA analysis in Enrichr to investigate possible miRNA-dependent mechanisms underlying I-BRD9- induced DEGs in HuLM cells. As shown in Figures S4A,B, the DEGs caused by I-BRD9 treatment correlated with the regulation of multiple miRNAs, suggesting the potential interaction between miRNAs and mRNA in response to I-BRD9 treatment.
3.4.5. Inhibition of BRD9 altered the levels of m6A regulators in UF cells
RNA modification impacts gene expression and N6-methyladenosine (m6A) is the most pervasive, abundant, and conserved internal modification within eukaryotic mRNAs [34,35,36,37,38]. Accordingly, we examined the RNA expression of key m6A writers (METTL3 and METTL14) in UF cells in the presence or absence of I-BRD9. As shown in Figure 8A,B, I-BRD9 treatment significantly changed the RNA levels of METTL14 and METTL3 .
4. Discussion
Epigenetic alterations regulate gene activity and expression beyond the underlying DNA sequence, and are linked to many diseases, including uterine tumorigenesis [5,39,40,41,42,43,44,45]. Therefore, understanding the relationship between epigenetic regulators and tumorigenesis is crucial for manipulating chromatin regulation in tumor therapy [46,47,48,49]. The present study revealed that BRD9, one of the key readers of lysine acetylation for regulating protein-histone association and chromatin remodeling, is aberrantly upregulated in UF tissues and cell lines. Furthermore, targeted inhibition of BRD9 induced cell cycle arrest and apoptosis, altered several critical biological pathways, including ECM accumulation, reprogrammed the pathological epigenome/epitranscriptome, and modulated gene regulation in UFs cells.
Prior functional and correlational studies on BRD proteins in tumor biology have been extensively investigated in several types of cancer [50]. For example, BRD specificities control the mixed-lineage leukemia phenotype [51]. BRD proteins played a role in NMYC translocation and were associated with MLL fusion oncoproteins in leukemogenesis [52,53]. BRD2 is essential for proinflammatory cytokine production in macrophages [54]. BRD2 and BRD4 physically associate with the promoters of inflammatory cytokine genes in macrophages. JQ1, an inhibitor of the Bromo- and extra-terminal domain (BET) family of BRD proteins, including BRD2/4, can block this association and reduce IL-6 and TNF-a levels. These studies suggested that targeting the BET proteins could benefit hyperinflammatory conditions associated with high levels of cytokine production [54]. In ovarian cancer, JQ1 suppresses tumor growth associated with cell cycle arrest, apoptosis induction, and metabolic alterations [55]. In Ewing Sarcoma, co-immunoprecipitation revealed an interaction of BRD4 with CDK9. Combined treatment of Ewing Sarcoma with BRD- and CDK9-inhibitors resulted in enhanced responses compared to individual drugs in vitro and in a preclinical mouse model in vivo [56].
In addition to the BET family, the role of the non-BET family members has been investigated recently. For instance, the non-BET family inhibitor NVS-CECR2-1 inhibits chromatin binding of CECR2 BRD and displaces CECR2 from chromatin within cells. NVS-CECR2-1 exhibits cytotoxic activity against various human cancer cells, killing SW48 colon cancer cells by inducing apoptosis [19]. In melanoma, the BRD9 inhibitor TP-472 blocked tumor growth by suppressing ECM-mediated oncogenic signaling and inducing apoptosis [57]. In renal clear cell carcinoma, the combined analysis of BRD9 and other chromatin-regulated genes showed a significant association with the high-risk groups and lower overall survival, providing a prediction model for further research investigating the role of the expression of BRD genes in cancers [58]. Recently, we identified the critical role of BRD9 in the pathogenesis of uterine leiomyosarcoma [59].
In contrast, the role and mechanism underlying the relevance and involvement of BRD family members in the pathogenesis of UFs, which are the most common benign reproductive tumors, are entirely lacking. Therefore, we characterized the functional role of BRD9, which may play an important role in UF progression. We investigated this specific protein initially because it is recently identidied and involved in multiple diseases [60]. Notably, BRD9 has been shown to play an important role in the uterine cancer, leiomyosarcoma [59]. Our studies demonstrated that BRD9 is aberrantly upregulated in UFs tissues and cells, indicating that BRD9 may contribute to the pathogenesis of UFs.
Epigenetic-targeted therapy has been applied in the treatment of various cancers [61,62,63]. Therefore, the development and use of small chemical inhibitors are fundamental and critical to the preclinical evaluation of BRD proteins as targets. Recently, a novel non-BET inhibitor has been developed with high potency for BRD9 [64]. To determine the functional role of BRD9 in UFs, we investigated the effect of BRD9 potent inhibitor (I-BRD9) on UF cells. We demonstrated that I-BRD9 treatment significantly inhibited UF cell proliferation concomitant with an increase in cell-cycle arrest, apoptosis, and decrease in ECM accumulation. These observations are consistent with the previous studies on BRD9 inhibition from other types of cells [57], and contribute to our understanding of the molecular mechanism underpinning ECM deposition and cell proliferation mediated by the BRD9 involvement in UFs.
To extensively determine the mechanism of BRD9 inhibitory action, we performed comparative transcriptome-wide RNA-sequencing in UF cells treated with vehicle or BRD9 inhibitor (I-BRD9). Our transcriptomic profiling analysis in UF cells revealed that multiple important pathways were altered in response to I-BRD9 treatment. For instance, I-BRD9 induced enriched pathways in UF cells, including E2F targets, G2M checkpoint, MYC targets, MTORC1 signaling, and mitotic spindle, DNA replication. We have identified several cell-cycle and apoptosis-related genes that may play an important role in the inhibitory effect on UF cell growth, supporting the molecular mechanism underlying the BRD9 inhibition-induced anti-UF cell effect. We demonstrated that cyclin-dependent kinases and their associated pathways are impacted in response to BRD9 inhibitors. Reactome analysis revealed that BRD9 inhibition altered the ECM accumulation and remodeling, which are the key factors for mechanotransduction and downstream signaling alterations for UF pathogenesis and growth. Previously, transcriptome-wide mRNA profiling in melanoma cells demonstrated that BRD9 inhibition not only upregulated pro-apoptotic genes associated with the p53 pathway, but also downregulated several extracellular matrix proteins which are required for tumor growth [57].
It has been widely accepted that different epigenetic mechanisms coordinately regulate gene expression and function [65,66,67,68]. To determine the relation between BRD9 and histone marks, we analyzed the epigenomic alterations associated with DEGs upon I-BRD9 treatment. Notably, we observed that DEGs in response to I-BRD9 treatments were significantly associated with the enrichment of several histone marks, including H3K27me3, H3K4me1, H3K4me2, and H3K4me3. In addition, BRD9 inhibition altered the expression of several epigenetic marks, including EZH2, SUV39H1, SUV39H2, and SIRT2. Notably, members of a BET protein family, including BRD2, BRD3, BRD4, and BRDT, play a role in the installation of histone methylation. For instance, blocking the readers of H3K27ac by BET inhibitor (JQ1) abolished H3K27ac-induced H3K4me3 installation and downstream gene activation [69]. In addition to BET BRDs, our findings herein reinforce the view that non-BET BRDs such as BRD9 may also play a critical role in cross-talking with histone modification “modifiers”, implicating non-BET BRDs in the complex of tumor epigenome network in the pathogenesis of UFs.
MiRNAs are small single-stranded non-coding RNA molecules that function in RNA silencing and post-transcriptional regulation of gene expression [70]. The interplay between miRNAs and epigenomic marks has been extensively reported [71,72,73]. Notably, accumulated studies demonstrated the roles of miRNAs in the pathogenesis of UFs [74,75,76]. In this study, we demonstrated that miRNAs might play a critical role in regulating gene expression in UF cells in response to I-BRD9 treatment. We identified a number of miRNAs that correlated with DEGs either up- or downregulated by I-BRD9 treatment, suggesting that BRD9 may alter the transcriptome via miRNA-mediated gene regulation. To our knowledge, these identified miRNAs have not been reported in UFs, and warrant further investigation.
The epitranscriptome is an emerging frontier in molecular medicine owing to its vast potential as an additional and highly dynamic layer of gene regulation above and beyond the epigenome [77,78,79,80]. To date, more than 160 different chemical modifications in RNA have been identified in living organisms; among these, m6A is the most pervasive, abundant, and conserved internal modification within eukaryotic mRNAs, occurring in ~25% of transcripts genome-wide and enriched around stop codons, 5’- and 3’- untranslated regions, and within long internal exons. m6A is incorporated co-transcriptionally by so-called ‘writers’, including the METTL3-METTL14 core methyltransferase complex and associated proteins that confer target mRNA specificity, removed by the demethylases erasers, and recognized by readers including the YTH family of proteins such as YTHDC1, and 2 [81,82,83,84]. m6A-bound readers ultimately determine the posttranscriptional fate of methylated mRNAs through modulation of cellular activities that control RNA stability, processing, and translation. m6A is thus a pervasive regulator of gene expression as well as a key determinant of cell fate and function; accordingly, disruption of m6A homeostasis has been implicated in a growing number of pathological conditions, including cancer[85,86,87]. Importantly, m6A and its corresponding readers, erasers, and writers are emerging drug targets in various disease settings [83,87], suggesting a vast but untapped potential therapeutic reserve in UFs. In this study, we demonstrated that inhibition of BRD9 altered the m6A writer METTL3 and METTL3 suggesting that targeting BRD9 in UFs might modulate the epitranscriptome via altering the post-transcriptional fate of RNA, therefore modulating the cell function.
We propose a mechanistic model for targeted inhibition of BRD9 in UFs based on our findings herein that: (1) BRD9 expression is aberrantly overexpressed in UFs, (2) targeted inhibition of BRD9 alters the UF phenotype with a decrease in cell proliferation and modulated ECM deposition and remodeling, (3) I-BRD9 altered several key pathways, reprogrammed the pathological epigenome and epitranscriptome, and changed miRNA network to suppress the UF phenotype leading to be a new option for UF treatment (Figure 8C).
In conclusion, our study demonstrated for the first time that BRD9 protein is aberrantly upregulated in UFs. Furthermore, inhibition of BRD9 suppresses the UF phenotype via altering vital UF-related pathways, reprogramming the pathological epigenome/epitranscriptome, and modulating miRNA-mediated gene regulation networks. Therefore, targeted inhibition of BRDs in UFs may provide a promising and novel strategy for treating patients with this clinically significant disease.
Author Contributions
Conceptualization, Q.Y.; data curation: Q.Y. methodology, Q.Y., S.V., A.F., A.K., M.M.O., formal analysis, Q.Y., S.V., A.F., A.K., M.V.B., M.A., T.B., H.S., funding acquisition, Q.Y., C.H., T.G.B., A.A.-H.; Supervision, Q.Y., A.F., A.A-H., writing-original draft, Q.Y., writing-review & edits. Q.Y., S.V., A.F., A.K., M.V.B., M.A., C.H., T.G.B., A.A-H. All authors have read and agreed to the published version of the manuscript.
Funding
This study was supported in part by National Institutes of Health (NIH) grants RO1 HD094378; RO1 ES028615; U54 MD007602, RO1 HD094380, HD087417 and HD106285.
Data availability
Raw FASTQ files were deposited in the NCBI Gene Expression Omnibus (GSE195800).
Acknowledgments
We would also like to thank The University of Chicago Genomics Facility (RRID.SCR_019196), especially Pieter W. Faber, for their assistance with Illumina RNA-sequencing. The bioinformatic analysis was supported in part through the computational resources and staff expertise provided by Wenjun Kang from the Center for Research Informatics at the University of Chicago. Finally, we thank The University of Chicago Cytometry and Antibody Technology Facility (RRID: SCR_017760), especially David Leclerc, for their assistance with Flow Cytometry.
Conflict of interest
The authors declare no conflict of interest.
Ethical approval and consent to participate
Not applicable
Consent for publication
The manuscript was reviewed and approved by all authors.
References
- Yang, Q., et al., Comprehensive Review of Uterine Fibroids: Developmental Origin, Pathogenesis, and Treatment. Endocr Rev, 2021. [CrossRef]
- Bulun, S.E., Uterine fibroids. N Engl J Med, 2013. 369(14): p. 1344-55. [CrossRef]
- Stewart, E.A., et al., Uterine fibroids. Nat Rev Dis Primers, 2016. 2: p. 16043. [CrossRef]
- Whynott, R.M., K.C.C. Vaught, and J.H. Segars, The Effect of Uterine Fibroids on Infertility: A Systematic Review. Semin Reprod Med, 2017. 35(6): p. 523-532. [CrossRef]
- Yang, Q., et al., The Mechanism and Function of Epigenetics in Uterine Leiomyoma Development. Reprod Sci, 2016. 23(2): p. 163-75. [CrossRef]
- Berta, D.G., et al., Deficient H2A.Z deposition is associated with genesis of uterine leiomyoma. Nature, 2021. [CrossRef]
- Jain, A.K. and M.C. Barton, Bromodomain Histone Readers and Cancer. J Mol Biol, 2017. 429(13): p. 2003-2010. [CrossRef]
- Rodriguez, R.M., et al., Aberrant epigenetic regulation of bromodomain BRD4 in human colon cancer. J Mol Med (Berl), 2012. 90(5): p. 587-95. [CrossRef]
- Sahni, J.M. and R.A. Keri, Targeting bromodomain and extraterminal proteins in breast cancer. Pharmacol Res, 2018. 129: p. 156-176. [CrossRef]
- Yang, Q. and A. Al-Hendy, Non-coding RNAs: an important regulatory mechanism in pathogenesis of uterine fibroids. Fertil Steril, 2018. 109(5): p. 802-803. [CrossRef]
- Chuang, T.D., A. Rehan, and O. Khorram, Functional role of the long noncoding RNA X-inactive specific transcript in leiomyoma pathogenesis. Fertil Steril, 2021. 115(1): p. 238-247. [CrossRef]
- George, J.W., et al., Integrated Epigenome, Exome, and Transcriptome Analyses Reveal Molecular Subtypes and Homeotic Transformation in Uterine Fibroids. Cell Rep, 2019. 29(12): p. 4069-4085 e6. [CrossRef]
- Moyo, M.B., J.B. Parker, and D. Chakravarti, Altered chromatin landscape and enhancer engagement underlie transcriptional dysregulation in MED12 mutant uterine leiomyomas. Nat Commun, 2020. 11(1): p. 1019. [CrossRef]
- Yang, Q., et al., Targeting Class I Histone Deacetylases in Human Uterine Leiomyosarcoma. Cells, 2022. 11(23). [CrossRef]
- Hugle, M., et al., Beyond the BET Family: Targeting CBP/p300 with 4-Acyl Pyrroles. Angew Chem Int Ed Engl, 2017. 56(41): p. 12476-12480. [CrossRef]
- Clegg, M.A., et al., Advancements in the Development of non-BET Bromodomain Chemical Probes. ChemMedChem, 2019. 14(4): p. 362-385. [CrossRef]
- Vichaikul, S., et al., Inhibition of bromodomain extraterminal histone readers alleviates skin fibrosis in experimental models of scleroderma. JCI Insight, 2022. 7(9). [CrossRef]
- Fujisawa, T. and P. Filippakopoulos, Functions of bromodomain-containing proteins and their roles in homeostasis and cancer. Nat Rev Mol Cell Biol, 2017. 18(4): p. 246-262. [CrossRef]
- Park, S.G., et al., Cytotoxic activity of bromodomain inhibitor NVS-CECR2-1 on human cancer cells. Sci Rep, 2020. 10(1): p. 16330. [CrossRef]
- Yang, Q., et al., The Polycomb Group Protein EZH2 Impairs DNA Damage Repair Gene Expression in Human Uterine Fibroids. Biol Reprod, 2016. 94(3): p. 69. [CrossRef]
- Yang, Q., et al., Role of histone deacetylases in regulation of phenotype of ovine newborn pulmonary arterial smooth muscle cells. Cell Prolif, 2013. 46(6): p. 654-64. [CrossRef]
- Love, M.I., W. Huber, and S. Anders, Moderated estimation of fold change and dispersion for RNA-seq data with DESeq2. Genome Biol, 2014. 15(12): p. 550. [CrossRef]
- Robinson, M.D., D.J. McCarthy, and G.K. Smyth, edgeR: a Bioconductor package for differential expression analysis of digital gene expression data. Bioinformatics, 2010. 26(1): p. 139-40. [CrossRef]
- Law, C.W., et al., voom: Precision weights unlock linear model analysis tools for RNA-seq read counts. Genome Biol, 2014. 15(2): p. R29. [CrossRef]
- Kuleshov, M.V., et al., Enrichr: a comprehensive gene set enrichment analysis web server 2016 update. Nucleic Acids Res, 2016. 44(W1): p. W90-7. [CrossRef]
- Yang, Q., et al., Altered DNA repair genes in human uterine fibroids are epigenetically regulated via EZH2 histone methyltransferase. Fertility and Sterility, 2015. 104(3). [CrossRef]
- Islam, M.S., et al., Extracellular matrix in uterine leiomyoma pathogenesis: a potential target for future therapeutics. Hum Reprod Update, 2018. 24(1): p. 59-85. [CrossRef]
- Islam, M.S., et al., Extracellular matrix and Hippo signaling as therapeutic targets of antifibrotic compounds for uterine fibroids. Clin Transl Med, 2021. 11(7): p. e475. [CrossRef]
- Jamaluddin, M.F.B., P. Nahar, and P.S. Tanwar, Proteomic Characterization of the Extracellular Matrix of Human Uterine Fibroids. Endocrinology, 2018. 159(7): p. 2656-2669. [CrossRef]
- Yang, Q. and A. Al-Hendy, Update on the Role and Regulatory Mechanism of Extracellular Matrix in the Pathogenesis of Uterine Fibroids. Int J Mol Sci, 2023. 24(6). [CrossRef]
- Leppert, P.C., F.L. Jayes, and J.H. Segars, The extracellular matrix contributes to mechanotransduction in uterine fibroids. Obstet Gynecol Int, 2014. 2014: p. 783289. [CrossRef]
- Ko, Y.A., et al., Extracellular matrix (ECM) activates beta-catenin signaling in uterine fibroids. Reproduction, 2018. 155(1): p. 61-71. [CrossRef]
- Norian, J.M., et al., Characterization of tissue biomechanics and mechanical signaling in uterine leiomyoma. Matrix Biol, 2012. 31(1): p. 57-65. [CrossRef]
- Yue, Y., J. Liu, and C. He, RNA N6-methyladenosine methylation in post-transcriptional gene expression regulation. Genes Dev, 2015. 29(13): p. 1343-55. [CrossRef]
- Liu, J., et al., A METTL3-METTL14 complex mediates mammalian nuclear RNA N6-adenosine methylation. Nat Chem Biol, 2014. 10(2): p. 93-5. [CrossRef]
- Jia, G., Y. Fu, and C. He, Reversible RNA adenosine methylation in biological regulation. Trends Genet, 2013. 29(2): p. 108-15. [CrossRef]
- Scheitl, C.P.M., et al., Site-specific RNA methylation by a methyltransferase ribozyme. Nature, 2020. 587(7835): p. 663-667. [CrossRef]
- Shen, H., et al., The emerging roles of N6-methyladenosine RNA methylation in human cancers. Biomark Res, 2020. 8: p. 24. [CrossRef]
- Bert, S.A., et al., Regional activation of the cancer genome by long-range epigenetic remodeling. Cancer Cell, 2013. 23(1): p. 9-22. [CrossRef]
- Garcia, N., et al., Targeting Hedgehog Pathway and DNA Methyltransferases in Uterine Leiomyosarcoma Cells. Cells, 2020. 10(1). [CrossRef]
- Yang, Q. and A. Al-Hendy, The Regulatory Functions and the Mechanisms of Long Non-Coding RNAs in Cervical Cancer. Cells, 2022. 11(7). [CrossRef]
- Zaib, S., N. Rana, and I. Khan, Histone Modifications and their Role in Epigenetics of Cancer. Curr Med Chem, 2022. 29(14): p. 2399-2411. [CrossRef]
- Keyvani-Ghamsari, S., et al., Current understanding of epigenetics mechanism as a novel target in reducing cancer stem cells resistance. Clin Epigenetics, 2021. 13(1): p. 120. [CrossRef]
- Ali, M., et al., Activation of beta-Catenin Signaling and its Crosstalk With Estrogen and Histone Deacetylases in Human Uterine Fibroids. J Clin Endocrinol Metab, 2020. 105(4). [CrossRef]
- Yang, Q., et al., Identification of Polycomb Group Protein EZH2-Mediated DNA Mismatch Repair Gene MSH2 in Human Uterine Fibroids. Reprod Sci, 2016. 23(10): p. 1314-25. [CrossRef]
- Schrump, D.S., J.A. Hong, and D.M. Nguyen, Utilization of chromatin remodeling agents for lung cancer therapy. Cancer J, 2007. 13(1): p. 56-64. [CrossRef]
- Qi, J., Bromodomain and extraterminal domain inhibitors (BETi) for cancer therapy: chemical modulation of chromatin structure. Cold Spring Harb Perspect Biol, 2014. 6(12): p. a018663. [CrossRef]
- Kaur, J., A. Daoud, and S.T. Eblen, Targeting Chromatin Remodeling for Cancer Therapy. Curr Mol Pharmacol, 2019. 12(3): p. 215-229. [CrossRef]
- Magnani, L., et al., Genome-wide reprogramming of the chromatin landscape underlies endocrine therapy resistance in breast cancer. Proc Natl Acad Sci U S A, 2013. 110(16): p. E1490-9. [CrossRef]
- Wu, D., et al., Small Molecules Targeting HATs, HDACs, and BRDs in Cancer Therapy. Front Oncol, 2020. 10: p. 560487. [CrossRef]
- Santillan, D.A., et al., Bromodomain and histone acetyltransferase domain specificities control mixed lineage leukemia phenotype. Cancer Res, 2006. 66(20): p. 10032-9. [CrossRef]
- Dawson, M.A., et al., Inhibition of BET recruitment to chromatin as an effective treatment for MLL-fusion leukaemia. Nature, 2011. 478(7370): p. 529-33. [CrossRef]
- Lucas, X. and S. Gunther, Targeting the BET family for the treatment of leukemia. Epigenomics, 2014. 6(2): p. 153-5. [CrossRef]
- Belkina, A.C., B.S. Nikolajczyk, and G.V. Denis, BET protein function is required for inflammation: Brd2 genetic disruption and BET inhibitor JQ1 impair mouse macrophage inflammatory responses. J Immunol, 2013. 190(7): p. 3670-8. [CrossRef]
- Qiu, H., et al., JQ1 suppresses tumor growth through downregulating LDHA in ovarian cancer. Oncotarget, 2015. 6(9): p. 6915-30. [CrossRef]
- Richter, G.H.S., et al., Combined Inhibition of Epigenetic Readers and Transcription Initiation Targets the EWS-ETS Transcriptional Program in Ewing Sarcoma. Cancers (Basel), 2020. 12(2). [CrossRef]
- Mason, L.D., et al., The BRD9/7 Inhibitor TP-472 Blocks Melanoma Tumor Growth by Suppressing ECM-Mediated Oncogenic Signaling and Inducing Apoptosis. Cancers (Basel), 2021. 13(21). [CrossRef]
- Lu, J., et al., Gene Signature Associated With Bromodomain Genes Predicts the Prognosis of Kidney Renal Clear Cell Carcinoma. Front Genet, 2021. 12: p. 643935. [CrossRef]
- Yang, Q., et al., The Functional Role and Regulatory Mechanism of Bromodomain-Containing Protein 9 in Human Uterine Leiomyosarcoma. Cells, 2022. 11(14). [CrossRef]
- Boyson, S.P., et al., Functional Roles of Bromodomain Proteins in Cancer. Cancers (Basel), 2021. 13(14). [CrossRef]
- Magic, Z., G. Supic, and M. Brankovic-Magic, Towards targeted epigenetic therapy of cancer. J BUON, 2009. 14 Suppl 1: p. S79-88.
- Zhao, R. and A.G. Casson, Epigenetic aberrations and targeted epigenetic therapy of esophageal cancer. Curr Cancer Drug Targets, 2008. 8(6): p. 509-21. [CrossRef]
- Bai, H., et al., Genetic and epigenetic heterogeneity of epithelial ovarian cancer and the clinical implications for molecular targeted therapy. J Cell Mol Med, 2016. 20(4): p. 581-93. [CrossRef]
- Moustakim, M., et al., Chemical probes and inhibitors of bromodomains outside the BET family. Medchemcomm, 2016. 7(12): p. 2246-2264. [CrossRef]
- Kondo, Y., Epigenetic cross-talk between DNA methylation and histone modifications in human cancers. Yonsei Med J, 2009. 50(4): p. 455-63. [CrossRef]
- Winter, S. and W. Fischle, Epigenetic markers and their cross-talk. Essays Biochem, 2010. 48(1): p. 45-61. [CrossRef]
- Szulwach, K.E., et al., Cross talk between microRNA and epigenetic regulation in adult neurogenesis. J Cell Biol, 2010. 189(1): p. 127-41. [CrossRef]
- Lopez, G., et al., HDAC Inhibition for the Treatment of Epithelioid Sarcoma: Novel Cross Talk Between Epigenetic Components. Mol Cancer Res, 2016. 14(1): p. 35-43. [CrossRef]
- Zhao, W., et al., Investigating crosstalk between H3K27 acetylation and H3K4 trimethylation in CRISPR/dCas-based epigenome editing and gene activation. Sci Rep, 2021. 11(1): p. 15912. [CrossRef]
- Cai, Y., et al., A brief review on the mechanisms of miRNA regulation. Genomics Proteomics Bioinformatics, 2009. 7(4): p. 147-54. [CrossRef]
- Perera, R.J. and A. Ray, Epigenetic regulation of miRNA genes and their role in human melanomas. Epigenomics, 2012. 4(1): p. 81-90. [CrossRef]
- Shivakumar, M., et al., Identification of epigenetic interactions between miRNA and DNA methylation associated with gene expression as potential prognostic markers in bladder cancer. BMC Med Genomics, 2017. 10(Suppl 1): p. 30. [CrossRef]
- Wiklund, E.D., J. Kjems, and S.J. Clark, Epigenetic architecture and miRNA: reciprocal regulators. Epigenomics, 2010. 2(6): p. 823-40. [CrossRef]
- Lazzarini, R., et al., From 2646 to 15: differentially regulated microRNAs between progenitors from normal myometrium and leiomyoma. Am J Obstet Gynecol, 2020. 222(6): p. 596 e1-596 e9. [CrossRef]
- Georgieva, B., et al., Characterization of the uterine leiomyoma microRNAome by deep sequencing. Genomics, 2012. 99(5): p. 275-81. [CrossRef]
- Ciebiera, M., et al., The Role of miRNA and Related Pathways in Pathophysiology of Uterine Fibroids-From Bench to Bedside. Int J Mol Sci, 2020. 21(8). [CrossRef]
- Rauch, S., C. He, and B.C. Dickinson, Targeted m(6)A Reader Proteins To Study Epitranscriptomic Regulation of Single RNAs. J Am Chem Soc, 2018. 140(38): p. 11974-11981. [CrossRef]
- Koranda, J.L., et al., Mettl14 Is Essential for Epitranscriptomic Regulation of Striatal Function and Learning. Neuron, 2018. 99(2): p. 283-292 e5. [CrossRef]
- Weng, Y.L., et al., Epitranscriptomic m(6)A Regulation of Axon Regeneration in the Adult Mammalian Nervous System. Neuron, 2018. 97(2): p. 313-325 e6. [CrossRef]
- Hsu, P.J., H. Shi, and C. He, Epitranscriptomic influences on development and disease. Genome Biol, 2017. 18(1): p. 197. [CrossRef]
- Xu, Y., et al., YTH Domain Proteins: A Family of m(6)A Readers in Cancer Progression. Front Oncol, 2021. 11: p. 629560. [CrossRef]
- Kontur, C., et al., Ythdf m(6)A Readers Function Redundantly during Zebrafish Development. Cell Rep, 2020. 33(13): p. 108598. [CrossRef]
- Zhen, D., et al., m(6)A Reader: Epitranscriptome Target Prediction and Functional Characterization of N (6)-Methyladenosine (m(6)A) Readers. Front Cell Dev Biol, 2020. 8: p. 741. [CrossRef]
- Berlivet, S., et al., Readers of the m(6)A epitranscriptomic code. Biochim Biophys Acta Gene Regul Mech, 2019. 1862(3): p. 329-342. [CrossRef]
- Li, F., et al., Glutamate from nerve cells promotes perineural invasion in pancreatic cancer by regulating tumor glycolysis through HK2 mRNA-m6A modification. Pharmacol Res, 2023. 187: p. 106555. [CrossRef]
- Shimura, T., et al., Novel evidence for m(6)A methylation regulators as prognostic biomarkers and FTO as a potential therapeutic target in gastric cancer. Br J Cancer, 2022. 126(2): p. 228-237. [CrossRef]
- Yang, Q. and A. Al-Hendy, The Functional Role and Regulatory Mechanism of FTO m(6)A RNA Demethylase in Human Uterine Leiomyosarcoma. Int J Mol Sci, 2023. 24(9). [CrossRef]
Figure 1.
Protein levels of BRD9 in human UF tissues and cells. (A) Immunoblot analysis was performed to determine the levels of BRD9 protein in UFs (n=21) and myometrium tissues (n=7); (B) The protein levels of BRD9 were quantified using NIH Image J software and presented as fold changes (F/M); (C) Immunoblot analysis was performed to determine the levels of BRD9 protein in HuLM and UTSM cells; (D) The BRD9 levels were quantified using NIH Image J software and presented as fold changes (HuLM/UTSM). β-actin was used as an endogenous control. P: Patients, M: Myometrium; F: Uterine fibroids, ****p<0.0001.
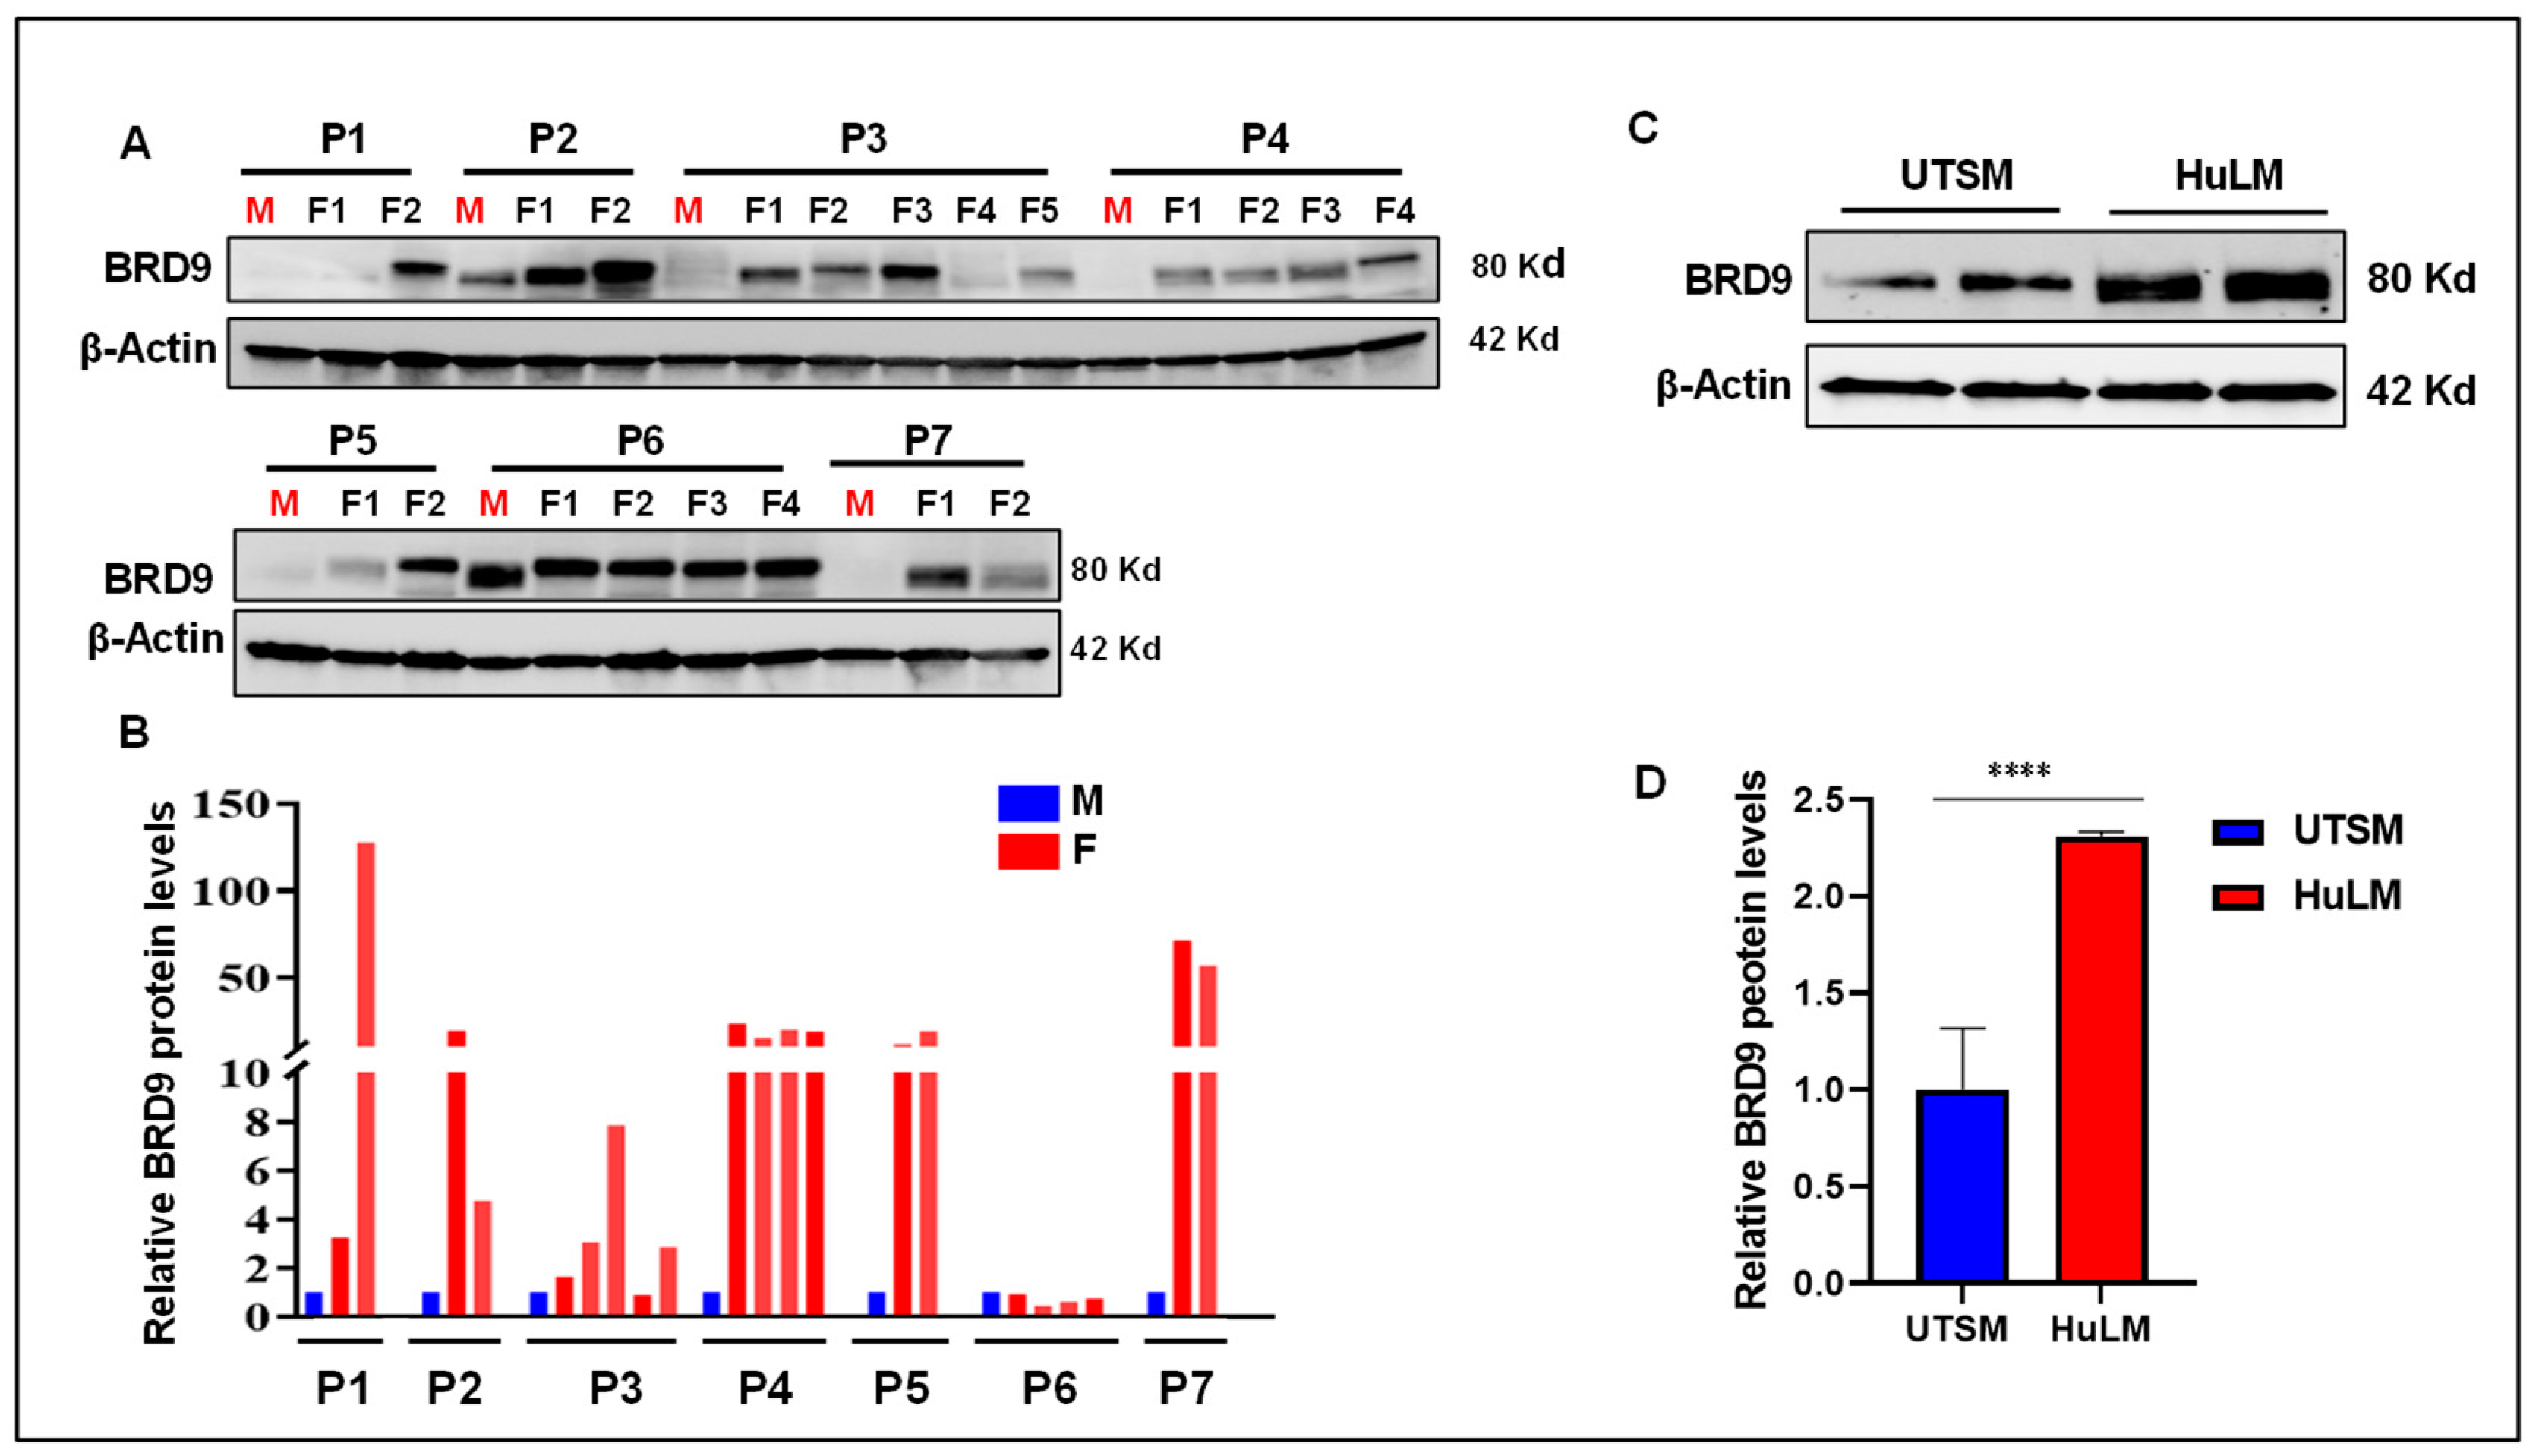
Figure 2.
Treatments with I-BRD9 decrease UF cell proliferation and ECM levels. (A) HuLM cell proliferation was performed in the presence or absence of I-BRD9 with a trypan blue exclusion assay; (B) The protein levels of PCNA and Fibronectin (FN) were examined by Immunoblot analysis using anti-PCNA and anti-FN antibody, respectively. (C) Flow cytometry analysis was performed to measure the cell cycle phase distribution in HuLM cells treated with I-BRD9 (n=3 for each group), (D) Quantitative analysis of cell cycle data. ** p <0.01; *** p <0.001; **** p <0.0001.
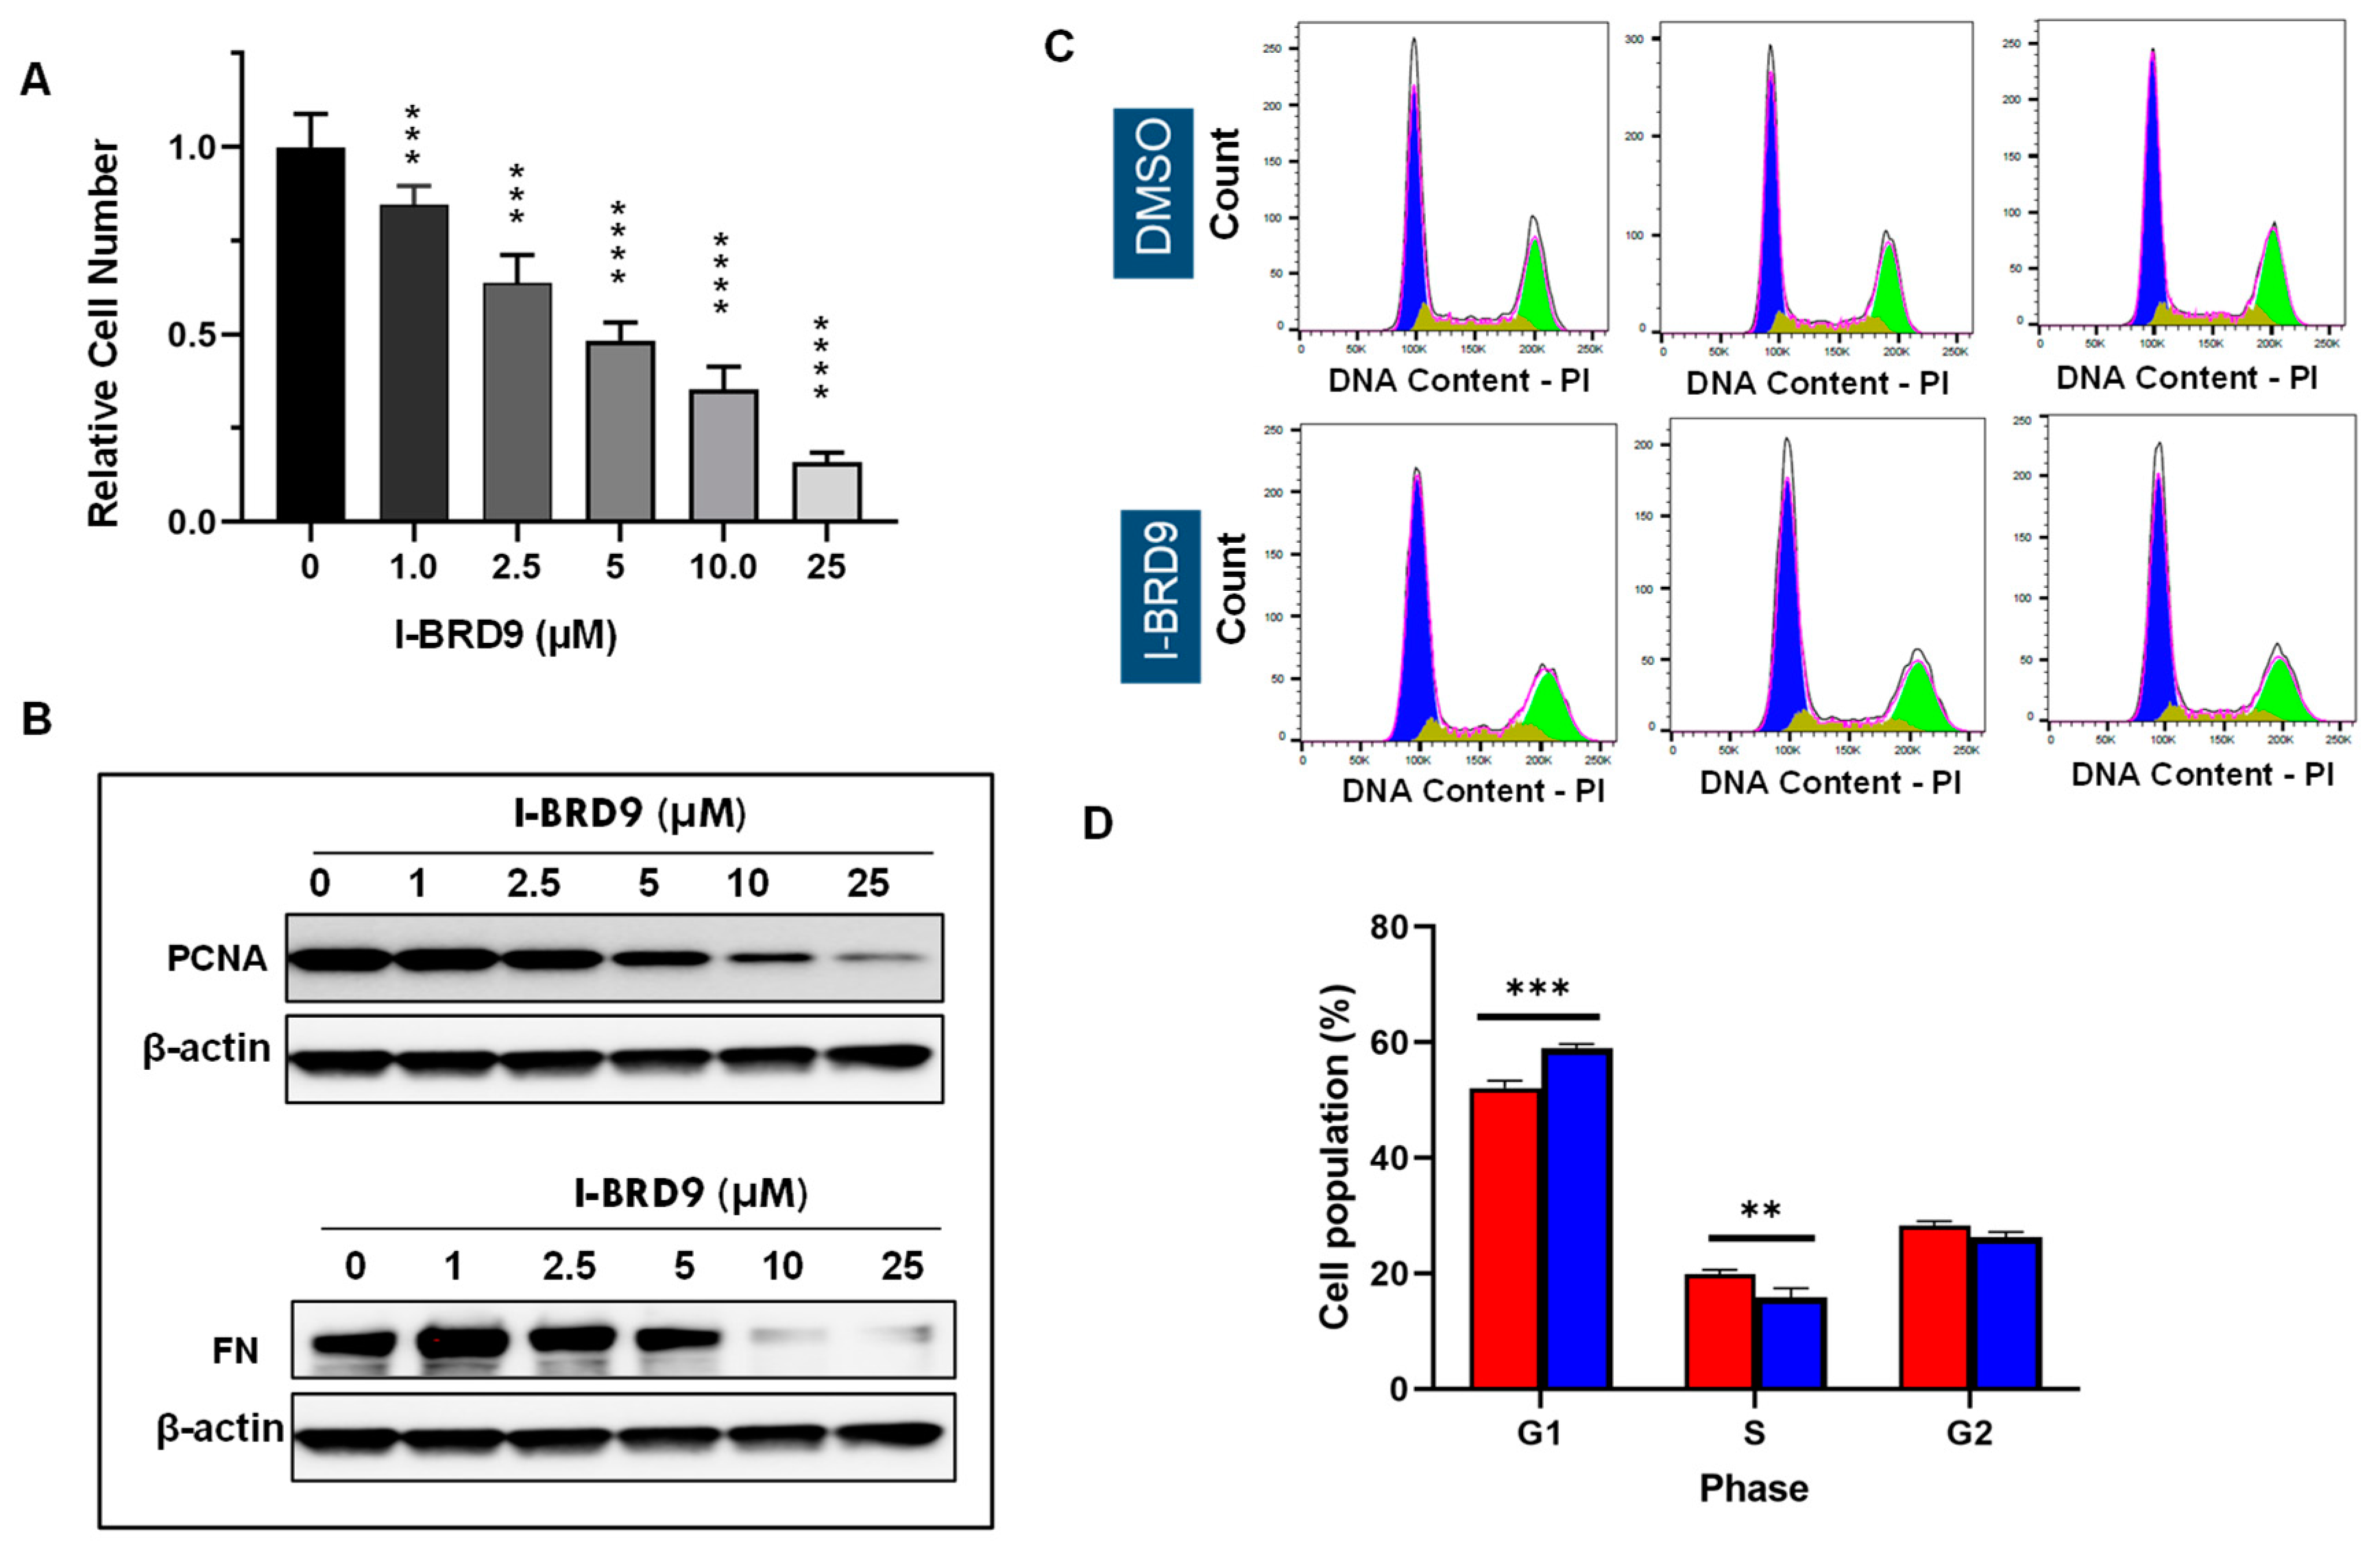
Figure 3.
Treatment with I-BRD9 sculpts the transcriptome of UF cells. (A)Venn diagrams demonstrating the overlap of DEGs identified by three methods of Limma+voom, edgeR and DESeq2 at Adjusted P-value cut off 0.05 and -1.5 > log2FC > 1.5 for I-BRD9 vs. Control, (B) Heatmap of I-BRD9 vs. control (DMSO) group. (C) Volcano plots of the gene expression profiles of I-BRD9 vs. Control; (D) Reactome analysis of DEGs. The dot plots showed the top twenty enrichment terms associated with down DEGs (left panel) and up DEGs (right panel) in response to I-BRD9 treatment. The X-axis represents the gene ratio, and the y-axis describes the enrichment components. The area of the cycle is proportional to the number of genes assigned to the term, and the color accords with the Adjusted p-value.
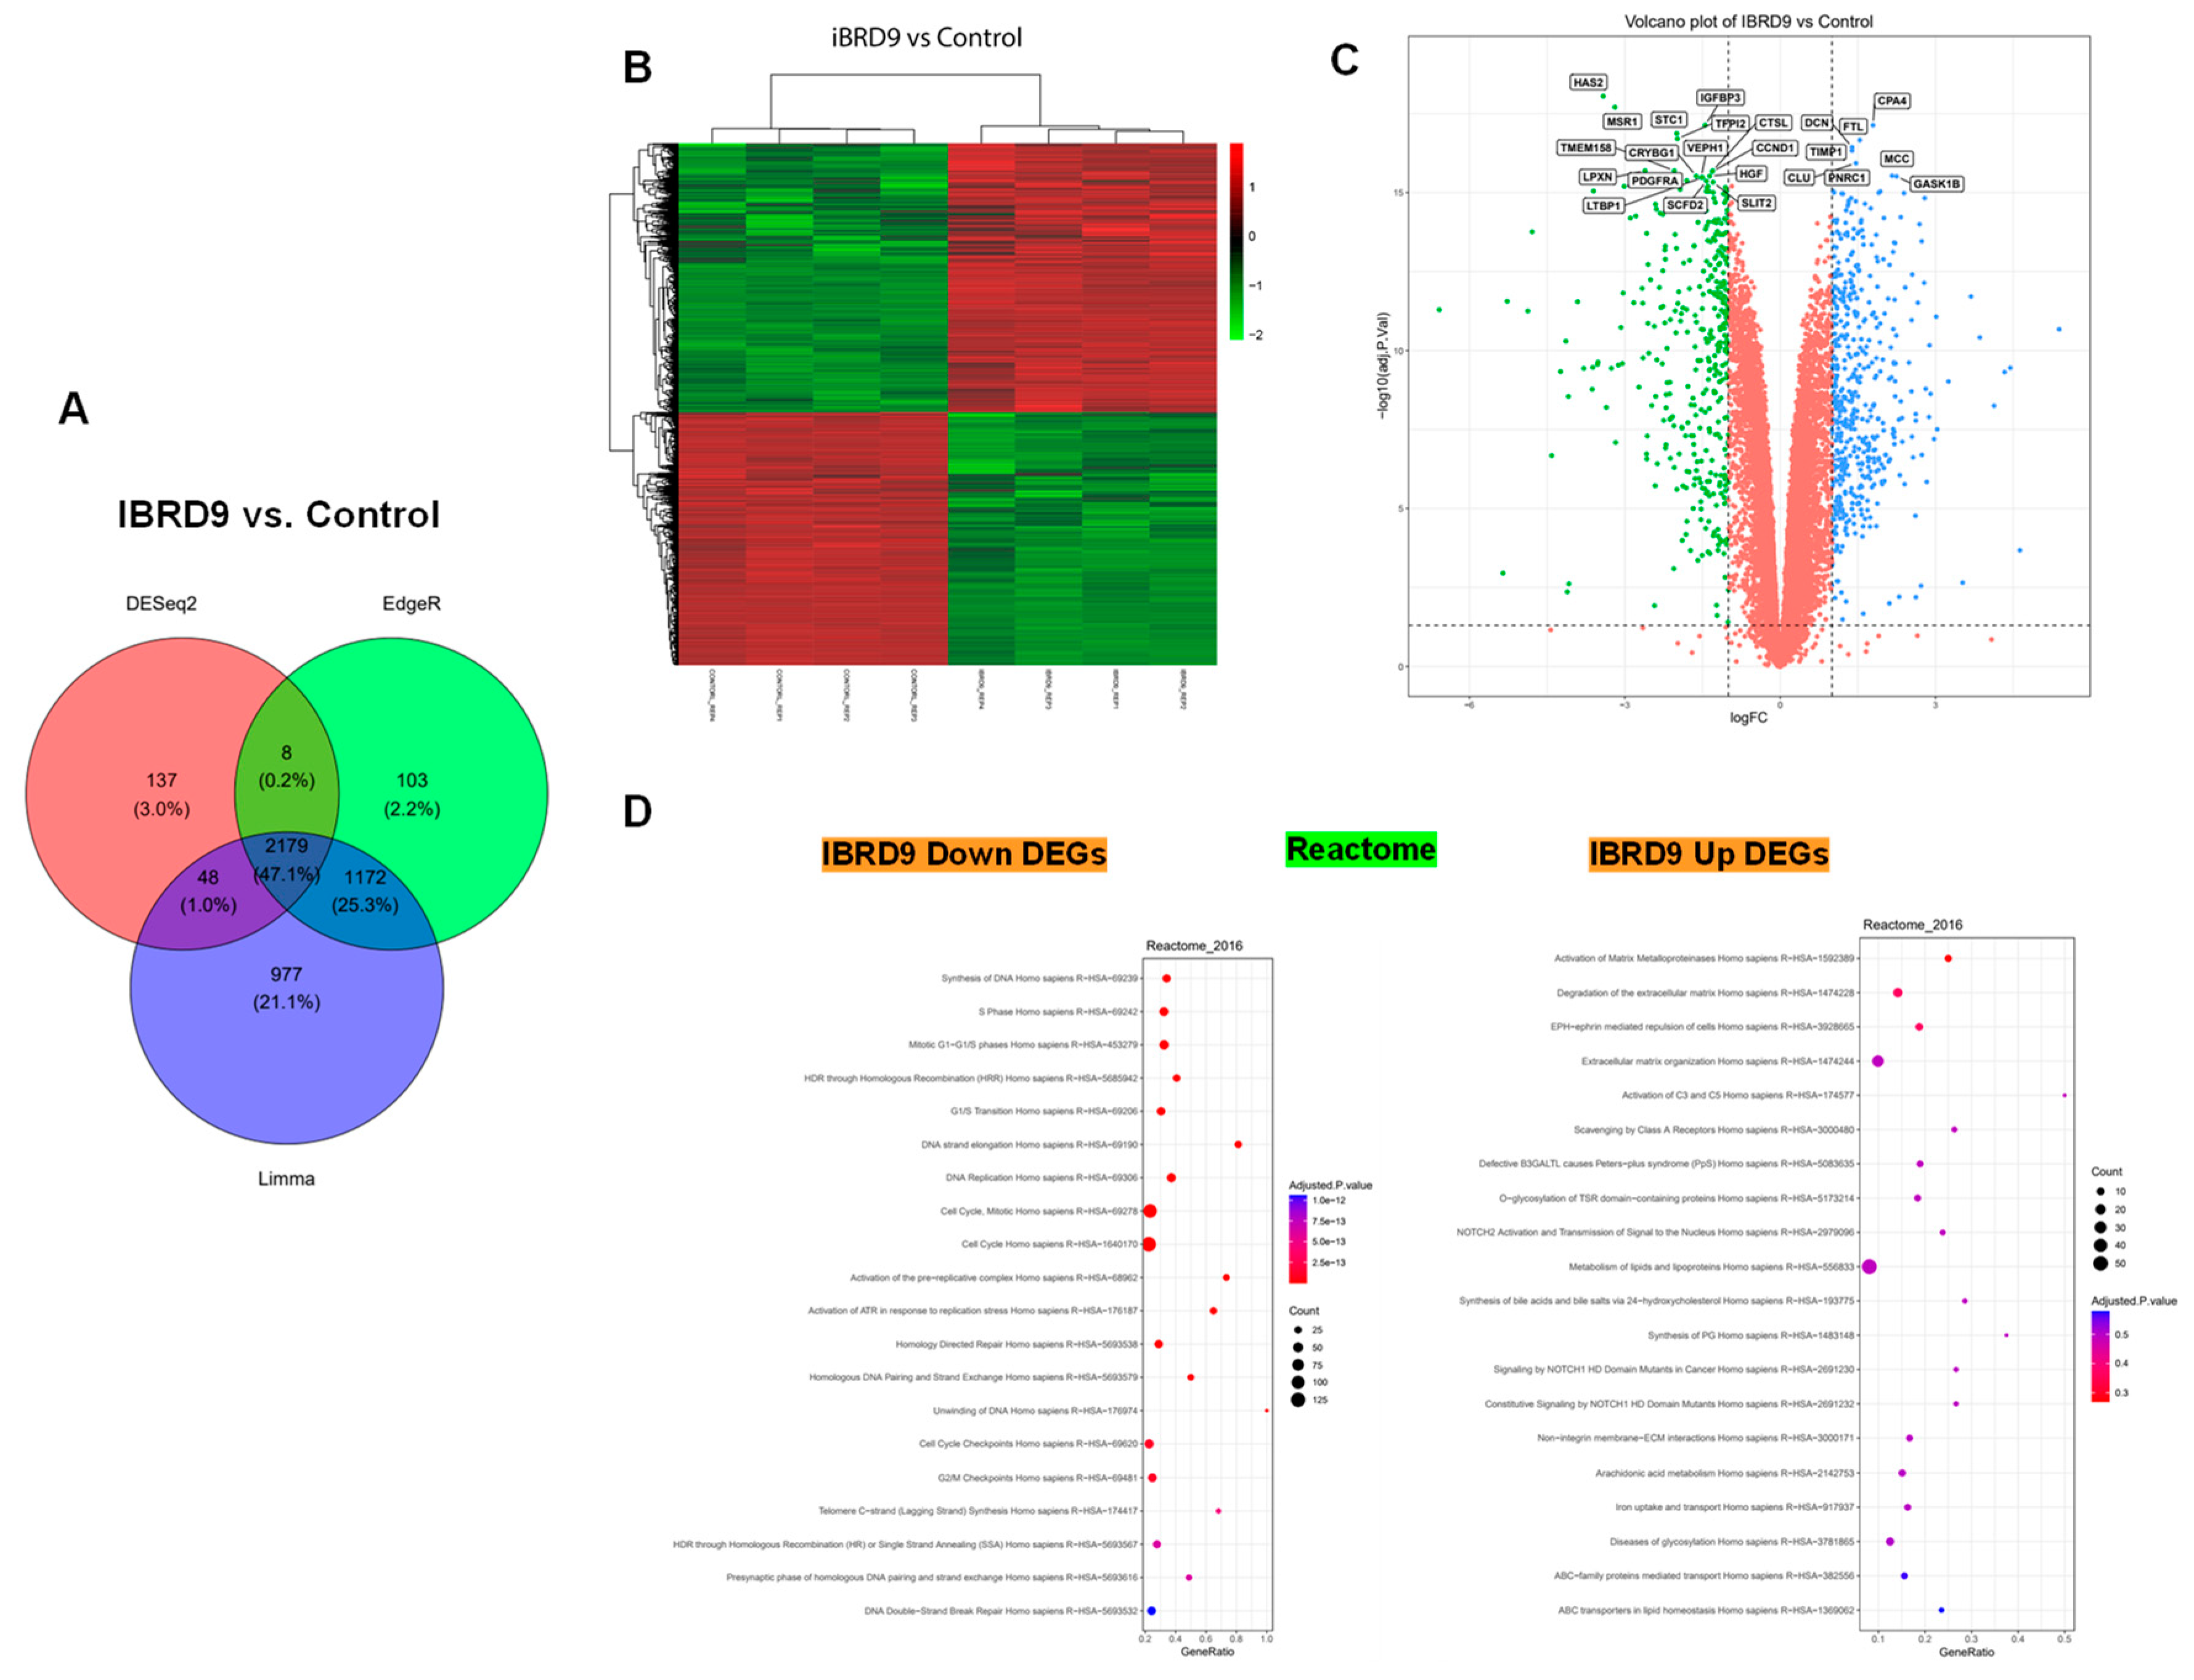
Figure 4.
I-BRD9 altered cell cycle- and apoptosis-related gene expression in HuLM cells. RNA-seq revealed the downregulation of CCND1, CCND3, CDK2, CDK6, , PCNA, BCL-2, and upregulation of CDKN1C and CDKN1B. *p <0.05; ** p <0.01; *** p <0.001; **** p <0.0001.
Figure 4.
I-BRD9 altered cell cycle- and apoptosis-related gene expression in HuLM cells. RNA-seq revealed the downregulation of CCND1, CCND3, CDK2, CDK6, , PCNA, BCL-2, and upregulation of CDKN1C and CDKN1B. *p <0.05; ** p <0.01; *** p <0.001; **** p <0.0001.
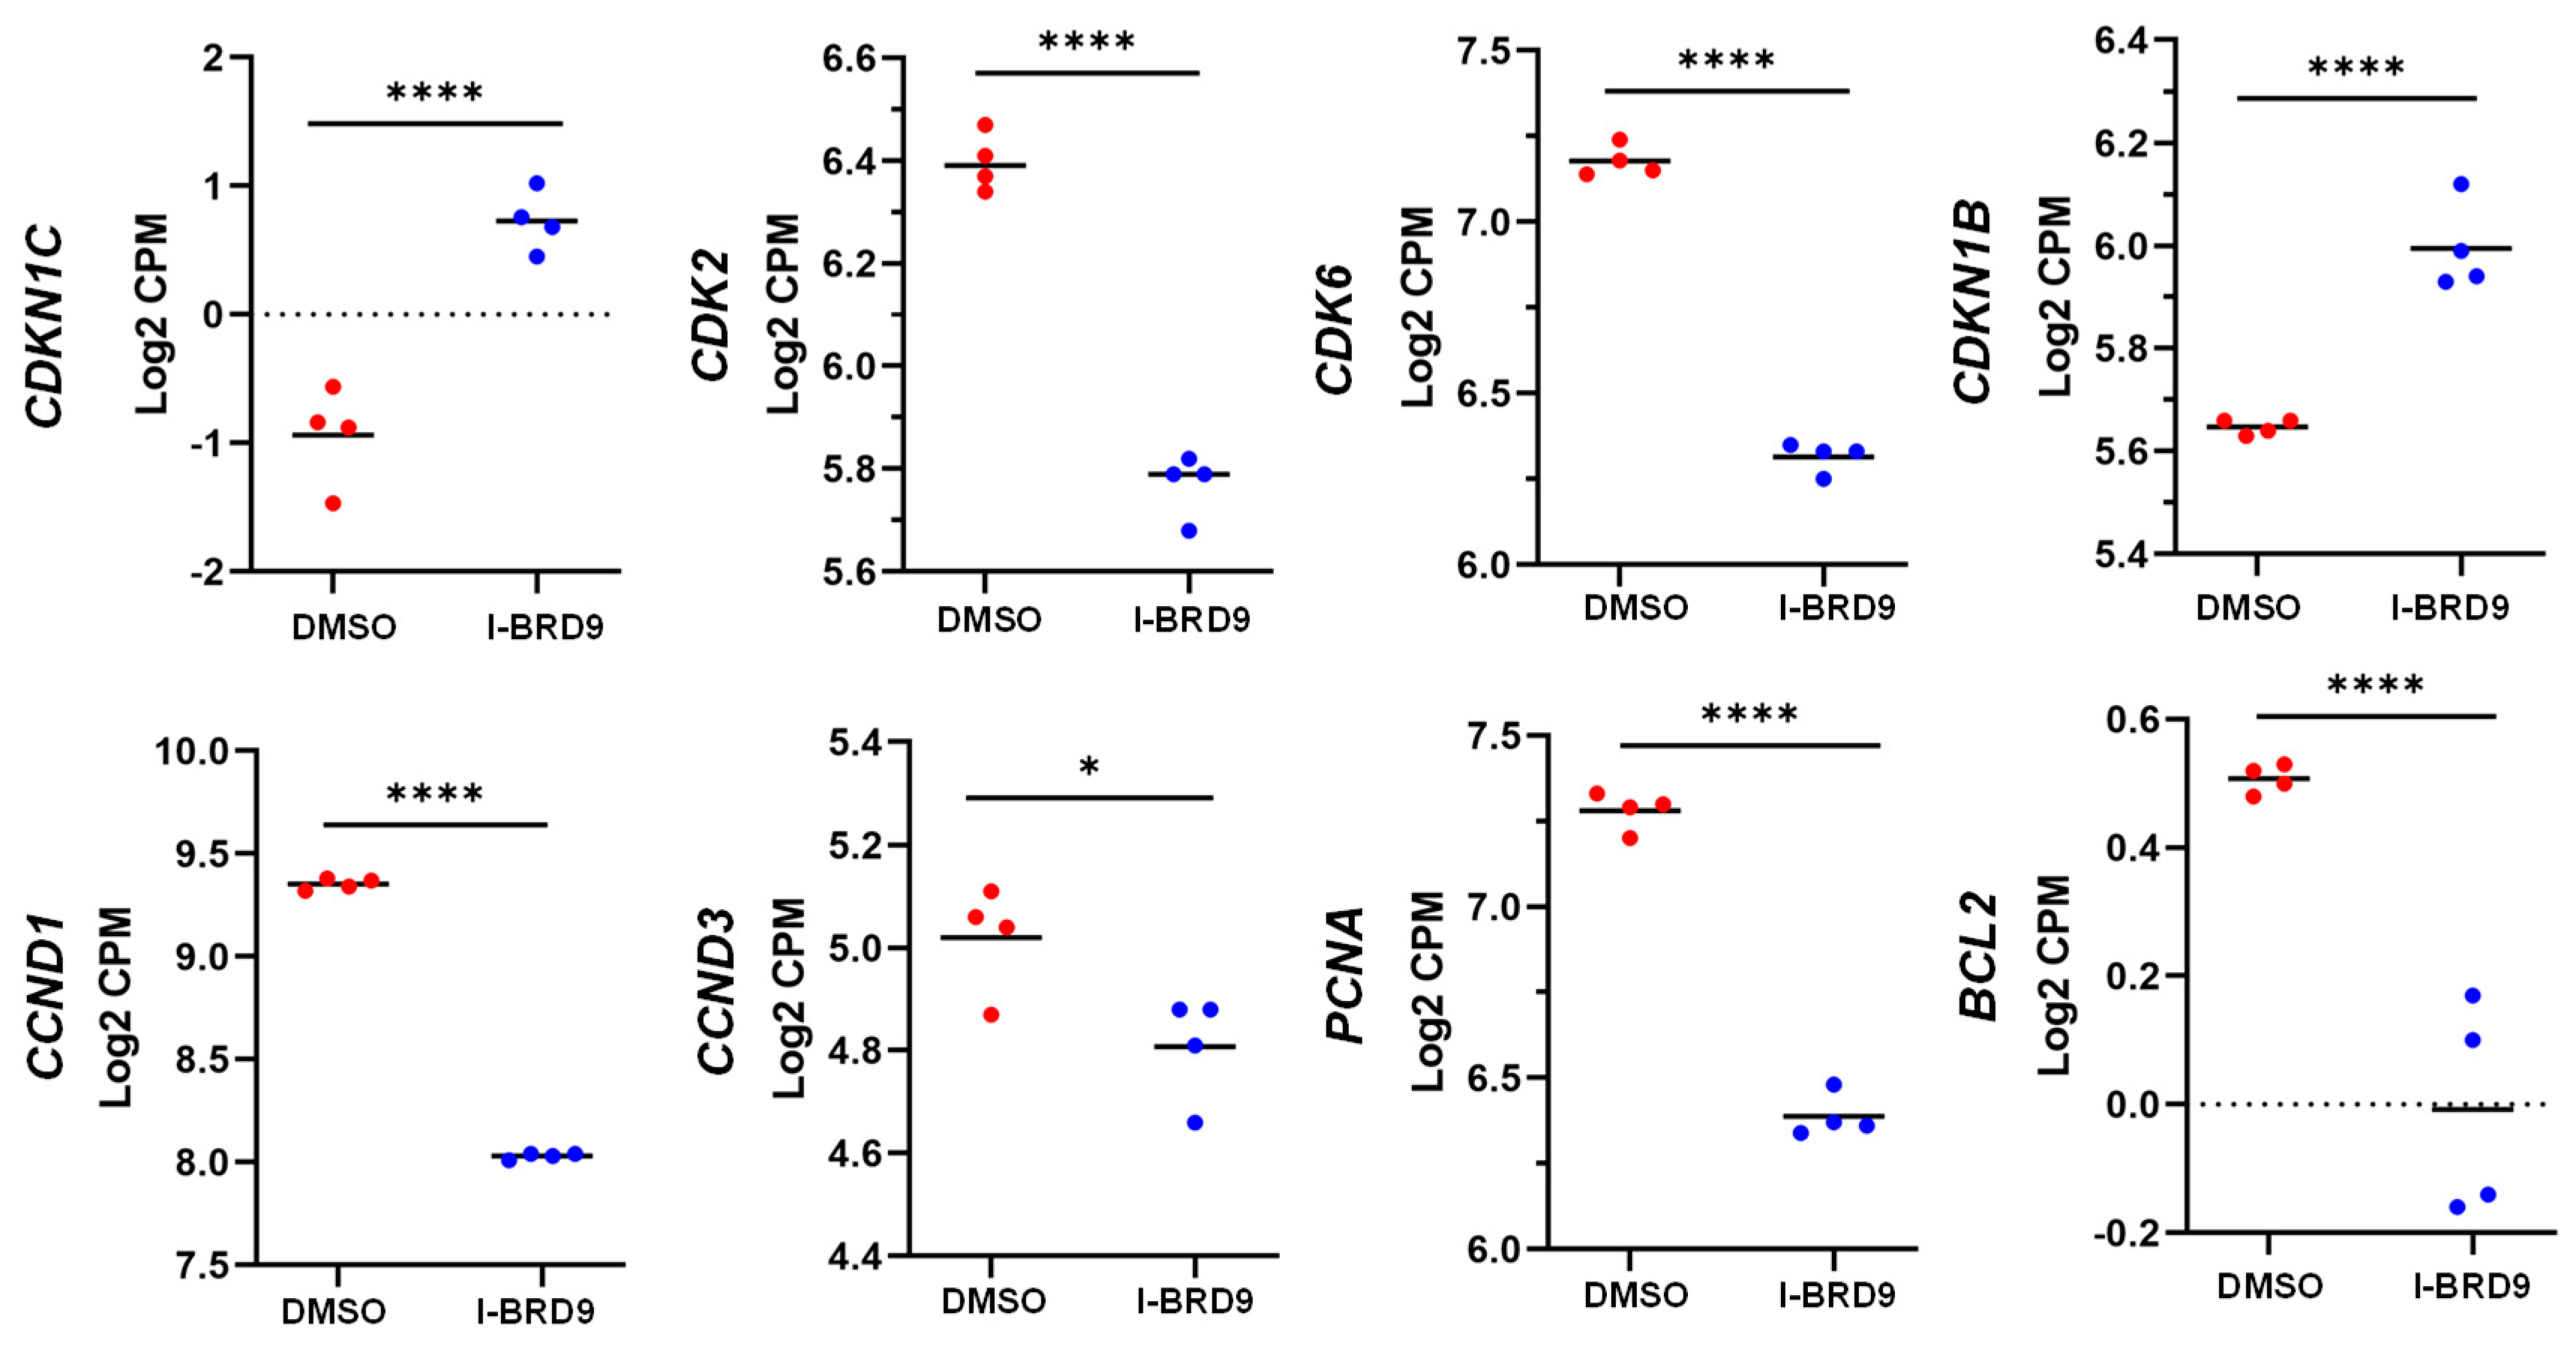
Figure 5.
I-BRD9 altered the RNA expression of ECM-related genes in HuLM cells. RNA-seq revealed the upregulation of MMP2, MMP11, MMP15, MMP16, MMP17 and downregulation of Col13A1, Col16A1 and Col17A1 in HuLM cells treated with I-BRD9.*** p <0.001; **** p <0.0001.
Figure 5.
I-BRD9 altered the RNA expression of ECM-related genes in HuLM cells. RNA-seq revealed the upregulation of MMP2, MMP11, MMP15, MMP16, MMP17 and downregulation of Col13A1, Col16A1 and Col17A1 in HuLM cells treated with I-BRD9.*** p <0.001; **** p <0.0001.

Figure 6.
Dot plot analysis for histone modifications. The dot plots showed the top twenty enrichment terms for histone modification associated with up DEGs (A) and down DEGs (B) in response to I-BRD9 treatment. The X-axis represents the gene ratio, and the y-axis describes the enrichment components. The area of the circle is proportional to the number of genes assigned to the term, and the color accords with the Adjusted P-value.
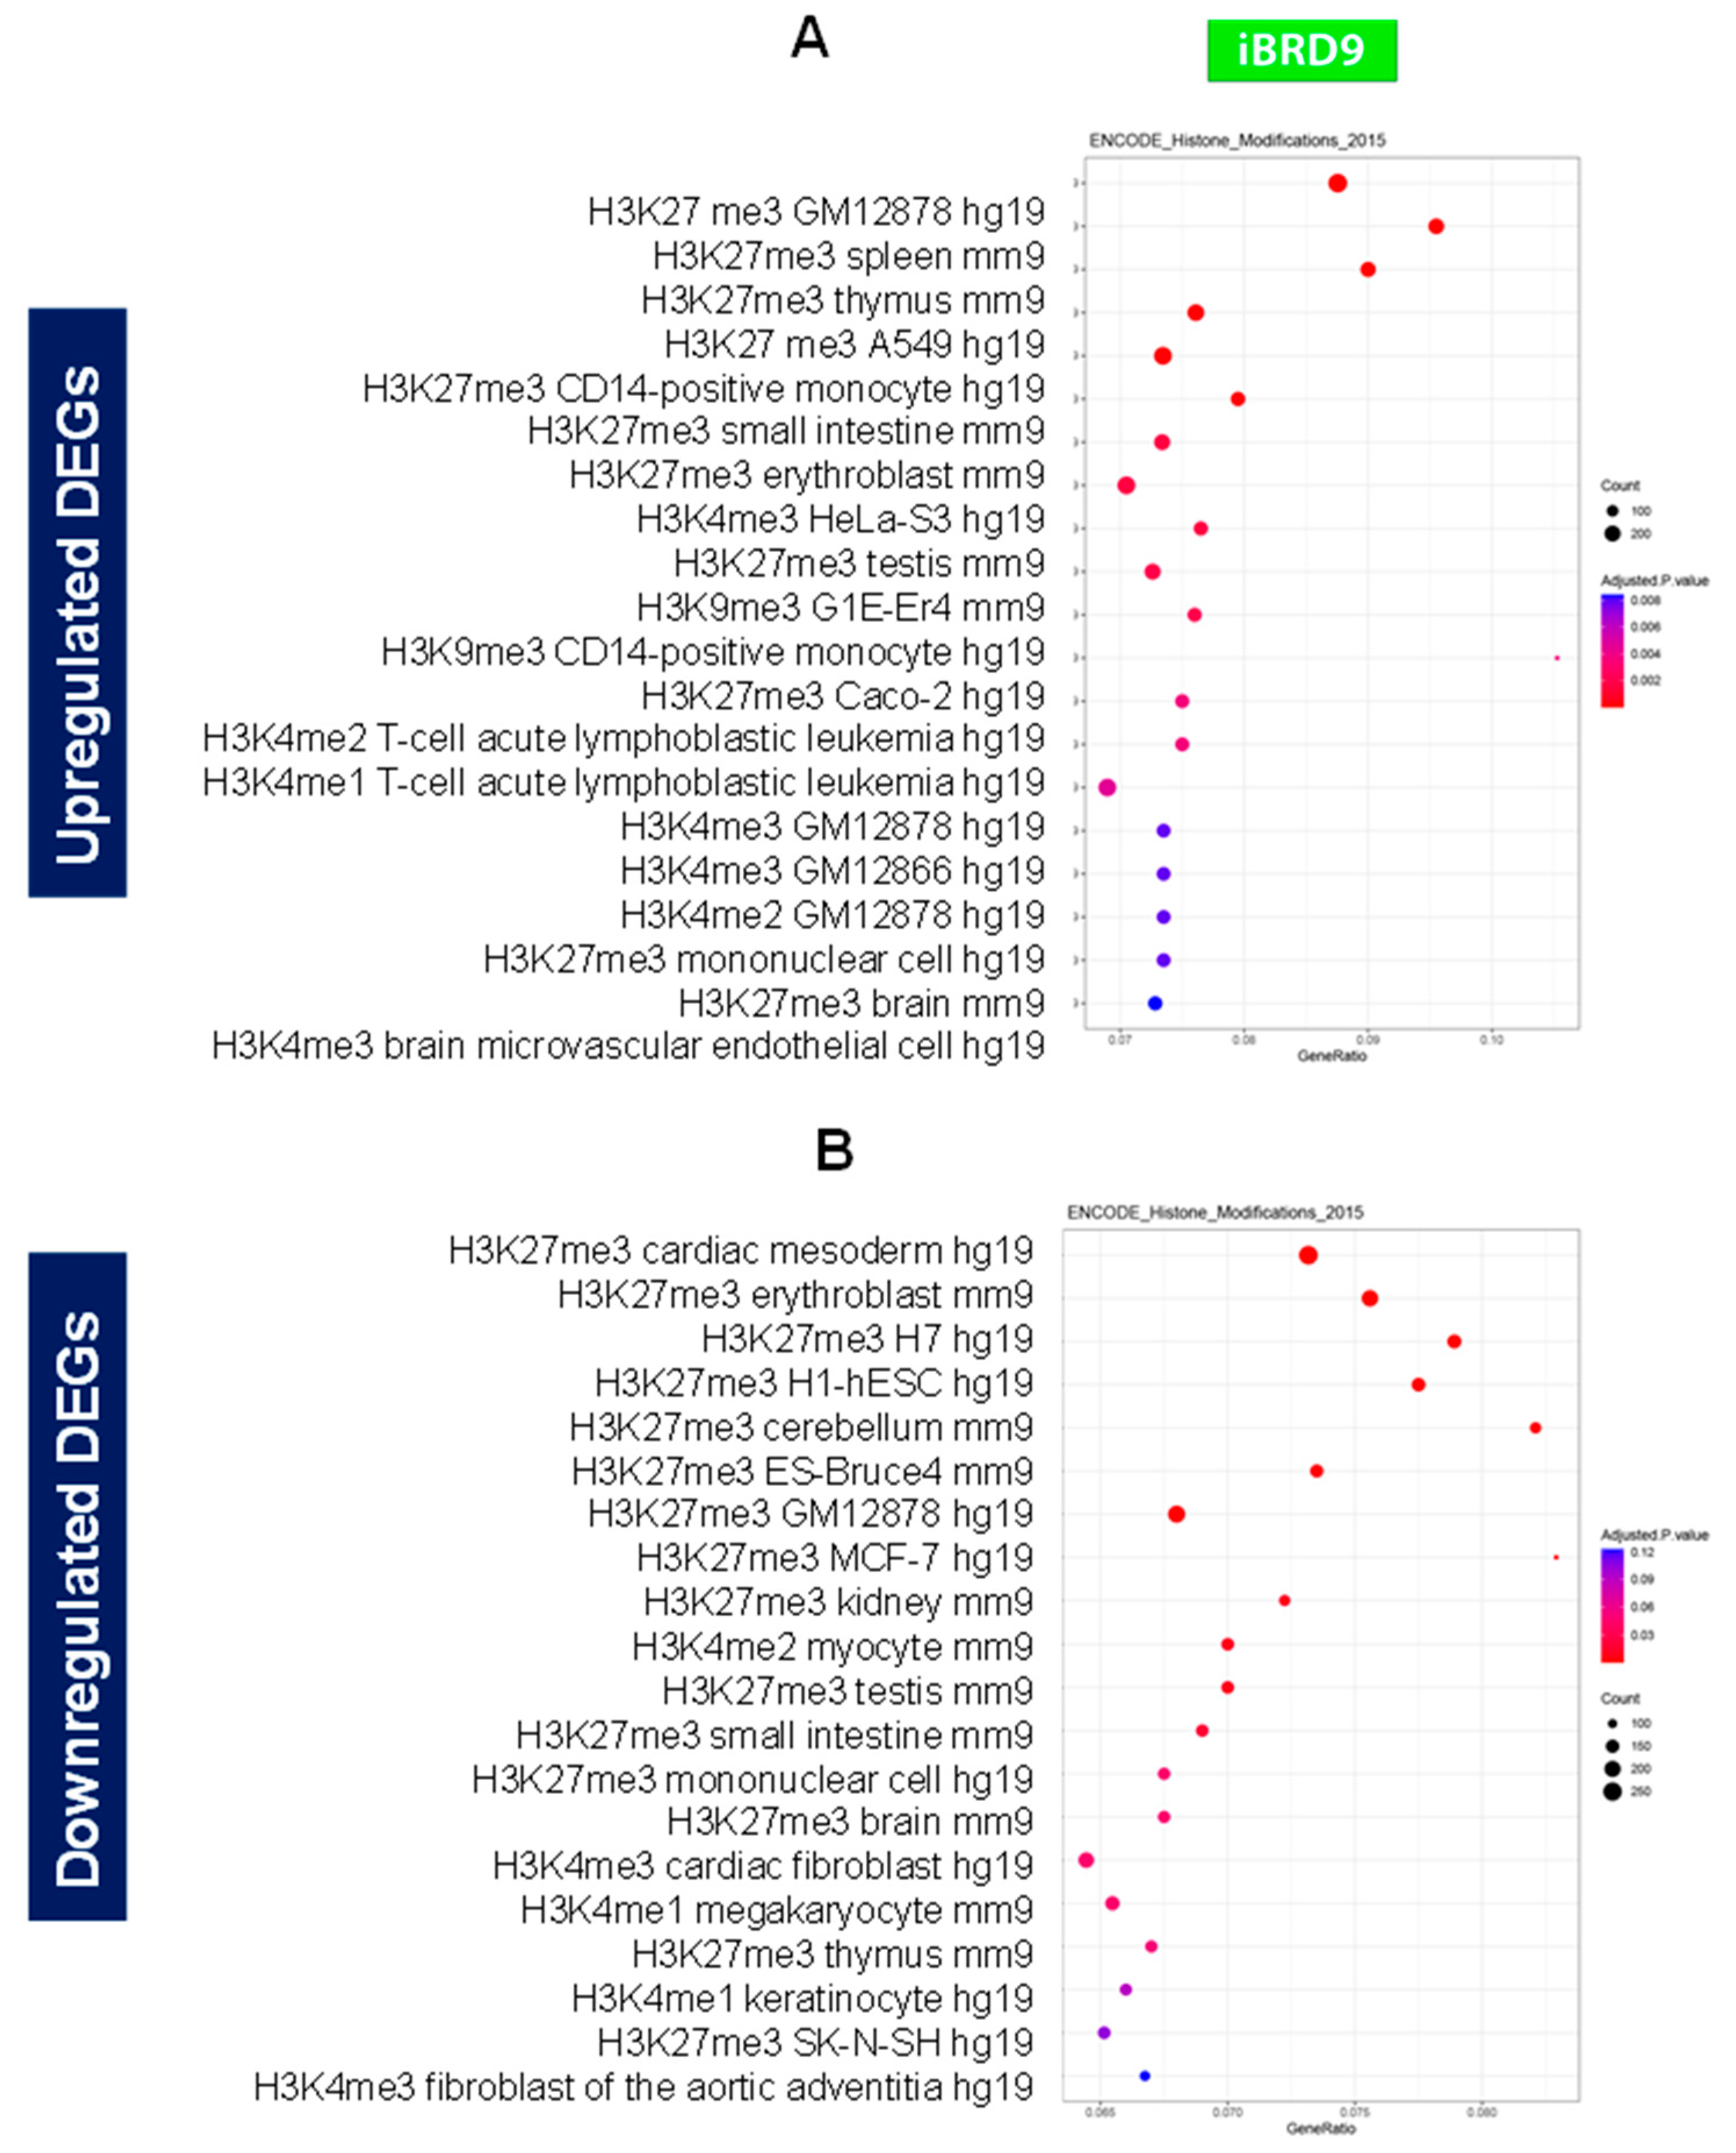
Figure 7.
I-BRD9 altered the RNA expression of epigenetic regulators in HuLM cells. RNA-seq revealed the downregulation of EZH2, SUV39H1, SUV39H2, DNMT3B, and DNMT1 in HuLM cells treated with I-BRD9. *** p <0.001; **** p <0.0001.
Figure 7.
I-BRD9 altered the RNA expression of epigenetic regulators in HuLM cells. RNA-seq revealed the downregulation of EZH2, SUV39H1, SUV39H2, DNMT3B, and DNMT1 in HuLM cells treated with I-BRD9. *** p <0.001; **** p <0.0001.
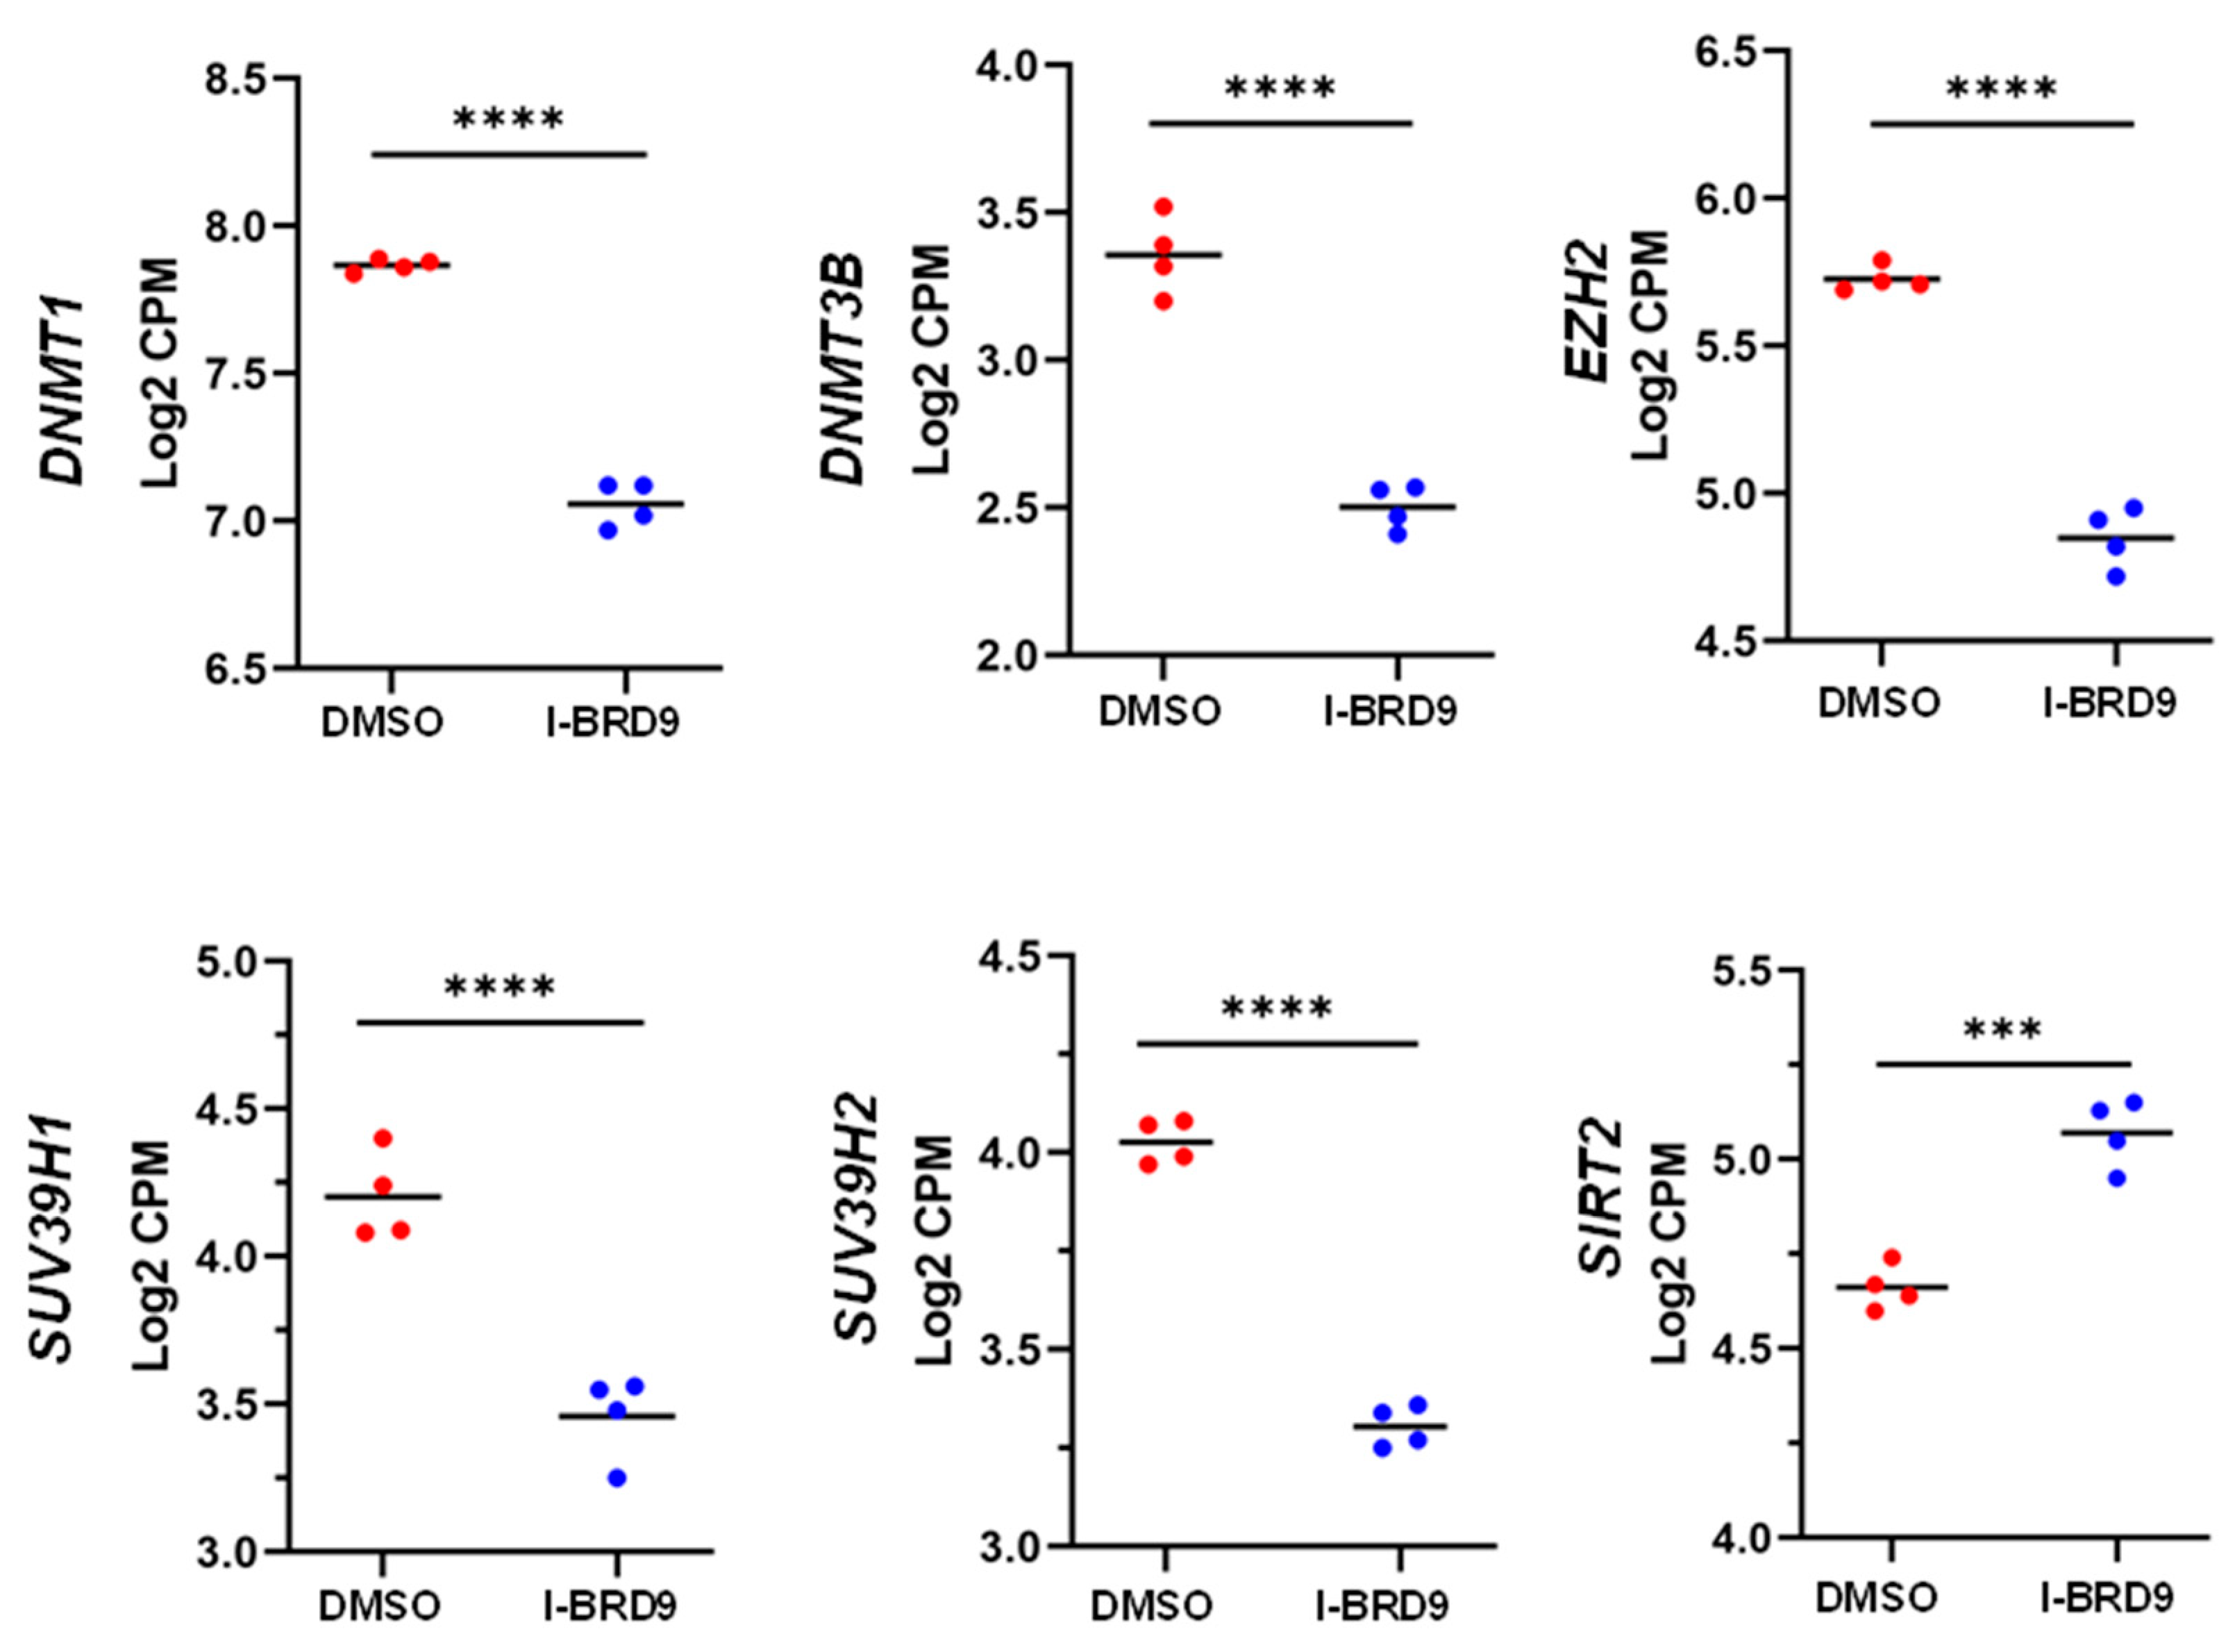
Figure 8.
The expression of M6A writers in HuLM cells in response to I-BRD9 treatments and experimental model. The RNA expression of METTL3 (A) and METTL14 (B) in HuLM cells treated with I-BRD9. (C) The experimental model shows that I-BRD9 treatment promotes apoptosis, induces cell cycle arrest, represses the ECM accumulation, and reprograms the epigenome and epitranscriptome in UF cells. Figure 8C was created using BioRender software online app (BioRender.com).
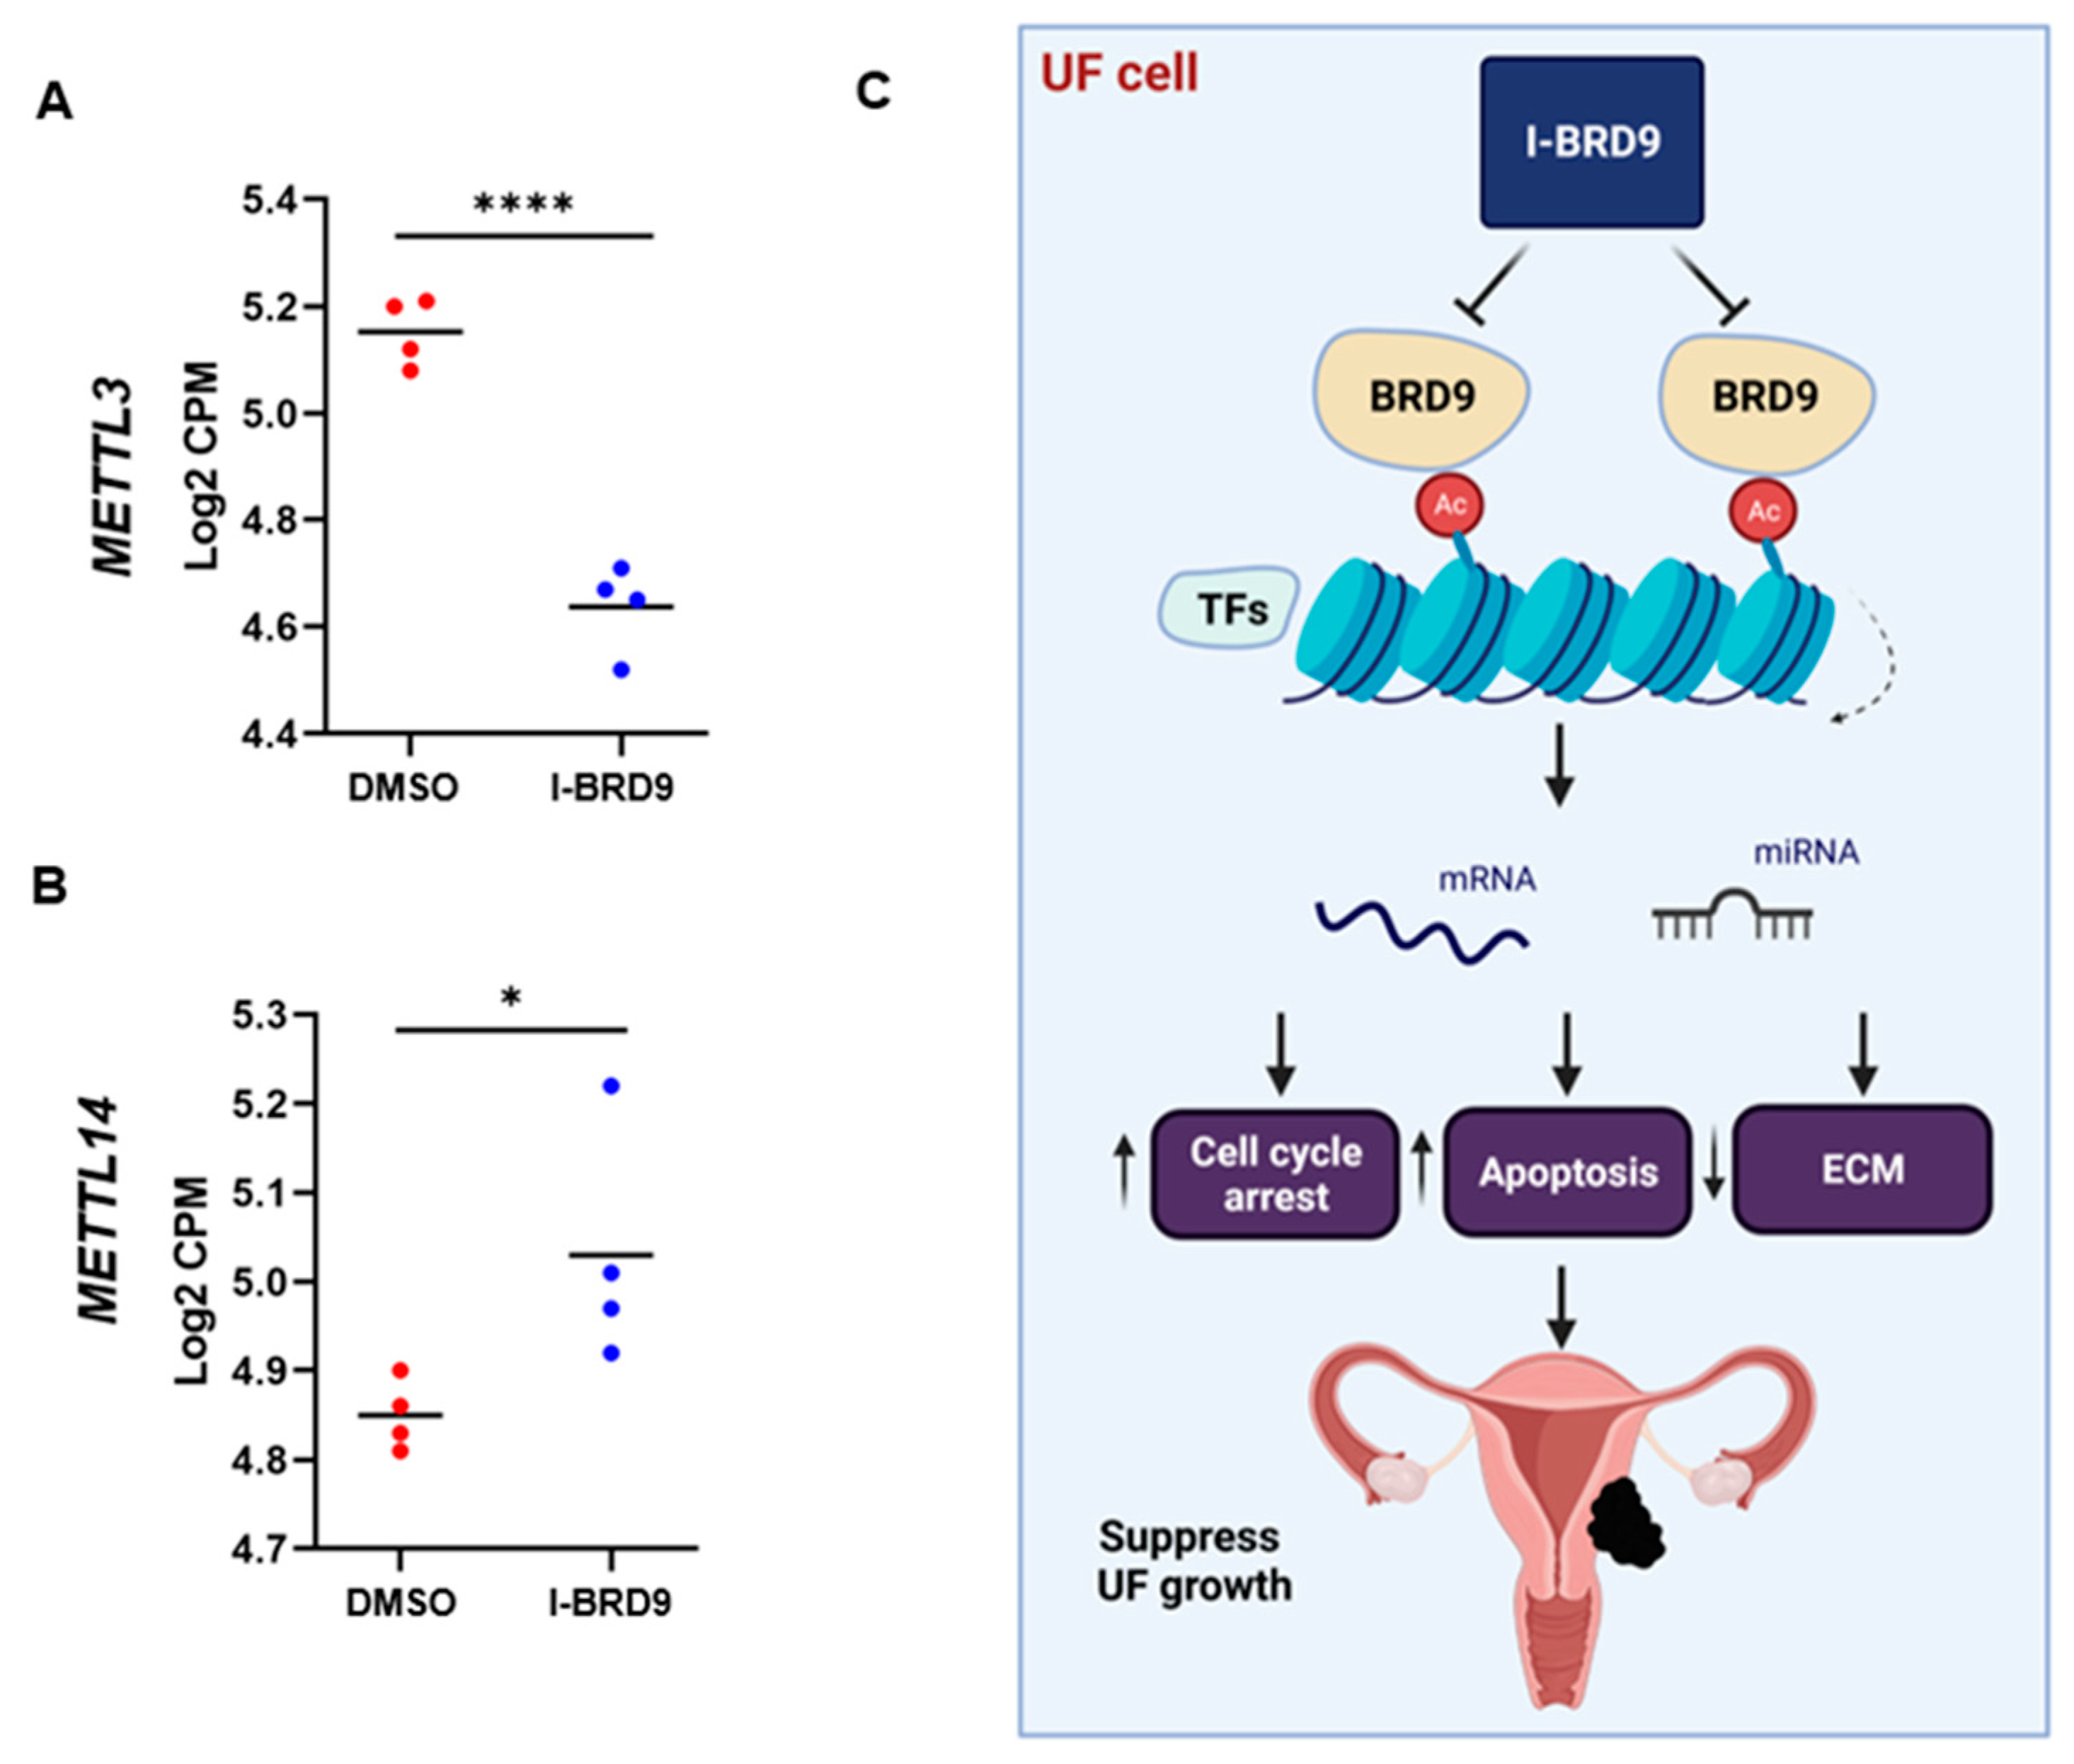

Table 1.
Antibodies used in the study.
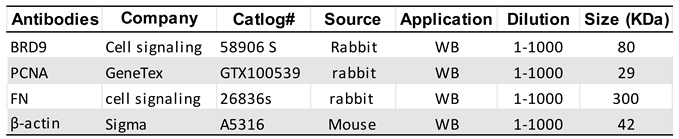 |
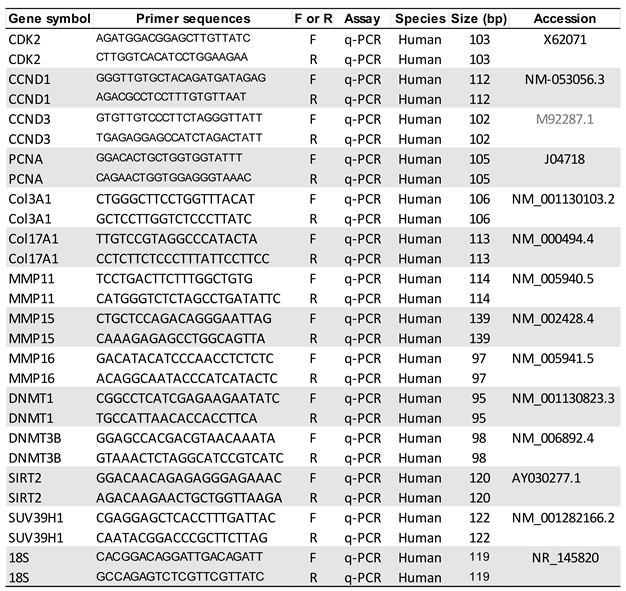
Table 2.
Primers used in the study.
 |
Disclaimer/Publisher’s Note: The statements, opinions and data contained in all publications are solely those of the individual author(s) and contributor(s) and not of MDPI and/or the editor(s). MDPI and/or the editor(s) disclaim responsibility for any injury to people or property resulting from any ideas, methods, instructions or products referred to in the content. |
© 2023 by the authors. Licensee MDPI, Basel, Switzerland. This article is an open access article distributed under the terms and conditions of the Creative Commons Attribution (CC BY) license (http://creativecommons.org/licenses/by/4.0/).
Copyright: This open access article is published under a Creative Commons CC BY 4.0 license, which permit the free download, distribution, and reuse, provided that the author and preprint are cited in any reuse.


