Preprint
Article

This version is not peer-reviewed.

Biochemical and Pharmacological Studies in the Helix pomatia—Snail Memory Model

Submitted:

18 December 2025

Posted:

19 December 2025

You are already at the latest version

Abstract

Kynurenic acid (KYNA) is a byproduct of the kynurenine pathway, which breaks down the amino acid tryptophan. KYNA acts as an antagonist of glutamate ionotropic excitatory amino acid (EAA) receptors and α7 nicotinic acetylcholine receptors (nAChRs). There is evidence that KYNA plays a significant role in various pathological conditions and the ageing process. It has also been suggested that KYNA contributes to memory impairment. This study investigated the impact of L-kynurenine, D-cycloserine, and Cerebrolysin on KYNA synthesis in the liver homogenate of Helix pomatia snails in vitro and in their ganglia in vivo. Furthermore, a memory model was established using these snails, wherein tentacle shortening served as an indicator of memory activity. In vitro experiments on Helix pomatia demonstrated the significant impact of L-kynurenine and anti-dementia drugs on KYNA synthesis. KYNA levels increased significantly in the presence of L-kynurenine, a bio-precursor, in liver homogenate. However, KYNA formation decreased when anti-dementia drugs, including Cerebrolysin or D-cycloserine, were administered to the snails’ liver homogenate. L-kynurenine has been shown to impair memory in vivo in snails, but an anti-dementia drug has been demonstrated to reverse this effect. Significant inhibition of tentacle lowering was observed in response to L-kynurenine treatment, which corresponded with elevated KYNA levels in the central nervous system. Administering D-cycloserine or Cerebrolysin alongside L-kynurenine reversed its effects. The Helix pomatia memory model is a valuable tool for studying learning and memory in various conditions and in the presence of different pharmacological agents. A drug or natural extract that blocks KYNA synthesis could be considered an anti-dementia agent. It may also protect against ageing and delay damage to the central nervous system related to memory.

Keywords: 
;  ;  ;  ;  ;  ;  ;  ;  ;  

1. Introduction

As previously demonstrated in 1996, increased kynurenic acid (KYNA) formation has been observed in patients diagnosed with Alzheimer’s disease (AD) [1]. This finding has since been confirmed in later studies [2,3,4,5]. A substantial body of research supports the correlation between elevated KYNA metabolism and memory impairment.
KYNA is a product of tryptophan degradation along kynurenine pathway (Figure 1), and acts as an endogenous antagonist of glutamate ionotropic excitatory amino acid receptors: N-methyl-D-aspartate (NMDAR) and α-amino-3-hydroxy-5-methyl-4-isoxazolepropionic acid (AMPA), 5-methylisoxazole-4-propionic acid (kainate) [6,7], and nicotinic acetylcholine receptors subtype (α7nAChR) [8]. However, KYNA is also an agonist at the orphan G protein-coupled receptor (GPR35 [9,10]), and exhibits anticonvulsant and neuroprotective properties [11,12]. There is evidence that the physiologically relevant concentrations of KYNA from low nanomolar to low micromolar [6,10] are likely to block α-7nAChR and NMDA receptors [12,13,14]. According to the hypothesis proposed by Greenmayer et al. in 1988 and supported by others, glutamatergic transmission plays an important role in the neuropathic mechanisms and symptoms of dementia [6,15]. We recently described the importance of KYNA in neurological disorders and demonstrated that elevated levels of KYNA in the central nervous system (CNS) may be involved in cognitive decline [16]. Elevated KYNA levels have also been found in normal elderly people [17]. Together with the proposed role of the glutamate receptor blockade [6,7,8], this suggests a potential role for KYNA in combating cognitive and/or learning impairments [18,19,20,21].
Learning ability naturally declines with age and is associated with neurodegenerative diseases that are characterized by increased KYNA metabolism in the central nervous system (CNS) and/or periphery [16]. Knowledge of KYNA as a tryptophan metabolite in the kynurenine pathway (see Figure 1) and as an antagonist of the ionotropic glutamate and alpha-7 nicotinic acetylcholine receptor subtypes is well documented [6,7,14]. However, controversy remains regarding the actions of KYNA [22]
The KYNA is synthesized from L-kynurenine through the action of kynurenine aminotransferases (KATs). Initially identified in the periphery, KATs were subsequently found in the CNS of mammals [23,24,25]. In previous work, my co-worker, Kepplinger, and I demonstrated that anti-dementia drugs, such as Cerebrolysin and D-cycloserine, reduce KYNA formation by inhibiting enzymes involved in KYNA synthesis, including KATs [26,27]. Furthermore, in vitro studies have shown that the presence of meat and certain herbs also impedes KAT activity [28,29,30]. Analysis of accumulated data suggests that dietary restriction might influence KYNA levels in the CNS. Indeed, a recent study by Vohra et al. (2017) [19] showed that a lack of KYNA induced by dietary restriction resulted in N-methyl-D-aspartate receptor (NMDAR) activation in a pair of critical interneurons involved in learning.
Historically, snails have been used as a food supplement [31]. Furthermore, snails have gained prominence in scientific research focused on studying the learning process, as Acebes et al. (2012) have highlighted [32]. The relatively simple central nervous systems of invertebrates make them ideal subjects for studying the biological basis of learning and memory at the molecular level [33].
Scientists have demonstrated that invertebrate species, such as the Helix aspersa snail, can learn to anticipate the presentation of food (US) through olfactory cues (CS). They employed the tentacle-lowering response as an index of learning [34]. A recently published study showed that snail tissue can synthesize KYNA in the CNS and periphery [35]. Given KYNA’s presence in the mammalian brain [36] and its regulation by the blood–brain barrier [37], snails could be valuable models for studying the link between KYNA synthesis and memory impairment. This phenomenon may be due to the relatively underdeveloped blood–brain barrier in these subjects, which allows pharmaceutical agents to permeate the ganglia [33].
The objective of this in vitro study was to examine alterations in kynurenine metabolism in Helix pomatia snail liver homogenate by quantifying KYNA and/or KATs in the presence of various pharmacological treatments, including L-kynurenine, Cerebrolysin, and D-cycloserine. The present study examined the influence of pharmacological treatment on the tentacle reduction response in the Helix pomatia snail. This response is used as an index of learning, attention, and alertness. Finally, an investigation was conducted into the alterations of KYNA in the snail brain homogenate. The evaluation encompassed the assessment of learning and memory capacity.

2. Materials and Methods

2.1. Compounds

The following compounds were purchased from Sigma-Aldrich Handel’s GmbH, Vienna, Austria: L-kynurenine (L-KYN), kynurenic acid (KYNA), pyruvate, pyridoxal-5′-phosphate, 2-amino-2-methyl-1-propanol (AMPOL), and D-cycloserine. Cerebrolysin was obtained from EBEWE Pharma in Unterach, Austria. It is produced by standardized, controlled enzymatic digestion of lipid-free porcine brain proteins and consists of free amino acids and peptides with molecular weights of less than 10 kD. In solution, it contains 40 mg of dry substance per mL with a nitrogen content of 5.3 mg. All other chemicals used were of the highest commercial purity.

2.2. Animals

The snails (Helix pomatia) were obtained from Gugumuck in Vienna, Austria. They were housed in large groups in an indoor enclosure with free access to vegetables, such as lettuce and carrots, and were exposed to a 12 h light/dark cycle. The enclosure was watered daily to maintain optimal humidity.

2.3. Methods

2.3.1. Age Determination of Snails ARS—Middle-Aged Group of Snails

The age of the snails was determined according to an Age Rating Scale (ARS), which consists of the measurement of several individual parameters, i.e., body weight, length, width, and height of the shell, length and width of the shell opening, and the shell’s growth rings, recently described by Kronsteiner et al. (2023) [35]. This study used middle-aged snails.

2.3.2. Preparation of Region and Homogenates

Once the experiments were complete, the snails were killed by freezing at −45 °C. Then, they were stored until they were analyzed. For dissection, the snails were thawed, and the liver and nerve ring were quickly dissected on ice, as previously described [35]. The upper part, i.e., the cerebral ganglia (CG), and the lower part, i.e., the subpharyngeal ganglia (SG), which consist of the pedal, visceral, and pleural ganglia, of the esophageal nerve ring, were used to determine the parameters. The tissue was frozen on dry ice and stored at −45 °C or −80 °C.
Preparation of Homogenates
To determine KAT and KYNA levels, liver or brain tissue homogenates were prepared by adding 19 or 5 volumes of distilled water (wt/vol), respectively, homogenizing the mixture, and dividing it into two portions: one for measuring KAT activity and one for measuring KYNA levels. For KYNA measurements, the homogenates were mixed with 50% trichloroacetic acid (v/v). Denatured proteins were removed by centrifugation at 20 °C and 11,700 rpm for 20 min. Then, KYNA levels were measured by HPLC.
To determine KAT activity in the liver homogenate, tissue samples were homogenized in an ice bath with five volumes of 5 mM Tris-acetate buffer (pH 8.0), containing 50 µM pyridoxal 5′-phosphate and 10 mM mercaptoethanol (wt/vol). The homogenates were then used to determine KAT I, KAT II, and KAT III activities.

3. Biochemical Methods

3.1. KAT Assay

KAT activities were measured as previously described by Baran et al. (1999) [1]. Briefly, the reaction mixture contains a homogenate, 2 µM L-kynurenine, 1 mM pyruvate, 70 µM pyridoxal 5′-phosphate, and either 150 mM AMPOL buffer (pH 9.6) for KAT I, 150 mM Tris-acetate buffer (pH 8.0) for KAT III, or 150 mM Tris-acetate buffer (pH 7.4) for KAT II. The total volume was 0.2 mL. After incubating for two hours at 37 °C (pilot experiments demonstrated the linearity of enzyme activity up to 18 h), we terminated the reaction by adding 10 µL of 50% trichloroacetic acid (TCA). We added 1 mL of 0.1 M HCl and centrifuged for 10 min to remove denatured proteins. If necessary, we applied the supernatant to a DOWEX 50 W anion exchange column, as described by Turski et al. (1989) [38]. KYNA eluted from the column was determined by HPLC. Blanks are obtained by adding 10 µL of 50% TCA prior to incubation at 37 °C.

3.2. High-Performance Liquid Chromatography (HPLC) Method for KYNA Detection

KYNA measurements were performed according to the method described by Swartz et al. (1990) [39], with the modifications described by Baran et al. (1999) applied [1]. The HPLC system consisted of the following components: a Merck Hitachi LaChrom Pump L-7100, an Autosampler L-7200, a Fluorescence Detector L-7485, and a Merck Hitachi Integrator D-7500; the equipment was sourced from Merck Hitachi, or VWR Hitachi Vienna, Austria. The mobile phase consisted of 50 mM sodium acetate, 250 mM zinc acetate, and 4% acetonitrile (pH 6.15), which was pumped through a 10 cm × 0.4 cm HR-80 C-18 column (3 µm particle size, In Chrom, Austria) at a flow rate of 1.0 mL/min. The fluorescence detector was set to an excitation wavelength of 340 nm and an emission wavelength of 398 nm. The injection volume was 50 µL. KYNA had a retention time of approximately seven minutes, with a sensitivity of 50 fmol per injection and a signal-to-noise ratio of 5.

3.3. Pharmacological Study—In Vitro

3.3.1. Synthesis of KYNA from L-Kynurenine in Snail Liver Homogenate

To verify the synthesis of KYNA from L-kynurenine via KAT I, KAT II, and KAT III activities, snail liver homogenate (1:100 wt/vol) was incubated in the presence of different concentrations of L-kynurenine (50, 100, 200, 400, 800 µM) under standard essay conditions, and the amount of KYNA formed was determined. Six independent experiments were performed.

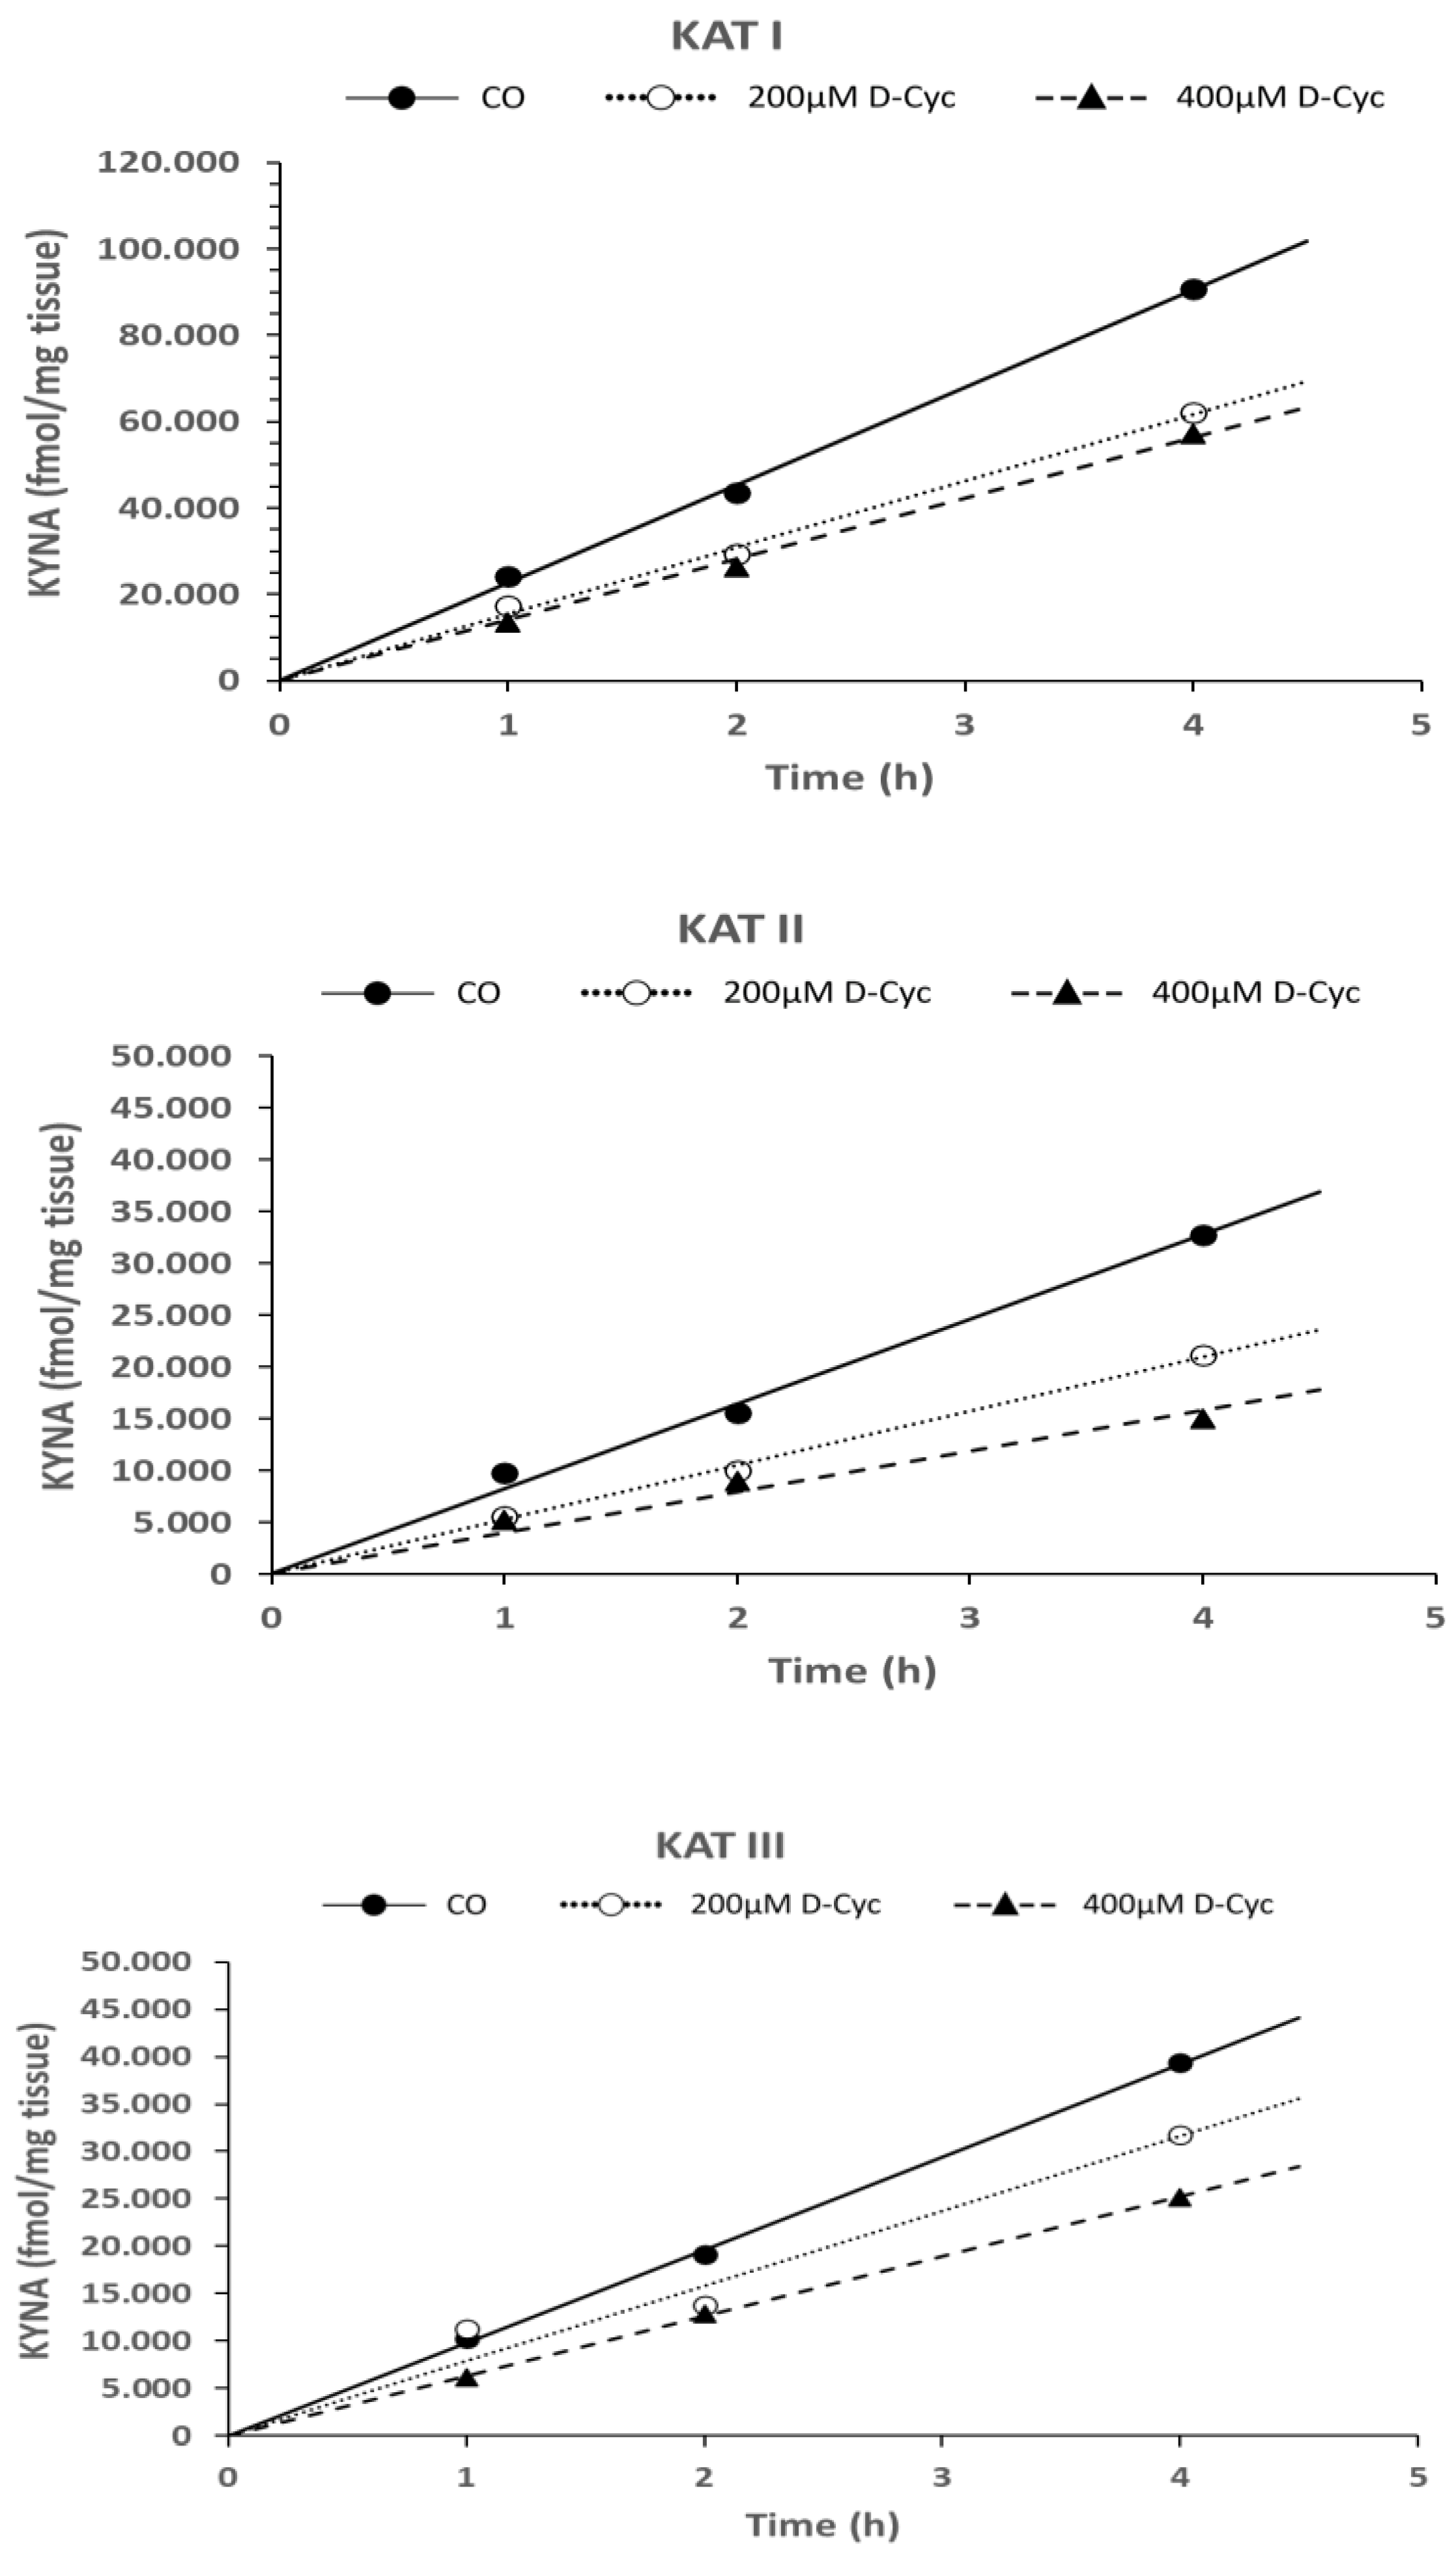
3.3.2. Effect of Cerebrolysin and D-Cycloserine on Snail Liver KAT I, KAT II, and KAT III Activities

To verify the effect of Cerebrolysin and D-cycloserine on snail liver KAT I, KAT II, and KAT III activities, snail liver homogenate (1:100 wt/vol) was incubated in the presence of different concentrations of Cerebrolysin (0.25, 1, 2.5, 5, 10, 15 µM) and D-cycloserine (50, 100, 200, 400, 800 µM) under standard assay conditions, and the amount of KYNA formed was determined. Six independent experiments were performed.

3.3.3. Time-Dependent Formation of KYNA in the Presence of L-Kynurenine, Cerebrolysin, and D-Cycloserine In Vitro

In six separate experiments, the time dependence of KYNA synthesis at 1, 2, 3, and 4 h by KAT I, KAT II, and KAT III in the presence of two different doses of L-kynurenine, Cerebrolysin and D-cycloserine was performed and evaluated.

4. Pharmacological Study—In Vivo

4.1. Effect of Treatment with L-Kynurenine, Cerebrolysin, and D-Cycloserine on KYNA

An in vivo dose–response study was performed, i.e., snails were treated with 100 µL solution of L-kynurenine (61.3 mg/mL) or Cerebrolysin (176.5 µL/mL) or D-cycloserine (5.1 mg/mL) for one or three consecutive days. The chemicals were carefully administered by drops on the body of the snail. Tentacle behaviours were observed. After the experiment, the snails were killed, and the ganglia were dissected and frozen at −40 °C until the determination of KYNA.

4.2. Experimental Design and Pharmacological Treatment In Vivo
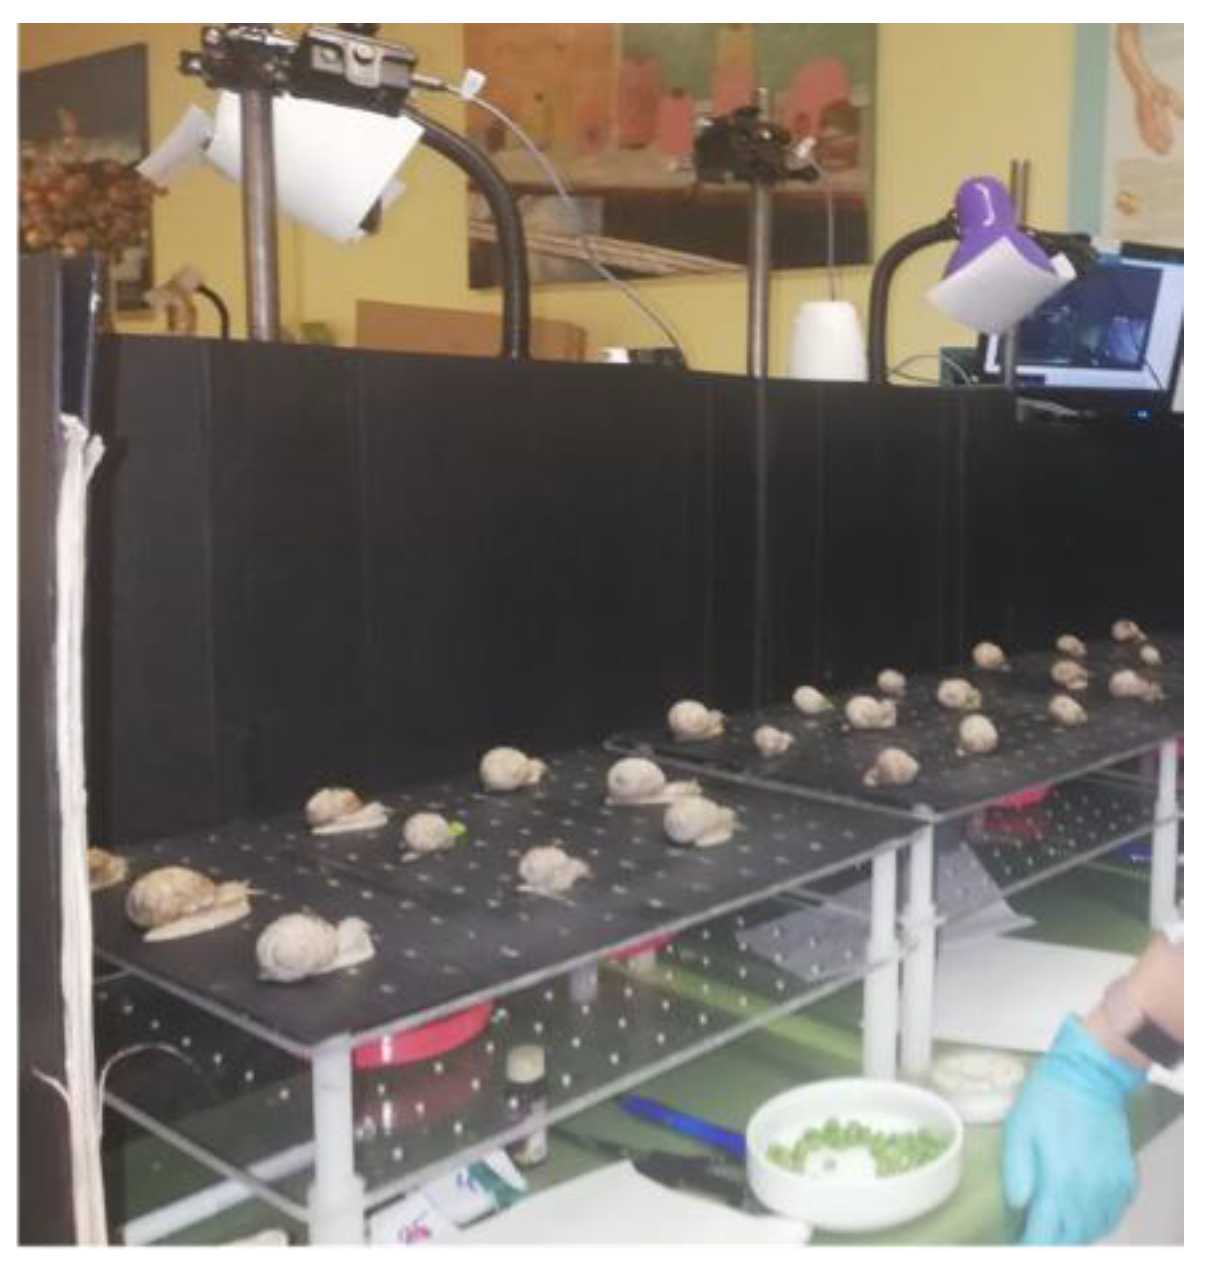
4.2.1. Behaviour

The tentacle lowering response, a parameter of behavioural change, was used as information pertaining to learning and memory ability [40,41].
The behavioural study included the detection of snail tentacle lowering before and after treatment. A camera system was installed for this purpose.

4.2.2. Experimental Treatment

For pharmacological studies, snails were transferred to individual containers per pharmacological treatment group and food-deprived for four days leading up to the start of the experiment (Figure 2).
Snails were divided into the following groups with different pharmacological treatments, as indicated in Table 1. Animals were treated with 100 µL of the solutions listed in Table 1, 1 h before the start of conditioning. The Control 1 and Control 2 groups differ in their treatment during conditioning (see Figure 2, and § 4.2.3 below). Humidity was increased by sprinkling the walls of the vessels (not the snails) with water to keep the snails moving.

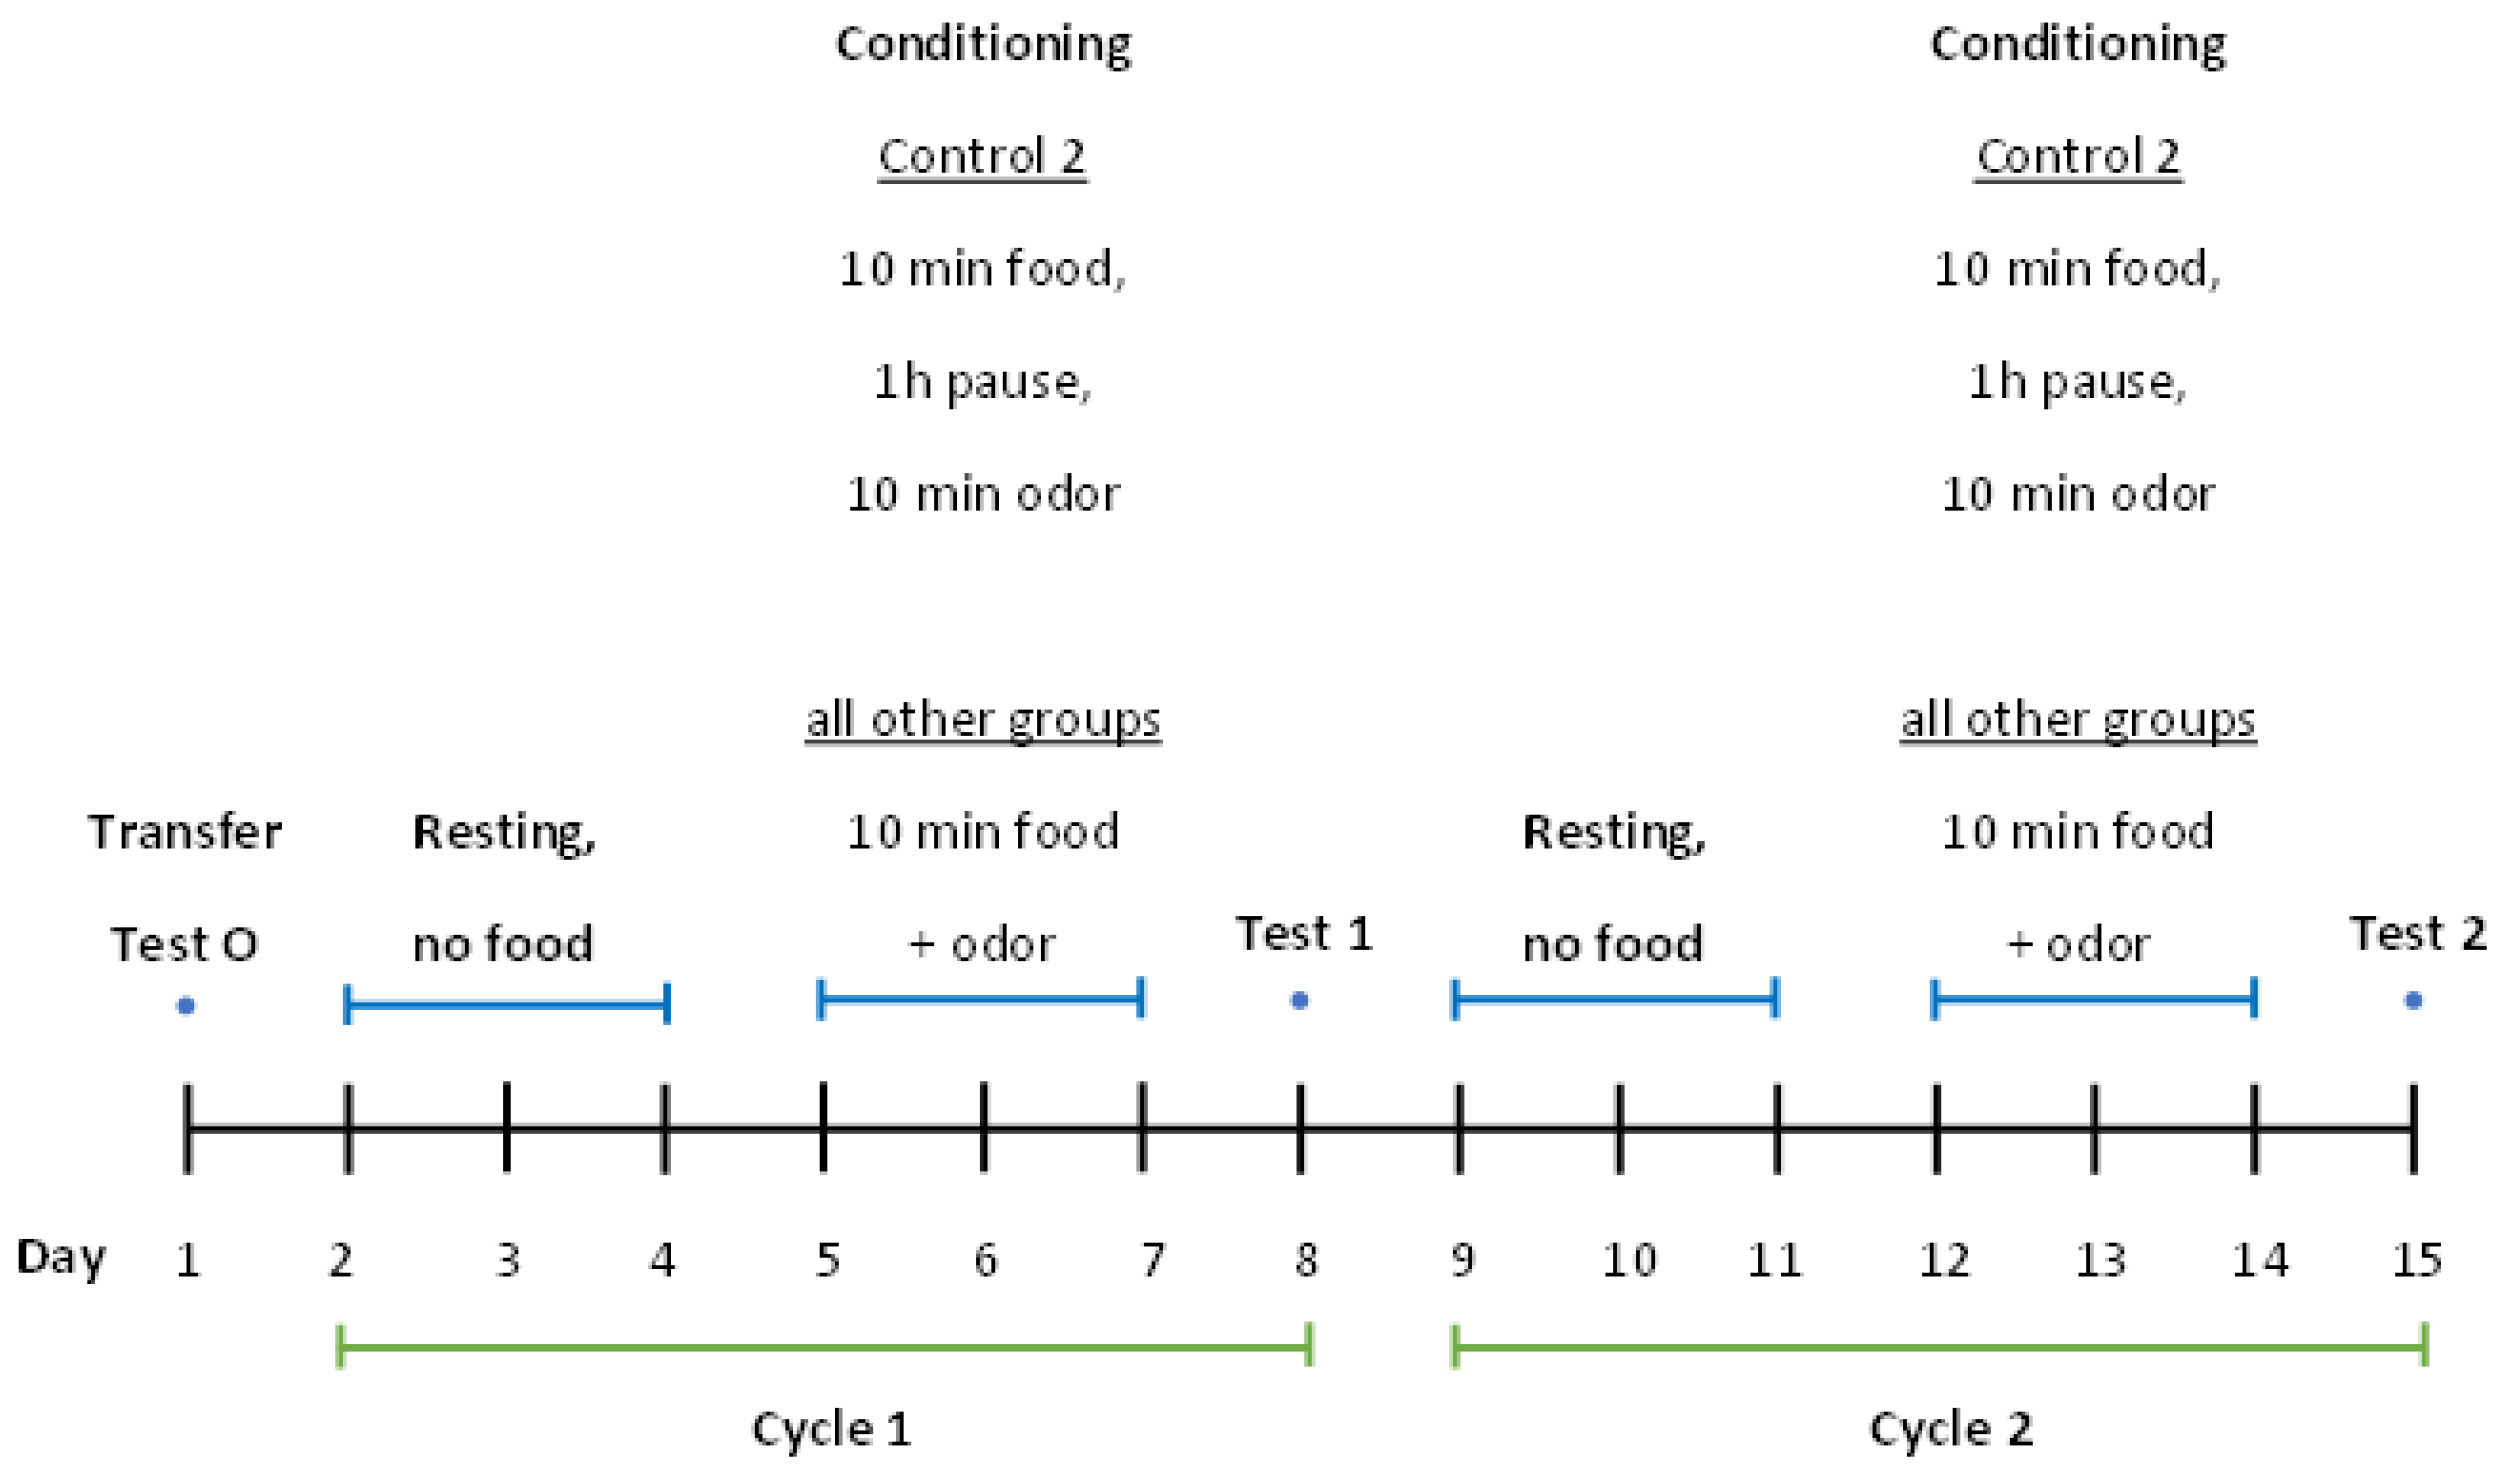
4.2.3. Time Course and Conditioning

The responses of the unconditioned snails were tested and recorded 4 days before the start of conditioning (Figure 2 Test 0), (T0). They were then transferred to their individual containers and food-deprived for four days until the start of conditioning. Conditioning lasted for the next 3 days. Conditioning and testing were performed in two cycles (Figure 2: Cycle 1, Test 1 (T1); Cycle 2, Test 2, (T2)).
Conditioning took place on days 5, 6, and 7 (three days). On day 8, the snails’ response to the odour was tested and recorded T1 (see day 8, Figure 2). On days 9, 10, and 11, the snails were allowed to rest in their containers. On days 12, 13, and 14, the snails were conditioned, and on day 15, the response to the odour was again tested and recorded T2 (see Figure 2).
For conditioning, the snails were placed on a test table (Figure 3), a plastic surface with small holes in it and legs at the edges (40 cm × 32 cm × 19.5 cm, length × width × height). Beneath the first plastic surface, at a distance of 6.8 cm, is another surface on which an odour can be placed. The scent used is Air Wick Essential Mist Relaxing Lavender. A few drops of the fragrance oil are dripped onto a piece of paper towel and placed on the second plastic surface. The fragrance oil (odour) represents the conditioned stimulus (CS). A pea is placed in front of each snail, and the animals are allowed to eat for 10 min. The pea is the unconditioned stimulus (US).
Snails of Control group 1 (CO1) were simultaneously conditioned on a plastic surface (Figure 3). Control group 2 (CO2) receives CS and US separately; i.e., the animals are placed on the plastic surface with a pea in front of each snail and allowed to eat for 10 min, but without the CS (odour). After 1 h, they are exposed to the odour for 10 min.

4.2.4. Testing

Each snail was placed separately on the same plastic surface (Figure 3) used for conditioning, with the odour placed on the bottom surface as described for the conditioning experiments. A camera (Crosstour CT 9000 Action Cam Underwater Camera (4K 16MP WiFi Underwater 40M Waterproof Helmet Camera Remote Control) (Electronics- B07F3F63SX: ZG-CT9000-NEW: 723172909023) connected to a computer was used to record the behaviour of each snail using the ManyCam software. Each snail’s response to the odour was recorded for 2 min.

4.2.5. Video Analysis

A single video contains three windows, one for each camera. The videos were edited using Adobe Premiere Pro to obtain an individual video for each snail. The position of the snails’ tentacles in each video was analyzed using the DeepLabCut software.

5. Data Analysis

All data are presented as the mean ± standard error. One-way ANOVA and Tukey’s HSD test, or Student’s t-test, were used for statistical analysis. Each sample was tested in duplicate. The levels of statistical significance are as follows: * p < 0.05, significant compared to the control group; ** p < 0.01, significant compared to the control group; *** p < 0.001, significant compared to the Control group.

6. In Vitro Study Results

6.1. Dose–Response of L-Kynurenine and Anti-Dementia Drugs in an In Vitro Assay

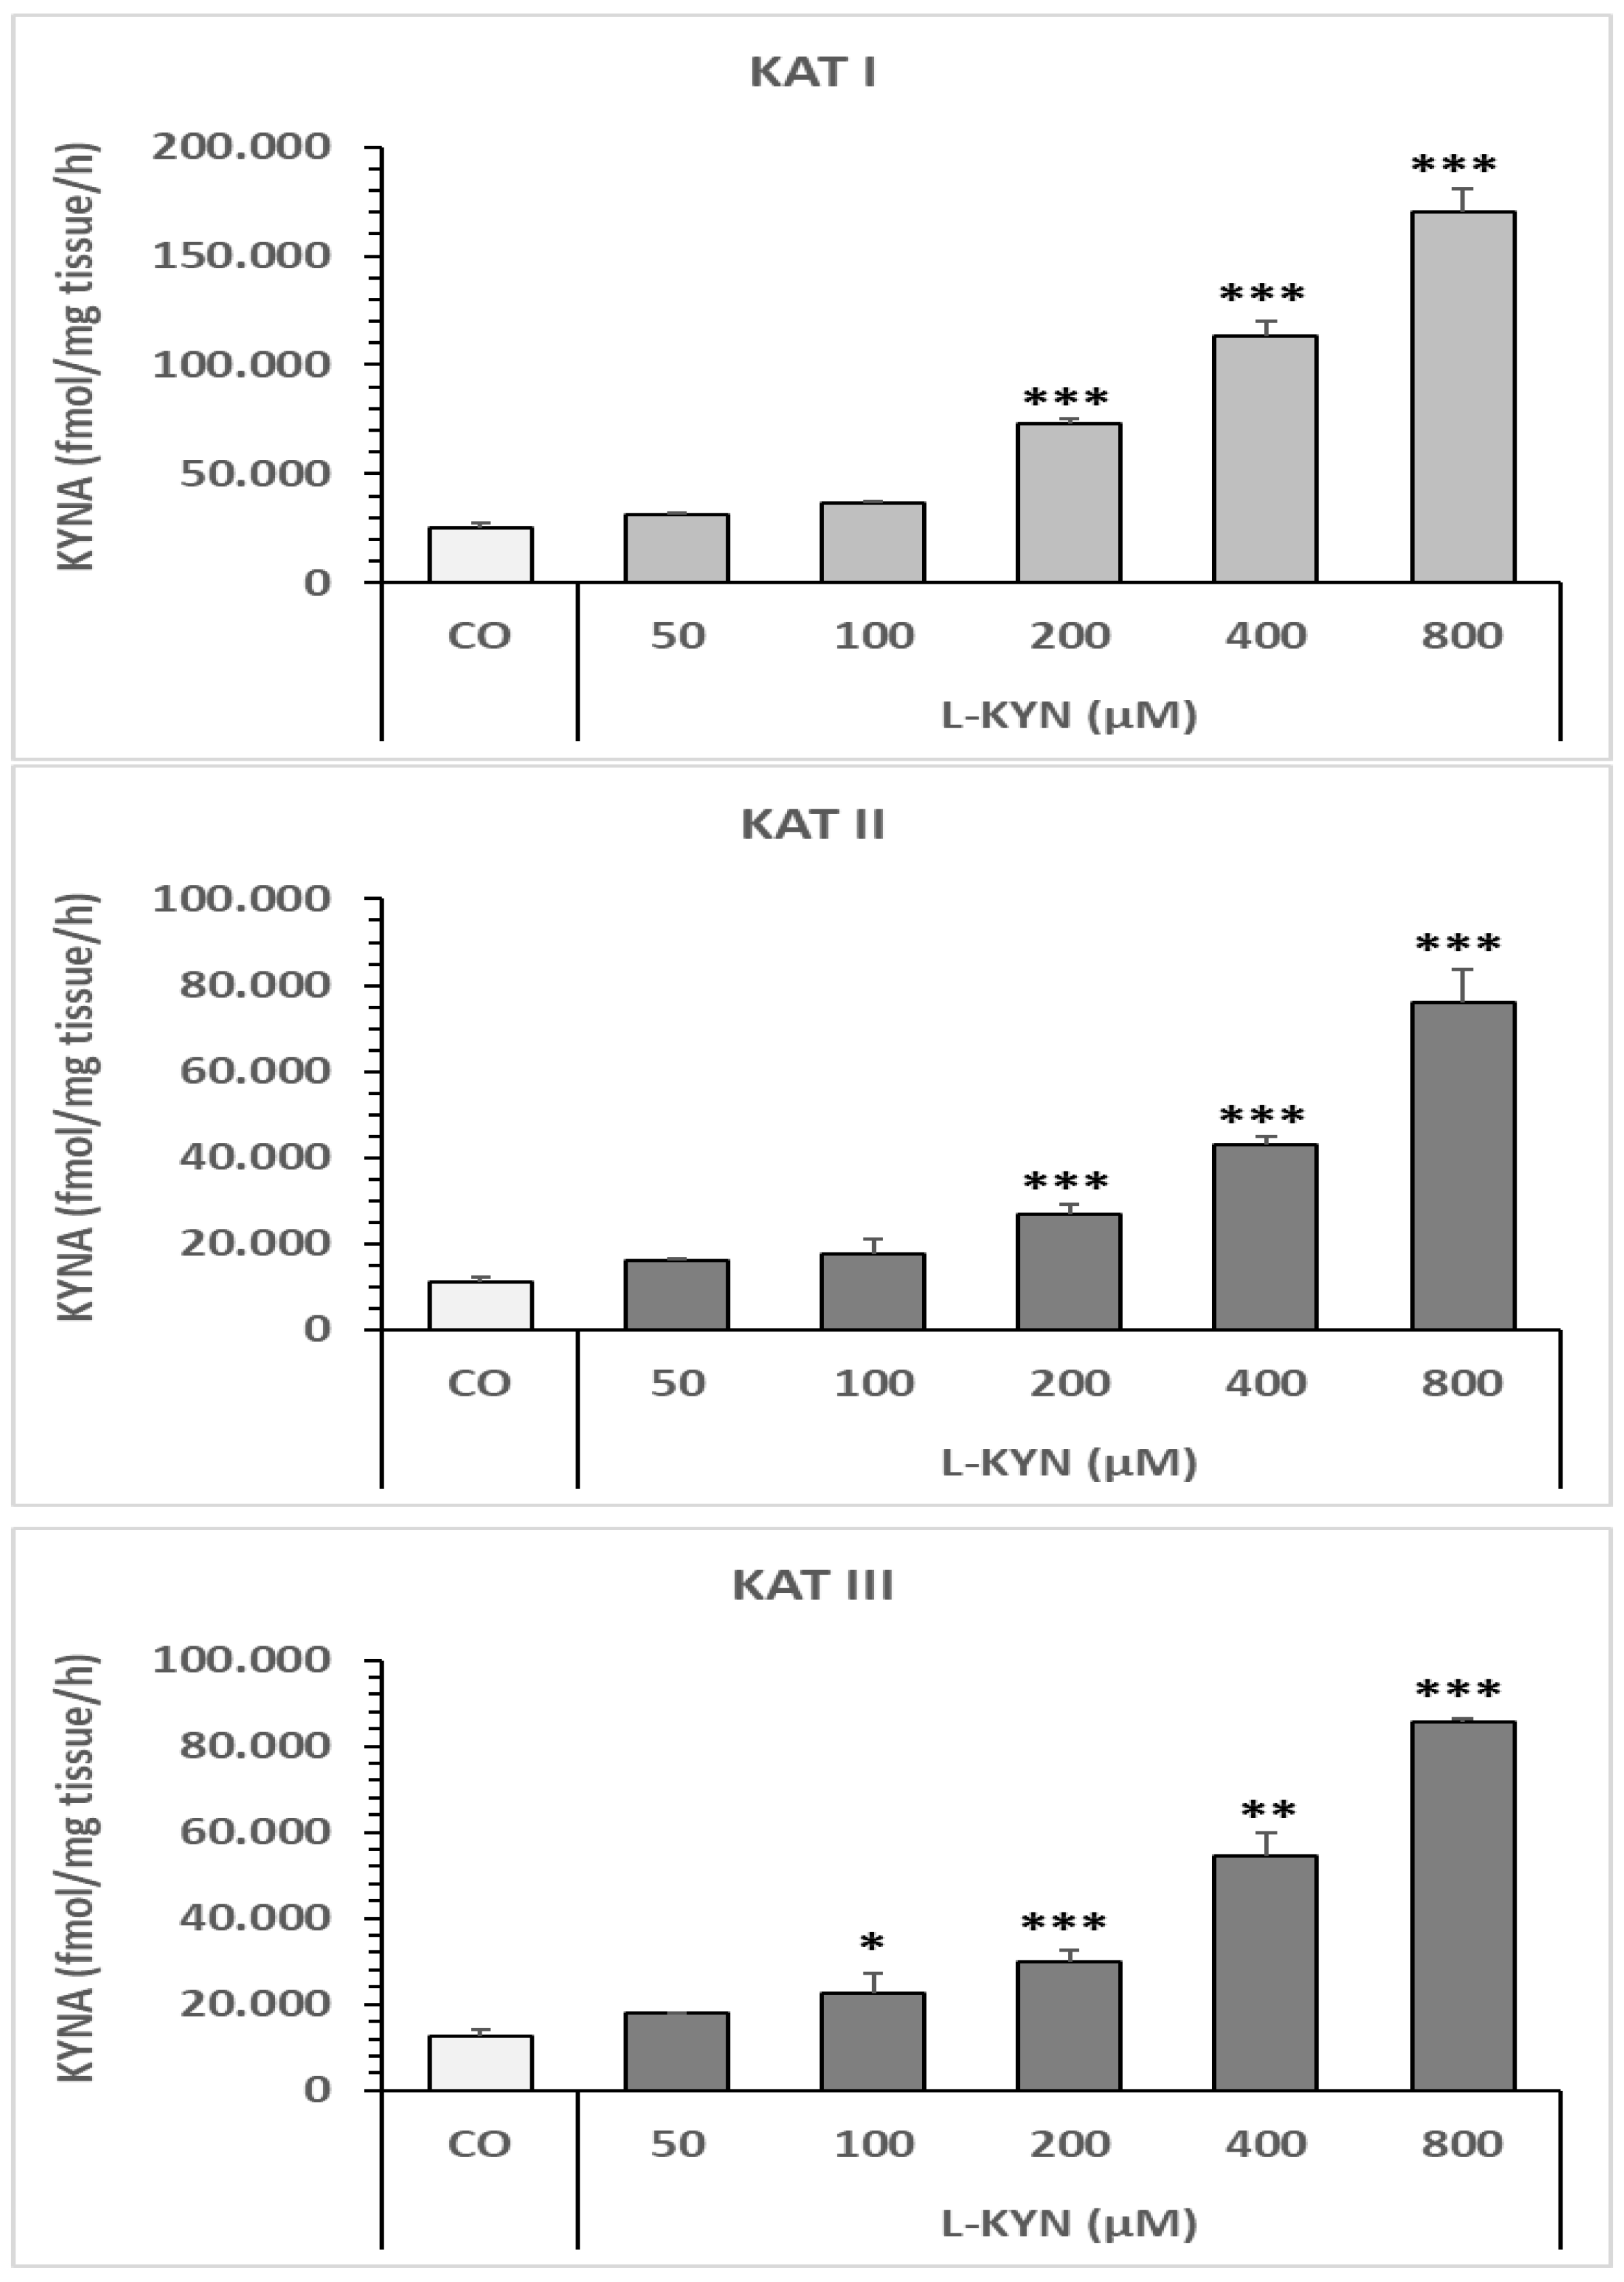
6.1.1. Effect of L-Kynurenine on Snail Liver KAT I, KAT II, and KAT III In Vitro

KYNA formation increased significantly in a dose-dependent manner in snail liver homogenate at concentrations of 50 µM, 100 µM, 200 µM, 400 µM, and 800 µM of L-kynurenine (L-KYN). KAT I was the most effective at forming KYNA, followed by KAT III and KAT II (see Figure 4).
Statistics for KAT I (Figure 4A): One-way analysis of variance (ANOVA) revealed significant differences between the Control (CO) and the different L-KYN doses for KAT I (see Figure 4A): F = 282.2938726, p = 1.59482 × 10⁻⁷. One-way ANOVA between the Control group (CO) and each L-KYN dose revealed the following significances: CO vs. 50 µM L-KYN (F = 1.05186486, p = 0.335086) and CO vs. 100 µM L-KYN (F = 3.640056383, p = 0.092888832123) were not significant; while CO vs. 200 µM L-KYN (F = 111.6820608, p = 9.55867 × 10⁻⁷), CO vs. 400 µM L-KYN (F = 165.242429278, p = 1.525777 × 10⁻⁷), and CO vs. 800 µM L-KYN (F = 282.2938726, p = 1.59482 × 10⁻⁷) were significant.
The following significances were shown by a Student’s t-test: CO vs. 50 µM L-KYN was not significant (t = −2.1011290035, p = 0.070978752); CO vs. 100 µM was significant (t = −3.801752258, p = 0.005299061); CO vs. 200 µM was significant (t = −13.17992206, p = 1.257944 × 10⁻⁷); CO vs. 400 µM was significant (t = −10.4171815, p = 0.000555758); CO vs. 800 µM was significant (t = −16.8016036, p = 1.59482 × 10⁻⁷).
Statistics for KAT II (Figure 4B): A one-way ANOVA revealed significant differences between CO and the various L-KYN doses for KAT II (Figure 4B); F = 52.68940622, p = 9.4466663 × 10⁻¹⁰. A one-way ANOVA of CO and each L-KYN dose revealed the following significances: CO vs. 50 µM L-KYN (F = 2.726821631, p = 0.133070219) and CO vs. 100 µM L-KYN (F = 3.414248142, p = 0.097697226) were not significant; while CO vs. 200 µM L-KYN (F = 34.33469187, p = 0.000109354), CO vs. 400 µM L-KYN (F = 170.901631, p = 4.801344 × 10⁻⁸), and CO vs. 800 µM L-KYN (F = 163.6580978, p = 4.45661 × 10⁻⁷) were statistically significant.
A Student’s t-test showed the following significances: CO vs. 50 µM L-KYN: significant, t = −3.426389432, p = 0.007566512; CO vs. 100 µM L-KYN: not significant, t = −1.300598306, p = 0.392970733; CO vs. 200 µM L-KYN: significant, t = −5.386028858, p = 0.003194298; CO vs. 400 µM L-KYN: significant, t = −13.72122736, p = 4.62107 × 10⁻⁶; CO vs. 800 µM L-KYN: significant, t = −12.79289286, p = 4.45661 × 10⁻⁷.
Statistics for KAT III (Figure 4C): One-way ANOVA revealed significant differences between CO and different doses of L-KYN for KAT III (Figure 4C); F = 45.61672269, p = 2.93378 × 10⁻9. One-way ANOVA between CO and each dose of L-KYN revealed the following significances: CO vs. 50 µM L-KYN and CO vs. 100 µM L-KYN were not significant (F = 2.017346562, p = 0.189212631; F = 2.017346562, p = 0.189212631, respectively); while CO vs. 200 µM L-KYN, CO vs. 400 µM L-KYN, and CO vs. 800 µM L-KYN were significant (F = 27.43334038, p = 0.000277609; F = 80.2562474, p = 2.19167 × 10⁻⁶; and F = 404.1630581, p = 8.67423 × 10⁻⁹, respectively).
Student’s t-test showed the following significances: CO vs. 50 µM L-KYN was significant: t = −3.140392115, p = 0.013795142; CO vs. 100 µM L-KYN was not significant: t = −1.532051659, p = 0.345427847; CO vs. 200 µM L-KYN was significant: t = −4.641790036, p = 0.007046006; CO vs. 400 µM L-KYN was significant: t = −8.95908783, p = 2.19167 × 10⁻⁶ and CO vs. 800 µM L-KYN was significant: t = −39.0916754, p = 2.98028 × 10⁻¹⁰.

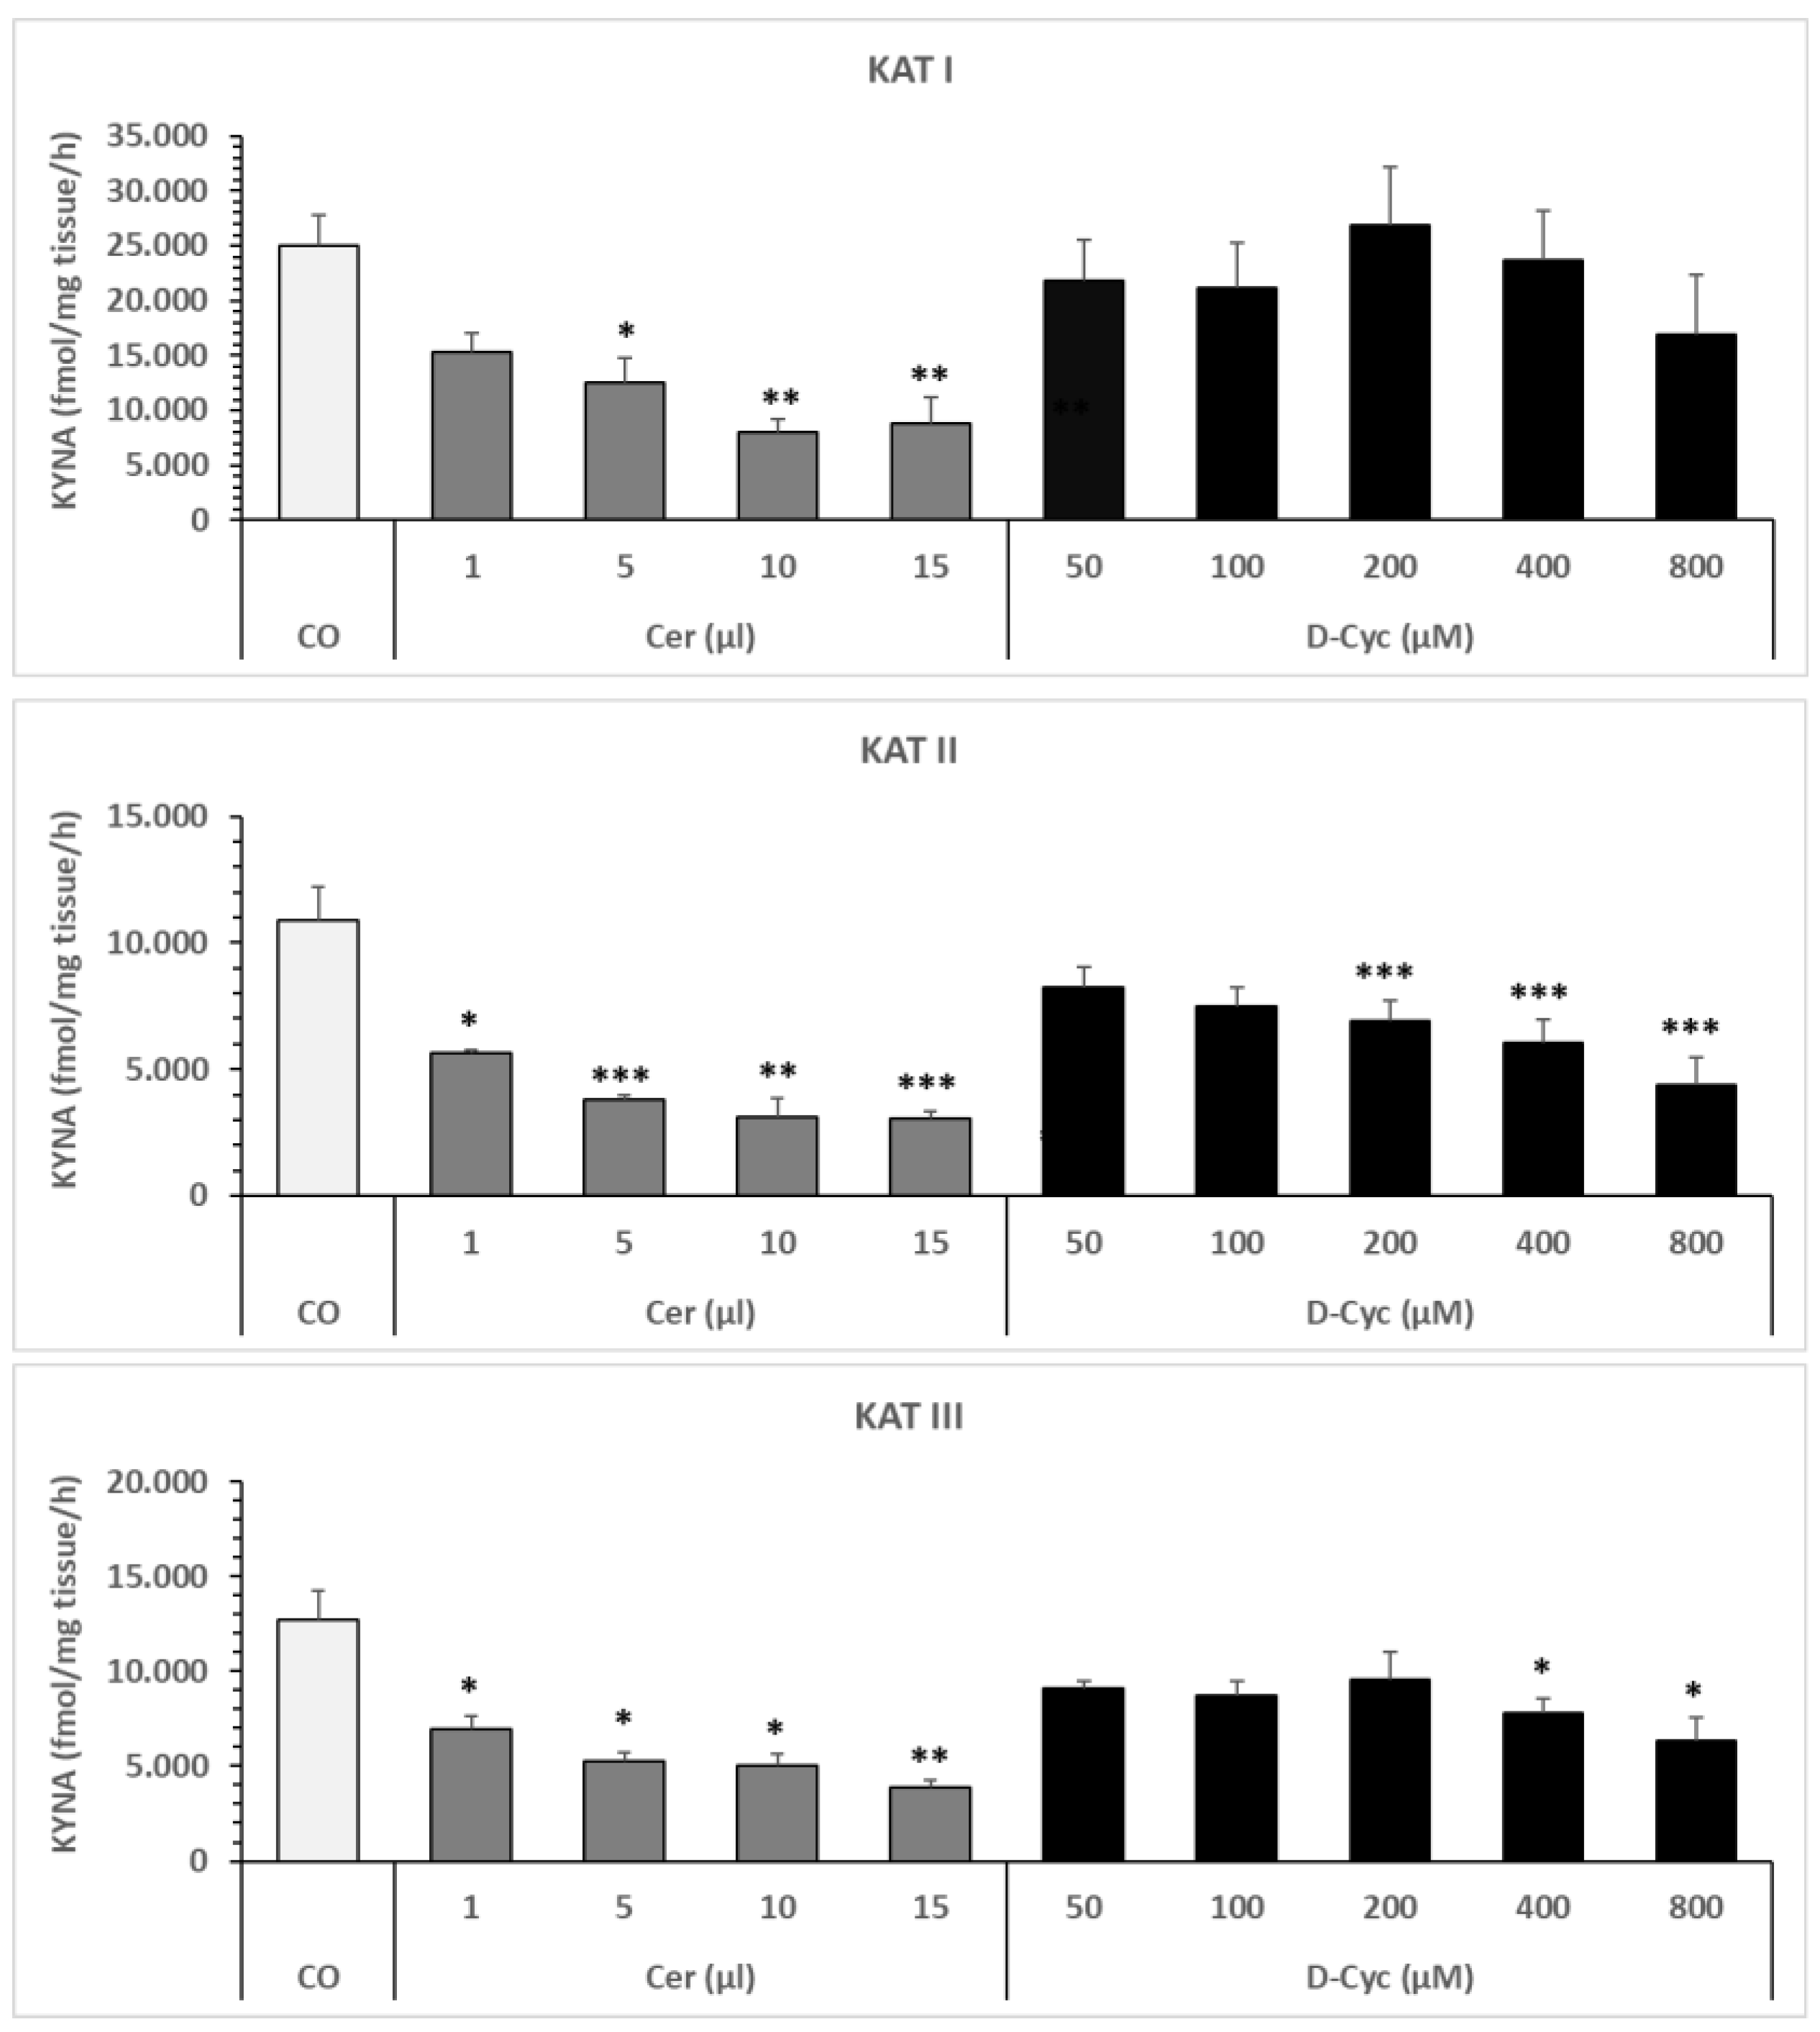
6.1.2. Effect of Cerebrolysin or D-Cycloserine on Snail Liver KAT I, KAT II, and KAT III In Vitro

Cerebrolysin significantly reduced the formation of KYNA via inhibition of KAT I, KAT II, and KAT III activities in snail liver homogenate in a dose-dependent manner (see Figure 5A–C, left). Boiled Cerebrolysin had no effect on KYNA formation.
D-cycloserine significantly decreased KYNA synthesis in a dose-dependent manner (50 µM, 100 µM, 200 µM, 400 µM, and 800 µM) in liver homogenate (Figure 5A–C, right). The inhibitory effect was strongest on KAT II (Figure 5B) and weaker on KAT III (Figure 5C). KAT I was moderately affected by D-cycloserine, though not significantly (Figure 5A). No effect on KYNA formation was observed under standard assay condition in the presence with boiled Cerebrolysin (data not shown).
Statistics for KAT I, Cer (Figure 5A, left): A one-way ANOVA revealed significant differences between CO and all doses of Cer for KAT I (Figure 5A); F = 7.492689167, p = 0.000845609. A one-way ANOVA of KAT I between CO and each dose of Cer revealed the following significances: CO vs. 1 µL was not significant (F = 4.564555071, p = 0.058380143); CO vs. 5 µL was significant (F = 7.151487928, p = 0.02332272); CO vs. 10 µL was significant (F = 14.77383354, p = 0.003245556); and CO vs. 15 µL was significant (F = 11.8844931, p = 0.006253477).
A Student’s t-test for KAT I between CO and Cer showed the following significances: CO vs. 1 µL was not significant (t = 2.725690528, p = 0.021366938); CO vs. 5 µL was significant (t = 3.124692324, p = 0.012085469); CO vs. 10 µL was significant (t = 5.203371108, p = 0.000528828); and CO vs. 15 µL was significant (t = 4.0445319, p = 0.0028803359).
Statistics for KAT II, Cer (Figure 5B, left). A one-way ANOVA revealed significant differences between CO and all doses of Cer for KAT II (Figure 5B); F = 9.685168643, p = 0.00015902. A one-way ANOVA of KAT II between CO and each dose of Cer revealed the following significances: CO vs. 1 µL, F = 5.864217012, p = 0.033909768; CO vs. 5 µL, F = 10.67198871, p = 0.007507721; CO vs. 10 µL, F = 12.09122266, p = 0.00517351; and CO vs. 15 µL, F = 12.8982009, p = 0.004233177.
A Student’s t-test for KAT II between CO and Cer showed the following significances: CO vs. 1 µL: t = 2.421615085, p = 0.033909735; CO vs. 5 µL: t = 3.26680087, p = 0.007507722; CO vs. 10 µL: t = 4.716999449, p = 0.000632928; CO vs. 15 µL: t = 3.59140664, p = 0.004233176.
Statistics for KAT III, Cer (Figure 5C, left). A one-way ANOVA revealed significant differences in KAT III (Figure 5C) between CO and all doses of Cer; F = 7.955090864, p = 0.00052363. A one-way ANOVA of KAT III between CO and each dose of Cer revealed the following significances: CO vs. 1 µL Cer, F = 5.1155001432, p = 0.044954025; CO vs. 5 µL Cer, F =8.684629431, p = 0.013281175; CO vs. 10 µL Cer, F =9.108852527, p = 0.011695613; and CO vs. 15 µL Cer, F = 12.2910309, p = 0.004919327.
A Student’s t-test for KAT III between CO and Cer showed the following significances: -CO vs. 1 µL: t = 3.150832495, p = 0.009409608; CO vs. 5 µL: t = 4.313475375, p = 0.001625943; CO vs. 10 µL: t = 4.304714575, p = 0.001411759; CO vs. 15 µL: t = 5.25350435, p = 0.000533672.
Statistics for KAT I, D-Cyc (Figure 5A, right). A one-way ANOVA for KAT I (Figure 5A) showed no significant differences between CO and all doses of D-Cyc; F = 0.389097361, p = 0.852566898. A one-way ANOVA of KAT I between CO and each dose of D-Cyc revealed the following significant results: CO vs. 50 µM D-Cyc, F = 0.366812598, p = 0.55824167; CO vs. 100 µM D-Cyc, F = 0.519830891, p = 0.487427006; CO vs. 200 µM D-Cyc, F = 0.072556347, p = 0.791320515; CO vs. 400 µM D-Cyc, F = 0.05283496, p = 0.821306762; and CO vs. 800 µM D-Cyc, F = 1.805238797, p = 0.20877293.
A Student’s t-test for KAT I between CO and D-Cyc showed the following: CO vs. 50 µM: not significant, t = 0.60547587, p = 0.566719947; CO vs. 100 µM: not significant, t = 0.691054708, p = 0.517700433; CO vs. 200 µM: not significant, t = −0.26936248, p = 0.791320796; CO vs. 400 µM: not significant, t = 0.22985868, p = 0.821306672; and CO vs. 800 µM: not significant, t = 1.165259411, p = 0.303158009.
Statistics for KAT II, D-Cyc (Figure 5B, right). A one-way ANOVA for KAT II (Figure 5B) showed significant differences between CO and all doses of D-Cyc; F = 3.559727969, p = 0.011686292. A one-way ANOVA of KAT II between CO and each dose of D-Cyc revealed the following significances: CO vs. 50 µM was not significant (F = 1.38279973, p = 0.264447856); CO vs. 100 µM was not significant (F = 2.309110205, p = 0.156825344); CO vs. 200 µM D-Cyc was significant (F = 5.329402764, p = 0.035630300); CO vs. 400 µM D-Cyc was significant (F = 7.39174044, p = 0.015850279); and CO vs. 800 µM D-Cyc was significant (F = 7.904086782, p = 0.016925441).
A Student’s t-test for KAT II between CO and D-Cyc showed the following: CO vs. 50 µM D-Cyc: not significant, t = 1.561293139, p = 0.146891886; CO vs. 100 µM D-Cyc: not significant, t = 2.042748234, p = 0.065804465, CO vs. 200 µM D-Cyc: significant, t = 2.378720529, p = 0.033081941; CO vs. 400 µM D-Cyc: significant, t = 2.78442, p = 0.01459949; and CO vs. 800 µM D-Cyc: significant, t = 3.39203395, p = 0.007567998.
Statistics for KAT III, D-Cyc (Figure 5C, right). A one-way ANOVA for KAT III (Figure 5C) showed no significant differences between CO and all doses of D-Cyc; F = 2.331065848, p = 0.065043161. A one-way ANOVA of KAT III between CO and each dose of D-Cyc revealed the following significant results: CO vs. 50 µM D-Cyc, F = 2.092875248, p = 0.175875399; CO vs. 100 µM D-Cyc, F = 2.43317178, p = 0.147081902; CO vs. 200 µM D-Cyc, F = 1.952107639, p = 0.181436461; CO vs. 400 µM D-Cyc, F = 6.8322953, p = 0.01955152; and CO vs. 800 µM D-Cyc, F = 5.791025125, p = 0.034832366.
A Student’s t-test for KAT III between CO and D-Cyc showed the following: CO vs. 50 µM D-Cyc: not significant, t = 2.138376775, p = 0.0598828642; CO vs. 100 µM D-Cyc: not significant, t = 2.181688633, p = 0.0522311599; CO vs. 200 µM D-Cyc: not significant, t = 1.397179051, p = 0.18146134; CO vs. 400 µM D-Cyc: significant, t = 2.72014405, p = 0.019016213; and CO vs. 800 µM D-Cyc: significant, t = 2.985532371, p = 0.01377247.

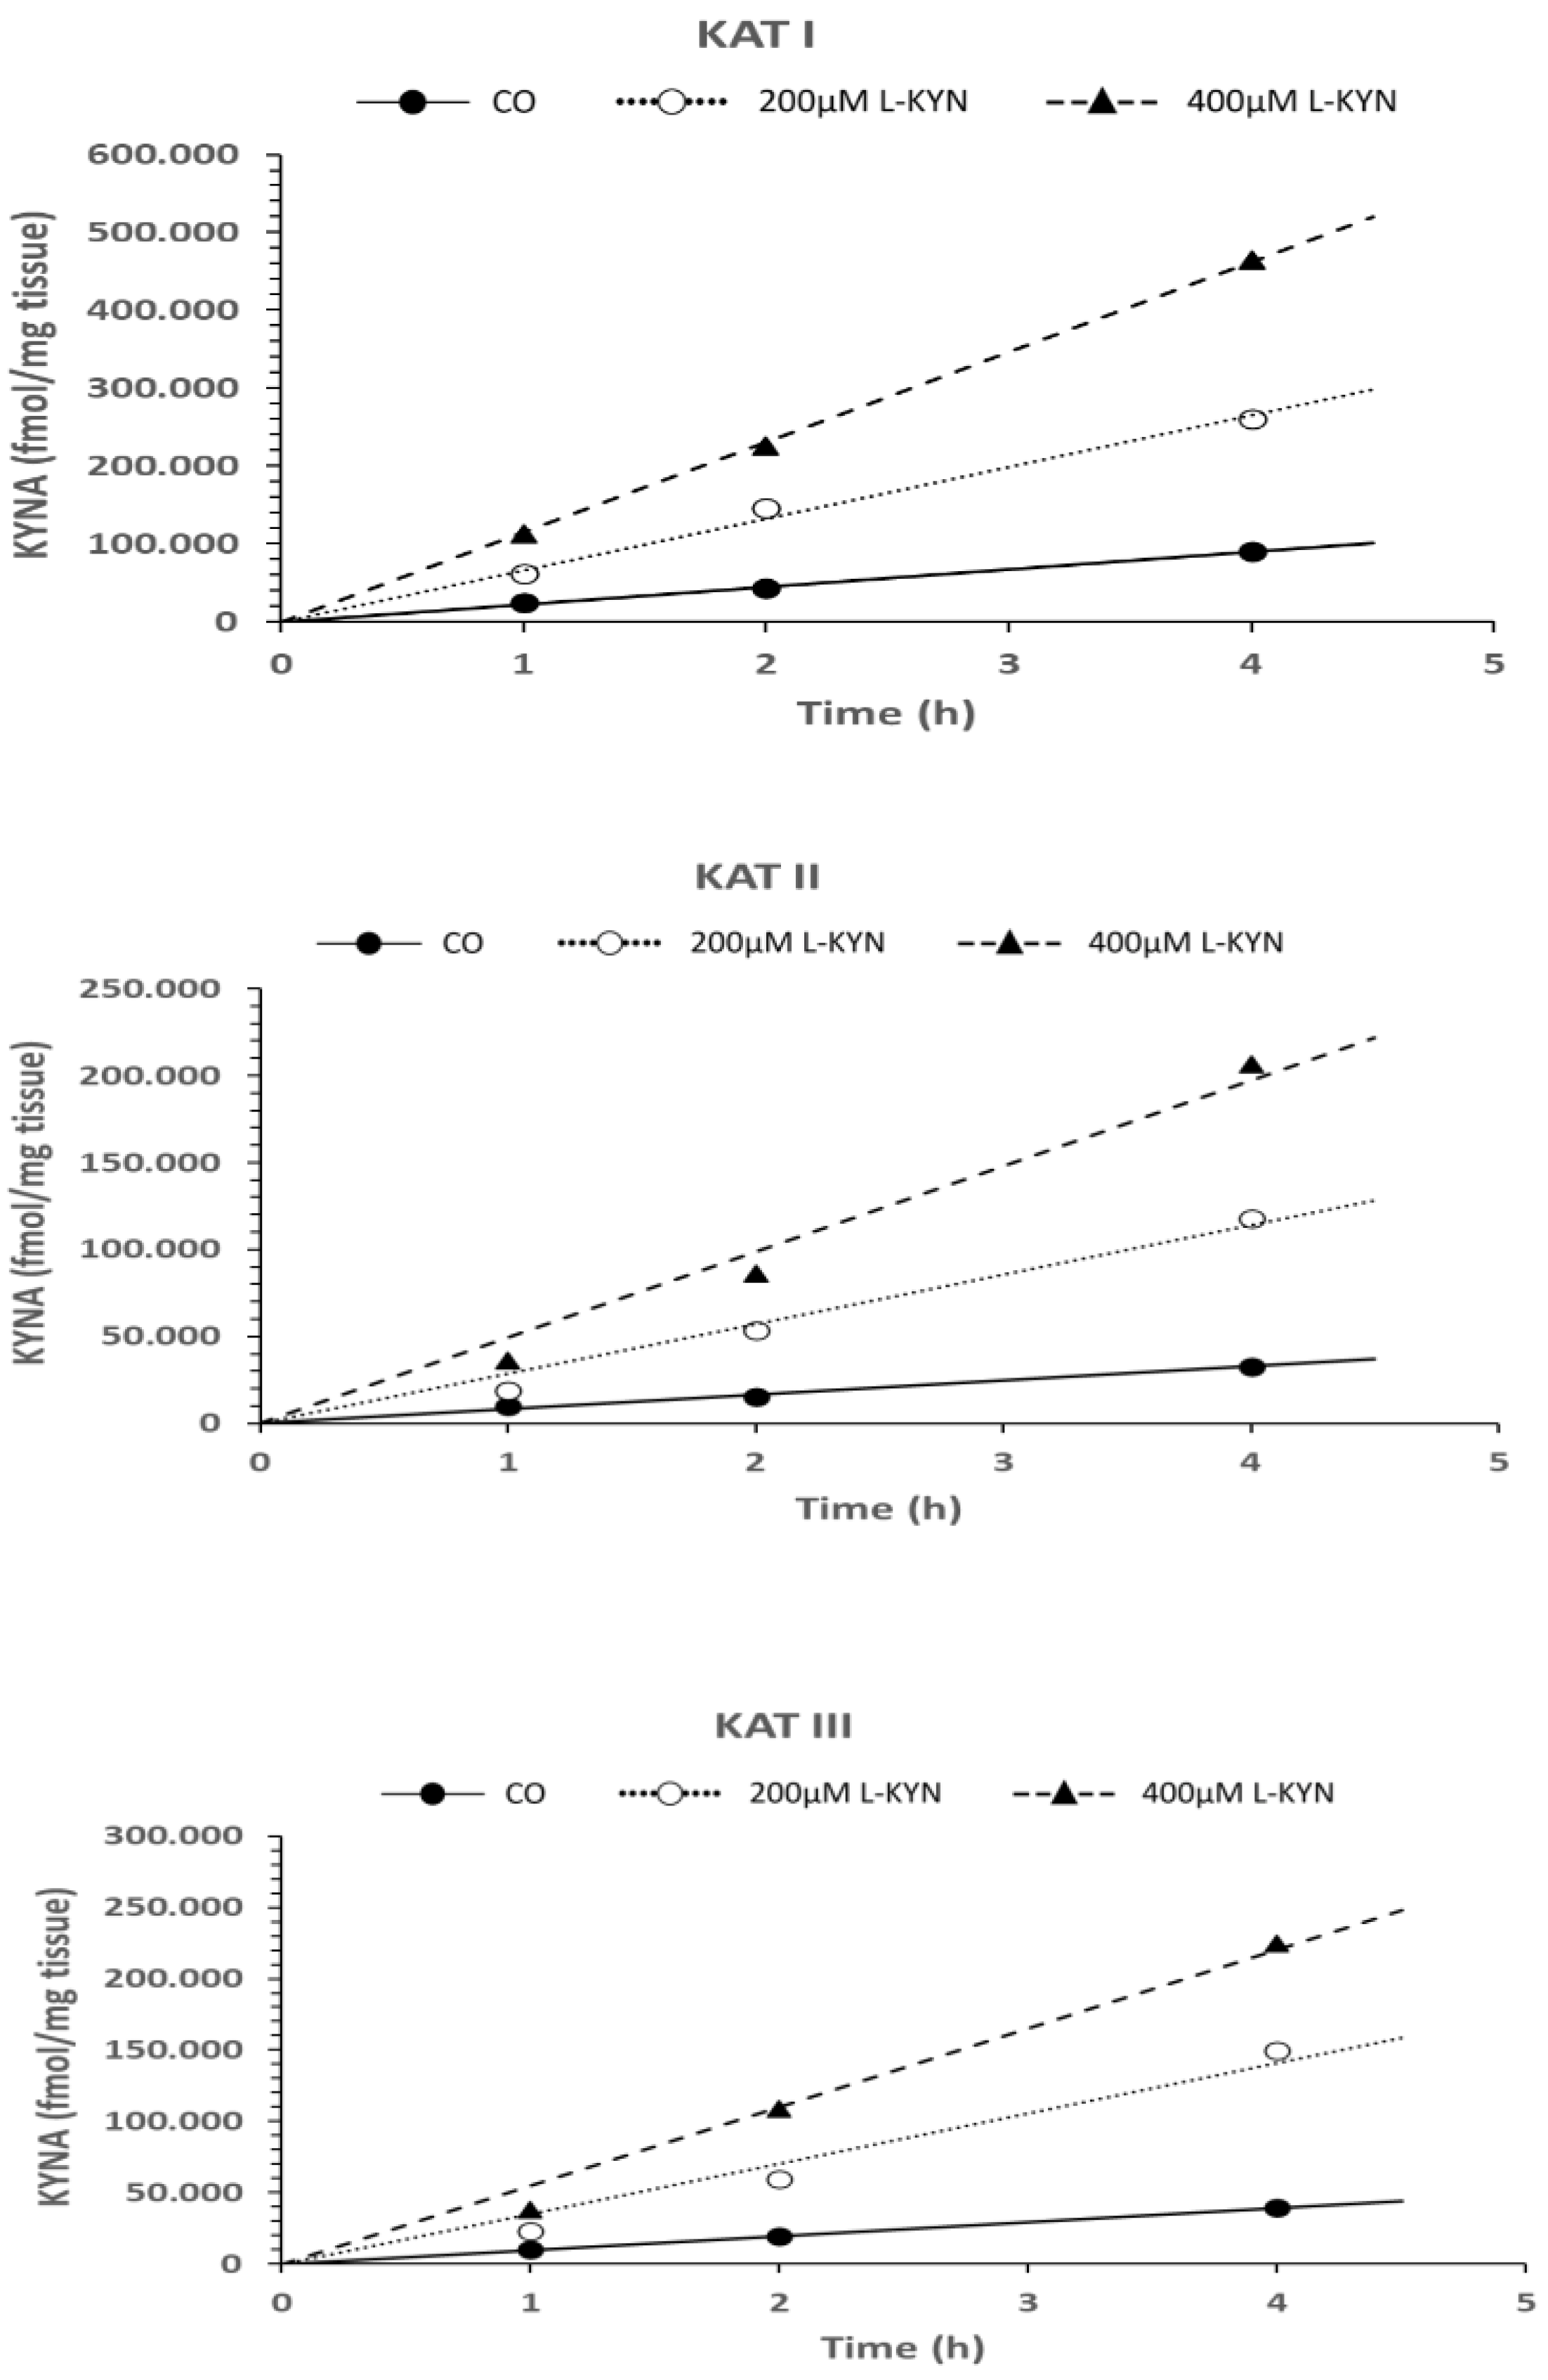
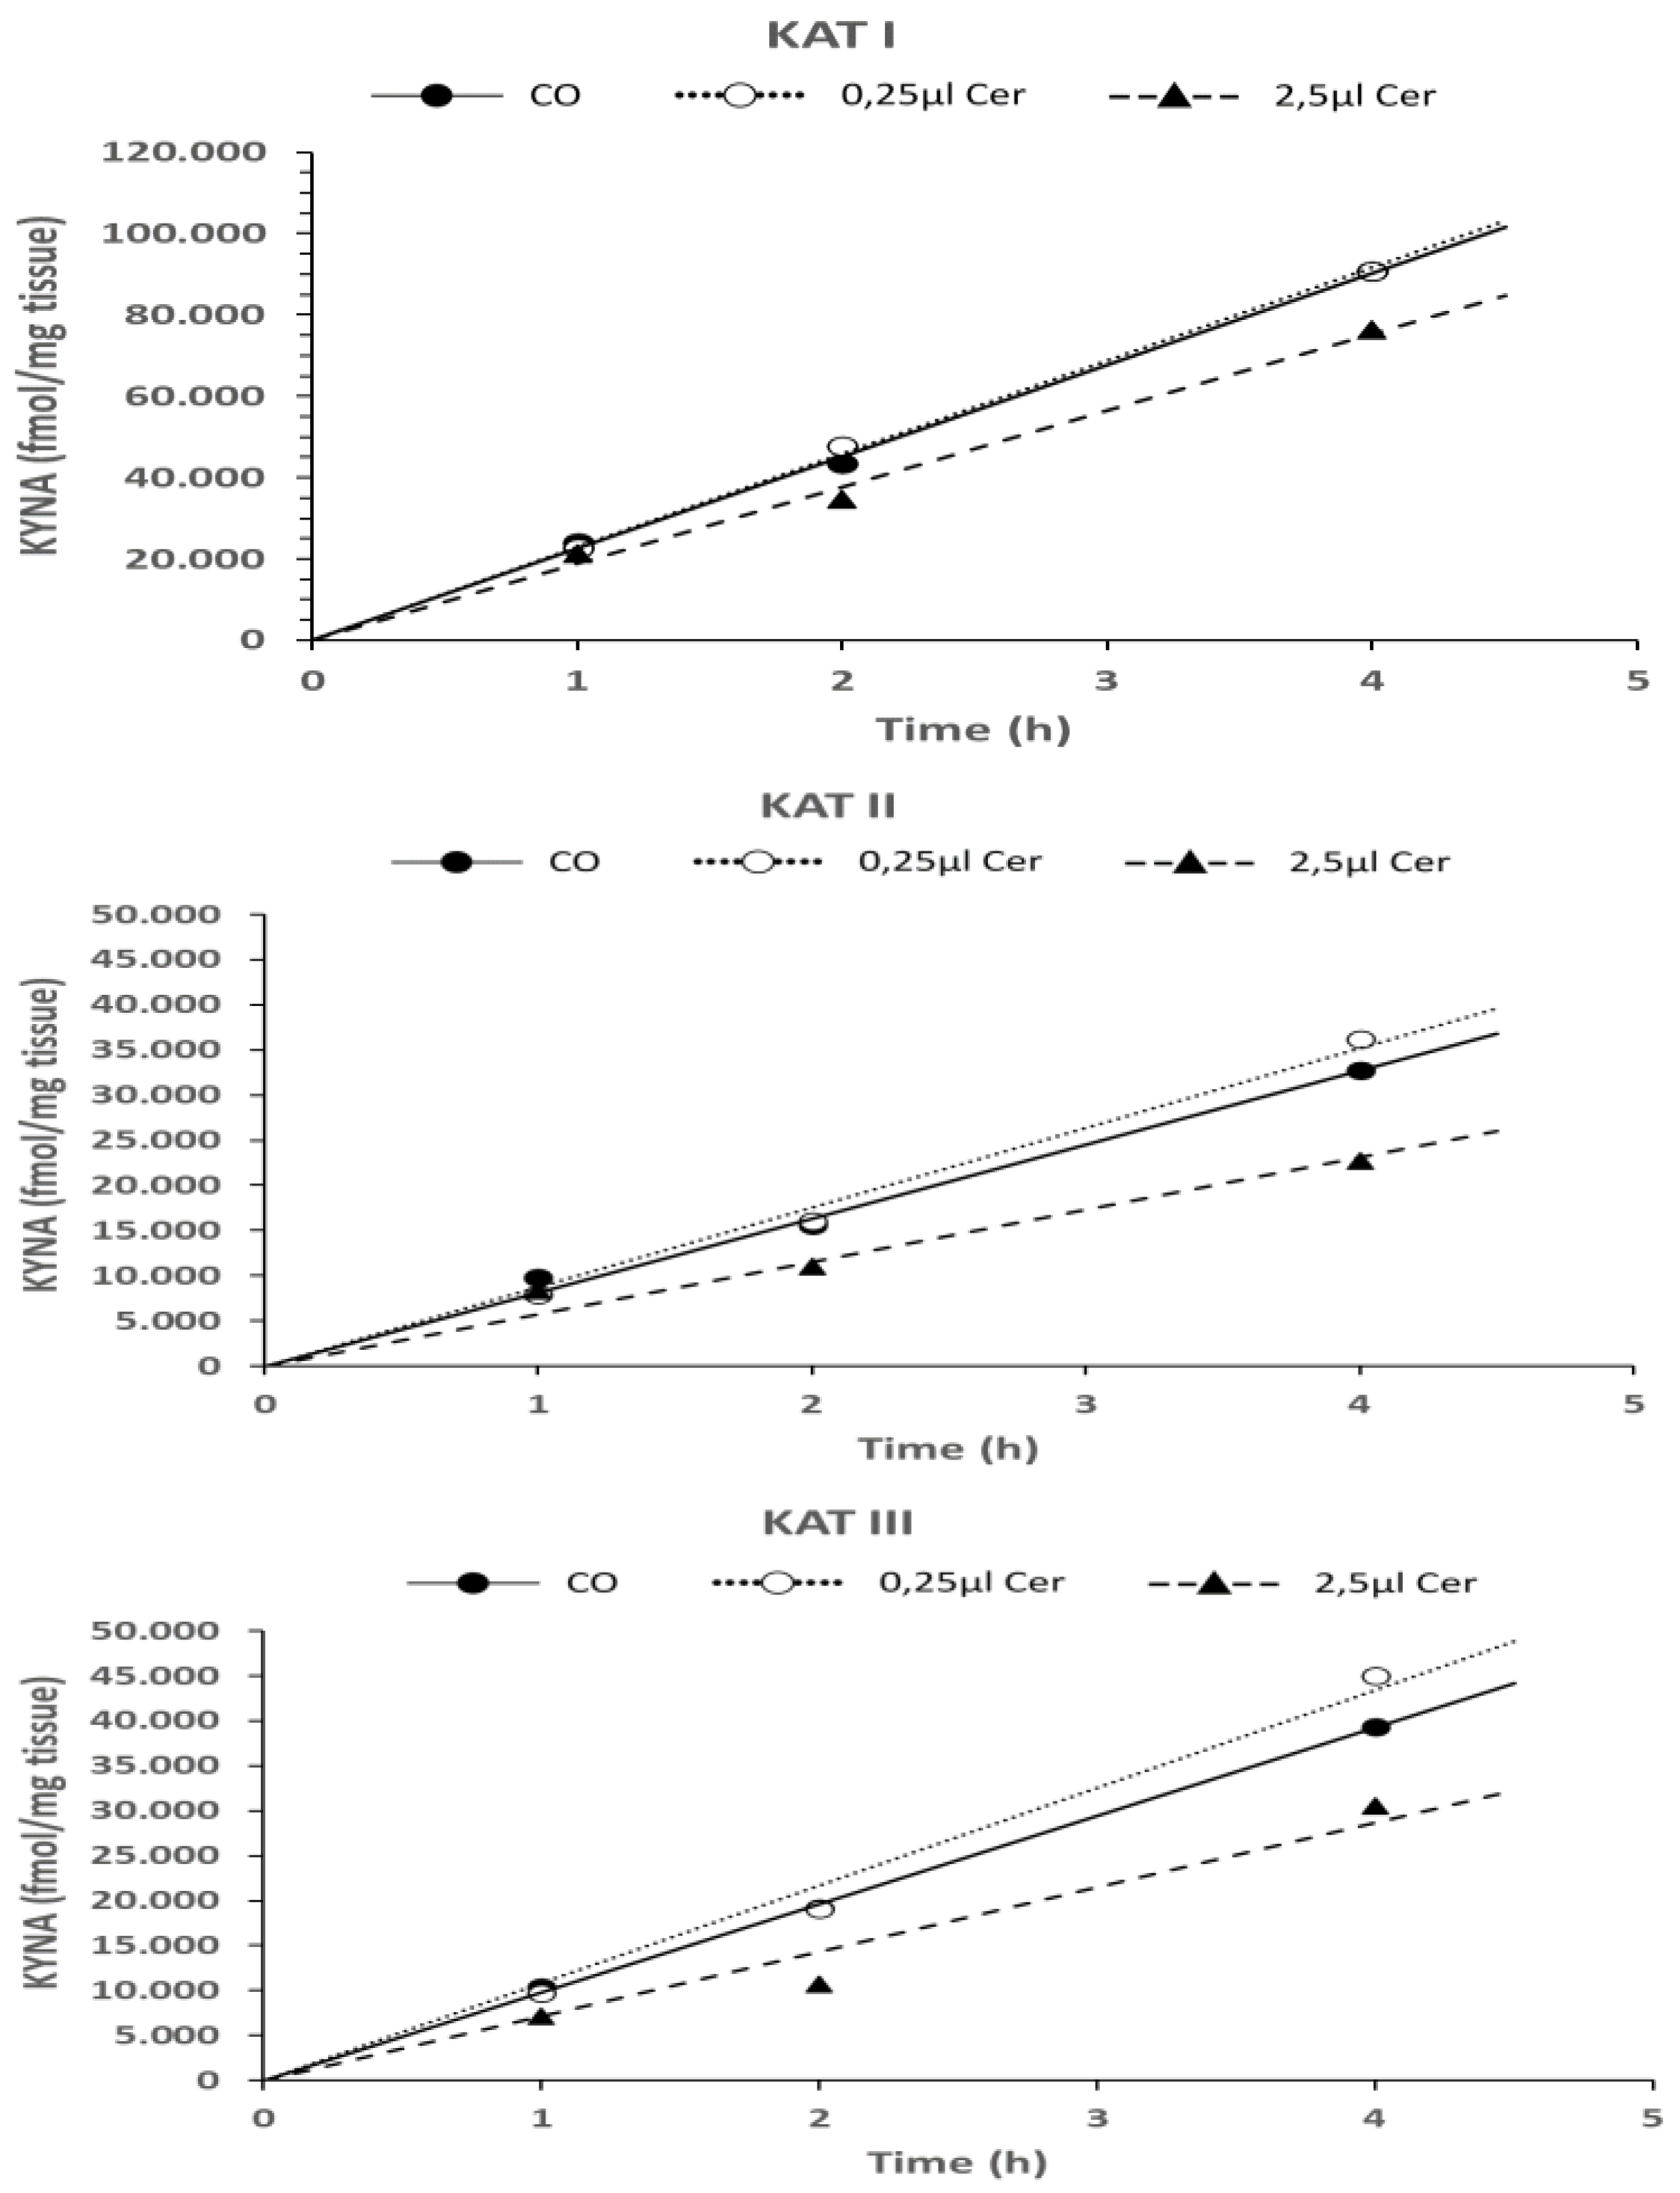
6.1.3. Time Dependence of KYNA Formation in the Presence of L-Kynurenine, Cerebrolysin, and D-Cycloserine in In Vitro Conditions

Utilizing two concentrations of L-kynurenine (200 µm and 400 µM), the formation of KYNA in liver homogenate exhibited a time-dependent formation and linear pattern up to 4 h of incubation with KAT I, KAT II, and KAT III, as demonstrated Figure 6 (6A, 6B, and 6C, respectively).
The investigation of the effect of two concentrations of Cerebrolysin (Cer) (0.25 µL and 2.5 µL) demonstrated a time-dependent and linear decrease in KYNA synthesis, extending up to four hours of incubation with KAT I, KAT II, and KAT III, in the presence of a higher dose of Cer (2.5 µL), as illustrated in Figure 7A, 7B, and 7C, respectively. Using a low dose of Cer (0.25 µL), the effect on KYNA synthesis was mostly not present, which was comparable with the Controls.
The investigation of the effect of D-cycloserine (200 µM and 400 µM) demonstrated a time-dependent and linear decline in KYNA formation, extending up to 4 h of incubation. This decline was observed in the presence of KAT I, KAT II, and KAT III at 200 µM and 400 µM doses, as depicted in Figure 8A, 8B, and 8C, respectively.
Student’s t-test statistics for Figure 6, Figure 7 and Figure 8: The Student’s t-test significance for KAT I, KAT II, and KAT III activities was calculated. The data corresponding to 1 h and 2 h, 1 h and 4 h, and 2 h and 4 h is displayed in Table 2 (see Table 2a–c).
Table 2. a. Student’s t-test of significance for KAT I.
Treatment 1 h–2 h 1 h–4 h 2 h–4 h
CO ns. 0.001 0.009
Cer 0.25 µL 0.008 0.021 ns
Cer 2.5 µL ns 0.012 0.029
D-Cyc 200 µM ns 0.03 ns
D-Cyc 400 µM ns 0.018 0.048
L-Kyn 200 µM ns ns ns
L-Kyn 400 µM ns 0.001 0.003
Table 2. b. Student’ t-test of significance for KAT II.
Treatment 1 h–2 h 1 h–4 h 2 h–4 h
CO 0.007 0.004 0.007
Cer 0.25 µL ns ns 0.049
Cer 2.5 µL ns ns ns
D-Cyc 200 µM ns 0.004 0.013
D-Cyc 400 µM 0.016 0.041 ns
L-Kyn 200 µM 0.030 0.001 0.002
L-Kyn 400 µM 0.002 <0.001 <0.001
Table 2. c. Student’ t-test of significance for KAT III.
Treatment 1 h–2 h 1 h–4 h 2 h–4 h
CO 0.034 <0.001 <0.001
Cer 0.25 µL ns ns ns
Cer 2.5 µL ns ns ns
D-Cyc 200 µM ns 0.044 ns
D-Cyc 400 µM ns ns 0.023
L-Kyn 200 µM 0.038 <0.001 0.001
L-Kyn 400 µM 0.027 0.001 0.004

7. Effect on KYNA Formation in an In Vivo Study

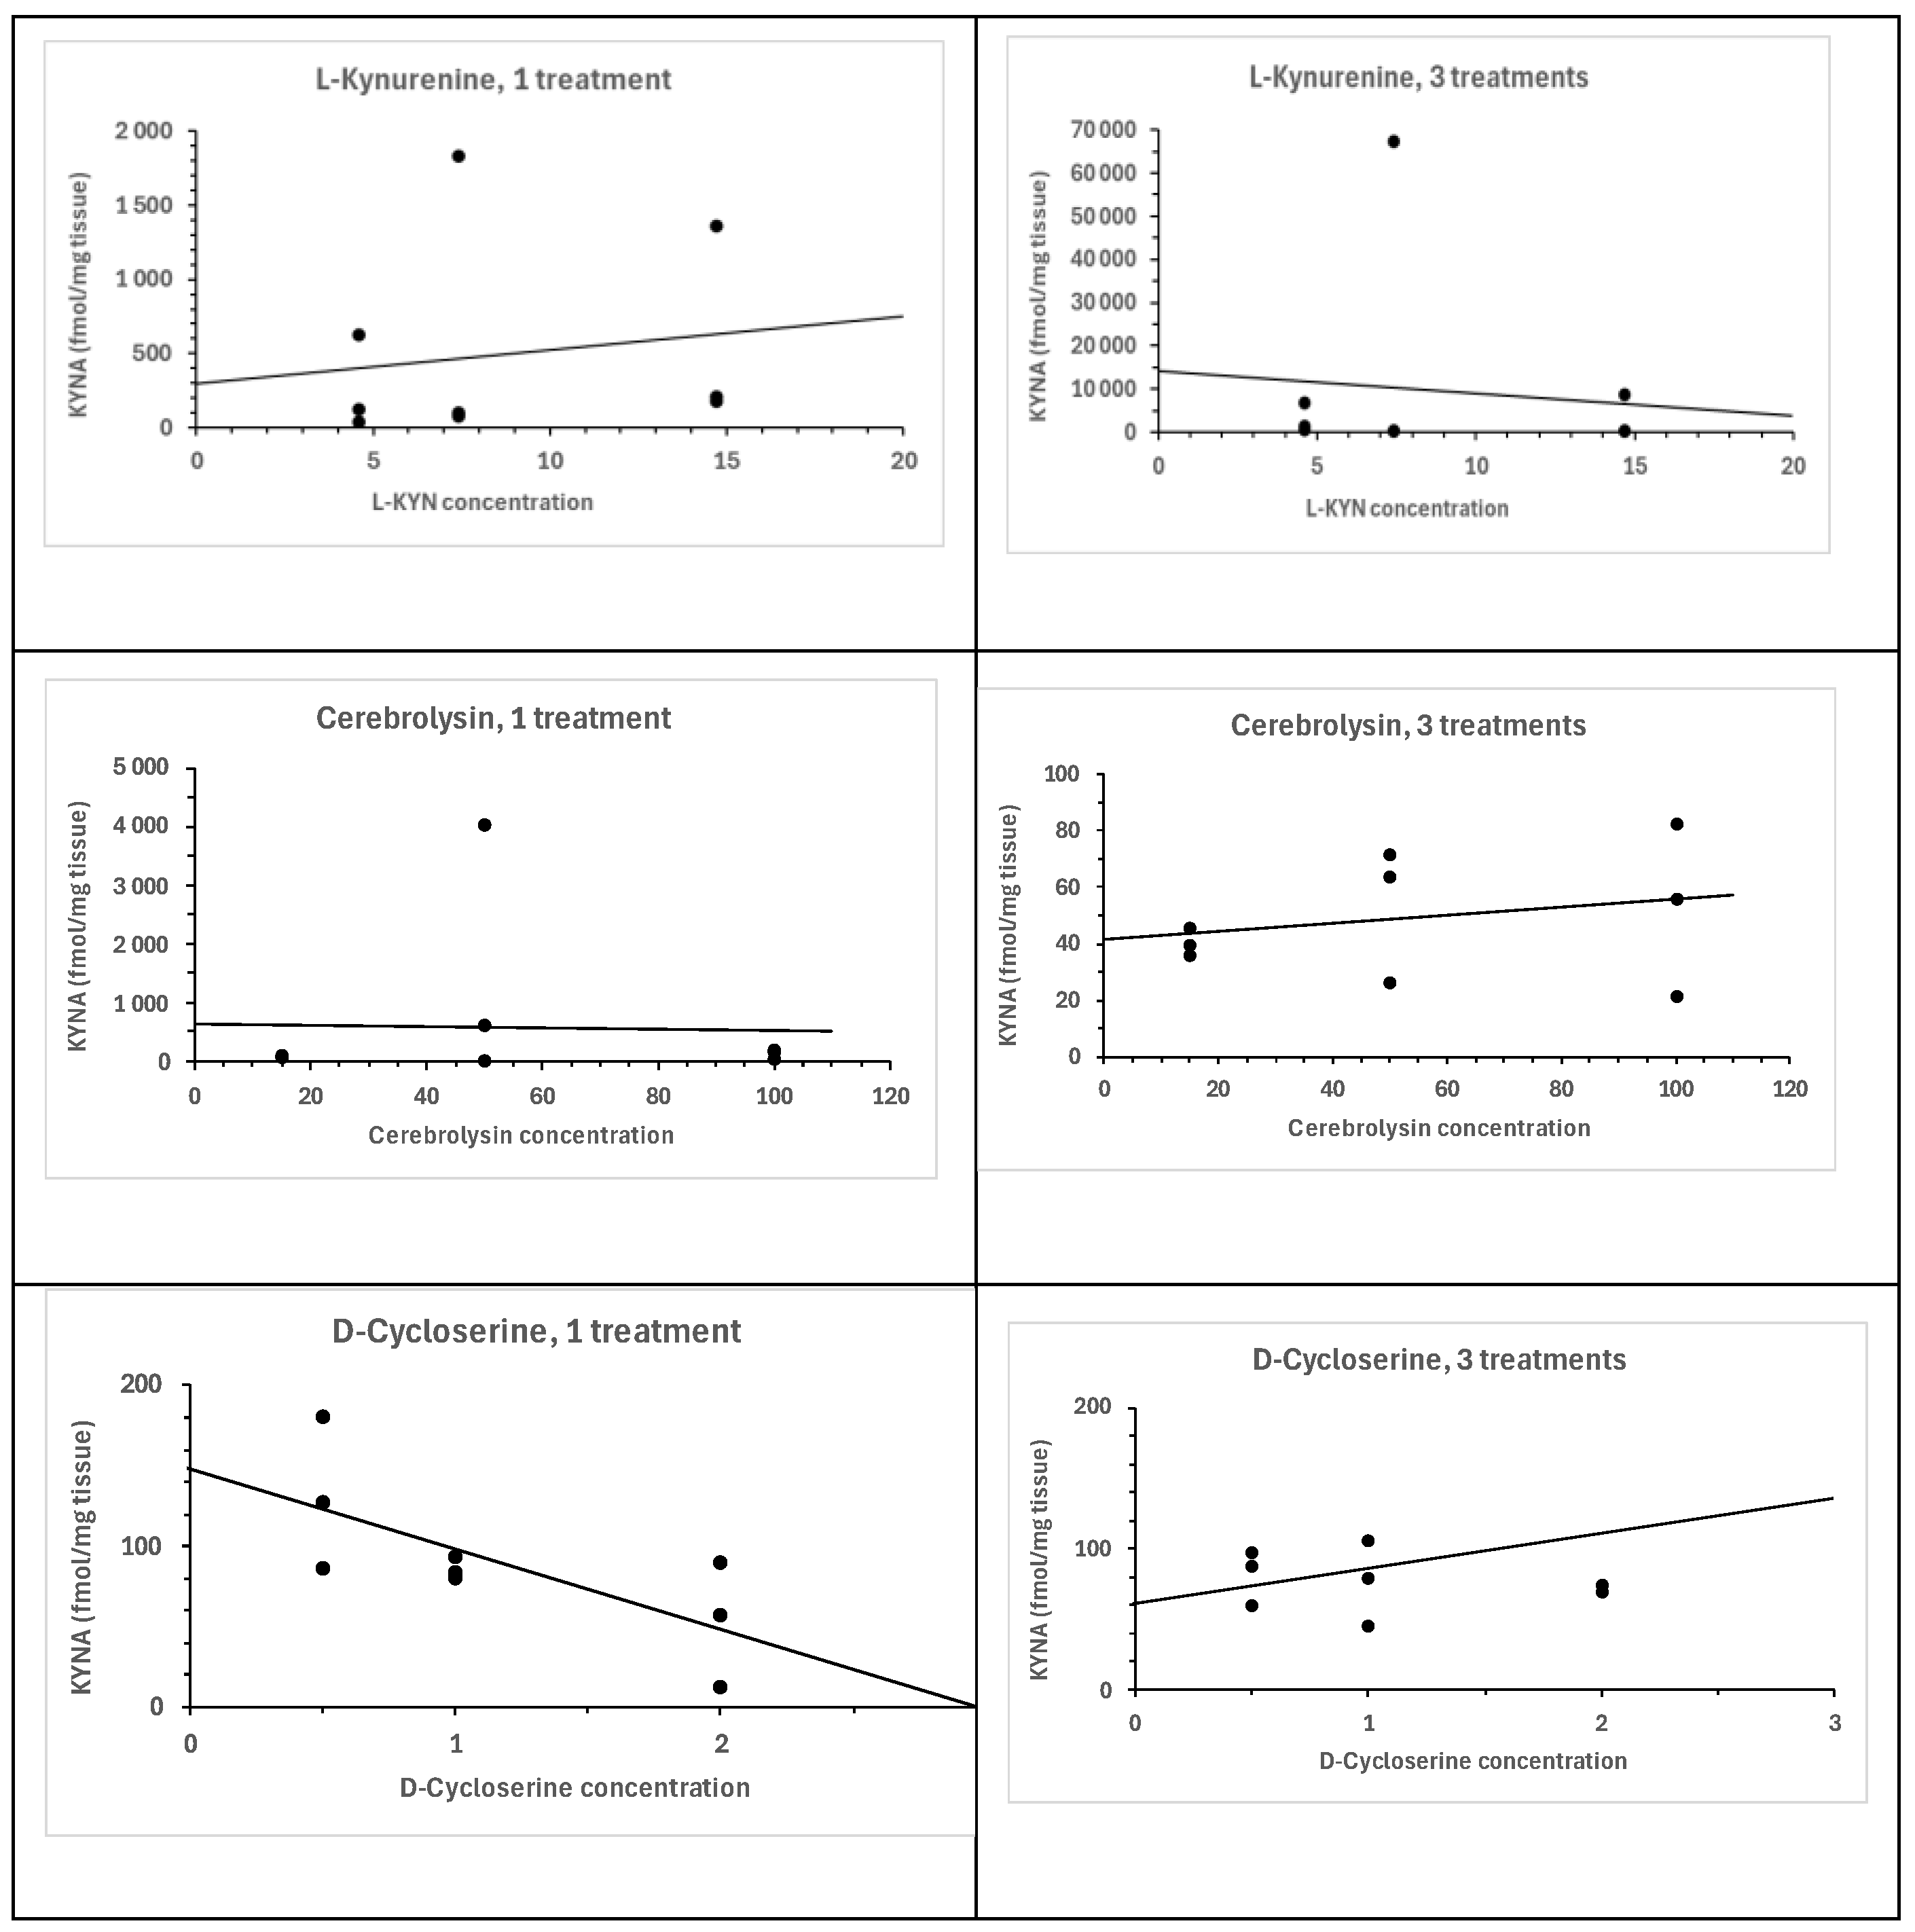
7.1. Effect of Dose–Response of L-Kynurenine, Cerebrolysin and D-Cycloserine on KYNA Formation In Vivo

7.1.1. Effect of L-Kynurenine

Treatment with L-kynurenine (4.6, 7.4, or 14.7 mg) resulted in a significant, dose-dependent increase in KYNA formation in the ganglia after one or three days compared to the Control group (see Figure 9A and 9B, respectively).

7.1.2. Effect of Cerebrolysin

The administration of cerebrolysin (15, 50, and 100 µL) to snails resulted in a dose-dependent and significant decrease in KYNA formation in the ganglia after one or three days of treatment, as compared to the Control group (see Figure 9C and 9D, respectively).

7.1.3. Effect of D-Cycloserine

The administration of D-cycloserine to snails resulted in a dose-dependent reduction in KYNA formation in the ganglia. The treatment groups, which received 0.5 mg, 1 mg, or 2 mg of D-cycloserine, exhibited a significant decrease in KYNA formation compared to the Control groups after one day of treatment and at a lower dose after three days of treatment (Figure 9E and 9F, respectively). A higher dose of D-cycloserine induced a moderate increase in KYNA synthesis (Figure 9F).

8. Pharmacological Treatment of Snails

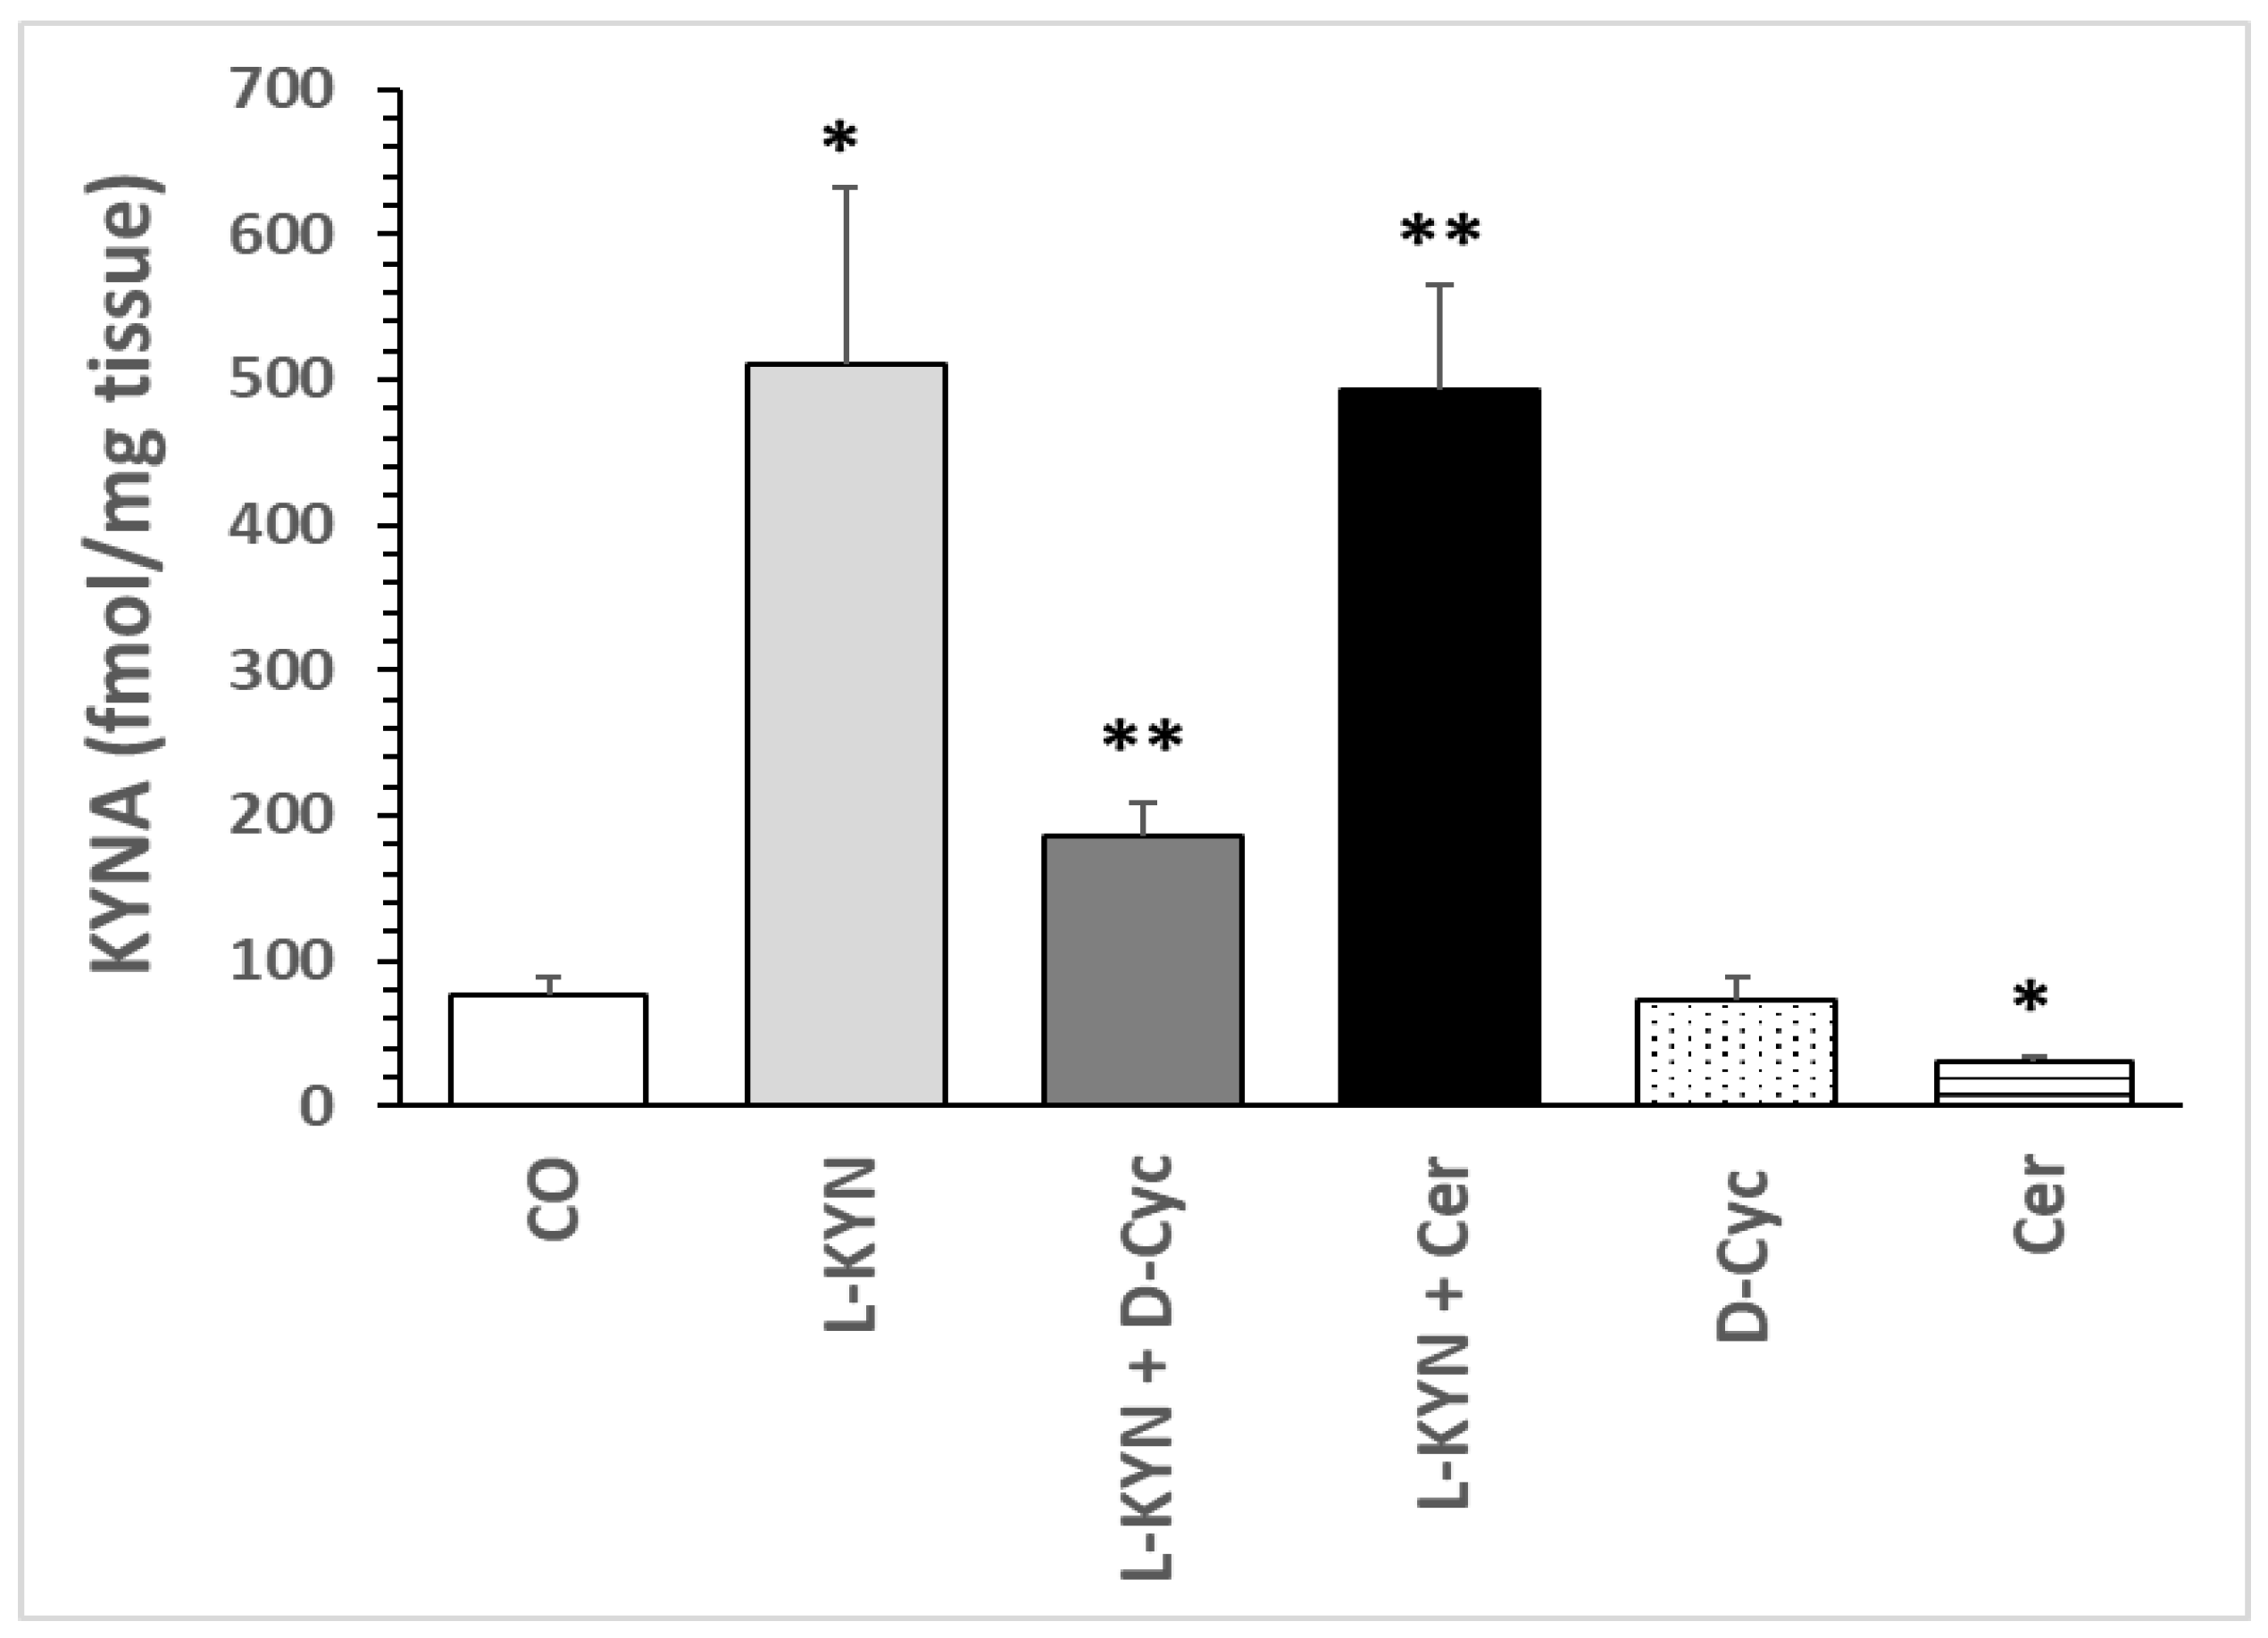
8.1. Effect of L-Kynurenine and an Anti-Dementia Drug on KYNA Formation and Tentacle Behaviour

8.1.1. Changes in KYNA

Treatment of the Helix pomatia with L-kynurenine resulted in a substantial increase in KYNA levels within the ganglia (Figure 10A). The co-administration of the L-kynurenine/D-cycloserine mixture (L-KYN/D-Cyc) led to a substantial reduction in KYNA levels. The co-administration of the L-kynurenine/cerebrolysine (L-KYN/Cer) mixture exhibited minimal impact on KYNA levels. Conversely, D-cycloserine (D-Cyc) or cerebrolysin (Cer) exhibited a reduction in KYNA levels in comparison to the Control group, with the effect of Cer proving to be statistically significant.
A one-way analysis of variance (ANOVA) for KYNA levels (Figure 10A) revealed significant differences between all pharmacological groups: F = 8.76677; p = 2.55021 × 10⁻⁵. One-way ANOVA for KYNA levels revealed a significant increase in KYNA concentrations, with a statistical significance of F = 8.29534 and p = 0.01383, between CO and L-KYN. Additionally, a trend towards statistical significance was observed in the L-KYN and L-KYN/D-Cyc mixture, with a statistical significance of F = 4.56984 and p = 0.055381. However, no statistical significance was detected between the L-KYN and L-KYN/Cer mixtures, with a statistical significance of F = 0.01212 and p = 0.91414. Furthermore, a significant difference in KYNA concentrations was observed between the L-KYN/D-Cyc mixture and D-Cyc, with a statistical significance of F = 13.07669 and p = 0.00472. Finally, a significant difference in KYNA concentrations was detected between the L-KYN/Cer mixture and Cer, with a statistical significance of F = 0.3464368 and p = 0.0001539. A statistically significant relationship was identified between L-KYN/Cer and L-KYN/D-Cyc, with a p-value of 0.00394 and a confidence interval of 13.87382. In contrast, no significant variation in KYNA levels was observed between CO and D-Cyc. The variation in KYNA levels in the L-KYN/Cer group could be due to low and high KYNA levels among samples. Storage of the samples could affect the data. This will be searched in the future.
The Student’s t-test for KYNA between CO and other groups (Figure 10A) yielded the following significant results: The CO vs. L-KYN comparison yielded a significant result, with a t-value of 2.88016 and a p-value of 0.01383. In contrast, the L-KYN vs. L-KYN/D-Cyc mixture did not demonstrate a significant outcome, with a t-value of −2.13772 and a p-value of 0.05381. Likewise, the L-KYN vs. L-KYN/Cer mixture did not reach statistical significance, with a t-value of −0.11011 and a p-value of 0.91414. However, the L-KYN/D-Cyc mixture vs. D-Cyc comparison yielded a substantial result, with a t-value of −3.61617 and a p-value of 0.00472. Similarly, the L-KYN/Cer mixture vs. Cer comparison was significant, with a t-value of 5.88588 and a p-value of 1.553959 × 10⁻⁴. Finally, the CO vs. D-Cyc comparison did not reach statistical significance, with a t-value of 0.11776 and a p-value of 0 = 908859. The results of the statistical analysis revealed a significant relationship between CO and Cer (p = 0.01607), with a t-value of −2.8912 and a p-value of 0.01607. Similarly, a significant relationship was observed between D-Cyc and Cer (p = 0.0444), with a t-value of −2.299809 and a p-value of 0.0444.

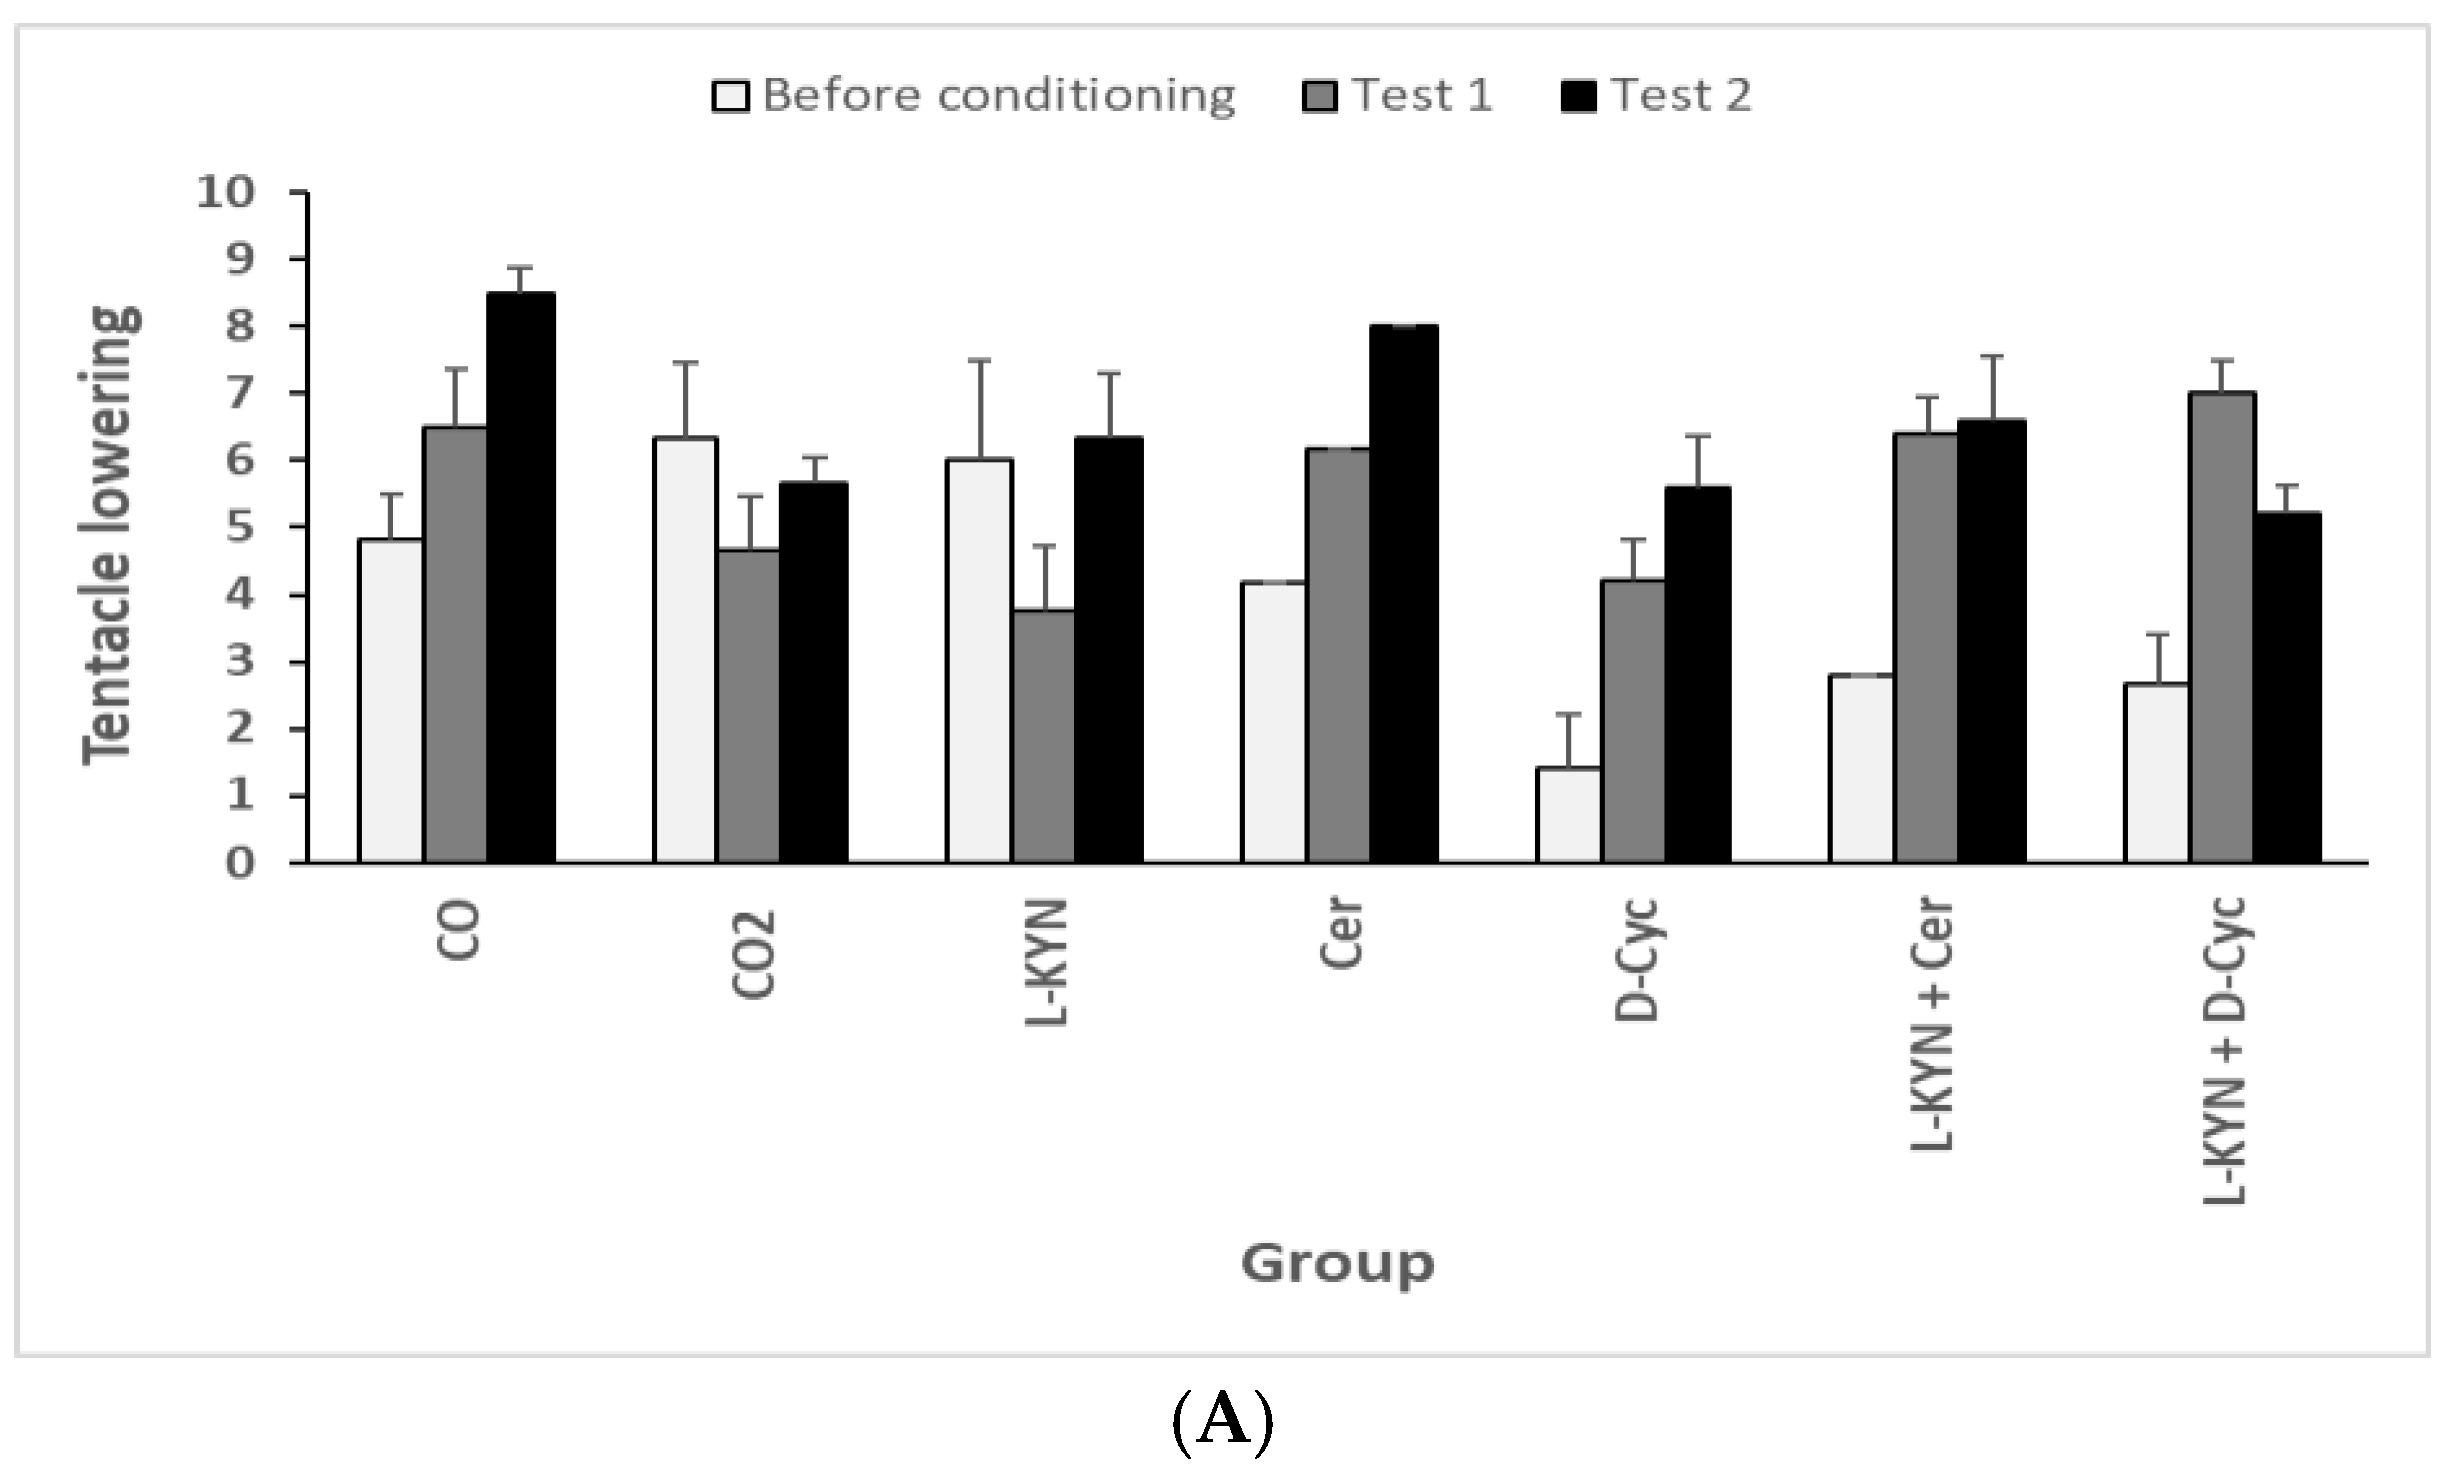
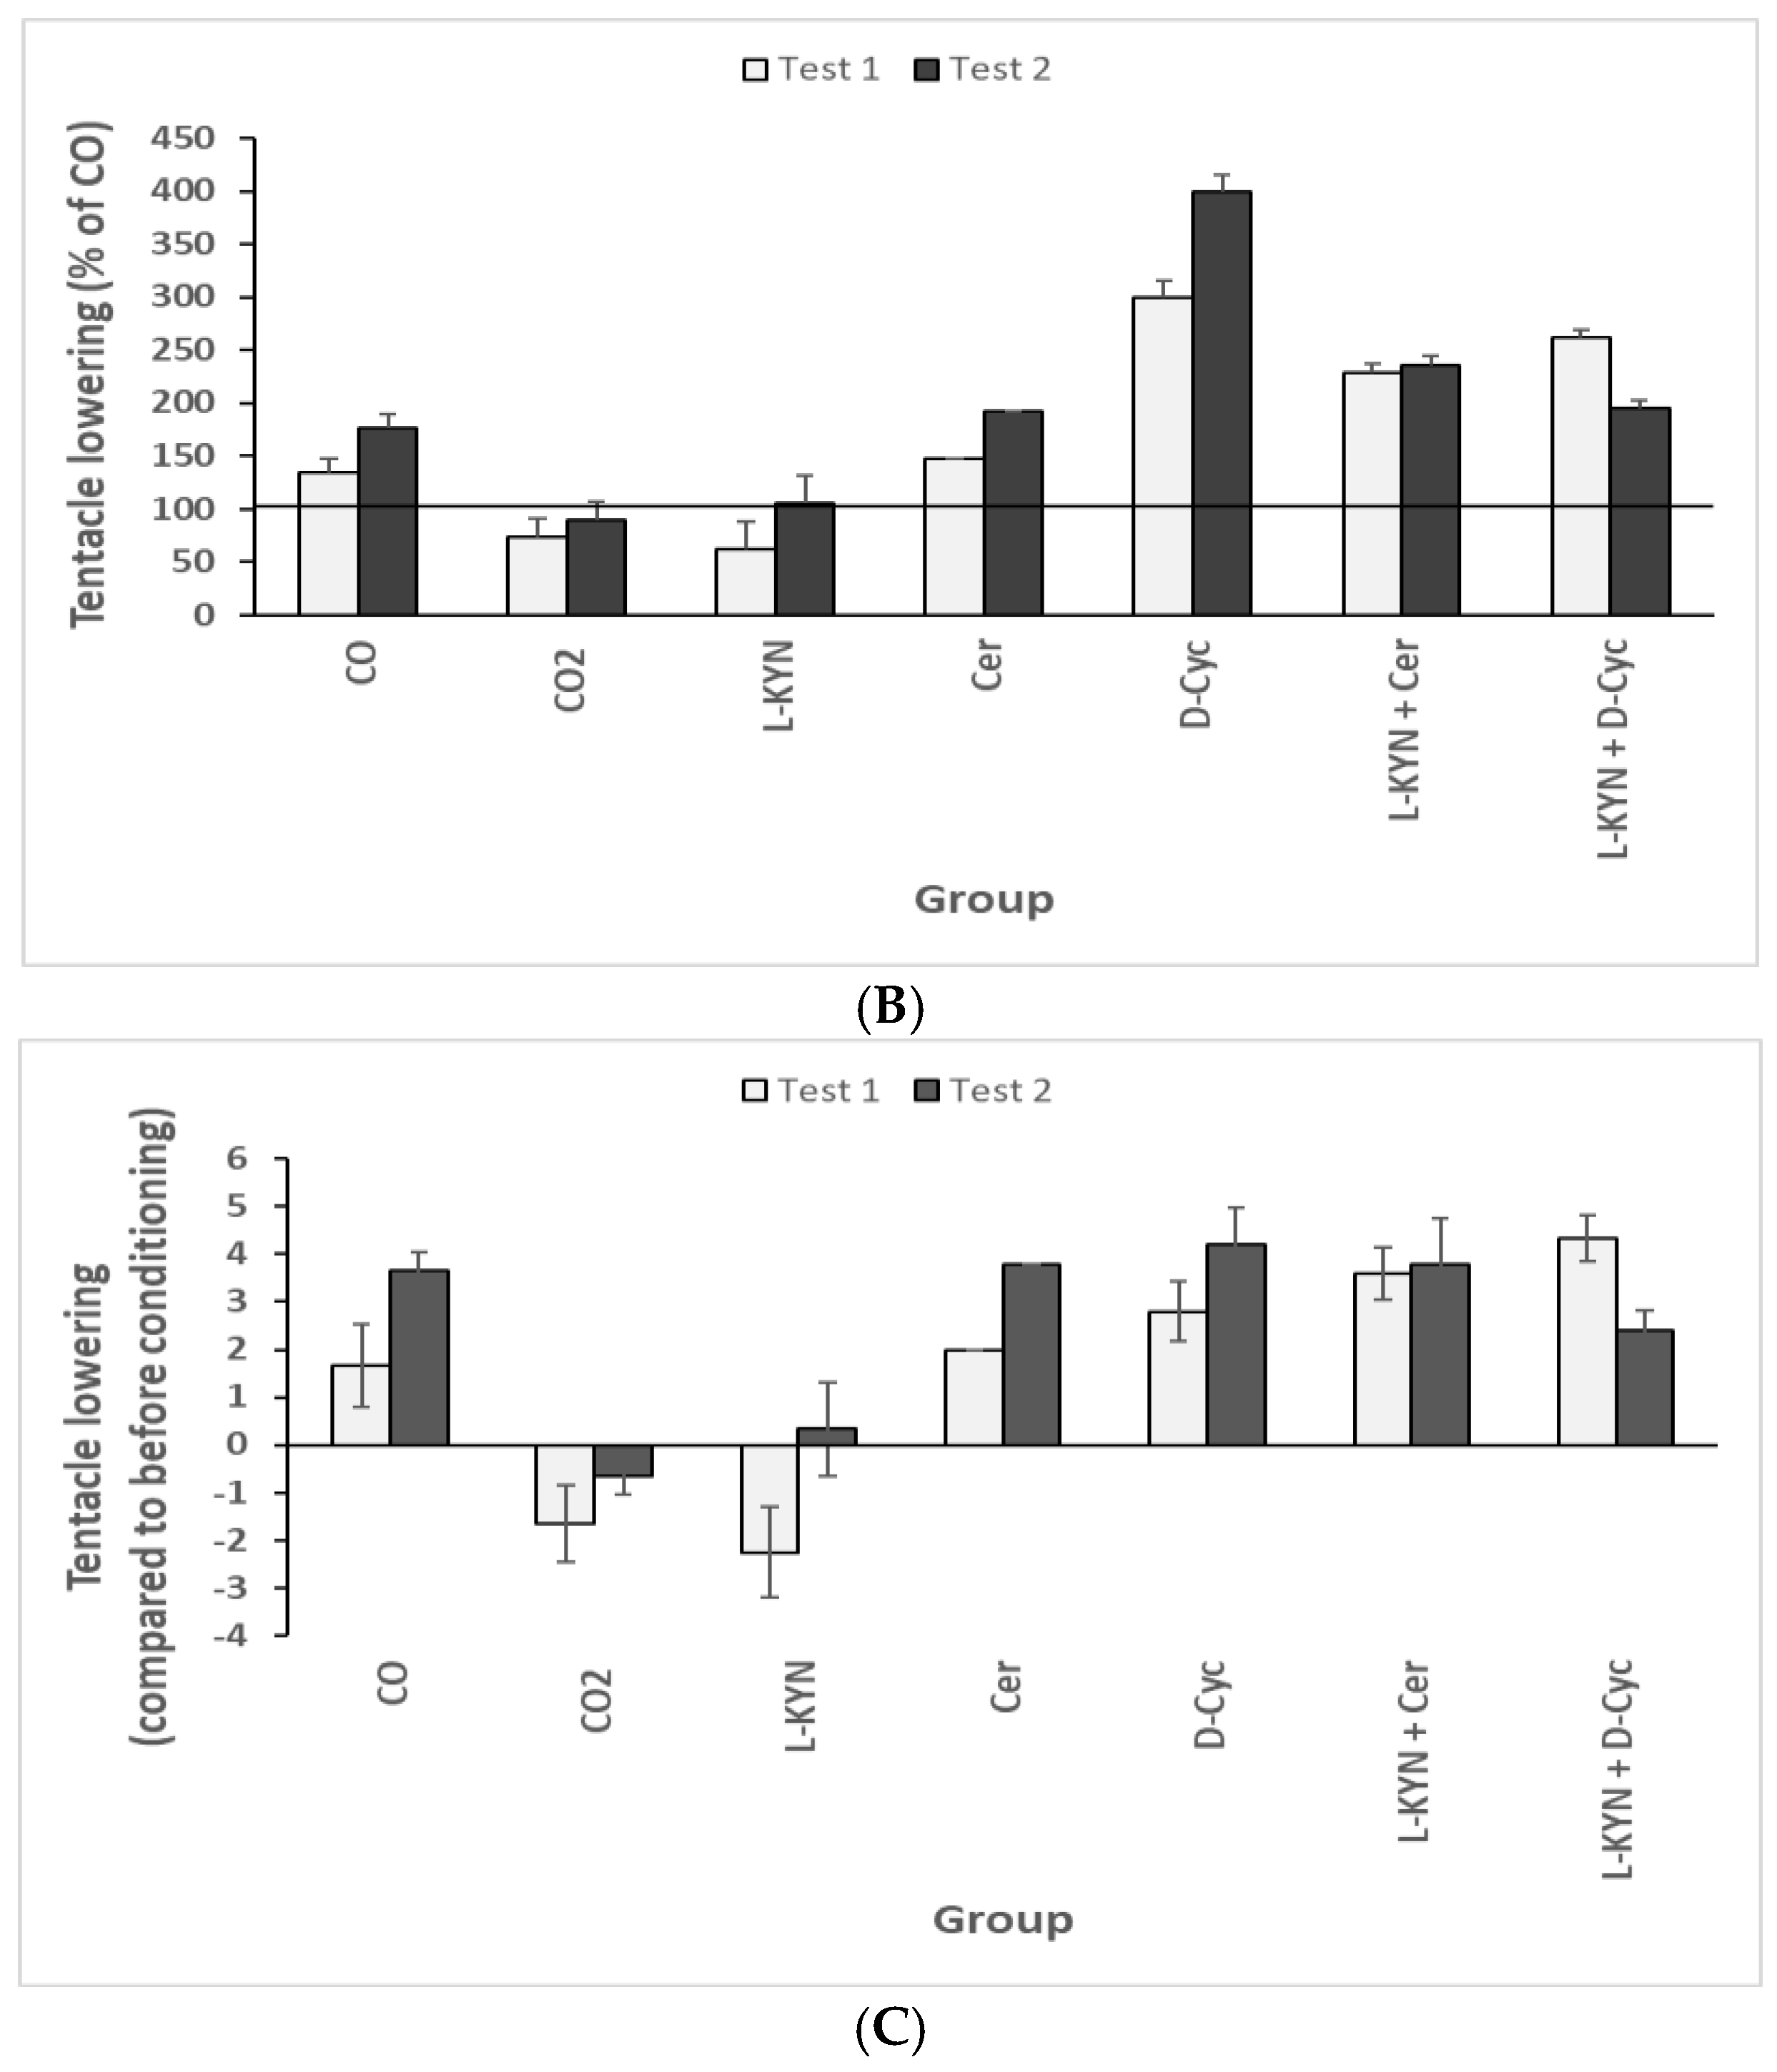
8.1.2. Behaviours-Alteration of Tentacle Lowering

A modification in the degree of activity exhibited by the tentacles has been observed (see Figure 10B). Snail activities were evaluated prior to conditioning (T0) and following cycle test I. L-kynurenine treatment led to a substantial reduction in tentacle lowering compared to the Control group (Figure 10B). The co-administration of L-kynurenine with D-cycloserine or cerebrolysine effectively negated the effect of L-kynurenine-induced tentacle lowering, resulting in values that were comparable to those observed in the Control group. The administration of D-cycloserine or cerebrolysin, either individually or in combination, resulted in a moderate augmentation of tentacle activity when compared to the Control group.
Figure 10. B. Effect of L-kynurenine, cerebrolysin, D-cycloserine, L-kynurenine/cerebrolysin, or L-kynurenine/D-cycloserine treatment on tentacle lowering of the Helix Pomatia snail. Snail’s activities (the number of tentacle depressions) were tested before conditioning (T0) and after the first Test I cycle. Data represent means ± SEM. Significance of differences: * p < 0.05; ** p < 0.01; *** p < 0.001 vs. the corresponding Control (T0). Number of tentacles lowering after treatments. Abbreviations: L-kynurenine (L-KYN); D-cycloserine (D-Cyc); Cerebrolysin (Cer). Data numbers are given in parentheses: CO (N = 6); L-Kyn (N = 8); L-Kyn/D-Cyc (N = 6); L-Kyn/Cer (N = 6); D-Cyc (N =6); Cer (N = 6).
Preprints 190399 g010b
A one-way ANOVA for tentacle lowering levels (Figure 10B) between all pharmacological groups demonstrated significant differences; F = 2.59588; p = 0.04443. A one-way ANOVA was conducted to assess the statistical significance of the observed reduction in tentacle lowering. The analysis revealed a substantial decrease in tentacle lowering between CO and L-KYN, with statistical significance indicated by an F-value of 8.54187 and a p-value of 0.01278. Additionally, a significant effect of D-Cyc was observed in the comparison between L-KYN and the mixture of L-KYN and D-Cyc, with statistical significance indicated by an F-value of 8.72548 and a p-value of 0.01206. Furthermore, a substantial increase in tentacle lowering was detected in the comparison between L-KYN and the mixture of L-KYN and D-Cyc, with statistical significance indicated by an F-value of 8.72548 and a p-value of 0.01206. However, no significant differences in tentacle lowering were observed between L-KYN and L-KYN/Cer, with statistical significance indicated by an F-value of 3.01609 and a p-value of 0.11309. A comparison of the effects of L-KYN/D-Cyc and D-Cyc on tentacle lowering revealed no significant differences (F = 0.01044, p = 0.92064). Similarly, no significant differences were observed in the changes in tentacle lowering when comparing L-KYN/D-Cyc and D-Cyc (F = 1.11304, p = 0.31624). Additionally, no significant differences in tentacle lowering were detected when CO was compared to D-Cyc (F = 0.7916, p = 0.039452). Likewise, no significant differences in tentacle lowering were observed when CO was compared to Cer (F = 0.56904, p = 0.46803). Finally, a lack of significant differences between D-Cyc and Cer in terms of tentacle lowering was revealed (F = 0.00186, p = 0.96648).
The following groups were subjected to a student’s t-test to ascertain differences in tentacle lowering: The CO vs. L-KYN comparison yielded a significant result, with a t-value of −2.92265 and a p-value of 0.01278. Similarly, the L-KYN vs. L-KYN/D-Cyc mixture exhibited a significant outcome, with a t-value of 2.95389 and a p-value of 0.0111206. However, the L-KYN vs. L-KYN/Cer mixture did not reach statistical significance, with a t-value of −0.11011 and a p-value of 0.91414. Furthermore, the L-KYN/D-Cyc mixture vs. D-Cyc comparison did not attain statistical significance, with a t-value of −1.05501 and a p-value of 0.31624. The L-KYN/Cer mixture vs. Cer comparison also did not reach statistical significance, with a t-value of −0.10217 and a p-value of 0.92064. Finally, the CO vs. D-Cyc comparison did not attain statistical significance, with a t-value of 0.88. The results of the statistical analysis revealed that the difference between CO and Cer was not significant (p = 0.39452). Similarly, the comparison between D-Cyc and Cer did not reach statistical significance (p = 0.46803).

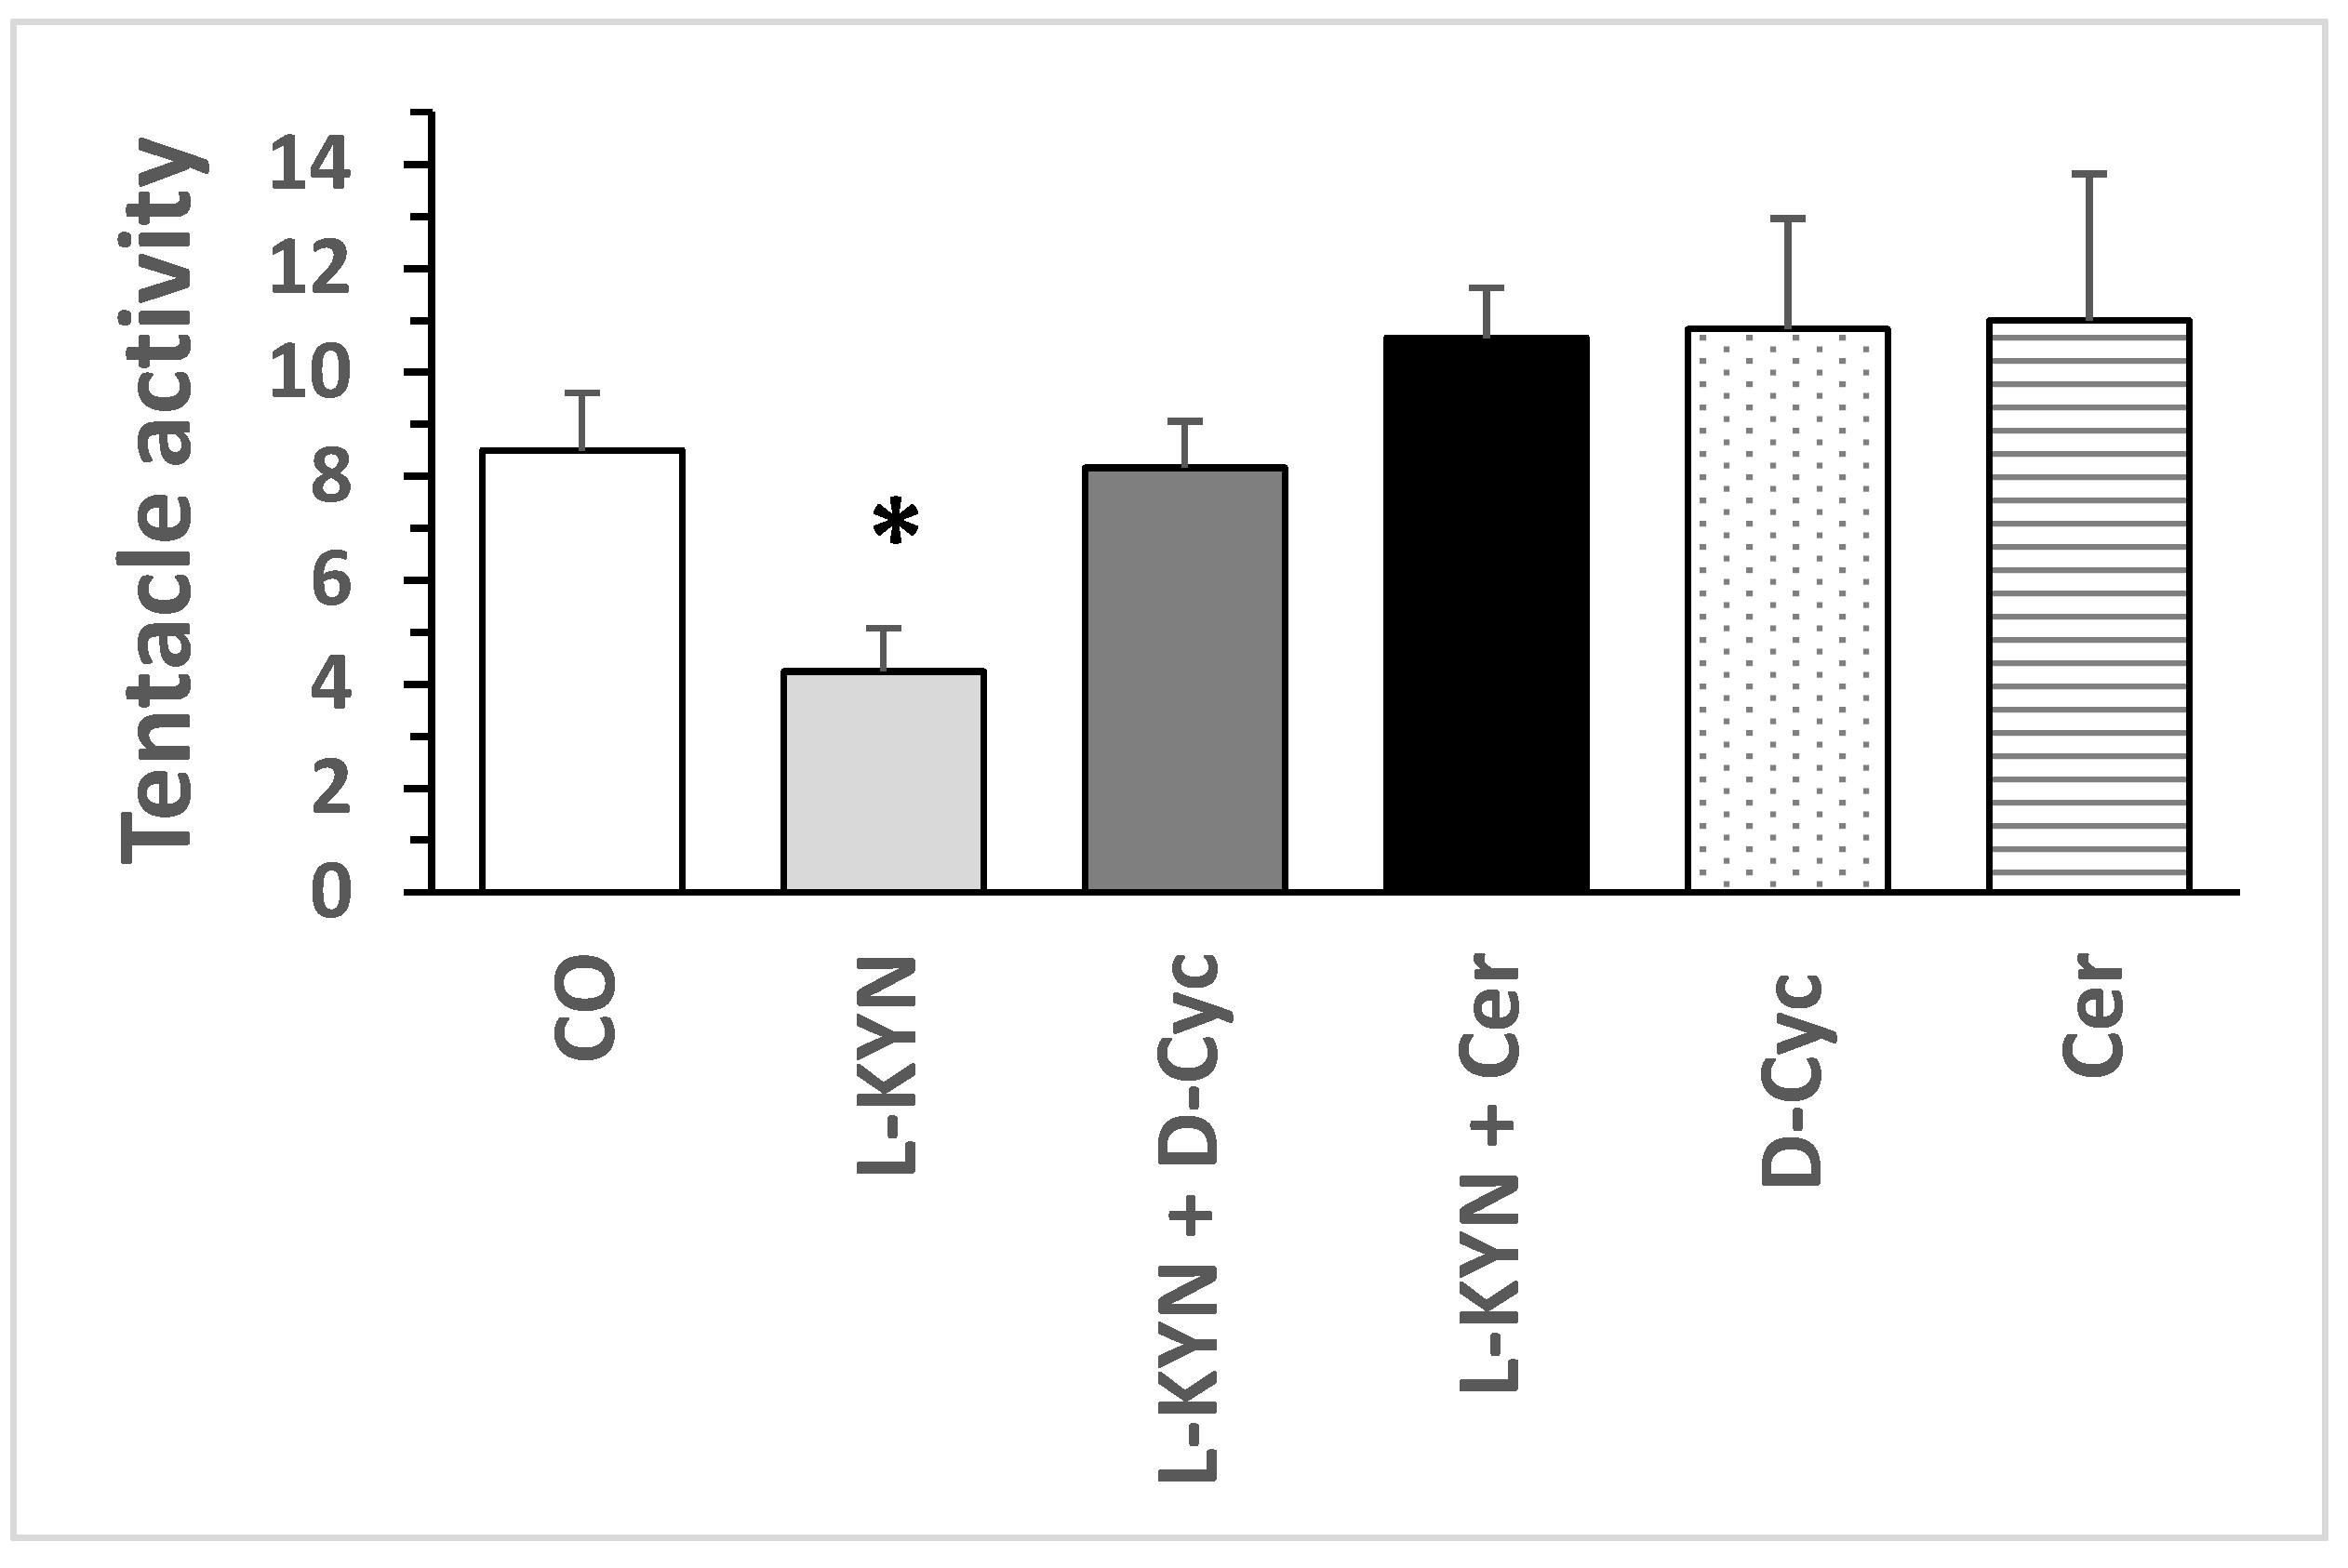
8.2. Effect of Pharmacological Treatment on Helix pomatia Snail Behaviour

Snail activities were tested before the conditioning (T0) and after the first (Test I) and second (Test II) test cycles. Data are presented in Figure 11 (Figure 11A–C). In comparing CO with CO2, we observed increased snail tentacle activity due to the presence of odour, indicating a learning process. This learning process was not observed after L-kynurenine treatment (i.e., an additional “stimulus”). We observed the inhibition of tentacle lowering due to L-kynurenine. The treatment with Cerebrolysin and D-cycloserine increased tentacle lowering, indicating increased learning activity. The co-application of mixtures L-kynurenine/D-cycloserine or L-kynurenine/Cerebrolysin abolished the effect of L-kynurenine (see Figure 11, Test 1). In Test 2, a positive effect was observed in all groups except CO2 and L-KYN.
Three different plots indicate the same results: Figure 11A represents the number of tentacle depressions before conditioning; Figure 11B represents this as a percentage of CO; and Figure 11C represents this as the change in the number of tentacle depressions after conditioning (i.e., the number of tentacle depressions after conditioning minis number of tentacle depressions before conditioning).
One-way ANOVA for tentacle lowering levels in the Control group with conditioning (Figure 11, CO) between T0, T1, and T2 measurements revealed significant differences (F = 4.67825; p = 0.0278). In terms of significance, T0 vs. T1 was most significant, F = 4.95097, p = 0.05312; T1 vs. T2 was not significant, F = 0.2063, p =0.66044; T0 vs. T2 was significant, F =12.47423, p = 0.00543. One-way ANOVA for tentacle lowering levels in the Control group without conditioning (Figure 10, CO2) between T0, T1, and T2 measurements revealed no significant differences, F = 1.17284; p = 0.33632. In terms of significance, T0 vs. T1 was not significant, F =1, p = 0.21818; T1 vs. T2 was significant, F = 5.82759, p = 0.04224; T0 vs. T2 was not significant, F = 0.32558, p = 0.58611.
One-way ANOVA for tentacle lowering in the L-KYN group (Figure 11, L-KYN) between T0, T1, and T2 measurements revealed no significant differences, F = 2.70565; p = 0.11076. In terms of significance, T0 vs. T1 was not significant, F = 1.83007, p = 0.21818; T1 vs. T2 was significant, F = 5.82759, p = 0.04224; T0 vs. T2 was not significant, F = 0.32558, p = 0.58611. One-way ANOVA for tentacle lowering in the Cer group (Figure 11, Cer) between T0, T1, and T2 measurements revealed significant differences, F = 6.46565; p = 0.01026. In terms of significance, T0 vs. T1 was not significant, F = 4.04494, p = 0.07203; T1 vs. T2 was not significant, F = 3.32215, p = 0.10167; T0 vs. T2 was significant, F =10.98523, p = 0.00902.
One-way ANOVA for tentacle lowering in the D-Cyc group (Figure 11, D-Cyc) between T0, T1, and T2 measurements revealed significant differences, F = 3.7; p = 0.04941. In terms of significance, T0 vs. T1 was not significant, F = 1.94595, p = 0.19323; T1 vs. T2 was not significant, F = 1.16046, p = 0.30667; T0 vs. T2 was significant, F = 12.18232, p = 0.00587. One-way ANOVA for tentacle lowering in the L-KYN/Cer group (Figure 11, L-KYN/Cer) between T0, T1, and T2 measurements revealed significant differences, F = 5.02786; p = 0.02261; In terms of significance, T0 vs. T1 was significant, F = 6.53768, p = 0.03084; T1 vs. T2 was not significant, F = 0, p = 1; T0 vs. T2 was significant, F = 6.77922, p = 0.02856.
One-way ANOVA for tentacle lowering in the L-KYN/D-Cyc group (Figure 11, L-KYN/D-Cyc) between T0, T1, and T2 measurements revealed significant differences, F = 8.61969; p = 0.00363. In terms of significance, T0 vs. T1 was significant, F = 26.40625, p = 4.38589 × 10⁻⁴; T1 vs. T2 was not significant, F = 2.42461, p = 0.15387; T0 vs. T2 was not significant, F = 4.13096, p = 0.07264.
Student’s t-test for tentacle lowering between T0 vs. T1, T1 vs. T2, and T0 vs. T2 in the CO Groups (Figure 11). CO Group: T0 vs. T1 was most significant, t = 2.22508, p = 0.05312; T1 vs. T2 was not significant, t = 0.4542, p = 0.66044; T0 vs. T2 was significant, t = −3.53189, p = 0.00543. CO2 Group: T0 vs. T1 was not significant, t = −1.59719, p = 0.14131; T1 vs. T2 was not significant, t = 0.90453, p = 0.38699; T0 vs. T2 was significant, t = −3.53189, p = 0.00543. L-KYN Group: T0 vs. T1 was not significant, t = −1.3528, p = 0.21818; T1 vs. T2 was significant, t = 2.41404, p = 0.0.04224; T0 vs. T2 was not significant, t = −0.5706, p = 0.58611. Cer Group: T0 vs. T1 was not significant, t = 2.0112, p = 0.07203; T1 vs. T2 was not significant, t = 1.82268, p = 0.10167; T0 vs. T2 was significant, t = −3.3144, p = 0.00902. D-Cyc Group: T0 vs. T1 was not significant, t = 1.39497, p = 0.19323; T1 vs. T2 was not significant, t = 1.07725, p =0.30667; T0 vs. T2 was significant, t = −3.49032, p = 0.00587. L-KYN/Cer Group: T0 vs. T1 was significant, t = 2.55689, p = 0.03084; T1 vs. T2 was not significant, t = 0, p = 1; T0 vs. T2 was significant, t = −2.60369, p = 0.02856. L-KYN/D-Cyc Group: T0 vs. T1 was significant, t = 5.1387, p = 4.38589 × 10⁻⁴; T1 vs. T2 was not significant, t = −1.55712, p = 0.15387; T0 vs. T2 was significant, t = −2.03248, p = 0.07264.

9. Discussion

As demonstrated in the present study and in a previous study by Kronsteiner et al. (2023) [35], KYNA formation in Helix pomatia brain or liver homogenates was significant and dependent on the L-kynurenine dose. Our research reveals a novel finding: anti-dementia drugs, including cerebrolysin and D-cycloserine, effectively reduce KYNA synthesis in vitro in Helix pomatia liver homogenate. A similar effect was observed in vivo, where brain KYNA levels increased significantly following L-kynurenine treatment. Furthermore, following treatment with cerebrolysin or D-cycloserine, a significant reduction in KYNA levels was observed in snail ganglia, indicating the blockade of KYNA-synthesizing enzymes (KATs) in the CNS.
The inhibitory effect of cerebrolysin and D-cycloserine on kynurenine degradation/ KAT activity has also been observed in other species, including rats and humans, in the periphery and/or CNS, at least in vitro [26,27]. These findings suggest that the effect on kynurenine metabolism is similar between the species studied.
Snails have previously been proposed as a model organism for the study of memory and learning [40,41]. In light of these findings and the accumulated data, the Helix pomatia snail was used as a “memory model” to evaluate the impact of various pharmacological interventions on learning/memory. We found that pre-treating the snails with L-kynurenine substantially increased KYNA levels in the ganglia.
Furthermore, tentacle activity decreased, as evidenced by a decline in tentacle lowering. This indicates impaired learning capacity and memory, respectively. Interestingly, the effects of L-kynurenine on snail tentacles were negated in the presence of cerebrolysin or D-cycloserine. Thus, the present study demonstrated that administering L-kynurenine with an anti-dementia pharmaceutical agent led to notable alterations in the behaviour of Helix pomatia snails. This alteration is characterized by a reduction in the frequency of tentacle lowering. These findings further support the idea that cerebrolysin and D-cycloserine might exert an antidementia effect in the snail memory model.
These observations provide further compelling evidence that increased KYNA synthesis contributes to learning impairment and may play a role in the development of dementia. Achieving optimal therapeutic outcomes requires careful management of therapy, particularly regarding drug concentration. Also, the consumption of different foods might suggest optimal conditions for keeping KYNA low.
A previous in vitro study demonstrated that in the presence of a high D-cycloserine dose (≥67.3 µM) in the incubation mixture, measured KYNA levels were below 0% of the Control [27]. The present study also demonstrated a significant reduction in KYNA formation by D-cycloserine. However, in vivo, studies revealed that higher D-cycloserine doses were not accompanied by a reduction in KYNA levels but rather by a notable moderate increase. Our observations revealed that KAT I activity remained unchanged in the presence of a high D-cycloserine dose. Conversely, KYNA formation was observed at a level comparable to that observed in the Control group, with a notable increase in KYNA synthesis also observed in some cases. A study on the effect of D-cycloserine on KAT I in humans and a study on the effect of Jerusalem Balsam on KAT I activity have revealed moderate reductions in KAT I, and even increases were observed in some cases [28,29].
Goff’s research suggests that administering D-cycloserine to patients diagnosed with schizophrenia during the acute phase of the illness has a positive effect [42]. However, long-term use of D-cycloserine has also been associated with deterioration [43]. This observation potentially explains why D-cycloserine is less effective at reducing “tentacle growth” over extended treatment periods (Baran observation). Goff (2017) found that the efficacy of D-cycloserine treatment in patients diagnosed with schizophrenia was enhanced when the dosage was reduced [43]. Goff’s observations are in the line with the effect of a high D-cycloserine dose on the KYNA in ganglia, where the KYNA levels were comparable to those of the Control, or even moderately increased.
It is important to note that another L-kynurenine metabolite, anthranilic acid (ANA) (Figure 1), is also elevated in individuals with schizophrenia [44]. A similar pattern of increased ANA and KYNA (ANA >> KYNA) has been observed in stroke patients as well [45]. The Zeptoring treatment was effective for both patient groups. All patients reported feeling well, likely due to the reduction of KYNA and, to a lesser extent, ANA observed in healthy subjects [46].
Interestingly, hawthorn berry extract exhibits anti-dementia activity and supports heart function. It also reduces KYNA and anthranilic acid levels in an in vitro study of healthy human subjects [30]. In Europe, hawthorn berry extract is used as a dietary supplement for heart health by older subjects and is sold in pharmacies.
Furthermore, high levels of KYNA increased mitochondrial oxygen consumption and decreased ATP synthesis in heart mitochondria, but not in brain or liver mitochondria, whereas 3-OH-kynurenine, 3-OH-anthranilic acid, and xanthurenic acid affected mitochondrial respiratory parameters in the heart, liver, and brain. In addition, anthranilic acid similar to KYNA significantly reduced RC values of heart mitochondria in the presence of glutamate/malate. Although the present study does not support the assumption of a correlation between impairment of brain mitochondria and high KYNA levels, it is important to mention that enhanced kynurenine aminotransferase activities in the brain may also increase the formation of xanthurenic acid from 3-OH-kynurenine. Because differences in the effects of tryptophan metabolites on mitochondrial respiratory parameters have been observed in the heart, brain, and liver, we believe the anti-dementia drug may impact not only KYNA but also xanthurenic acid and notably, anthranilic acid. We have previously reported significant, dose-dependent effects of L-kynurenine and its metabolites, including KYNA and xanthurenic acid, or anthranilic acid on respiratory parameters in rat brain, heart, and liver mitochondria [46]. Furthermore, high levels of KYNA increased mitochondrial oxygen consumption and decreased ATP synthesis in heart mitochondria but not in brain or liver mitochondria. In contrast, 3-OH-kynurenine and xanthurenic acid affected mitochondrial respiratory parameters in the heart, liver, and brain. Whereas anthranilic acid, a product of L-kynurenine significantly affected the mitochondria function, as well. While the present study does not support the assumption of a correlation between impaired brain mitochondria and high KYNA levels, it is worth noting that enhanced KAT activity in the brain could also increase xanthurenic acid formation from 3-OH-kynurenine. Importantly, the Respiratory Control (RC) value of brain mitochondria was significantly lowered in the presence of xanthurenic acid since oxygen consumption during the passive state increased slightly, whereas oxygen consumption during the active state decreased moderately in the presence of glutamate/malate. These data suggest that brain mitochondria are impaired in the presence of increased xanthurenic acid levels, and that the application of antidementia drugs might correct these levels and the accompanying pathological events, as we recently suggested [16].
No effect of millimolar quinolinic acid doses on mitochondrial respiratory parameters in the heart, liver, or brain of rats was detected [46]. Ageing: the quality of the mitochondrial respiratory parameters in the brain, heart, and liver was unaffected by ageing, at least in healthy rats [46].
Some controversial publications have suggested that quinolinic acid plays a more significant role in the development of dementia [47]. From a biochemical perspective, mitochondria are defined as sub-cellular organelles. Previous studies have shown that high doses of L-kynurenine metabolites, such as KYNA, 3-hydroxykynurenine, and 3-hydroxyanthranilic acid, significantly affect rat mitochondrial respiratory parameters. However, these effects were not observed in the presence of quinolinic acid [46]. Furthermore, our study suggests that applying KAT inhibitors may increase quinolinic acid synthesis. Contrary to expectations, tentacle activity increased rather than decreased in the in vivo study. This finding supports the idea that KYNA likely plays a modulatory role in behaviour and memory impairment.
The neurodegenerative effects of quinolinic acid are well-documented in HIV-1-infected patients and may significantly impact memory and cognition [47,48,49]. These quinolinic acid-induced biochemical events are related to cell loss and the proliferation of cells that synthesize KYNA following neurodegeneration. Notably, KAT I activity increased significantly under various pathological conditions. Additionally, KYNA levels are significantly elevated under pathological conditions, too. Despite its neuroprotective and anticonvulsant properties, KYNA cannot stop or delay neurodegenerative events.
Notably, our data suggest that the ability of drugs to increase and/or decrease KYNA synthesis is a significant indicator of their potential as antidementia drugs. Which KAT might be more effective for antidementia drugs in vivo?
Interestingly, increased water consumption was found to reduce KYNA levels in snails (an observation by Kronsteiner). These events correlate well with the slight memory impairment experienced by individuals who reduced their daily liquid intake, including water. Doctors recommend controlling the amount of water consumed to improve mood, memory capacity, and health. Modulation of KYNA synthesis might have a significant impact on the processes responsible for energy supply.
Furthermore, KYNA also demonstrates an interesting action, acting as an agonist of the orphan G protein-coupled receptor GPR-35 [9]. Regarding the importance of the involvement of KYNA and xanthurenic acid in relation to the GPR-35 receptor in the gut microbiota, specific GPR-35-positive signals have been detected in the gastrointestinal tract [9]. Lowering KYNA levels in ageing birds reveals remarkable biochemical conditions. These results establish a positive correlation between good memory and low KYNA levels in older age [16,50]. Also, anthranilic acid acts as an agonist of the orphan G protein-coupled receptor GPR-109A and its role might play pivotal function, as well [51].
An interesting paper by Berlinguer-Palmini et al. (2013) demonstrated that the activation of GPR35 reduces Ca2+ transients and contributes to the KYNA-dependent reduction in synaptic activity at the CA3-CA1 synapses [52], indicating the presence of GPR35 receptors in the brain. A further notable observation has been made by Deng et al. (2025) [53], whose work explores the interaction between the gut microbiota and the cyclic adenosine monophosphate–protein kinase A signalling pathway, suggesting a potential therapeutic approach for neurodegenerative diseases. Furthermore, regarding this interaction, KYNA may modulate the relationship between AMP and ATP in the hippocampus, which could influence memory capacity [53,54]. This is an intriguing and intricate mechanism involving numerous variables that fluctuate based on energy supply and biochemical processes. In this regard, mitochondrial activity plays a significant role in supplying energy to cells and their respiratory tract, which depends significantly on bio-pharmacological conditions. As we have demonstrated, various endogenous metabolites of the tryptophan pathway affect different organs in different ways [46]. Similarly, different and complex pathologies were evident following HIV-1 virus infection in humans. All pathological events were related to enhanced ANA and/or KYNA formation [44,45].
10. Conclusions
Regarding the role of KYNA in memory impairment, it is important to note that anti-dementia drugs may interfere with kynurenic acid synthesis. The Helix pomatia snail memory model is a valuable tool for evaluating the effects of certain compounds on memory and the biochemistry of the kynurenine pathway in vivo. Within this model, using pharmaceuticals or natural agents that can modulate kynurenine metabolic activity in the central and peripheral nervous systems by reducing KYNA levels through KAT inhibition represents a promising approach to alleviating or preventing acute cardiovascular and neurological exacerbations in patients with dementia and/or inflammation. Additionally, this approach could be used prophylactically to promote cognitive health throughout the human lifespan.

Author Contributions

This work was structured by H.B., and C.K. contributed to the analysis. Both authors have read and agreed to the published version of the manuscript.

Funding

This project received in part financial support from the K3-F-995/001-2021 initiative, which is funded by the Department of Science and Research of the Government of Lower Austria in St. Pölten.

Data Availability Statement

Some data is unavailable for technical reasons.

Acknowledgments

We would like to express our profound gratitude to Berthold Kepplinger. This work was supported by Kepplinger, who passed away at the end of 2019.

Conflicts of Interest

The authors declare no conflicts of interest.

Abbreviations

AMPOL—2-amino-2-methyl-1-propanol; ARS—age rating scale; Cer—Cerebrolisin; D-cyc—D-cycloserine; EAA—excitatory amino acid; nAChR—nicotinic -acetylcholine receptor; CG—cerebral ganglia; CNS—central nervous system; CSF—cerebro spinal fluid; GDF—glia depressing factor; GPR35—G protein-coupled receptor 35; HPLC—high performance liquid chromatography; KAT—kynurenine aminotransferase; KYNA—kynurenic acid; L-KYN—L-kynurenine; N—number; NMDA—N-methyl-D-aspartate; P5P—pyridoxal 5′-phosphate; PYR—pyruvate; SG—subpharyngeal ganglia; TRP—tryptophan.

References

  1. Baran, H.; Jellinger, K.; Deecke, L. Kynurenine metabolism in Alzheimer’s disease. J Neural Transm. 1999, 106, 165–181. [Google Scholar] [CrossRef]
  2. González-Sánchez, M.; Jiménez, J.; Narváez, A.; Antequera, D.; Llamas-Velasco, S.; Martín, A.H.-S.; Molina Arjona, J.A.; López de Munain, A.; Lleó Bisa, A.; Marco, M.-P.; Rodríguez-Núñez, M.; Pérez-Martínez, D.A.; Villarejo-Galende, A.; Bartolome, F.; Domínguez, E.; Carro, E. Kynurenic Acid Levels are Increased in the CSF of Alzheimer’s Disease Patients. Biomolecules 2020, 10, 571. [Google Scholar] [CrossRef]
  3. Knapskog, A.-B.; Aksnes, M.; Edwin, T.H.; Ueland, P.M.; Ulvik, A.; Fang, E.F.; Eldholm, R.S.; Halaas, N.B.; Saltvedt, I.; Giil, L.M.; Watne, L.O. Higher concentrations of kynurenic acid in CSF are associated with the slower clinical progression of Alzheimer’s disease. Alzheimer’s & Dementia 2023, 19(12), 5573–5582. [Google Scholar]
  4. Fernandes, B.S.; Inam, M.E.; Enduru, N.; Quevedo, J.; Zhao, Z. The kynurenine pathway in Alzheimer’s disease: a meta-analysis of central and peripheral levels. Braz. J. Psychiatry 2023, 45, 286–297. [Google Scholar] [CrossRef] [PubMed]
  5. Choe, K.; Bakker, L.; van den Hove, D.L.A.; Eussen, S.J.P.M.; Kenis, G.; Ramakers, I.H.G.B.; Verhey, F.R.J.; Rutten, B.P.F.; Köhler, S. Kynurenine pathway dysregulation in cognitive impairment and dementia: a systematic review and meta-analysis. GeroScience. 2025. REVIEW. [Google Scholar] [CrossRef]
  6. Stone, T.W. Neuropharmacology of quinolinic and kynurenic acids. Pharmacol. Rev. 1993, 45, 309–379. [Google Scholar] [CrossRef]
  7. Birch, P.J.; Grossman, C.J.; Hayes, A.G. Kynurenic acid antagonizes responses to NMDA via an action at the strychnine-insensitive glycine receptor. Eur. J. Pharmacology. 1988, 154, 85–87. [Google Scholar] [CrossRef]
  8. Hilmas, C.; Pereira, E.F.R.; Alkondon, M.; Rassoulpour, A.; Schwarcz, R.; Albuquerque, E.X. The brain metabolite kynurenic acid inhibits alpha7 nicotinic receptor activity and increases non-alpha7 nicotinic receptor expression: physiopathological implications. J Neurosci. 2001, 21, 7463–7473. [Google Scholar] [CrossRef]
  9. Wang, J.; Simonavicius, N.; Wu, X.; Swaminath, G.; Reagan, J.; Tian, H.; Ling, L. Kynurenic acid as a ligand for orphan G protein-coupled receptor GPR35. Biol J Chem. 2006, 281(31), 22021–22028. [Google Scholar] [CrossRef]
  10. Stone, T.W.; Stoy, N.; Darlington, L.G. An Expanding range of targets for kynurenine metabolism of tryptophan. Trends in Paharmacological Science 2013, 34, 136–143. [Google Scholar] [CrossRef] [PubMed]
  11. Foster, A.C.; Vezzani, A.; French, E.D.; Schwarcz, R. Kynurenic acid blocks neurotoxicity and seizures induced in rats by the related brain metabolite quinolinic acid. Neurosci Lett. 1984, 48, 273–278. [Google Scholar] [CrossRef] [PubMed]
  12. Bratek-Gerej, E.; Ziembowicz, A.; Godlewski, J.; Salinska, E. The Mechanism of the Neuroprotective Effect of KynurenicAcid in the Experimental Model of Neonatal Hypoxia–Ischemia: The Link to Oxidative Stress. Antioxidants 2021, 10, 1775. [Google Scholar] [CrossRef]
  13. Albuquerque, E.X.; Alkondon, M.; Pereira, E.F.R.; Castro, N.G.; Schrattenholz, A.; Barbosa, C.T.F.; Bonfante-Carbarcas, R.; Aracava, Y.; Eisenberg, H.M.; Maelike, A. Properties of neuronal nicotinic acetylcholine receptors: pharmacological characterization and modulation of synaptic function. J Pharmacol Exp Ther. 1997, 280, 1117–1136. [Google Scholar] [CrossRef]
  14. Albuquerque, E.X.; Pereira, E.F.; Alkondon, M.; Rogers, S.W. Mammalian nicotinic receptors: from structure to function. Physiol Rev. 2009, 89, 73–120. [Google Scholar] [CrossRef]
  15. Greenamyre, J.T.; Maragos, W.F.; Albin, R.L.; Penney, J.B.; Young, A.B. Glutamate transmission and toxicity in Alzheimer’s disease. Review. Prog Neuropsychopharmacol Biol Psychiatry 1988, 12, 421–430. [Google Scholar] [CrossRef] [PubMed]
  16. Baran, H.; Jan Pietryja, M.; Kepplinger, B. Importance of Modulating Kynurenic Acid Metabolism—Approaches for the Treatment of Dementia. Biomolecules. 2025, 15, 74. [Google Scholar] [CrossRef] [PubMed]
  17. Kepplinger, B.; Baran, H.; Kainz, A.; Ferraz-Leite, H.; Newcombe, J.; Kalina, P. Age-related increase of kynurenic acid in human cerebrospinal fluid: Positive correlation with IgG and beta2-microglobulin changes. Neurosignals. 2005, 14, 126–135. [Google Scholar] [CrossRef]
  18. Chess, A.C.; Simoni, M.K.; Alling, T.E.; Bucci, D.J. Elevations of kynurenic acid produce working memory deficits. Schizophr Bull. 2007, 33, 797–804. [Google Scholar] [CrossRef]
  19. Vohra, M.; Lemieux, G.A.; Lin, L.; Ashrafi, K. The beneficial effects of dietary restriction on learning are distinct from its effects on longevity and mediated by depletion of a neuroinhibitory metabolite. PLoS Biol 2017, 15, 1–24. [Google Scholar] [CrossRef] [PubMed]
  20. Potter, M.C.; Elmer, G.I.; Bergeron, R.; Albuquerque, E.X.; Guidetti, P.; Wu, H.Q.; Schwarcz, R. Reduction of endogenous kynurenic acid formation enhances extracellular glutamate, hippocampal plasticity, and cognitive behavior. Neuropsychopharmacol. 2010, 35, 1734–1742. [Google Scholar] [CrossRef]
  21. Kozak, R.; Campbell, B.M.; Strick, C.A.; Horner, W.; Hoffmann, W.E.; Kiss, T.; Chapin, D.S.; McGinnis, D.; Abbott, A.L.; Roberts, B.M.; Fonseca, K.; Guanowsky, V.; Young, D.A.; Seymour, P.A.; Dounay, A.; Hajos, M.; Williams, G.V.; Castner, S.A. Reduction of Brain Kynurenic Acid Improves Cognitive Function. J. Neurosci. 2014, 34, 10592–10602. [Google Scholar] [CrossRef]
  22. Stone, T.W. Does Kynurenic Acid Act on Nicotinic Receptors? An Assessment of the Evidence. J. Neurochem. 2020, 152, 627–649. [Google Scholar] [CrossRef]
  23. Ishikawa, T.; Okuno, E.; Tsujimoto, M.; Nakamura, M.; Kido, R. Kynurenine-pyruvate Aminotransferase in Rat Kidney and Brain. Adv. Exp. Med. Biol. 1991, 294, 567–572. [Google Scholar] [PubMed]
  24. Kido, R. Kynurenate Forming Enzymes in Liver, Kidney and Brain. Kynurenine and Serotonin Pathways. Adv. Exp. Med. Biol. 1991, 294, 201–205. [Google Scholar] [PubMed]
  25. Okuno, E.; Nakamura, M.; Schwarcz, R. Two kynurenine aminotransferases in human brain. Brain Res. 1991, 542, 307–312. [Google Scholar] [CrossRef]
  26. Baran, H.; Kepplinger, B. Cerebrolysin Lowers Kynurenic Acid Formation - An In Vitro Study. Eur. Neuropsychopharmacol. 2009, 19, 161–168. [Google Scholar] [CrossRef]
  27. Baran, H.; Kepplinger, B. D-Cycloserine Lowers Kynurenic Acid Formation - New Mechanism of action. Eur. Neuropsychopharmacol. 2014, 24, 639–644. [Google Scholar] [CrossRef] [PubMed]
  28. Baran, H.; Kepplinger, B. Porcine tissues influence kynurenic acid formation. Parkinsonism Relat. Disord. 2006, 12 Suppl.1, 36. [Google Scholar] [CrossRef]
  29. Baran, H.; Pietryja, M.J.; Kronsteiner, C.; Kepplinger, B. Jerusalem Balsam Lowers Kynurenic Acid Formation: An In Vitro Study. J. Tradit. Med. Clin. Naturopat. 2017, 3, 1–5. [Google Scholar] [CrossRef]
  30. Kepplinger, B.; Kronsteiner, C.; Więcek, M.; Baran, H. Hawthorn berry extract lowers kynurenic acid and anthranilic acid formation. 15th ANA Meeting at the IST Austria, 2017, September 24th-26th; Abstract. [Google Scholar]
  31. Radzki, R.P.; Bieńko, M.; Polak, P.; Szkucik, K.; Ziomek, M.M.; Ostapiuk, M.; Bieniaś, J. Is the consumption of snail meat actually healthy? An analysis of the osteotropic influence of snail meat as a sole source of protein in growing rats. J. Anim. Physiol. Anim. Nutr. 2018, 102, 885–891. [Google Scholar] [CrossRef]
  32. Acebes, F.; Solar, P.; Moris, J.; Loy, I. Associative learning phenomena in the snail (Helix aspersa): Conditioned inhibition. Learn. Behav. 2012, 40, 34–41. [Google Scholar] [CrossRef]
  33. Crow, T. Pavlovian Conditioning of Hermissenda: Current Cellular, Molecular, and Circuit. Review. Learn. Mem. 2004, 11, 229–238. [Google Scholar] [CrossRef] [PubMed]
  34. Ungless, M.A. Dissociation of food-finding and tentacle-lowering, following food-attraction conditioning in the snail, Helix aspersa. In Behavioural processes; Elsevier, 2001. [Google Scholar]
  35. Kronsteiner, C.; Baran, H.; Kepplinger, B. Kynurenic acid levels and kynurenine aminotransferase I, II and III activities in ganglia, heart and liver of snail Helix Pomatia. Cell Physiol. Biochem. 2023, 18(57), 279–297. [Google Scholar] [CrossRef]
  36. Moroni, F.; Russi, P.; Lombardi, G.; Beni, M.; Carlà, V. Presence of Kynurenic Acid in the Mammalian Brain. J. Neurochem. 1988, 51, 177–180. [Google Scholar] [CrossRef]
  37. Fukui, S.; Schwarcz, R.; Rapoport, S.I.; Takada, Y.; Smith, Q.R. Blood-brain barrier transport of kynurenines: implications for brain synthesis and metabolism. J. Neurochem. 1991, 56, 2007–2017. [Google Scholar] [CrossRef]
  38. Turski, W.A.; Gramsbergen, J.B.P.; Traitler, H.; Schwarcz, R. Rat brain slices produce and liberate kynurenic acid upon expose to L-kynurenine. J Neurochem. 1989, 52, 1629–1636. [Google Scholar] [CrossRef]
  39. Swartz, K.J.; Matson, W.R.; MacGarvey, U.; Ryan, E.A.; Beal, M.F. Measurement of Kynurenic Acid in Mammalian Brain Extracts and Cerebrospinal Fluid by High-performance Liquid Chromatography with Fluorometric and Coulometric Electrode Array Detection. Anal. Biochem. 1990, 185, 363–376. [Google Scholar] [CrossRef]
  40. Ungless, M.A. A Pavlovian analysis of food-attraction conditioning in the snail Helix aspersa. Animal Learning & Behavior. 1998, 26, 15–19. [Google Scholar]
  41. Acebes, F.; Solar, P.; Carnero, S.; Loy, I. Blocking of conditioning of tentacle lowering in the snail (Helix asparsa). The Qarterly Journal of experimental Psychology 2009, 62, 1315–1327. [Google Scholar] [CrossRef] [PubMed]
  42. Goff, D.C. D-Cycloserine: An evolving role in learning and neuroplasicity in Schizophrenia. Schizophrenia Bulletin 2012, 38(5), 936–941. [Google Scholar] [CrossRef]
  43. Goff, D.C. D-cycloserine in Schizophrenia: New Strategies for Improving Clinical Outcomes by Enhancing Plasticity. Curr. Neuropharmacol. 2017, 15, 21–34. [Google Scholar] [CrossRef]
  44. Oxenkrug, G.; van der Hart, M.; Roeser, J.; Summergrad, P. Anthranilic acid: a potential biomarker and treatment target for schizophrenia. Ann. Psychiatry Ment. Health 2016, 4, 1059. [Google Scholar]
  45. Kepplinger, B; Sedlnitzky-Semler, B.; Eigner, S.; Kalina, P.; Berger, P.; Baran, H. Stroke Patients after repetitive Transcranial Magnetic Stimulation (rTMS) –Alterations of Tryptophan Metabolites in the Serum. Int. J. Neurorehabilitation 2014, 1, 128. [Google Scholar] [CrossRef]
  46. Kepplinger, B.; Baran, H.; Sedlnitzky-Semler, B.; Badawi, N.R.; Erhart, H. Stochastic resonance activity influences serum tryptophan metabolism in healthy human subjects. Int. J. Tryptophan Res. 2011, 4, 49–60. [Google Scholar] [CrossRef] [PubMed]
  47. Baran, H.; Staniek, K.; Bertignol-Spörr, M.; Attam, M.; Kronsteiner, C.; Kepplinger, B. Effects of various kynurenine metabolites on respiratory parameters of rat brain, liver and heart mitochondria. Int. J. Tryptophan. Res. 2016, 9, 17–29. [Google Scholar] [CrossRef] [PubMed]
  48. Guillemin, G.J.; Wang, L.; Brew, B.J. Quinolinic acid selectively induces apoptosis of human astrocytes: potential role in AIDS dementia complex. J Neuroinflammation 2005, 26(2), 16. [Google Scholar] [CrossRef]
  49. Heyes, M.P.; Brew, B.J.; Saito, K.; Quearry, B.J.; Price, R.W.; Lee, K.; Bhalla, R.B.; Der, M.; Markey, S.P. Inter-relationships between quinolinic acid, neuroactive kynurenines, neopterin and beta2-microglobulin in cerebrospinal fluid and serum of HIV-1-infected patients. J. Neuroimmunol. 1992, 40, 71–80. [Google Scholar] [CrossRef]
  50. Baran, H.; Hainfellner, J.A.; Kepplinger, B. Kynurenic acid metabolism in various types of brain pathology in HIV-1 infected patients. Int J Tryptophan Res. 2012, 5, 49–64. [Google Scholar] [CrossRef]
  51. Kronsteiner, C. Tryptophanmetabolismus bei Steinadlern (Aquila chrysaetos)—Untersuchung des Alterungsprozesses. Ph.D./Mater’s Thesis, Julius-Maximilians-Universität Würzburg Julius Maximilian University of Würzburg, Würzburg, Germany, 2014. [Google Scholar]
  52. Oxenkrug, G. Anthranilic Acid–G-Protein coupled receptor109A–Cytosolic Phospholipase A2–Myelin–Cognition Cascade: A New Target for the Treatment/Prevention of Cognitive Impairment in Schizophrenia, Dementia, and Aging. Int. J. Mol. Sci. 2024, 25, 13269. [Google Scholar] [CrossRef]
  53. Berlinguer-Palmini, R.; Masi, A.; Narducci, R.; Cavone, L.; Maratea, D.; Cozzi, A.; Sili, M.; Moroni, F.; Mannaioni, G. GPR35 Activation Reduces Ca2+Transients and Contributes to the Kynurenic Acid-Dependent Reduction of Synaptic Activity at CA3-CA1 Synapses. PLoS ONE 2013, 8, e82180. [Google Scholar] [CrossRef]
  54. Deng, F.; Yang, D.; Qing, L.; Chen, Y.; Zou, J.; Jia, M.; Wang, Q.; Jiang, R.; Huang, L. Exploring the interaction between the gut microbiota and cyclic adenosine monophosphate-protein kinase A signaling pathway: a potential therapeutic approach for neurodegenerative diseases. Neural Regen Res. 2025, 20, 3095–3112. [Google Scholar] [CrossRef]
  55. Ted Abel, T.; Nguyen, P.V. Regulation of hippocampus-dependent memory by cyclic AMP-dependent protein kinase. Prog. Brain Res. 2008, 169, 97–115. [Google Scholar] [CrossRef]
Figure 1. Kynurenine pathway of tryptophan metabolism.
Preprints 190399 g001
Figure 2. Scheme for behavioural experiments.
Preprints 190399 g002
Figure 3. Experimental table for memory test.
Preprints 190399 g003
Figure 4. Effect of various doses of L-kynurenine on KYNA formation using KAT I (A), KAT II (B), and KAT III (C) activities of Helix pomatia snail liver homogenates. Data represent means ± SEM. Significance of differences: * p < 0.05; ** p < 0.01; *** p < 0.001 vs. the corresponding control liver homogenate. KAT I, KAT II, and KAT III activities of the control snail liver homogenate were 25.02 ± 2.8 (N = 8), 10.87 ± 1.33 (N = 8), and 12.75 ± 01.54 (N = 8) (pmol/mg wet tissue weight/h). The following doses of L-KYN were used: 50 µM (N = 2); 100 µM (N = 2); 200 µM (N = 4); 400 µM (N = 4); 800 µM (N = 4). Abbreviation: L-kynurenine (L-KYN). Numbers of independent measurements are given in parentheses (N). Assay performed as described in the Materials and Methods section.
Preprints 190399 g004
Figure 5. Effect of various doses of cerebrolysin and D-cycloserine on KAT I (A), KAT II (B), and KAT III (C) activities of Helix pomatia snail liver homogenates. Data represent means ± SEM. Significance of differences: * p < 0.05; ** p < 0.01; *** p < 0.001 vs. the corresponding control liver homogenate. KAT I, KAT II, and KAT III activities of the control snail liver homogenate were 25.02 ± 2.8 (N = 8), 10.87 ± 1.33 (N = 9), and 12.75 ± 01.54 (N = 9) (pmol/mg wet tissue weight/h). Abbreviations: Cerebrolysin (Cer); D-cycloserine (D-Cyc). Numbers of independent measurements are given in parentheses (N). The following doses of Cer were used : 1 µL (N = 4); 5 µL (N = 4); 10 µL (N = 4); 15 µL (N = 4). The following doses of D-Cyc were used: 50 µM (N = 4); 100 µM (N = 4); 200 µM (N = 9); 400 µM (N = 9); 800 µM (4). Assay performed as described in the Materials and Methods section. Data represent means ± SEM.
Preprints 190399 g005
Figure 6. Time dependence of KYNA synthesis in the presence of two different concentrations of L-kynurenine (L-KYN) (200 µM and 400 µM) in liver homogenate of Helix Pomatia snail for 1 h, 2 h, and 4 h of incubation time using KAT I (A), KAT II (B), and KAT III (C). Data represent means ± SEM; KAT I, KAT II, and KAT III activities are presented in fmol/mg tissue /h. The assay was performed as described in the Materials and Methods section. Data represent means ± SEM. Data numbers (N) are given in parentheses in Figure 6A–C: C0 1 h (N = 5), C0 2 h (N = 7), C0 4 h (N = 5); 200 µM L-KYN 1 h (N = 2), 200 µM 2 h (N = 4), 200 µM L-KYN 4 h (N = 2); 400 µM L-KYN 1 h (N = 2), 400 µM L-KYN 2 h (N = 4), 400 µM L-KYN 4 h (N = 2).
Preprints 190399 g006
Figure 7. KAT I (A), KAT II (B), and KAT III (C):Time dependence of KYNA synthesis in the presence of two different concentrations of cerebrolysin (Cer) (0.25 µL and 2.5 µL) in the liver homogenate of the Helix Pomatia snail for 1 h, 2 h, and 4 h of incubation time under standard assay conditions, as described in the Materials and Methods section. Data represent means ± SEM. KAT I (A), KAT II (B), and KAT III (C) activities are presented in fmol/mg tissue /h. Data numbers (N) are given in parentheses for (AC): C0 1 h (N = 5), C0 2 h (N = 7), C0 4 h (N = 5); 0.25 µL Cer 1 h (N = 5), 0.25 µL Cer 2 h (N = 7), 0.25 µL Cer 4 h (N = 5); 2.5 µL Cer 1 h (N = 5), 2.5 µL Cer 2 h (N = 7), 2.5 µL Cer 4 h (N = 5).
Preprints 190399 g007
Figure 8. KAT I (A), KAT II (B), and KAT III (C): Time dependence of KYNA synthesis in the presence of two different concentrations of D-cycloserine (D-Cyc) (200 µM and 400 µM) in the liver homogenate of the Helix Pomatia snail for 1 h, 2 h, and 4 h of incubation time under standard assay conditions, as described in the Materials and Methods section. Data represent means ± SEM. KAT I (A), KAT II (B), and KAT III (C) activities are presented in fmol/mg tissue /h. Data numbers (N) are given in parentheses for (AC): C0 1 h (N = 5), C0 2 h (N = 7), C0 4 h (N = 5); 200 µM D-Cyc 1 h (N = 5), 200 µM D-Cyc 2 h (N = 7), 200 µM D-Cyc 4 h (N = 5); 400 µM D-Cyc 1 h (N = 5), 400 µM 2 h (N = 7), 400 µM 4 h (N = 5).
Preprints 190399 g008
Figure 9. Dose-response of L-kynurenine (L-Kyn) (4.6 mg, 7.4 mg, 14.7 mg) treatment on KYNA formation in the ganglia of the snail Helix pomatia using one or three treatments. Dose-response of cerebrolysin (15 µl, 50 µl, 100 µl) treatment on KYNA formation in the ganglia of the snail Helix pomatia using one or three treatments, in vivo. Dose-response of D-cycloserine (0.5 mg, 1 mg, 2 mg) treatment on KYNA formation in the ganglia of the snail Helix pomatia using one or three treatments, in vivo. Data represent mean ± SEM; Number of independent data are in parenthesis (N=3). KYNA levels are expressed in fmol/mg tissue.
Preprints 190399 g009
Figure 10. A. Effect of L-kynurenine, cerebrolysin, D-cycloserine, L-kynurenine/cerebrolysin, or L-kynurenine/D-cycloserine treatment on KYNA levels in the ganglia (A). The KYNA level was measured after the first test cycle. Data represent means ± SEM. Significance of differenc The KYNA level was measured after the first test cycle. es: * p < 0.05; ** p < 0.01; *** p < 0.001 vs. the corresponding Control (T0). KYNA levels are presented in fmol/mg tissue. Abbreviations: L-kynurenine (L-KYN); D-cycloserine (D-Cyc); Cerebrolysin (Cer). Data numbers are given in parentheses: CO (N = 6); L-Kyn (N = 8); L-Kyn/D-Cyc (N = 6); L-Kyn/Cer (N = 6); D-Cyc (N =6); Cer (N = 6).
Preprints 190399 g010a
Figure 11. Evaluation of the effect of L-kynurenine and pharmacological treatment on tentacle lowering (A) Data numbers are given in parentheses: CO (N = 6); CO2 (N = 6); L-Kyn (N = 4); Cer (N = 6); D-Cyc (N = 5); L-Kyn + Cer (N = 5); L-Kyn + D-Cyc (N = 6).
Preprints 190399 g011aPreprints 190399 g011b
Table 1. Experimental design for in vivo pharmacological study. Abbreviations: Control (CO); L-kynurenine (L-KYN); D-cycloserine (D-CYC); Cerebrolysin (CER).
Number of Groups/Name Treatment
Group 1: CO1 Water
Group 2: CO2 Water
Group 3: L-KYN L-kynurenine
Group 4: D-CYC D-cycloserine
Group 5: CER Cerebrolysin
Group 6: L-KYN/D-CYC L-kynurenine + D-cycloserine
Group 7: L-KYN/CER L-kynureniene + cerebrolysin
Disclaimer/Publisher’s Note: The statements, opinions and data contained in all publications are solely those of the individual author(s) and contributor(s) and not of MDPI and/or the editor(s). MDPI and/or the editor(s) disclaim responsibility for any injury to people or property resulting from any ideas, methods, instructions or products referred to in the content.
Copyright: This open access article is published under a Creative Commons CC BY 4.0 license, which permit the free download, distribution, and reuse, provided that the author and preprint are cited in any reuse.
Prerpints.org logo

Preprints.org is a free preprint server supported by MDPI in Basel, Switzerland.

Subscribe

Disclaimer

Terms of Use

Privacy Policy

Privacy Settings

© 2026 MDPI (Basel, Switzerland) unless otherwise stated