
Submitted:
29 April 2025
Posted:
30 April 2025
You are already at the latest version
Abstract
The cuprizone (CPZ) toxin-induce animal model is suitable for studying the neurodegenerative processes of multiple sclerosis (MS) and the underlying molecular mechanisms. Cognitive de-cline is widespread in MS and has a marked impact on the quality of life of patients. Further-more, alterations in the kynurenine pathway (KP) of tryptophan degradation are remarkably evident not only in MS but also in its CPZ model too. Our aim was to investigate the KP in de-tail while simultaneously analyzing cognitive abilities during long-term CPZ exposure at dif-ferent time points during intoxication and recovery period. In our study, mice were fed with 0.2% CPZ toxin for 12 weeks followed by a 4-week recovery phase after toxin withdrawal. In the fourth, eighth and twelfth weeks of the demyelination period and at the end of the fourth week of the remyelination phase, we analyzed the cognitive ability of the animals with the Y-Maze test and we examined the distribution of all metabolites involved in the KP of TRP breakdown in plasma and five brain regions using ultra-high-performance liquid chromatography with tandem mass spectrometry (UHPLC-MS/MS) technique. During bioanalytical analyses, we ob-served discrepancies in the levels of all neuroactive metabolites of KP, including anthranilic acid (AA), xanthurenic acid (XA), kynurenic acid (KYNA), quinaldic acid (QAA), 3-hydoxykynurenine (3-HK), 3-hydroxyanthranilic acid (3-HANA), picolinic acid (PA) and quinolinic acid (QUIN), in response to toxin treatment both in the periphery and in the CNS. As the treatment progressed, the concentration of metabolites XA, KYNA, QAA, 3-HK, 3-HANA moved at drastically lower values, while QUIN or PA showed dynamic changes. Nevertheless, we noticed normalization of the metabolite levels upon remyelination. In parallel, we determined a notable cognitive de-cline in the CPZ-treated group. Overall, we identified the profile of neuroactive metabolites of the KP in periphery and CNS, as well as cognitive impairment during chronic treatment. Con-sequently, our studies were the first to confirm the link between the kynurenine metabolite ab-normalities seen in the CPZ model and MS, thereby emphasizing the relevance of the kynurenine metabolite profile, opening further opportunities to identify and investigate the mechanisms of neurodegenerative processes.
Keywords:
cuprizone
; multiple sclerosis
; chronic treatment
; cognitive dysfunction
; tryptophan metabolism
1. Introduction
Multiple sclerosis (MS) is a chronic inflammatory neurodegenerative disease, which affects more than 2.8 million people worldwide [1] and it usually occurs in young adulthood [2,3]. The disease is characterized by inflammatory and demyelinating processes that contribute to damage and loss of oligodendrocytes and axons, gliosis, as well as neurodegeneration [3,4]. In additional to focal inflammatory changes, smoldering disease activity which occurs in the early disease process, is characterized by low-grade inflammation and neural dysregulation [3,5]. Smoldering inflammation results in diffuse damage and atrophy in white and gray matter, while reduced or absent remyelination efficiency may also contribute to neuroaxonal damage [5,6]. At the onset of the disease, the most MS patients have a relapsing remitting (RRMS) course, characterized by episodically recurring exacerbations of the disease and subacute neurological impairment [3]. However, over the years, the disease may transform into secondary progressive (SPMS) MS in the majority of patients, where smoldering disease activity can be identified and a slow progressive clinical deterioration is seen in the absence of clinically evident relapses. While in a smaller percentage of MS patients, the illness may start with a primary progressive (PPMS) form, in which a progressive course of the disease is experienced from the beginning [3,7]. Nevertheless, currently available disease-modifying therapies are effective in reducing relapse rates, but they have limited success in preventing the progression and reducing smoldering disease activity [8]. During the progressive process, there is a gradual accumulation and worsening of disability [9]. According to studies, cognitive impairment affects a large number of patients with progressive MS and has a negative impact of quality of life [10,11]. Cognitive dysfunctions involve a decline in attention, memory, information processing speed or executive functions, which worsens over time [10]. Cognitive impairment is already present in early MS and their frequency increases with the duration of the disease [12,13,14]. Furthermore, fatigue and depression can aggravate cognitive impairment in MS [15]. However, studies have shown that cognitive impairments occurs more frequently and more severe in PPMS than in RRMS [9,16]. Thus, the higher incidence of cognitive impairment is SPMS may be associated with a longer duration of the disorder and the progressive form [9].
Cuprizone (CPZ) -induced demyelination model is a well-characterized and widely used animal model of MS for investigating of molecular mechanisms and for a broader analysis of demyelination and remyelination processes [17]. Administration of the copper chelating CPZ toxin results in severe demyelination with microglia and macrophage activation, and astrocyte reactivation in the absence of a peripheral immune response [18]. Furthermore, CPZ administration also affects the kinetics of amino-3-hydroxy-5-methyl-4-isoxazolepropionic acid (AMPA) and N-methyl-D-aspartate (NMDA) receptors [19]. The reproducibility of the model and the relatively simple oral administration of the toxin make this animal model easy to monitor and control, as well as widely used animal model. CPZ treatment causes significant and severe demyelinating changes in several brain regions, such as the thalamus, hippocampus, striatum, corpus callosum, cerebral cortex or cerebellum [18,20,21,22]. Chronic toxin treatment for more than 12 weeks can result in, among other things, extensive gliosis, marked demyelination, significant weight loss and decreased remyelination efficiency [18]. Therefore, the CPZ rodent model is excellent for studying the progressive form of MS, the neurodegenerative processes following myelin damage, as well as the pathomechanisms underlying the damage [20].
The metabolic abnormalities of tryptophan (TRP) breakdown are found in the pathogenesis and progression of several neurodegenerative diseases, including MS, and these metabolic pathways play important roles [23,24,25]. The degradation of the amino acid TRP occurs via the three main pathways, to a lesser extent through the serotonin and indole pathways, while to the greatest extent via the kynurenine pathway (KP) (Figure 1).
The serotonin pathway produces, among others melatonin and serotonin, which are also known in neuropsychiatric and neurodegenerative diseases [26], while the indole pathway, which is regulated by the gut microbiome produces numerous indole derivatives, the alterations of which have also been reported in many diseases [27,28,29]. Nonetheless, TRP can be predominantly converted to L-kynurenine in the KP, from which several neuroactive metabolites can be formed, such as anthranilic acid (AA), 3-hydroxy-L-kynurenine (3-HK), kynurenic acid (KYNA) or xanthurenic acid (XA). Furthermore, diverse metabolites that are considered neurotoxic are also produce, like 3-hydroxyanthranilic acid (3-HANA) and quinolinic acid (QUIN). However, various end-products are formed too, such as picolinic acid (PA) or quinaldic acid (QAA). Nevertheless, at the end of the KP of TRP degradation, nicotinamide adenine dinucleotide (NAD+) is ultimately formed, an essential biochemical cofactor for cellular function [25,30] (Figure 1).
Studies have reported abnormalities and alterations in level of metabolites in the KP, in various neurodegenerative diseases, including MS [25,31,32]. Elevated KYNA levels were observed during the relapse phase of the MS, while its concentration decreased in the remission period [33,34]. Similarly, in the progressive phase of the disease, decreased KYNA levels were also reported [35]. Furthermore, reduced serum 3-HK concentration were described in MS patients, in the recent study [36]. In addition, decreased KYNA and PA levels were also observed in the cerebrospinal fluid of MS patients, while QUIN concentration was increased [25]. In our previous studies, we also performed several analyses of TRP metabolism in the CPZ rodent model of MS, in which we were the first to report in the literature on alterations affecting the three main pathways of TRP breakdown caused by acute, 5-week CPZ intoxication [37,38,39]. On the one hand, we observed significant changes in plasma TRP, 3-HK, KYNA, XA and AA levels, as well as a decreased in AA and 3-HK concentrations, and an increase in TRP levels in different brain regions, as a result of toxin treatment [38]. On the other hand, during a detailed examination of the periphery, we noticed a marked decrease in 3-HK, XA, KYNA, QAA and indole-3-lactic acid levels in various visceral tissues after poisoning. In addition, we experienced a decrease in urinary TRP, KYNA and XA concentrations, while an increase in serotonin and 5-hydroxyindoleacetic acid levels, among others during acute CPZ treatment [39].
Based on these previous results, in the present study we further investigated the metabolic abnormalities of the KP of TRP degradation in the central nervous system (CNS) using long-term CPZ treatment in rodents. In addition, we analyzed the degree of cognitive damage caused by intoxication by the effect of demyelination processes, and by detecting remyelination efficiency. As we have assumed that chronic toxin treatment has a marked influence on both cognitive abilities and metabolic distributions in various brain regions as the damage progress, in addition, to the metabolic concentration differences observed so far, additional neuroactive and neurotoxic metabolite levels may also show alterations.
Therefore, we examined the distribution of all metabolites in the KP in the plasma on the periphery, and in five brain regions of the CNS, as well as alterations in cognitive abilities at different times of chronic CPZ toxin treatment and at the end of remyelination period.
2. Results
2.1. Investigation of Animals’ Body Weight
On the third day of the toxin treatment, a significant decrease in the body weight was observed in the CPZ-treated group compared to the CO. This deviation became more pronounced as the toxicity processed between the groups. However, during the remyelination phase of the examination, the dissimilarity between the groups gradually decreased and at the end of the investigation, there was no significant difference between the CO and CPZ groups (Figure 2).
2.2. Behavioral Test
2.2.1. Spontaneous Alteration
During our work, we observed that in the Y-Maze behavioral test, the short-term memory of the animals was significantly reduced after 4 weeks and 8 weeks of CPZ treatment compared to the control group (Figure 3). The cognitive decline in MS often occurs simultaneously with motor symptoms, therefore we were curious about the velocity of the animals during short-term memory tests. We found that, were significant difference between the CPZ group in the treatment of 4 weeks vs. 12 weeks and 16, the remyelination weeks (Figure 4). In addition, we found a significant difference between the velocity of the 4 vs. 12 and 16 week CO groups.
Our results reflect that while CPZ had a negative effect on short-term memory already at the beginning of treatment, motor symptoms only appeared during the subsequent 12-week treatment and these motor symptoms persisted during the remyelination phase, in contrast to the effect on memory, which approached the performance of the 4-week control group during the remyelination phase.
2.2.2. Spatial Reference Memory
In spatial reference memory studies, we found that cuprizone had a significant effect on long-term memory during the 12-week treatment and during the remyelination phase. Namely, the animals spent significantly less time exploring the novel arm during the 12-week treatment and 16-week remyelination phase than during the 4-week and 8-week cuprizone treatment (Figure 5). Thus, the animals were unable to distinguish between the already explored and the arm that was unexplored to them. When we examined how many times the mice entered the previously explored arms, i.e. how many times they made mistakes, we observed that there were fewer mistakes during the 12-week cuprizone treatment (Figure 6). However, this may be because the animals spent more time in the previously explored arms than in the novel arms during the observation interval, because they did not recognize them.
In the long-term memory tests, no differences were found between the groups in terms of the velocity of the animals (Figure 7). Presumably, the animals’ motor performance did not affect the result.
2.3. Bioanalytical Measurement of Tryptophan Metabolites
2.3.1. Plasma
In the case of plasma samples, in the fourth week of CPZ poisoning, we observed an increased TRP concentration and markedly decreased KYNA, QAA and XA levels in the toxin-treated group, which distinctions persisted until the end of intoxication, then normalized in the remyelination phase and the levels of metabolites in the CO and CPZ groups were approximately in the same range (Figure 8). Similarly, the levels of 3-HK, AA and PA also decreased at the beginning of CPZ treatment, but as demyelination progressed, their concentrations showed an increasing trend, and during the remyelination period, already there were no differences in the levels of 3-HK and AA between the groups, while the concentration of PA was markedly higher in the CPZ group at the twelfth week of intoxication, which deviation remained between the CO and CPZ groups until the end of recovery (Figure 9). Already at the beginning of the toxin treatment, the concentrations of 3-HANA and QUIN were also drastically reduced in the CPZ group, which remained at a low level in the case of 3-HANA until the twelfth week of the demyelination period. However, at the end of remyelination phase the concentrations of 3-HANA in the two groups were in the same range. In contrast, the level of QUIN showed an increasing tendency as the treatment progressed, and by the end of intoxication its level was significantly higher in the CPZ group, than in the CO group. Even so, by the fourth week of recovery, the QUIN level was markedly reduced in the CPZ toxin-treated group, compared to the CO (Figure 10).
During the examination of the plasma excitotoxicity index, we experienced a pronounced increase in the CPZ-treated group, which was exceptionally high until twelfth weeks of intoxication, but at the end of the remyelination phase there was no significant discrepancy between the studied groups (Figure 11).
2.3.2. Striatum
During the examination of the brain regions, in the striatum significantly lower concentrations of 3-HK, XA, AA and QAA were detected in the CPZ group as early as the fourth week of treatment. As the damage progressed, the levels of 3-HK showed a slow increase, and at the end of recovery, higher concentrations were observed in the toxin-treated group, compared to the CO. In contrast, the XA and QAA levels were lower in the CPZ group throughout the demyelination period, but by the fourth week of remyelination, the concentrations of these metabolites were already in the same range in the CO and CPZ groups. In addition, after the initial decreased AA value in the CPZ group, its concentration significantly increased in the treated group by the twelfth week of poisoning, but by the end of remyelination phase AA levels were also similar between the groups (Figure 12).
2.3.3. Cortex
At the fourth week of the intoxication, a significant decrease was observed in the levels of XA, AA and QAA in the cortex of the CPZ-treated group, compared to the CO. This markedly low concentrations of XA and QAA metabolites remained until the end of the poisoning, but at the end of the recovery period there were no differences between the CO and CPZ groups. The level of KYNA was remarkably lower in the toxin-treated group only in the eighth week of demyelination, which became even more evident in the twelfth week of the treatment, but at the end of the remyelination phase there was no visible discrepancy in the KYNA concentration between the groups. In contrast, after the initial decreased level of AA, it showed a slow increase in parallel with the progression and by the fourth week of remyelination the elevated AA concentration of the CPZ group became significant compared to the CO group (Figure 13). Furthermore, already in the fourth week of the investigation, we experienced a marked decrease in the concentration of 3-HK and 3-HANA in the cortex of the toxin-treated group. These reduced concentrations persisted until the twelfth week of the demyelination period. Nevertheless, at the end of remyelination phase, the 3-HANA level of the CPZ group was in the same range as the CO, while the 3-HK concentration of the treated group was noticeably increased compared to the CO group (Figure 14).
2.3.4. Hippocampus
Similar to the cortex, the hippocampal KYNA level in the CPZ group became significantly lower only in the eighth week of poisoning. However, as the toxicity worsened, its level gradually increased and at the end of remyelination the KYNA concentration was remarkably higher in the treated group than in the CO. In contrast, the values of 3-HK, QAA and XA were markedly lower in the CPZ group already in the fourth week of the study. However, as a results of a possible compensatory mechanism, the levels of the metabolites increased with the progression of the demyelination period and by the end of the remyelination phase the aforementioned metabolite concentrations of the CO and CPZ groups did not differ significantly (Figure 15). In addition, the AA level of the CPZ group was also decreased definitely in the fourth week of poisoning, but increased with the progress of the treatment weeks, and by the end of recovery period there was no discrepancy between the groups. Furthermore, we observed marked increase in the hippocampal PAD and QUIN concentratios in the toxin-treated group at week 12 of toxin administration, which deviation disappeared in the case of QUIN at the end of remyelination. However, the value of PAD was remarkably elevated in the treated group at week 4 of the recovery period compared to the CO group (Figure 16).
2.3.5. Brainstem
During the analysis of the brainstem, we noticed significant decrease in 3-HK, QAA and XA levels in the CPZ group in the fourth week of toxin treatment. These low concentrations of QAA and XA remained until the twelfth week of intoxication, but by the end of the recovery phase, the metabolite levels of the CO and CPZ group were in the same range. Nevertheless, the 3-HK level gradually increased as the treatment progressed and at the fourth week of remyelination a higher 3-HK value was observed in the toxin-treated group, than in the CO. In contrast, the level of KYNA was remarkably higher in the CPZ group by the fourth week of the demyelination period, but by the twelfth week of toxin administration its level decreased drastically in the CPZ group, while by the end of recovery period KYNA also showed a markedly higher value compared to the CO group (Figure 17). Furthermore, the brainstem concentrations of 3-HANA and QUIN were significantly lower in the CPZ-treated group in the fourth week of poisoning, and after slow increase in concentrations, these metabolite level differences disappeared by the end of toxicity and the values of the 3-HANA and QUIN did not differ decidedly between the CO and CPZ groups (Figure 18).
2.3.6. Cerebellum
During the analyses of the cerebellum, in the fourth week of toxicity, we experienced marked decreases in the levels of 3-HK, XA and QAA of the CPZ-treated group. These reduced metabolite values remained until the end of the poisoning, but by the end of recovery these differences in concentrations disappeared between the groups. Furthermore, the level of 3-HK in the treated group showed a slow increase trend as the poisoning progressed and by the end of investigation, there was no detectable diversion between the CO and CPZ groups for this metabolite. Nonetheless, the KYNA concentration in the cerebellum of the CPZ group decreased remarkably by the eighth week of intoxication. This deviation became even more obvious by the end of the poisoning. However, as a result remyelination period, the level of KYNA was significantly higher in the toxin-treated group, than in the CO (Figure 19). In contrast, alterations in cerebellar PAD and QUIN concentrations were only detectable as a result of longer period of toxin administration, namely PAD showed a significant increase in the CPZ group at the eighth week of toxin treatment, while in the CPZ group, we only saw a marked increase in QUIN level at the twelfth week of treatment. Moreover, these remarkably elevated metabolite concentrations were still detectable at the end of the remyelination phase (Figure 20).
3. Discussion
In the present study, we investigated alterations in cognitive abilities and the KP of TRP degradation at different time points of long-term CPZ treatment and at the end of the recovery period following chronic toxin administration. The CPZ–induced animal model, which mimics the progressive form of MS, provides an opportunity to investigate neurodegenerative processes, as well as for detailed mapping of the underlying metabolic processes and analyze the relationships. Based on our previous data, as a result of acute CPZ toxin treatment, in addition to extensive and severe demyelination, we observed differences in the metabolic pathways of TRP breakdown in both periphery and CNS [37,38,39]. Consequently, in this study we investigated how chronic CPZ intoxication affects the discrepancy in the metabolite concentrations involved in the KP, whether in addition to the metabolite levels seen during acute toxin treatment, other neuroactive metabolic products also show differences. Since we assumed that the neuroprotective and neurotoxic metabolite concentration alterations seen in the progressive form of MS can also found in the CPZ rodent model under the influence of long-term intoxication.
Body weight measurements were performed throughout the investigation to monitor the condition of the animals and to verify the reliability of the toxin-induce rodent model, during which we experienced a marked decrease in body weight of the CPZ –treated group during the entire period of intoxication, compared to the CO group, which results are consistent with our previous study data [37,38,39]. To assess the change in cognitive abilities and animals’ motor performance due to chronic treatment, we used Y-Maze behavioral tests at different time points of poisoning. Furthermore, using bioanalytical analyses, we examined the alterations in the concentrations of metabolites involved in the KP of TRP degradation, due to long-term CPZ treatment.
In our investigation, we identified several kynurenine metabolites whose concentrations were remarkably influenced by the duration of CPZ poisoning. In addition to the metabolite determined in our previous studies, the current chronic treatment caused marked distinctions, including in the level of TRP, AA, KYNA, QAA, XA, 3-HK, 3-HANA, PA and QUIN in plasma and brain regions. Furthermore, we also identified additional KP metabolic products, including 3-HANA, PA and QUIN, whose concentration differences were not detectable during the previous acute treatments, i.e. they show a discrepancy as a result of chronic intoxication. In addition, we noticed dynamic changes in the level of other neuroactive metabolites, such as KYNA, XA, AA or 3-HK in the diverse sample types examined during the treatment period. In the case of plasma, with the exception of TRP, the levels of almost all metabolites decreased significantly at the beginning of CPZ exposure. By the end of the toxin treatment, only the concentrations of PA and QUIN increased markedly, while during the remyelination period the metabolite levels normalized. These results are supported by the increased excitotoxic index, in the plasma of the CPZ group. The QUIN/KYNA ratio, which indicates excitotoxicity, is increasingly gaining attention, and our data may support the theory that excitotoxic metabolites can cause neurodegeneration in MS [40]. Similar differences were noticed in the brain regions, here too, the most kynurenine metabolites decreased as a result of intoxication in the treated group compared to the CO, then at the end of the toxin administration we only experienced a significant increase in the levels of PAD and QUIN in some brain regions. So, based on our data, it appears that toxin exposure drastically blocks almost all metabolites of the KP in both the periphery and the CNS. While, the deviations in metabolite concentrations observed during the recovery period can be explained as a compensatory mechanism. In some cases, the body seems to try to normalize markedly decreased neuroprotective and neuroactive metabolite levels, as well as increased concentrations of neurotoxic metabolites after CPZ withdrawal.
Several studies have reported abnormalities in the KP in various neurodegenerative and neuropsychiatric diseases, including MS [25,41]. Degeneration and/ or inflammation of the CNS have a marked impact on TRP metabolism and thus on the KP too [23]. Significantly elevated TRP levels have been observed in peripheral blood mononuclear cell of RRMS patients [42]. However, other studies have not found any deviations in CSF TRP concentrations between patients with MS and controls [35,40,43,44]. Similarly, no significant differences in TRP level were found in serum samples of PPMS and SPMS patients [35]. In the case of CSF KYNA level, Tömösi et al. reported a reduced concentration in RRMS patients [40]. Furthermore Rejdak et al. also decreased KYNA levels were experienced in MS patients in remission phase [34], but an increased KYNA concentrations were seen in the CSF of RRMS during relapse [33]. The production of KYNA is mostly associated with astrocytes, while the other kynurenine metabolites are mainly formed in microglial cells [32] KYNA is an endogenous NMDA receptor antagonist, as well as AMPA and kainate receptors antagonist [45,46]. Through the inhibition of the NMDA receptor, it can protect neurons from the harmful effects of excessive Ca2+ influx, which is an important process of neurodegeneration. In addition, the antioxidant properties of KYNA have also been reported [47], further strengthening its neuroprotective role [32,48,49]. Other studies have announced that KYNA plays a neuroprotective role in progressive MS [50,51]. Increased KYNA levels in PPMS have been reported to have neuroprotective effects both clinically and experimentally, slowing disease progression [52,53]. Whereas SPMS patients show reduced neuroprotective activity, which clearly illustrated the crucial dissimilarities in KP in the different clinical forms of MS [41,54].
AA, XA and PA are also referred to as Janus-faced metabolites [55]. AA has been shown to be a potent free radical scavenger [48,56], it has effect on respiratory parameters [57] and the synthesis of non-steroidal anti-inflammatory agents [58,59]. It may also play an antioxidant role, as well as an inhibitor of QUIN production, but AA can also have a negative effect on neuronal survival as an iron chelator [60,61]. Studies have shown that XA also function as an antioxidant, because it can scavenge free radicals and superoxide anion, as well as inhibit hematoxylin autooxidation and lipid peroxidation, among others [48,56,62,63,64]. Furthermore, XA is a metabotropic glutamate receptor agonist, affecting glutamate excitotoxicity, and is able to enhance postsynaptic glutamate uptake and impact transsynaptic glutamate accessibility, thereby influencing glutamate excitotoxicity [65]. In addition, XA can impact extracellular glutamate attainability by inhibiting presynaptic glutamate transport [55,66]. PA functions as a macrophage activator and can influence macrophage proteins [67,68,69]. The role of this metabolite in neurodegeneration processes through the coactivation of macrophage by PA is accentuated [70]. Nevertheless, relatively little data are available for this metabolite in MS, However, a study reported higher PA levels in the RRMS patients and lower values in PPMS, as well as a contrary link between PICA and QUIN [41,71]. Nonetheless, studies analyzing the distribution of PA found no differences between CSF and serum levels in RRMS patients [40,44]. Furthermore, other studies have shown higher QUIN levels in the CSF samples of patients with MS than in controls [40,44], as well as an elevated serum QUIN concentrations have also been described in the disease [40]. In progressive MS, QUIN may be liable for the tau protein phosphorylation [72]. Regarding to the QUIN/KYNA distribution, Tömösi et al. reported an elevated ratio in both CSF and serum samples among MS patients, compared to the control group [40]. However, decreased plasma levels of QUIN and 3-HK were reported in the SM group, than in the control, while a higher QUIN/KYNA ratio was observed in MS patients [73].
QUIN is a competitive NMDA receptor agonist [32,55]. It can induce excitotoxicity by increasing Ca2+ influx and glutamate release, while inhibiting glutamate reuptake in astrocytes, as well as increasing the production of reactive oxygen species [32,74,75]. Moreover, QUIN can also increase lipid peroxidation, the depletion of some endogenous antioxidants, and the phosphorylation of certain proteins, thereby contributing to the pathogenesis of various neurodegenerative diseases [32,74,76,77,78]. Additional neurotoxic effects of QUIN include disturbance of the blood-brain barrier, increased oxidative stress through the formation of reactive oxygen and nitrogen species, or gliotoxicity [55,74,79] Due to its neurotoxic properties, it shows concentration differences in several disorders and its elevated levels can be associated with the pathomechanism of various neurological diseases [25,41,55,80]. Both QUIN and 3-HK, as neuroactive metabolites, can generate cell death via diverse excitotoxic processes [79,81,82]. However, 3-HK and 3-HANA are relatively controversial metabolites, because previously thought to be neurotoxic, but recent studies have also shed light on their beneficial properties. On the one hand, they can influence the neurotoxic effect of QUIN [83], as well as together regulate the redox balance of brain tissue, thereby preventing further damage [56,60,81]. Furthermore, 3-HK and 3-HANA may also act as important antioxidants [56,84,85]. On the other hand, 3-HK can induce oxidative damage [56], and apoptosis of hippocampal and cortical neurons [86,87,88]. Similarly, 3-HANA has been reported as a prooxidative and neurotoxic metabolite in some studies [82,88], but others have announced neuroprotective and immunomodulatory effects [89,90]. Furthermore, a recent study reported reduced serum 3-HK levels in MS patients, which may be associated with increased microglial activation [36]. In addition, reduced 3-HK levels have also been reported in serum and plasma samples of patients with schizophrenia and major depression [91,92].
Nevertheless, our study confirmed that long-term intoxication has significant effects on working memory of mice too. In addition, we determined that chronic CPZ treatment remarkably impaired long-term memory in toxin-treated mice as a function of treatment time. Thus, we identified notably cognitive impairment in the treated group as a result of long-term toxin administration. Studies suggest that neuroinflammation and oxidative stress may contribute to the aging process and this inflammatory state can ultimately be linked to impairments in motor and cognitive function [93]. Studies have also shown that cognitive decline is a common symptom in MS, affecting more than half of patients and may be an important indicator of further disease progression [94]. Furthermore, it significantly affecting patients’ daily lives, while its frequently varies throughout the course of the disease [95]. Cognitive impairment is a common manifestation on disability in early MS, which may also precede the appearance of physical symptoms, but may be associated with motor dysfunction too [96,97]. Cognitive decline is more common in PMS, in the older MS patients and among men [98], while the progressive form is related to more serious damage to some cognitive brain areas [9]. Cognitive impairment most often affects cognitive processing speed and episodic memory [95]. Furthermore, changes in brain networks contribute pronouncedly to cognitive decline, the primary sign of which may be atrophy of gray matter [55]. Disease-related cognitive decline may result from inflammation of the CNS and the interaction of neuronal damage. Moreover, impaired of information processing speed may be connected with MS-related damage to the thalamus, corpus callosum, cerebellum, basal ganglia or temporal cortex, among others [55]. The key to the efficiency of cognitive functions as complex brain processes is the local information processing and the effective connection of different brain regions. Consequently, harmful processes, including metabolic abnormalities can disrupt the appropriate interaction, causing cognitive dysfunction [98]. The examination and assessment of cognitive abilities in MS are important and significant in choosing the therapy applied, determining the disability status of patients and improving their quality of life [99]. Studies have shown that cognitive impairment is more likely to be associated with irreversible demyelination processes and the resulting neuronal damage than with acute inflammatory activity [100]. Therefore, treatments that also aim at possible neuroprotection, such as dimethyl fumarate, may be more effective in preventing and improving cognitive impairment [101,102]. In the experimental autoimmune encephalomyelitis (EAE) model, dimethyl fumarate treatment improved, among other things, hippocampus-related cognitive performances [102]. Investigations in this model have shown a link between synaptopathy induced by microglial activation and cognitive dysfunction, because damage to the hippocampus causes impairment of memory and learning, which can be linked to, among others, premature microglial activation or neurodegeneration [103]. As microglia, their dysfunction and the resulting oxidative stress and inflammatory conditions have been implicated in age-related CNS abnormalities [93]. Furthermore, acute CPZ toxin treatment can cause cognitive impairment and behavioral abnormalities [18,104]. Nevertheless, studies have shown that elevated QUIN levels and a higher KYN/TRP ratio are associated with impaired cognitive performance [55,105]. While KYNA, as a Janus-faced metabolite, can express distinct effects in a concentration-dependent manner on different receptors and via diverse mechanisms, which concentration differences can also be associated with the deterioration of cognitive functions [105,106,107,108]. Based on the interaction and communication of the gut-brain axis, it can be assumed that changes in the metabolic pathway of TRP degradation may also have an impact on cognitive functions [109]. Nevertheless, studies investigating the relationship between TRP metabolites and cognitive performance in neurodegenerative and neuropsychiatric diseases suggest the involvement of kynurenines in cognitive and behavioral symptoms. However, it is important to note, that some of them are contradictory and incomplete, and therefore further studies are needed to clarify the relation between KP and cognitive performance [55].
The authors admit the limitations of our investigation and the used animal model. The CPZ toxin model of MS is mainly suitable for studying neurodegenerative processes in the absence of peripheral immune response [18]. However, based on our analyses, despite the secondary involvement of the immune system, we identified marked metabolite differences, which affected the concentration of almost all metabolites in the KP examined during long-term treatment. Furthermore, we also acknowledge an even longer investigation period would have allowed for further analysis of metabolites and, consequently, the subsequent investigation of remyelination efficacy.
Nonetheless, to our knowledge, our research group is the first to investigate the changes in KP during long-term CPZ treatment in parallel with the analysis of cognitive performance, from which we pioneered the identification of alterations in almost all metabolites of the pathway and cognitive decline due to toxin administration. In addition, we determined the dynamic concentration changes of the examined metabolites as a result of intoxication. Therefore, our results confirm that the levels of metabolites in the KP in the periphery and the CNS change consistently under the influence of toxin exposure. Moreover, during long-term CPZ treatment, we found a correspondence between the metabolite alterations caused by CPZ intoxication and the neuroactive metabolite changes seen in the MS, which confirms the relevance of the CPZ rodent model and the importance of metabolic discrepancy due to progressive damage. Overall, our results are notably consistent, showing robust uniform metabolite patterns in the peripheral and CNS as neurodegenerative processes progress, which confirms the relevance of applying these analyses in clinical practice.
4. Materials and Methods
4.1. Animal Experiments and Sample Collection
Eight weeks old C57BL/6J male mice were used (n = 80) in our investigation. The animals were bred and maintained under standard laboratory conditions with 12 h‒12 h light/dark cycle at 24 ± 1ºC and 45‒55% relative humidity in the Animal House of the Department of Neurology, University of Szeged. The investigations were in accordance with the Ethical Codex of Animal Experiments and were approved by the Ethics Committee of the Faculty of Medicine, University of Szeged, and the National Food Chain Safety Office with a permission number of XI./475/2024. The experiment was performed partly as previously described in our previous studies [37,38]. Briefly, the animals were housed in groups of 5 in polycarbonate cages (530 cm3 floor space). Before starting of the experiment, animals were acclimated to grounded standard rodent chow for 2 weeks, and the weight of the animals was measured every other day.
The CPZ toxin was administered to half of the experimental animals (n = 40) for 12 weeks by a diet containing 0.2% CPZ (bis-cyclohexanone-oxaldihydrazone; Sigma-Aldrich, St. Louis, MO, USA) mixed into a grounded standard rodent chow with free access to water. For control group (CO), age and weight-matched animals were used (n = 40) which had rodent chow and free access to water. At the end of the fourth, eighth and twelfth weeks, 10 animals were randomly chosen from both CO and CPZ groups and terminated for further analysis. Thus, at the end of the demyelination phase, 60 animals were terminated (n = 60; 30 CPZ treated and 30 CO animals). The surviving animals (n = 20; 10 CPZ treated and 10 CO animals) underwent the remyelination phase for 4 weeks and at the end of the sixteenth week of the recovery phase the all animals were sacrificed, as follows (Figure 21). Y-Maze behavioral tests were performed at the end of the fourth, eighth and twelfth weeks of demyelination phase, as well as at the end of the 4-week remyelination period (Figure 21).
The animals were terminated based on our previous studies [37,38,39]. In summary, the mice were anesthetized with intraperitoneal 4% chloral hydrate (10 ml/kg body weight). For further studies, mice (CO: n = 40, CPZ: n = 40) were perfused transcardially with artificial cerebrospinal fluid (aCSF). Blood samples were taken from the left heart ventricle into Eppendorf tubes with disodium ethylenediaminetetraacetate dihydrate and the plasma samples were separated by centrifugation (3500 rpm for 10 min at 4°C). The diverse brain regions, namely the striatum, cortex, hippocampus, brainstem and cerebellum, were removed from the animals. All samples were removed on ice and stored at –80°C until further use.
4.2. Behavioral Investigation
To assess the cognitive abilities of mice, we performed a Y-Maze behavioral test, which is an excellent method for analyzing short-term memory in animals. The animals of the CPZ-treated and control groups (n = 40 animals/group) were placed in a Y-shaped compartment (21 x 7 x 15.5 cm) with the same arm length, and spontaneous alteration and spatial reference memory were analyzed, performing the tests and calculating the percent alteration as described in the manuscript of Kraeuter et al. [110], with the difference that during the spontaneous alteration test, the mice were allowed to explore the maze undisturbed for 5 minutes. All tests were recorded with a camera (Basler ace Classic acA1300 -60gm, Basler AG, Ahrensburg, Germany) and analyzed with a software (EthoVision XT14, Noldus Information Technology BV, Wageningen, Netherlands). Our tests were performed in the fourth, eighth and twelfth weeks of toxin administration, as well as in the fourth week of the recovery period.
4.3. Ultra-High Performance Liquid Chromatography with Tandem Mass Spectrometry (UHPLC–MS/MS) Measurement
Plasma samples were prepared [38,39] and measured according to previously published methodologies [111,112] using ultra-high performance liquid chromatography-tandem mass spectrometry (UHPLC-MS/MS). Brain samples were prepared [38] and measured [111,112] according to previously published methodologies using UHPLC-MS/MS.
4.4. Excitotoxicity Index
4.5. Statistical Analysis
The statistical analyses were carried out with the IBM SPSS Statistics 28.0 software (SPSS Inc., Chicago, IL, USA). For the statistical analysis of body weight, two-way repeated-measures analysis of variance (ANOVA) was used. Pairwise comparisons of group means were based on the estimated marginal means with Sidak or Tamhane’s T2 post hoc test with adjustment for multiple comparisons. Concerning the behavioral test, Normality with Kolmogorov-Smirnov post hoc test, Homogenity of variances with Levene test and One-Way ANOVA with Dunnett T3 or LSD post hoc tests statistical analysis were performed. While in case of velocity of mice in Y-Maze spatial reference memory test, non-parametrical Kruskal-Wallis test was used. Regarding the UHPLC-MS/MS measurements, after checking for its assumptions (checking for outliers, Shapiro and Levene tests), we applied one-way ANOVA test to evaluate the results. Pairwise comparisons of group means were based on the estimated marginal means with Sidak or Tamhane’s T2 post hoc test with adjustment for multiple comparisons. In the case of the assumptions not being met, we applied non-parametric statistics (Kruskal-Wallis test). We rejected null hypotheses when the corrected p level was < 0.05, and in such cases, the differences were considered significant.
Author Contributions
Conceptualization, H.P., Z.G. and L.V.; writing—original draft preparation, H.P., Z.G. and D.M.; performed the experiments, analyzed, and interpreted the data, H.P., Z.G. and D.M.; visualization, H.P., and D.M.; writing—review and editing, H.P., Z.G., D.M., C.R., P.M., P.K., and L.V.; project administration, L.V.; funding acquisition, L.V. and P.K. All authors have read and agreed to the published version of the manuscript.
Funding
This research was funded by National Research, Development and Innovation Office – NKFIH 138125, SZTE SZAOK-KKA No:2022/5S729, HUN-REN-SZTE Neuroscience Research Group, and by University of Szeged Open Access Fund, Grant ID: 7674. Project no TKP2021-EGA-32 has been implemented with the support provided by the Ministry of Culture and Innovation of Hungary from the National Research, Development and Innovation Fund, financed under the TKP2021-EGA funding scheme. The research was supported by the Incubation Competence Centre of the Life Sciences Cluster of the Centre of Excellence for Interdisciplinary Research, Development and Innovation of the University of Szeged. Helga Polyák Ph.D. is a member of the Preventive Health Sciences Research Group.
Institutional Review Board Statement
The animal study protocol was approved by the Protection of Animals in Research of the University of Szeged (Szeged, Hungary) and the Scientific Ethics Committee for Animal Research of the Protection of Animals Advisory Board (XI./475/2024). The protocol for animal care was approved both by the Hungarian Health Committee (40/2013 (II.14.)) and the directive of the European Parliament (2010/63/EU).
Informed Consent Statement
Not applicable.
Data Availability Statement
The data presented in this study are available on request from the corresponding author.
Conflicts of Interest
The authors declare no conflicts of interest.
Declaration of conflicting interests
The authors declared no potential conflicts of interest with respect to the research, authorship, and/or publication of this article.
Abbreviations
| AA | Anthranilic acid |
| AMPA | amino-3-hydroxy-5-methyl-4-isoxazolepropionic acid |
| CO | Control |
| CNS | Central nervous system |
| CPZ | Cuprizone |
| 3-HANA | 3-hydroxyanthranilic acid |
| 3-HK | 3-hydroxy-L-kynurenine |
| KP | Kynurenine pathway |
| KYN | Kynurenine |
| KYNA | Kynurenic acid |
| UHPLC-MS/MS | Ultra-high performance liquid chromatography-tandem mass spectrometry |
| MS | Multiple sclerosis |
| NAD+ | Nicotineamide adenine dinucleotide |
| NMDA | N-methyl-D-aspartate |
| PA | Picolinic acid |
| PAD | Derivatized picolinic acid |
| PPMS | Primary progressive multiple sclerosis |
| RRMS | Relapsing-remitting multiple sclerosis |
| SPMS | Secondary progressive multiple sclerosis |
| TRP | Tryptophan |
| XA | Xanthurenic acid |
| QAA | Quinaldic acid |
| QUIN | Quinolinic acid |
References
- Walton C, King R, Rechtman L, Kaye W, Leray E, Marrie RA, et al. Rising prevalence of multiple sclerosis worldwide: Insights from the Atlas of MS, third edition. Mult Scler 2020;26:1816–21. [CrossRef]
- Moles L, Egimendia A, Osorio-Querejeta I, Iparraguirre L, Alberro A, Suárez J, et al. Gut Microbiota Changes in Experimental Autoimmune Encephalomyelitis and Cuprizone Mice Models. ACS Chem Neurosci 2021;12:893–905. [CrossRef]
- Woo MS, Engler JB, Friese MA. The neuropathobiology of multiple sclerosis. Nat Rev Neurosci 2024;25:493–513. [CrossRef]
- Cagol A, Schaedelin S, Barakovic M, Benkert P, Todea R-A, Rahmanzadeh R, et al. Association of Brain Atrophy With Disease Progression Independent of Relapse Activity in Patients With Relapsing Multiple Sclerosis. JAMA Neurol 2022:e221025. [CrossRef]
- Frischer JM, Weigand SD, Guo Y, Kale N, Parisi JE, Pirko I, et al. Clinical and Pathological Insights into the Dynamic Nature of the White Matter Multiple Sclerosis Plaque. Ann Neurol 2015;78:710–21. [CrossRef]
- Lubetzki C, Zalc B, Williams A, Stadelmann C, Stankoff B. Remyelination in multiple sclerosis: from basic science to clinical translation. The Lancet Neurology 2020;19:678–88. [CrossRef]
- Reich DS, Lucchinetti CF, Calabresi PA. Multiple Sclerosis. N Engl J Med 2018;378:169–80. [CrossRef]
- McGinley MP, Goldschmidt CH, Rae-Grant AD. Diagnosis and Treatment of Multiple Sclerosis: A Review. JAMA 2021;325:765–79. [CrossRef]
- Brochet B, Clavelou P, Defer G, De Seze J, Louapre C, Magnin E, et al. Cognitive Impairment in Secondary Progressive Multiple Sclerosis: Effect of Disease Duration, Age, and Progressive Phenotype. Brain Sci 2022;12:183. [CrossRef]
- Tan LSY, Francis HM, Lim CK. Exploring the roles of tryptophan metabolism in MS beyond neuroinflammation and neurodegeneration: A paradigm shift to neuropsychiatric symptoms. Brain Behav Immun Health 2021;12:100201. [CrossRef]
- Morrow SA. Cognitive Impairment in Multiple Sclerosis: Past, Present, and Future. Neuroimaging Clin N Am 2024;34:469–79. [CrossRef]
- Deloire M, Salort E, Bonnet M, Arimone Y, Boudineau M, Amieva H, et al. Cognitive impairment as marker of diffuse brain abnormalities in early relapsing remitting multiple sclerosis. J Neurol Neurosurg Psychiatry 2005;76:519–26. [CrossRef]
- Brochet B, Ruet A. Cognitive Impairment in Multiple Sclerosis With Regards to Disease Duration and Clinical Phenotypes. Front Neurol 2019;10:261. [CrossRef]
- Meca-Lallana V, Gascón-Giménez F, Ginestal-López RC, Higueras Y, Téllez-Lara N, Carreres-Polo J, et al. Cognitive impairment in multiple sclerosis: diagnosis and monitoring. Neurol Sci 2021;42:5183–93. [CrossRef]
- Denney DR, Lynch SG, Parmenter BA, Horne N. Cognitive impairment in relapsing and primary progressive multiple sclerosis: mostly a matter of speed. J Int Neuropsychol Soc 2004;10:948–56. [CrossRef]
- Ruet A, Deloire M, Charré-Morin J, Hamel D, Brochet B. Cognitive impairment differs between primary progressive and relapsing-remitting MS. Neurology 2013;80:1501–8. [CrossRef]
- Praet J, Guglielmetti C, Berneman Z, Van der Linden A, Ponsaerts P. Cellular and molecular neuropathology of the cuprizone mouse model: clinical relevance for multiple sclerosis. Neurosci Biobehav Rev 2014;47:485–505. [CrossRef]
- Sen MK, Mahns DA, Coorssen JR, Shortland PJ. Behavioural phenotypes in the cuprizone model of central nervous system demyelination. Neurosci Biobehav Rev 2019;107:23–46. [CrossRef]
- Kawabata R, Yamamoto S, Kamimura N, Yao I, Yoshikawa K, Koga K. Cuprizone-induced demyelination provokes abnormal intrinsic properties and excitatory synaptic transmission in the male mouse anterior cingulate cortex. Neuropharmacology 2025;271:110403. [CrossRef]
- Nomura T, Bando Y, Nakazawa H, Kanemoto S, Yoshida S. Pathological changes in mice with long term cuprizone administration. Neurochemistry International 2019;126:229–38. [CrossRef]
- Kipp M, Nyamoya S, Hochstrasser T, Amor S. Multiple sclerosis animal models: a clinical and histopathological perspective. Brain Pathology 2017;27:123–37. [CrossRef]
- Gudi V, Gingele S, Skripuletz T, Stangel M. Glial response during cuprizone-induced de- and remyelination in the CNS: lessons learned. Front Cell Neurosci 2014;8. [CrossRef]
- Lovelace MD, Varney B, Sundaram G, Franco NF, Ng ML, Pai S, et al. Current Evidence for a Role of the Kynurenine Pathway of Tryptophan Metabolism in Multiple Sclerosis. Front Immunol 2016;7. [CrossRef]
- Bansi J, Koliamitra C, Bloch W, Joisten N, Schenk A, Watson M, et al. Persons with secondary progressive and relapsing remitting multiple sclerosis reveal different responses of tryptophan metabolism to acute endurance exercise and training. Journal of Neuroimmunology 2018;314:101–5. [CrossRef]
- Vécsei L, Szalárdy L, Fülöp F, Toldi J. Kynurenines in the CNS: recent advances and new questions. Nat Rev Drug Discov 2013;12:64–82. [CrossRef]
- Davidson M, Rashidi N, Nurgali K, Apostolopoulos V. The Role of Tryptophan Metabolites in Neuropsychiatric Disorders. Int J Mol Sci 2022;23:9968. [CrossRef]
- Dopkins N, Nagarkatti PS, Nagarkatti M. The role of gut microbiome and associated metabolome in the regulation of neuroinflammation in multiple sclerosis and its implications in attenuating chronic inflammation in other inflammatory and autoimmune disorders. Immunology 2018;154:178–85. [CrossRef]
- Gao J, Xu K, Liu H, Liu G, Bai M, Peng C, et al. Impact of the Gut Microbiota on Intestinal Immunity Mediated by Tryptophan Metabolism. Front Cell Infect Microbiol 2018;8:13. [CrossRef]
- Sauma S, Casaccia P. Gut-brain communication in demyelinating disorders. Curr Opin Neurobiol 2020;62:92–101. [CrossRef]
- Badawy AA-B. Kynurenine pathway and human systems. Experimental Gerontology 2020;129:110770. [CrossRef]
- Rajda C, Majláth Z, Pukoli D, Vécsei L. Kynurenines and Multiple Sclerosis: The Dialogue between the Immune System and the Central Nervous System. Int J Mol Sci 2015;16:18270–82. [CrossRef]
- Biernacki T, Sandi D, Bencsik K, Vécsei L. Kynurenines in the Pathogenesis of Multiple Sclerosis: Therapeutic Perspectives. Cells 2020;9. [CrossRef]
- Rejdak K, Petzold A, Kocki T, Kurzepa J, Grieb P, Turski WA, et al. Astrocytic activation in relation to inflammatory markers during clinical exacerbation of relapsing-remitting multiple sclerosis. J Neural Transm 2007;114:1011. [CrossRef]
- Rejdak K, Bartosik-Psujek H, Dobosz B, Kocki T, Grieb P, Giovannoni G, et al. Decreased level of kynurenic acid in cerebrospinal fluid of relapsing-onset multiple sclerosis patients. Neuroscience Letters 2002;331:63–5. [CrossRef]
- Lim CK, Bilgin A, Lovejoy DB, Tan V, Bustamante S, Taylor BV, et al. Kynurenine pathway metabolomics predicts and provides mechanistic insight into multiple sclerosis progression. Sci Rep 2017;7. [CrossRef]
- Saraste M, Matilainen M, Rajda C, Galla Z, Sucksdorff M, Vécsei L, et al. Association between microglial activation and serum kynurenine pathway metabolites in multiple sclerosis patients. Multiple Sclerosis and Related Disorders 2022:103667. [CrossRef]
- Polyák H, Cseh EK, Bohár Z, Rajda C, Zádori D, Klivényi P, et al. Cuprizone markedly decreases kynurenic acid levels in the rodent brain tissue and plasma. Heliyon 2021;7:e06124. [CrossRef]
- Polyák H, Galla Z, Nánási N, Cseh EK, Rajda C, Veres G, et al. The Tryptophan-Kynurenine Metabolic System Is Suppressed in Cuprizone-Induced Model of Demyelination Simulating Progressive Multiple Sclerosis. Biomedicines 2023;11:945. [CrossRef]
- Polyák H, Galla Z, Rajda C, Monostori P, Klivényi P, Vécsei L. Plasma and Visceral Organ Kynurenine Metabolites Correlate in the Multiple Sclerosis Cuprizone Animal Model. Int J Mol Sci 2025;26:976. [CrossRef]
- Tömösi F, Kecskeméti G, Cseh EK, Szabó E, Rajda C, Kormány R, et al. A validated UHPLC-MS method for tryptophan metabolites: Application in the diagnosis of multiple sclerosis. Journal of Pharmaceutical and Biomedical Analysis 2020;185:113246. [CrossRef]
- Fathi M, Vakili K, Yaghoobpoor S, Tavasol A, Jazi K, Mohamadkhani A, et al. Dynamic changes in kynurenine pathway metabolites in multiple sclerosis: A systematic review. Front Immunol 2022;13:1013784. [CrossRef]
- Negrotto L, Correale J. Amino Acid Catabolism in Multiple Sclerosis Affects Immune Homeostasis. The Journal of Immunology 2017;198:1900–9. [CrossRef]
- Aeinehband S, Brenner P, Ståhl S, Bhat M, Fidock MD, Khademi M, et al. Cerebrospinal fluid kynurenines in multiple sclerosis; relation to disease course and neurocognitive symptoms. Brain, Behavior, and Immunity 2016;51:47–55. [CrossRef]
- Rajda C, Galla Z, Polyák H, Maróti Z, Babarczy K, Pukoli D, et al. Cerebrospinal Fluid Neurofilament Light Chain Is Associated with Kynurenine Pathway Metabolite Changes in Multiple Sclerosis. Int J Mol Sci 2020;21. [CrossRef]
- Kessler M, Terramani T, Lynch G, Baudry M. A glycine site associated with N-methyl-D-aspartic acid receptors: characterization and identification of a new class of antagonists. J Neurochem 1989;52:1319–28.
- Birch PJ, Grossman CJ, Hayes AG. Kynurenate and FG9041 have both competitive and non-competitive antagonist actions at excitatory amino acid receptors. Eur J Pharmacol 1988;151:313–5. [CrossRef]
- Lugo-Huitrón R, Blanco-Ayala T, Ugalde-Muñiz P, Carrillo-Mora P, Pedraza-Chaverrí J, Silva-Adaya D, et al. On the antioxidant properties of kynurenic acid: Free radical scavenging activity and inhibition of oxidative stress. Neurotoxicology and Teratology 2011;33:538–47. [CrossRef]
- Pérez-González A, Alvarez-Idaboy JR, Galano A. Free-radical scavenging by tryptophan and its metabolites through electron transfer based processes. J Mol Model 2015;21:213. [CrossRef]
- Goda K, Hamane Y, Kishimoto R, Ogishi Y. Radical scavenging properties of tryptophan metabolites. Estimation of their radical reactivity. Adv Exp Med Biol 1999;467:397–402. [CrossRef]
- Hartai Z, Klivenyi P, Janaky T, Penke B, Dux L, Vecsei L. Kynurenine metabolism in multiple sclerosis. Acta Neurologica Scandinavica 2005;112:93–6. [CrossRef]
- Kepplinger B, Baran H, Kainz A, Ferraz-Leite H, Newcombe J, Kalina P. Age-related increase of kynurenic acid in human cerebrospinal fluid - IgG and beta2-microglobulin changes. Neurosignals 2005;14:126–35. [CrossRef]
- Andiné P, Lehmann A, Ellrén K, Wennberg E, Kjellmer I, Nielsen T, et al. The excitatory amino acid antagonist kynurenic acid administered after hypoxic-ischemia in neonatal rats offers neuroprotection. Neuroscience Letters 1988;90:208–12. [CrossRef]
- Atlas A, Franzen-Röhl E, Söderlund J, Jönsson EG, Samuelsson M, Schwieler L, et al. Sustained Elevation of Kynurenic Acid in the Cerebrospinal Fluid of Patients with Herpes Simplex Virus Type 1 Encephalitis. Int J Tryptophan Res 2013;6:89–96. [CrossRef]
- Myint A-M, Kim YK, Verkerk R, Scharpé S, Steinbusch H, Leonard B. Kynurenine pathway in major depression: evidence of impaired neuroprotection. J Affect Disord 2007;98:143–51. [CrossRef]
- Kupjetz M, Wences Chirino TY, Joisten N, Zimmer P. Kynurenine pathway dysregulation as a mechanistic link between cognitive impairment and brain damage: Implications for multiple sclerosis. Brain Research 2024:149415. [CrossRef]
- González Esquivel D, Ramírez-Ortega D, Pineda B, Castro N, Ríos C, Pérez de la Cruz V. Kynurenine pathway metabolites and enzymes involved in redox reactions. Neuropharmacology 2017;112:331–45. [CrossRef]
- Baran H, Staniek K, Kepplinger B, Stur J, Draxler M, Nohl H. Kynurenines and the respiratory parameters on rat heart mitochondria. Life Sciences 2003;72:1103–15. [CrossRef]
- Badawy AA-B. Hypothesis kynurenic and quinolinic acids: The main players of the kynurenine pathway and opponents in inflammatory disease. Medical Hypotheses 2018;118:129–38. [CrossRef]
- Tanaka M, Spekker E, Szabó Á, Polyák H, Vécsei L. Modelling the neurodevelopmental pathogenesis in neuropsychiatric disorders. Bioactive kynurenines and their analogues as neuroprotective agents—in celebration of 80th birthday of Professor Peter Riederer. J Neural Transm 2022. [CrossRef]
- Chobot V, Hadacek F, Weckwerth W, Kubicova L. Iron chelation and redox chemistry of anthranilic acid and 3-hydroxyanthranilic acid: A comparison of two structurally related kynurenine pathway metabolites to obtain improved insights into their potential role in neurological disease development. J Organomet Chem 2015;782:103–10. [CrossRef]
- Darlington LG, Forrest CM, Mackay GM, Smith RA, Smith AJ, Stoy N, et al. On the biological importance of the 3-hydroxyanthranilic acid: Anthranilic acid ratio. International Journal of Tryptophan Research 2010;3:51–9. [CrossRef]
- Lima VLA, Dias F, Nunes RD, Pereira LO, Santos TSR, Chiarini LB, et al. The Antioxidant Role of Xanthurenic Acid in the Aedes aegypti Midgut during Digestion of a Blood Meal. PLoS One 2012;7:e38349. [CrossRef]
- Murakami K, Ito M, Yoshino M. Xanthurenic acid inhibits metal ion-induced lipid peroxidation and protects NADP-isocitrate dehydrogenase from oxidative inactivation. J Nutr Sci Vitaminol (Tokyo) 2001;47:306–10. [CrossRef]
- Ramírez-Ortega D, Ramiro-Salazar A, González-Esquivel D, Ríos C, Pineda B, Pérez de la Cruz V. 3-Hydroxykynurenine and 3-Hydroxyanthranilic Acid Enhance the Toxicity Induced by Copper in Rat Astrocyte Culture. Oxid Med Cell Longev 2017;2017:2371895. [CrossRef]
- Fazio F, Lionetto L, Curto M, Iacovelli L, Copeland CS, Neale SA, et al. Cinnabarinic acid and xanthurenic acid: Two kynurenine metabolites that interact with metabotropic glutamate receptors. Neuropharmacology 2017;112:365–72. [CrossRef]
- Neale SA, Copeland CS, Uebele VN, Thomson FJ, Salt TE. Modulation of hippocampal synaptic transmission by the kynurenine pathway member xanthurenic acid and other vglut inhibitors. Neuropsychopharmacology 2013;38:1060–7. [CrossRef]
- Bosco MC, Rapisarda A, Massazza S, Melillo G, Young H, Varesio L. The tryptophan catabolite picolinic acid selectively induces the chemokines macrophage inflammatory protein-1 alpha and -1 beta in macrophages. J Immunol 2000;164:3283–91. [CrossRef]
- Melillo G, Cox GW, Biragyn A, Sheffler LA, Varesio L. Regulation of nitric-oxide synthase mRNA expression by interferon-gamma and picolinic acid. J Biol Chem 1994;269:8128–33.
- Melillo G, Cox GW, Radzioch D, Varesio L. Picolinic acid, a catabolite of L-tryptophan, is a costimulus for the induction of reactive nitrogen intermediate production in murine macrophages. J Immunol 1993;150:4031–40.
- Guillemin GJ, Kerr SJ, Smythe GA, Smith DG, Kapoor V, Armati PJ, et al. Kynurenine pathway metabolism in human astrocytes: a paradox for neuronal protection. J Neurochem 2001;78:842–53. [CrossRef]
- Grant RS, Coggan SE, Smythe GA. The Physiological Action of Picolinic Acid in the Human Brain. Int J Tryptophan Res 2009;2:71–9.
- Anderson JM, Hampton DW, Patani R, Pryce G, Crowther RA, Reynolds R, et al. Abnormally phosphorylated tau is associated with neuronal and axonal loss in experimental autoimmune encephalomyelitis and multiple sclerosis. Brain 2008;131:1736–48. [CrossRef]
- Staats Pires A, Krishnamurthy S, Sharma S, Chow S, Klistorner S, Guillemin GJ, et al. Dysregulation of the Kynurenine Pathway in Relapsing Remitting Multiple Sclerosis and Its Correlations With Progressive Neurodegeneration. Neurol Neuroimmunol Neuroinflamm 2025;12:e200372. [CrossRef]
- Guillemin GJ. Quinolinic acid, the inescapable neurotoxin. FEBS J 2012;279:1356–65. [CrossRef]
- Sandi D, Fricska-Nagy Z, Bencsik K, Vécsei L. Neurodegeneration in Multiple Sclerosis: Symptoms of Silent Progression, Biomarkers and Neuroprotective Therapy—Kynurenines Are Important Players. Molecules 2021;26:3423. [CrossRef]
- Rios C, Santamaria A. Quinolinic acid is a potent lipid peroxidant in rat brain homogenates. Neurochem Res 1991;16:1139–43. [CrossRef]
- Pierozan P, Zamoner A, Krombauer Soska Â, Bristot Silvestrin R, Oliveira Loureiro S, Heimfarth L, et al. Acute intrastriatal administration of quinolinic acid provokes hyperphosphorylation of cytoskeletal intermediate filament proteins in astrocytes and neurons of rats. Experimental Neurology 2010;224:188–96. [CrossRef]
- Rahman A, Ting K, Cullen KM, Braidy N, Brew BJ, Guillemin GJ. The Excitotoxin Quinolinic Acid Induces Tau Phosphorylation in Human Neurons. PLoS One 2009;4:e6344. [CrossRef]
- Lugo-Huitrón R, Ugalde Muñiz P, Pineda B, Pedraza-Chaverrí J, Ríos C, Pérez-de la Cruz V. Quinolinic Acid: An Endogenous Neurotoxin with Multiple Targets. Oxid Med Cell Longev 2013;2013:104024. [CrossRef]
- Brundin L, Sellgren CM, Lim CK, Grit J, Pålsson E, Landén M, et al. An enzyme in the kynurenine pathway that governs vulnerability to suicidal behavior by regulating excitotoxicity and neuroinflammation. Transl Psychiatry 2016;6:e865. [CrossRef]
- Capucciati A, Galliano M, Bubacco L, Zecca L, Casella L, Monzani E, et al. Neuronal Proteins as Targets of 3-Hydroxykynurenine: Implications in Neurodegenerative Diseases. ACS Chem Neurosci 2019;10:3731–9. [CrossRef]
- Okuda S, Nishiyama N, Saito H, Katsuki H. 3-Hydroxykynurenine, an Endogenous Oxidative Stress Generator, Causes Neuronal Cell Death with Apoptotic Features and Region Selectivity. Journal of Neurochemistry 1998;70:299–307. [CrossRef]
- Guidetti P, Schwarcz R. 3-Hydroxykynurenine potentiates quinolinate but not NMDA toxicity in the rat striatum. European Journal of Neuroscience 1999;11:3857–63. [CrossRef]
- Colín-González AL, Maya-López M, Pedraza-Chaverrí J, Ali SF, Chavarría A, Santamaría A. The Janus faces of 3-hydroxykynurenine: Dual redox modulatory activity and lack of neurotoxicity in the rat striatum. Brain Research 2014;1589:1–14. [CrossRef]
- Leipnitz G, Schumacher C, Dalcin KB, Scussiato K, Solano A, Funchal C, et al. In vitro evidence for an antioxidant role of 3-hydroxykynurenine and 3-hydroxyanthranilic acid in the brain. Neurochemistry International 2007;50:83–94. [CrossRef]
- Okuda S, Nishiyama N, Saito H, Katsuki H. Hydrogen peroxide-mediated neuronal cell death induced by an endogenous neurotoxin, 3-hydroxykynurenine. Proc Natl Acad Sci U S A 1996;93:12553–8.
- Chiarugi A, Cozzi A, Ballerini C, Massacesi L, Moroni F. Kynurenine 3-mono-oxygenase activity and neurotoxic kynurenine metabolites increase in the spinal cord of rats with experimental allergic encephalomyelitis. Neuroscience 2001;102:687–95. [CrossRef]
- Reyes-Ocampo J, Ramírez-Ortega D, Vázquez Cervantes GI, Pineda B, Montes de Oca Balderas P, González-Esquivel D, et al. Mitochondrial dysfunction related to cell damage induced by 3-hydroxykynurenine and 3-hydroxyanthranilic acid: Non-dependent-effect of early reactive oxygen species production. NeuroToxicology 2015;50:81–91. [CrossRef]
- Krause D, Suh H-S, Tarassishin L, Cui QL, Durafourt BA, Choi N, et al. The Tryptophan Metabolite 3-Hydroxyanthranilic Acid Plays Anti-Inflammatory and Neuroprotective Roles During Inflammation. Am J Pathol 2011;179:1360–72. [CrossRef]
- Lee W-S, Lee S-M, Kim M-K, Park S-G, Choi I-W, Choi I, et al. The tryptophan metabolite 3-hydroxyanthranilic acid suppresses T cell responses by inhibiting dendritic cell activation. International Immunopharmacology 2013;17:721–6. [CrossRef]
- Oxenkrug G, van der Hart M, Roeser J, Summergrad P. Anthranilic Acid: A Potential Biomarker and Treatment Target for Schizophrenia. Ann Psychiatry Ment Health 2016;4.
- Cathomas F, Guetter K, Seifritz E, Klaus F, Kaiser S. Quinolinic acid is associated with cognitive deficits in schizophrenia but not major depressive disorder. Sci Rep 2021;11:9992. [CrossRef]
- Musella A, Gentile A, Rizzo FR, De Vito F, Fresegna D, Bullitta S, et al. Interplay Between Age and Neuroinflammation in Multiple Sclerosis: Effects on Motor and Cognitive Functions. Front Aging Neurosci 2018;10:238. [CrossRef]
- Lechner-Scott J, Agland S, Allan M, Darby D, Diamond K, Merlo D, et al. Managing cognitive impairment and its impact in multiple sclerosis: An Australian multidisciplinary perspective. Mult Scler Relat Disord 2023;79:104952. [CrossRef]
- Benedict RHB, Amato MP, DeLuca J, Geurts JJG. Cognitive impairment in multiple sclerosis: clinical management, MRI, and therapeutic avenues. Lancet Neurol 2020;19:860–71. [CrossRef]
- McNicholas N, O’Connell K, Yap SM, Killeen RP, Hutchinson M, McGuigan C. Cognitive dysfunction in early multiple sclerosis: a review. QJM: An International Journal of Medicine 2018;111:359–64. [CrossRef]
- Alharthi HM, Almurdi MM. Association between cognitive impairment and motor dysfunction among patients with multiple sclerosis: a cross-sectional study. Eur J Med Res 2023;28:110. [CrossRef]
- Margoni M, Preziosa P, Rocca MA, Filippi M. Depressive symptoms, anxiety and cognitive impairment: emerging evidence in multiple sclerosis. Transl Psychiatry 2023;13:264. [CrossRef]
- De Meo E, Portaccio E, Giorgio A, Ruano L, Goretti B, Niccolai C, et al. Identifying the Distinct Cognitive Phenotypes in Multiple Sclerosis. JAMA Neurol 2021;78:1–12. [CrossRef]
- Geurts JJ, Barkhof F. Grey matter pathology in multiple sclerosis. The Lancet Neurology 2008;7:841–51. [CrossRef]
- Linker RA, Lee D-H, Ryan S, Van Dam AM, Conrad R, Bista P, et al. Fumaric acid esters exert neuroprotective effects in neuroinflammation via activation of the Nrf2 antioxidant pathway. Brain 2011;134:678–92. [CrossRef]
- das Neves SP, Santos G, Barros C, Pereira DR, Ferreira R, Mota C, et al. Enhanced cognitive performance in experimental autoimmune encephalomyelitis mice treated with dimethyl fumarate after the appearance of disease symptoms. Journal of Neuroimmunology 2020;340:577163. [CrossRef]
- Mandolesi G, Grasselli G, Musumeci G, Centonze D. Cognitive deficits in experimental autoimmune encephalomyelitis: neuroinflammation and synaptic degeneration. Neurol Sci 2010;31:255–9. [CrossRef]
- Kopanitsa MV, Lehtimäki KK, Forsman M, Suhonen A, Koponen J, Piiponniemi TO, et al. Cognitive disturbances in the cuprizone model of multiple sclerosis. Genes, Brain and Behavior 2021;20:e12663. [CrossRef]
- Stone TW, Darlington LG. The kynurenine pathway as a therapeutic target in cognitive and neurodegenerative disorders. Br J Pharmacol 2013;169:1211–27. [CrossRef]
- Prescott C, Weeks AM, Staley KJ, Partin KM. Kynurenic acid has a dual action on AMPA receptor responses. Neurosci Lett 2006;402:108–12. [CrossRef]
- Rózsa E, Robotka H, Vécsei L, Toldi J. The Janus-face kynurenic acid. J Neural Transm (Vienna) 2008;115:1087–91. [CrossRef]
- Martos D, Tuka B, Tanaka M, Vécsei L, Telegdy G. Memory Enhancement with Kynurenic Acid and Its Mechanisms in Neurotransmission. Biomedicines 2022;10:849. [CrossRef]
- Ghadiri F, Ebadi Z, Asadollahzadeh E, Naser Moghadasi A. Gut microbiome in multiple sclerosis-related cognitive impairment. Multiple Sclerosis and Related Disorders 2022;67:104165. [CrossRef]
- Kraeuter A-K, Guest PC, Sarnyai Z. The Y-Maze for Assessment of Spatial Working and Reference Memory in Mice. Methods Mol Biol 2019;1916:105–11. [CrossRef]
- Galla Z, Rácz G, Grecsó N, Baráth Á, Kósa M, Bereczki C, et al. Improved LC-MS/MS method for the determination of 42 neurologically and metabolically important molecules in urine. Journal of Chromatography B 2021;1179:122846. [CrossRef]
- Galla Z, Rajda C, Rácz G, Grecsó N, Baráth Á, Vécsei L, et al. Simultaneous determination of 30 neurologically and metabolically important molecules: A sensitive and selective way to measure tyrosine and tryptophan pathway metabolites and other biomarkers in human serum and cerebrospinal fluid. Journal of Chromatography A 2021;1635:461775. [CrossRef]
- Barone P. The ‘Yin’ and the ‘Yang’ of the kynurenine pathway: excitotoxicity and neuroprotection imbalance in stress-induced disorders. Behavioural Pharmacology 2019;30:163. [CrossRef]
- Globus MY-T, Ginsberg MD, Busto R. Excitotoxic index — a biochemical marker of selective vulnerability. Neuroscience Letters 1991;127:39–42. [CrossRef]
Figure 1.
Tryptophan metabolic pathways. Degradation of the essential amino acid tryptophan via the serotonin, kynurenine and indole pathways. NAD+: nicotinamide adenine dinucleotide.
Figure 1.
Tryptophan metabolic pathways. Degradation of the essential amino acid tryptophan via the serotonin, kynurenine and indole pathways. NAD+: nicotinamide adenine dinucleotide.
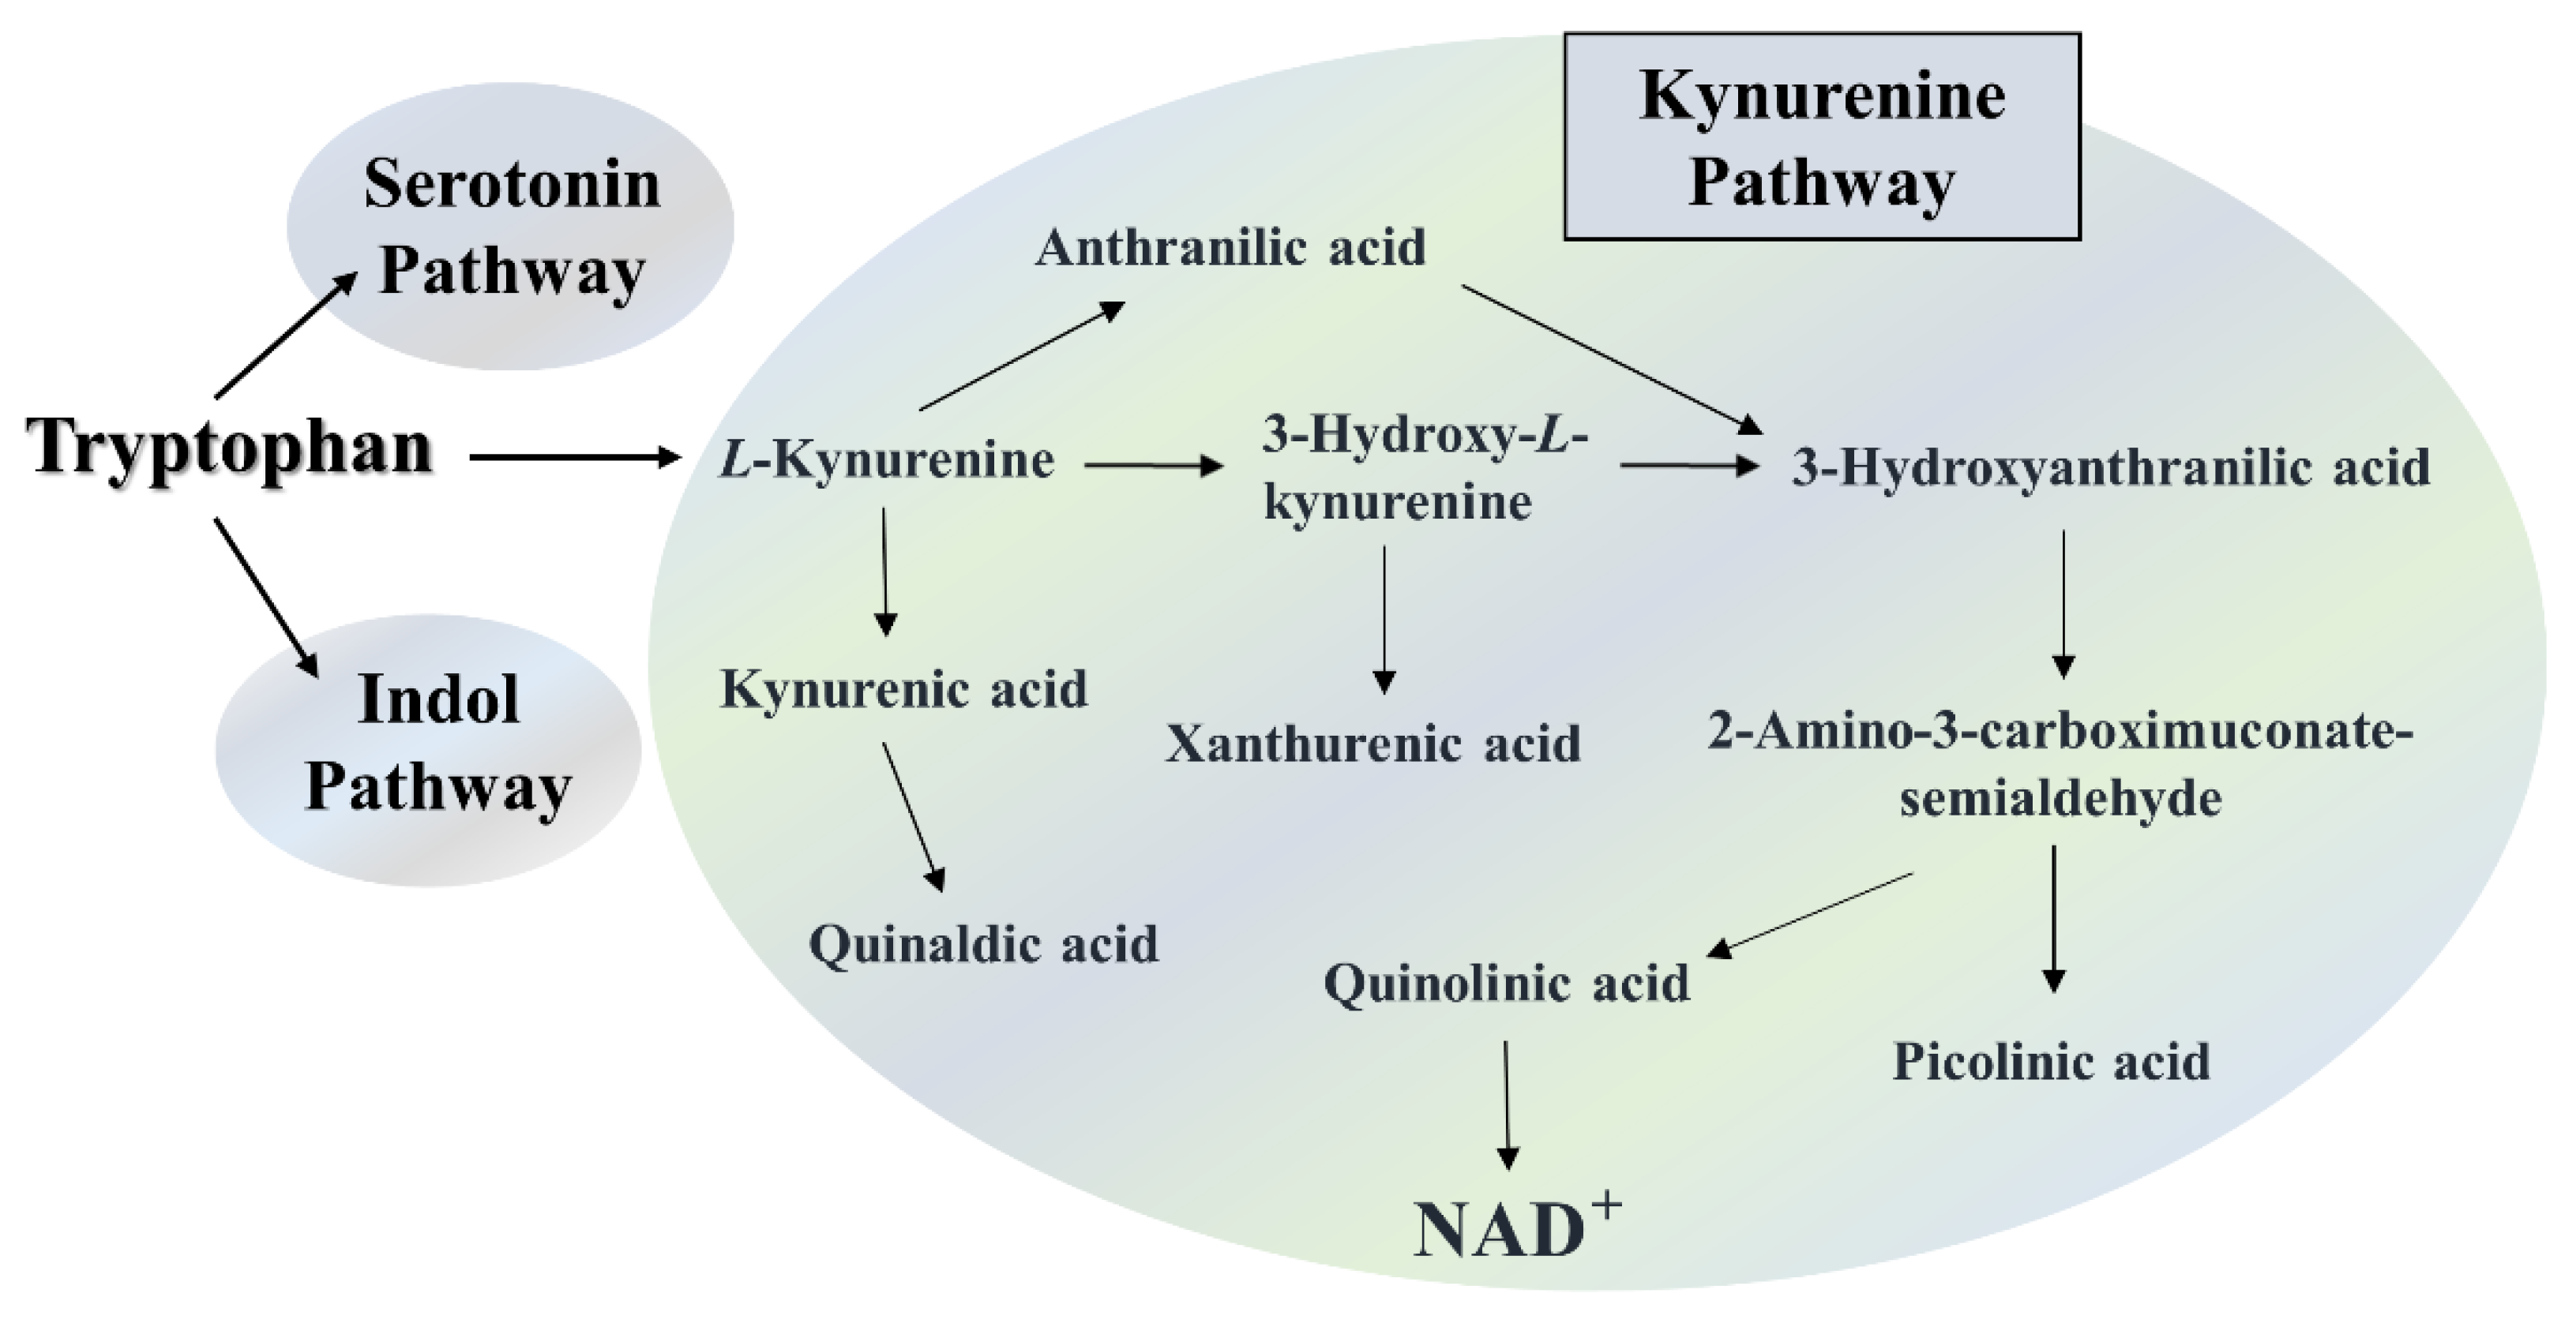
Figure 2.
Alterations in the animals’ body weight during intoxication. The control group is represented by blue diamonds, and the CPZ treated group is depicted with green triangels in the experiment time. CO: control group; CPZ: cuprizone treated group, *: p < 0.05 vs. CO, **: p < 0.01 vs. CO, ***: p < 0.001 vs. CO. The data are presented as mean ± SEM.
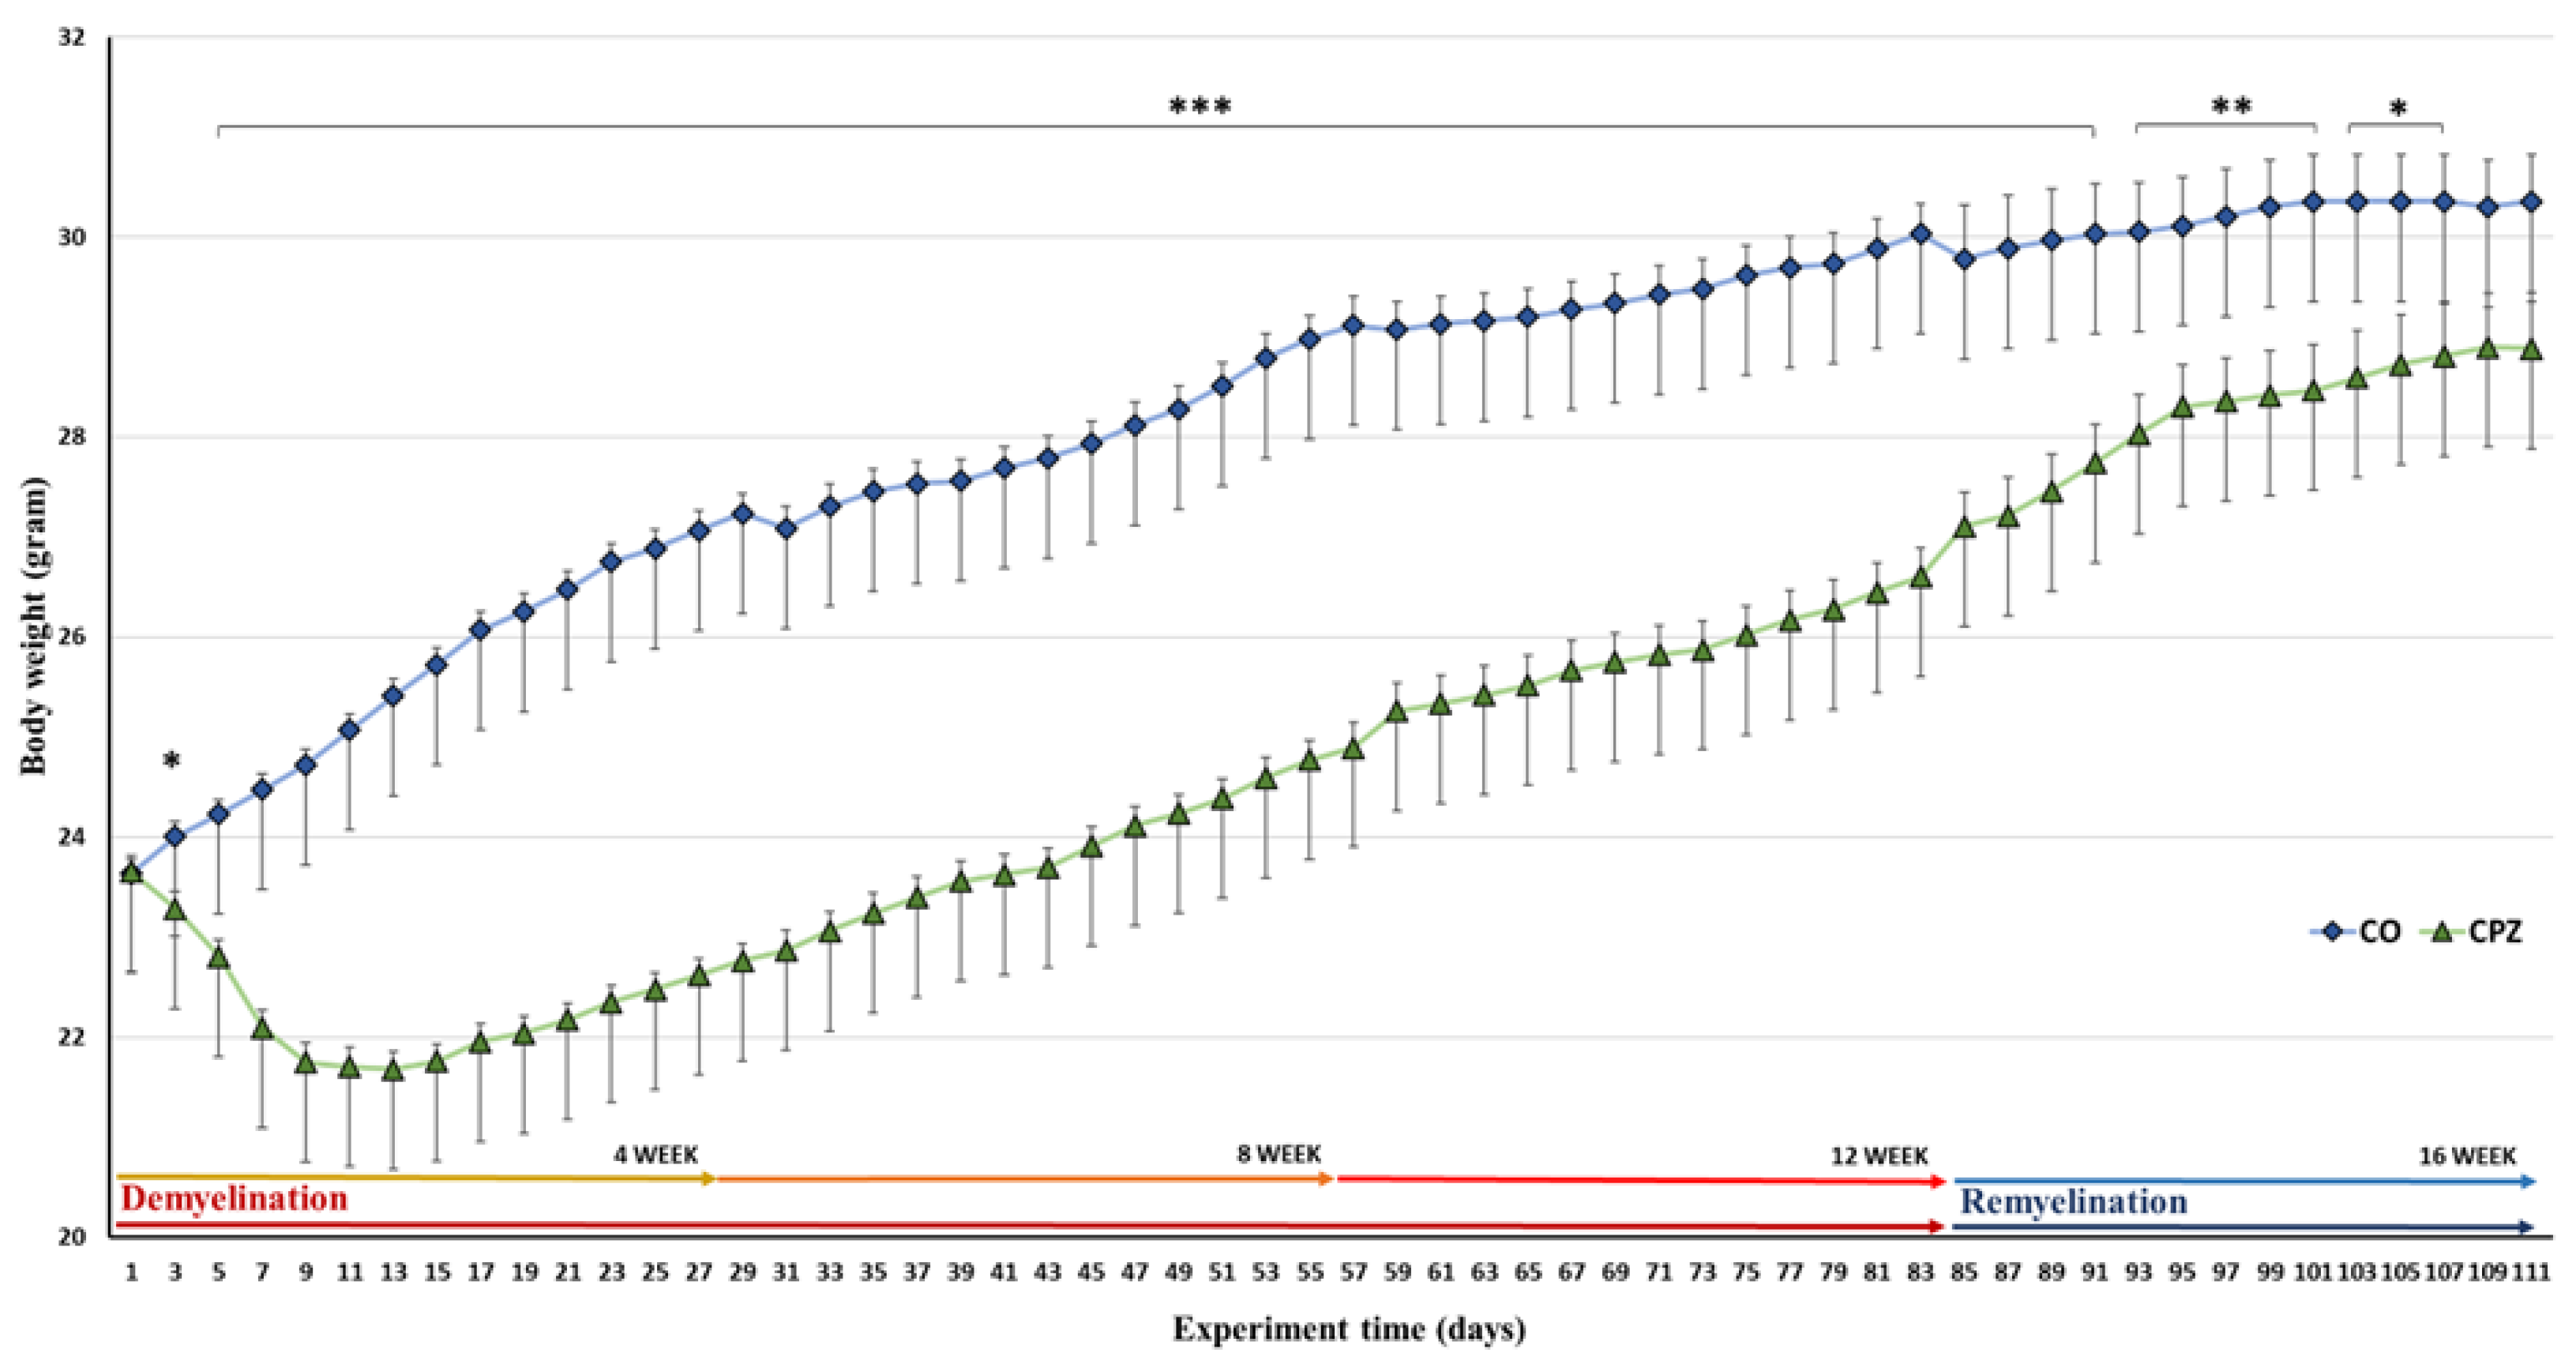
Figure 3.
Spontaneous alteration in the Y-Maze test. We found significant difference between the CPZ and control group in the treatment of 4 weeks and in the 8 weeks. Ctrl: control group; CPZ: cuprizone treated group. The level of significance *: p < 0.05 vs. CO. The number of animals in groups: n (control) = 10, and n (CPZ) = 10. We show the data mean ± SD.
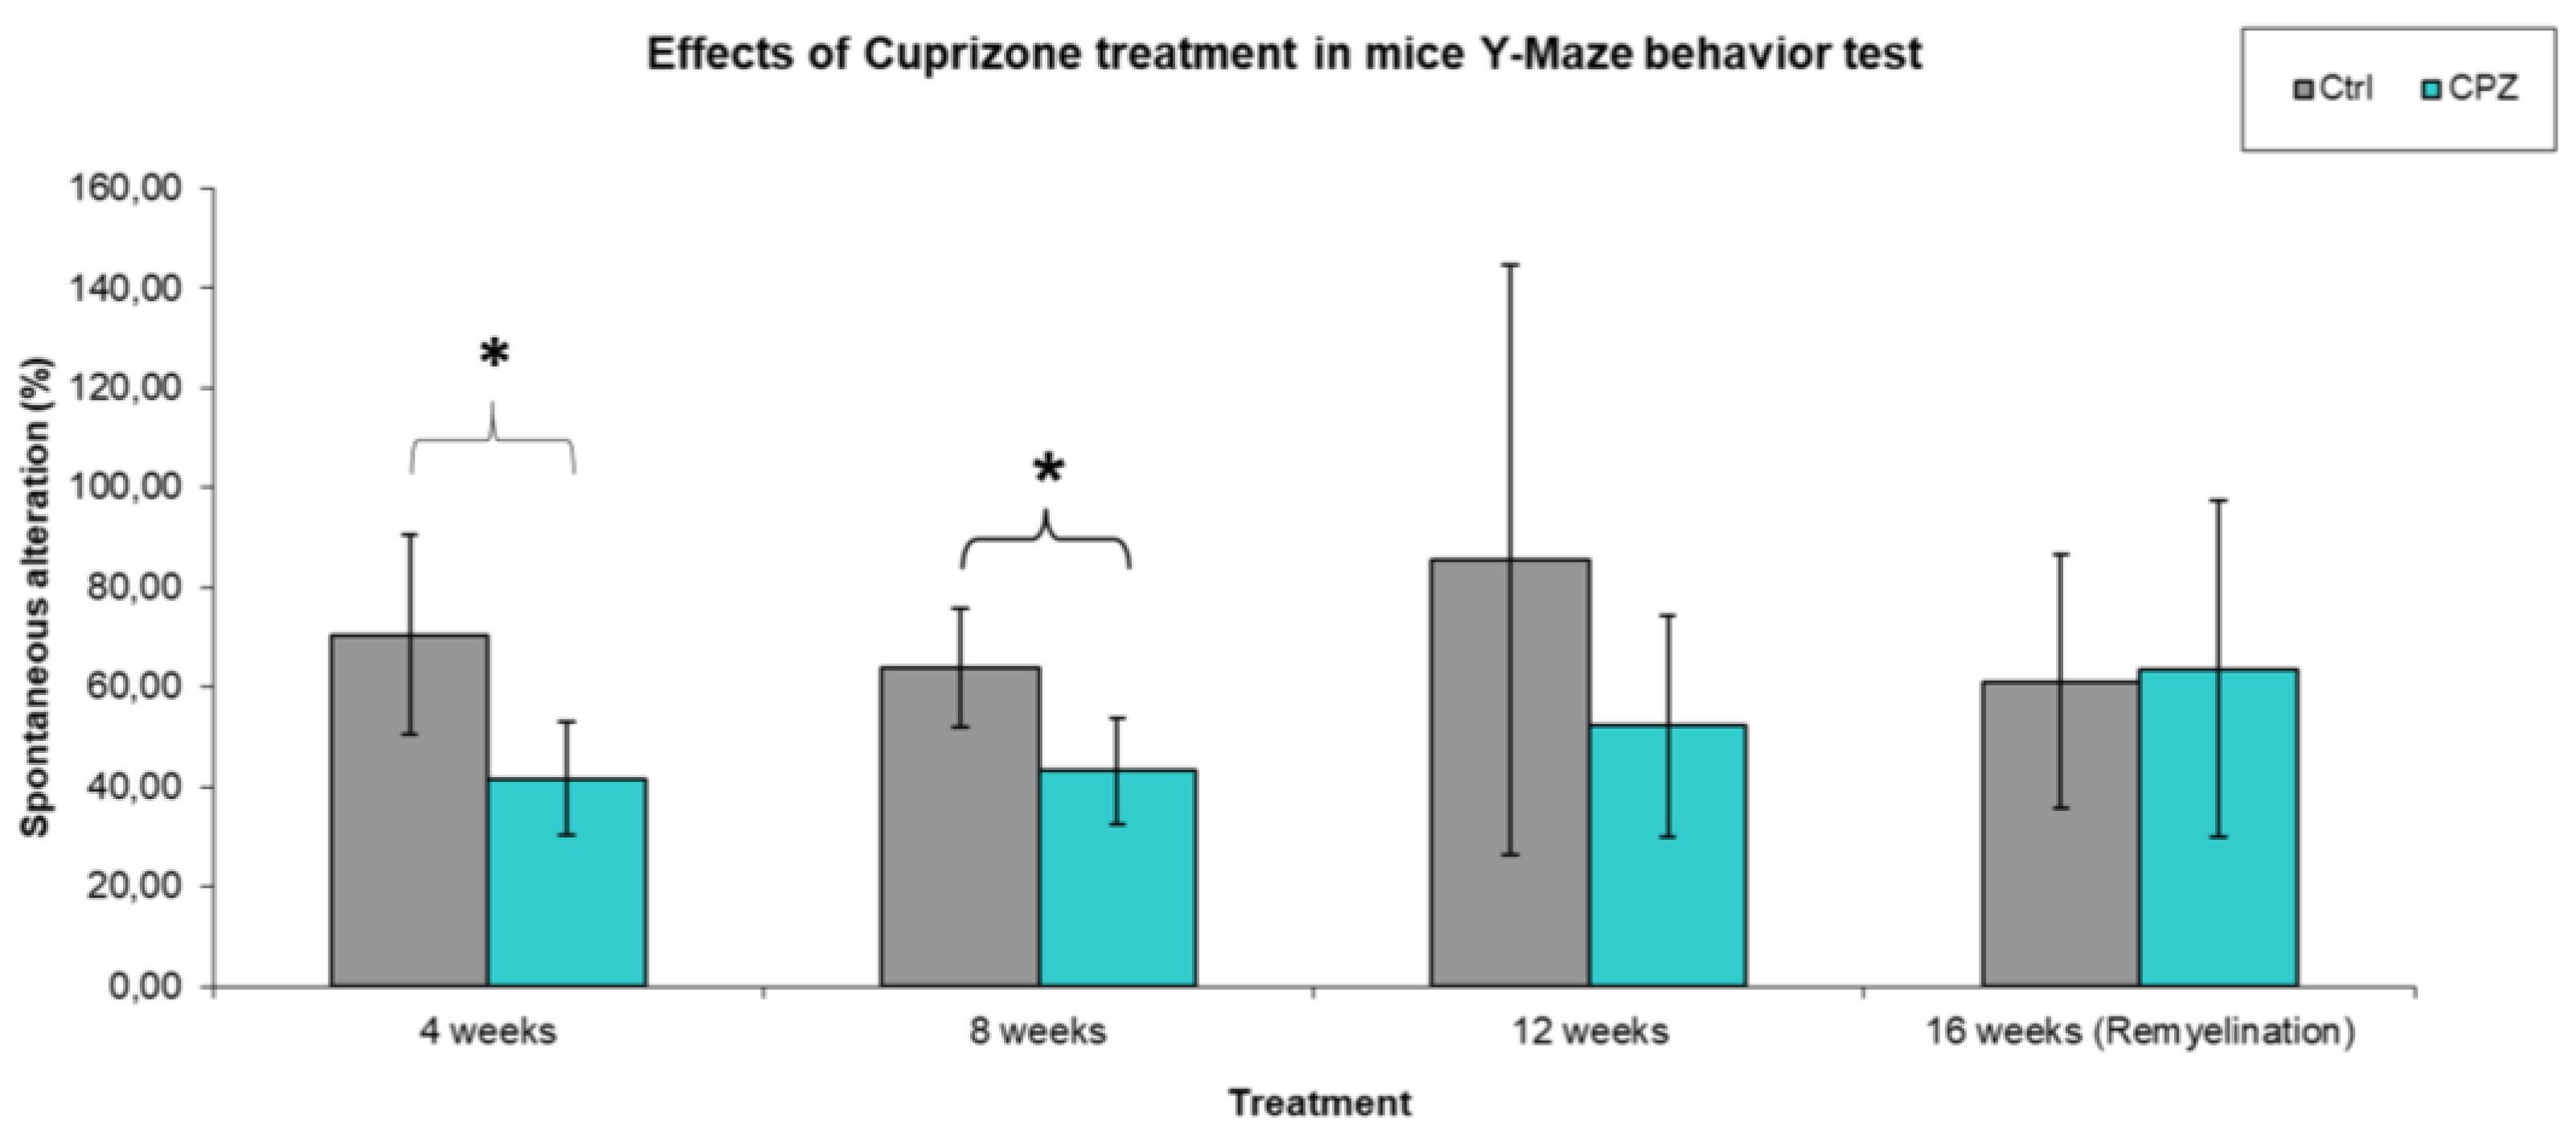
Figure 4.
Velocity of mice in Y-Maze spontaneous alteration test. We found significant difference between the CPZ vs. CPZ, Ctrl vs. Ctrl group in the treatment of 4 weeks vs. 12 weeks and in the 4 weeks vs. 16 weeks. Ctrl: control group; CPZ: cuprizone treated group. The level of significance CPZ vs. CPZ: *p < 0.05, **p < 0.01, Ctrl vs. Ctrl: # p < 0.05. The number of animals in groups: n (control) = 10, and n (CPZ) = 10. We show the data mean ± S.E.M.
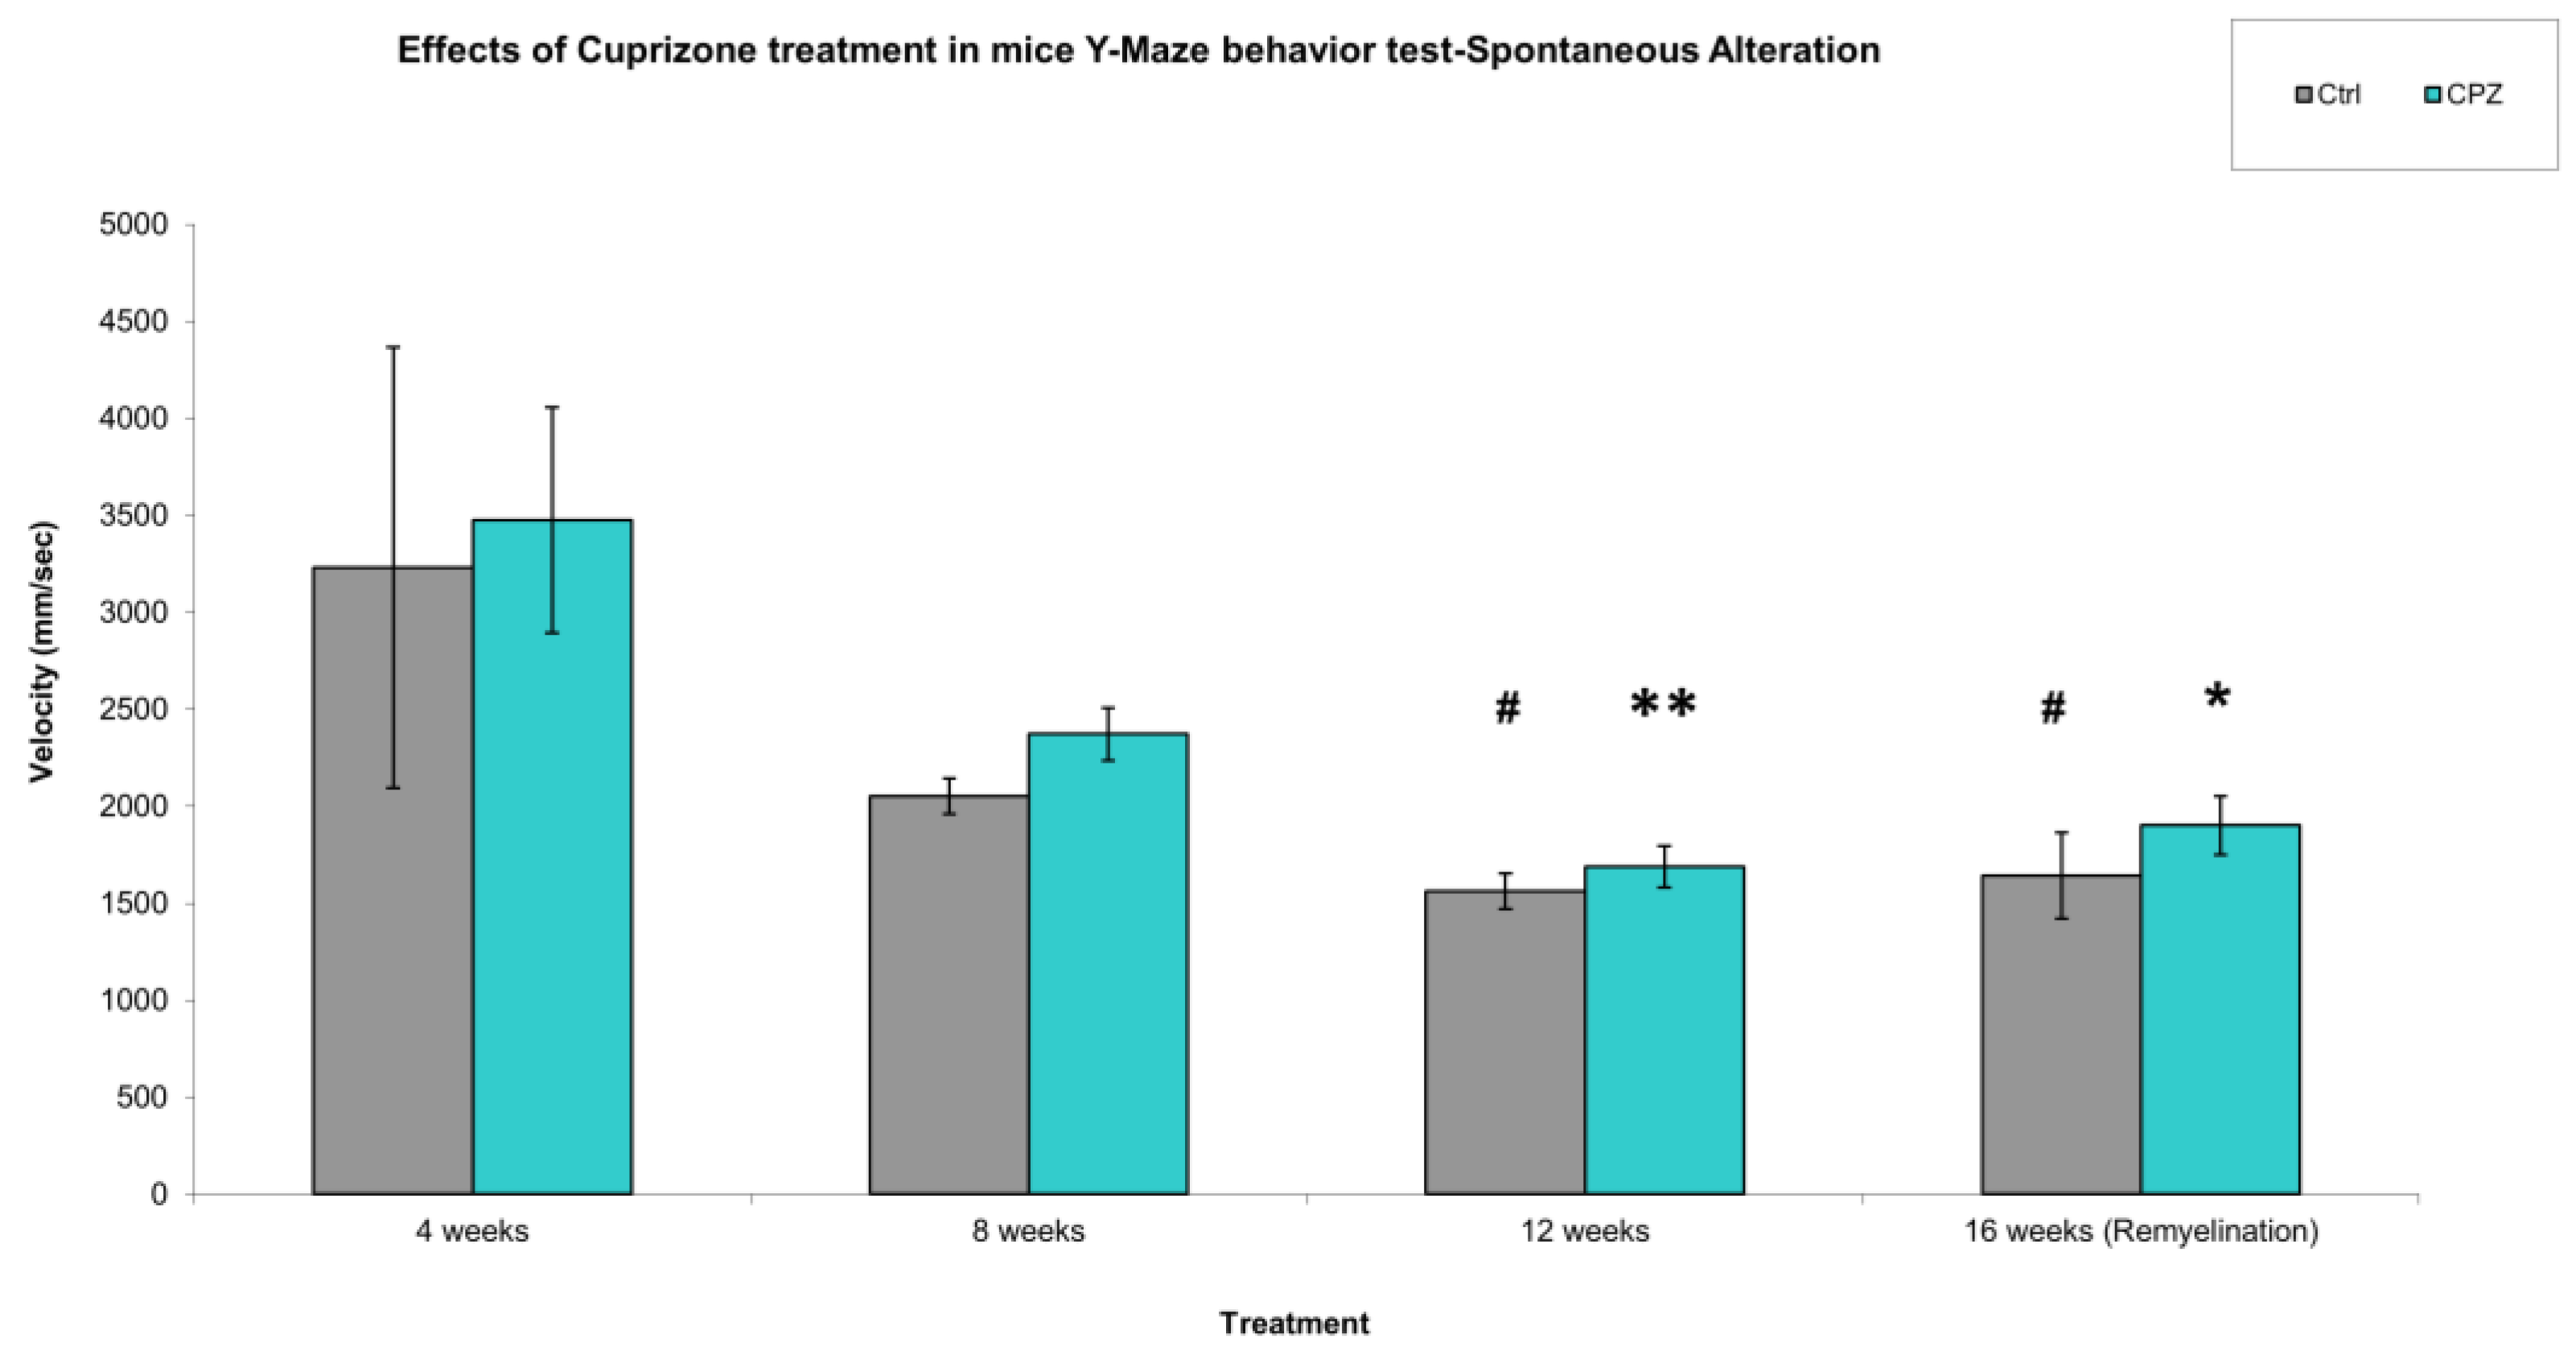
Figure 5.
Time spent in the unexplored (Novel) Y-Maze arm. We found significant difference between the CPZ vs. CPZ group in the treatment of 4 weeks vs. 12 and 16 weeks and in the 8 weeks vs. 12 weeks. Ctrl: control group; CPZ: cuprizone treated group. The level of significance 4 weeks vs. 12 and 16 weeks: * p < 0.05; 8 weeks vs. 12 weeks: # p < 0.05. The number of animals in groups: n (control) = 10, and n (CPZ) = 10. We show the data mean ± S.E.M.
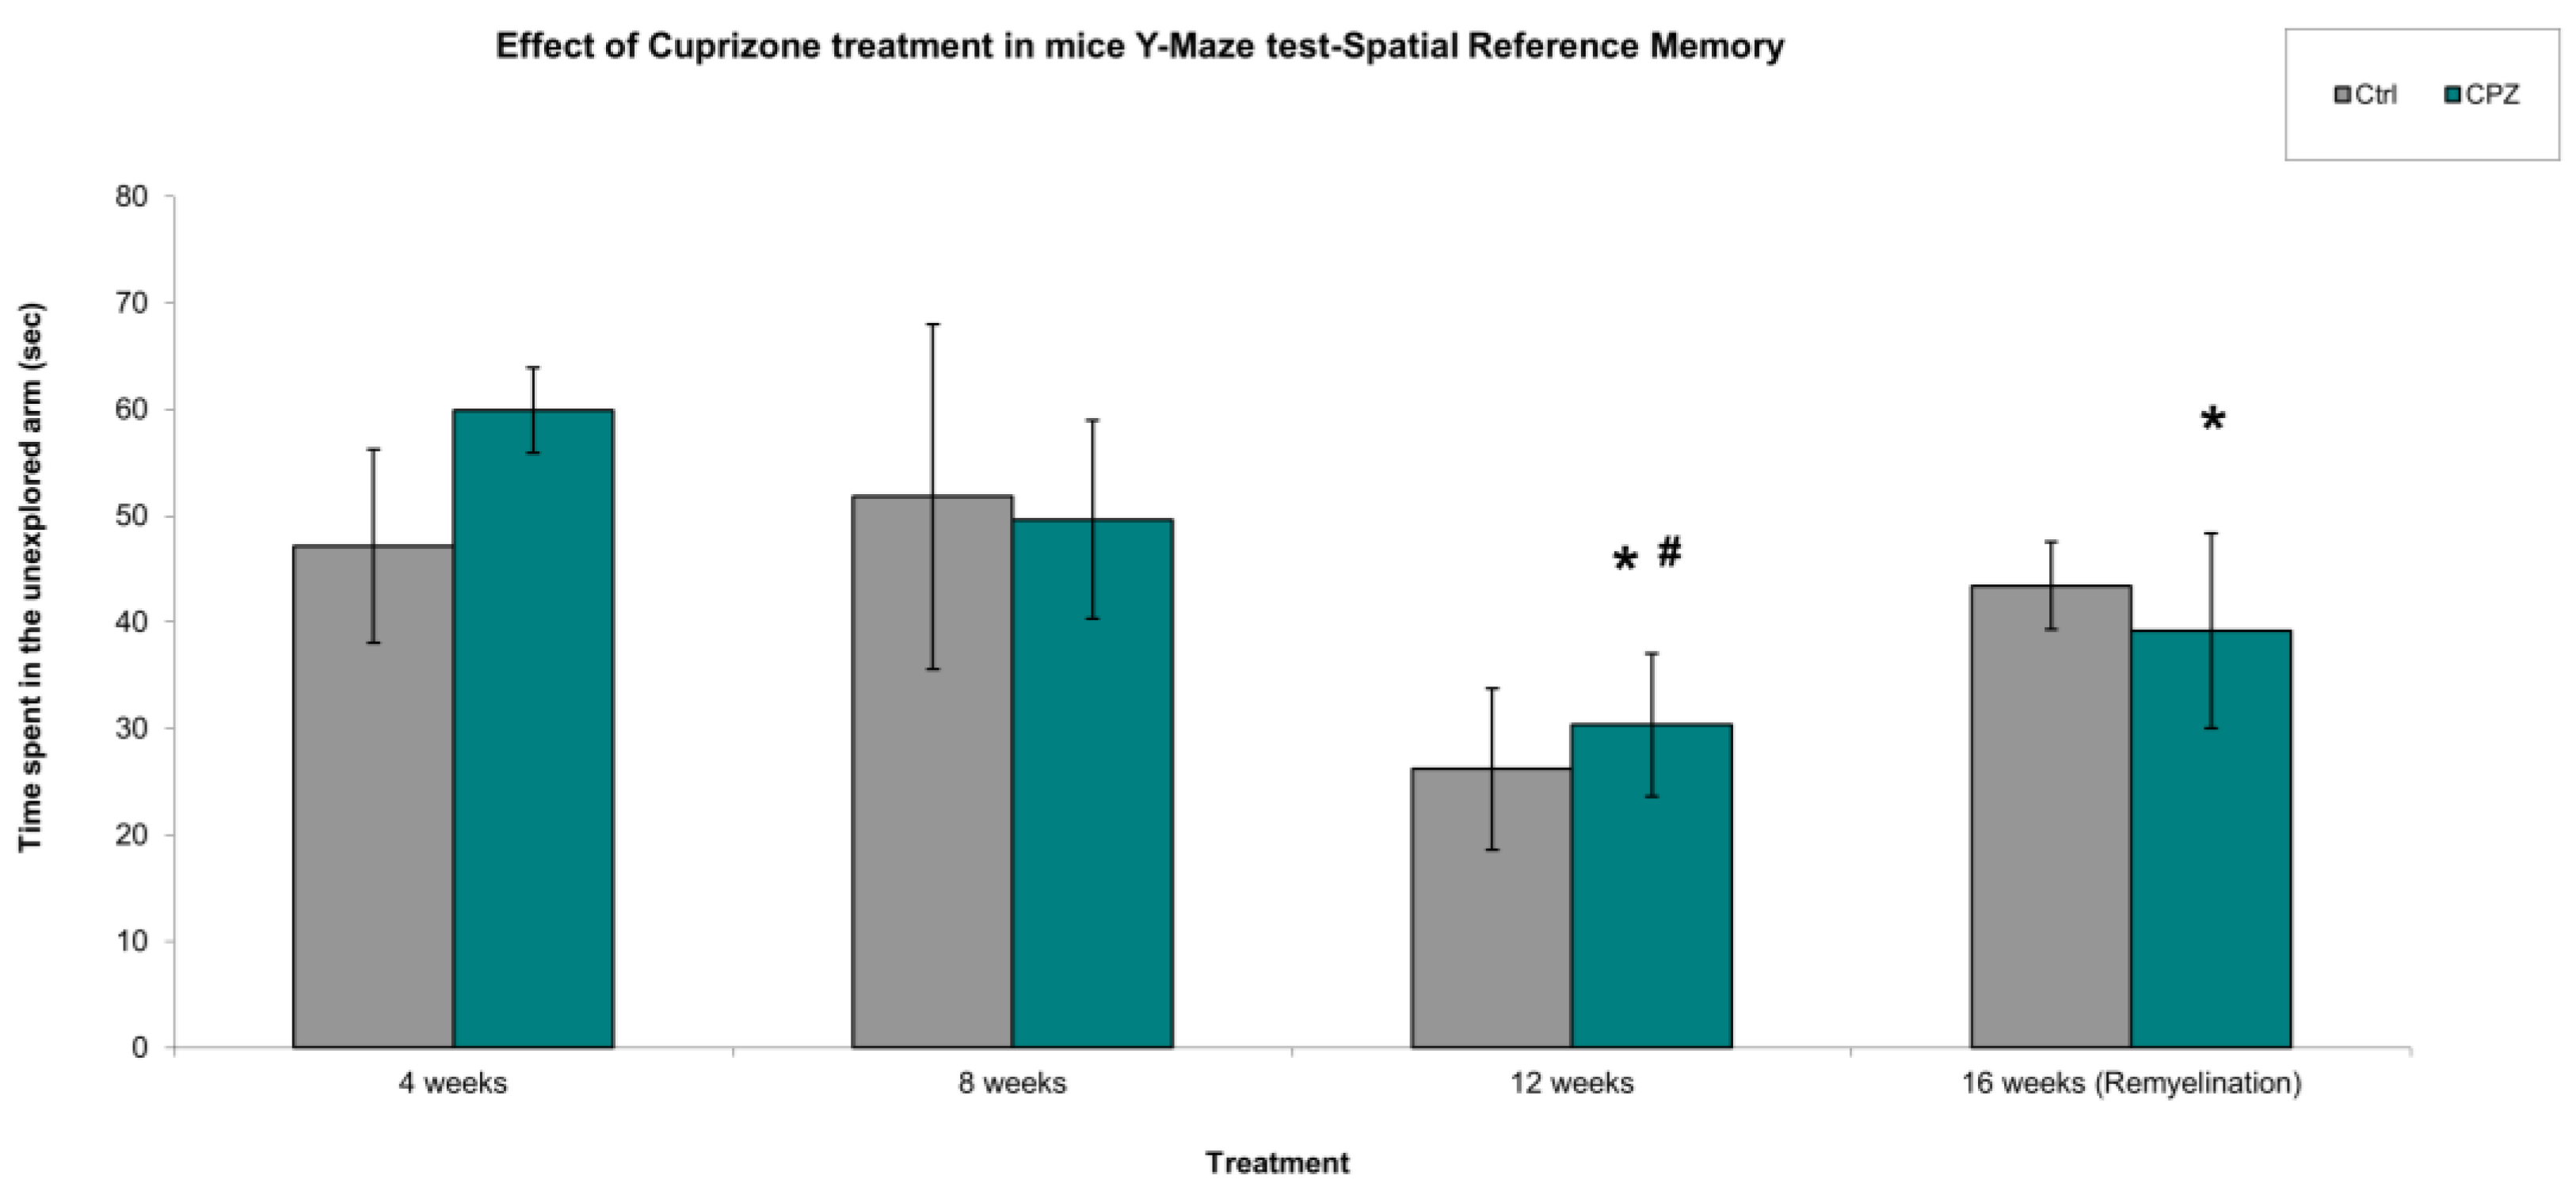
Figure 6.
Spatial reference memory, number of the enters in the explored Y-Maze arm (mistakes of mice). We found significant difference between the CPZ vs. CPZ group in the treatment of 4 weeks vs. 12 weeks and in the 8 weeks vs. 12 weeks. Ctrl: control group; CPZ: cuprizone treated group. The level of significance 4 weeks vs. 12 weeks: * p < 0.05, 8 weeks vs. 12 weeks: # p < 0.05. The number of animals in groups: n (control) = 10, and n (CPZ) = 10. We show the data mean ± S.E.M.
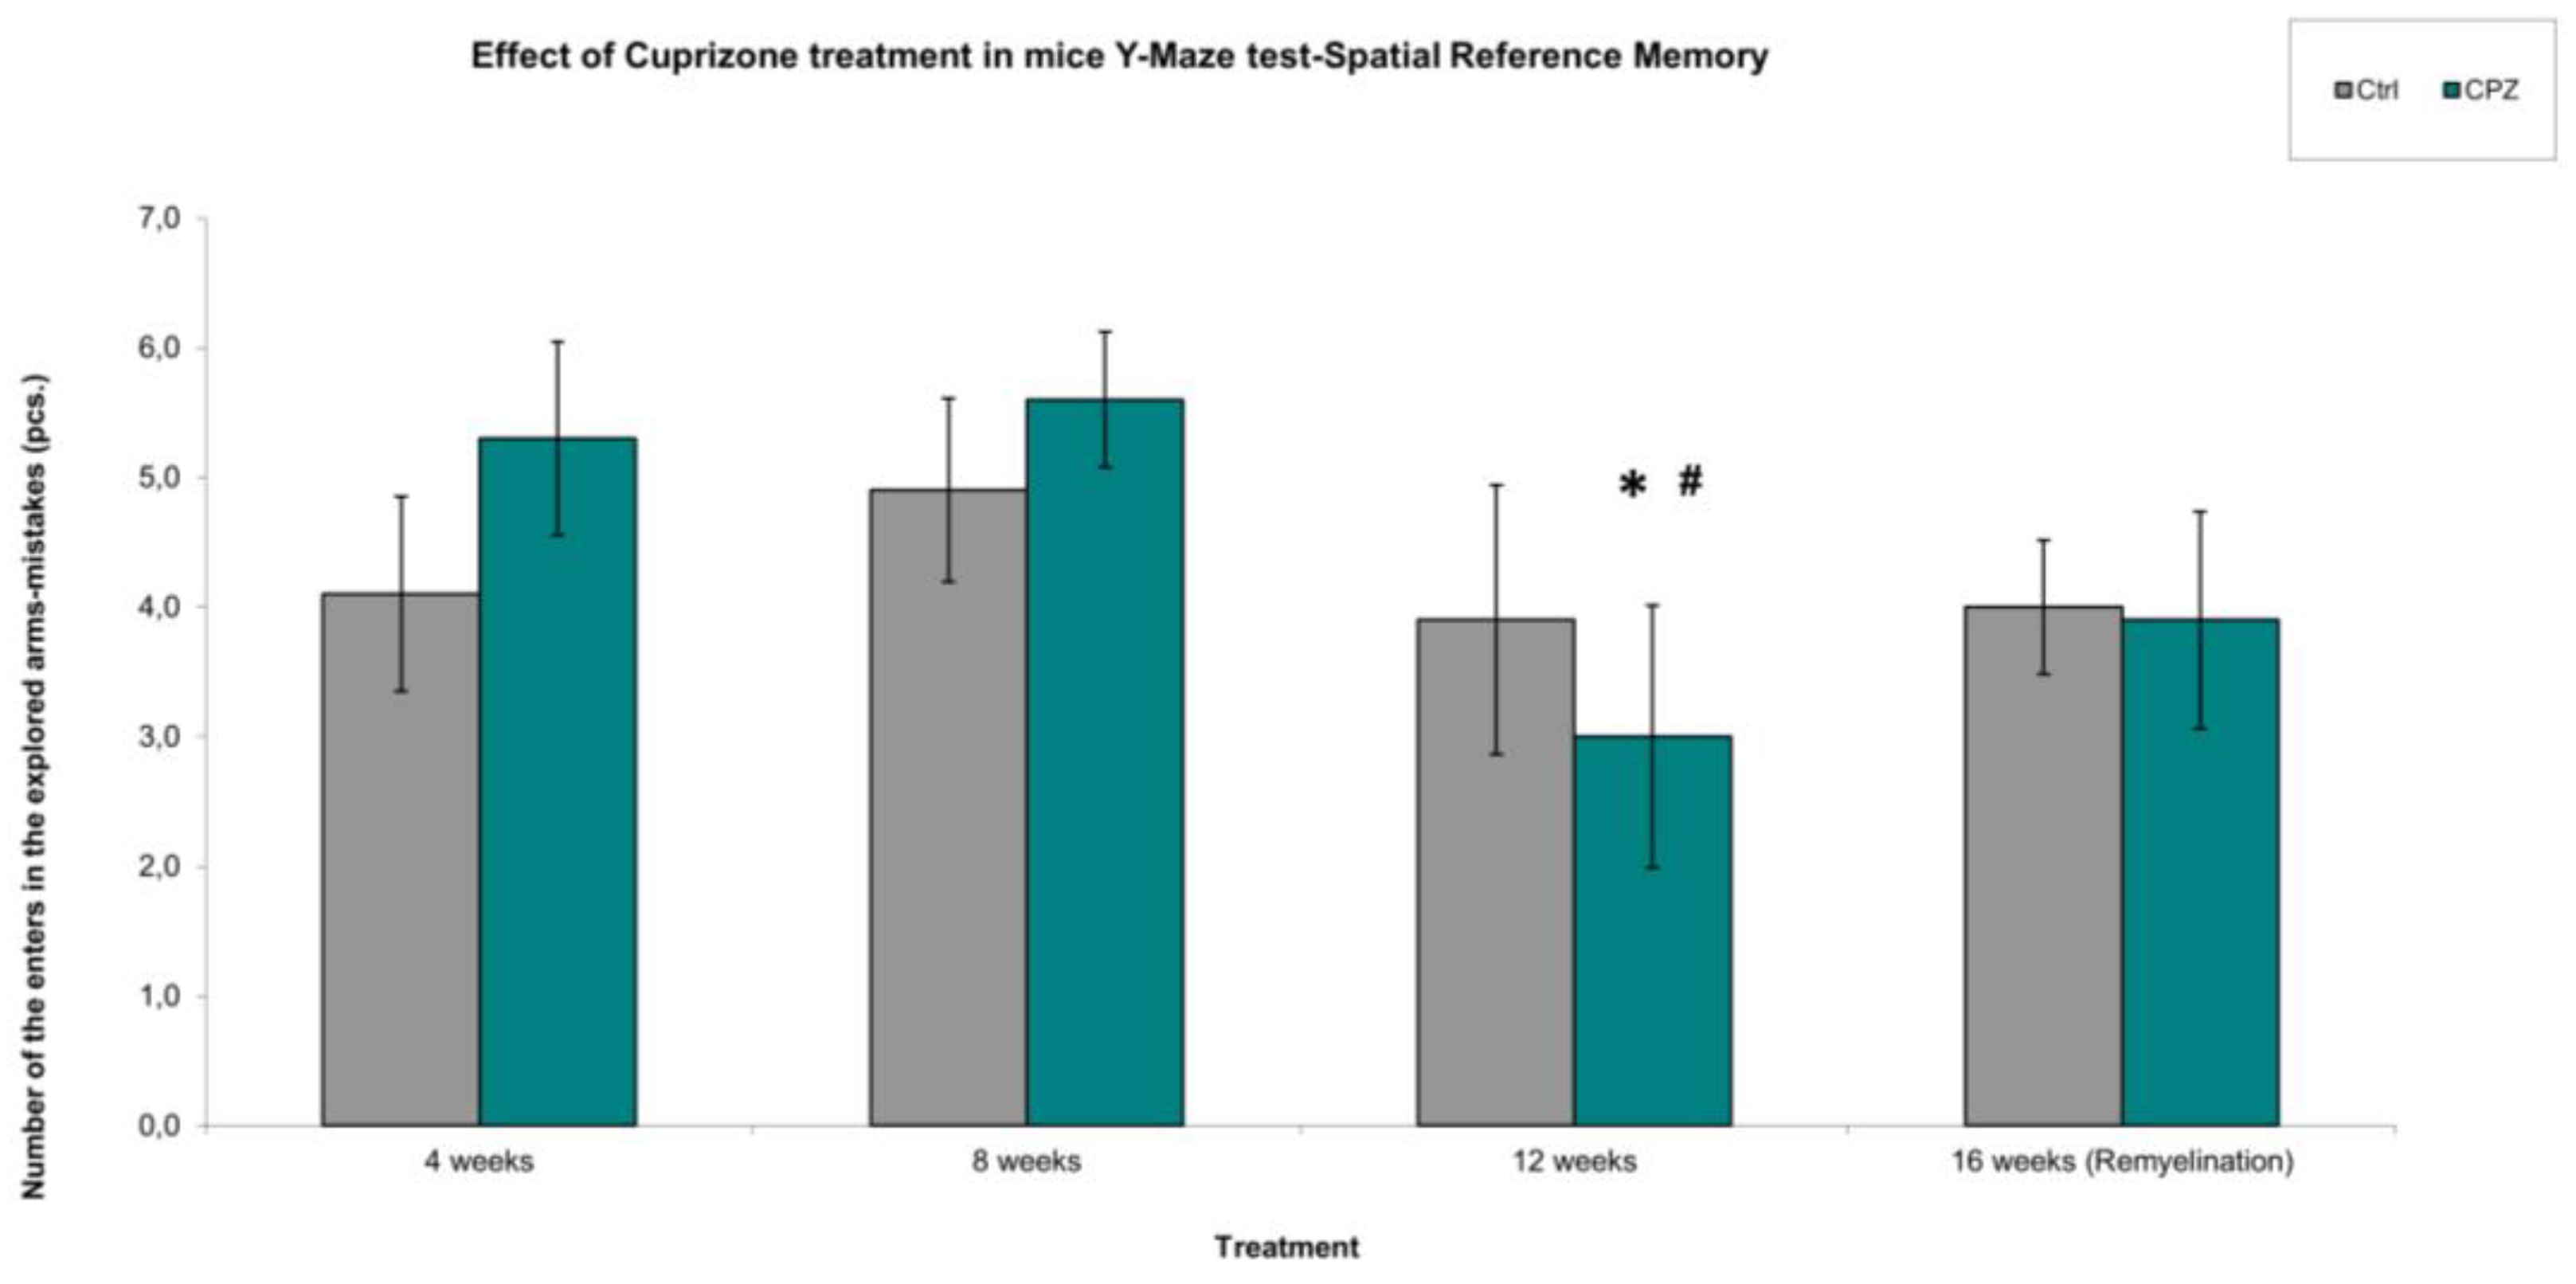
Figure 7.
Velocity of mice in Y-Maze spatial reference memory test. We did not find significant differences in behavior between the treated groups (CPZ) and the control (Ctrl) groups. We show the data median ± IQR, the gray and turquoise dots are the outliers. The number of animals in groups: n (control) = 10, and n (CPZ) = 10.
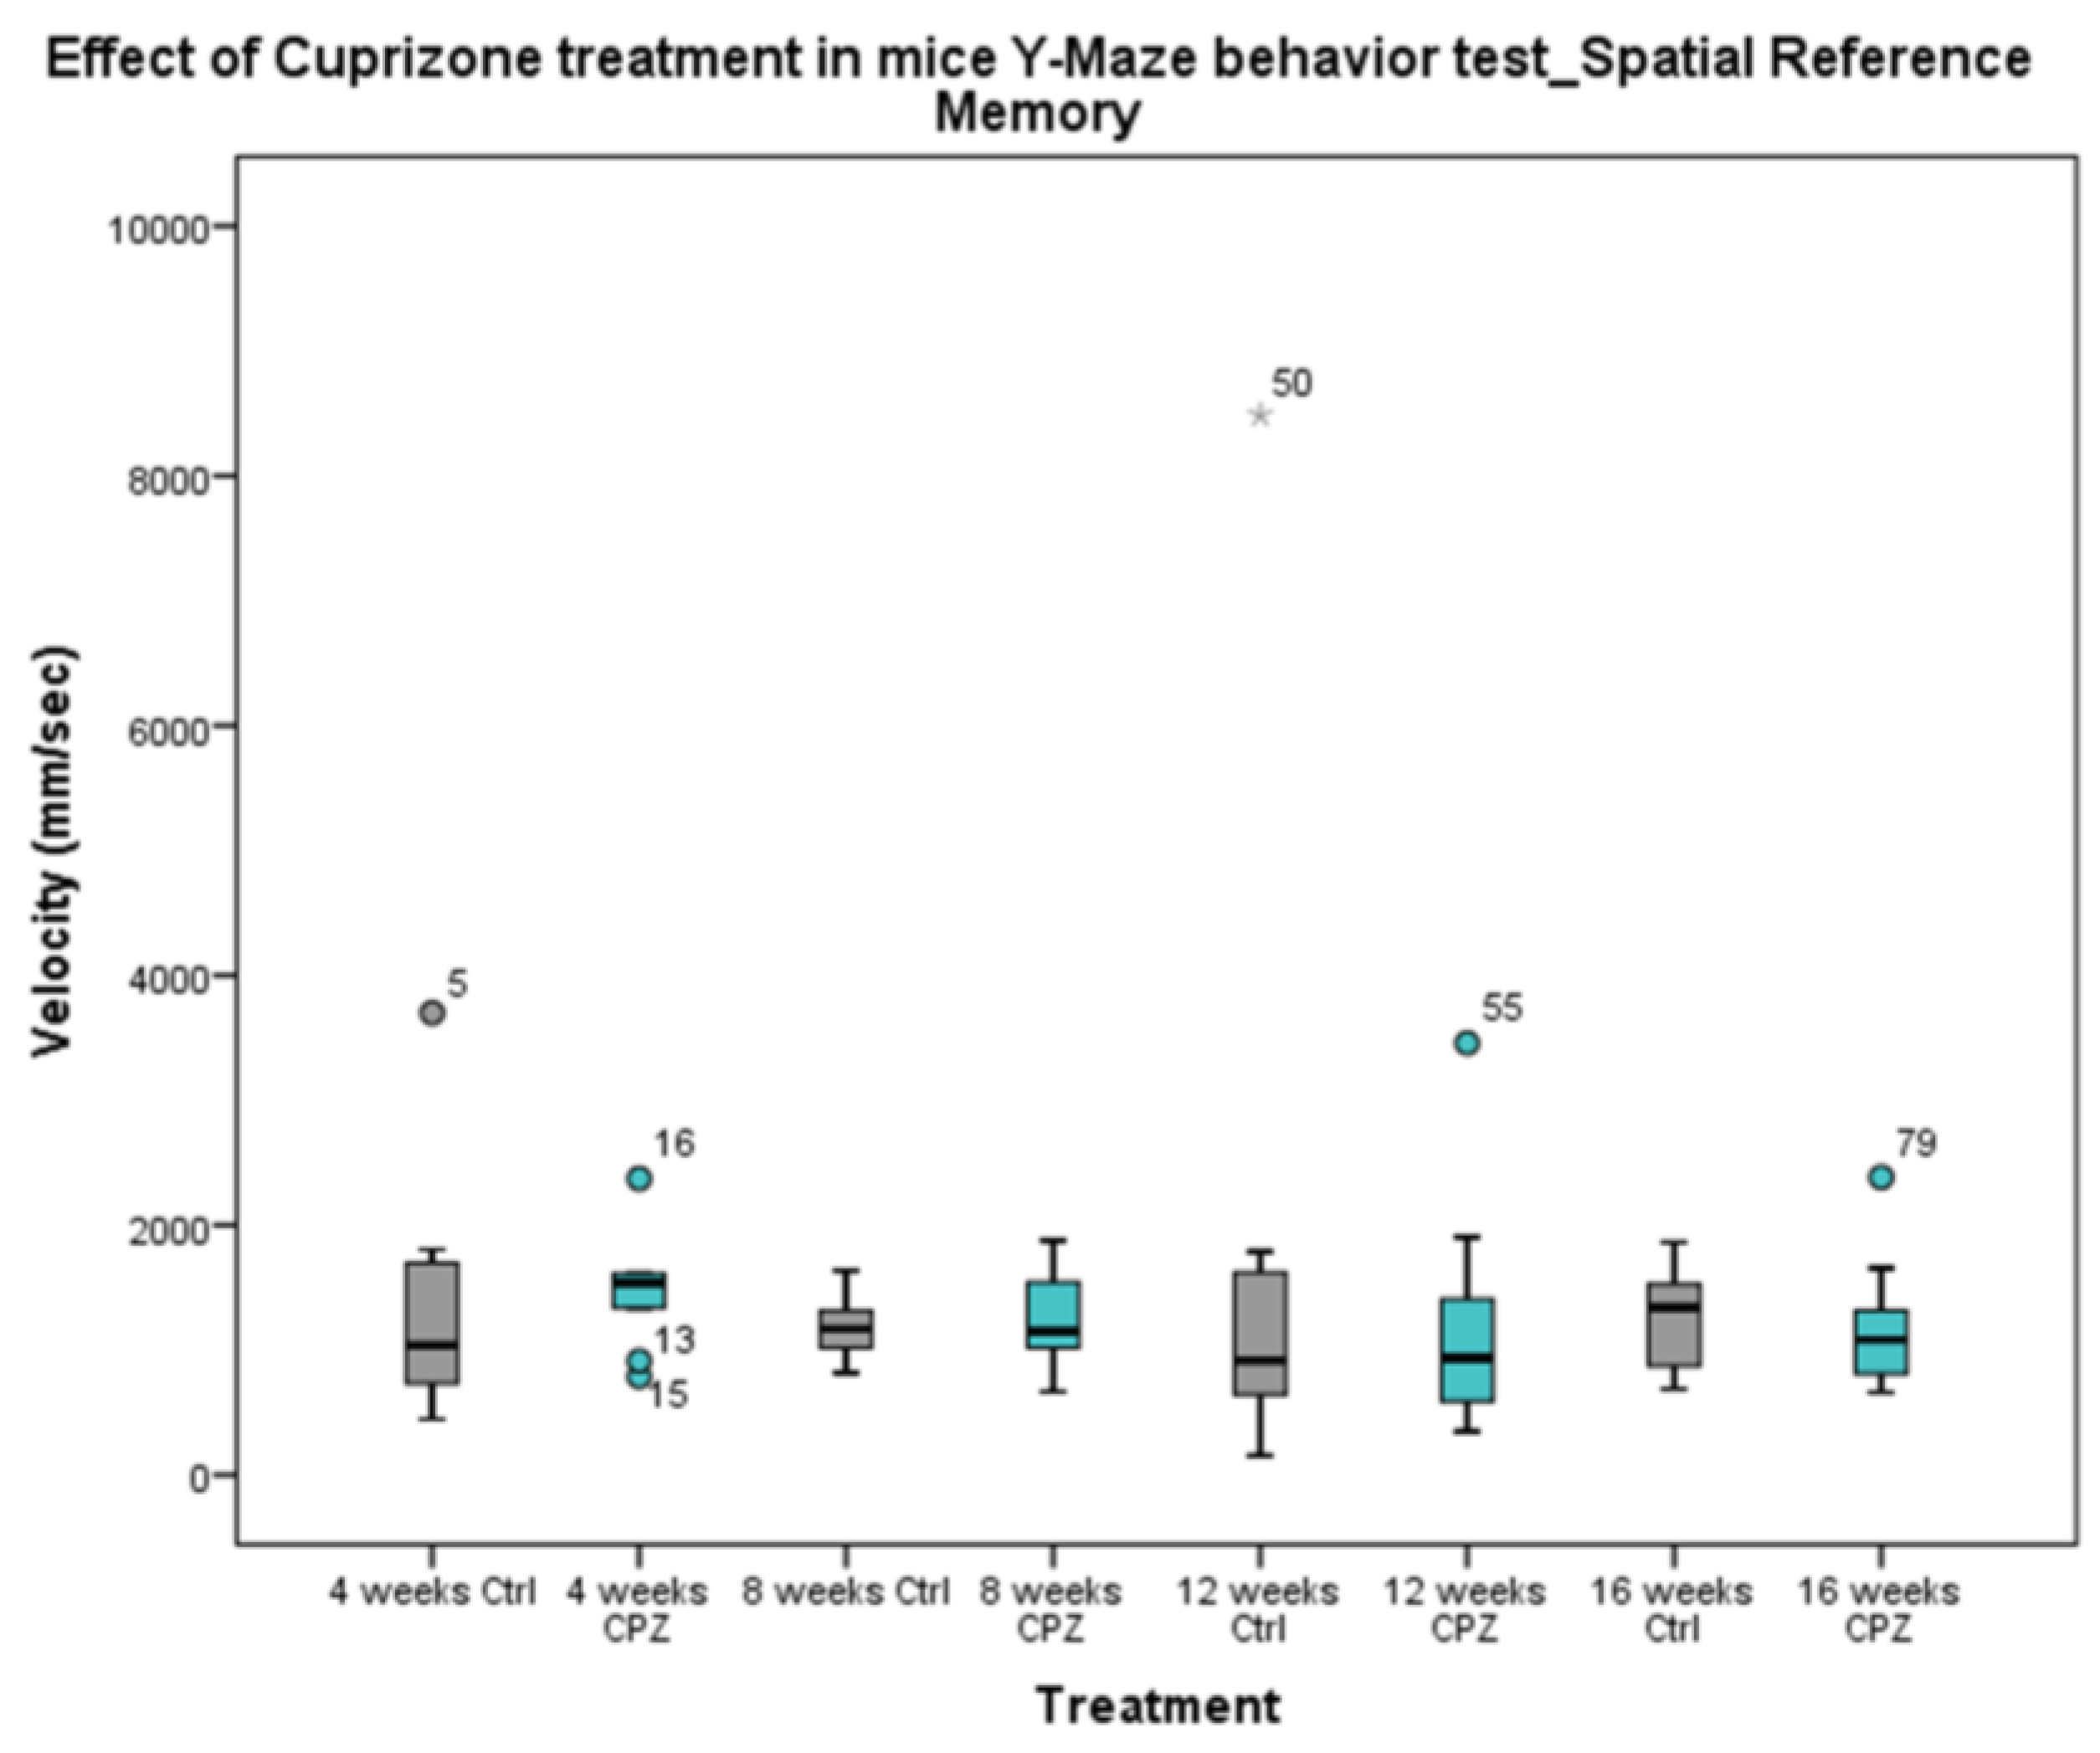
Figure 8.
Alterations in plasma tryptophan (TRP), kynurenic acid (KYNA), quinaldic acid (QAA) and xanthurenic acid (XA) concentrations during poisoning. Plasma KYNA, QAA and XA levels of the CPZ-treated group were significantly lower than those of the CO group during the entire period of intoxication. However, in the remyelination phase, the concentrations of metabolites did not differ between the groups. In contrast, the level of TRP showed a higher value in the CPZ group at weeks 4 and 8 of treatment, then with a decreasing trend in the recovery phase the TRP concentrations of the groups were similar. CO: control group, CPZ: cuprizone treated group, *: p < 0.05 vs. CO, ***: p < 0.001 vs. CO. We show the data median ± IQR, with the outliers.
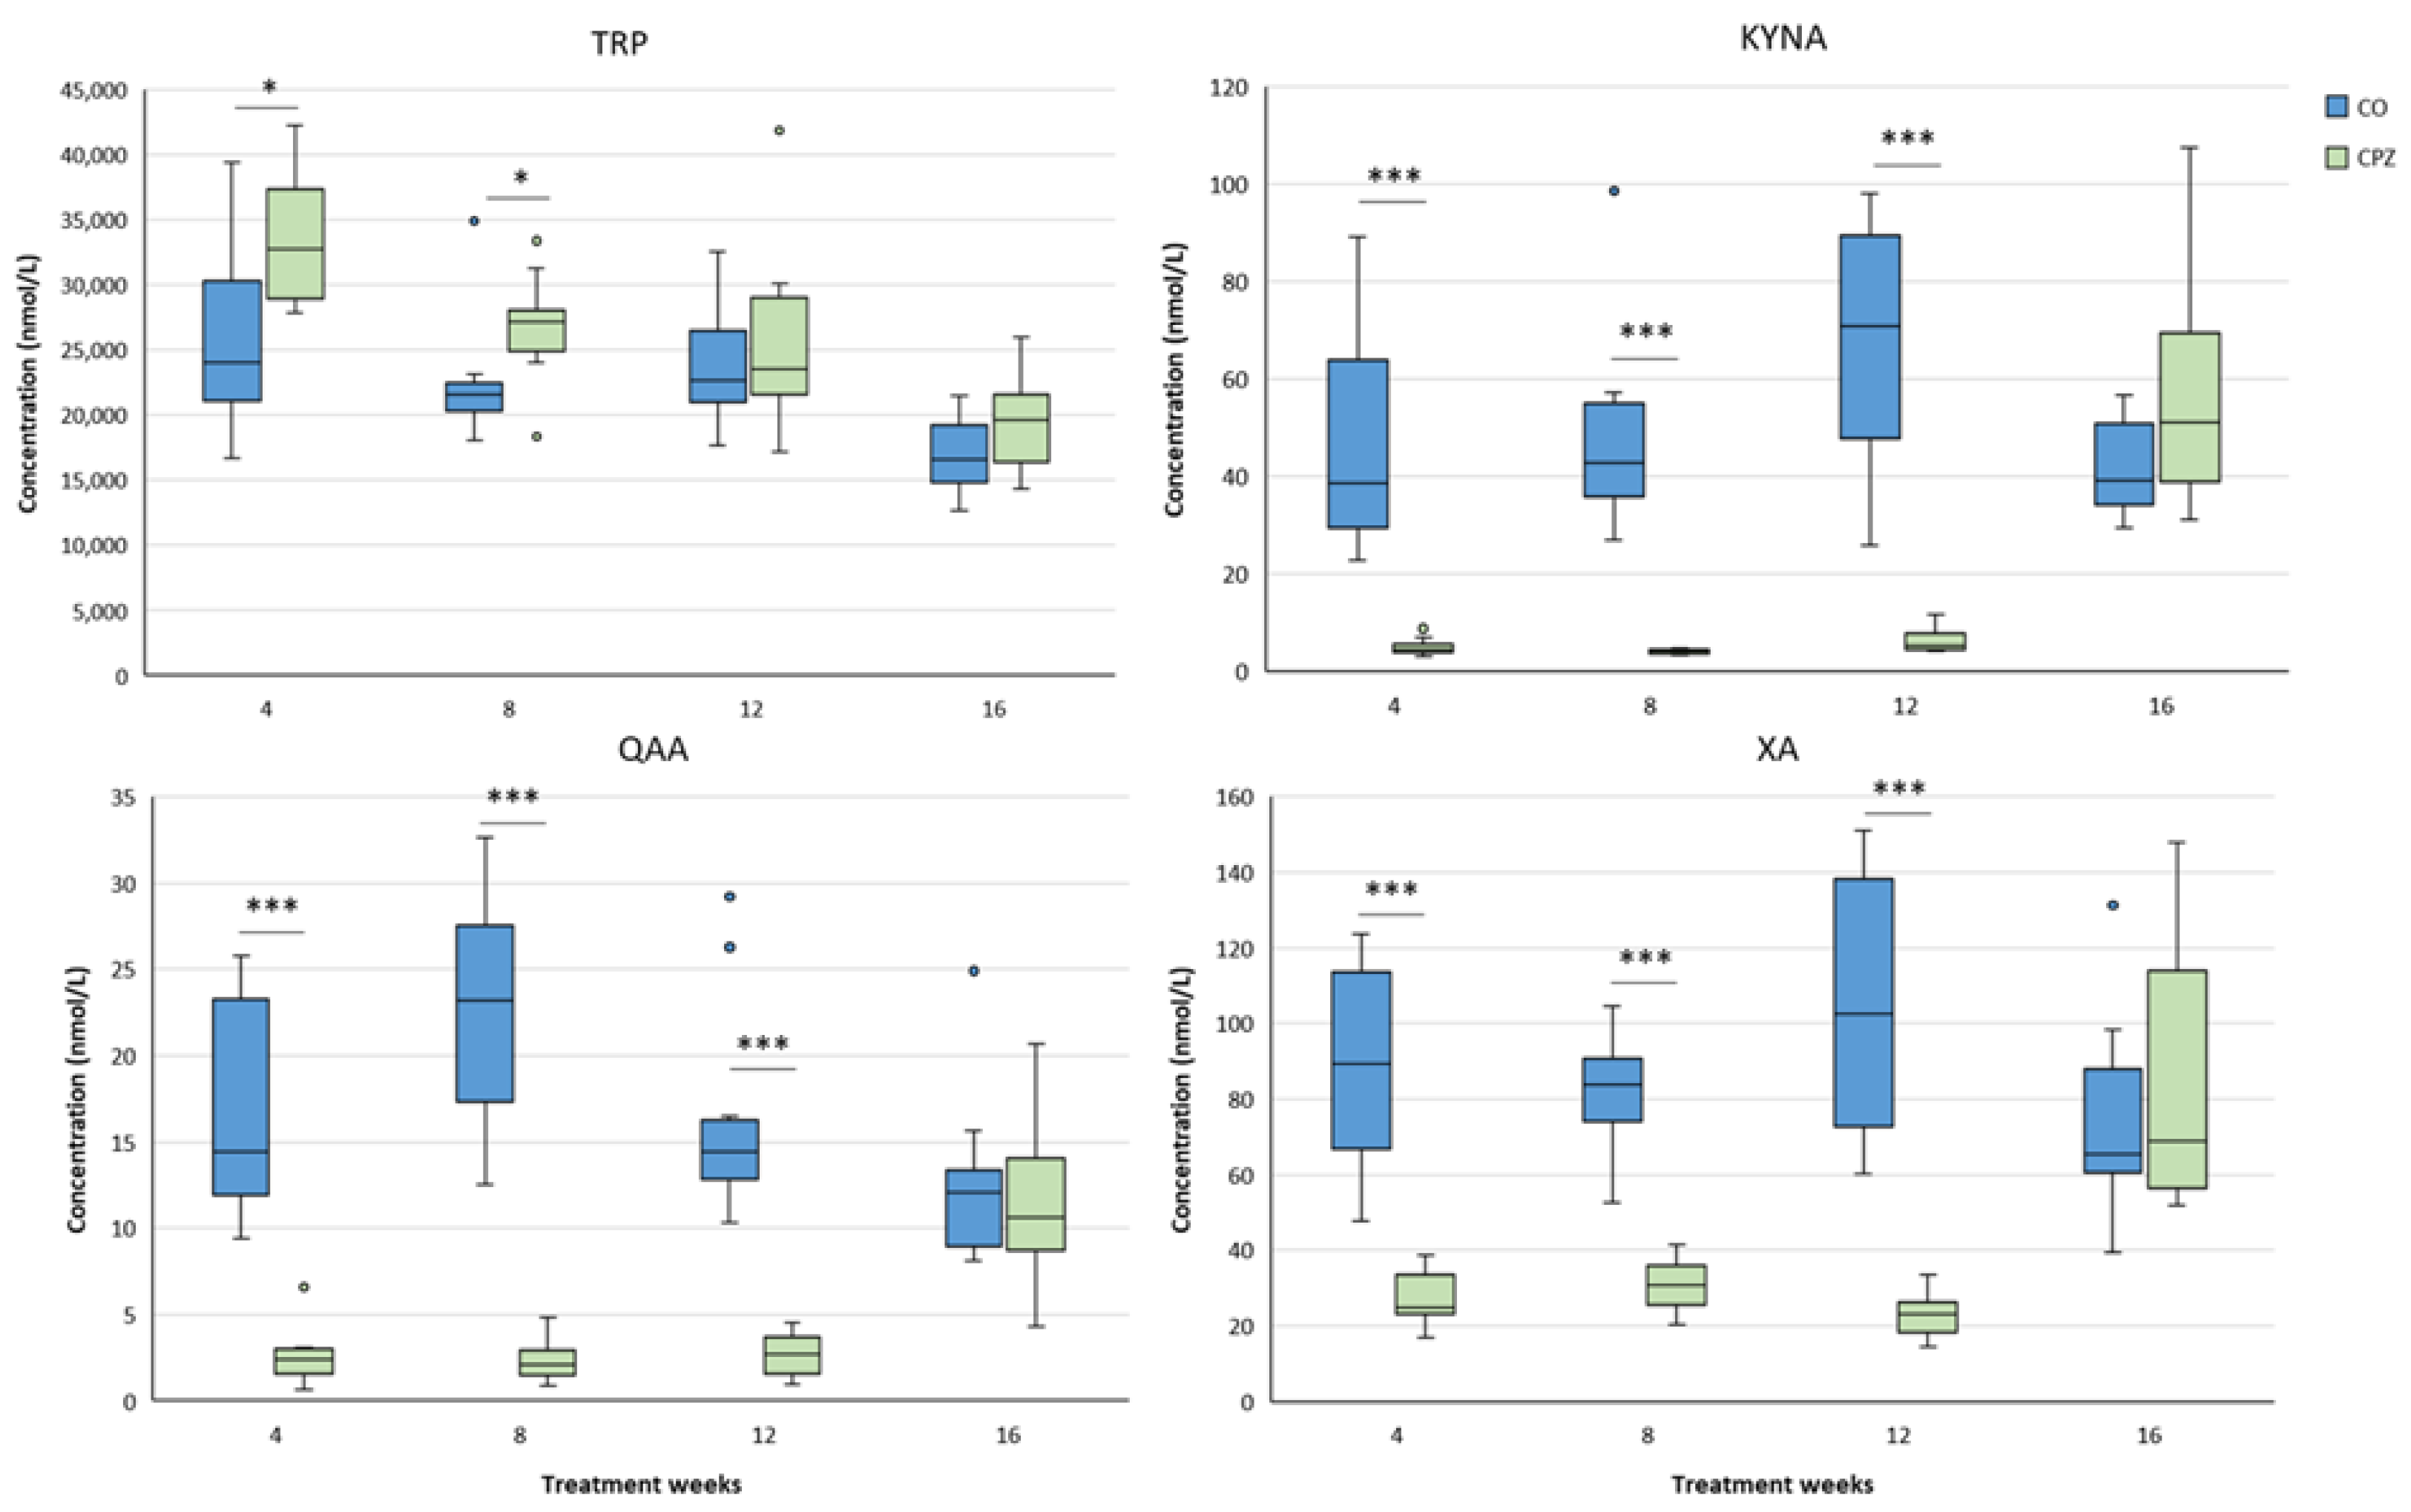
Figure 9.
Changes in plasma 3-hydroxy-L-kynurenine (3-HK), anthranilic acid (AA) and picolinic acid (PA) levels during chronic CPZ treatment. At the beginning of the intoxication, the plasma concentrations of 3-HK, AA and PA markedly reduced in the CPZ group, then as demyelination progressed, the levels of these metabolites showed a slow increase, so much so that PA was higher in the CPZ group than in the CO group at the the twelfth week of treatment and at the end of remyelination, while there were no differences in the levels of 3-HK and AA metabolites between the groups. CO: control group, CPZ: cuprizone treated group, *: p < 0.05 vs. CO, ***: p < 0.001 vs. CO. We show the data median ± IQR, with the outliers.
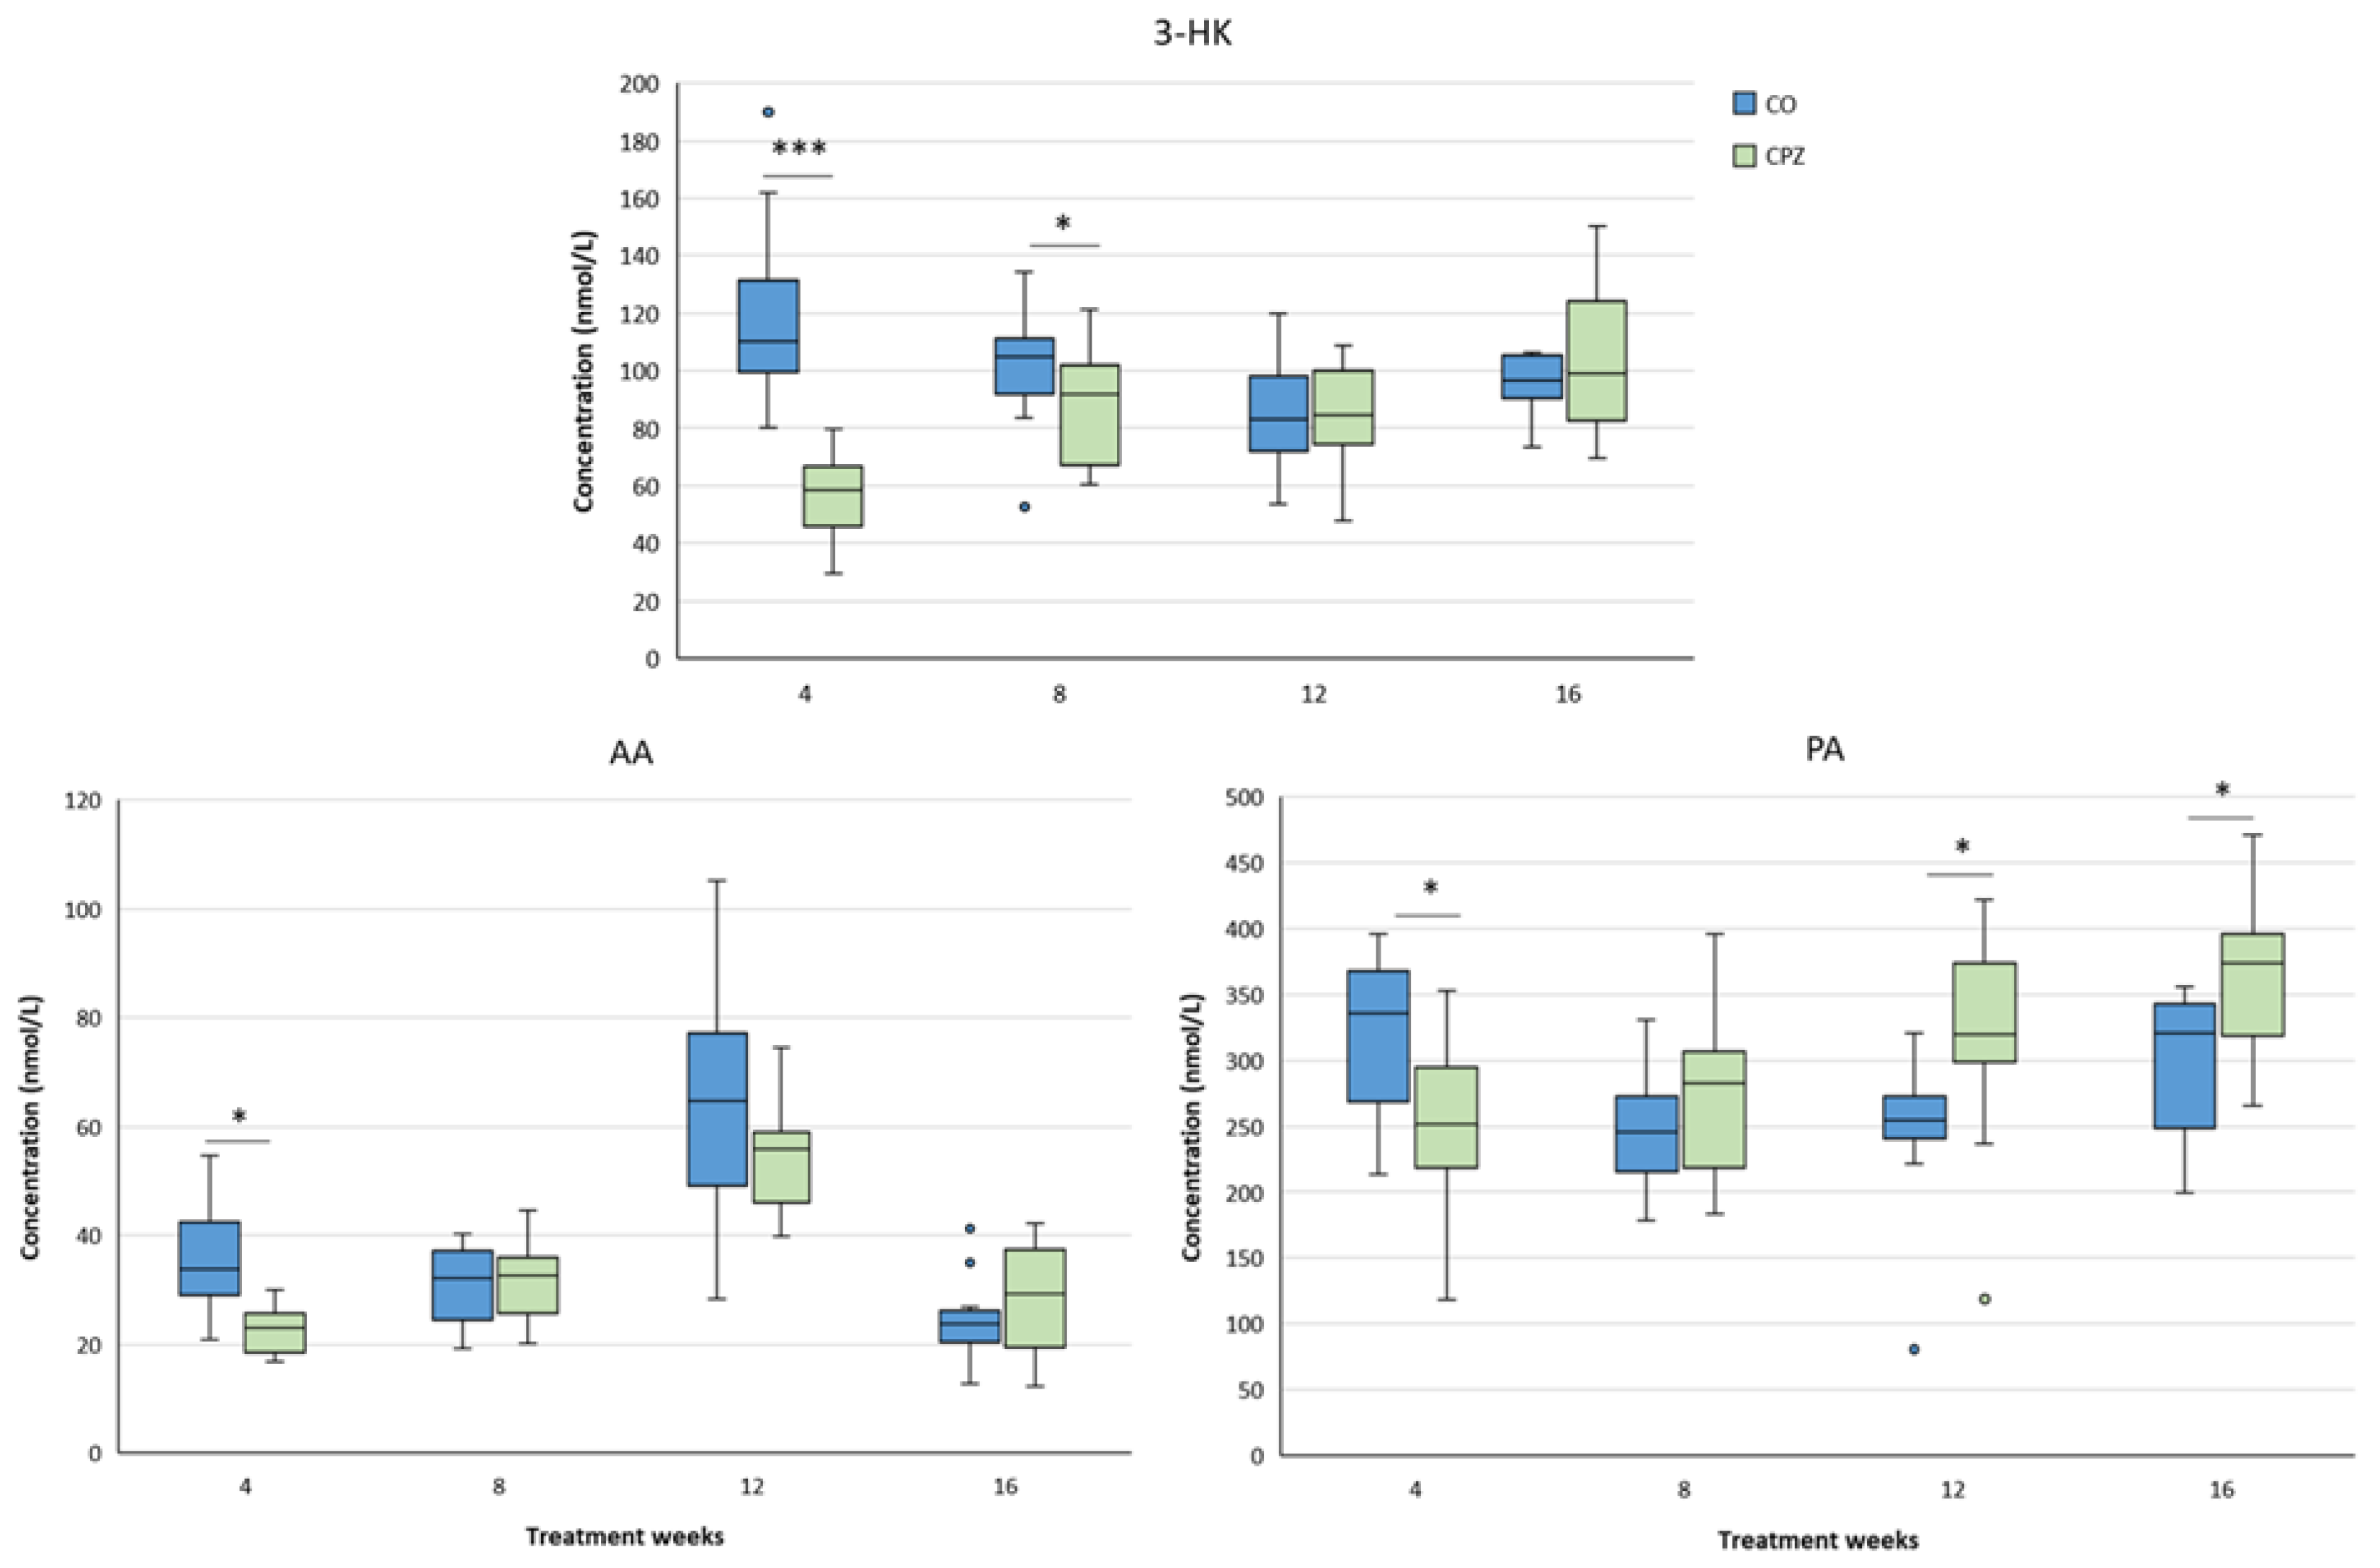
Figure 10.
Differences 3-hydroxyanthranilic acid (3-HANA) and quinolinic acid (QUIN) concentrations in plasma during investigation. In the fourth week of intoxication, the level of 3-HANA and QUIN decreasd remarkedly in the CPZ group as a result of treatment. In the case of 3-HANA, this remained until the twelfth week of poisoning, but at the end of recovery the 3-HANA concentrations in the groups were almost the same. However, the plasma level of QUIN gradually increased as the CPZ intoxication progressed and by the end of treatment was significantly higher in the CPZ group compared to the CO. Moreover, at the fourth week of remyelination period the level of QUIN suddenly decreased markedly in the CPZ group. CO: control group, CPZ: cuprizone treated group, *: p < 0.05 vs. CO, ***: p < 0.001 vs. CO. We show the data median ± IQR, with the outliers.
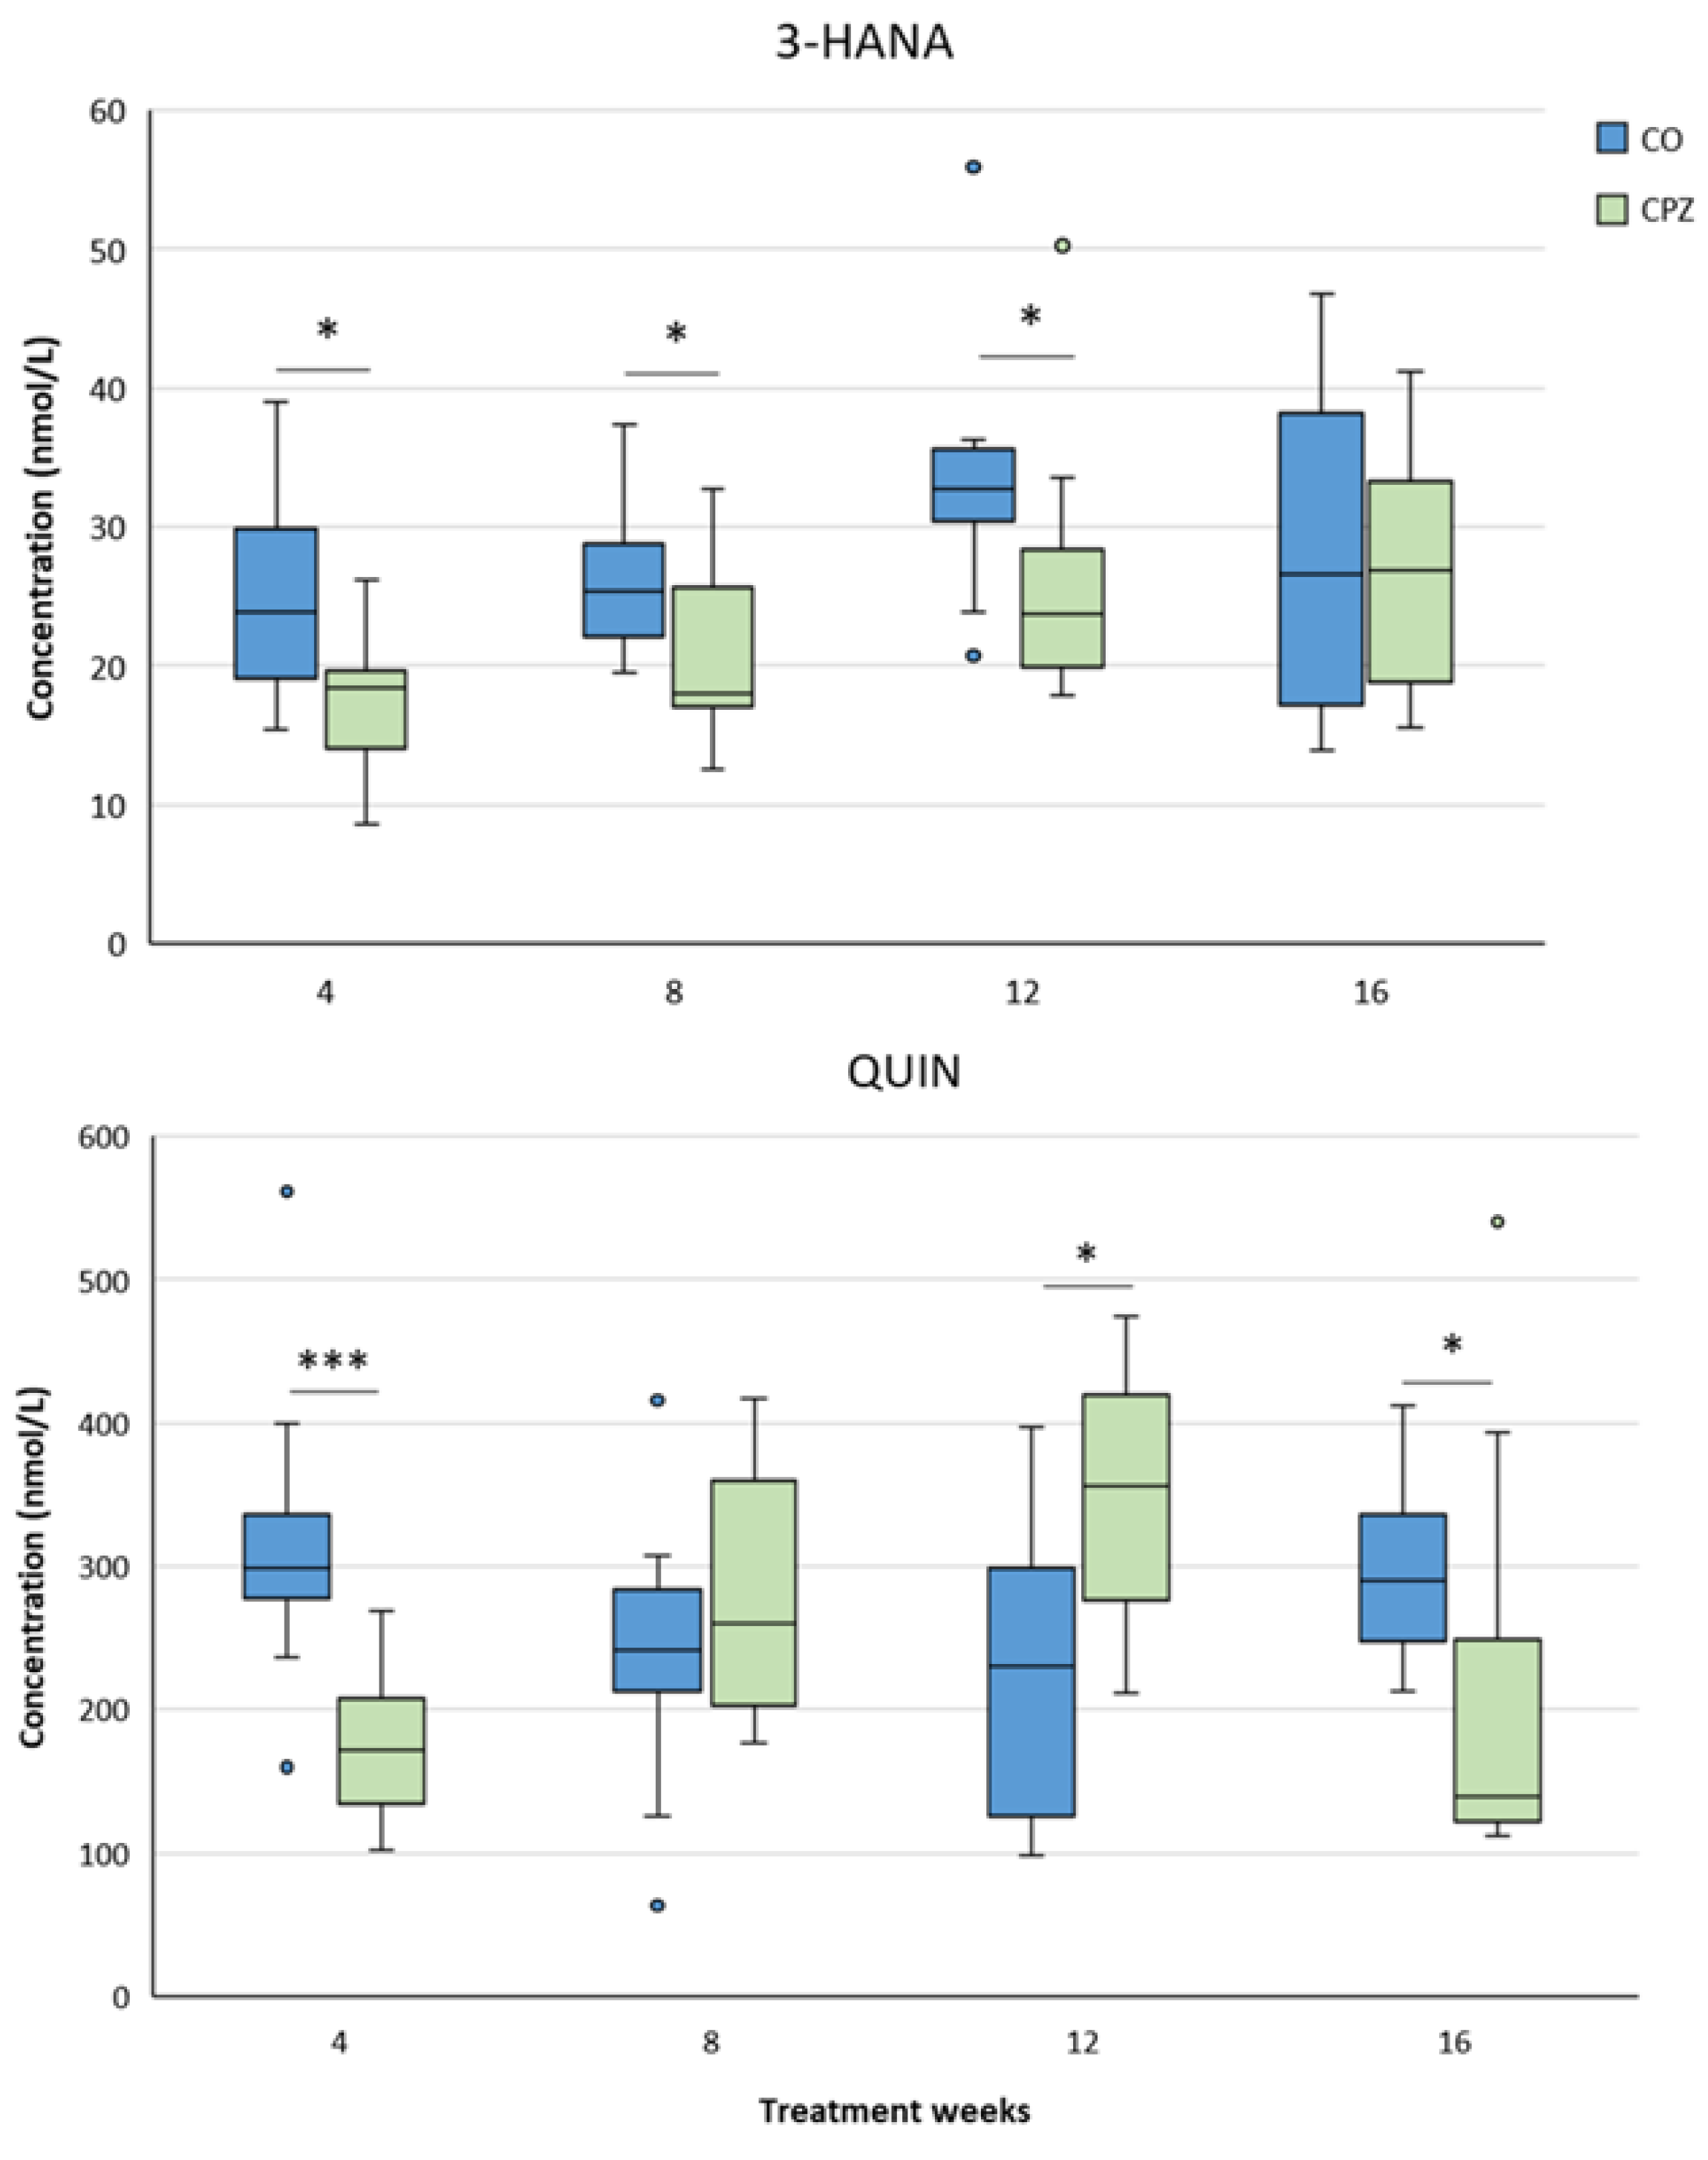
Figure 11.
Increased excitotoxicity in plasma. A marked increase in the plasma excitotoxicity index of the CPZ group was noticed throughout the treatment period, which deviation normalized between groups in the remyelination period. CO: control group, CPZ: cuprizone treated group, ***: p < 0.001 vs. CO. We show the data median ± IQR, with the outliers.
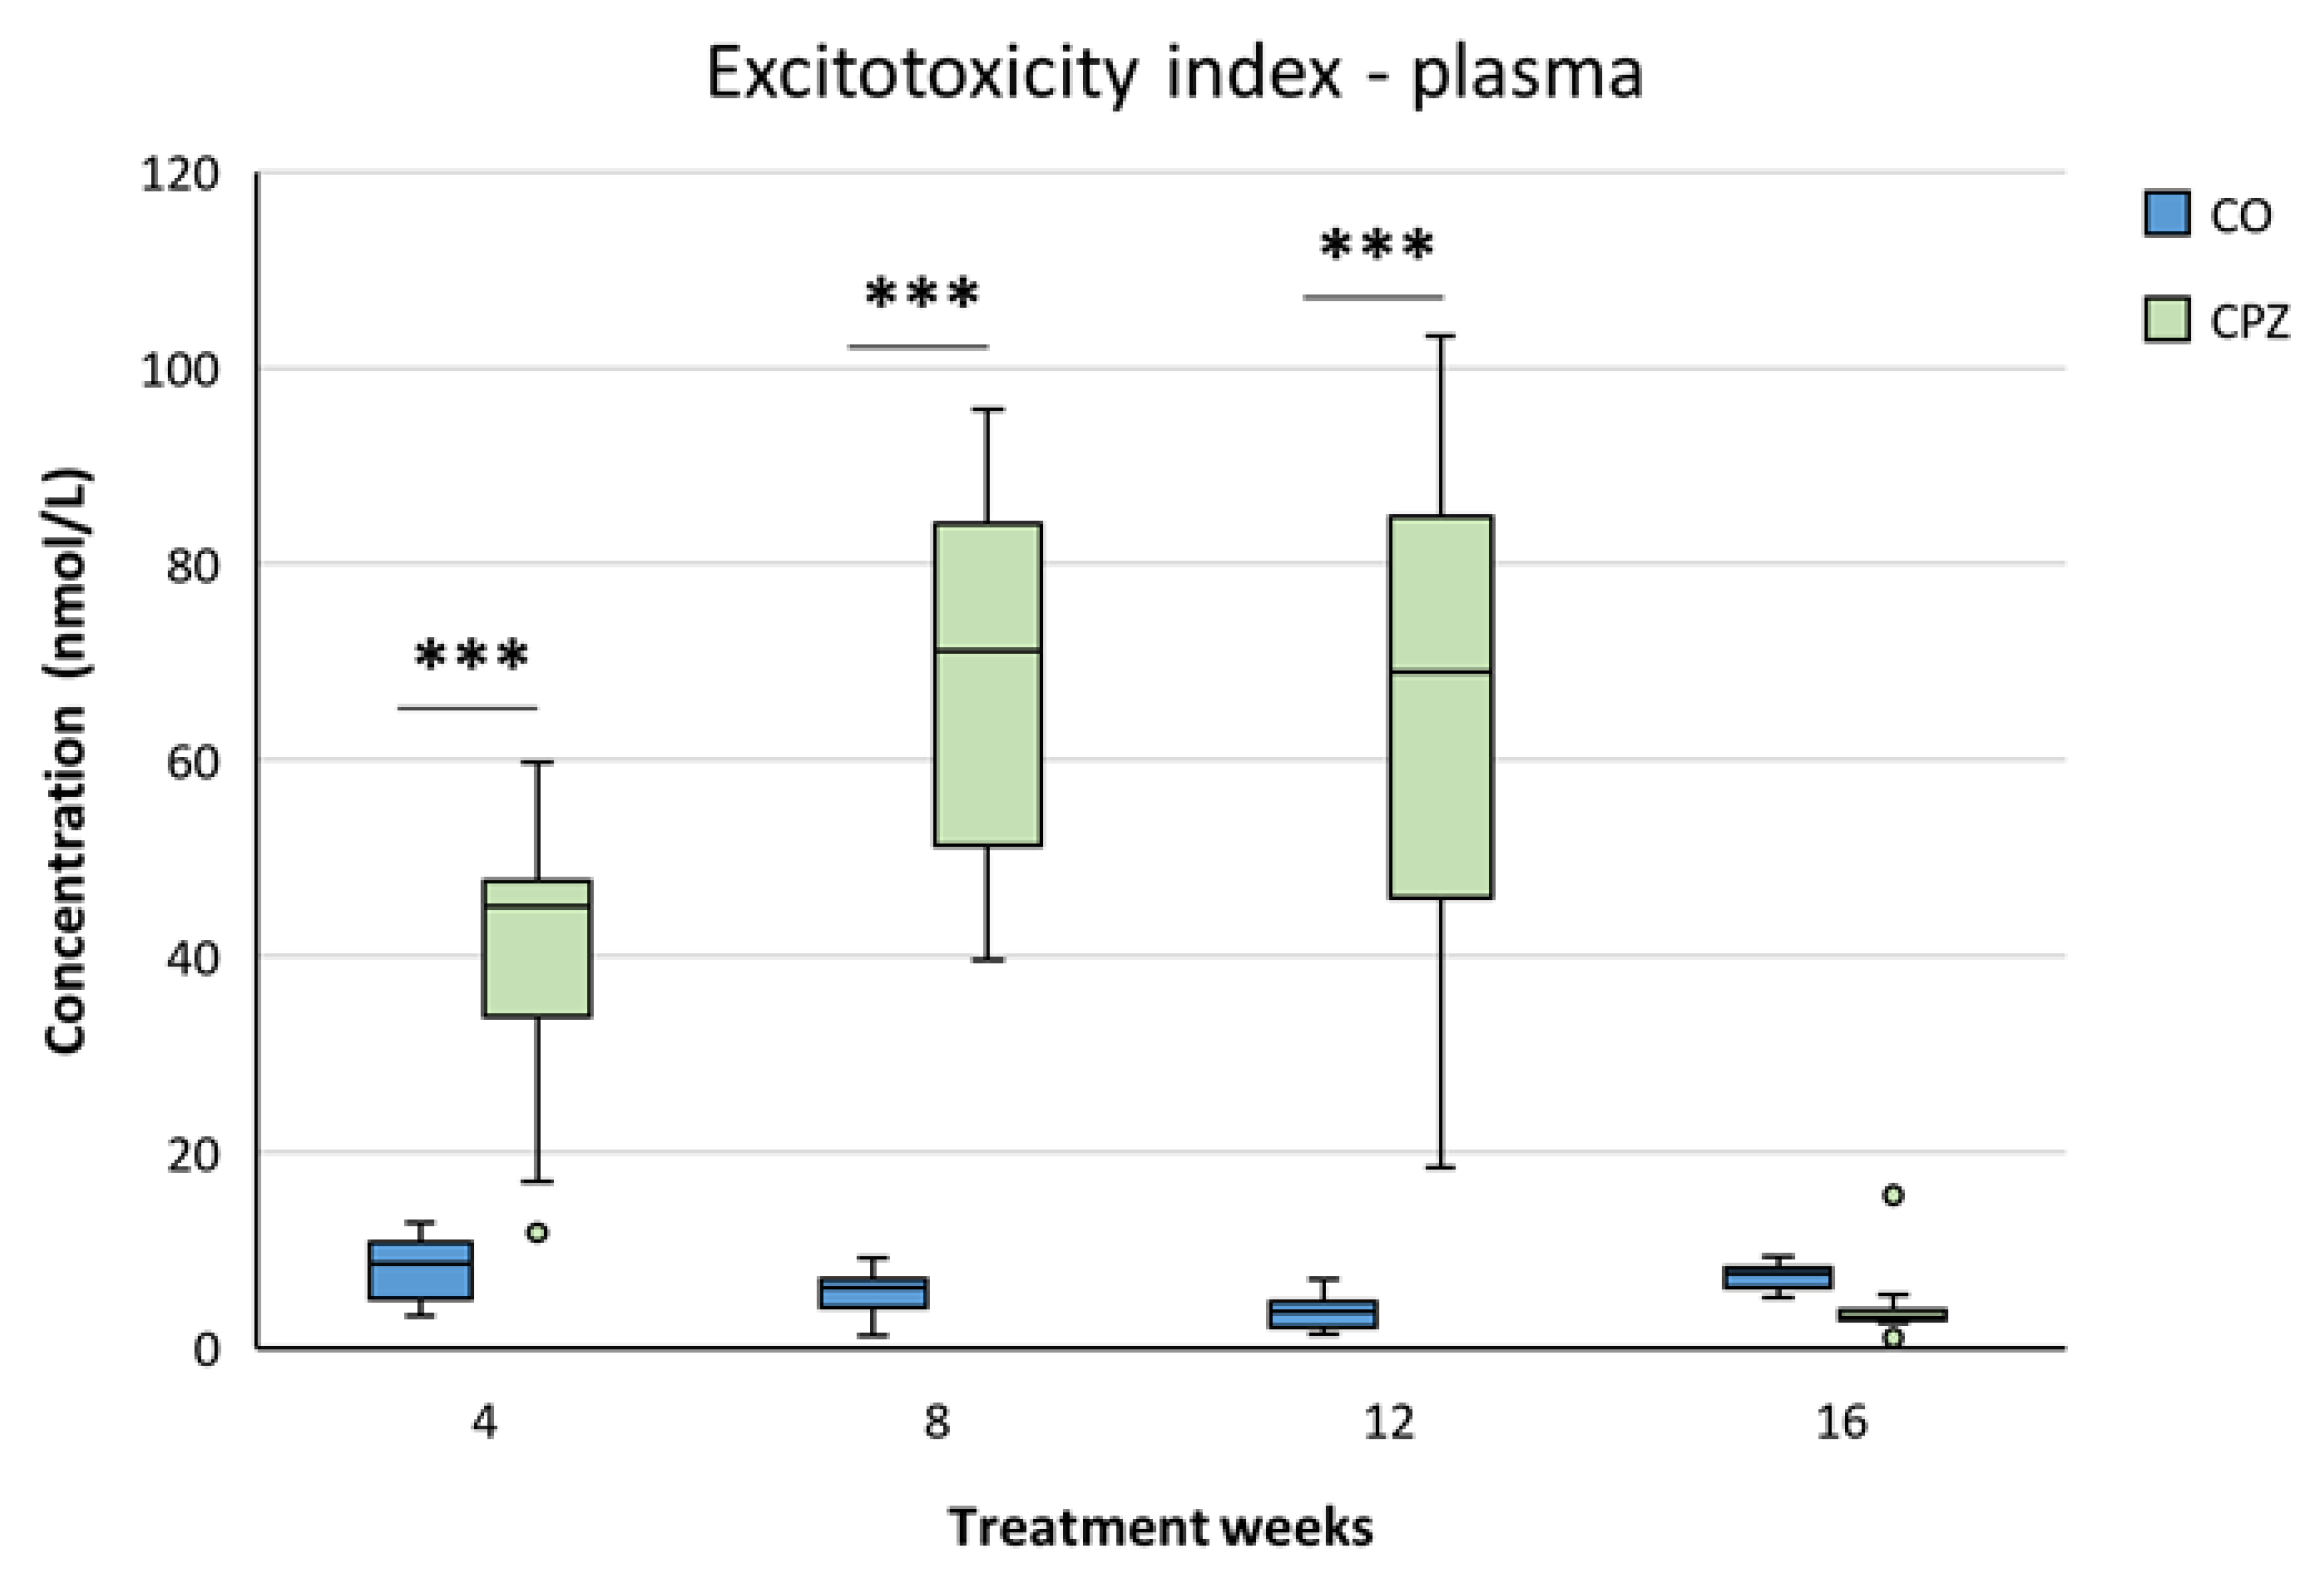
Figure 12.
Variations in the levels of 3-hydroxy-L-kynurenine (3-HK), xanthurenic acid (XA) anthranilic acid (AA) and quinaldic acid (QAA) metabolites in the striatum during our investigation. By the fourth week of the intoxication, the concentrations of 3-HK, XA, AA and QAA of the CPZ group were markedly reduced compared to the CO group, which differences remained until the end of demyelination period in the case of XA and QAA. The level of 3-HK gradually increased as the damage progressed and by the end of recovery its concentration was significantly higher in the treated group than in the CO. Similarly, the level of AA also showed an increasing trend with the progression of demyelination, and by the twelfth week of intoxication the AA value of the CPZ group was remarkably higher than that of the CO group. However, by the end of the remyelination phase the levels of 3-HK, XA and AA also normalized and the concentrations of these metabolites of the CO and CPZ groups were in a similar range. CO: control group, CPZ: cuprizone treated group, *: p < 0.05 vs. CO, **: p < 0.01 vs. CO, ***: p < 0.01 vs. CO. We show the data median ± IQR, with the outliers.
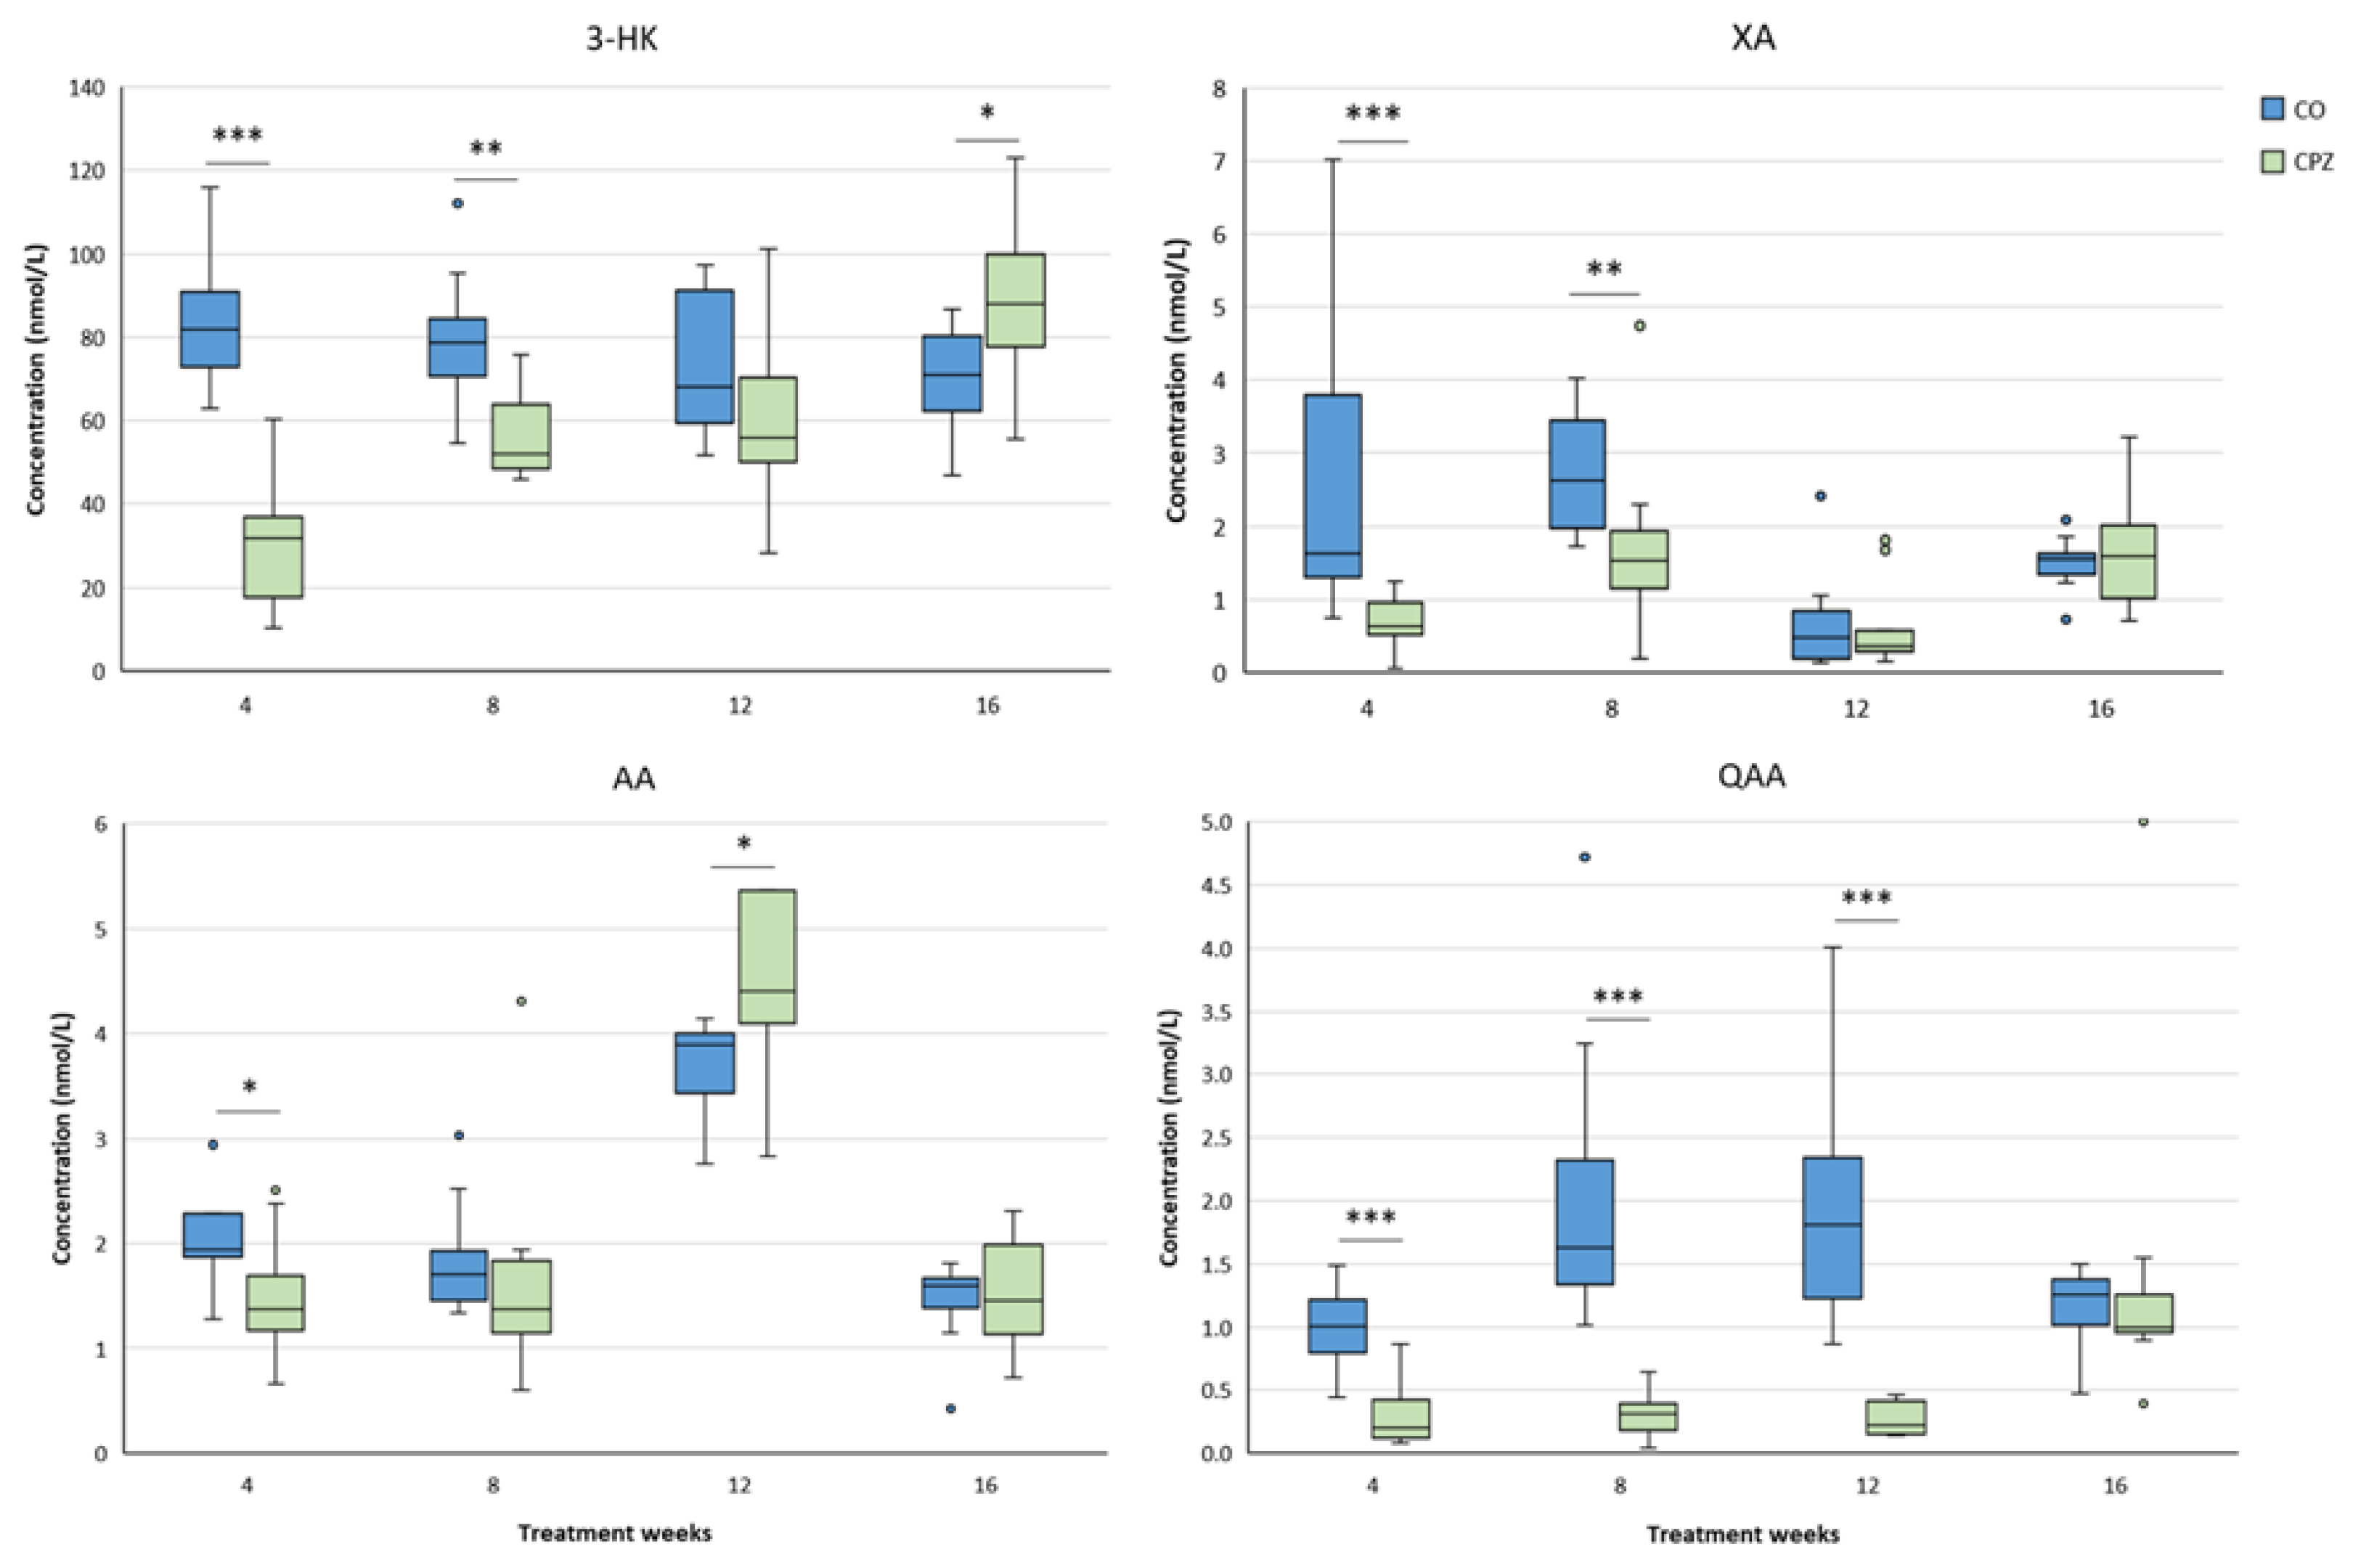
Figure 13.
Changes in kynurenic acid (KYNA), xanthurenic acid (XA), anthranilic acid (AA) and quinaldic acid (QAA) levels in the cortex. The decreased KYNA level of the CPZ group became marked by the eighth week of poisoning, which deviation remained until the end of intoxication, but normalized during remyelination period. Similarly, the concentration of XA and QAA also decreased remarkably at the beginning of toxin treatment and these persisted until the end of intoxication, but by the fourth week of recovery these differences disappeared between the groups in the case of both XA and QAA. However, after the initial decreased level, the concentration of AA gradually increased in the CPZ group as the damage progressed and by the end of the study, higher AA value was seen in the cortex of the CPZ-treated animals than in the CO. CO: control group, CPZ: cuprizone treated group, *: p < 0.05 vs. CO, **: p < 0.01 vs. CO, ***: p < 0.001 vs. CO. We show the data median ± IQR, with the outliers.
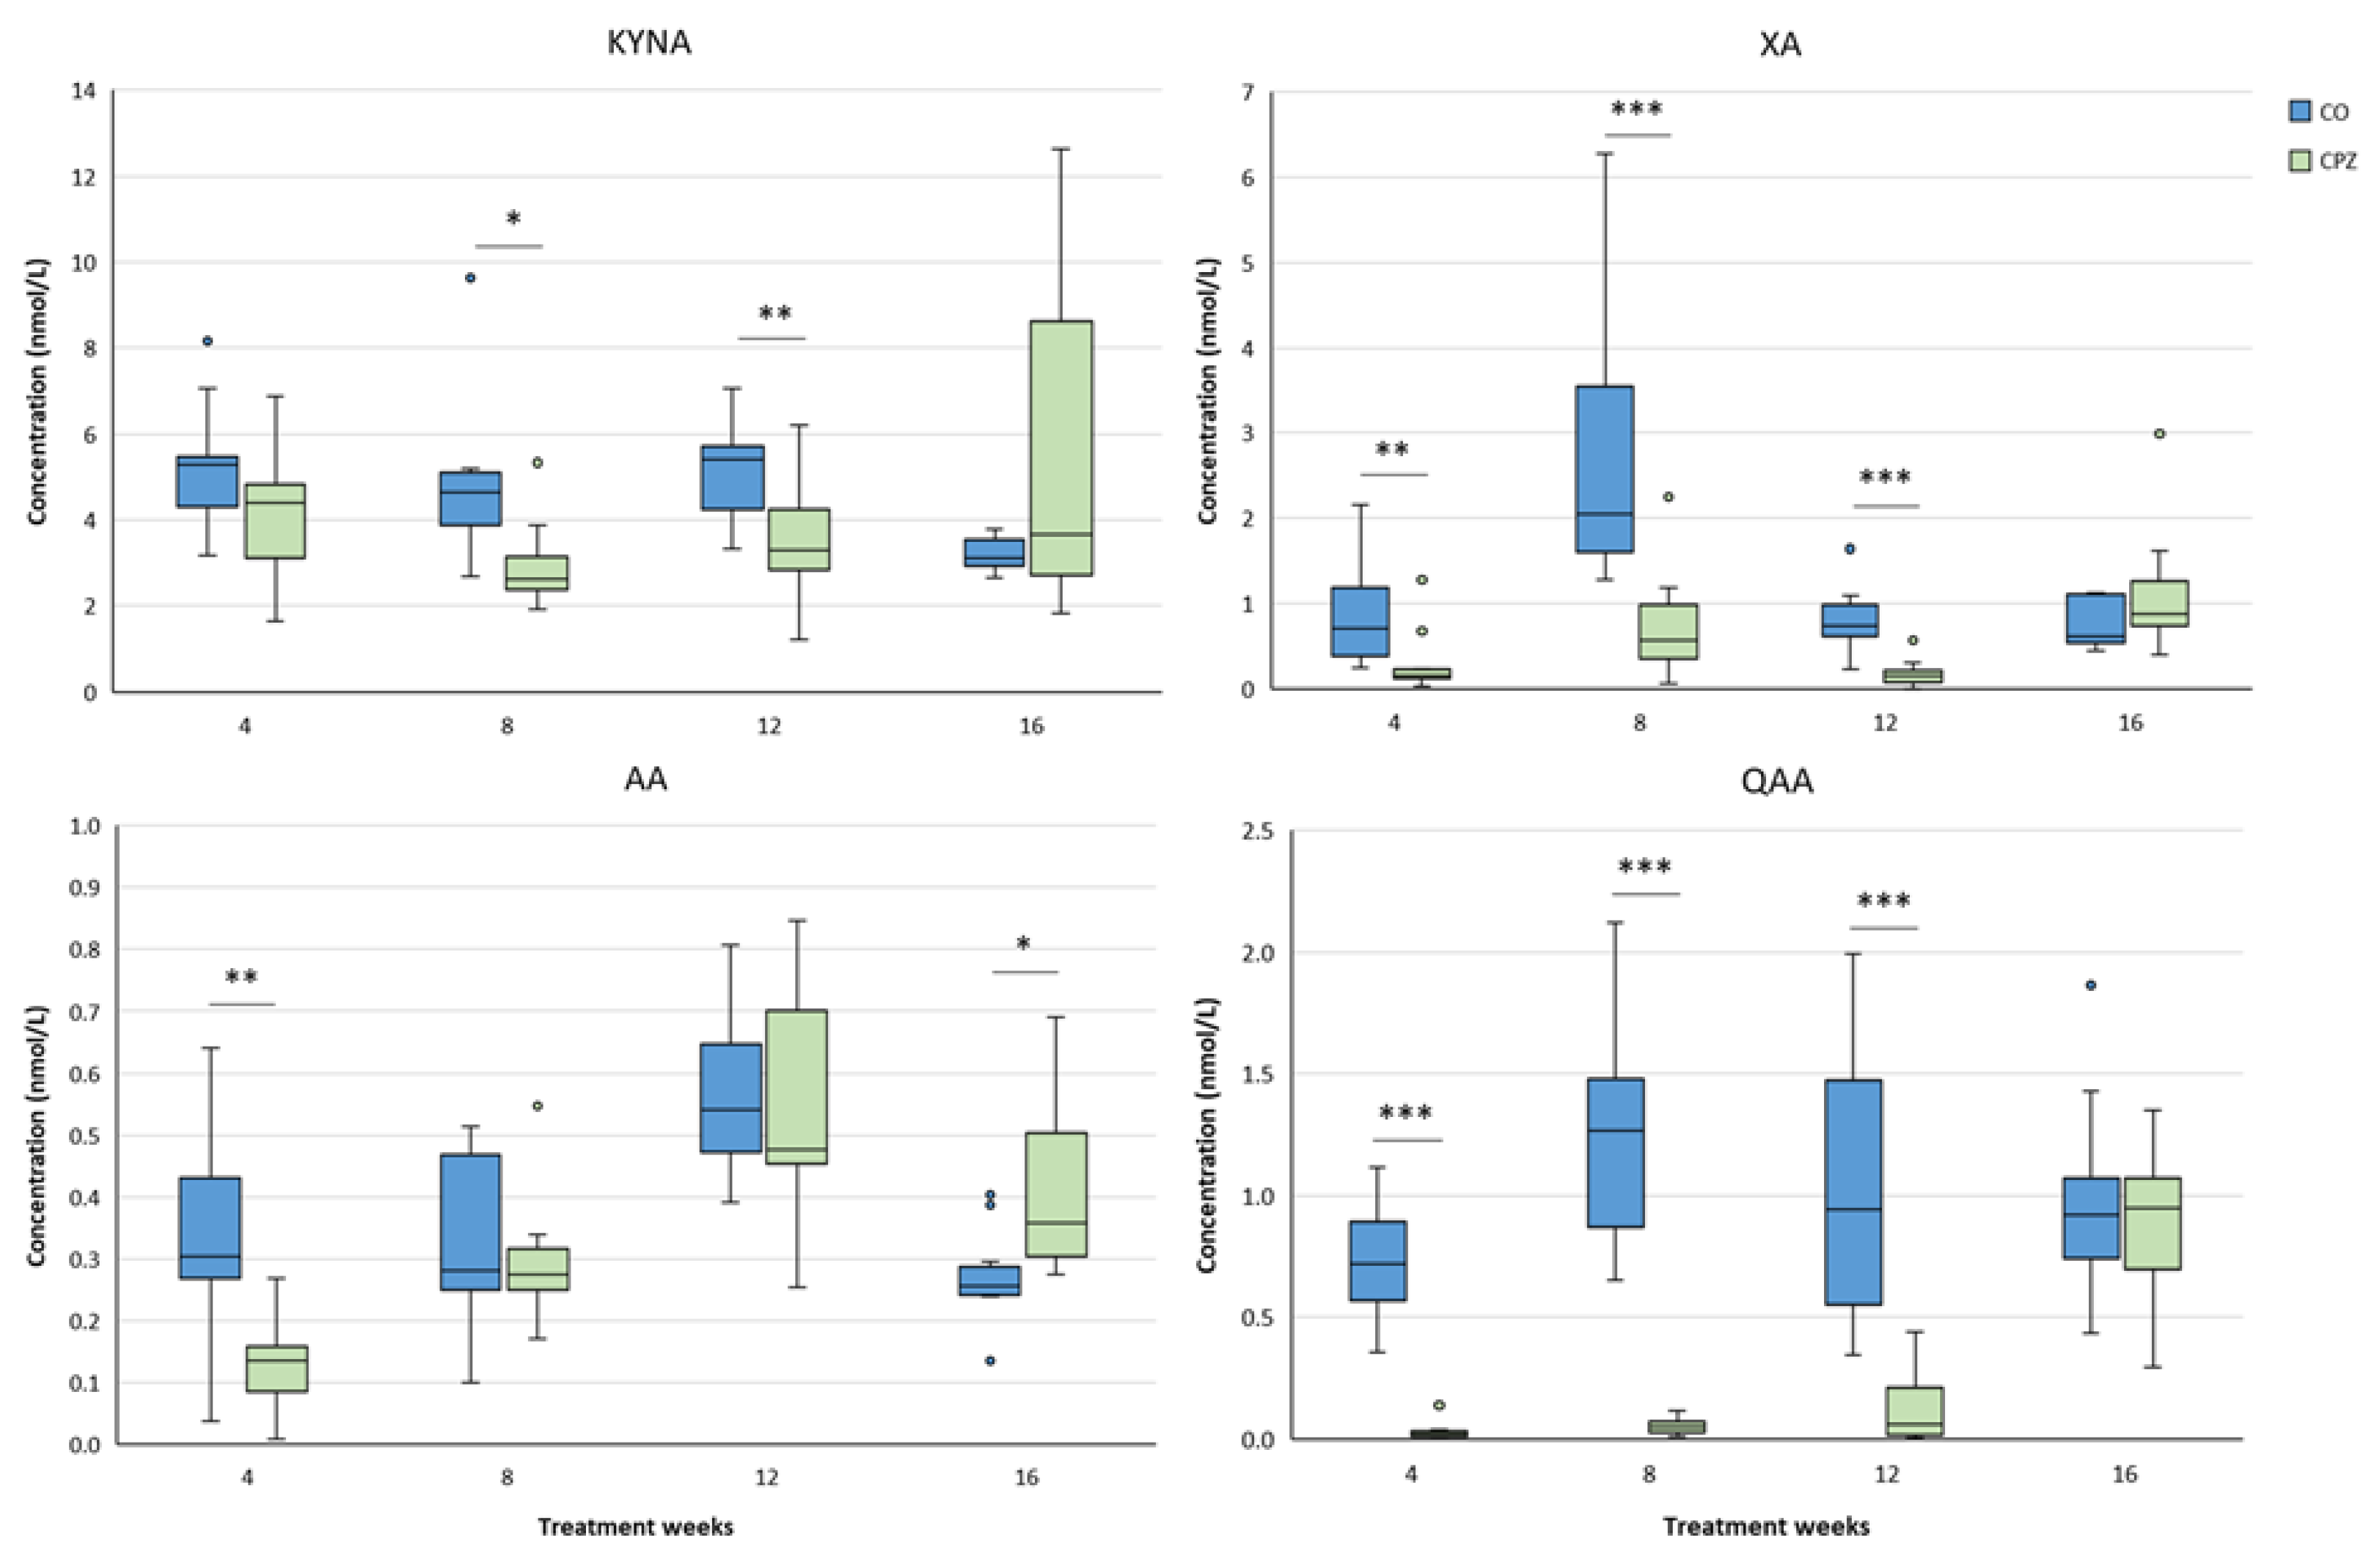
Figure 14.
Reduced 3-hydroxy-L-kynurenine (3-HK) and 3-hydroxyanthranilic acid (3-HANA) levels in the cortex during CPZ poisoning. As a result of intoxication, the concentration of 3-HK and 3-HANA were markedly reduced in the treated group. However, during the recovery, the level of the 3-HANA was normalized, while the value of 3-HK was definitely higher in the CPZ group, than in the CO group. CO: control group, CPZ: cuprizone treated group, *: p < 0.05 vs. CO, **: p < 0.01 vs. CO, ***: p < 0.001 vs. CO. We show the data median ± IQR, with the outliers.

Figure 15.
Alterations in kynurenic acid (KYNA), 3-hydroxy-L-kynurenine (3-HK), quinaldic acid (QAA) and xanthurenic acid (XA) levels in the hippocampus during the investigation. The KYNA concentration of the CPZ group was significantly lower, than that the CO group in the eighth week of treatment. After that, it showed an increasing trend and at the end of remyelination period the KYNA level of the CO group was higher, that the CO group. The values of 3-HK, QAA and XA were also markedly lower in the toxin treated animals in the fourth week of poisoning, which difference remained in the case of QAA until the end of treatment, while the levels of 3-HK and XA slowly increased, and the deviations between the groups disappeared by the twelfth week of toxicity. CO: control group, CPZ: cuprizone treated group, *: p < 0.05 vs. CO, **: p < 0.01 vs. CO, ***: p < 0.001 vs. CO. We show the data median ± IQR, with the outliers.
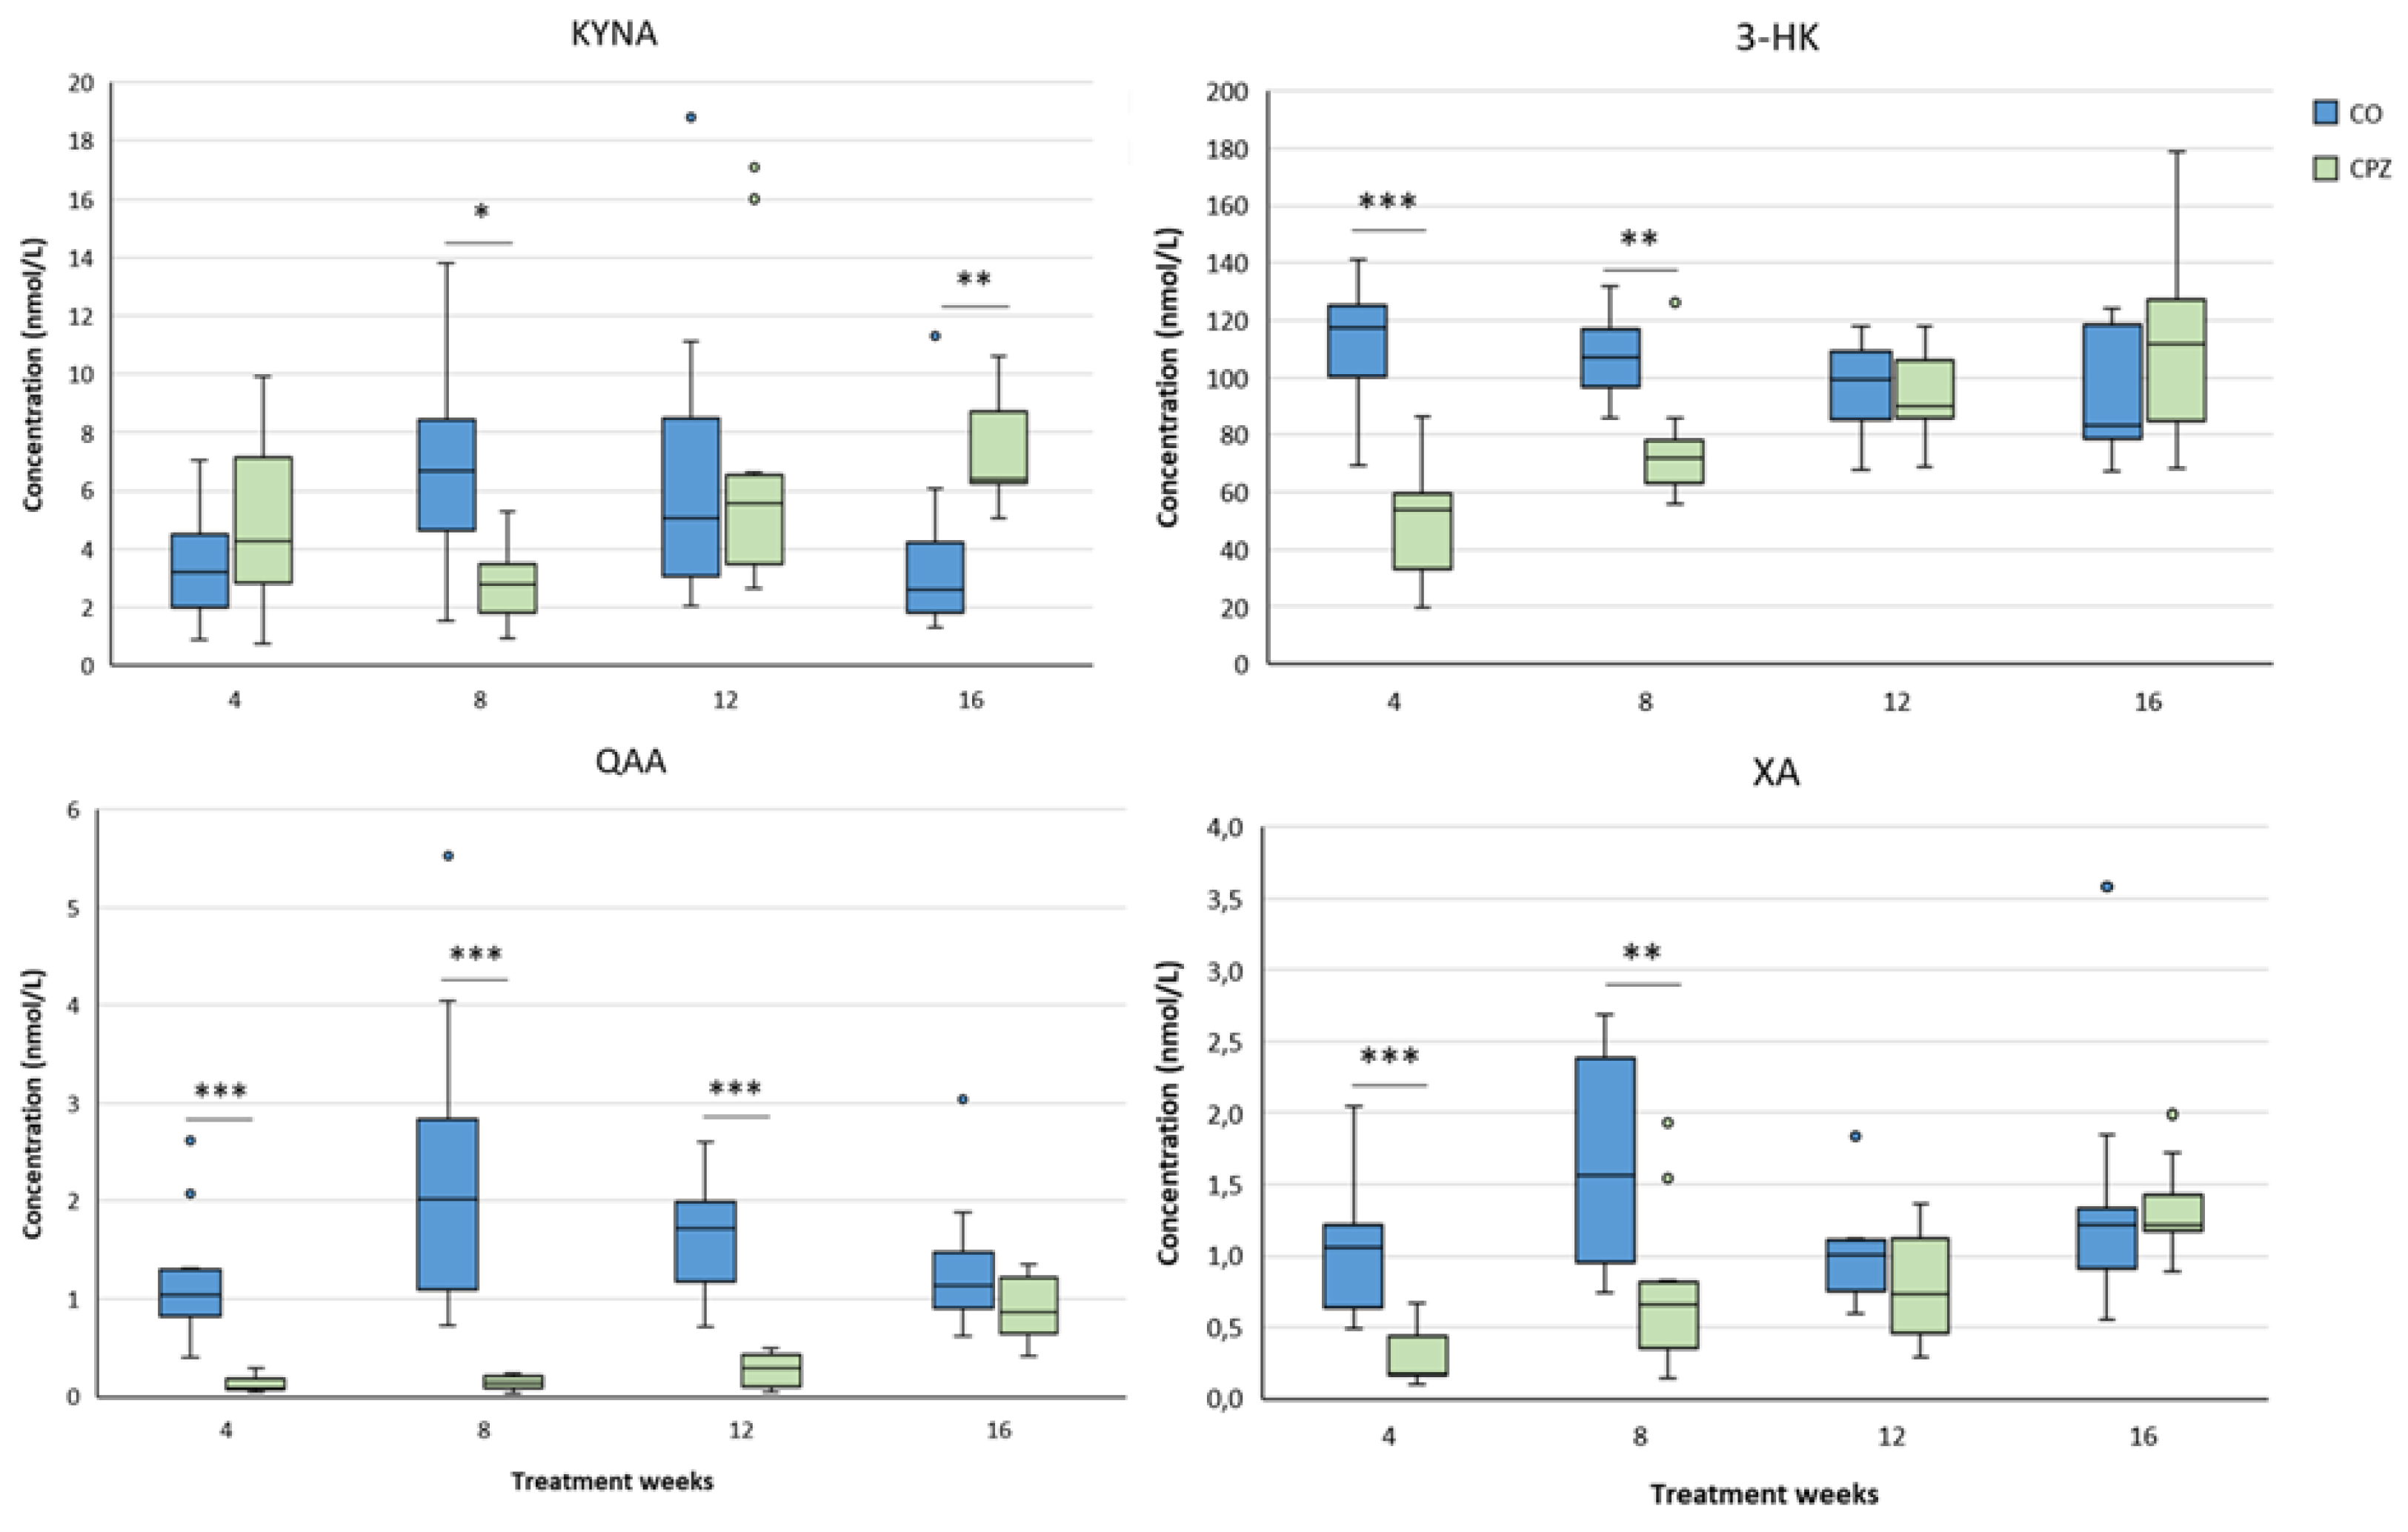
Figure 16.
Deviations in hippocampal anthranilic acid (AA), derivatized picolinic acid (PAD) and quinolinic acid (QUIN) levels during examination. The AA concentration in the CPZ group was significantly reduced at the beginning of toxin-treatment, but slowly elevated as the weeks progressed, and during recovery AA levels of the CO and CPZ groups were in the same range. At the twelfth week of poisoning, the concentrations of PAD and QUIN in the CPZ group were markedly higher than those in the CO group. Although QUIN level normalized after the toxin withdrawal, PAD value in the intoxicated group remained high level until the end of remyelination phase. CO: control group, CPZ: cuprizone treated group, *: p < 0.05 vs. CO, **: p < 0.01 vs. CO, ***: p < 0.001 vs. CO. We show the data median ± IQR, with the outliers.
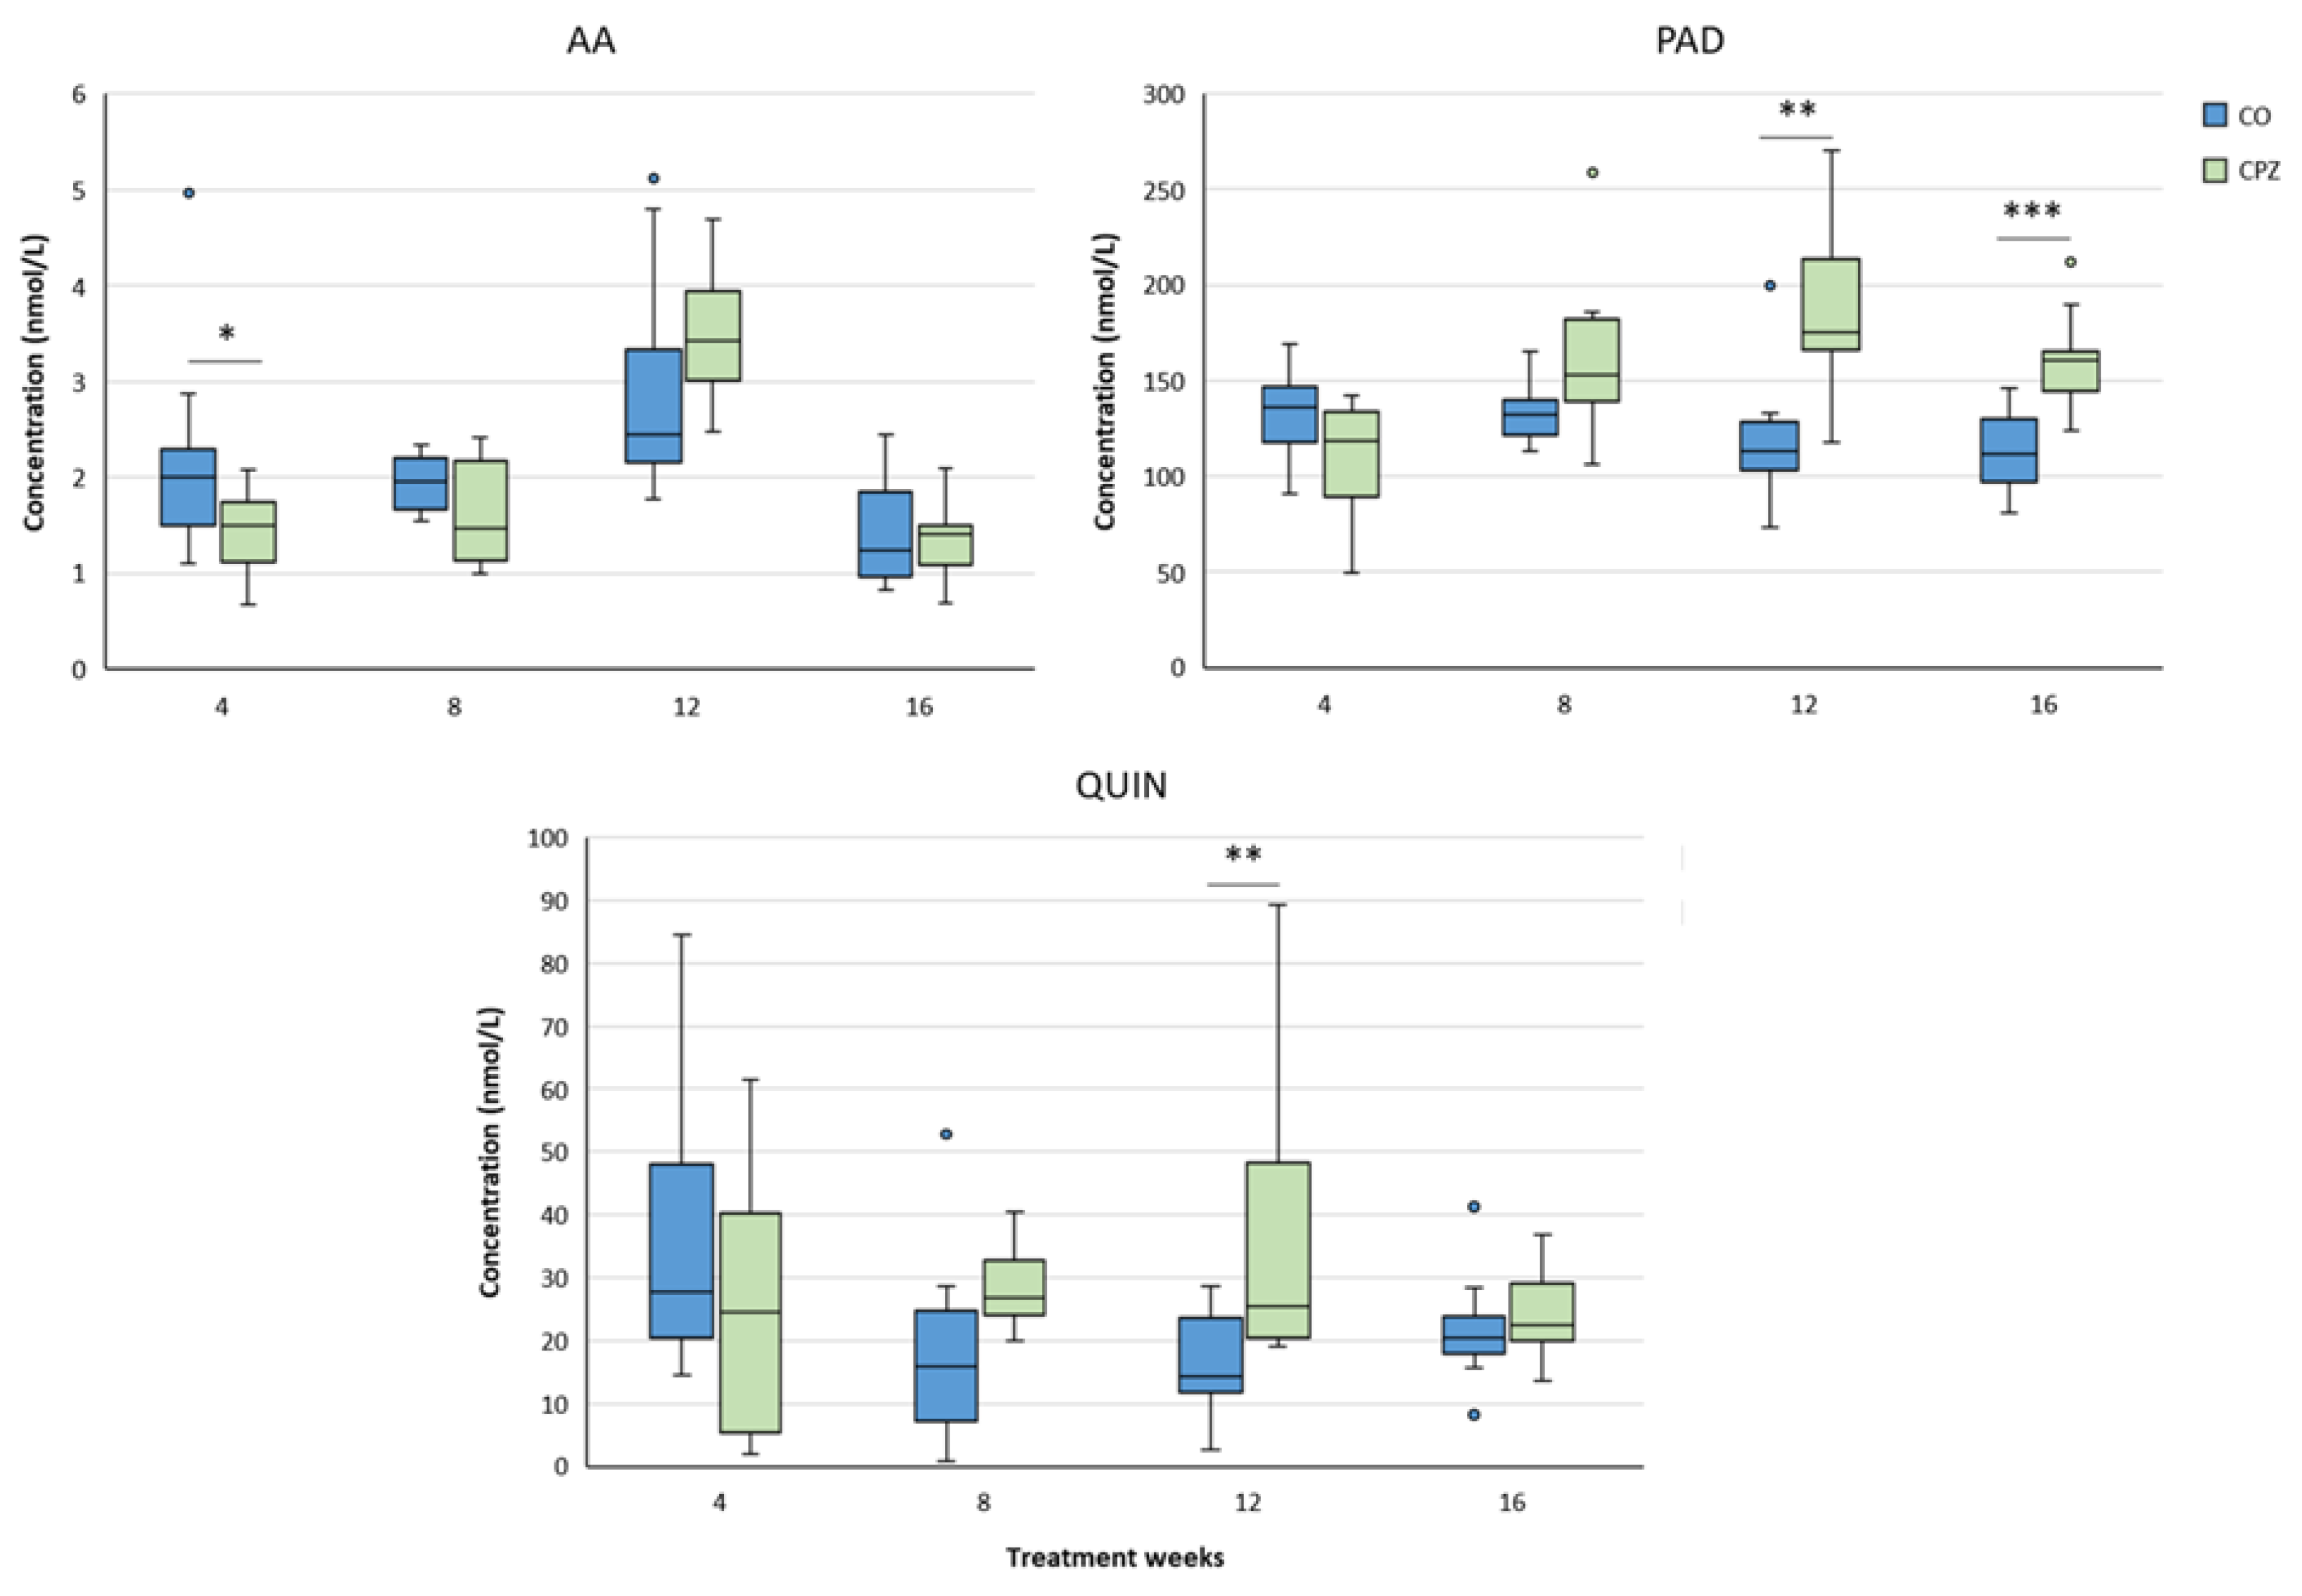
Figure 17.
Changes of kynurenine metabolites in the brainstem during intoxication. In the fourth week of poisoning, the concentration of kynurenic acid (KYNA) increased in the CPZ group, compared to the CO group. However, by the twelfth week of intoxication, the level of KYNA had significantly decreased in the treated group, while by the end of recovery a higher KYNA value was again detectable. The level of 3-hydroxy-L-kynurenine (3-HK) reduced remarkably at the beginning of toxicity, then gradually elevated as the treatment progressed and by the end of remyelination, it was at a higher level in the CPZ group, than in the CO. Nonetheless, in the CPZ group, the concentrations of quinaldic acid (QAA) and xanthurenic acid (XA) were markedly low throughout the treatment period, but by the fourth week of recovery phase, there were no detectable differences between the groups. CO: control group, CPZ: cuprizone treated group, *: p < 0.05 vs. CO, **: p < 0.01 vs. CO, ***: p < 0.001 vs. CO. We show the data median ± IQR, with the outliers.

Figure 18.
Alterations in brainstem 3-hydroxyanthranilic acid (3-HANA) and quinolinic acid (QUIN) levels during examination. The values of 3-HANA and QUIN decreased pronounced in treated group at the beginning of the toxicity, but as the damage progressed an increasing trend was seen in the level of these metabolites. Therefore, by the end of remyelination period, there were no detectable differences in the 3-HANA and QUIN concentrations between the CO and CPZ groups. CO: control group, CPZ: cuprizone treated group, *: p < 0.05 vs. CO, ***: p < 0.001 vs. CO. We show the data median ± IQR, with the outliers.
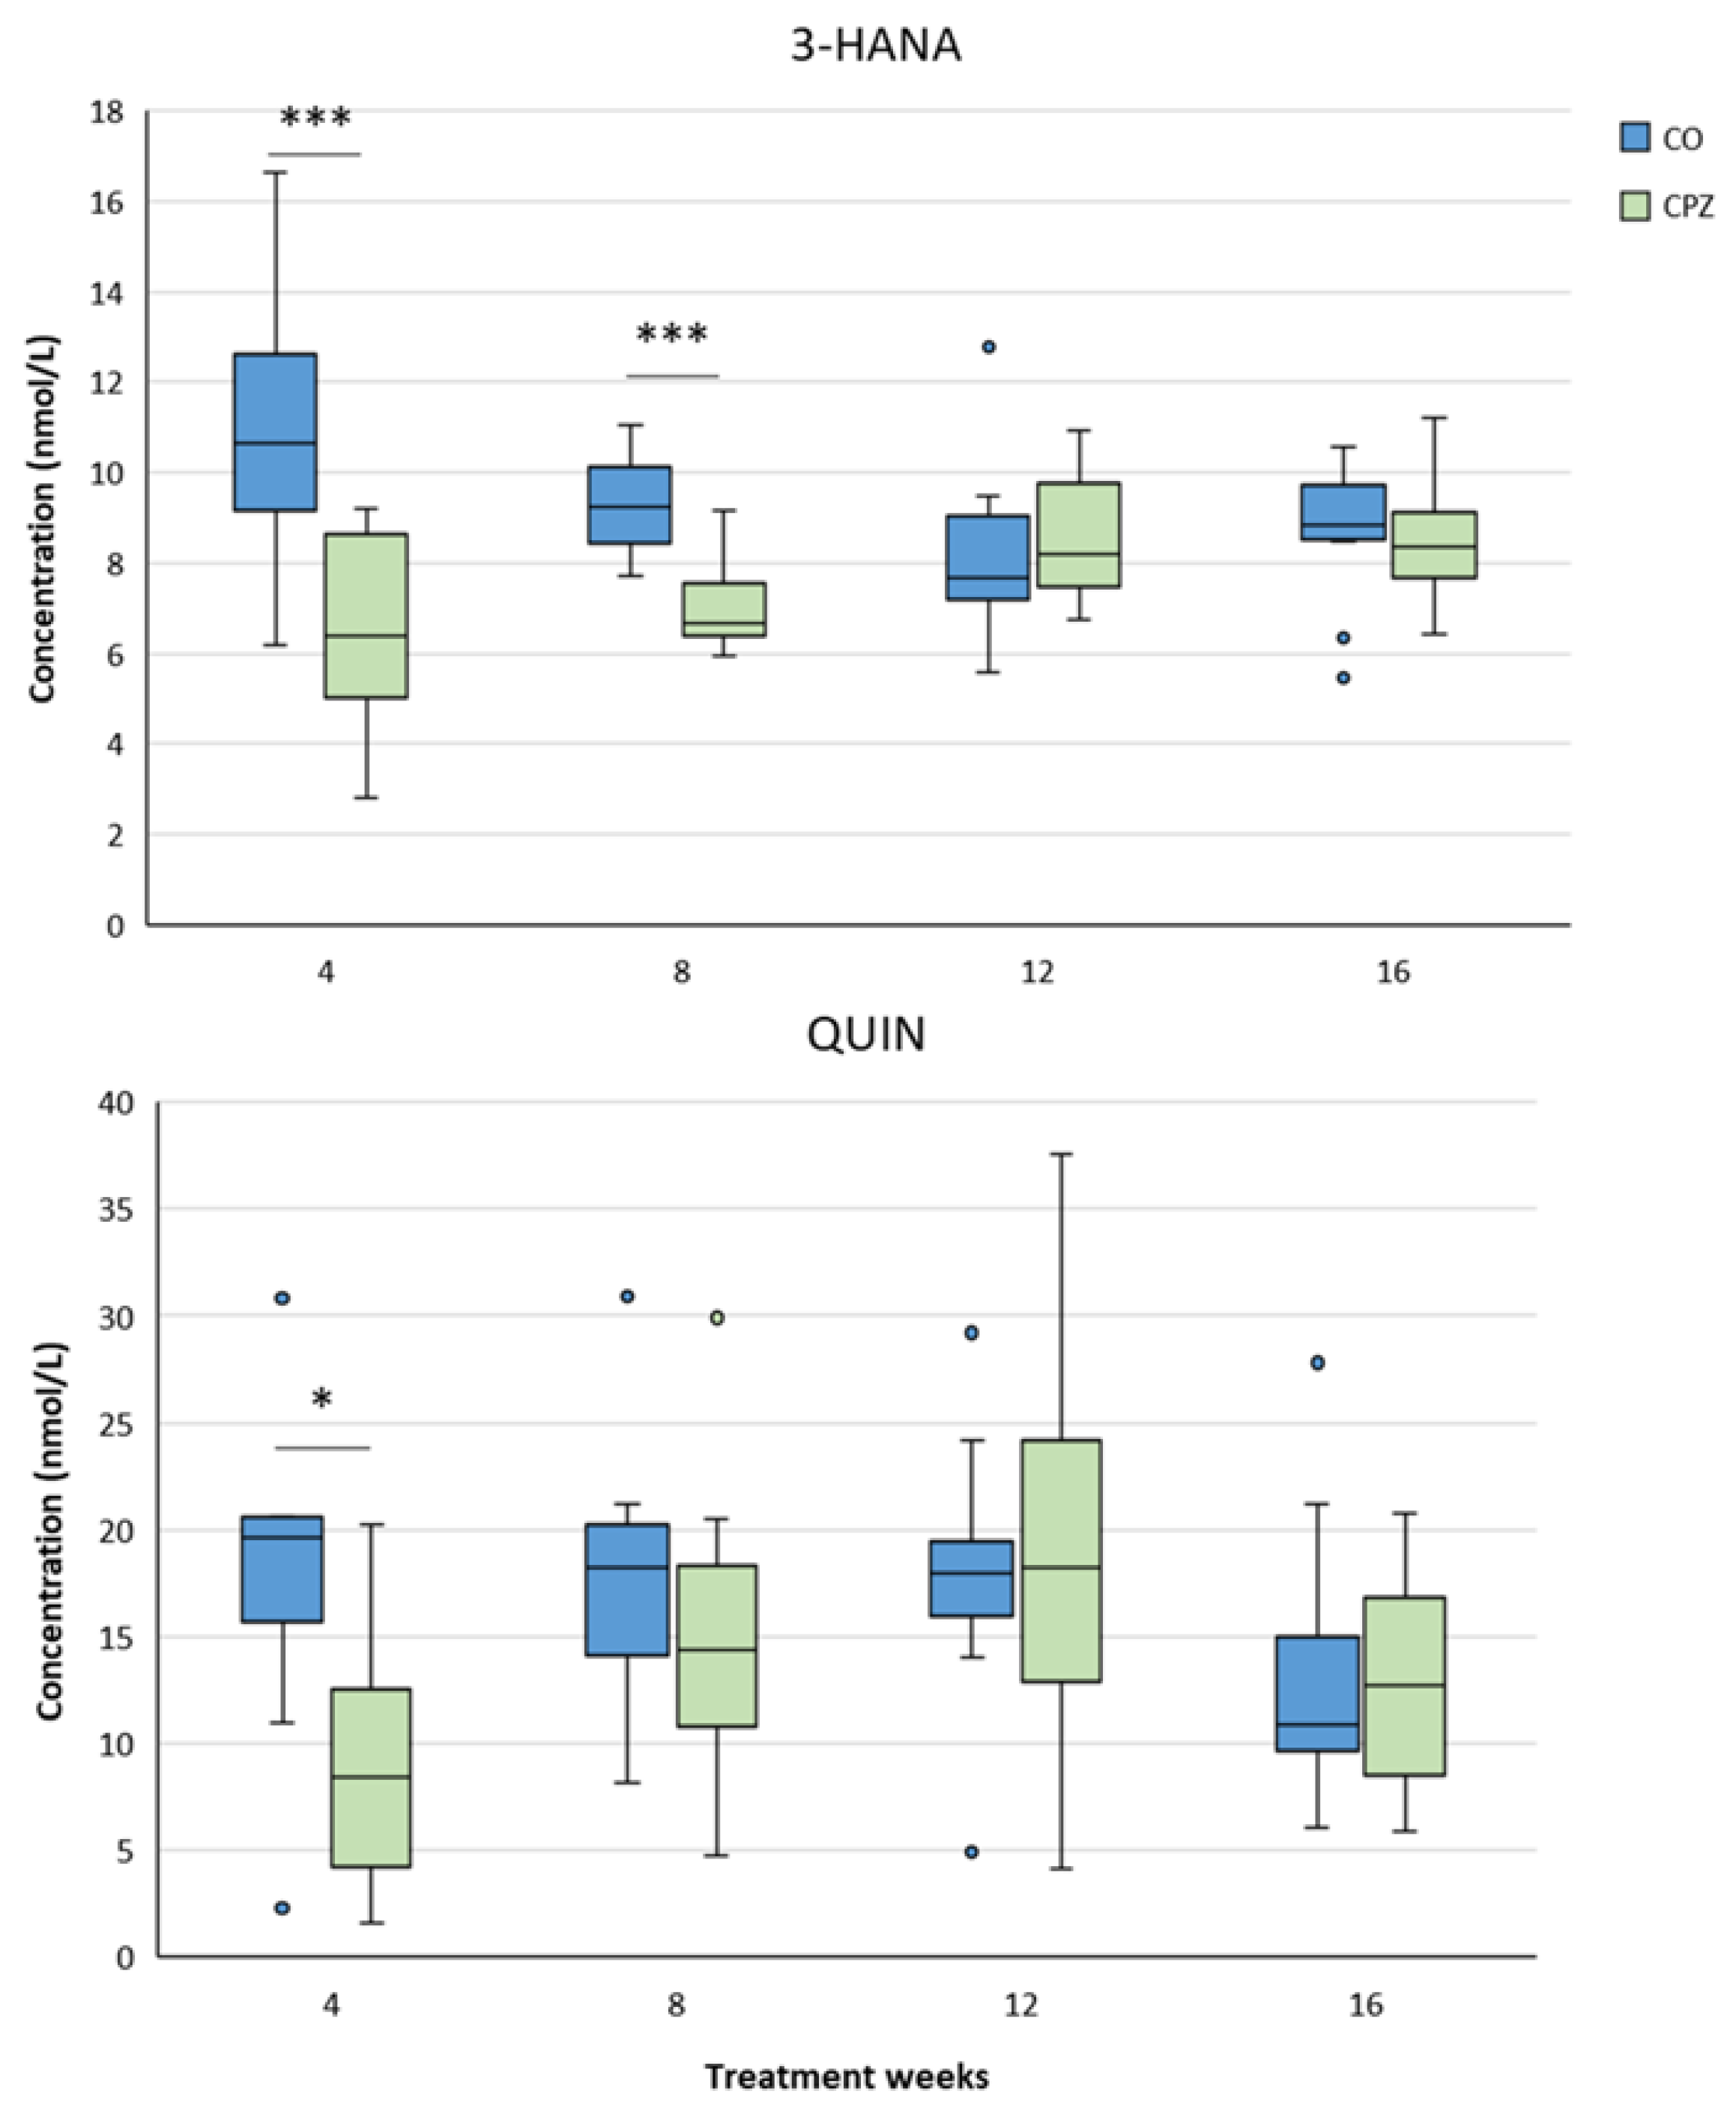
Figure 19.
Reduced cerebellar 3-hydroxy-L-kynurenine (3-HK), xanthurenic acid (XA), kynurenic acid (KYNA) and quinaldic acid (QAA) concentrations as a result of toxin treatment. During the period of intoxication, cerebellar levels of 3-HK, XA, KYNA and QAA were markedly reduced in the CPZ group, compared to the CO group. However, at the end of remyelination phase, the metabolite levels of the treated group were similar to those of the CO group, except for the concentration of KYNA, because its value was higher in the toxin-treated group at the end of recovery, than in the CO. CO: control group, CPZ: cuprizone treated group, *: p < 0.05 vs. CO, **: p < 0.01 vs. CO, ***: p < 0.001 vs. CO. We show the data median ± IQR, with the outliers.
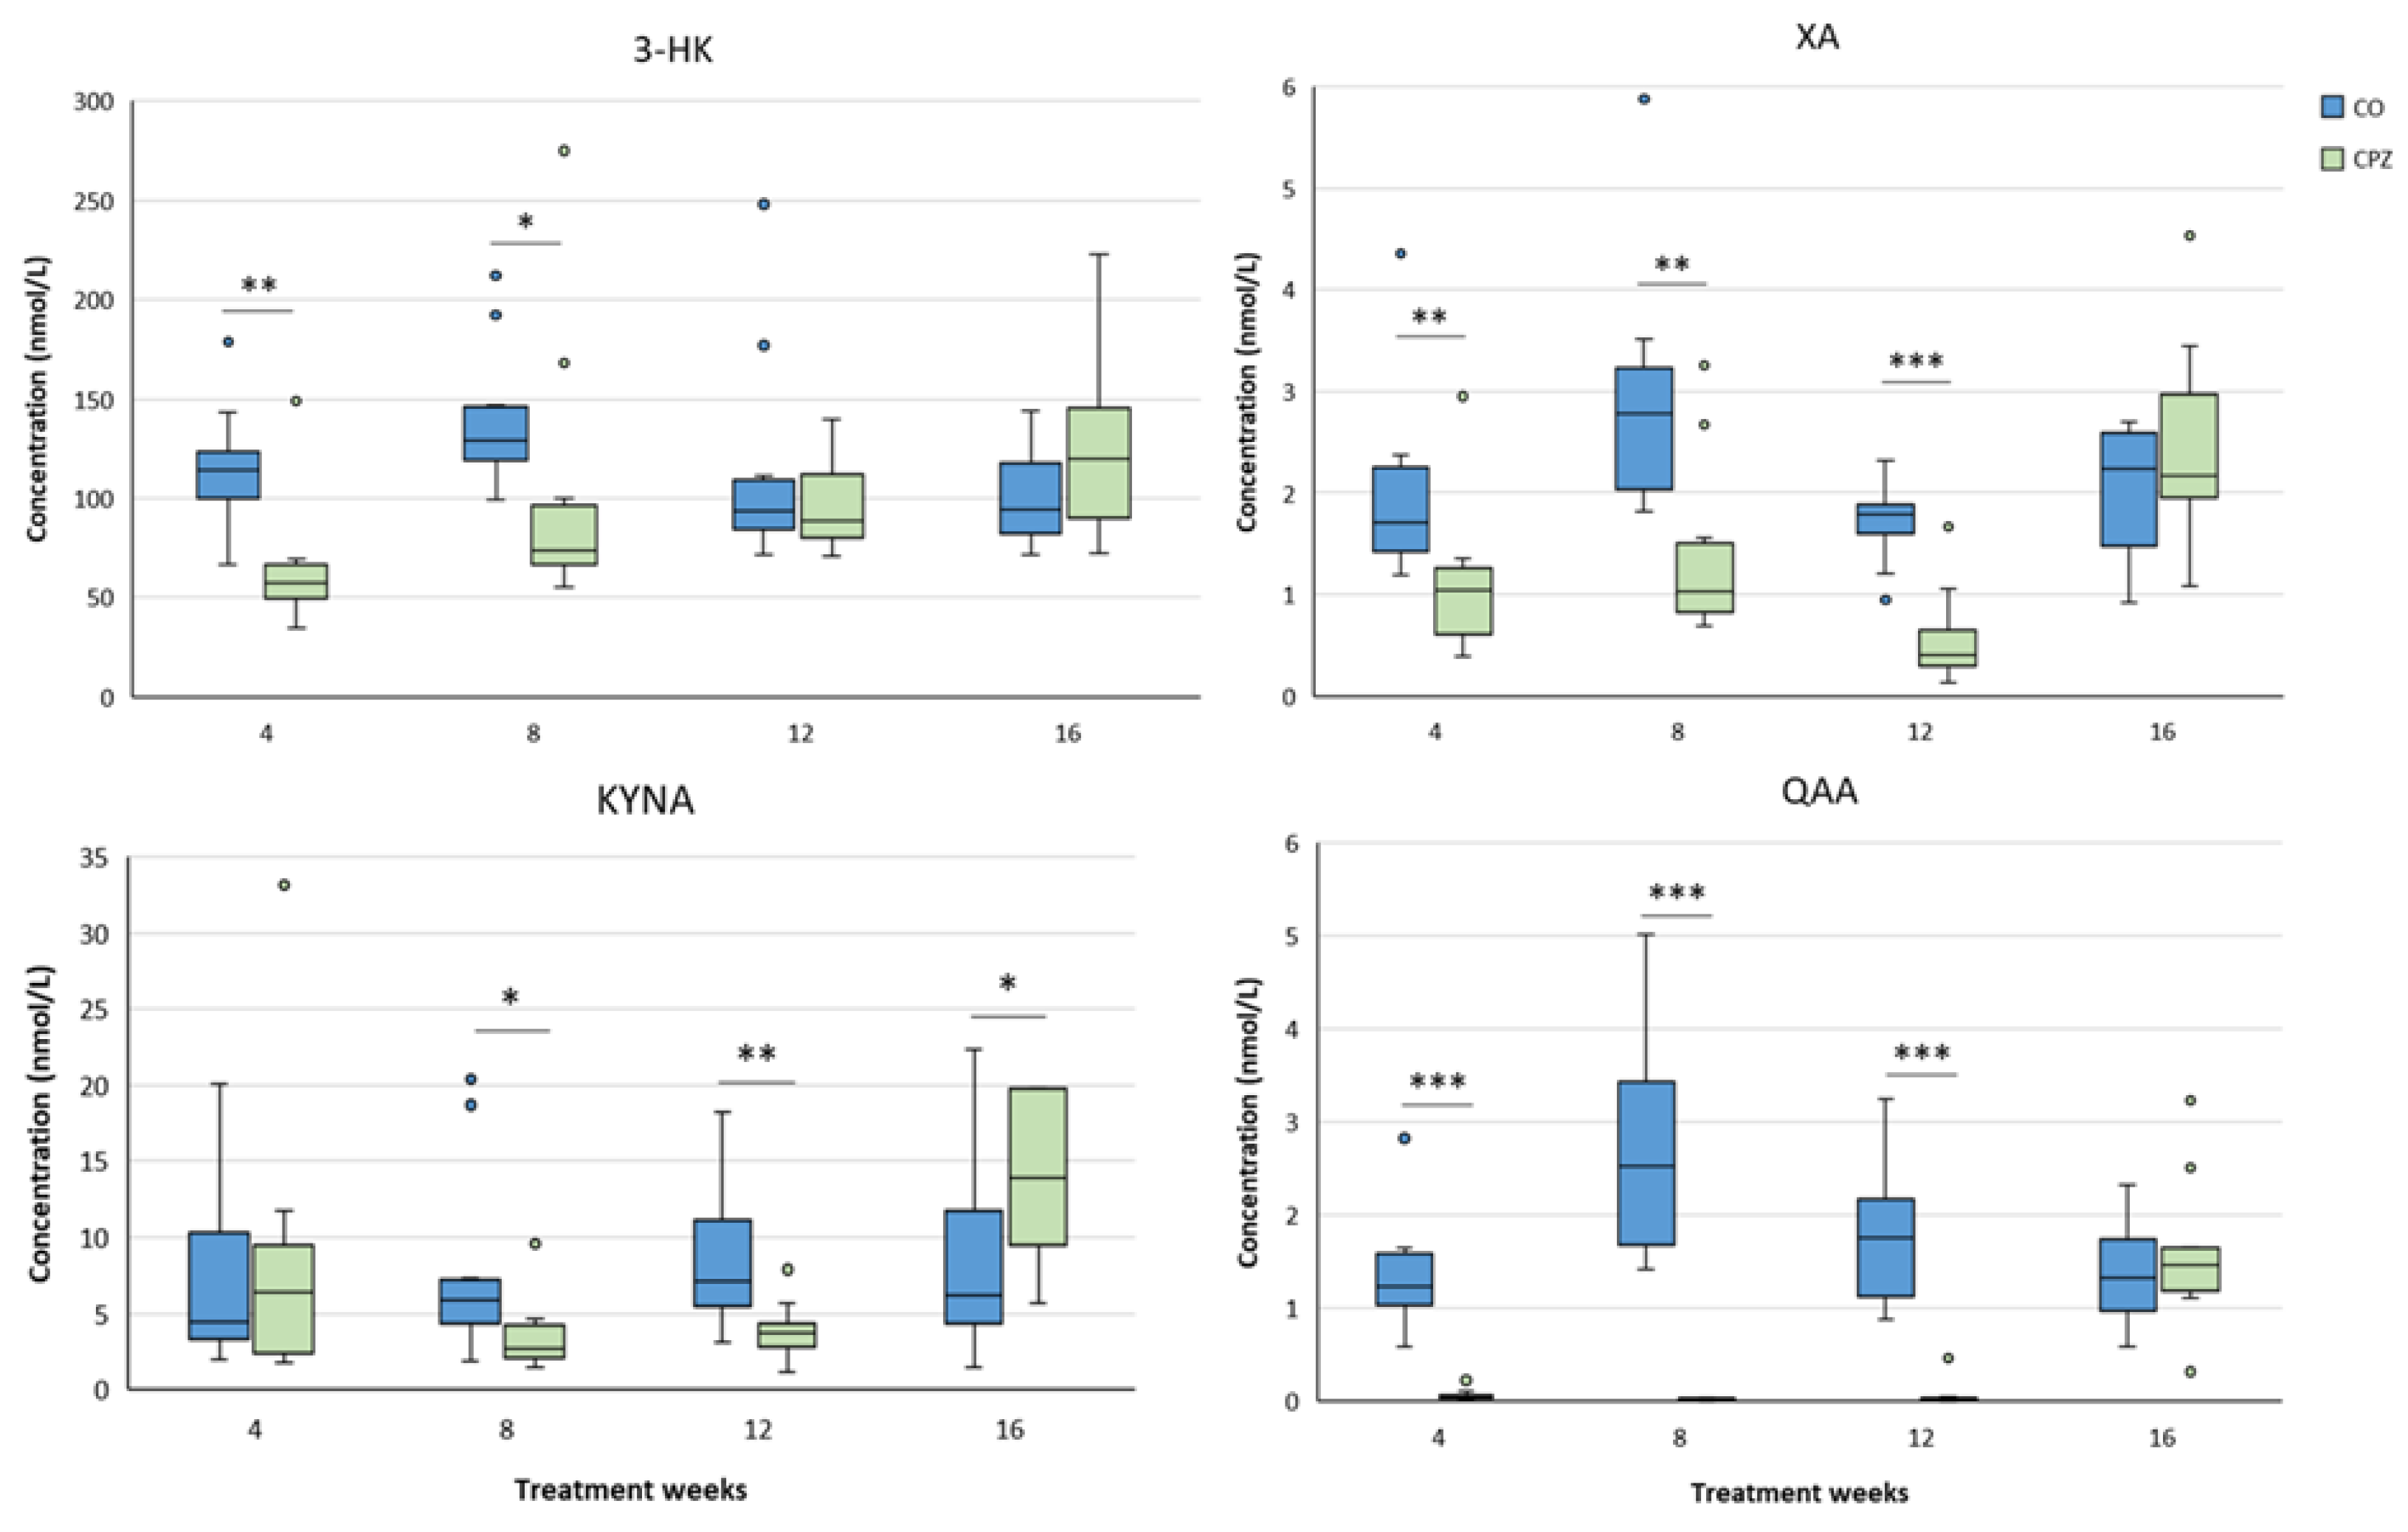
Figure 20.
Elevated derivatized picolinic acid (PAD) and quinolinic acid (QUIN) levels in the cerebellum during toxin administration. As a result of prolonged intoxication, cerebellar PAD and QUIN concentrations were markedly increased in the CPZ group, which differences were still identifiably between the CO and CPZ groups in the fourth week of recovery period. CO: control group, CPZ: cuprizone treated group, *: p < 0.05 vs. CO, ***: p < 0.001 vs. CO. We show the data median ± IQR, with the outliers.
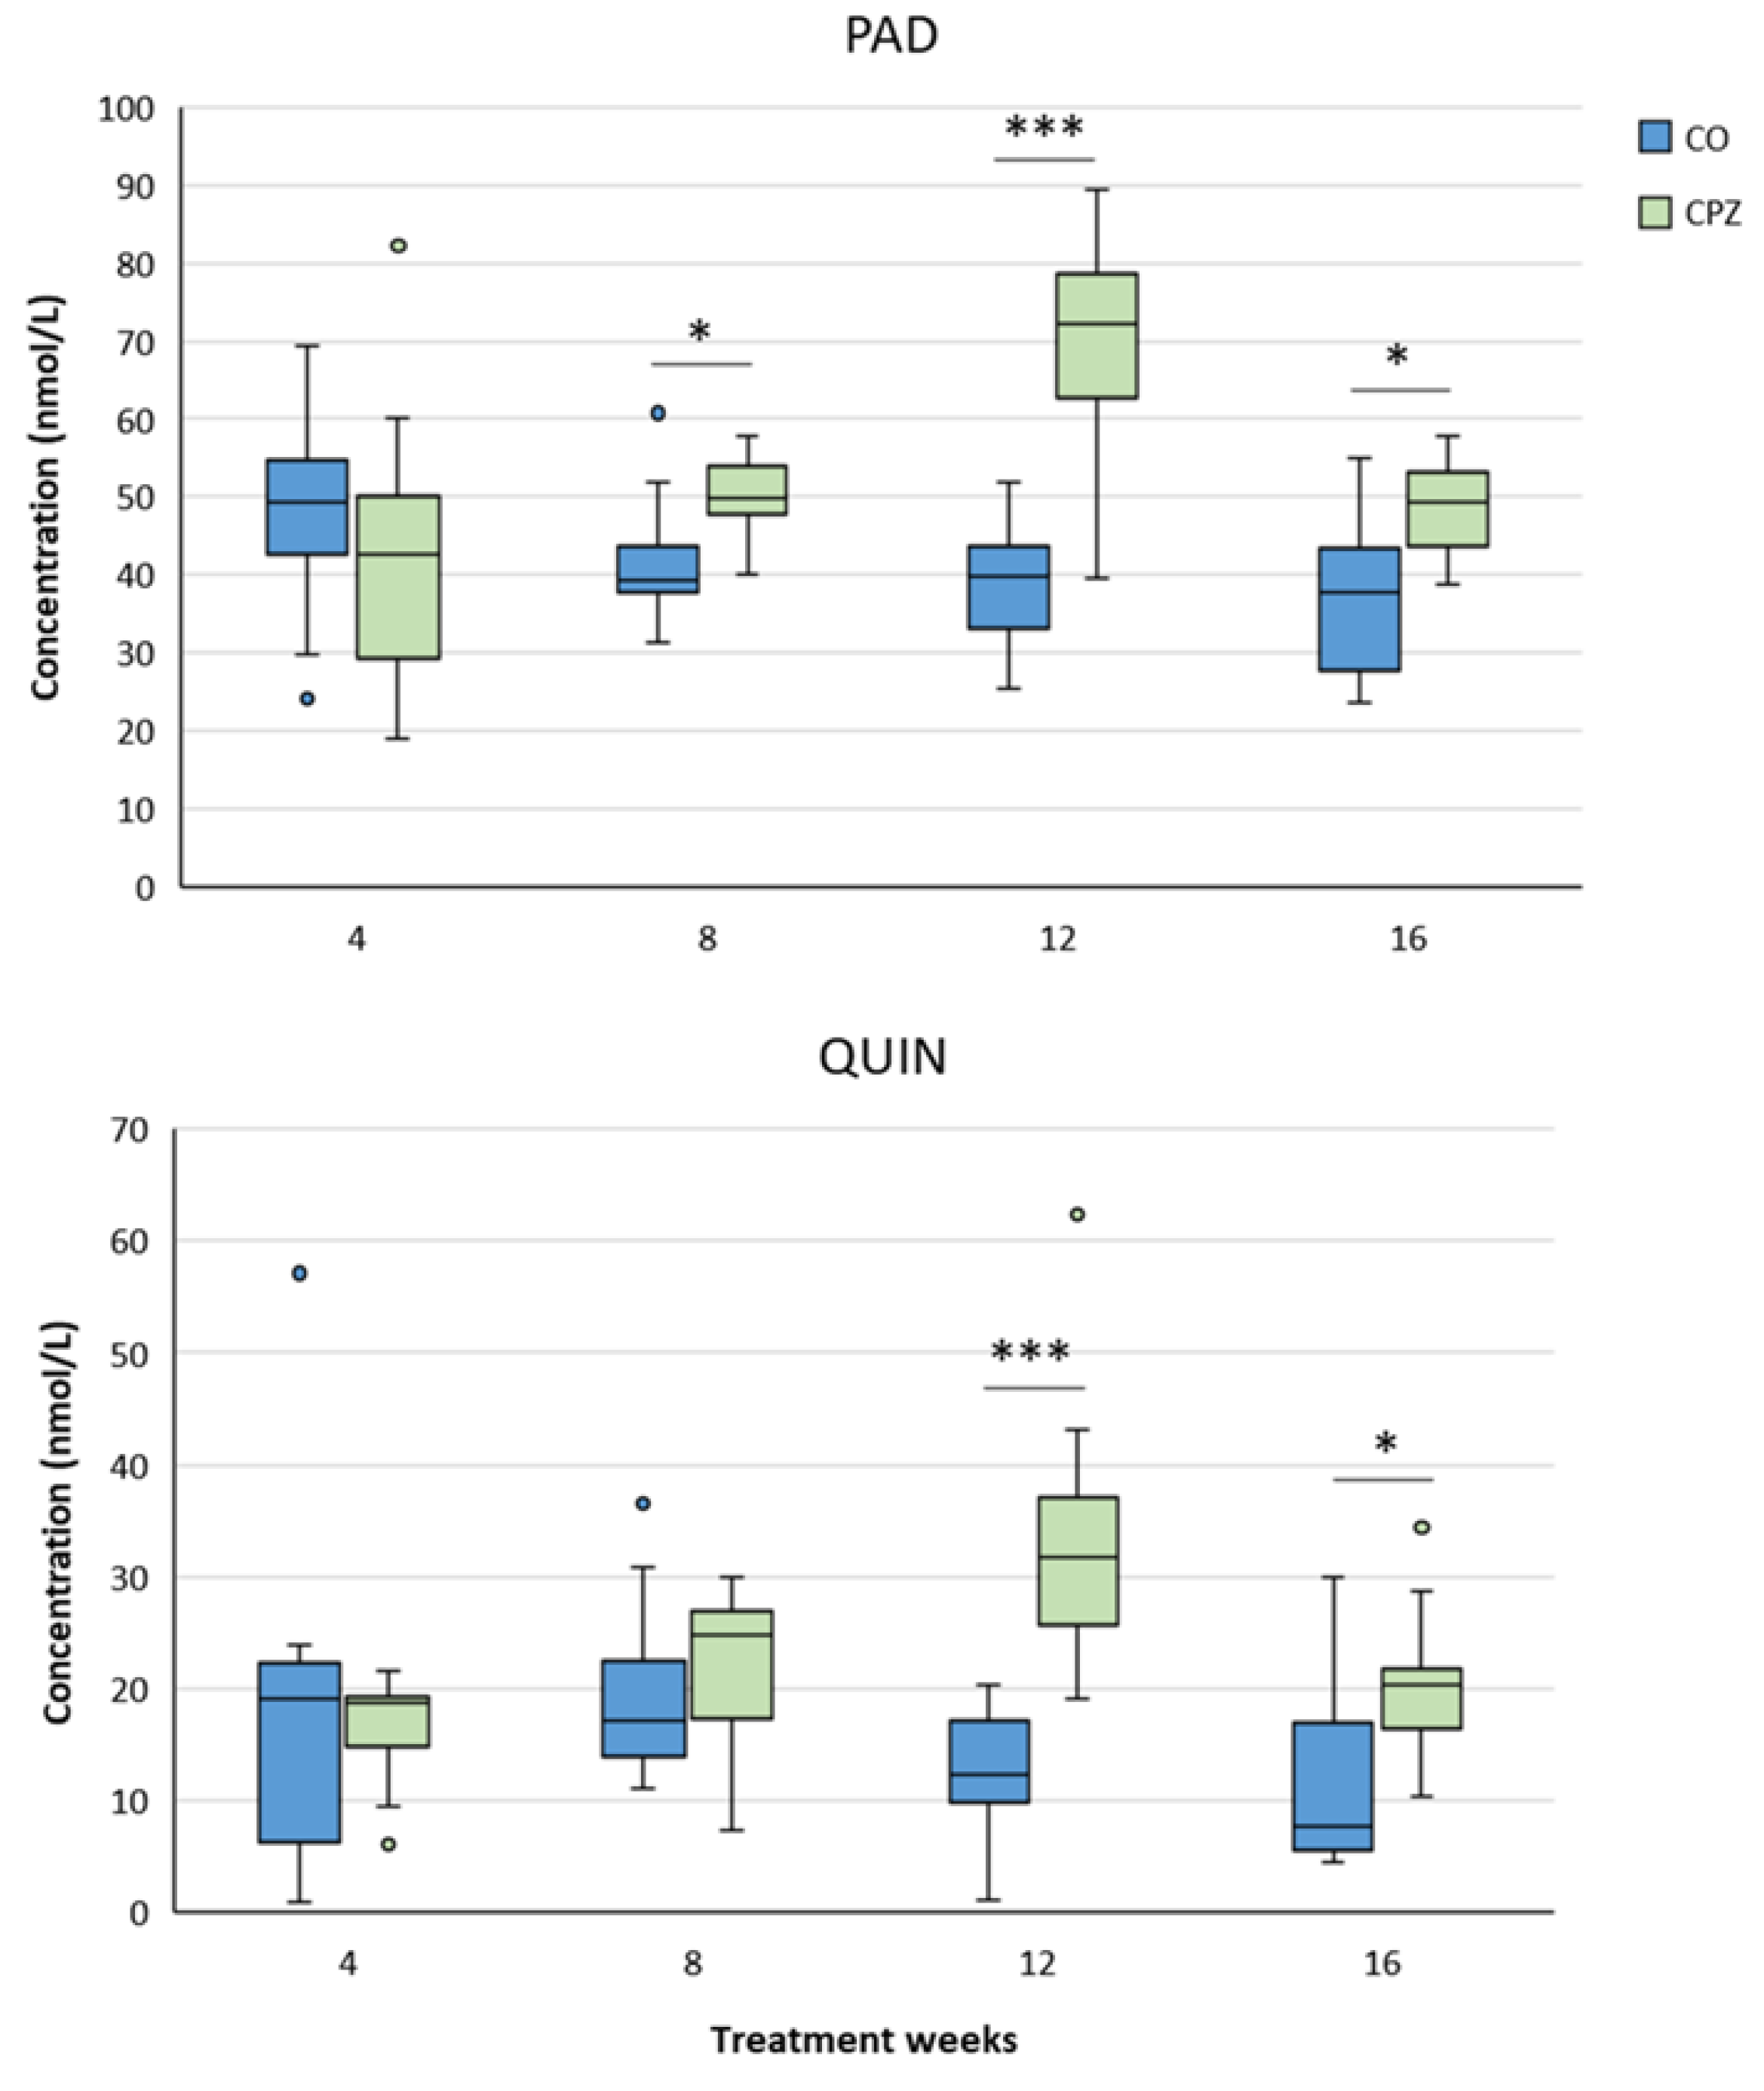
Figure 21.
Timeline of the experimental procedure applied in this investigation. CO: control group; CPZ: cuprizone group; n: represents the number of animals used; UHPLC-MS/MS: ultra-high performance liquid chromatography-tandem mass spectrometry; numbers (1–16) in the figure: experimental weeks (week 1 to week 16); * Plasma and 5 different brain regions (striatum, cortex, hippocampus, brainstem and cerebellum) samples were used for bioanalytical measurements both from the CO and the CPZ treated group.
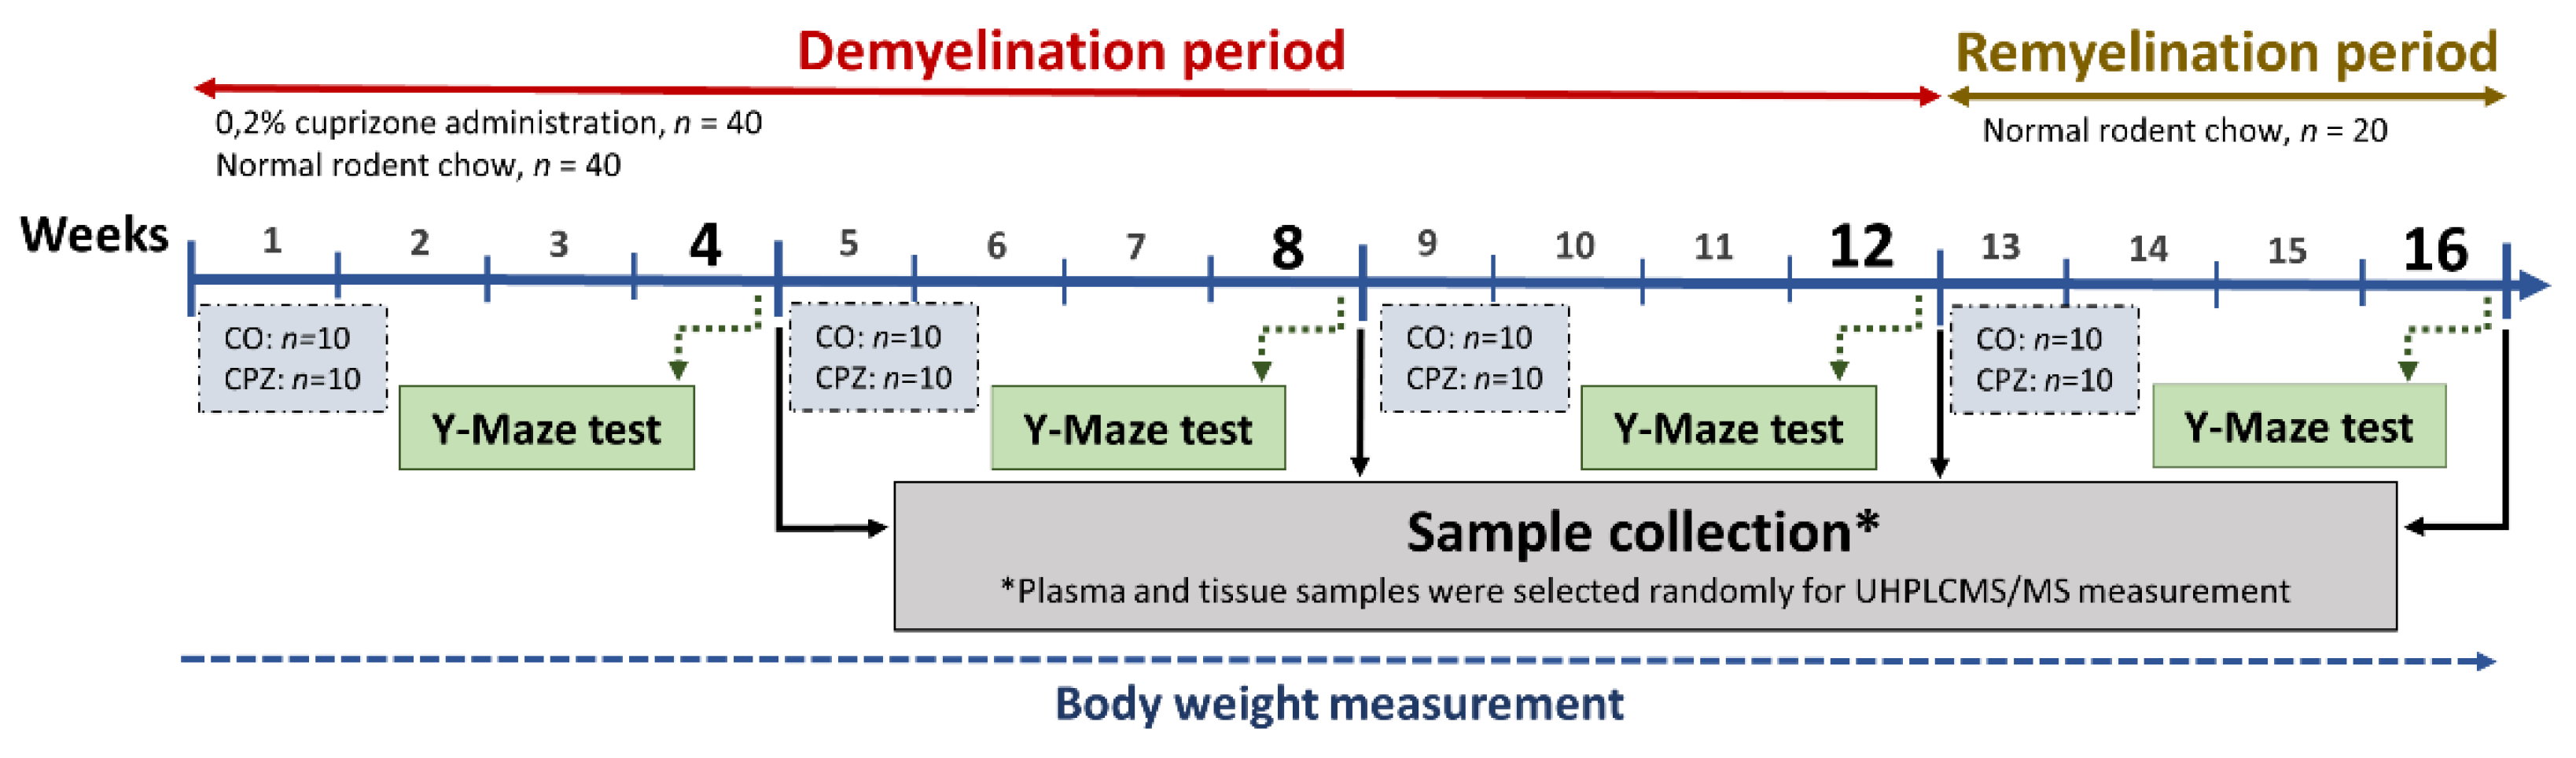
Disclaimer/Publisher’s Note: The statements, opinions and data contained in all publications are solely those of the individual author(s) and contributor(s) and not of MDPI and/or the editor(s). MDPI and/or the editor(s) disclaim responsibility for any injury to people or property resulting from any ideas, methods, instructions or products referred to in the content. |
© 2025 by the authors. Licensee MDPI, Basel, Switzerland. This article is an open access article distributed under the terms and conditions of the Creative Commons Attribution (CC BY) license (http://creativecommons.org/licenses/by/4.0/).
Copyright: This open access article is published under a Creative Commons CC BY 4.0 license, which permit the free download, distribution, and reuse, provided that the author and preprint are cited in any reuse.


