
Submitted:
17 December 2025
Posted:
19 December 2025
You are already at the latest version
Abstract
Background: Paroxysmal nocturnal haemoglobinuria (PNH) is a clonal haematopoietic stem cell disease, characterized primarily by intravascular hemolysis, thrombosis, and bone marrow failure. Complement inhibitors are commonly used in clinical treatment, showing limited efficacy, thus highlighting the urgent need to identify new therapeutic targets and explore alternative treatment strategies to provide theoretical guidance for clinical practice. Methods: We established a PNH cell model and constructed a miRNA–mRNA regulatory network to identify key miRNAs and core target genes. Single-cell sequencing data were analyzed to further clarify the critical genes. Drug prediction was then performed using multiple databases to identify potential therapeutic agents for PNH, which were subsequently validated through molecular docking and molecular dynamics simulations. Results: Using CRISPR/RNP technology, we successfully constructed a PIGA-knockout (PIGA-KO) THP-1 cell model. Differential expression analysis identified 1979 differentially expressed mRNAs (DEmRNAs) and 97 differentially expressed miRNAs (DEmiRNAs). The multiMiR package in R was used to predict the target genes of DEmiRNAs, from which those experimentally validated through dual-luciferase reporter assays were selected. After integrating with the DEmRNAs, a miRNA–mRNA regulatory network was constructed, comprising 26 miRNAs and 38 mRNAs. Prediction of miRNA pathway enrichment analysis identified hsa-miR-23a-3p as a key miRNA, with CXCL12, CXCL8, HES1, and TRAF5 as core target genes. Integration of single-cell sequencing datasets (PRJNA1061334 and GSE157344) was performed, followed by cell communication and enrichment analysis. This approach, combined with clinical relevance, identified neutrophil cluster as a key cluster. Intersection analysis of neutrophil cluster differential analysis result with key modules from hdWGCNA further clarified the critical genes. Drug prediction using the EpiMed, CMap, and DGIdb identified Leflunomide, Dipyridamole, and Pentoxifylline as potential therapeutic agents. Molecular docking and molecular dynamics simulations showed stable binding of these potential drugs to the critical molecules, indicating a strong molecular interaction foundation. Conclusion: Leflunomide, Dipyridamole, and Pentoxifylline may serve as promising therapeutic agents for PNH, and the hsa-miR-23a-3p/CXCL8 regulatory axis could play a pivotal role in the pathogenesis and progression of PNH.
Keywords:
paroxysmal nocturnal hemoglobinuria
; miRNA-mRNA regulatory network
; drug repositioning
; scRNA seq
; molecular docking
; molecular dynamics simulation
1. Introduction
Paroxysmal nocturnal hemoglobinuria (PNH) is a rare acquired clonal hematopoietic stem cell disorder. The core pathological mechanism involves somatic mutations in the PIGA of hematopoietic stem cells, leading to impaired synthesis of glycosylphosphatidylinositol-anchored proteins (GPI-APs). Red blood cells lacking GPI-APs are highly susceptible to complement-mediated attack, resulting in intravascular hemolysis, paroxysmal hemoglobinuria, bone marrow failure, and venous thrombosis. In some cases, patients may also develop hematologic malignancies [1].
With the research and application of complement C5 inhibitors such as Eculizumab [2], Pozelimab [3], and Crovalimab [4], complement C3 inhibitors like Pegcetacoplan [5,6], complement factor D inhibitors like Danicopan [7], and complement factor B inhibitors such as Iptacopan [8], the survival rate and quality of life of patients have significantly improved. However, current drug therapies still have a number of limitations, including high drug costs, variable efficacy among different patients, infection risks associated with long-term use, compliance issues, and the development of drug resistance in some patients [9,10]. Therefore, the development of safer, more effective, and cost-efficient therapeutic drugs, to continuously improve the benefits for PNH patients, has become a critical issue that needs to be addressed.
Drug repositioning (DR) refers to a strategy for identifying new uses for existing drugs that have been approved for other medical indications or are still in the experimental phase [11]. This approach not only reduces the time and cost associated with new drug development but also significantly increases the success rate of repurposing for new indications, owing to the extensive data on drug safety, pharmacokinetics, and other factors [12,13]. Moreover, with the rapid development of computational biology and artificial intelligence technologies, methods such as molecular docking (MD) and molecular dynamics simulation (MDS) have become widely applied in DR research [14,15]. MD enables precise prediction of the binding modes and affinities between drugs and target proteins, facilitating high-throughput drug screening [16]. MDS further reveals the stability and mechanism of action of drug-protein complexes, providing atomic-level insights into their interactions and offering a theoretical foundation for subsequent experimental validation [17]. These technological approaches not only accelerate the drug screening process but also provide powerful tools for in-depth understanding of drug mechanisms and for optimizing the structure of candidate molecules. Therefore, the strategy of combining DR with MD and MDS offers a new pathway for the development of potential therapeutic drugs for rare diseases like PNH, which have well-defined pathogenesis, urgent treatment needs, but a relatively small patient population.
In recent years, in addition to the classic protein targets, microRNAs (miRNAs), as key regulators of gene expression, have also attracted increasing attention for their role in hematological diseases such as PNH [18]. miRNAs are a class of endogenous non-coding small RNAs that regulate gene expression by binding to the 3'-UTR of target mRNAs, leading to mRNA degradation or translation repression. They play a critical regulatory role in various biological processes, including cell proliferation, differentiation, and apoptosis [19]. Studies have shown that specific miRNAs may be involved in the pathogenesis of PNH by modulating complement systems, hematopoietic stem cell function, and the immune microenvironment [20]. Additionally, miRNAs have emerged as novel therapeutic targets, with evidence suggesting that their expression levels can be modulated by drugs, thereby influencing downstream signaling pathways and providing new insights for the treatment of rare diseases like PNH [21,22]. In drug repositioning research, drug screening and mechanistic exploration based on miRNA regulatory networks have become an emerging area of interest. By integrating miRNA-related target information, it is possible to further enrich the drug target spectrum and enhance the efficiency of candidate drug screening.
In light of this, the present study focuses on DR for PNH, aiming to identify potential therapeutic agents for precise treatment of PNH and elucidate the theoretical basis behind them. First, a systematic review of PNH-related molecular targets was conducted, and MD was used to screen FDA-approved drugs that have good binding affinity with PNH targets. Next, MDS were employed to analyze the structural stability and interaction mechanisms of the drug-target complexes. Finally, through the integration of pharmacological information, the feasibility of the candidate drugs for clinical treatment of PNH was explored (Figure 1). This study not only provides potential drugs and personalized treatment options for PNH patients but also offers new theoretical insights into the application of DR in the field of rare hematological diseases.
2. Materials and Methods
2.1. Materials
The THP-1 cell line was purchased from Tsingke Biotechnology Co., Ltd. RPMI 1640 medium, New Zealand fetal bovine serum (FBS), phosphate-buffered saline (PBS), and penicillin-streptomycin solution were purchased from Gibco (USA).RNA extraction kits, FastPure® Cell/Tissue Total RNA Isolation Kit V2, HiScript® III All-in-one RT SuperMix Perfect for qPCR, and Taq Pro Universal SYBR qPCR Master Mix were purchased from Vazyme Co., Ltd. (China).The primers required for RT-qPCR experiments were synthesized by Biomed Technology Co., Ltd. (China).CCK8 was obtained from Dojindo Laboratories (Japan).
2.2. Construction of Gene Knockout Cell Line Using CRISPR/RNP Method
For the PIGA, gene knockout was performed in THP-1 cells using a Cas9-based CRISPR/RNP system [23]. Target sequences were selected based on functional regions and low off-target principles, and two sgRNAs (AGAUACCAUGCAUAUAUUAU and ACACUCUCUCGGGUUAGCCC) were designed. The sgRNAs and Cas9 protein were mixed at a 5:1 to 10:1 ratio to form the RNP complex, which was then transfected into cells using the Neon NxT electroporation system. After electroporation, single-cell sorting and amplification were performed, and single clones with high knockout efficiency and good condition were selected and preserved. Gene knockout efficiency was assessed by PCR. Cells were cultured under standard conditions (RPMI-1640, 10% FBS, 1% P/S, 37℃, 5% CO2), and all experiments were conducted according to the manufacturer's instructions.
The above gene knockout experiment was entrusted to Tsingke Biotechnology Co., Ltd.
2.3. Validation of Cell Line Using Molecular Biology Techniques and Whole-Transcriptome Sequencing
Total RNA was extracted from PIGA-KO THP-1 cells and wild-type (WT) THP-1 cells using the FastPure® Cell/Tissue Total RNA Isolation Kit V2. The RNA purity and concentration were assessed using a NanoDrop spectrophotometer. Reverse transcription was performed using the HiScript® III All-in-one RT SuperMix Perfect for qPCR, and cDNA amplification was carried out using the Taq Pro Universal SYBR qPCR Master Mix. The primers for the PIGA were as follows: upstream primer sequence: CCTGTAGAGGAGGAGCTGGGAATGG, downstream primer sequence: CACCGAGCTGACATCAGCAAA. The primers for the β-actin were: upstream primer sequence: CTACAATGAGCTGCGTGTGGC, downstream primer sequence: CAGGTCCAGACGCAGGATGGC. The relative expression of the target gene was calculated using the 2-ΔΔCt method.
Total RNA was extracted using Trizol reagent, and whole-transcriptome sequencing was performed by Tsingke Biotechnology Co., Ltd. using the Illumina platform.
2.4. Upstream Analysis and Differential Expression Analysis
An analysis platform was constructed in a Linux environment, where tools such as FastQC, MultiQC, Samtools, HISAT2, RSeQC, and Bowtie2 were installed. miRNA and mRNA data were preprocessed, aligned, and quantified using miRDeep2 [24] and HISAT2, respectively. The miRbase (https://www.mirbase.org/) and Ensembl (https://www.ensembl.org/index.html) were used to obtain the miRNA and mRNA expression profiles for each sample, which were used for subsequent analysis. The ensembl_gene_id format from the upstream quantification results was converted to the hgnc_symbol format. Differential expression analysis of the mRNA and miRNA quantification results was performed using the DESeq2 package in R 4.4.1. Differential expression mRNAs (DEmRNAs) and differential expression miRNAs (DEmiRNAs) were identified based on P < 0.05 and |Log2FC| > 1. Finally, the results were visualized using the ggplot2 package in R 4.4.1.
2.5. Functional Enrichment Analysis and Gene Set Enrichment Analysis
The differentially expressed gene names filtered by threshold were converted to the entrezgene_id format. Using the clusterProfiler package in R 4.4.1, Gene Ontology (GO) functional annotation and Kyoto Encyclopedia of Genes and Genomes (KEGG) functional annotation were performed with P < 0.05 as the threshold.
2.6. Construction of miRNA-mRNA Regulatory Axis and Identification of Key Genes
The multiMiR package [25] in R 4.4.1 was used to predict and select target genes validated by dual-luciferase reporter assays. The regulatory direction was determined based on the sign of Log2FC, and the intersection with DEmRNAs was further analyzed to construct the miRNA-mRNA regulatory network. The ENCORI (https://rnasysu.com/encori/) was used to predict the enriched pathways of DEmiRNAs. miRNAs enriched in multiple PNH-related pathways were considered as core miRNAs, and their regulated target genes were identified as core genes in PNH.
2.7. Single-Cell RNA-seq Analysis
A search string was conducted in the PubMed (https://pubmed.ncbi.nlm.nih.gov/) using the query ("PNH" [Title]) AND ("multiomics" [Title]), and single-cell RNA sequencing (scRNA-seq) data for PNH from relevant publications were downloaded as the disease group. The data was processed with Cell Ranger 9.0.1 for upstream quantification analysis. Normal human scRNA-seq data were retrieved from the DISCO [26] (https://disco.bii.a-star.edu.sg/) as the control group. The filtering criteria for cells and genes were as follows: for the disease group, cells with fewer than 30,000 expressed genes, fewer than 5,000 genes, and less than 8% mitochondrial gene content were retained; for the control group, cells with fewer than 10,000 expressed genes, fewer than 2,000 genes, and less than 15% mitochondrial gene content were retained. After integrating the scRNA-seq data from the disease and control groups, data were normalized using the NormalizeData function. Batch effect correction was performed using the Harmony function for disease and normal samples, followed by principal component analysis (PCA) to compute the principal components of the data. K-nearest neighbors (KNN) clustering analysis was then applied to the top 30 principal components selected from the data. Finally, cell types were annotated using the CellMarker 2.0 (http://bio-bigdata.hrbmu.edu.cn/CellMarker/) and the ACT (http://xteam.xbio.top/ACT/index.jsp). Cell communication analysis was performed using the CellChat package in R 4.4.1, with enrichment analysis of PNH-related cell clusters such as monocytes, macrophages, megakaryocytes, and neutrophils. High-dimensional Weighted Gene Co-expression Network Analysis (hdWGCNA) was employed to analyze the scRNA-seq data and identify modules most highly correlated with the neutrophil cluster, which were then considered key modules.
2.8. Prediction of Potential Therapeutic Drugs for PNH
Using the Epigenomic Precision Medicine Prediction Platform (EpiMed) [27], along with the CMap [28] (https://clue.io/query), DEmRNAs were used as input for drug prediction. Core genes in the miRNA-mRNA regulatory network associated with PNH were input into the DGIdb [29] (https://dgidb.org/) for drug prediction. The intersection of key modules obtained from hdWGCNA analysis and DEmRNAs in the neutrophil cluster was also used as input for drug prediction in the CMap. The drug prediction results from these four sources was analyzed to identify potential therapeutic drugs for PNH.
2.9. Molecular Docking
The 3D structure files of the proteins encoded by core genes were downloaded from the PDB (https://www.rcsb.org/) and the protein structures were examined using PyMOL 3.1 for subsequent docking. The 2D structural sequences of core miRNAs were obtained from the miRBase, and their 3D structure files were predicted and downloaded from the AlphaFold Server (https://alphafoldserver.com/). The DoGSite3 tool from the ProteinsPlus (https://proteins.plus/) was used to predict the binding pockets of the core miRNAs, and their structures were also examined using PyMOL 3.1 for docking preparation. SDF format files of potential therapeutic drugs were downloaded from the PubChem (https://pubchem.ncbi.nlm.nih.gov/), and converted into PDB format files using OpenBabel 3.1.1. AutoDock Tools 1.5.7 was used to add hydrogen atoms to the core gene-encoded proteins and core miRNAs, as well as to hydrogenate and define rotatable bonds for the small molecule drugs, saving the files in PDBQT format. The docking parameters were set using the Grid module, with semi-flexible docking specified, an exhaustiveness of 8, and the Lamarckian genetic algorithm as the docking algorithm. MD was performed using AutoDock Vina 1.2.0, yielding binding free energies and docking result files. Finally, visualization was performed using PyMOL 3.1 and BIOVIA Discovery Studio.
2.10. Molecular Dynamics Simulation
MDS were performed on the protein-ligand complexes obtained from MD. The complexes were preprocessed and split using PyMOL 3.1. Subsequently, the topology files of the drug molecules were generated using sobtop 1.0 based on the AMBER force field. The topology files for the protein were created using GROMACS (2020.6-MODIFIED) with the amber99sb-ildn.ff force field. The system, including ions, solvent, receptor, and ligand, was preprocessed in three main steps. First, energy minimization was performed using the steepest descent algorithm to stabilize the system. Then, during heating to 300 K, position restraints were applied to both the receptor and the ligand in each system. Finally, MDS were performed under constant pressure (1 atm) and temperature (300 K), using the Number of particles, Pressure, and Temperature ensemble. After a 300 ns MDS, various dynamic parameters were calculated using the built-in scripts of GROMACS, including root mean square deviation (RMSD), root mean square fluctuation (RMSF), radius of gyration (Rg), solvent accessible surface area (SASA), hydrogen bonds, interatomic distances, and Gibbs free energy.
2.11. Binding Free Energy Calculations
The binding free energies between the protein and ligand were estimated using the molecular mechanics Poisson–Boltzmann surface area (MM-PBSA) method which combines molecular mechanics (MM) energies with solvation free energy contributions. The calculations were performed with the g_mmpbsa tool integrated in the GROMACS package. A 300 ns MDS was conducted for each protein–ligand complex, and MM-PBSA analyses were performed throughout the entire 300 ns trajectory to estimate the binding free energy.
The MM energy components, including van der Waals and electrostatic interactions, were directly obtained from the GROMACS force field. The polar solvation free energy was calculated by numerically solving the Poisson–Boltzmann equation using the Adaptive Poisson–Boltzmann Solver (APBS) program. The solvent dielectric constant and solute dielectric constant were set to 80 and 2, respectively, under the nonlinear Poisson–Boltzmann (npbe) model at 298 K.
2.12. Cell Viability Assay
Quantitative cell viability of the effect of drugs on cell activity was performed using the Cell Counting Kit-8 (CCK-8) assay in PIGA-KO THP-1 cell line.A total of 5 × 10⁵ viable cells from two cell lines were seeded in 96-well plates, with three replicate wells per group, to ensure uniformity in experimental conditions.The cells were incubated at 37°C with 5% CO₂ for 2 hours in a constant temperature incubator, followed by treatment with various concentrations of the drugs (6.25, 12.5, 25, 50 and 100 μM) for 24, 48, and 72 hours. After treatment, 20 μL of CCK-8 solution was added to each well and incubated for 2 hours at 37°C with 5% CO₂. Optical density (OD) at 450 nm was measured using a microplate reader to determine cell viability. Cell survival rate were computed pursuant to below:
Based on the cell survival rate, the half maximal inhibitory concentration (IC50) was calculated to evaluate the cytotoxicity of the compound.
2.13. Statistical Analysis
All data analysis and visualization were performed using R 4.4.1 and GraphPad Prism 8.0. An unpaired t-test was used for comparisons between two groups. Experiments were conducted with at least three biological replicates. In bioinformatics analysis, a statistical significance threshold of P < 0.05 and |Log2FC| > 1 was applied.
3. Results
3.1. Establishment and Validation of PNH Cell Lines
After electroporating THP-1 cells with the CRISPR/Cas9 RNP system, a PIGA-KO cell line was successfully obtained. RT-qPCR validation showed that the expression level of PIGA in the PIGA-KO cell line was significantly lower than in the WT cell line (Supplementary Figure S1, Supplementary Table S1).The obtained monoclonal knockout clones maintained a stable PIGA-deficient phenotype during long-term culture.
3.2. Differential Analysis and Enrichment Analysis
Differential expression analysis of mRNA sequencing data was performed using the DESeq2 package in R 4.4.1, resulting in 1979 DEmRNAs, of which 1117 were upregulated and 862 were downregulated. Differential analysis of miRNA sequencing data identified 97 DEmiRNAs, with 43 upregulated and 54 downregulated (Figure 2 a-b, Supplementary Table S2).
Gene Ontology (GO) and Kyoto Encyclopedia of Genes and Genomes (KEGG) enrichment analyses were conducted on the differentially expressed genes(DEGs). GO enrichment analysis revealed that the DEGs were enriched in 1116 pathways, with 161 related to molecular function (MF), 105 related to cellular component (CC), and 850 related to biological process (BP). Enriched pathways included "calcium ion transport", "regulation of monoatomic ion transport", and "metal ion transmembrane transporter activity", which are mainly associated with immune response, ion transport and signaling, and gene expression regulation. KEGG enrichment analysis showed that the DEGs were enriched in 58 pathways (Supplementary Table S3), including "Hematopoietic cell lineage", "Neutrophil extracellular trap formation", and "Complement and coagulation cascades", which are primarily involved in signaling transduction, cell communication, hematopoiesis and coagulation, and complement system functions (Figure 2 c-d).
3.3. Construction of miRNA-mRNA Regulatory Axis and Identification of Key Genes
Target gene prediction was performed using the multiMiR package in R 4.1.1, from which those experimentally validated through dual-luciferase reporter assays were selected, yielding 66 miRNAs corresponding to 638 potential target genes (Supplementary Table S4). The target genes of upregulated miRNAs were intersected with downregulated mRNAs, and the target genes of downregulated miRNAs were intersected with upregulated mRNAs to identify biologically significant regulatory relationships. Ultimately, a miRNA-mRNA regulatory axis consisting of 26 miRNAs and 38 mRNAs was constructed (Figure 3, Table 1). miRNA pathway enrichment analysis revealed that only hsa-miR-23a-3p was enriched in PNH-related pathways, including "KEGG_Complement_And_Coagulation_Cascades", "KEGG_Hematopoietic_Cell_Lineage", and "KEGG_Glycosylphosphatidylinositol_Gpi_Anchor_Biosynthesis" (Supplementary Table S5). Therefore, this study identifies hsa-miR-23a-3p as a core miRNA in PNH, with its target genes CXCL12, CXCL8, HES1, and TRAF5 serving as core genes in PNH.
3.4. Single-Cell Sequencing Data Analysis
The disease group data was obtained from the dataset PRJNA1061334 (https://www.ncbi.nlm.nih.gov/bioproject/?term=PRJNA1061334), and the control group data was GSE157344 (https://www.ncbi.nlm.nih.gov/geo/query/acc.cgi?acc=GSE157344). Quantification of the disease group was performed using Cell Ranger 9.0.1 software with default parameters. The disease and control group data were integrated and analyzed using Seurat and Harmony packages in R 4.1.1. After annotating the cells using multiple databases, 14 cell types were identified, including monocytes, erythrocytes, neutrophils, T cells, B cells, megakaryocytes, and others (Figure 4 a-b). Enrichment analysis of the monocyte cluster, macrophage cluster, megakaryocyte cluster, and neutrophil cluster showed that neutrophils were enriched in pathways such as "Platelet activation" and "Neutrophil extracellular trap formation" (Figure 4 c). Cell communication analysis revealed that neutrophils had larger nodes and multiple thick lines connecting them to various immune cells, indicating their high proportion in the single-cell dataset and their central and highly active role in the cell communication network (Figure 4 d-e). Therefore, a differential expression analysis (P < 0.05) was performed on the neutrophil cluster, resulting in 7700 differentially expressed genes, with 5670 upregulated and 2030 downregulated (Supplementary Table S6, Supplementary Figure S2).
hdWGCNA analysis was performed on the integrated single-cell data, with a soft threshold of 12. The results revealed that the single-cell objects could be divided into nine modules: black, blue, brown, green, magenta, pink, red, turquoise, and yellow. By examining the correlation between each module and the neutrophil cluster, modules 5, 7, and 9 showed high correlation with the neutrophil cluster. These modules were selected as key modules, with corresponding colors of red, magenta, and pink (Figure 5). Genes from the key modules were extracted and intersected with the DEGs in the neutrophil cluster, resulting in 154 key neutrophil genes, with 79 upregulated and 75 downregulated, which were used for subsequent potential drug prediction (Supplementary Table S7).
3.5. Potential Drug Prediction for PNH
DEmRNAs were input into EpiMed for drug prediction (P < 0.05, Correlation < −0.1), yielding drug set A. DEmRNAs were also input into the CMap database for drug prediction (norm_cs < 0), resulting in drug set B. The four core genes (CXCL12, CXCL8, HES1, TRAF5) were input into the DGIdb for drug prediction (Drug Status: Approved), producing drug set C. Key neutrophil cluster genes were input into the CMap database for drug prediction (norm_cs < 0), resulting in drug set D. The intersection of drug sets A, B, C, and D revealed eight candidate drugs: Prednisone (PDN), Tretinoin (ATRA), Dipyridamole (DIP), Danazol (DAN), Pentoxifylline (PTX), Leflunomide (LEF), Colchicine (COL), and Paclitaxel (Figure 6, Table 2, Supplementary Table S8). Among these, Prednisone, as a corticosteroid, has already been included in PNH treatment guidelines; Tretinoin has been confirmed to have potential therapeutic effects for PNH; Danazol, a synthetic androgen, has significant hepatic burden; and Colchicine and Paclitaxel, as chemotherapeutic agents, are not considered for this study. Leflunomide (LEF), as an immunomodulatory drug, can suppress inflammation, reduce complement-mediated hemolysis, and prevent thrombosis; Dipyridamole (DIP), an anti-platelet aggregation drug, can inhibit platelet activation and aggregation, expand blood vessels, and has a low risk of bleeding and minimal side effects; Pentoxifylline (PTX), an agent that improves microcirculation, can reduce blood viscosity, enhance red blood cell deformability, and inhibit platelet aggregation. Therefore, this study identifies LEF, DIP, and PTX as potential therapeutic drugs for PNH.
3.6. Molecular Docking
MD results of LEF, DIP, and PTX with CXCL8 and hsa-miR-23a-3p were visualized using PyMOL 3.1 (Figure 7). All three drugs form multiple hydrogen bond interactions with CXCL8, and their binding energies are close to −5 kcal/mol, indicating a stable potential binding between these drugs and CXCL8. Similarly, the three drugs also form multiple hydrogen bond interactions with hsa-miR-23a-3p, with binding energies all less than −5 kcal/mol, suggesting a high degree of binding between the small molecules and this miRNA. Therefore, LEF, DIP, and PTX are likely to influence the structural functionality and biological activity of CXCL8 and hsa-miR-23a-3p, thereby impacting the onset and progression of the PNH.
3.7. Molecular Dynamics Simulation
MD was performed using semi-flexible docking, which currently does not consider the flexibility of protein structures. To further assess the binding degree and stability between the compounds and the protein, a 300 ns MDS of the LEF, DIP, and PTX-CXCL8 complexes was conducted (Figure 8).
The RMSD profiles for all three complexes exhibit minor fluctuations, remaining relatively stable, which indicates that the overall structures of the protein-ligand complexes did not undergo significant deviations, thus suggesting stable binding interactions over the simulation period.
The RMSF data show some localized fluctuations in specific residues, reflecting the inherent flexibility of certain regions in the protein, while the majority of the structure remains stable. This is expected as flexible regions are often crucial for functional dynamics and ligand interaction. The Rg curves indicate that the complexes maintained a compact and stable conformation, with minimal expansion or collapse, reinforcing the structural integrity of the systems throughout the simulation.
Regarding the SASA, the values fluctuated slightly, suggesting that the protein-ligand complexes retained a stable interaction with the solvent, with no significant conformational changes occurring during the simulation. The Hydrogen Bonds analysis revealed consistent and stable hydrogen bonding interactions between the protein and ligand, further supporting the stability of the complexes. The number of hydrogen bonds remained relatively unchanged, which is a key indicator of the strength and persistence of the protein-ligand interaction.
The Interatomic Distance analysis showed that key distances between the protein and ligand atoms remained stable over time, which further emphasizes the consistent binding mode of the ligand within the protein's active site. Lastly, the Gibbs Free Energy Landscape (FEL) analysis revealed a single well-defined minimum energy cluster for all complexes, suggesting that the systems explored stable conformations with minimal energy fluctuations, indicative of strong and stable protein-ligand interactions.
In conclusion, these results correspond to the MD visualization, with almost no change in the binding site before and after the MDS, indicating that the LEF, DIP, and PTX-CXCL8 complexes have high binding stability.
3.8. Binding Free Energy Analysis
Further, the binding free energy of each complex was calculated using the MM-PBSA method over the entire 300 ns molecular dynamics trajectory to assess the stability and affinity of the protein–ligand interactions. As shown in Figure 9 a-c, the mean binding free energies of the DIP–CXCL8, LEF–CXCL8, and PTX–CXCL8 complexes were −163.4, −92.4, and −119.9 kJ/mol, respectively.
The MM-PBSA results demonstrated that all three ligands formed energetically favorable and stable complexes with CXCL8. Among them, DIP exhibited the most negative binding free energy, reflecting its strongest affinity and greatest stability throughout the 300 ns simulation. LEF and PTX also maintained consistent interactions with CXCL8, though with relatively weaker binding energies, indicating moderate but stable associations.
Collectively, the results of the MM-PBSA analysis indicate that DIP, LEF, and PTX have the potential to act as CXCL8 modulators, and their interactions with CXCL8 may also influence the development and progression of paroxysmal nocturnal hemoglobinuria by modulating CXCL8-related inflammatory and immune pathways.
3.9. Cell Viability Assays
The cytotoxic effects of DIP, LEF, and PTX on the PIGA-KO cell line were quantitatively evaluated using the CCK-8 assay after 24, 48, and 72 hours of treatment. As shown in Figure 10 a-c, all three compounds exhibited a concentration- and time-dependent reduction in cell viability. At lower concentrations, minimal cytotoxicity was observed, whereas progressive inhibition of cell proliferation became evident with increasing drug concentrations and prolonged exposure.
A noticeable enhancement in growth inhibition was observed after 72 hours compared with the 24-hour and 48-hour treatments, suggesting a cumulative cytotoxic effect over time. Among the tested agents, LEF demonstrated relatively higher potency at lower concentrations, whereas PTX showed a delayed but pronounced cytotoxic response at higher doses (Figure 10 d-f).
Quantitative analysis of IC₅₀ values further confirmed the time-dependent sensitivity of PIGA-KO cells to these compounds. The IC₅₀ values for DIP, LEF, and PTX were 81.08 µM, 69.68 µM, and 125.40 µM at 24 h; 59.89 µM, 74.60 µM, and 87.28 µM at 48 h; and 54.79 µM, 51.98 µM, and 96.71 µM at 72 h, respectively (Figure 10 g-i). These results indicate that PIGA-KO cells are susceptible to the antiproliferative activity of all three agents, with a gradual increase in inhibitory potency upon prolonged exposure.
4. Discussion
This study systematically investigates the molecular pathogenesis of PNH and potential drug targets, aiming to provide a theoretical basis and data support for the understanding of PNH pathogenesis and precision treatment. By constructing a PIGA-KO THP-1 cell model and applying various bioinformatics methods, hsa-miR-23a-3p was identified as a core miRNA. It regulates multiple PNH-related signaling pathways through the modulation of CXCL12, CXCL8, HES1, and TRAF5, significantly impacting cellular inflammation, chemotaxis, and immune regulation.
Previous studies [30] have reported that in myelodysplastic syndrome (MDS) patients, the expression of CXCL12 and miR-23a in stromal cells is negatively correlated, and for the first time, the miR-23a/CXCL12 axis was shown to regulate the hematopoietic microenvironment. Additionally, Liu et al [31]. found that miR-23a-3p regulates CXCL12 to affect angiogenesis. Research by Moon et al [32]. indicated that although miR-23a-3p does not directly target CXCL8, both are part of the same regulatory network, with potential targeting effects that influence inflammation, cytokine cascades, and other cardiovascular disease-related mechanisms. Shang et al [33]. further demonstrated that miR-23a-3p directly binds and inhibits the expression of TRAF5, regulating cell survival and proliferation. Collectively, miR-23a-3p plays a significant role in the onset and progression of PNH and related hematological diseases through a multi-target, multi-pathway regulatory mechanism. These regulatory effects correlate with clinical phenomena, such as the high incidence of hemolysis, thrombosis, and infections in PNH patients.
Neutrophils, the most abundant white blood cells in blood, are key members of the innate immune system. They primarily develop in the bone marrow and combat pathogens through phagocytosis, degranulation, and the formation of extracellular traps. In addition, neutrophils play multiple roles in tissue repair and fibrosis, protecting the body while potentially contributing to inflammation and tissue damage [34,35]. Clinically, the detection of GPI-AP-deficient neutrophil clones through flow cytometry allows for the sensitive and accurate diagnosis of PNH, including the detection of very small clones, which aids in early disease detection and monitoring. Compared to red blood cells, neutrophils are less affected by hemolysis and other interferences in PNH detection, providing a distinct diagnostic advantage [36]. Neutrophil extracellular traps (NETs), which are web-like structures composed of DNA and antimicrobial proteins released by neutrophils in response to specific stimuli, capture and eliminate pathogens [37]. Numerous studies have shown that while NETs serve to protect the body, they also promote thrombosis and participate in inflammation and tissue damage in various disease states [38,39,40,41]. In this study, single-cell transcriptome analysis not only further confirmed the central role of neutrophils in the immune microenvironment of PNH patients, but also revealed their unique role in regulating local inflammation, thrombosis, and complement activation. hdWGCNA analysis identified several co-expression modules and core genes closely associated with neutrophil function, providing strong evidence for further elucidating their molecular action network in PNH pathogenesis.
In terms of drug repositioning, this study, based on multi-omics data, combined with drug repositioning methods, bioinformatics predictions, clinical guidelines, molecular docking, and molecular dynamics simulations, identified potential therapeutic drugs for PNH. Through intersection analysis of the predictions from multiple drug platforms, eight candidate drugs were finally selected: Prednisone, Tretinoin, Dipyridamole, Danazol, Pentoxifylline, Leflunomide, Colchicine, and Paclitaxel. This study further evaluated the feasibility of these drugs by considering their existing clinical applications, pharmacological mechanisms, and safety profiles.
Prednisone, a corticosteroid, is widely used in the clinical treatment of PNH and is recommended as a first-line therapy in mainstream guidelines [42,43]. It mainly alleviates acute episodes by inhibiting inflammatory responses and immune-mediated hemolysis [44,45]. Tretinoin has been shown to have some relieving effects on PNH [46]. Danazol, a synthetic androgen, promotes hematopoiesis but imposes significant liver burden and carries a higher risk of complications with long-term use [47,48,49]. Colchicine and Paclitaxel are primarily used for malignant tumors and autoimmune diseases; the former has noticeable toxic side effects as a traditional chemotherapeutic agent [50], and the latter, while capable of interfering with microtubule polymerization, has higher toxicity and insufficient evidence supporting its clinical feasibility in PNH [51]. Therefore, both Colchicine and Paclitaxel are not considered suitable candidates for PNH treatment.
Based on an in-depth examination of drug mechanisms and clinical needs, LEF, DIP, and PTX are considered to have greater translational potential. LEF, a classic immunomodulator, is widely used in autoimmune diseases such as rheumatoid arthritis [52]. It works by inhibiting dihydroorotate dehydrogenase, blocking pyrimidine synthesis, and significantly suppressing the activation and proliferation of T and B lymphocytes [53,54]. Moreover, LEF downregulates the expression of various inflammatory factors, including CXCL8 (IL-8), which can effectively reduce complement-mediated hemolysis and associated inflammatory responses [55,56]. The molecular docking and molecular dynamics simulation results of this study further confirm that LEF has strong binding ability with core miRNAs and genes, theoretically providing an effective intervention for immune and inflammatory abnormalities in PNH, offering a molecular basis for clinical treatment.
DIP is a classic anti-platelet aggregation drug that can dilate blood vessels [57], increase microcirculatory perfusion, and improve tissue hypoxia, with relatively low bleeding risk and mild side effects [58,59]. In PNH patients, due to vascular damage and high thrombosis risk caused by intravascular hemolysis and complement activation, the rational application of anti-platelet aggregation drugs is crucial for prevention and treatment. Molecular docking and dynamics simulation results in this study also indicate that DIP can stably bind and regulate multiple PNH-related target molecules, providing a molecular basis for inhibiting thrombosis and improving microcirculation.
PTX is a drug that improves microcirculation [60], primarily used in peripheral vascular and chronic ischemic diseases. PTX inhibits phosphodiesterase, thereby reducing the synthesis of inflammatory factors [61]. It can also alleviate hemoglobinuria [62,63,64], lower blood viscosity, enhance red blood cell deformability, inhibit platelet aggregation, and modulate the release of inflammatory factors [65,66]. In the molecular docking and dynamics simulations in this study, PTX showed good binding ability with key inflammatory signal molecules such as CXCL8, theoretically helping to improve blood rheology and reduce vascular damage following hemolysis in PNH patients.
In addition, results from the CCK-8 assay demonstrated that LEF, DIP and PTX exhibited significant cytotoxic effects on PIGA-KO cells. These findings suggest that LEF, DIP, and PTX may serve as potential therapeutic candidates for PNH, particularly through their roles in complement inhibition, modulation of inflammatory responses, and prevention of thrombosis.
However, this study has certain limitations. First, although the PIGA-KO THP-1 cell model was effectively constructed using CRISPR/RNP technology to simulate the molecular pathology of PNH, there is an inherent difference between the cell model and the complex in vivo physiological environment. Second, although bioinformatics methods, molecular docking, and molecular dynamics simulations were used to identify multiple key regulatory targets and signaling pathways, some of the predicted targets and their exact biological functions in PNH pathogenesis still lack direct experimental validation. Finally, despite the use of multiple platforms and algorithms to reduce false-positive rates in drug prediction, candidate drugs may still face safety, optimal dosing, drug interactions, and potential side effects in real clinical applications.
5. Conclusions
This study elucidates the molecular pathogenesis of PNH through the establishment of a PIGA-KO THP-1 cell model and integrative bioinformatics analyses, identifying hsa-miR-23a-3p as a pivotal regulatory molecule. By modulating CXCL12, CXCL8, HES1, and TRAF5, miR-23a-3p orchestrates multiple signaling pathways implicated in inflammation, chemotaxis, and immune regulation, providing mechanistic insights into hallmark clinical manifestations of PNH, including hemolysis, thrombosis, and infection susceptibility. Single-cell transcriptomics further underscored the central role of neutrophils in the PNH immune microenvironment, linking their pro-inflammatory and pro-thrombotic activities to disease progression. DR analyses, supported by MD and MDS, highlighted Leflunomide, Dipyridamole, and Pentoxifylline as promising therapeutic candidates with potential to modulate complement activation, inflammation, and thrombosis. While these findings provide a robust theoretical framework for precision treatment strategies, limitations remain regarding the translation from in vitro models to the complex in vivo milieu, as well as the need for functional validation of predicted targets. Future studies integrating clinical trials and mechanistic experiments are warranted to substantiate these therapeutic prospects and advance personalized management approaches for PNH.
Author Contributions
Conceptualization, X.L. and P.Z.; Data curation, P.Z., Y.T. and X.S.; Formal analysis, P.Z., Y.X. and H.Z.; Funding acquisition, X.L.; Investigation, P.Z., H.L. and X.S.; Methodology, P.Z., Y.X., W.Z., Y.T. and H.Z.; Project administration, P.Z., H.Z. H.L.; Resources, X.L. and H.L.; Software, P.Z., Y.X., J,X., W.Z., Y.T. and H.Z.; Supervision, X.L., Y.X., H.Y. and H.Z.; Validation, P.Z., H.L. and X.S.; Visualization, P.Z., Y.X., J.X., Y.T. and H.Z.; Writing—original draft, P.Z., X.S., and Y.T.; writing—review and editing, X.L., J.X., H.Y., Y.X. and H.Z. All authors have read and agreed to the published version of the manuscript.
Funding
Financial support was received from National Natural Science Foundation of China (No.82450110) and National Key Research and Development Program of China (No.2021YFC2701704).
Institutional Review Board Statement
Not applicable.
Informed Consent Statement
Not applicable.
Data Availability Statement
The code is available in the GitHub at https://github.com/lulab-pz/PNH_bioinformatics_analysis. The raw sequencing data are available in the NCBI BioProject under accession number PRJNA1305106.
Conflicts of Interest
The authors declare no conflicts of interest.
References
- Hill, A.; DeZern, A.E.; Kinoshita, T.; Brodsky, R.A. Paroxysmal Nocturnal Haemoglobinuria. Nat Rev Dis Primers 2017, 3, 17028. [CrossRef]
- Jang, J.H.; Han, B.; Jung, J.; Russo, P.; Kulasekararaj, A.G. The Path to Accessible Care: Development and Impact of Eculizumab Biosimilars for Paroxysmal Nocturnal Hemoglobinuria and Atypical Hemolytic Uremic Syndrome. BioDrugs 2025, 39, 281–295. [CrossRef]
- Hoy, S.M. Pozelimab: First Approval. Drugs 2023, 83, 1551–1557. [CrossRef]
- Dhillon, S. Crovalimab: First Approval. Drugs 2024, 84, 707–716. [CrossRef]
- Heo, Y.-A. Pegcetacoplan: A Review in Paroxysmal Nocturnal Haemoglobinuria. Drugs 2022, 82, 1727–1735. [CrossRef]
- Hoy, S.M. Pegcetacoplan: First Approval. Drugs 2021, 81, 1423–1430. [CrossRef]
- Kang, C. Danicopan: First Approval. Drugs 2024, 84, 613–618. [CrossRef]
- Syed, Y.Y. Iptacopan: First Approval. Drugs 2024, 84, 599–606. [CrossRef]
- Fattizzo, B.; Versino, F.; Barcellini, W. Breakthrough Hemolysis in Paroxysmal Nocturnal Hemoglobinuria throughout Clinical Trials: From Definition to Clinical Practice. Blood 2025, 146, 411–421. [CrossRef]
- Schoettler, M.L.; Lisac, R.; Ofori, J.; Frost, E.; Liang, W.; Parikh, S.; Chandrakasan, S.; Fitch, T.; Obordo, J.; Spencer, K.; et al. Eculizumab Is Associated With Increased Infection Rates and Infection Related Mortality in Children With Thrombotic Microangiopathy After HCT. Am J Hematol 2025. [CrossRef]
- Baró, E.L.; Catti, F.; Estarellas, C.; Ghashghaei, O.; Lavilla, R. Drugs from Drugs: New Chemical Insights into a Mature Concept. Drug Discov Today 2024, 29, 104212. [CrossRef]
- Wan, Z.; Sun, X.; Li, Y.; Chu, T.; Hao, X.; Cao, Y.; Zhang, P. Applications of Artificial Intelligence in Drug Repurposing. Adv Sci (Weinh) 2025, 12, e2411325. [CrossRef]
- Sebastiano, M.R.; Hadano, S.; Cesca, F.; IAHSP Consortium; Ermondi, G. Preclinical Alternative Drug Discovery Programs for Monogenic Rare Diseases. Should Small Molecules or Gene Therapy Be Used? The Case of Hereditary Spastic Paraplegias. Drug Discov Today 2024, 29, 104138. [CrossRef]
- Hasan, M.R.; Alsaiari, A.A.; Fakhurji, B.Z.; Molla, M.H.R.; Asseri, A.H.; Sumon, M.A.A.; Park, M.N.; Ahammad, F.; Kim, B. Application of Mathematical Modeling and Computational Tools in the Modern Drug Design and Development Process. Molecules 2022, 27, 4169. [CrossRef]
- Lin, X.; Li, X.; Lin, X. A Review on Applications of Computational Methods in Drug Screening and Design. Molecules 2020, 25, 1375. [CrossRef]
- Pinzi, L.; Rastelli, G. Molecular Docking: Shifting Paradigms in Drug Discovery. Int J Mol Sci 2019, 20, 4331. [CrossRef]
- Yang, G.; Yang, Z. Applications of Docking and Molecular Dynamics in Drug Design. Curr Comput Aided Drug Des 2013, 9, 506. [CrossRef]
- Teruel-Montoya, R.; Luengo-Gil, G.; Vallejo, F.; Yuste, J.E.; Bohdan, N.; García-Barberá, N.; Espín, S.; Martínez, C.; Espín, J.C.; Vicente, V.; et al. Differential miRNA Expression Profile and Proteome in Plasma Exosomes from Patients with Paroxysmal Nocturnal Hemoglobinuria. Sci Rep 2019, 9, 3611. [CrossRef]
- Liao, Z.; Liu, W.; Wang, L.; Xie, W.; Yao, C.; Huang, Q.; Jiang, X.; Ren, C. The Role of Non-Coding RNA Regulates Stem Cell Programmed Death in Disease Therapy. Noncoding RNA Res 2025, 13, 57–70. [CrossRef]
- Mortazavi-Jahromi, S.S.; Aslani, M. Dysregulated miRNAs Network in the Critical COVID-19: An Important Clue for Uncontrolled Immunothrombosis/Thromboinflammation. Int Immunopharmacol 2022, 110, 109040. [CrossRef]
- Choi, B.; Kim, H.-A.; Suh, C.-H.; Byun, H.O.; Jung, J.-Y.; Sohn, S. The Relevance of miRNA-21 in HSV-Induced Inflammation in a Mouse Model. Int J Mol Sci 2015, 16, 7413–7427. [CrossRef]
- Garzon, R.; Pichiorri, F.; Palumbo, T.; Visentini, M.; Aqeilan, R.; Cimmino, A.; Wang, H.; Sun, H.; Volinia, S.; Alder, H.; et al. MicroRNA Gene Expression during Retinoic Acid-Induced Differentiation of Human Acute Promyelocytic Leukemia. Oncogene 2007, 26, 4148–4157. [CrossRef]
- Kim, S.; Kim, D.; Cho, S.W.; Kim, J.; Kim, J.-S. Highly Efficient RNA-Guided Genome Editing in Human Cells via Delivery of Purified Cas9 Ribonucleoproteins. Genome Res 2014, 24, 1012–1019. [CrossRef]
- Friedländer, M.R.; Mackowiak, S.D.; Li, N.; Chen, W.; Rajewsky, N. miRDeep2 Accurately Identifies Known and Hundreds of Novel microRNA Genes in Seven Animal Clades. Nucleic Acids Res 2012, 40, 37–52. [CrossRef]
- Ru, Y.; Kechris, K.J.; Tabakoff, B.; Hoffman, P.; Radcliffe, R.A.; Bowler, R.; Mahaffey, S.; Rossi, S.; Calin, G.A.; Bemis, L.; et al. The multiMiR R Package and Database: Integration of microRNA-Target Interactions along with Their Disease and Drug Associations. Nucleic Acids Res 2014, 42, e133. [CrossRef]
- Li, M.; Ang, K.S.; Teo, B.; Rom, U.; Nguyen, M.N.; Maurer-Stroh, S.; Chen, J. Rediscovering Publicly Available Single-Cell Data with the DISCO Platform. Nucleic Acids Res 2025, 53, D932–D938. [CrossRef]
- Zhang, J.; Chen, H.; Shi, L.; Ma, Y.; Zhi, P.; Li, H.; Zhang, H.; Geng, J.; Zhang, L.Z.; Jing, Y.; et al. Quantitative Transcriptome-Based Analysis Predicts a Combination Therapy for Severe Haemophilia B: A Case Report. Br J Haematol 2024, 204, 1105–1108. [CrossRef]
- Subramanian, A.; Narayan, R.; Corsello, S.M.; Peck, D.D.; Natoli, T.E.; Lu, X.; Gould, J.; Davis, J.F.; Tubelli, A.A.; Asiedu, J.K.; et al. A Next Generation Connectivity Map: L1000 Platform and the First 1,000,000 Profiles. Cell 2017, 171, 1437-1452.e17. [CrossRef]
- Cannon, M.; Stevenson, J.; Stahl, K.; Basu, R.; Coffman, A.; Kiwala, S.; McMichael, J.F.; Kuzma, K.; Morrissey, D.; Cotto, K.; et al. DGIdb 5.0: Rebuilding the Drug-Gene Interaction Database for Precision Medicine and Drug Discovery Platforms. Nucleic Acids Res 2024, 52, D1227–D1235. [CrossRef]
- Arabanian, L.S.; Fierro, F.A.; Stölzel, F.; Heder, C.; Poitz, D.M.; Strasser, R.H.; Wobus, M.; Borhäuser, M.; Ferrer, R.A.; Platzbecker, U.; et al. MicroRNA-23a Mediates Post-Transcriptional Regulation of CXCL12 in Bone Marrow Stromal Cells. Haematologica 2014, 99, 997–1005. [CrossRef]
- Liu, Y.; Li, Q.; Tang, D.; Li, M.; Zhao, P.; Yang, W.; Shu, L.; Wang, J.; He, Z.; Li, Y.; et al. SNHG17 Promotes the Proliferation and Migration of Colorectal Adenocarcinoma Cells by Modulating CXCL12-Mediated Angiogenesis. Cancer Cell Int 2020, 20, 566. [CrossRef]
- Moon, K.Z.; Rahman, M.H.; Alam, M.J.; Hossain, M.A.; Hwang, S.; Kang, S.; Moon, S.; Park, M.N.; Ahn, C.-H.; Kim, B. Unraveling the Interplay between Cardiovascular Diseases and Alcohol Use Disorder: A Bioinformatics and Network-Based Exploration of Shared Molecular Pathways and Key Biomarkers Validation via Western Blot Analysis. Comput Biol Chem 2025, 115, 108338. [CrossRef]
- Shang, M.; Weng, L.; Wu, S.; Liu, B.; Yin, X.; Wang, Z.; Mao, A. HP1BP3 Promotes Tumor Growth and Metastasis by Upregulating miR-23a to Target TRAF5 in Esophageal Squamous Cell Carcinoma. Am J Cancer Res 2021, 11, 2928–2943.
- Herro, R.; Grimes, H.L. The Diverse Roles of Neutrophils from Protection to Pathogenesis. Nat Immunol 2024, 25, 2209–2219. [CrossRef]
- Yaw, H.P.; Devi, S.; Ng, L.G. Neutrophils: Key Players in the Metabolic Syndrome Puzzle. hLife 2025, 3, 121–131. [CrossRef]
- Brando, B.; Gatti, A.; Preijers, F. Flow Cytometric Diagnosis of Paroxysmal Nocturnal Hemoglobinuria: Pearls and Pitfalls - A Critical Review Article. EJIFCC 2019, 30, 355–370.
- Schoen, J.; Euler, M.; Schauer, C.; Schett, G.; Herrmann, M.; Knopf, J.; Yaykasli, K.O. Neutrophils’ Extracellular Trap Mechanisms: From Physiology to Pathology. Int J Mol Sci 2022, 23, 12855. [CrossRef]
- Wang, H.; Kim, S.J.; Lei, Y.; Wang, S.; Wang, H.; Huang, H.; Zhang, H.; Tsung, A. Neutrophil Extracellular Traps in Homeostasis and Disease. Signal Transduct Target Ther 2024, 9, 235. [CrossRef]
- Fuchs, T.A.; Brill, A.; Duerschmied, D.; Schatzberg, D.; Monestier, M.; Myers, D.D.; Wrobleski, S.K.; Wakefield, T.W.; Hartwig, J.H.; Wagner, D.D. Extracellular DNA Traps Promote Thrombosis. Proc Natl Acad Sci U S A 2010, 107, 15880–15885. [CrossRef]
- Papayannopoulos, V. Neutrophil Extracellular Traps in Immunity and Disease. Nat Rev Immunol 2018, 18, 134–147. [CrossRef]
- Yipp, B.G.; Kubes, P. NETosis: How Vital Is It? Blood 2013, 122, 2784–2794. [CrossRef]
- Red Blood Cell Disease (Anemia) Group, Chinese Society of Hematology, Chinese Medical Association [Guidelines for the diagnosis and management of paroxysmal nocturnal hemoglobinuria (2024)]. Zhonghua Xue Ye Xue Za Zhi 2024, 45, 727–737. [CrossRef]
- Rosse, W.F. Paroxysmal Nocturnal Hemoglobinuria as a Molecular Disease. Medicine (Baltimore) 1997, 76, 63–93. [CrossRef]
- Osti, N.; Beschin, G.; Goldin, M.; Guidolin, L.; Panero, E.; Sartori, A.; Parisi, A.; Cantini, M.; Pizzolo, F.; Olivieri, O.; et al. Case Report: Microangiopathic Hemolytic Anemia With Normal ADAMTS13 Activity. Front Med (Lausanne) 2021, 8, 589423. [CrossRef]
- Brazel, D.; Eid, T.; Harding, C. Warm and Cold Autoimmune Hemolytic Anemia in the Setting of COVID-19 Disease. Cureus 2021, 13, e18127. [CrossRef]
- Viniou, N.; Michali, E.; Meletis, J.; Andreopoulos, A.; Vaiopoulos, G.; Stavroyianni, N.; Loukopoulos, D.; Yataganas, X. Trisomy 8 in a Patient Who Responded to Therapy with All-Trans-Retinoic Acid and Developed Paroxysmal Nocturnal Haemoglobinuria. Br J Haematol 1997, 97, 135–136. [CrossRef]
- Cines, D.B.; Cassileth, P.A.; Kiss, J.E. Danazol Therapy in Myelodysplasia. Ann Intern Med 1985, 103, 58–60. [CrossRef]
- Sadek, I.; Zayed, E.; Hayne, O.; Fernandez, L. Prolonged Complete Remission of Myelodysplastic Syndrome Treated with Danazol, Retinoic Acid and Low-Dose Prednisone. Am J Hematol 2000, 64, 306–310. [CrossRef]
- Shah, S.; Yadav, R.; Bhattarai, A.; Dahal, K.; Tharu, S.; Gautam, S.; Rawal, L.; Thapa, S.; Sah, S.K.; Sharma, S.; et al. Safety and Efficacy of Danazol in Immune Thrombocytopenia: A Systematic Review. Res Pract Thromb Haemost 2024, 8, 102444. [CrossRef]
- Stewart, S.; Yang, K.C.K.; Atkins, K.; Dalbeth, N.; Robinson, P.C. Adverse Events during Oral Colchicine Use: A Systematic Review and Meta-Analysis of Randomised Controlled Trials. Arthritis Res Ther 2020, 22, 28. [CrossRef]
- da Costa, R.; Passos, G.F.; Quintão, N.L.M.; Fernandes, E.S.; Maia, J.R.L.C.B.; Campos, M.M.; Calixto, J.B. Taxane-Induced Neurotoxicity: Pathophysiology and Therapeutic Perspectives. Br J Pharmacol 2020, 177, 3127–3146. [CrossRef]
- Smolen, J.S.; Landewé, R.; Bijlsma, J.; Burmester, G.; Chatzidionysiou, K.; Dougados, M.; Nam, J.; Ramiro, S.; Voshaar, M.; van Vollenhoven, R.; et al. EULAR Recommendations for the Management of Rheumatoid Arthritis with Synthetic and Biological Disease-Modifying Antirheumatic Drugs: 2016 Update. Ann Rheum Dis 2017, 76, 960–977. [CrossRef]
- Miao, F.; Li, X.; Zhao, L.; Zhang, S.; Geng, M.; Ye, C.; Shi, Y.; Lei, T. Leflunomide-Mediated Immunomodulation Inhibits Lesion Progression in a Vitiligo Mouse Model. Int J Mol Sci 2025, 26, 6787. [CrossRef]
- Phan, T.; Nguyen, V.H.; Buettner, R.; Morales, C.; Yang, L.; Wong, P.; Tsai, W.; Salazar, M. d’Alincourt; Gil, Z.; Diamond, D.J.; et al. Inhibition of de Novo Pyrimidine Synthesis Augments Gemcitabine Induced Growth Inhibition in an Immunocompetent Model of Pancreatic Cancer. Int J Biol Sci 2021, 17, 2240–2251. [CrossRef]
- Mirmohammadsadegh, A.; Homey, B.; Abts, H.F.; Köhrer, K.; Ruzicka, T.; Michel, G. Differential Modulation of Pro- and Anti-Inflammatory Cytokine Receptors by N-(4-Trifluoromethylphenyl)-2-Cyano-3-Hydroxy-Crotonic Acid Amide (A77 1726), the Physiologically Active Metabolite of the Novel Immunomodulator Leflunomide. Biochem Pharmacol 1998, 55, 1523–1529. [CrossRef]
- Klimiuk, P.A.; Kita, J.; Chwiecko, J.; Sierakowski, S. The Changes in Serum Chemokines Following Leflunomide Therapy in Patients with Rheumatoid Arthritis. Clin Rheumatol 2009, 28, 17–21. [CrossRef]
- Hasday, J.D.; Sitrin, R.G. Dipyridamole Stimulates Urokinase Production and Suppresses Procoagulant Activity of Rabbit Alveolar Macrophages: A Possible Mechanism of Antithrombotic Action. Blood 1987, 69, 660–667.
- Aktas, B.; Utz, A.; Hoenig-Liedl, P.; Walter, U.; Geiger, J. Dipyridamole Enhances NO/cGMP-Mediated Vasodilator-Stimulated Phosphoprotein Phosphorylation and Signaling in Human Platelets: In Vitro and in Vivo/Ex Vivo Studies. Stroke 2003, 34, 764–769. [CrossRef]
- d’Esterre, C.D.; Lee, T.-Y. Effect of Dipyridamole during Acute Stroke: Exploring Antithrombosis and Neuroprotective Benefits. Ann N Y Acad Sci 2010, 1207, 71–75. [CrossRef]
- Plotnikov, M.B.; Aliev, O.I.; Shamanaev, A.Y.; Sidekhmenova, A.V.; Anfinogenova, Y.; Anishchenko, A.M.; Fomina, T.I.; Arkhipov, A.M. Effects of Pentoxifylline on Hemodynamic, Hemorheological, and Microcirculatory Parameters in Young SHRs during Arterial Hypertension Development. Clin Exp Hypertens 2017, 39, 570–578. [CrossRef]
- Lugnier, C. Cyclic Nucleotide Phosphodiesterase (PDE) Superfamily: A New Target for the Development of Specific Therapeutic Agents. Pharmacol Ther 2006, 109, 366–398. [CrossRef]
- Navarro, J.F.; Milena, F.J.; Mora, C.; León, C.; García, J. Renal Pro-Inflammatory Cytokine Gene Expression in Diabetic Nephropathy: Effect of Angiotensin-Converting Enzyme Inhibition and Pentoxifylline Administration. Am J Nephrol 2006, 26, 562–570. [CrossRef]
- Strutz, F.; Heeg, M.; Kochsiek, T.; Siemers, G.; Zeisberg, M.; Müller, G.A. Effects of Pentoxifylline, Pentifylline and Gamma-Interferon on Proliferation, Differentiation, and Matrix Synthesis of Human Renal Fibroblasts. Nephrol Dial Transplant 2000, 15, 1535–1546. [CrossRef]
- Abdel-Salam, O.M.E.; Baiuomy, A.R.; El-Shenawy, S.M.; Arbid, M.S. The Anti-Inflammatory Effects of the Phosphodiesterase Inhibitor Pentoxifylline in the Rat. Pharmacol Res 2003, 47, 331–340. [CrossRef]
- Xing, F.; Xun, S.; Zhu, Y.; Hu, F.; Drevenšek-Olenik, I.; Zhang, X.; Pan, L.; Xu, J. Microfluidic Assemblies Designed for Assessment of Drug Effects on Deformability of Human Erythrocytes. Biochem Biophys Res Commun 2019, 512, 303–309. [CrossRef]
- Maldonado, V.; Loza-Mejía, M.A.; Chávez-Alderete, J. Repositioning of Pentoxifylline as an Immunomodulator and Regulator of the Renin-Angiotensin System in the Treatment of COVID-19. Med Hypotheses 2020, 144, 109988. [CrossRef]
Figure 1.
Overall workflow of the present study.
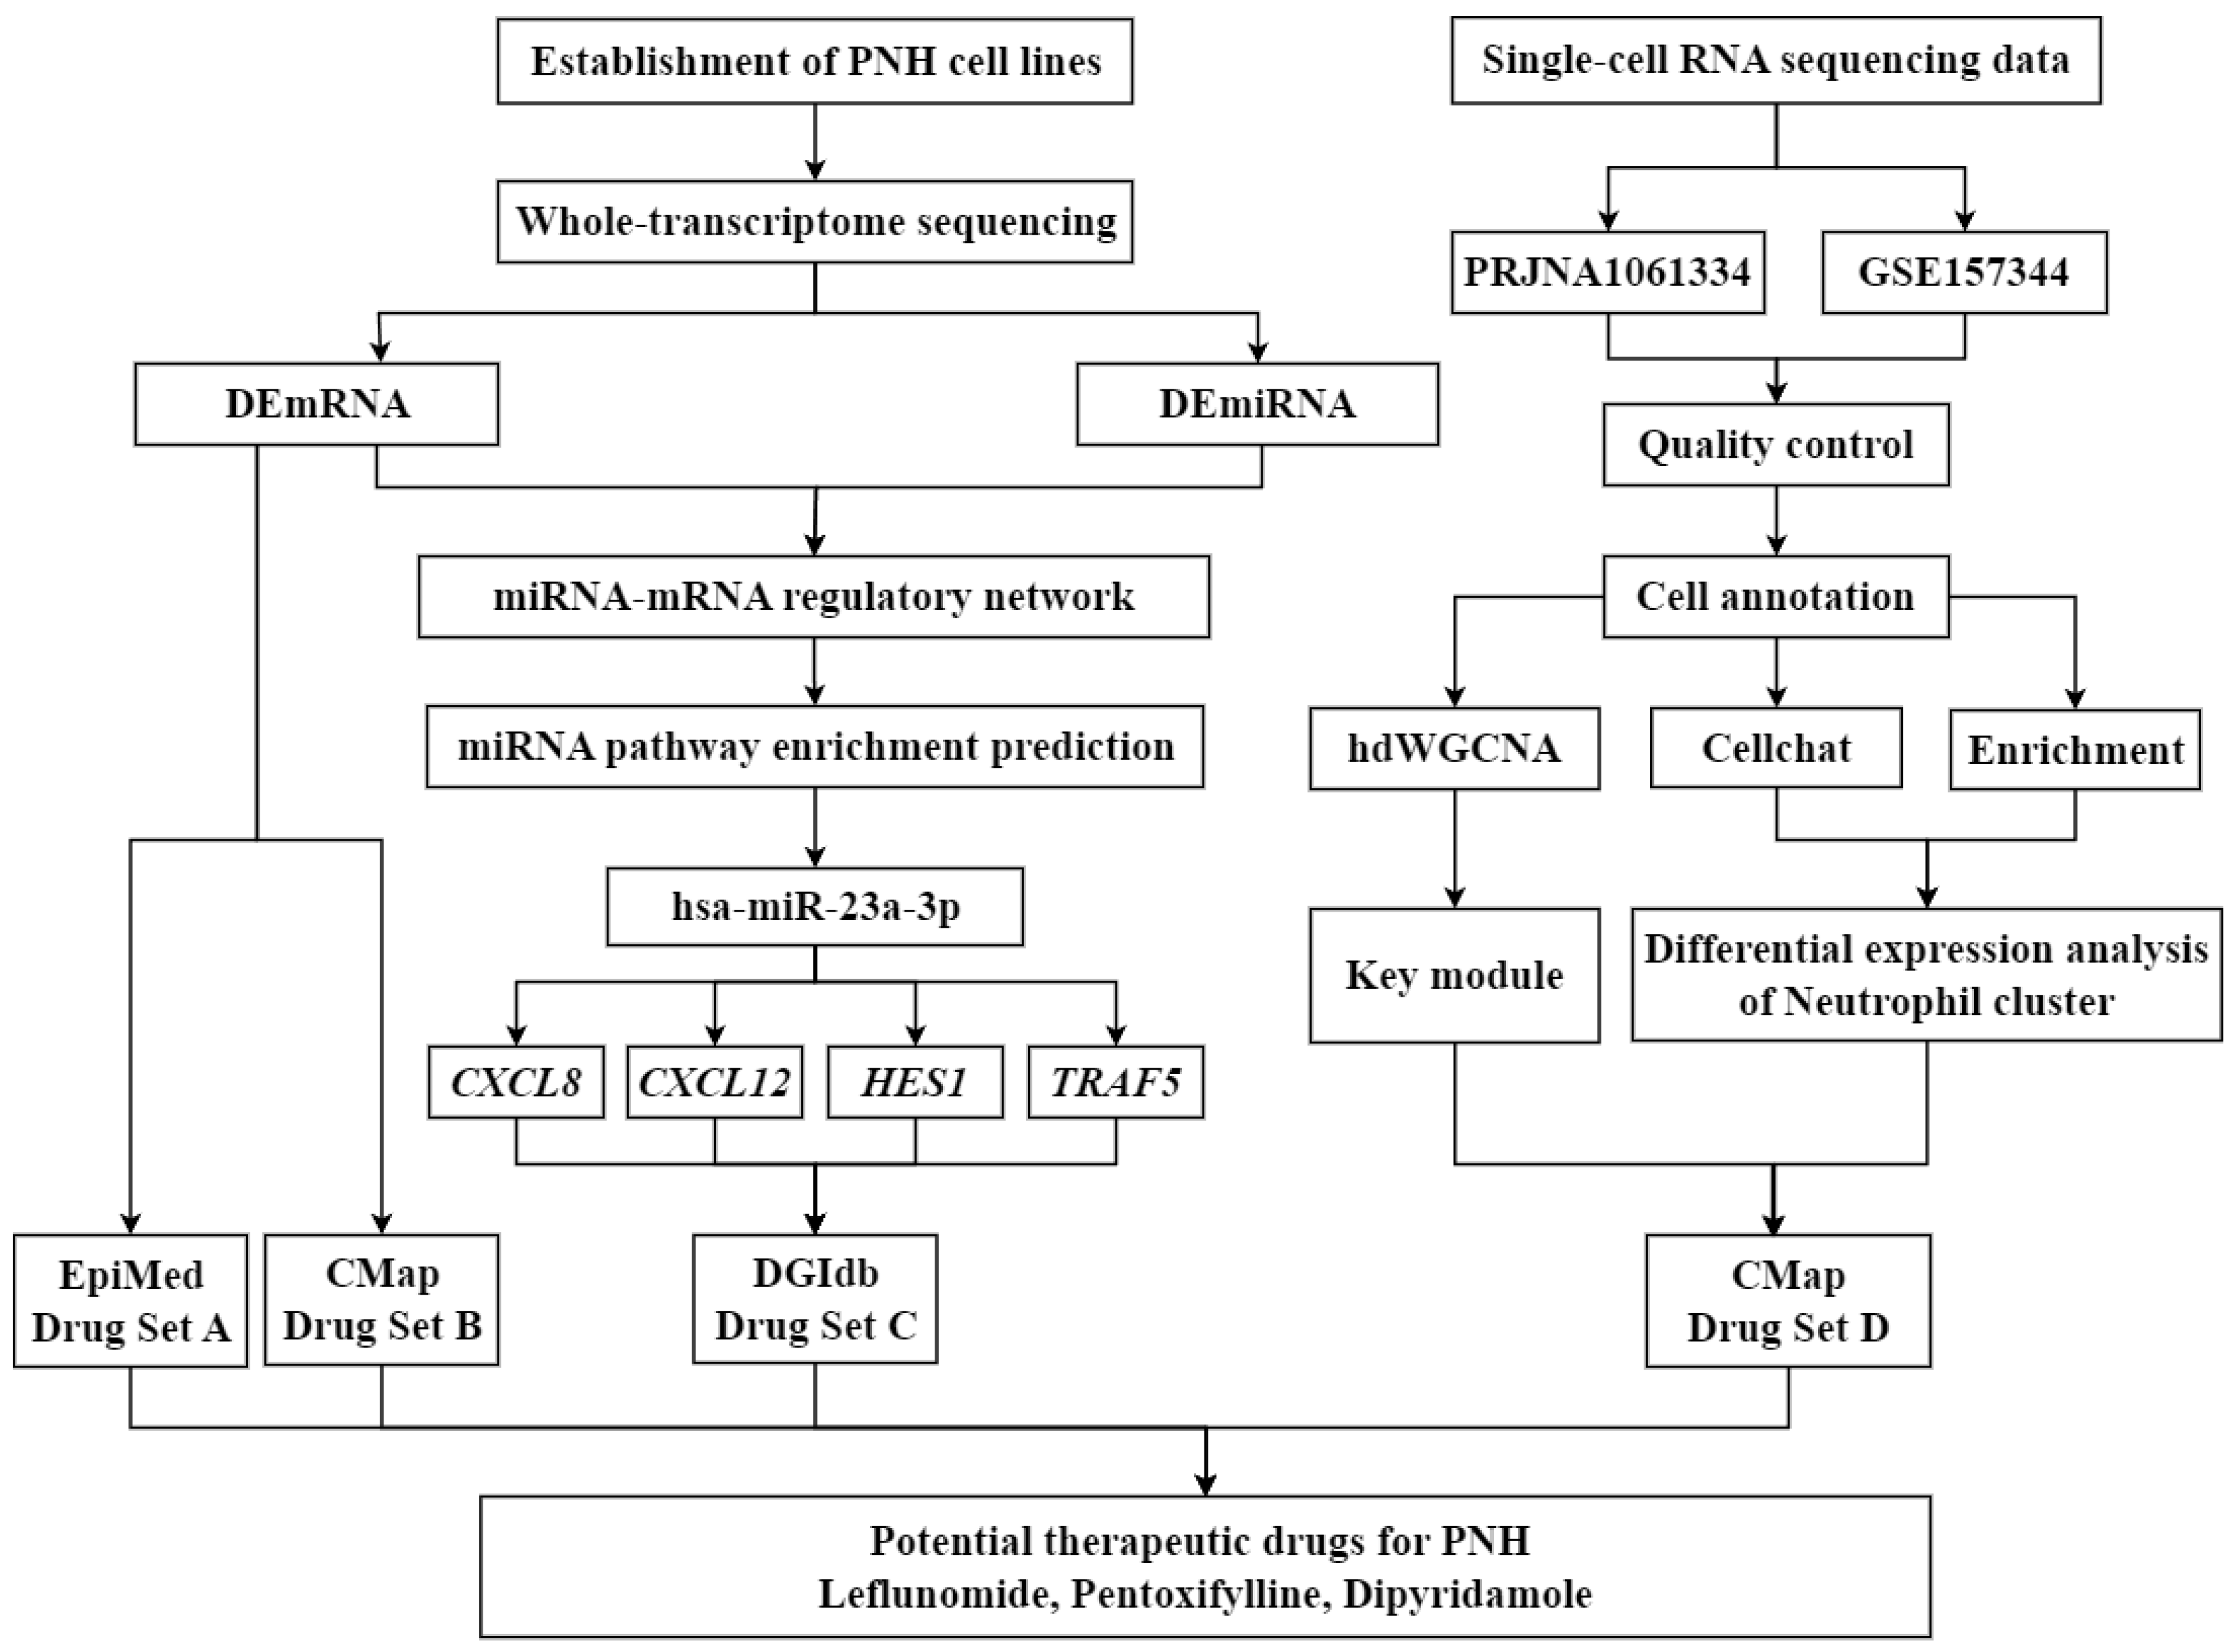
Figure 2.
Differential expression analysis and GO/KEGG enrichment analysis of the whole-transcriptome sequencing data. (a) Volcano plot of differential expression analysis of mRNA. (b) Volcano plot of differential expression analysis of miRNA. (c) GO functional enrichment analysis of mRNA. (d) KEGG functional enrichment analysis of mRNA.
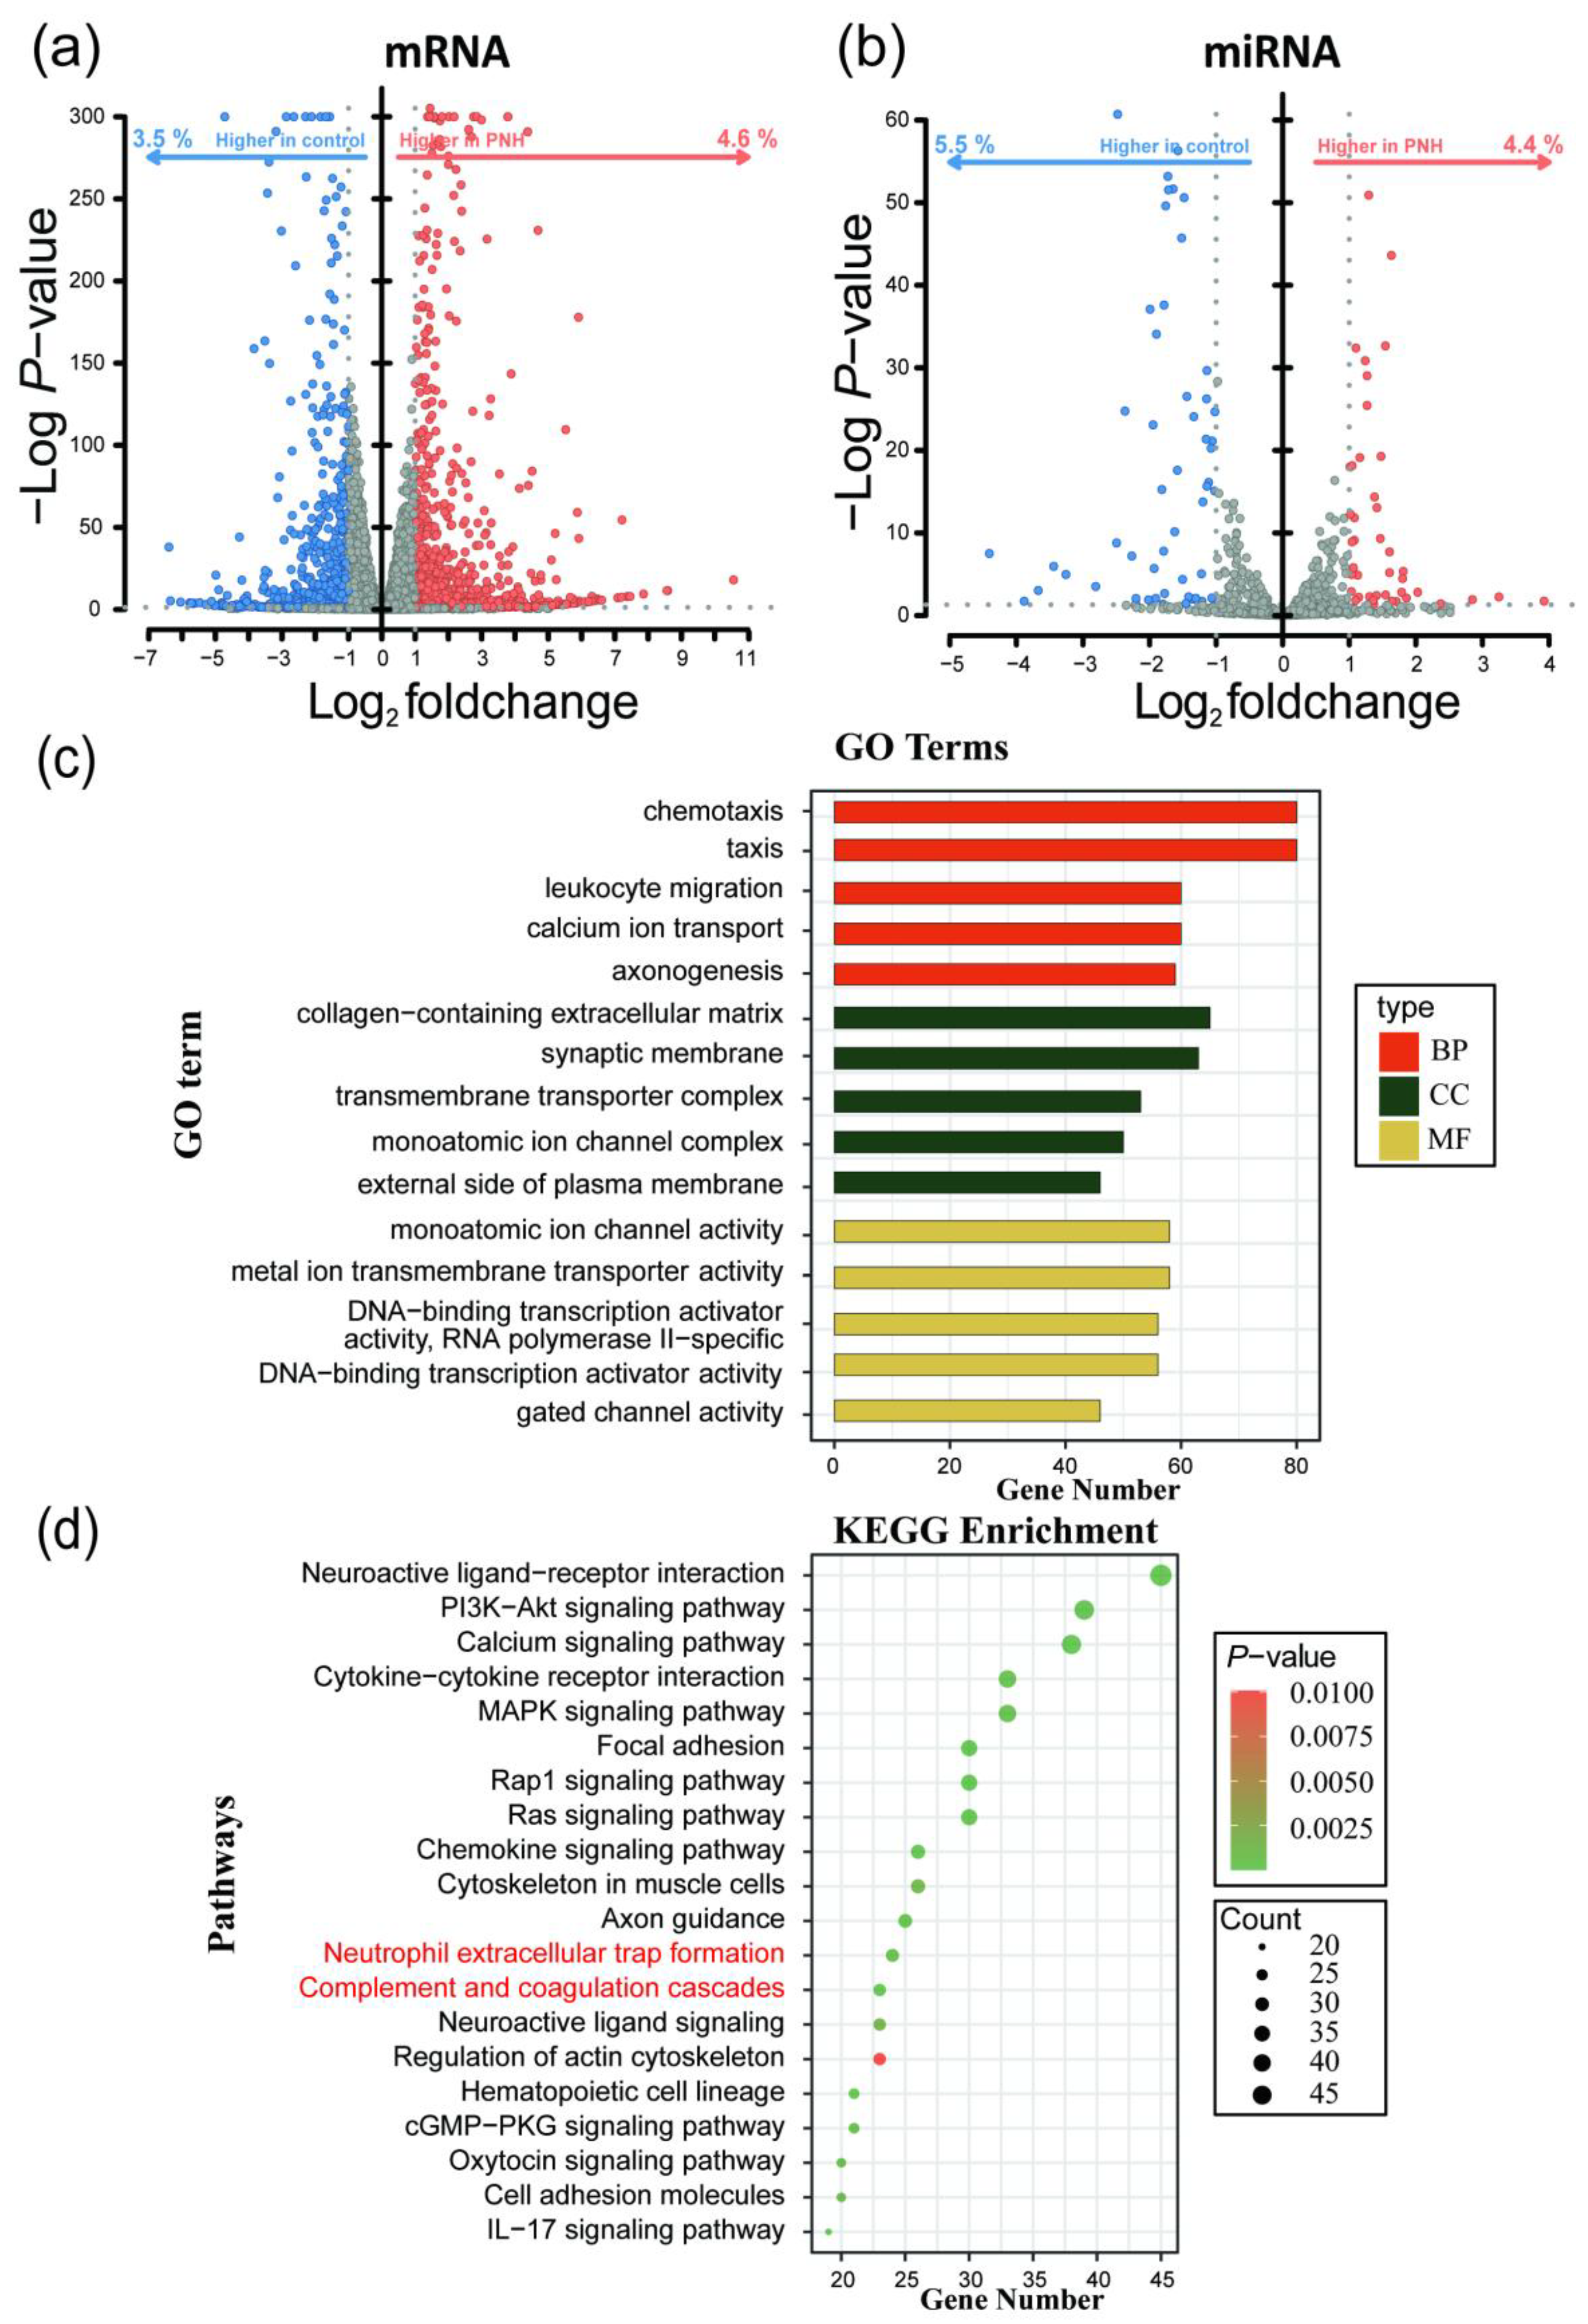
Figure 3.
miRNA-mRNA Regulatory Network.
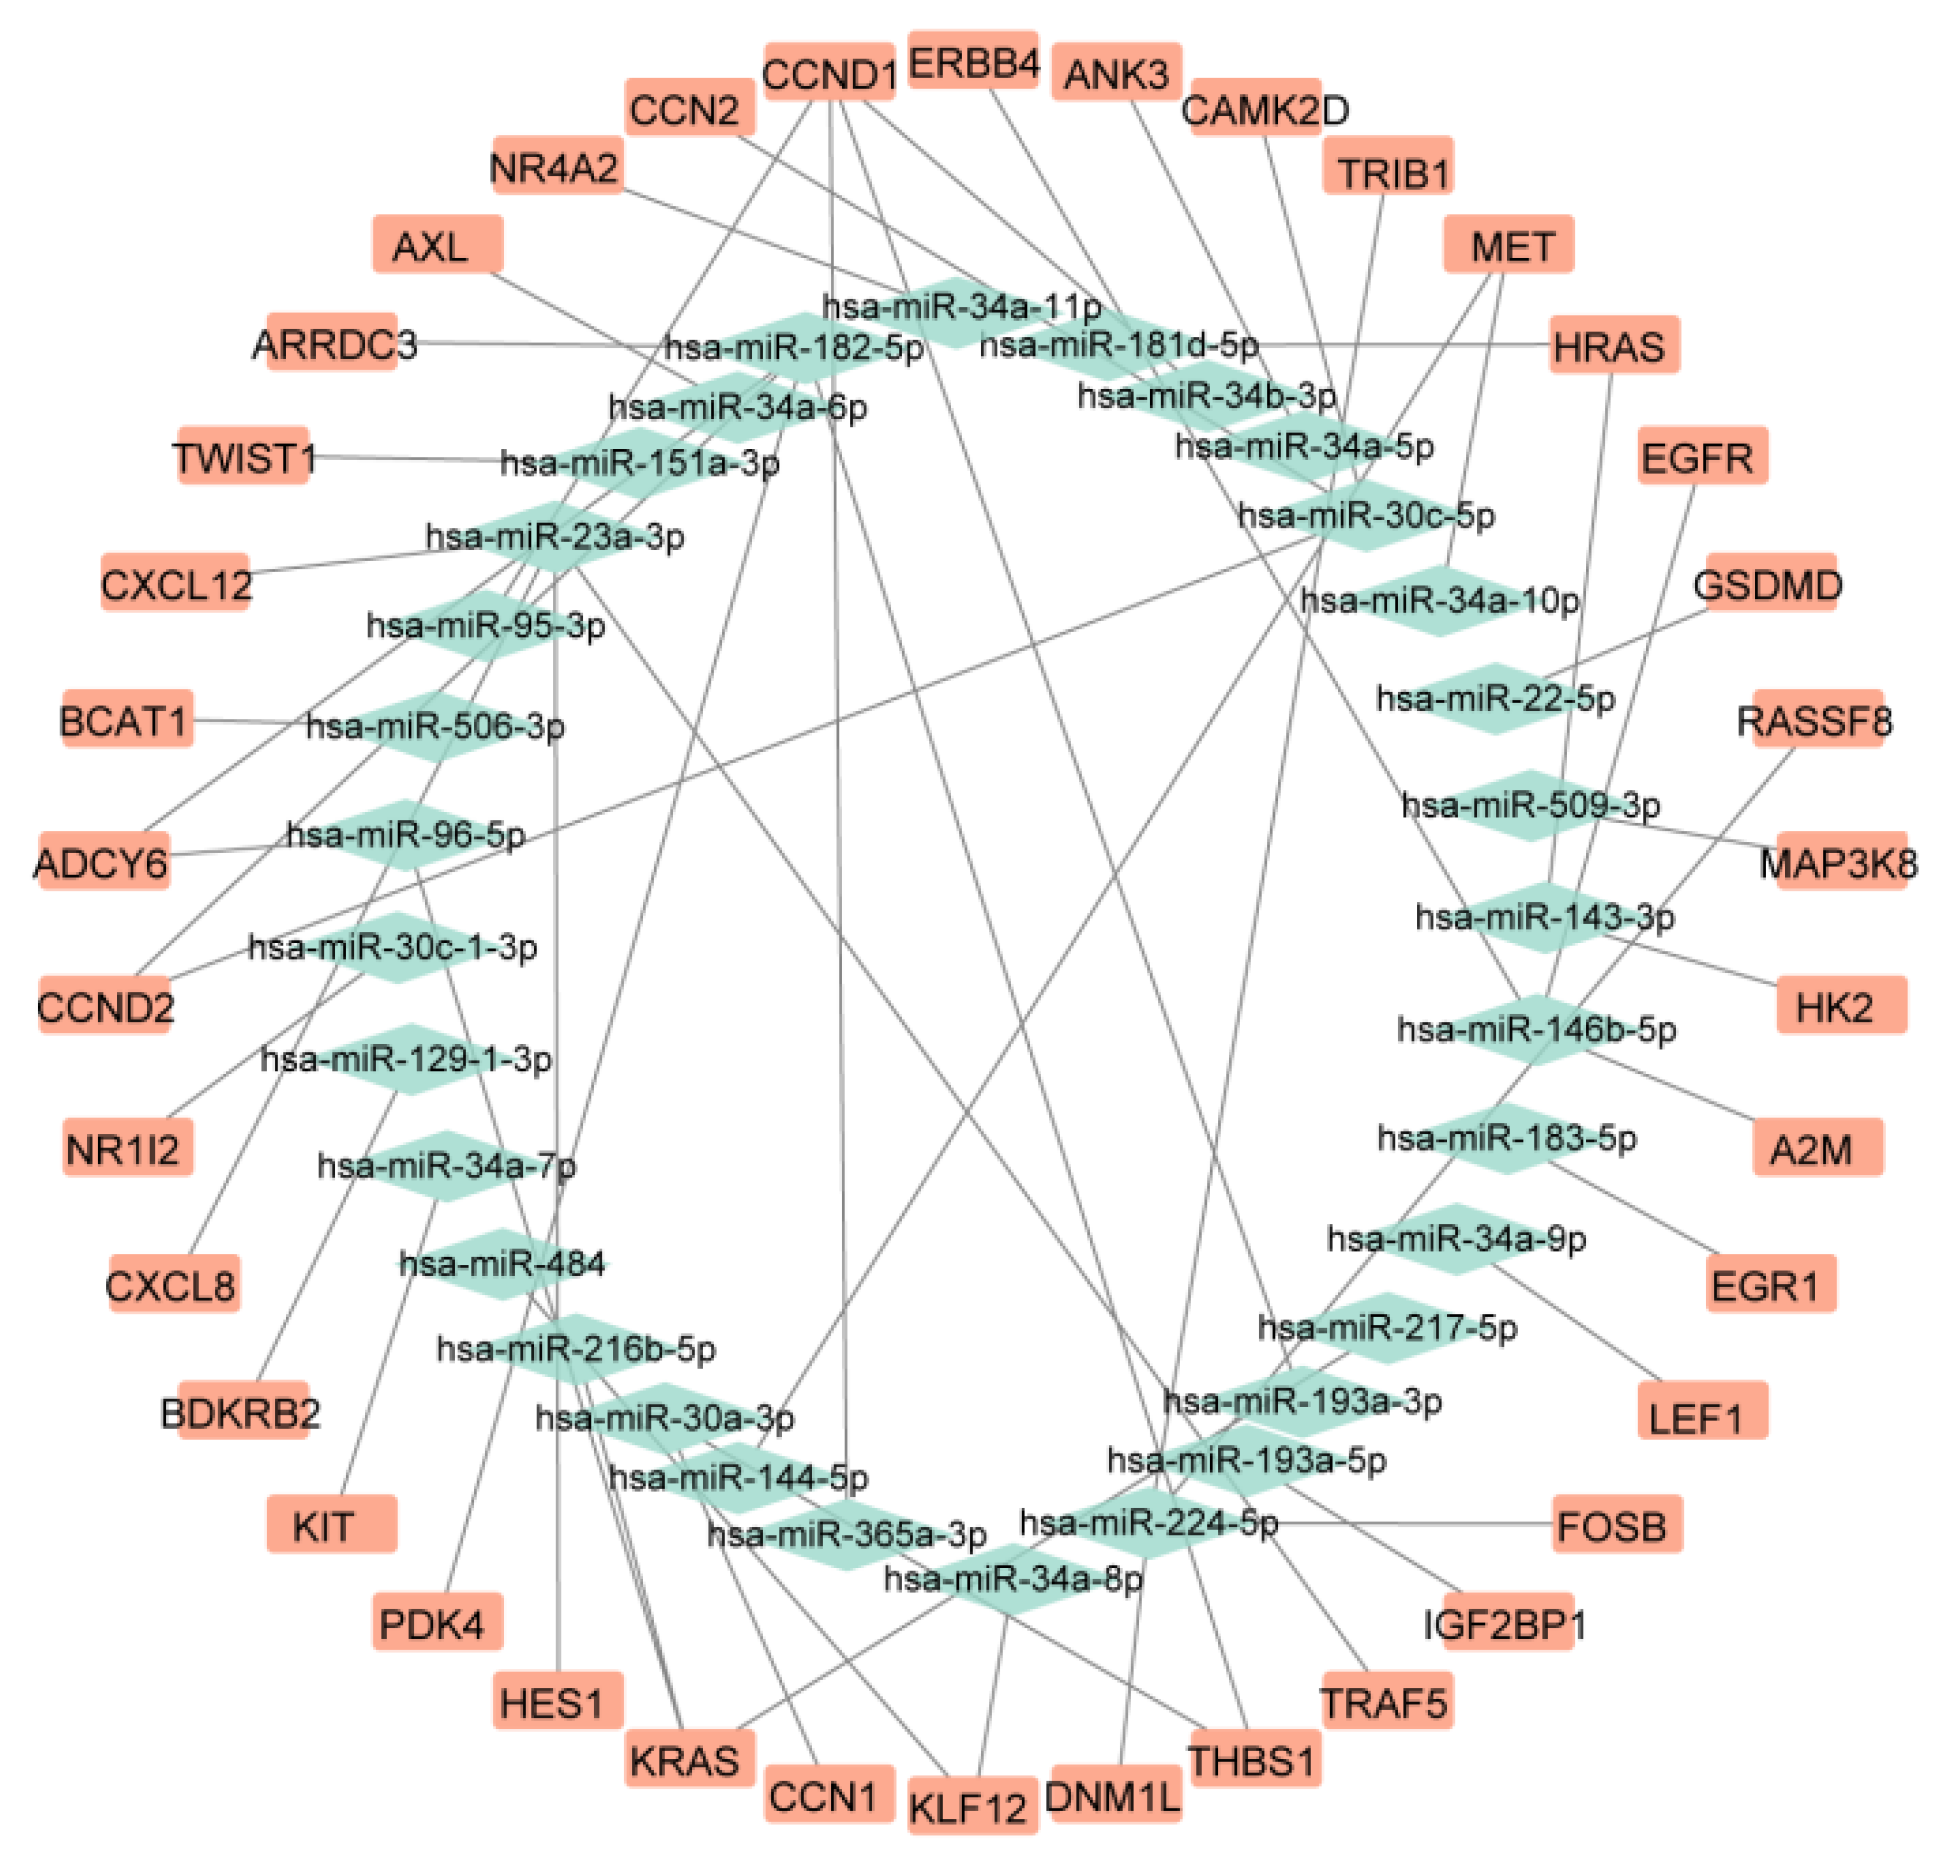
Figure 4.
Single-cell data analysis results. (a) A dot plot showing the expression of typical marker genes across different cell subpopulations. The size of the dots represents the expression proportion, and the color represents the average expression level. (b) UMAP dimensionality reduction clustering plot displaying the distribution of major cell types, including monocytes, macrophages, neutrophils, NK cells, B cells, T cells, erythroid lineage, and megakaryocyte lineage cells, after annotation using multiple databases. (c) Functional pathway enrichment analysis of marker genes for different cell types, with a bar plot showing the characteristic pathways of each cell type and their enrichment Z-scores. (d) Cell interaction count analysis, with a chord diagram showing the number of interactions between different cell types, where the width of the connecting lines represents the number of interactions. (e) Cell interaction strength analysis, with a chord diagram showing the interaction strength between different cell types, where the width of the connecting lines represents the strength of the interactions.
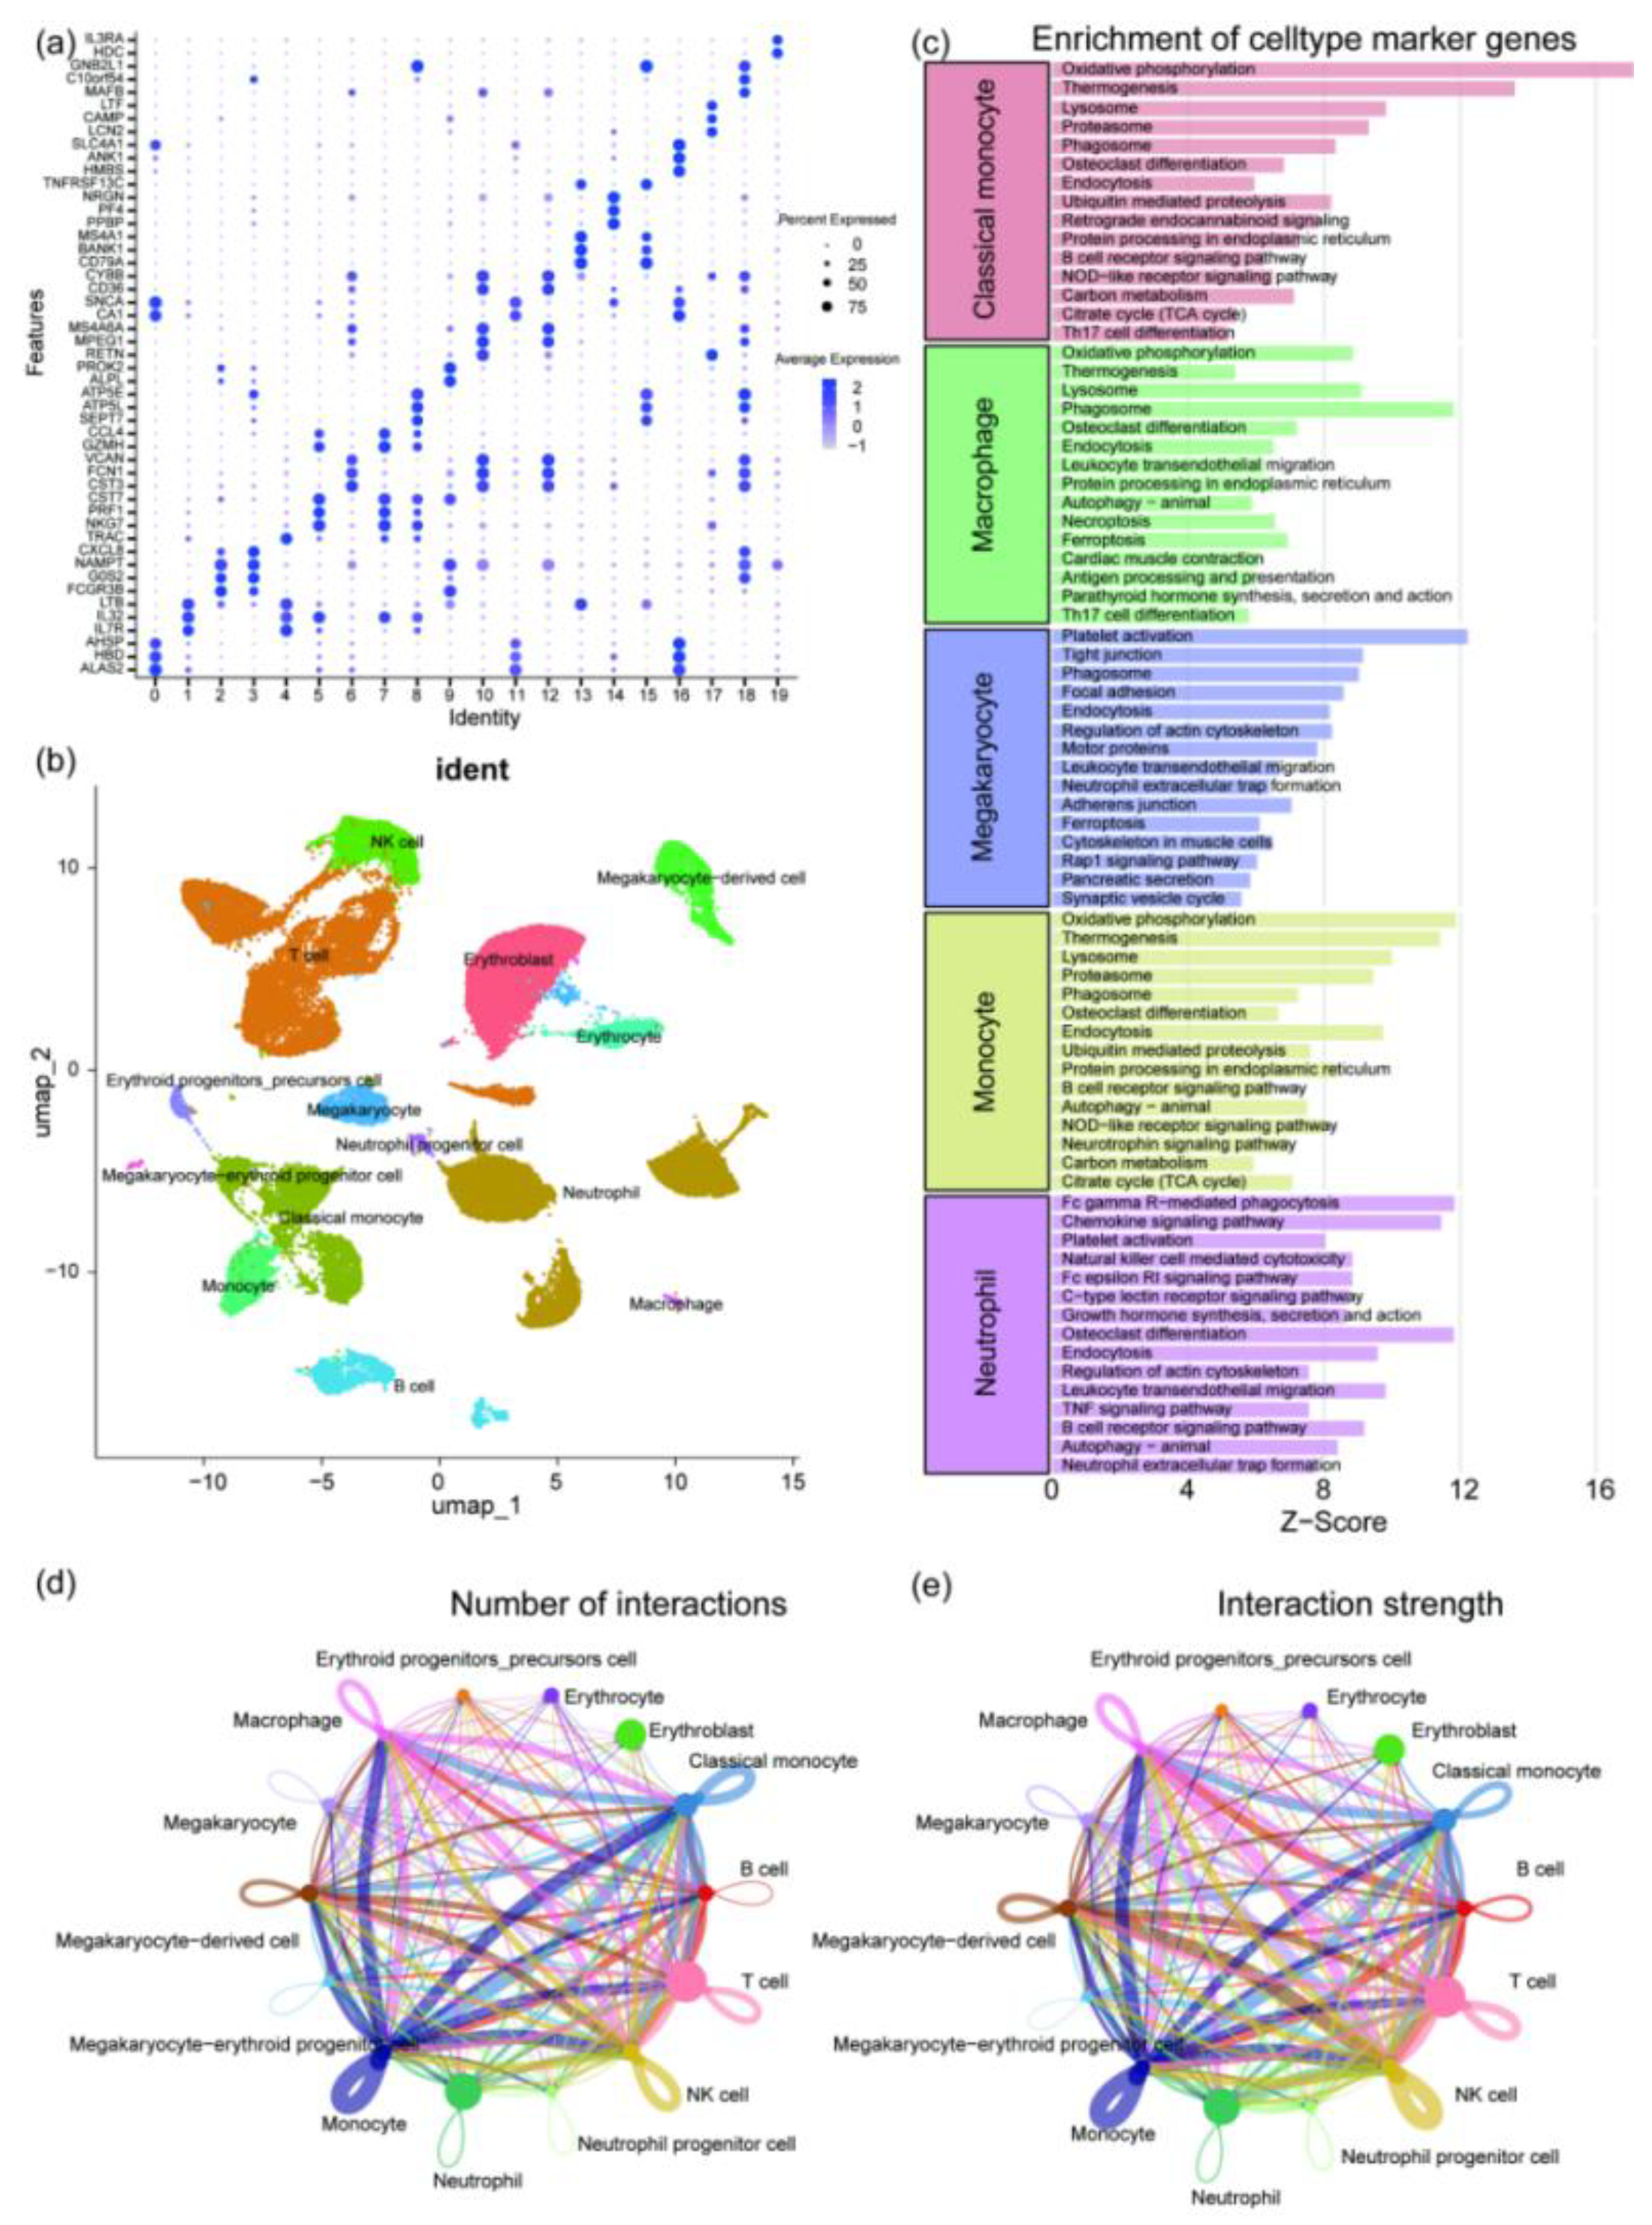
Figure 5.
hdWGCNA analysis results. (a) Plot showing the soft threshold power determination used in hdWGCNA, with 12 selected as the optimal threshold. (b) Dendrogram generated by WGCNA displaying the hierarchical clustering of genes into different modules based on co-expression patterns. (c) Bar plot showing the module characteristic gene (kME) values for genes within different color-coded modules (black, blue, brown, green, magenta, pink, red, turquoise, yellow). (d) Correlation analysis illustrating the relationships between different gene modules, with positive and negative correlations represented in blue and green, respectively. (e) Dot plot showing the correlation between different cell clusters and key modules.
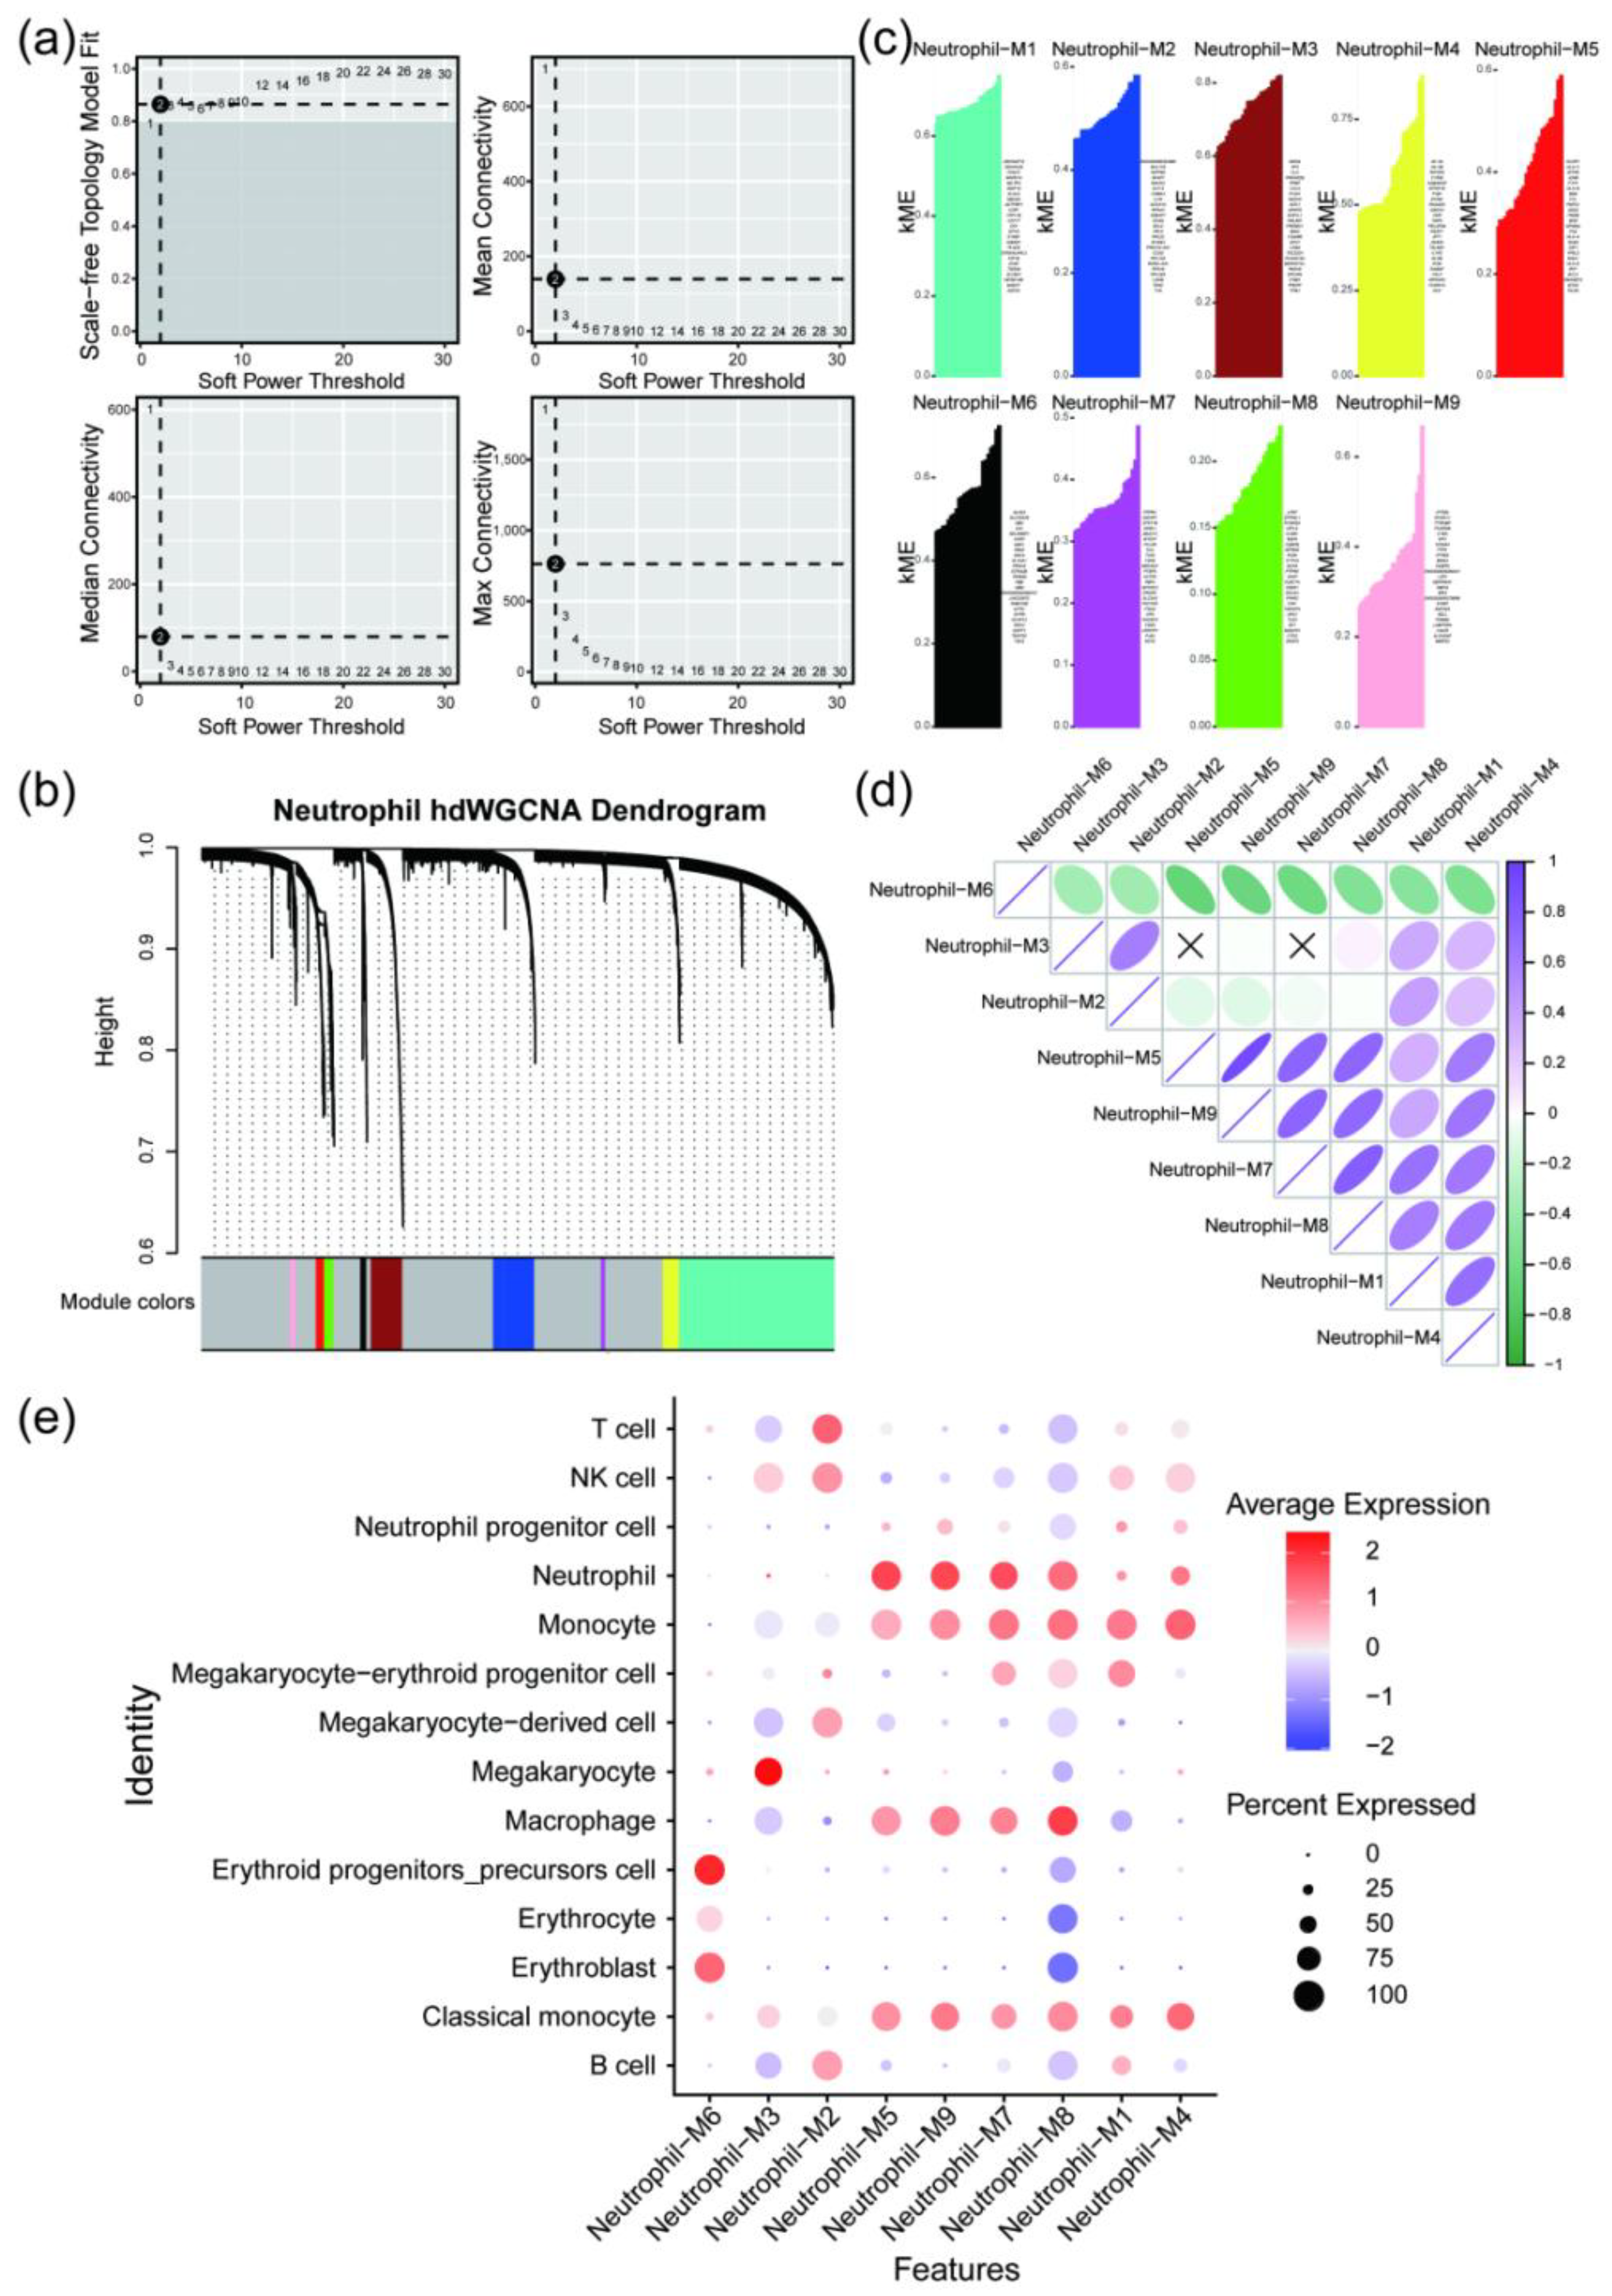
Figure 6.
Venn diagram of drug sets A (mRNA EpiMed), B (mRNA CMap), C (mRNA DGIdb), and D (scRNA CMap).
Figure 6.
Venn diagram of drug sets A (mRNA EpiMed), B (mRNA CMap), C (mRNA DGIdb), and D (scRNA CMap).
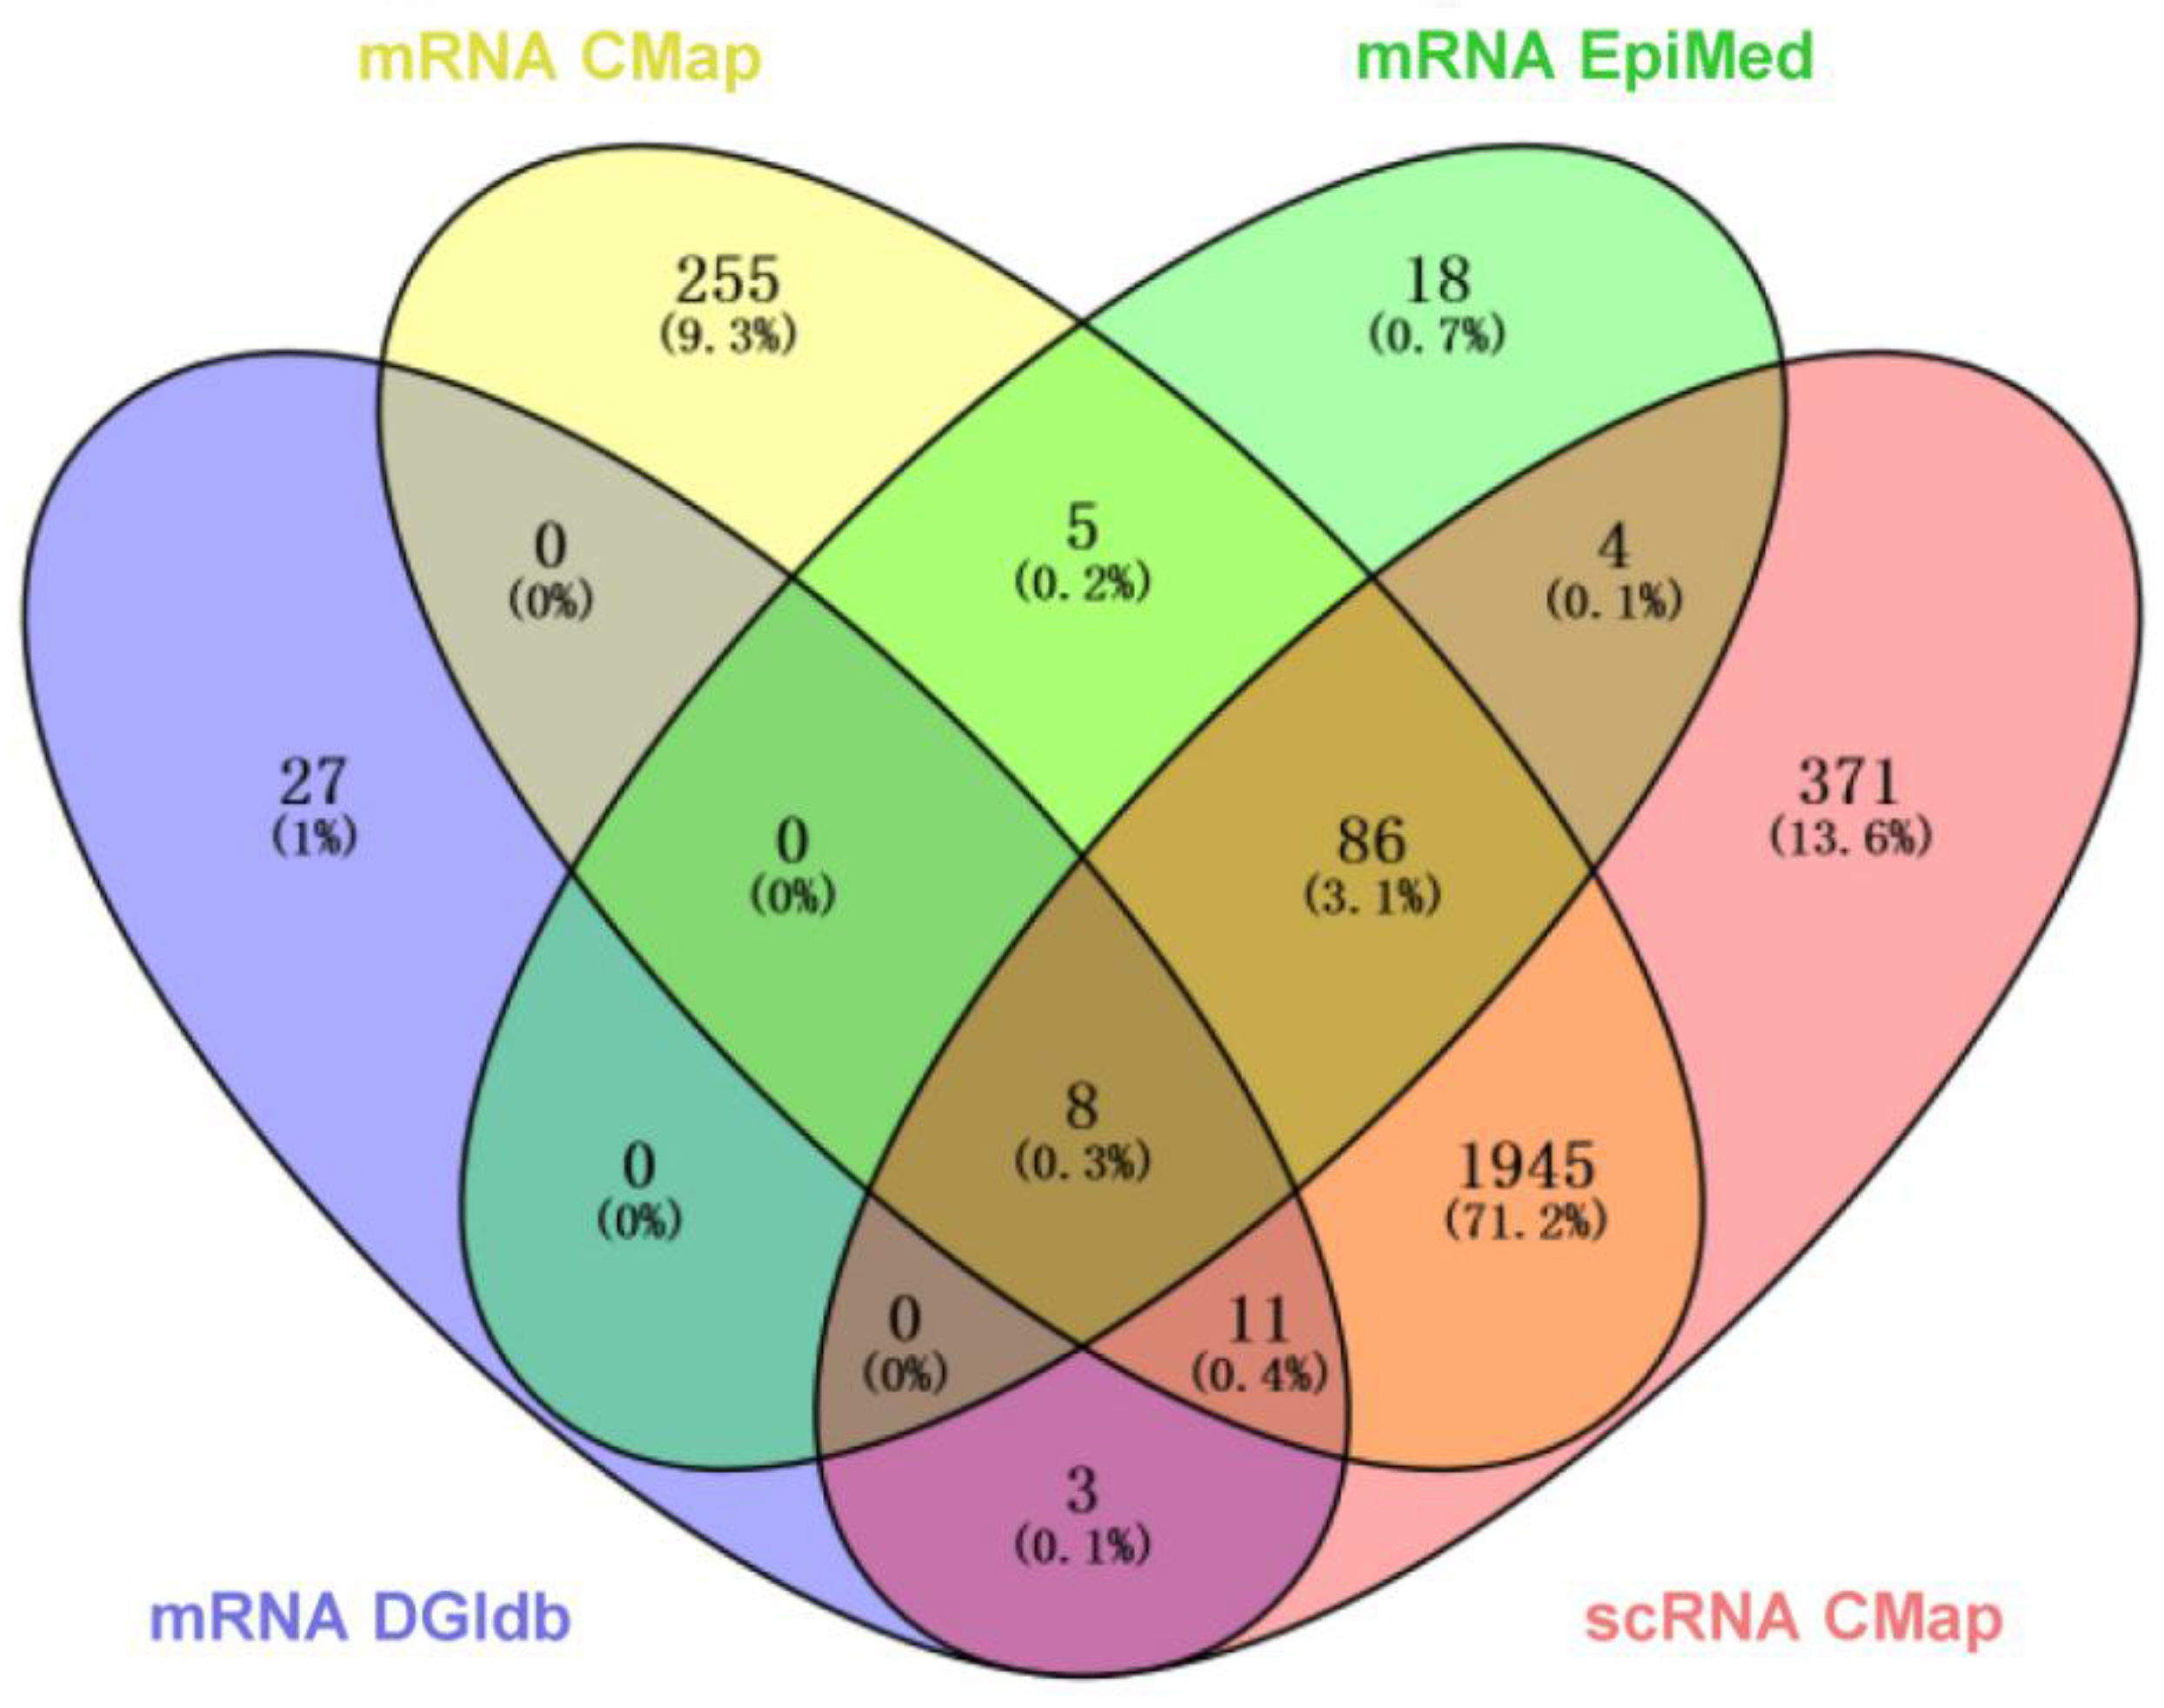
Figure 7.
MD results of DIP, LEF, and PTX binding with CXCL8 and hsa-miR-23a-3p.(a) Binding energy heatmap showing the interaction energies of DIP, LEF, and PTX with CXCL8 and hsa-miR-23a-3p.(b) Binding mode of DIP with CXCL8.(c) Binding mode of LEF with CXCL8.(d) Binding mode of PTX with CXCL8.(e) Binding mode of DIP with hsa-miR-23a-3p.(f) Binding mode of LEF with hsa-miR-23a-3p.(g) Binding mode of PTX with hsa-miR-23a-3p.The left panel showing the overall interaction, the middle panel highlighting the detailed binding mode, and the right panel focusing on key hydrogen bond interaction sites.
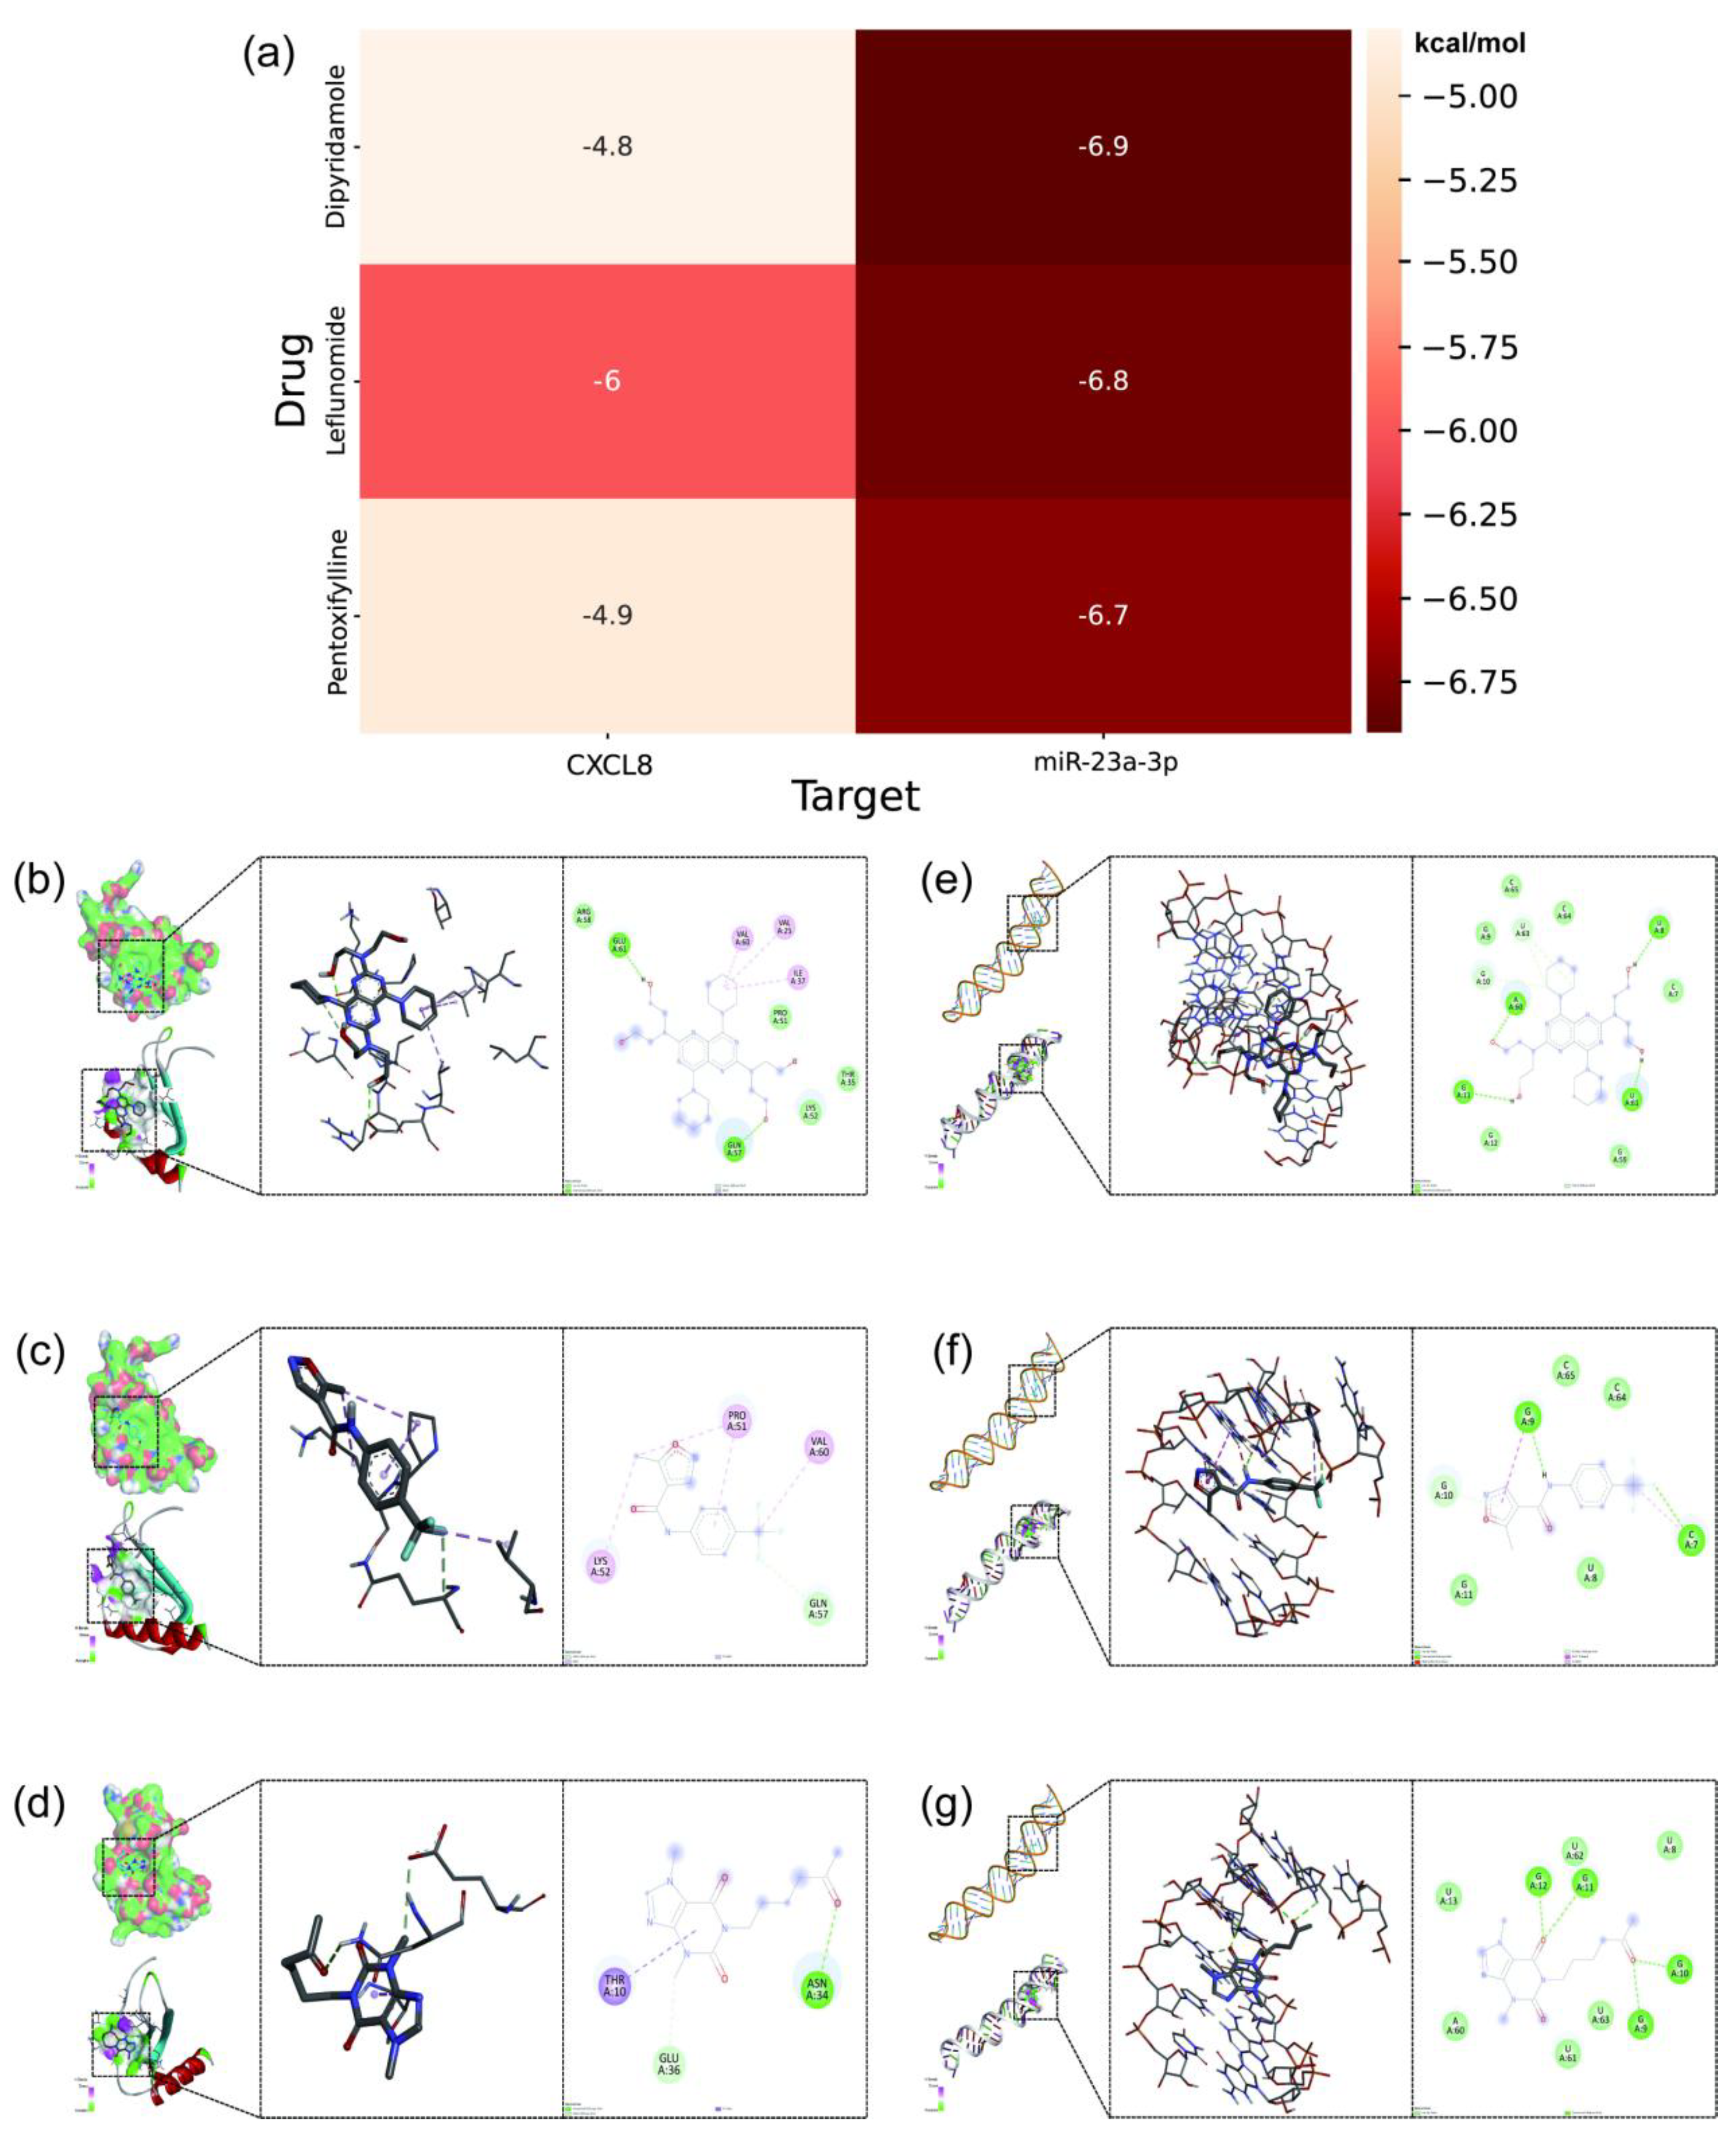
Figure 9.
MDS results of the DIP, LEF, and PTX-CXCL8 complexes. (a) RMSD, RMSF, Rg, SASA, Hydrogen Bonds, Interatomic Distance and FEL of the DIP-CXCL8 complex. (b) RMSD, RMSF, Rg, SASA, Hydrogen Bonds, Interatomic Distance and FEL of the LEF-CXCL8 complex. (c) RMSD, RMSF, Rg, SASA, Hydrogen Bonds, Interatomic Distance and FEL of the PTX-CXCL8 complex. Each group displays the system stability, flexibility changes, conformational compactness, and energy distribution characteristics.
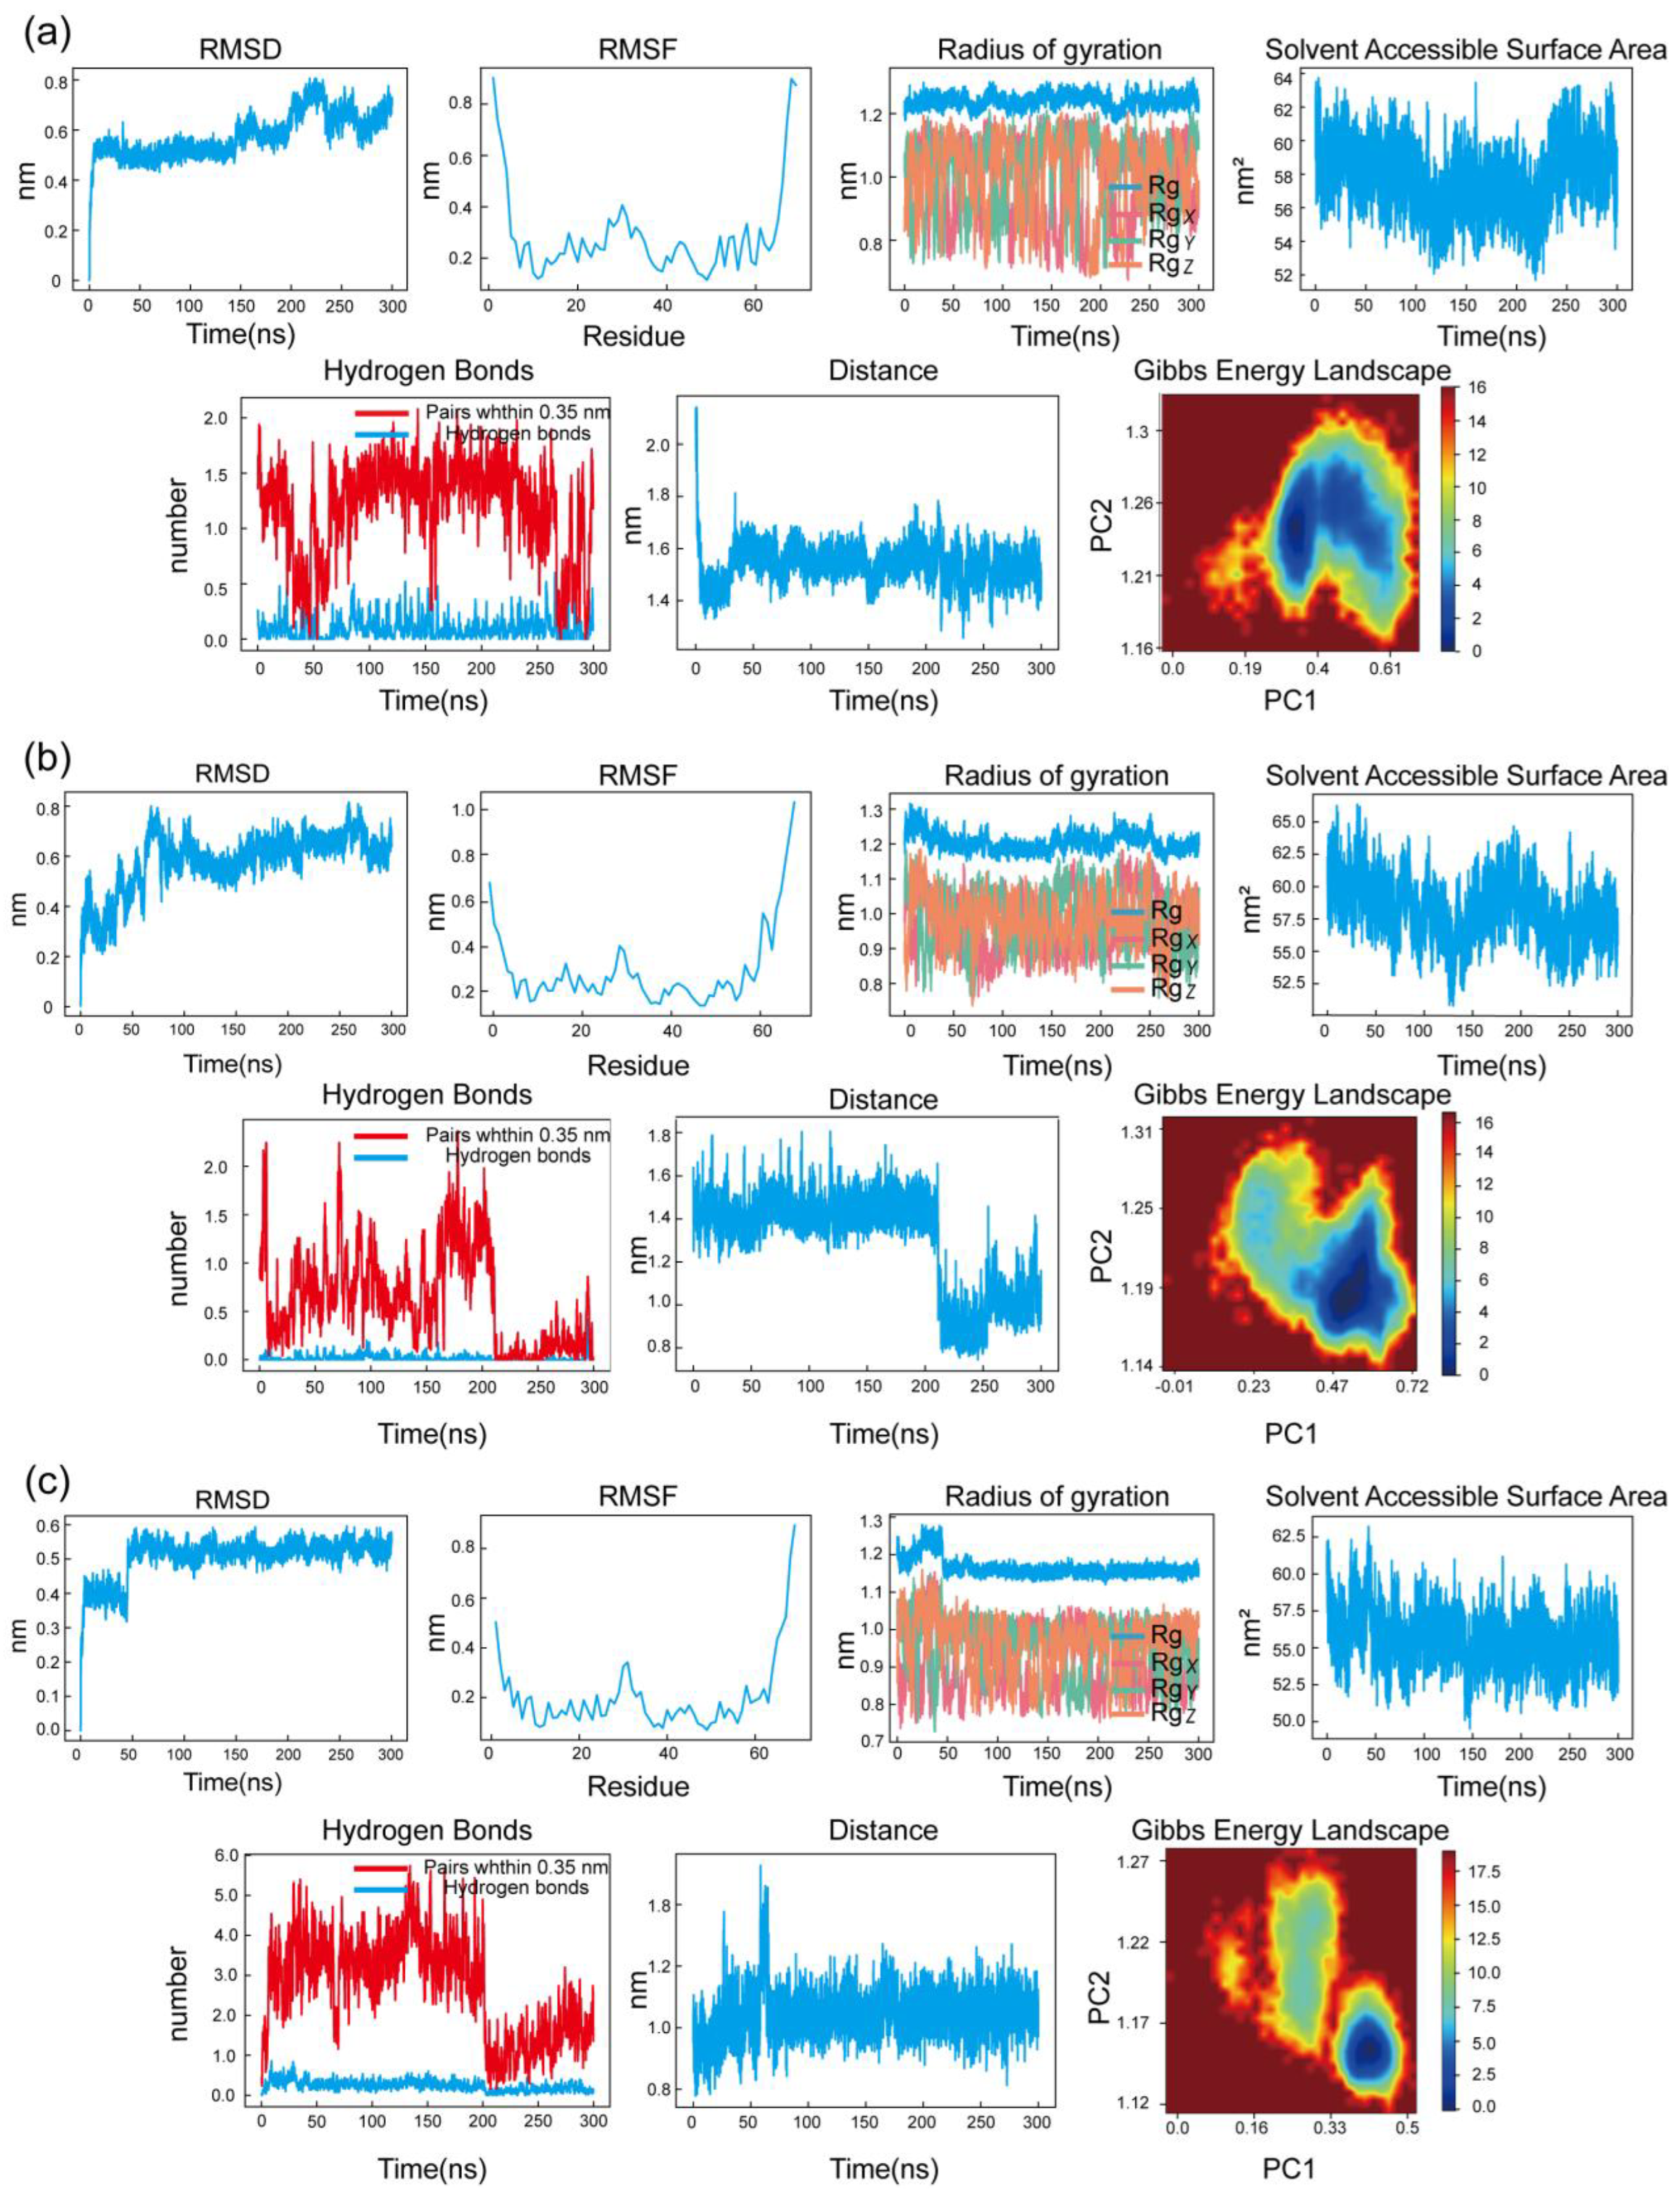
Figure 9.
Binding free energy profiles of CXCL8 complexes obtained from MM-PBSA analysis. (a) DIP–CXCL8 complex, (b) LEF–CXCL8 complex, and (c) PTX–CXCL8 complex. The blue lines represent the time-dependent variations in binding free energy (ΔG) over the 300 ns simulation, while the red dashed lines indicate the corresponding average binding free energy values for each complex.
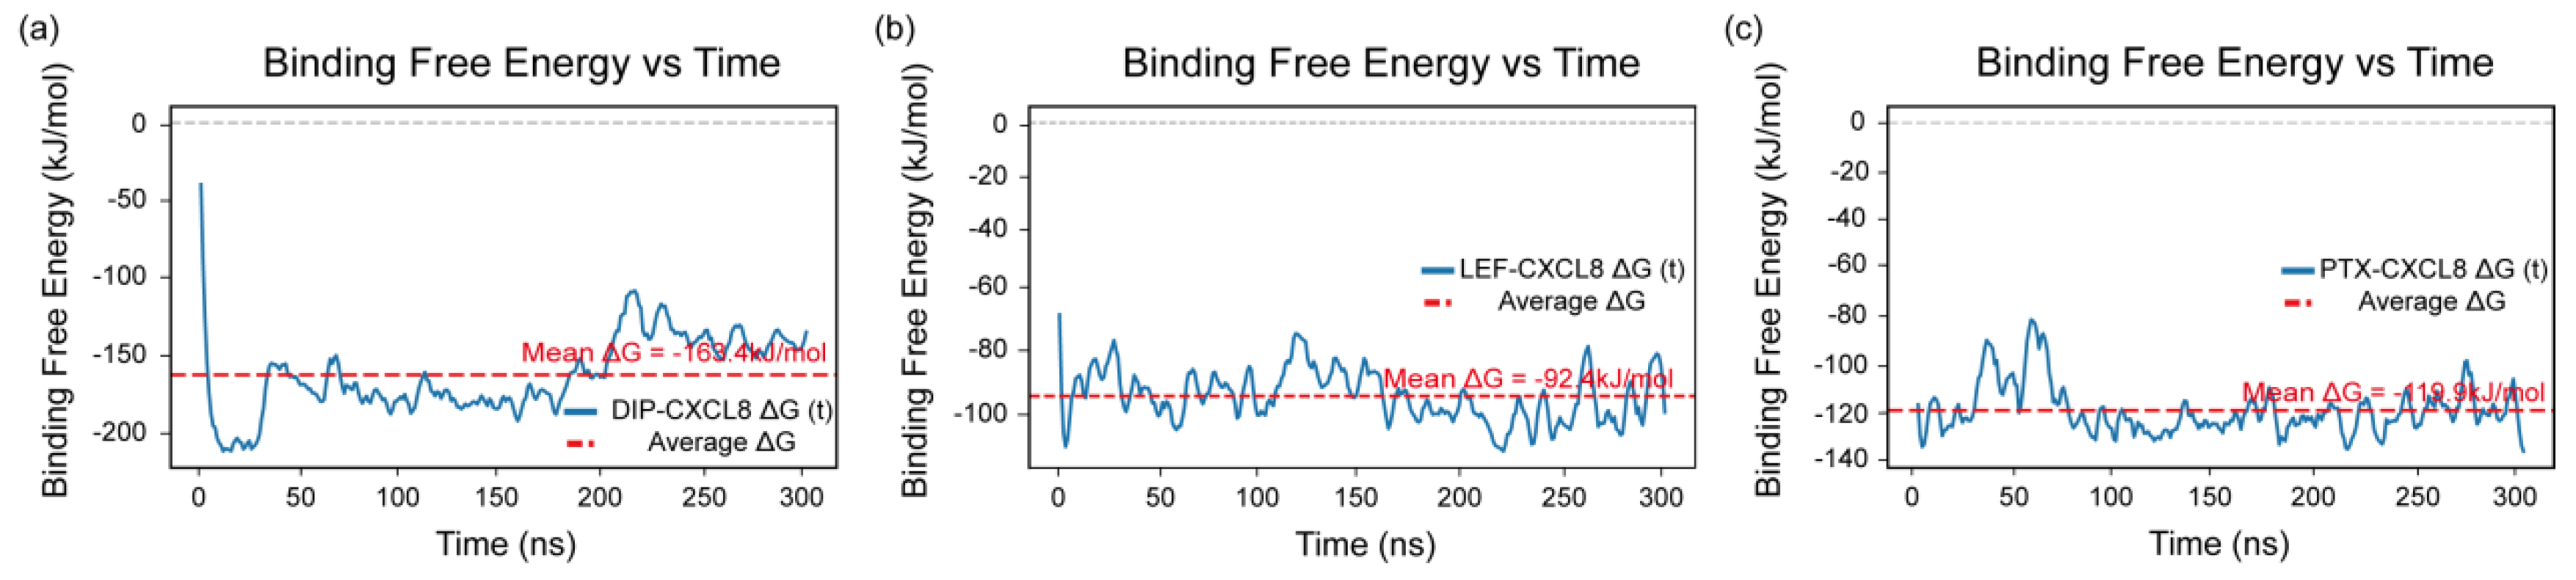
Figure 10.
Cell viability of PIGA-KO cells treated with DIP, LEF, and PTX at various concentrations and time points.(a–c) Cell viability after exposure to different concentrations of DIP, LEF, and PTX for 24 h, 48 h, and 72 h, respectively.(d–f) Comparison of time-dependent cytotoxic effects for each compound. The bottom panels illustrate the corresponding log-transformed IC₅₀ curves for (d) DIP, (e) LEF, and (f) PTX, showing a concentration- and time-dependent reduction in cell viability.
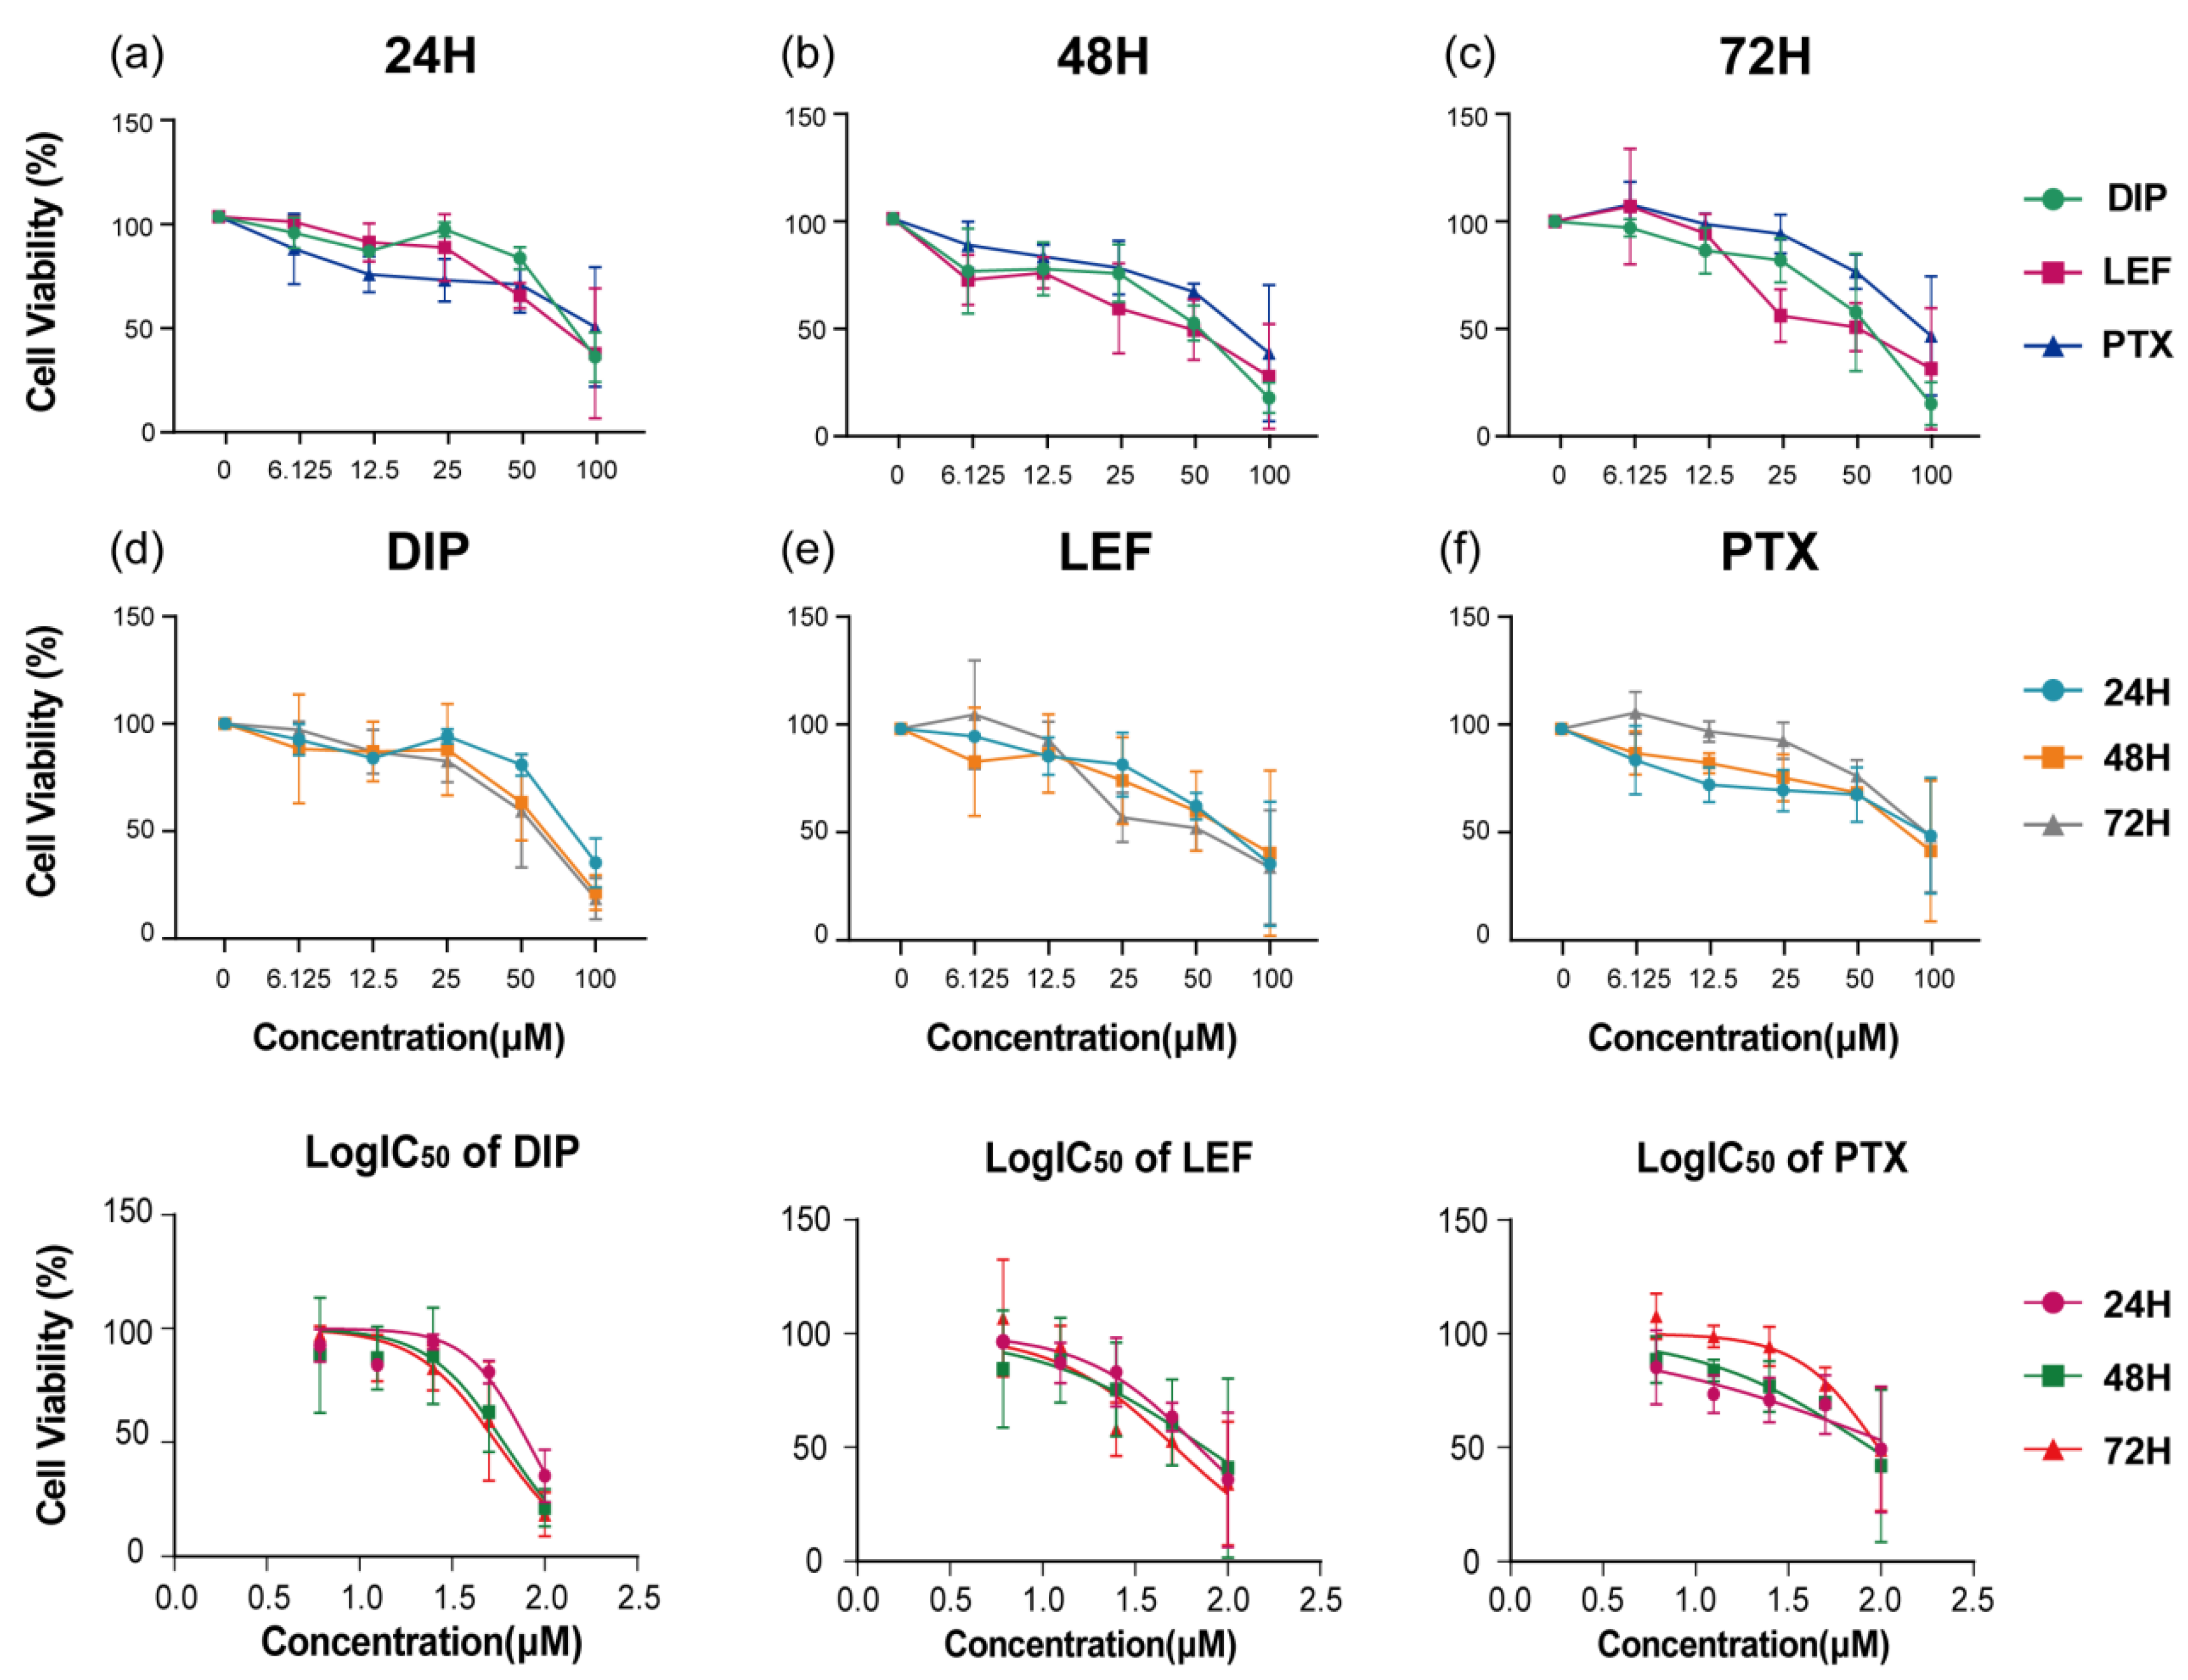

Table 1.
Node Information and Regulatory Directions in the miRNA-mRNA Regulatory Network.
| miRNA | Target gene | Regulatory direction of miRNA |
|---|---|---|
| hsa-miR-129-1-3p | BDKRB2 | up |
| hsa-miR-143-3p | HK2 HRAS | up |
| hsa-miR-181d-5p | HRAS | up |
| hsa-miR-193a-3p | CCND1 | up |
| hsa-miR-193a-5p | IGF2BP1 | up |
| hsa-miR-22-5p | GSDMD | up |
| hsa-miR-23a-3p | CXCL12 CXCL8 HES1 TRAF5 | up |
| hsa-miR-34b-3p | CCND1 | up |
| hsa-miR-365a-3p | CCND1 | up |
| hsa-miR-95-3p | CCND1 | up |
| hsa-miR-144-5p | MET | down |
| hsa-miR-146b-5p | A2M EGFR ERBB4 | down |
| hsa-miR-151a-3p | TWIST1 | down |
| hsa-miR-182-5p | ADCY6 ARRDC3 CCND2 PDK4 THBS1 | down |
| hsa-miR-183-5p | EGR1 | down |
| hsa-miR-216b-5p | KRAS | down |
| hsa-miR-217-5p | KRAS | down |
| hsa-miR-224-5p | DNM1L FOSB RASSF8 TRIB1 | down |
| hsa-miR-30a-3p | CCN1 THBS1 | down |
| hsa-miR-30c-1-3p | NR1I2 | down |
| hsa-miR-30c-5p | CAMK2D CCN2 CCND2 | down |
| hsa-miR-34a-5p | ANK3 AXL KIT KLF12 LEF1 MET NR4A2 | down |
| hsa-miR-484 | KLF12 | down |
| hsa-miR-506-3p | BCAT1 | down |
| hsa-miR-509-3p | MAP3K8 | down |
| hsa-miR-96-5p | ADCY6 KRAS | down |
Table 2.
Intersection of drugs from drug sets A, B, C, and D.
| Drug name | CID | Pharmacological Class | Target gene |
|---|---|---|---|
| Prednisone | 5865 | Glucocorticoid | CXCL12 |
| Tretinoin | 444795 | Retinoid | HES1、CXCL8 |
| Dipyridamole | 3108 | Antiplatelet | CXCL8 |
| Danazol | 28417 | Androgen | CXCL8 |
| Pentoxifylline | 4740 | Vasodilator | CXCL8 |
| Leflunomide | 3899 | Immunosuppressant | CXCL8 |
| Colchicine | 6167 | Anti-inflammatory | CXCL8 |
| Paclitaxel | 36314 | Chemotherapeutic | CXCL8 |
Disclaimer/Publisher’s Note: The statements, opinions and data contained in all publications are solely those of the individual author(s) and contributor(s) and not of MDPI and/or the editor(s). MDPI and/or the editor(s) disclaim responsibility for any injury to people or property resulting from any ideas, methods, instructions or products referred to in the content. |
© 2025 by the authors. Licensee MDPI, Basel, Switzerland. This article is an open access article distributed under the terms and conditions of the Creative Commons Attribution (CC BY) license (http://creativecommons.org/licenses/by/4.0/).
Copyright: This open access article is published under a Creative Commons CC BY 4.0 license, which permit the free download, distribution, and reuse, provided that the author and preprint are cited in any reuse.


