
Submitted:
17 December 2025
Posted:
18 December 2025
You are already at the latest version
Abstract
The ground impedance (insulation resistance Risol) of photovoltaic (PV) modules is usually measured only in the dry state, even though arrays frequently operate under dew-wet or rain-wet conditions, when leakage paths can change. We measured dry insulation resistance Rdry and IEC 61215 MQT 15 wet leakage resistance Rwet for N = 37 field-aged crystalline-silicon modules from utility-scale plants and related the results to the IEC 40 MΩ·m² criterion (Rwet·A ≥ 40). The measurements used 1000 V DC and a 2 min dwell; Rwet was obtained in a salted bath with a solution resistivity < 3500 Ω·cm. The median Rdry was 42.4 GΩ, whereas the median Rwet was 462.5 MΩ, resulting in a median Rdry/Rwet ratio of ~110×. Three modules (8.1%) failed the 40 MΩ·m² limit already in the dry state, whereas eight modules (21.6%) failed under IEC-wet conditions; five were dry-pass/wet-fail cases that would have passed dry screening. For a representative area A = 1.8 m², a practical conservative dry triage threshold of approximately 55.5 GΩ identifies modules needing IEC-wet verification rather than serving as a stand-alone limit. Overall, combining dry and IEC-wet measurements improves safety and supports sustainability through resource-efficient repowering/revamping and end-of-life decisions in large PV fleets, particularly in hot climates.
Keywords:
photovoltaics
; insulation resistance/ground impedance
; IEC 61215
; MQT 15
; wet leakage
; dew
; repowering/revamping
; reliability
; sustainability
1. Introduction
The long-term safety and reliability of photovoltaic (PV) modules are essential for the performance and sustainability of large-scale PV installations. A key parameter in this context is the insulation resistance Risol between the DC circuits and accessible conductive parts or ground. If Risol becomes too low, leakage currents increase, ground-fault detection may trigger frequent trips, and in extreme cases, safety hazards for personnel and the public can arise. In routine practice, Risol is usually assessed only in the dry state with an ohmmeter at several hundred volts to 1000 V DC, and the measured values are compared with acceptance criteria derived from IEC 61215, often expressed as a minimum resistance or a resistance–area product [1].
However, real PV modules in the field frequently operate under dew-wet, fog-wet or rain-wet conditions, especially in the early morning, when radiative cooling causes the front glass to fall below the ambient temperature and the dew point. Under such conditions, leakage paths along the glass surface, frame, edges, junction box and backsheet can differ substantially from those under dry conditions, and wet insulation resistance can be far lower than dry values [2,3,4,5]. The IEC 61215 MQT 15 wet leakage current test was designed to represent these wet operating conditions. In this test, a module is immersed in a conductive solution and biased at DC voltage; for modules larger than 0.1 m², the product Rwet × A must be at least 40 MΩ·m² to pass [1].
Several studies have examined how insulation resistance depends on humidity, temperature and system voltage. Hernández et al. [2] linked array insulation resistance to environmental conditions and string voltage, showing that water ingress and surface wetting can significantly reduce Risol at typical operating voltages. Roy [3] modeled leakage through encapsulant–backsheet stacks, highlighting the role of water uptake, ion transport and the Arrhenius-type temperature dependence. Buerhop et al. [4] studied the development of wet leakage resistance for different backsheet types and demonstrated that some fluoropolymer-free backsheet constructions exhibit pronounced decreases in wet resistance with field exposure, leading to ground-impedance issues at inverters. Ketjoy et al. [5] investigated flooded PV modules and confirmed the strong impact of moisture pathways on wet leakage behavior. Backsheet--related insulation issues in multi-megawatt plants and their spectroscopic identification have been described in further detail in [6,7,8].
Beyond immediate safety, wet insulation resistance has implications for circularity and end-of-life strategies. Environmentally sustainable methods for recycling PV panels laminated with soft polysiloxane gels have been demonstrated, enabling mechanical delamination without burning or aggressive chemicals [9]. Other works have analyzed PV panel and inverter damage due to water penetration [10] and examined the effects of backsheet repairs on insulation resistance [11]. Broader reviews addressing PV end-of-life management and recycling from a sustainability perspective, including economic and process-related aspects, are provided in [12,13,14,15]. Together, these developments highlight the need to characterize insulation behavior under realistic wet conditions as part of a sustainable strategy for PV asset management.
At the same time, global PV deployment is increasingly concentrated in high-irradiance regions with very low levelised cost of electricity (LCOE), where partial repowering/revamping—replacement of older or underperforming modules with newer technology after 5–10 years—can be economically attractive [16,17,18,19,20]. In the following, we use the term repowering in a broad sense that also covers “revamping” concepts in which only part of the installed capacity is renewed while much of the existing infrastructure remains in place. In such markets, reliable insulation-resistance data under realistic wet conditions are relevant not only for immediate safety but also for asset-management and the end-of-life decisions: whether modules can be kept in service, should be replaced in repowering campaigns, or directed to advanced recycling routes [9,12,13,14,15].
In this work, we address these questions by systematically comparing dry and IEC-wet insulation resistance for a set of field-aged crystalline-silicon modules. Specifically, we
- quantify the relationship between dry (Rdry) and IEC-wet (Rwet) ground impedance (insulation resistance) for N = 37 field-aged modules;
- document the occurrence of dry-pass/wet-fail modules that meet dry criteria but fail the IEC 40 MΩ·m² wet criterion;
- derive a dry-test threshold that can serve as a conservative screening indicator for potential IEC-wet failure;
- How dry and wet insulation measurements can support safer operation, repowering/revamping and contributing to sustainable PV fleet management and sustainability-oriented end-of-life strategies should be discussed.
2. Materials and Methods
2.1. Samples
We analyzed N = 37 field-aged crystalline-silicon PV modules originating from utility-scale plants operating in a very moderate Central European climate (Slovakia). To preserve the anonymity of suppliers and sites, module types are denoted by internal IDs. For each module, we recorded
- module ID (internal),
- wet insulation resistance R_wet with unit (kΩ, MΩ, GΩ or catastrophic 0 Ω),
- dry insulation resistance R_dry with unit,
- ratio Rdry/Rwet (dimensionless).
2.2. Dry Insulation Resistance Measurements
The dry insulation resistance Rdry was measured at 1000 V DC using a calibrated insulation tester. Measurements were performed under ambient laboratory conditions (22 ± 2 °C, relative humidity 40–60%), and the modules were electrically isolated from the ground except through the tester.
For each module, the positive terminal of the tester was connected to the interconnected string of cells (short-circuited together), whereas the negative terminal was connected to the aluminum frame. After ramping to 1000 V, the voltage was held for a dwell time of 2 min, and the insulation resistance was then recorded.
For comparison with the IEC criteria, we computed the resistance–area product Rdry × A and compared it with 40 MΩ·m² for typical module areas A = 1.6–2.0 m². In practical applications, the exact module area should be used [1].
2.3. IEC 61215 MQT 15 Wet Leakage Test
The wet insulation resistance Rwet was measured following the MQT 15 wet leakage current test in IEC 61215 [1]. The test setup is illustrated schematically in Figure 1, and a photograph of the laboratory installation is shown in Figure 2. A non-conductive polypropylene (PP) tank equipped with a stainless- steel mesh electrode was filled with saltwater such that the solution resistivity remained below 3500 Ω·cm. The laboratory temperature was maintained at 22 ± 2 °C.
Each module was placed horizontally and immersed so that the front glass and frame were fully in contact with the solution; the junction box and cables were also wetted with the same solution by spraying. The module’s output leads were short-circuited and connected to the positive terminal of the insulation tester, whereas the negative terminal was connected to the bath electrode. A DC voltage of 1000 V was applied, and after a 2 min dwell time, the insulation resistance Rwet was recorded. After each test, the module was discharged by briefly short-circuiting the leads to the frame.
For modules with areas A > 0.1 m², the IEC acceptance criterion is as follows:
In this study, a representative area A = 1.8 m² is used to derive illustrative thresholds; in real applications, the actual module area should be used.
2.4. Data analysis and Dry-Test Threshold
For each module, we computed the ratio
(using MΩ units), which captures the magnitude of the dry-to-wet drop in insulation resistance. We also classified each module as passing or failing with respect to the IEC 40 MΩ·m² criterion for assumed areas A = 1.6, 1.8 and 2.0 m².
To derive a practical dry-test threshold usable as a simple screening rule, we considered A = 1.8 m² and scanned candidate thresholds T on Rdry. For each threshold, modules with Rdry < T were flagged as “at risk”, and we computed
- Sensitivity: fraction of IEC-wet-failing modules correctly flagged as at risk;
- Specificity: fraction of IEC-wet-passing modules correctly not flagged.
Sensitivity and specificity curves as a function of T were used to illustrate the trade-off between conservatism and false alarms.
3. Results
3.1. Dry Versus IEC-Wet Insulation Resistance and Ratio Distributions
Across the N = 37 modules, the median wet insulation resistance Rwet was 462.5 MΩ, whereas the median dry resistance Rdry was 42.4 GΩ. Thus, at the median, the dry measurement overestimates the wet resistance by a factor of approximately 110. The median ratio Rdry/Rwet was 109.7×, with a mean ratio of 543.5×, indicating a strongly skewed distribution with a long tail toward very large dry‒wet drops. Several modules exhibit ratios above 200, and five modules (Panels 11, 15, 16, 22 and 28) show catastrophic wet behavior with Rwet ≈ 0 Ω, i.e., complete loss of insulation under wet conditions.
To visualize the modulewise behavior of the dry and IEC-wet insulation resistance, Figure 3 shows the Rdry and Rwet values for each module on a logarithmic MΩ scale. The modules with finite Rwet values are sorted along the x-axis by increasing the IEC-wet resistance, and the corresponding dry resistance is shown for the same modules. For every module in the plot, Rdry clearly exceeds Rwet, typically by one to two orders of magnitude, confirming that dry measurements systematically overestimate the insulation level that is relevant under wet operating conditions. The lowest Rwet values cluster well below 100 MΩ, whereas most Rdry values remain in the 104–105 MΩ range. Modules with Rwet ≈ 0 Ω cannot be shown on the logarithmic axis and are therefore omitted from Figure 2 but are included in the statistical analysis.
To summarize the ratio Rdry/Rwet in an intuitive way and explicitly include the modules with R_wet = 0 Ω, the ratios were grouped into five categories: 0 (Rwet = 0 Ω), 0–1, 1–10, 10–100 and 100–1000. The resulting categorical histogram is shown in Figure 4. Five modules fall into the “0 (Rwet = 0 Ω)” bin, two modules fall into the 0–1 bin (Rdry < Rwet), one module falls into the 1–10 bin, and 14 and 15 modules fall into the 10–100 and 100–1000 bins, respectively. Thus, most modules exhibit dry-to-wet drops exceeding one order of magnitude, and many exceed two orders of magnitude. This skewed distribution underlies the failure statistics discussed in Section 3.2, where three modules fail the dry 40 MΩ·m² criterion and eight modules fail the IEC-wet criterion, with five modules showing dry-pass/wet-fail behavior.
3.2. Compliance with the IEC 40 MΩ·m² Criterion and Dry-Pass/Wet-Fail Cases
For typical module areas A = 1.6, 1.8 and 2.0 m², the 40 MΩ·m² criterion translates into wet-resistance limits of 25.0 MΩ, 22.2 MΩ and 20.0 MΩ, respectively. Using A = 1.8 m² as an example, our dataset yields
- IEC-wet-pass modules: 29 modules;
- IEC-wet-fail modules: 8 modules (21.6% of the set);
- Dry-fail modules: 3 modules already below 22.2 MΩ in the dry state;
- Dry-pass/wet-fail modules: 5 modules that meet the dry criterion but fail the IEC-wet limit.
The summary statistics are listed in Table 2, and the IEC-wet pass/fail statistics are given in Table 3.
Thus, relying on dry insulation resistance alone would have allowed five unsafe modules out of 37 (13.5%) to pass—the dry-pass/wet-fail population. In a large plant with tens of thousands of modules, this fraction could translate into hundreds of problematic units, with an increased risk of ground-fault trips and safety issues [2,4,10].
Figure 5 shows Rdry versus Rwet on logarithmic axes for all the modules with finite Rwet. The crosses indicate modules that pass the IEC-wet criterion, whereas the squares indicate IEC-wet failure. The diagonal line is Rdry = Rwet, and the horizontal line is the IEC-wet limit Rwet = 40/A for A = 1.8 m². All the modules lie well above the diagonal, confirming that Rdry > Rwet for every module with a finite Rwet. The vast majority also lie above the horizontal IEC-wet limit. However, the five dry-pass/wet-fail modules have high Rdry values but lie below the IEC-wet limit, thus failing the wet criterion despite acceptable dry behavior.
3.3. Practical Dry-Test Threshold
For A = 1.8 m², the modules were labeled IEC-wet-fail if Rwet × A < 40 MΩ·m². On the basis of this classification, we scanned candidate dry thresholds T and flagged modules with Rdry < T as “at risk”. For each threshold, we computed the sensitivity (fraction of IEC-wet-failing modules correctly flagged) and specificity (fraction of IEC-wet-passing modules correctly not flagged).
Figure 6 shows the sensitivity and specificity versus T on a logarithmic x-axis, together with a vertical line at T ≈ 55.5 GΩ (55 500 MΩ). As T increases from low values, the sensitivity rapidly approaches unity, meaning that virtually all the IEC-wet-failing modules are captured as at risk. Moreover, the specificity decreases because an increasing fraction of IEC-wet-passing modules is also flagged.
At T ≈ 55.5 GΩ, the sensitivity in our dataset is high (six of eight IEC-wet-failing modules are correctly flagged), whereas the specificity is low (only a minority of IEC-wet-passing modules correctly not flagged). This threshold is therefore deliberately conservative: it minimizes the likelihood of missing an IEC-wet failure at the expense of flagging many IEC-wet-passing modules. It is best understood as a triage indicator for prioritizing modules for IEC-wet verification rather than as a stand-alone pass/fail criterion.
4. Discussion
4.1. Dew, Wet Conditions and Leakage Mechanisms
The strong dry-to-wet drop in Risol observed in this work is consistent with the physical and electrochemical understanding of wet leakage in PV modules [2,3,4,5]. Glass-covered modules with high infrared emissivity radiate thermal energy to the night sky and can cool below the ambient temperature and the dew point, causing dew to form readily on the front glass, at frame edges and at mounting interfaces. Thin water films and droplets create additional conductive pathways, lower surface resistivity, facilitate ionic transport into micro-cracks, and degrade backsheets and encapsulant interfaces. In combination with pre-existing material degradation, such moisture-assisted pathways can reduce insulation resistance by several orders of magnitude compared with dry conditions. Our measurements confirm this behavior: dry measurements overestimate wet insulation resistance by roughly two orders of magnitude at the median, and in several cases, wet failures are catastrophic (Rwet ≈ 0 Ω).
A useful analogy is provided by the Namib desert beetle, whose elytra combine high infrared emissivity with a micro-textured surface that promotes preferential condensation in the valleys between bumps. Figure 7 schematically illustrates this “valley condensation” mechanism. In a similar way, dew on PV modules tends to accumulate in regions with favorable micro-geometry and thermal coupling—such as frame edges, cell cut-outs and backsheet irregularities—forming localized water films and droplets that effectively shorten leakage paths to grounded metal parts and promote electrochemical reactions in polymeric components, thereby accelerating long-term degradation.
From a system perspective, the most critical combination of conditions typically occurs around sunrise. After a long, humid night, modules often exhibit their highest surface moisture and thus their lowest insulation resistance, while at the same time, the module and cell temperatures are at their minimum, and the open-circuit voltage of the DC system is near its daily maximum. Consequently, many insulation-resistance alarms and ground-fault trips in operating plants are observed shortly after sunrise rather than at midday, when modules are warmer and partially dry [2,3,4,5,10]. The coexistence of high system voltage and low Risol helps explain why even a relatively small fraction of dry-pass/wet-fail modules, or a handful of catastrophic wet failures, can disproportionately affect plant-level protection systems.
Taken together, these considerations emphasize that wet insulation resistance is not an exceptional or extreme state but rather a regular operating condition during many mornings of the year across a wide range of climates, including a hot desert climate. IEC-conformant wet testing therefore mirrors real-world conditions far more closely than dry testing alone does and provides information directly relevant for safety assessments, O&M strategies and repowering decisions at the system level.
4.2. Implications for Testing Strategies of Field-Aged Modules
At present, IEC 61215 MQT 15 is mainly applied for type approval of new products, whereas field-aged modules in operating plants and secondary markets are rarely subjected to IEC-conformant wet testing. Our results suggest several practical implications for testing strategies.
First, dry-only testing is insufficient to guarantee safety. In this moderate dataset, three modules (8.1%) already fail the IEC criterion in the dry state, but eight modules (21.6%) fail under IEC-wet conditions, including five dry-pass/wet-fail cases. In utility-scale plants, similar fractions correspond to many hundreds of problematic modules and could lead to nuisance trips or safety incidents [2,4,10].
Second, IEC-wet testing should be considered for field-aged modules, at least on a sampling basis, in climates with frequent dew or heavy precipitation, in hot desert climates with morning dew and in plants where backsheet-driven insulation issues are suspected [4,6,7,8]. IEC-wet tests capture leakage paths that only form under wet operation and reveal catastrophic failures that dry tests miss.
Third, the proposed dry threshold of ≈55.5 GΩ (for A = 1.8 m²) can be used as a conservative screening indicator: modules with Rdry values below this threshold are prioritized for IEC-wet verification and detailed inspection, whereas modules with higher Rdry values are lower priority. Thresholds can be adapted to fleet- specific data, risk tolerance and available testing capacity.
Fourth, for new plants, operators may consider incorporating insulation-resistance monitoring and periodic wet testing into their operation and maintenance strategies, especially for module designs and backsheet materials known to show strong wet-resistance degradation [4,6,7,8].
In summary, integrating IEC-type wet testing into the toolkit for field-aged modules can significantly improve the robustness of safety assessments while still using dry measurements as a fast first-line screening tool. The key quantitative message is the contrast between 3 dry failures and 8 wet failures, including 5 dry-pass/wet-fail modules, in what might otherwise appear to be a healthy population.
4.3. Repowering/Revamping Decisions and End-Of-Life Management
In high-irradiance regions with very low PV LCOE, partial repowering/revamping—replacing older modules with newer technology after 5–10 years—can be economically attractive [16,17,18,19,20]. Case studies of premature field failure have shown that the effective service life can be limited to only 3–6 years for some material combinations because of issues such as potential-induced degradation (PID), delamination, moisture ingress or early-generation polyamide backsheets [6,7,8,19,20]. In these situations, early module replacement in a repowering strategy can restore plant performance and extend system lifetime.
The wet insulation resistance provides an additional decision parameter in this context:
- modules that pass both dry and IEC-wet tests and show acceptable power output can be kept in service until performance degradation or mechanical wear justifies replacement;
- modules that fail the IEC-wet criterion or exhibit catastrophic wet behavior (Rwet ≈ 0 Ω) represent a safety and reliability risk, even if their dry resistance remains high; these modules should be prioritized for replacement during repowering campaigns;
- By combining dry thresholds (e.g., 55.5 GΩ) with IEC-wet tests, operators can identify sub-arrays or module batches that merit priority replacement versus those that can be retained or redeployed in less demanding applications (e.g., low-voltage systems with enhanced protection).
From a sustainability perspective, repowering/revamping decisions and the end-of-life management are tightly linked. Modules removed for safety reasons or as part of repowering campaigns can be directed to advanced and sustainable recycling processes, supporting circular-economy objectives while reducing environmental impact [9,12,13,14,15]. In sunny and hot climates with annual specific yields of up to approximately 1800 kWh/kW, the return on investment (ROI) can be shorter than five years [16,17,18]. In such contexts, repowering or revamping within 5–7 years can be economically feasible, and reliable wet-insulation-resistance data help ensure that sustainability considerations are fully integrated into technical and financial decision-making.
5. Conclusions
We measured the dry and IEC-wet insulation resistance of 37 field-aged crystalline-silicon PV modules and used these data to evaluate the adequacy of dry-only testing and to explore implications for repowering/revamping and sustainable PV deployment and asset management. The main conclusions are as follows:
- Dry measurements can strongly overestimate wet insulation resistance. The median ratio Rdry/Rwet is ≈110×, with a long high-ratio tail where some modules show drops of more than two orders of magnitude, and several modules exhibit catastrophic wet behavior with Rwet ≈ 0 Ω.
- Dry-only testing can miss wet-insulation failures. In this dataset, three modules fail the IEC 40 MΩ·m² criterion in the dry state, whereas eight modules fail under IEC-wet conditions. Five of the wet-failing modules are dry-pass/wet-fail cases, demonstrating that dry-only testing is not sufficient to ensure compliance under wet operation.
- A conservative dry-test threshold of approximately 55.5 GΩ (for A = 1.8 m²) provides high sensitivity but low specificity for predicting IEC-wet failure. This threshold is best used as a triage indicator to prioritize modules for IEC-wet verification and closer inspection rather than as a stand-alone acceptance criterion within a testing and risk-management strategy.
- IEC-conformant wet testing of field-aged modules—at least on a sampling basis—should be considered in climates with frequent dew or heavy precipitation, in hot desert climates with morning dew and where backsheet-related insulation problems are suspected [2,3,4,5,6,7,8] as part of sustainable operation and maintenance practices.
- Wet insulation resistance is highly relevant for the end- of- life decisions of PV panels and for repowering/revamping within 5–10 years, particularly in demanding hot climates. It helps identify modules that should be removed for safety reasons during repowering campaigns and directed to appropriate recycling routes [9,10,11,12,13,14,15], thereby aligning operational safety with a circular-economy and sustainability objectives.
The incorporation of wet insulation testing into the standard assessment of used and field-aged PV modules is therefore recommended as a practical step toward safer, more reliable and more sustainable PV deployment.
Author Contributions
Conceptualization, V.P.; methodology, V.P. and V.B.; investigation, V.P., V.B. and M.K.; formal analysis, T.F.; writing—original draft preparation, V.P. and T.F.; writing—review and editing, all authors. All the authors have read and agreed to the published version of the manuscript.
Funding
No funding.
Institutional Review Board Statement
Not applicable.
Informed Consent Statement
Not applicable.
Data Availability Statement
The cleaned dataset of dry and wet insulation resistance values, together with analysis scripts, is available from the corresponding author upon reasonable request.
Conflicts of Interest
The authors declare that they have no conflicts of interest.
References
- IEC 61215-2:2021; Terrestrial Photovoltaic (PV) Modules—Design Qualification and Type Approval—Part 2: Test Procedures (MQT 15: Wet Leakage Current Test). International Electrotechnical Commission: Geneva, Switzerland, 2021. Available online: https://webstore.iec.ch/en/publication/61350 (accessed on 7 December 2025).
- Hernández, J.C.; et al. Influence of Environmental Conditions on Insulation Resistance in PV Generators. Renew. Energy 2010, 35, 593–601. [Google Scholar] [CrossRef]
- Roy, J.N. Modeling Insulation Resistance of PV Modules under Different Temperatures and Humidity. Sol. Energy 2015, 120, 1–8. [Google Scholar] [CrossRef]
- Buerhop, C.; et al. Wet Leakage Resistance Development of Modules with Various Backsheet Types. Prog. Photovolt: Res. Appl. 2022, 30(8), 938–947. [Google Scholar] [CrossRef]
- Ketjoy, N.; et al. Field and Laboratory Investigation of Flooded PV Modules: Wet Leakage and Insulation Resistance. PLOS ONE 2022, 17(11), e0274839. [Google Scholar] [CrossRef]
- Buerhop-Lutz, C.; et al. PV Modules and Their Backsheets—A Case Study of a Multi-Megawatt PV Power Station. Sol. Energy Mater. Sol. Cells 2021, 230, 111295. [Google Scholar] [CrossRef]
- Lutz, C.B.; et al. Dynamics of Backsheet-Driven Insulation Issues in PV Power Plants. Sol. Energy Mater. Sol. Cells 2023, 259, 112398. [Google Scholar] [CrossRef]
- Stroyuk, O.; et al. Identification of the Backsheet Type of Silicon Photovoltaic Modules by Spectroscopic Methods. ACS Appl. Energy Mater. 2023, 6, 2573–2586. [Google Scholar] [CrossRef]
- Poulek, V.; Beranek, V.; Kozelka, M.; Finsterle, T. Environmentally Sustainable Recycling of Photovoltaic Panels Laminated with Soft Polysiloxane Gels: Promoting the Circular Economy and Reducing the Carbon Footprint. Sustainability 2025, 17(18), 8167. [Google Scholar] [CrossRef]
- Poulek, V.; et al. PV Inverter and Panel Damages Due to Water Penetration in PV Panels. IEEE J. Photovolt. 2021, 11, 1–9. [Google Scholar] [CrossRef]
- Finsterle, T.; Kasper, J.; Hrzina, P.; Knap, V.; Černá, L. The Effect of Backsheet Repairs on Insulation Resistance in Photovoltaic Modules. Monatsh. Chem. 2025, 156(5), 559–567. [Google Scholar] [CrossRef]
- Chiang, P.F.; et al. End-of-Life Management and Recycling of Photovoltaic Panels: A Review. Recycling 2024, 6(2), 22. [Google Scholar] [CrossRef]
- Gerold, E.; Antrekowitsch, H. Advancements and Challenges in Photovoltaic Cell Recycling: A Comprehensive Review. Sustainability 2024, 16, 2542. [Google Scholar] [CrossRef]
- Akhter, M.; et al. Sustainable Strategies for Crystalline Solar Cell Recycling. Sustainability 2024, 16, 5785. [Google Scholar] [CrossRef]
- Królicka, A.; Maj, A.; Łój, G. Promoting Sustainability in the Recycling of End-of-Life Photovoltaic Panels and Li-Ion Batteries Through LIBS-Assisted Waste Sorting. Sustainability 2025, 17(3), 838. [Google Scholar] [CrossRef]
- PVPS, IEA. Trends in Photovoltaic Applications 2025; International Energy Agency Photovoltaic Power Systems Programme: Paris, France, 2025. Available online: https://iea-pvps.org/wp-content/uploads/2025/10/IEA-PVPS_Trends_2025-.pdf (accessed on 7 December 2025).
- IRENA. Renewable Power Generation Costs in 2020; International Renewable Energy Agency: Abu Dhabi, UAE, 2021. Available online: https://www.irena.org/-/media/Files/IRENA/Agency/Publication/2021/Jun/IRENA_Power_Generation_Costs_2020.pdf (accessed on 7 December 2025).
- Fraunhofer, ISE. Photovoltaics Report; Fraunhofer Institute for Solar Energy Systems ISE: Freiburg, Germany, updated 31 October 2025. Available online: https://www.ise.fraunhofer.de/en/publications/studies/photovoltaics-report.html (accessed on 7 December 2025).
- Villena-Ruiz, R.; et al. Techno-Economic Assessment of PV Plant Repowering in Southern Europe. Energies 2021, 14, 1234. [Google Scholar] [CrossRef]
- Carvalho, J.P.; et al. Economic Assessment of PV Repowering Options in Europe. Energies 2022, 15, 8307. [Google Scholar] [CrossRef]
- Firman, A.; Cáceres, M.; González Mayans, A.R.; Vera, L.H. Schematic for the Wet Leakage Current Test (IEC 61215 MQT 15). Photovoltaic Qualification and Approval Tests; Standards 2022, 2, 136–156. [Google Scholar] [CrossRef]
- Guadarrama-Cetina, J.; et al. Dew Condensation on Desert Beetle Skin. Eur. Phys. J. E 2014, 37(11), 109. [Google Scholar] [CrossRef] [PubMed]
Figure 1.
Schematic diagram of the measurement circuit (adapted from Firman et al. [21]).
Figure 1.
Schematic diagram of the measurement circuit (adapted from Firman et al. [21]).
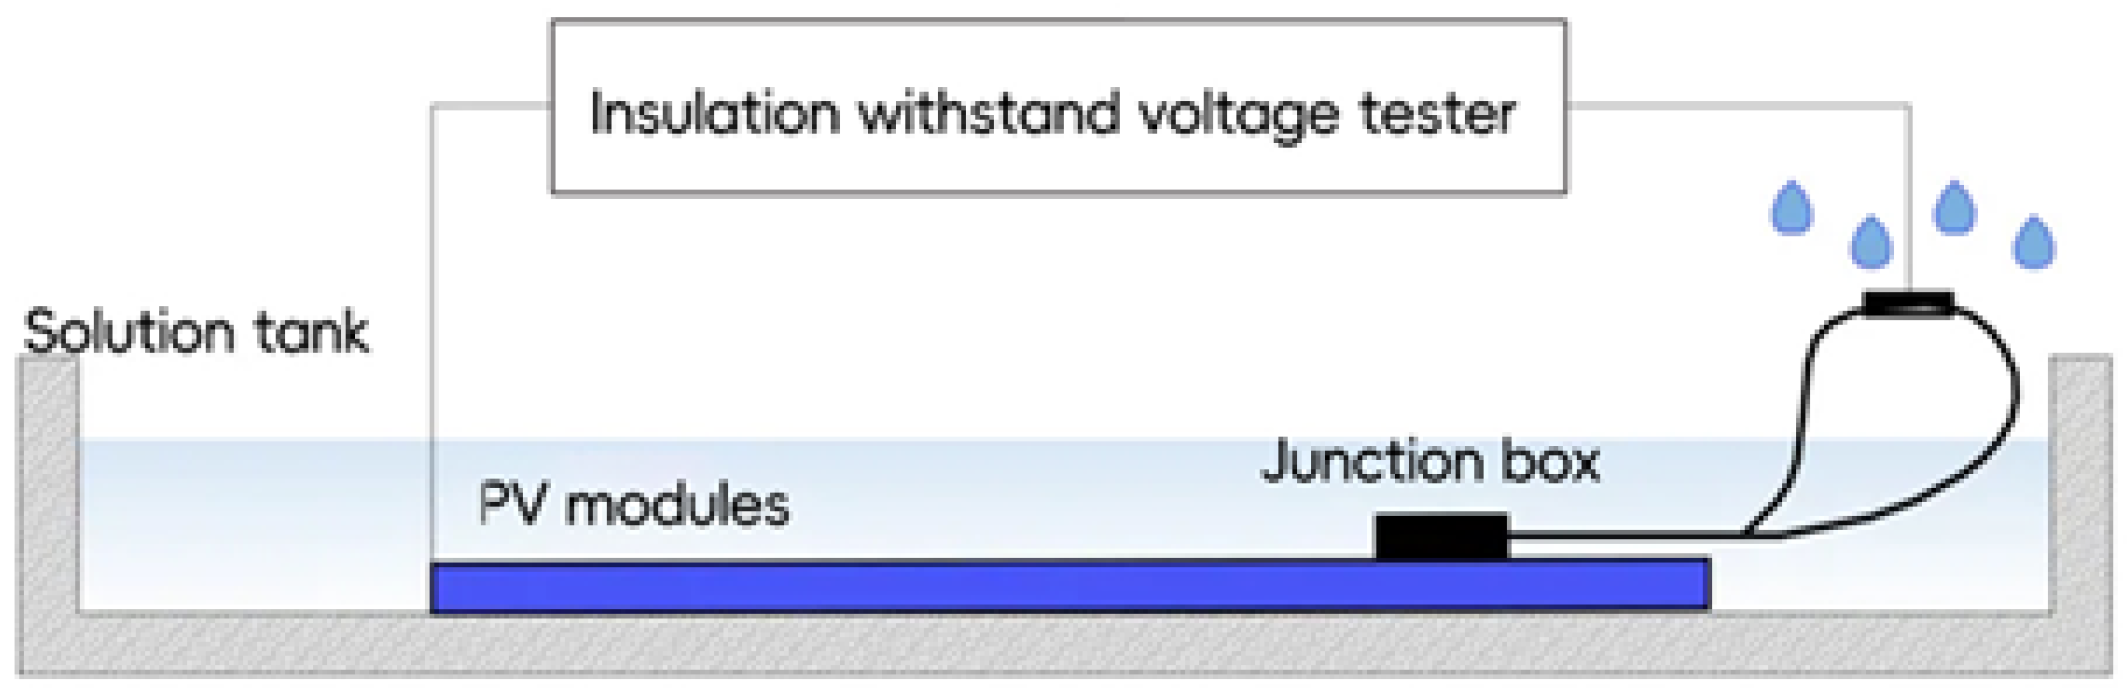
Figure 2.
Photograph of the actual laboratory installation with the PP tank, immersed module and insulation tester.
Figure 2.
Photograph of the actual laboratory installation with the PP tank, immersed module and insulation tester.
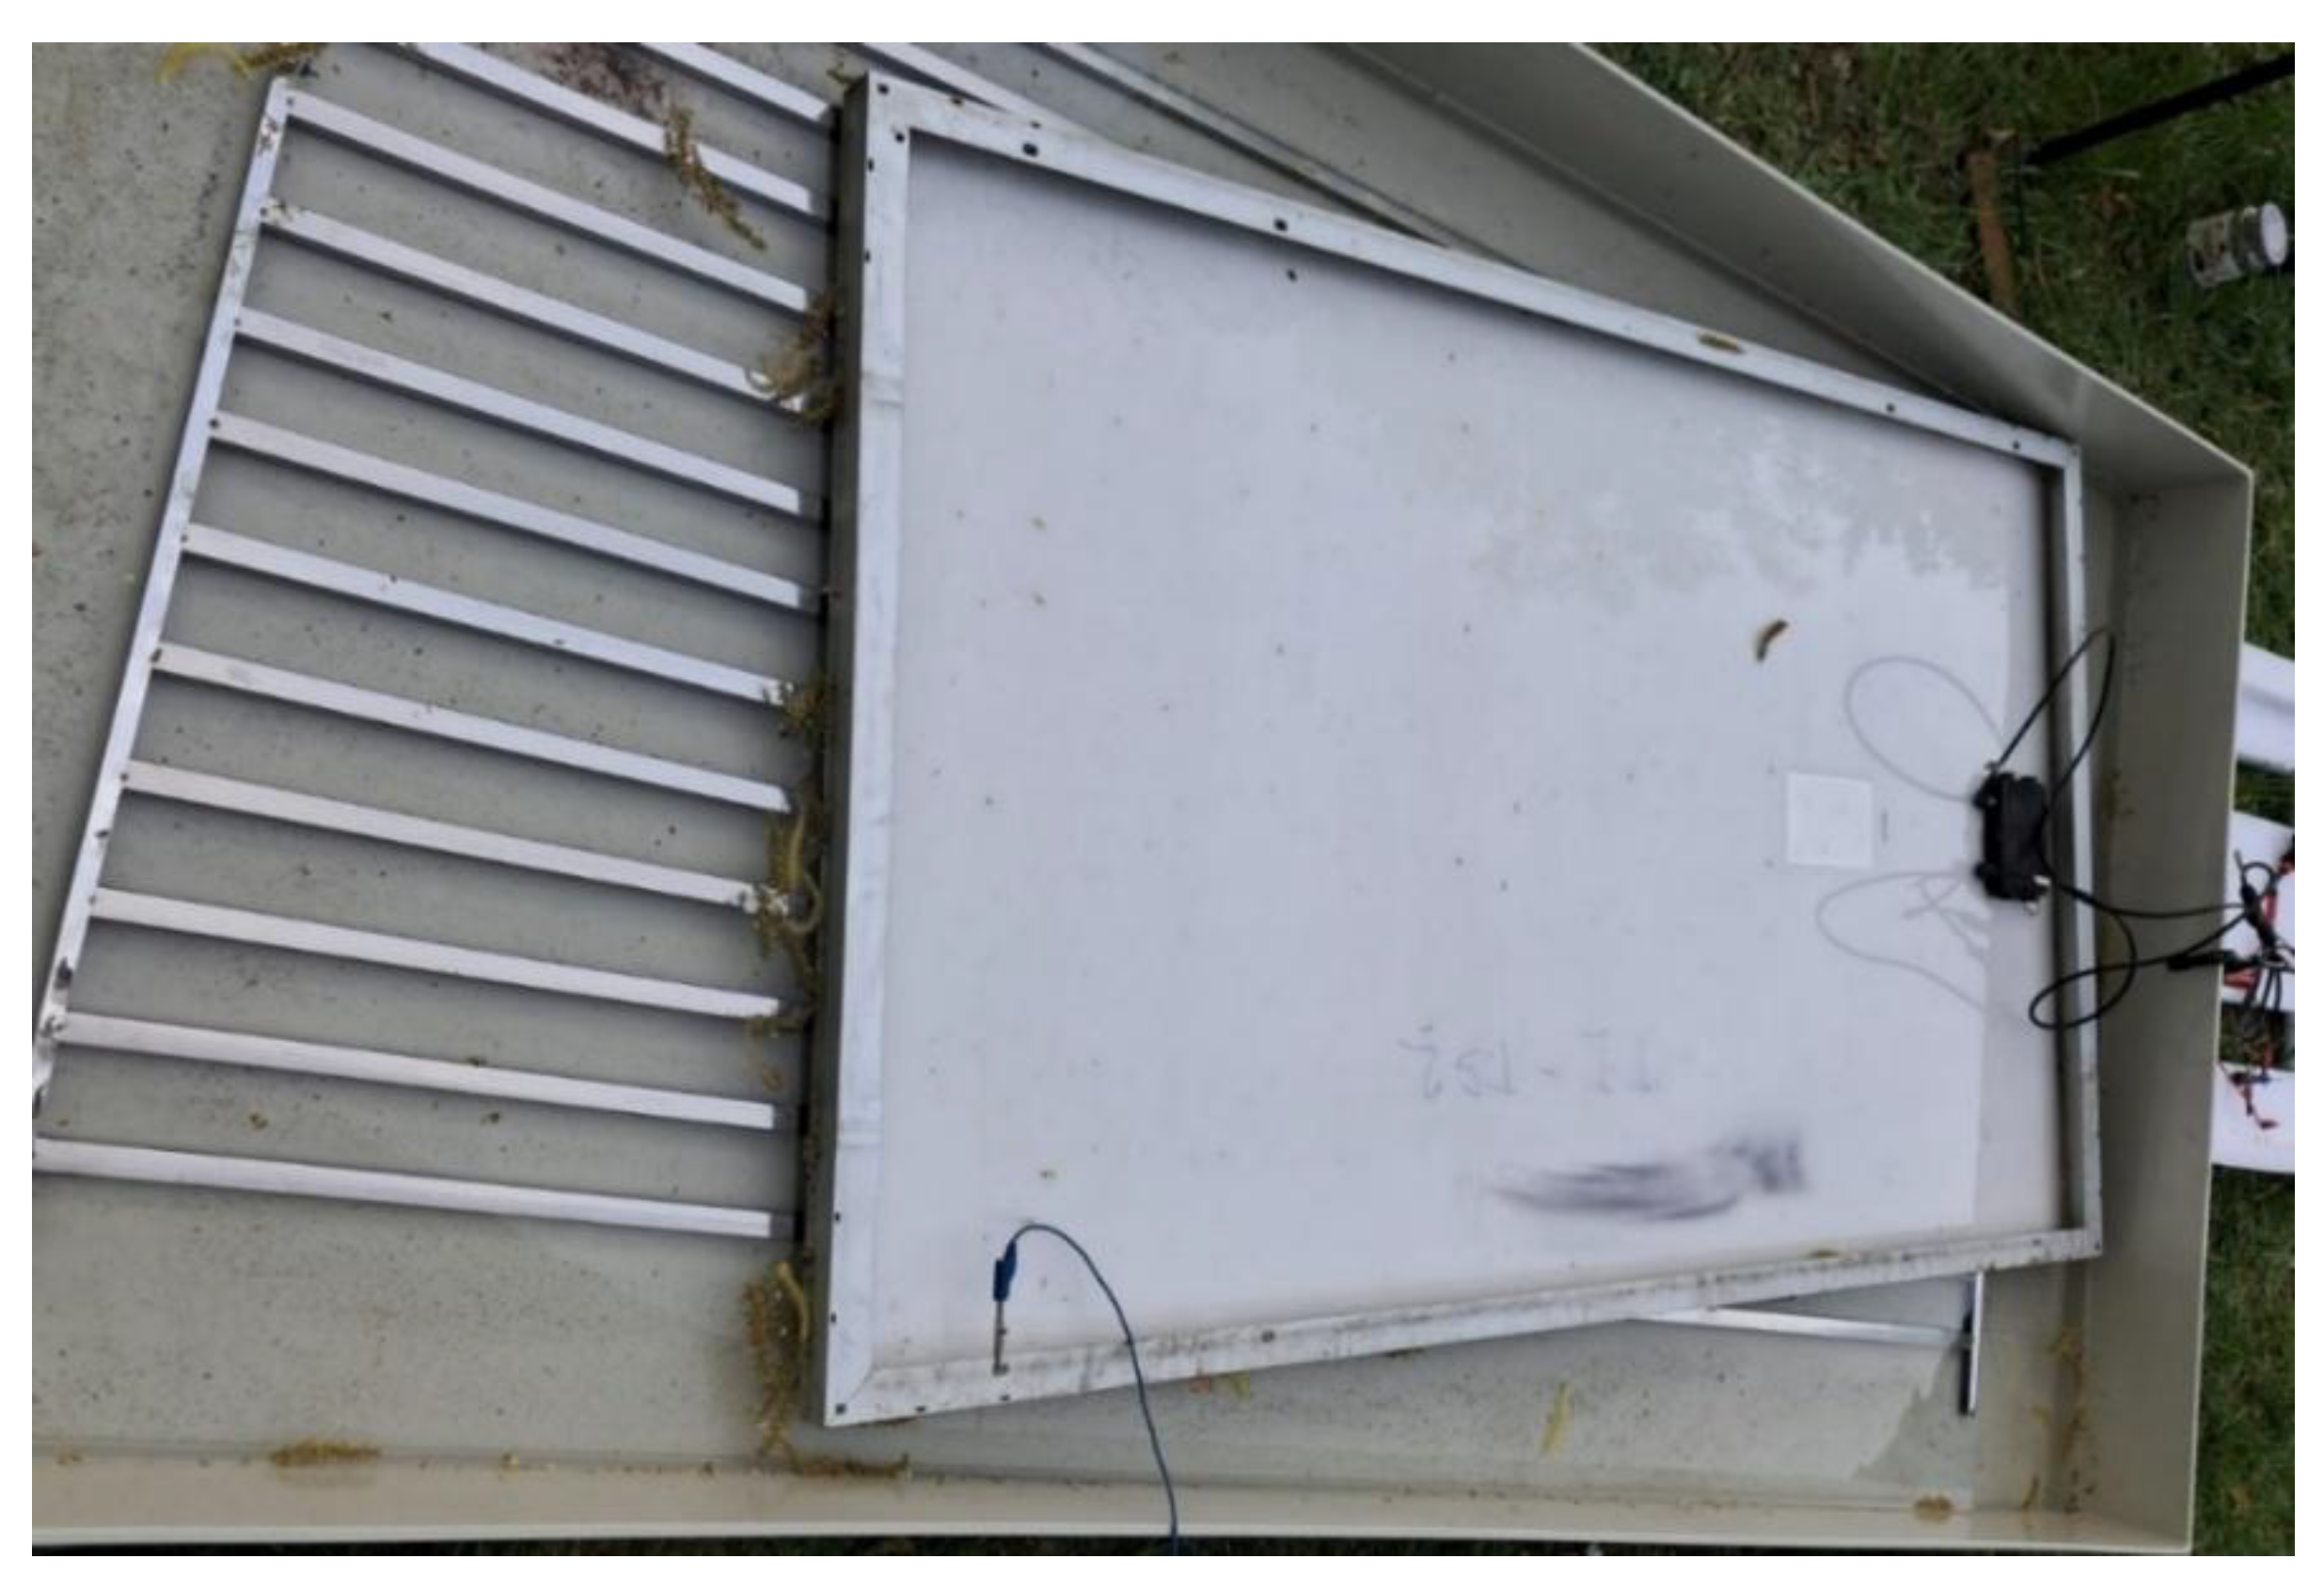
Figure 3.
Dry (Rdry) and IEC-wet (Rwet) insulation resistances of the field-aged modules.
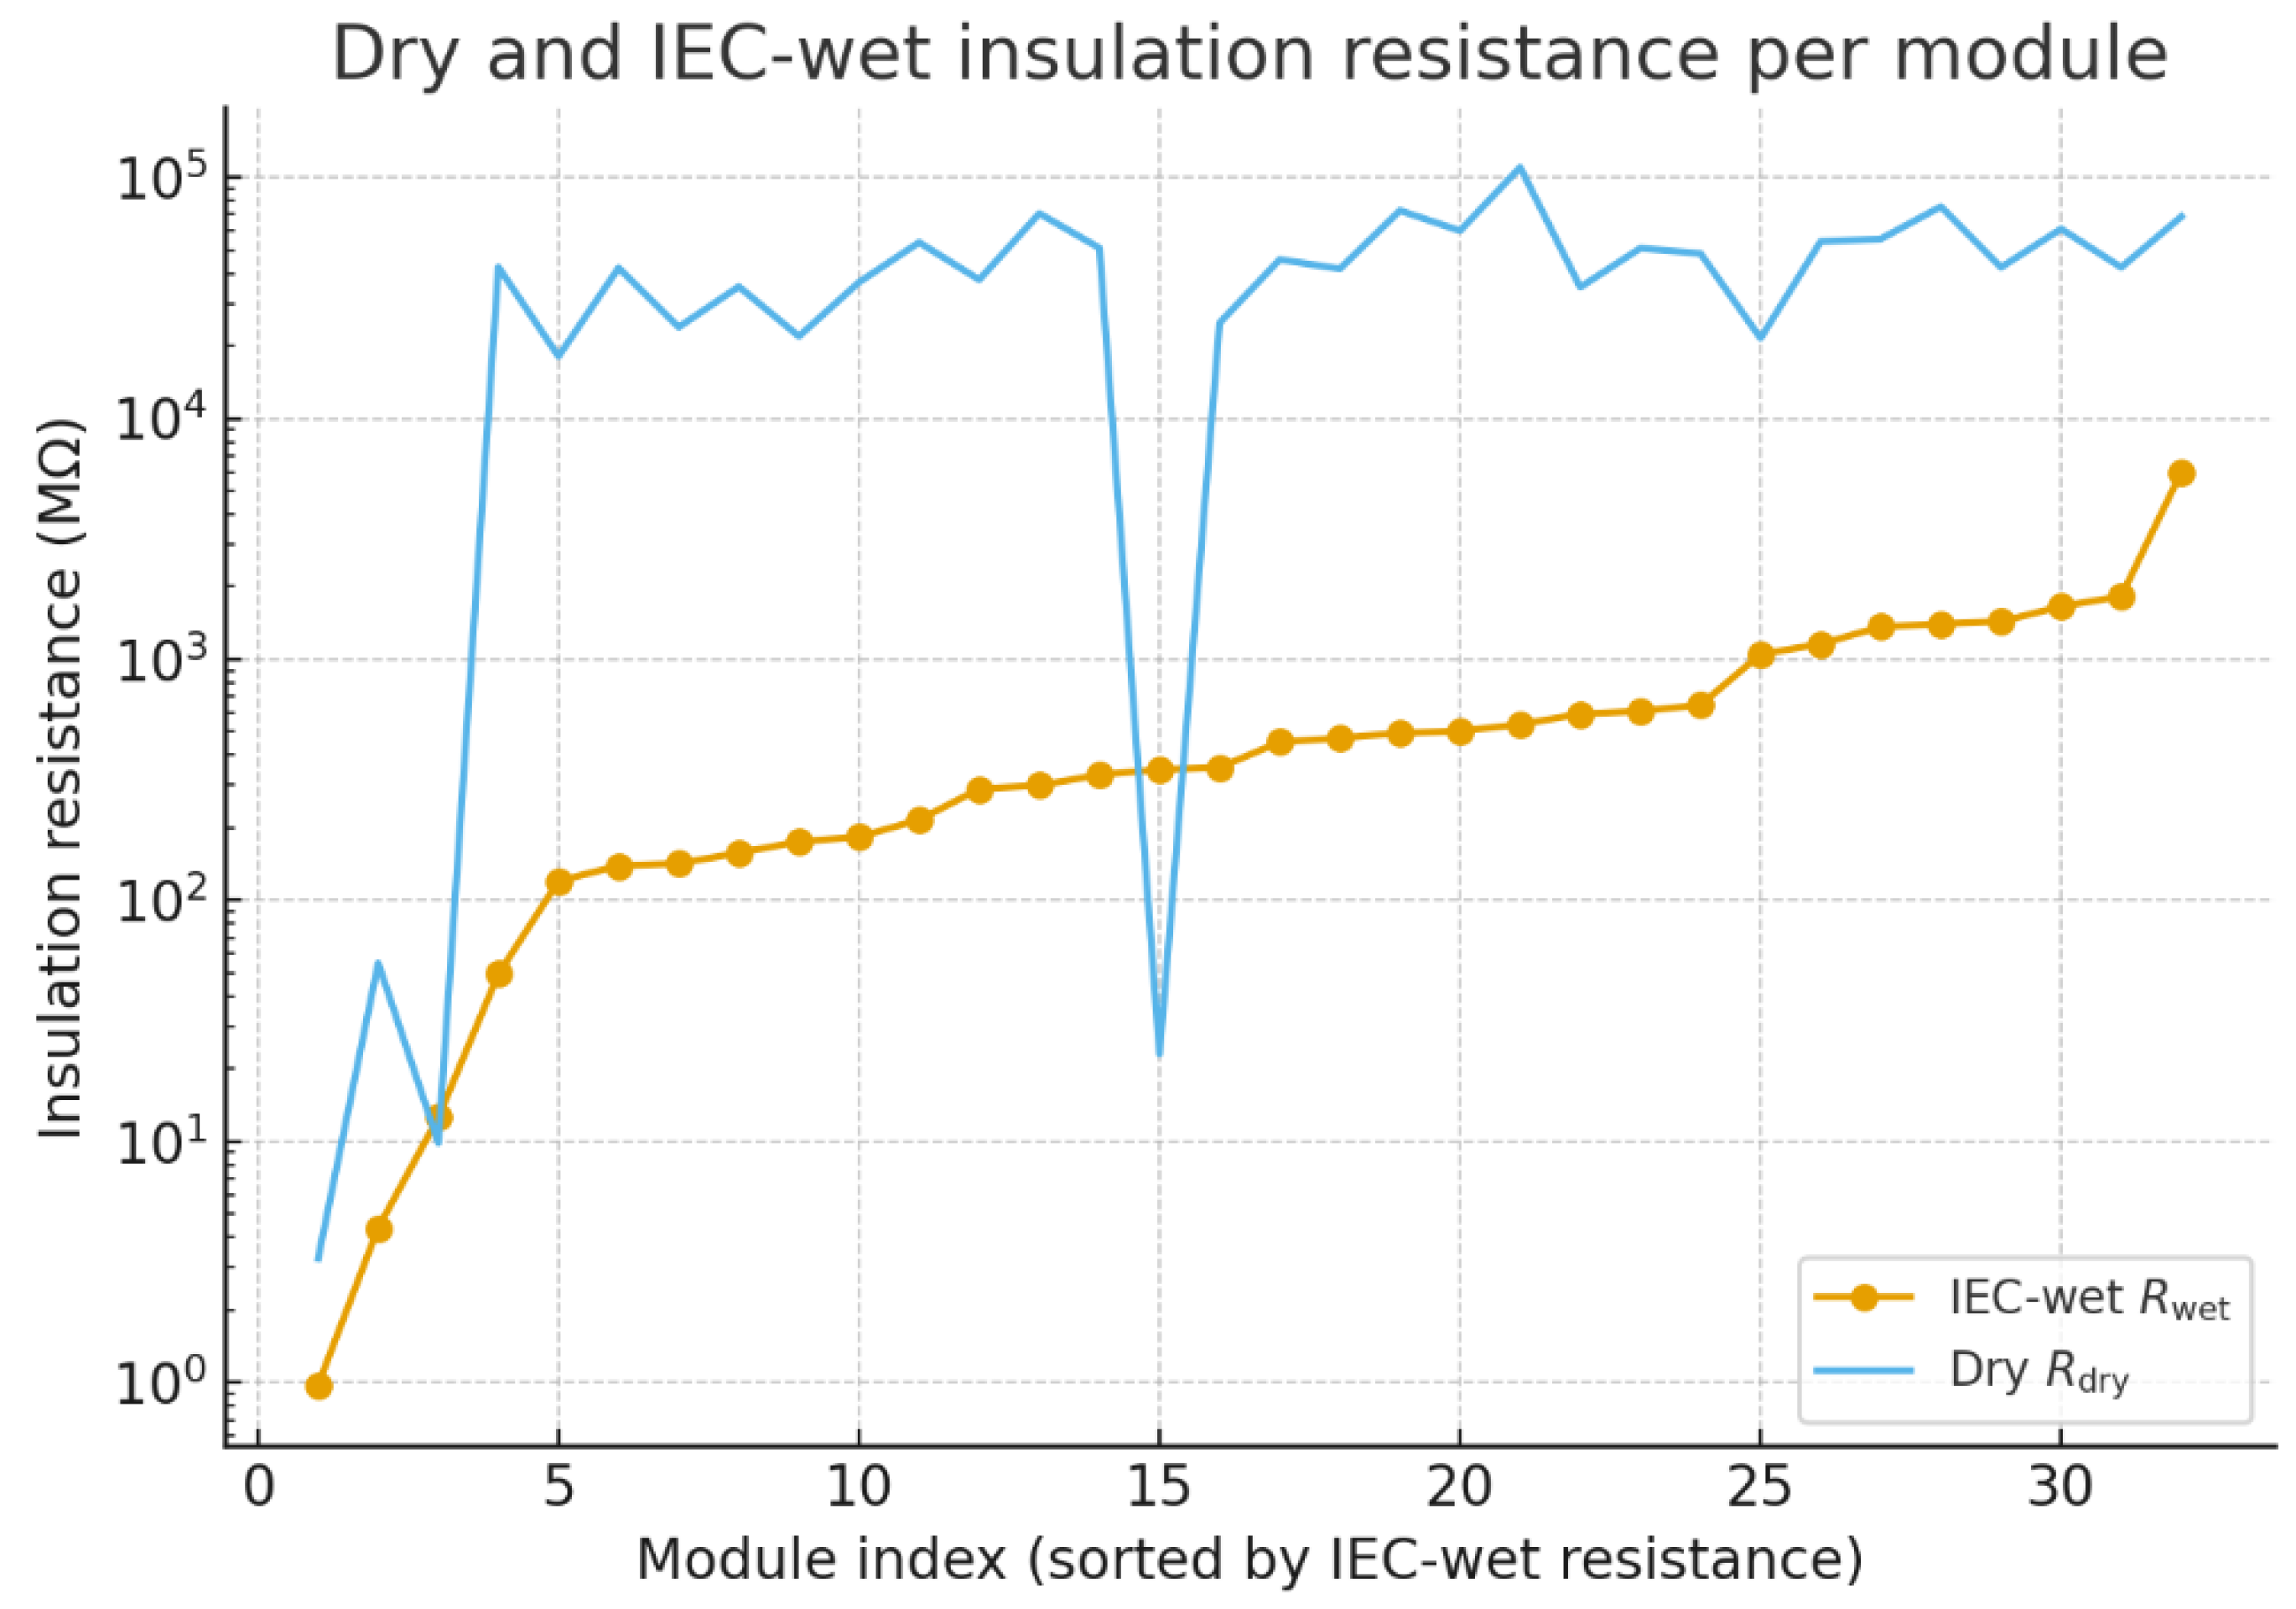
Figure 4.
Distribution of the dry-to-wet insulation resistance ratio Rdry/Rwet. The ratios are grouped into five categories, including catastrophic wet failure (Rwet = 0 Ω).
Figure 4.
Distribution of the dry-to-wet insulation resistance ratio Rdry/Rwet. The ratios are grouped into five categories, including catastrophic wet failure (Rwet = 0 Ω).
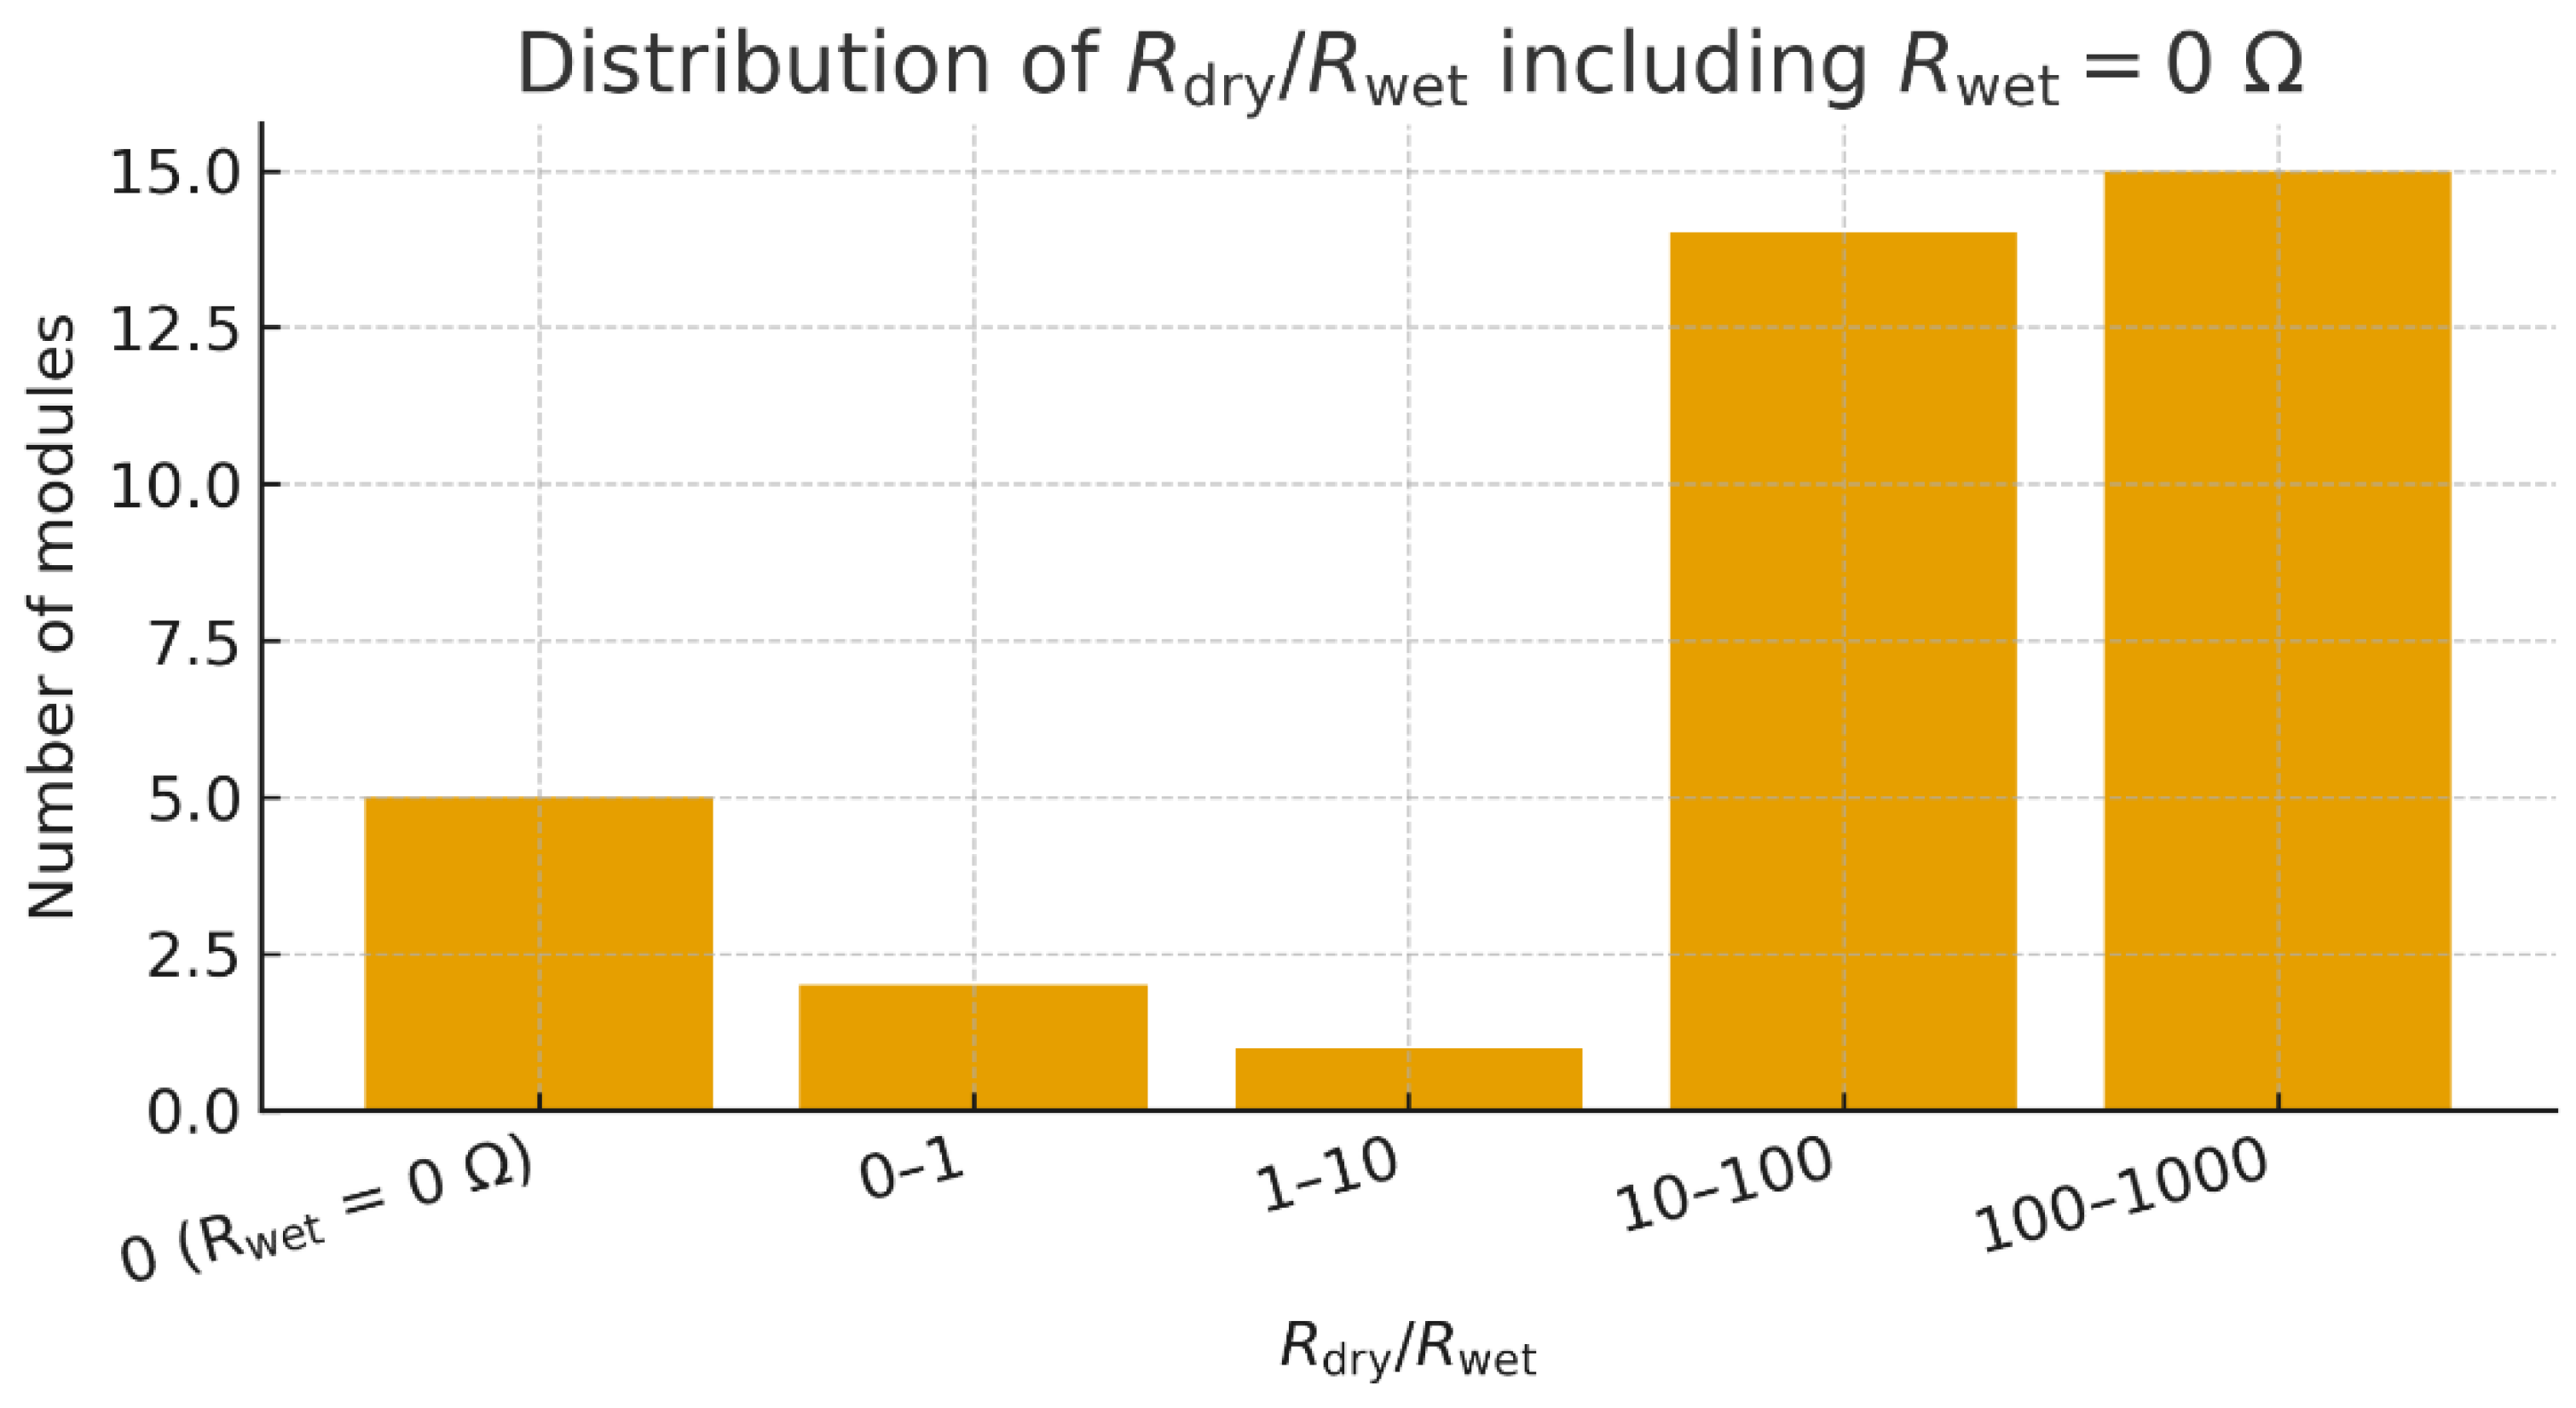
Figure 5.
Scatter plot of dry insulation resistance Rdry versus IEC-wet resistance Rwet.
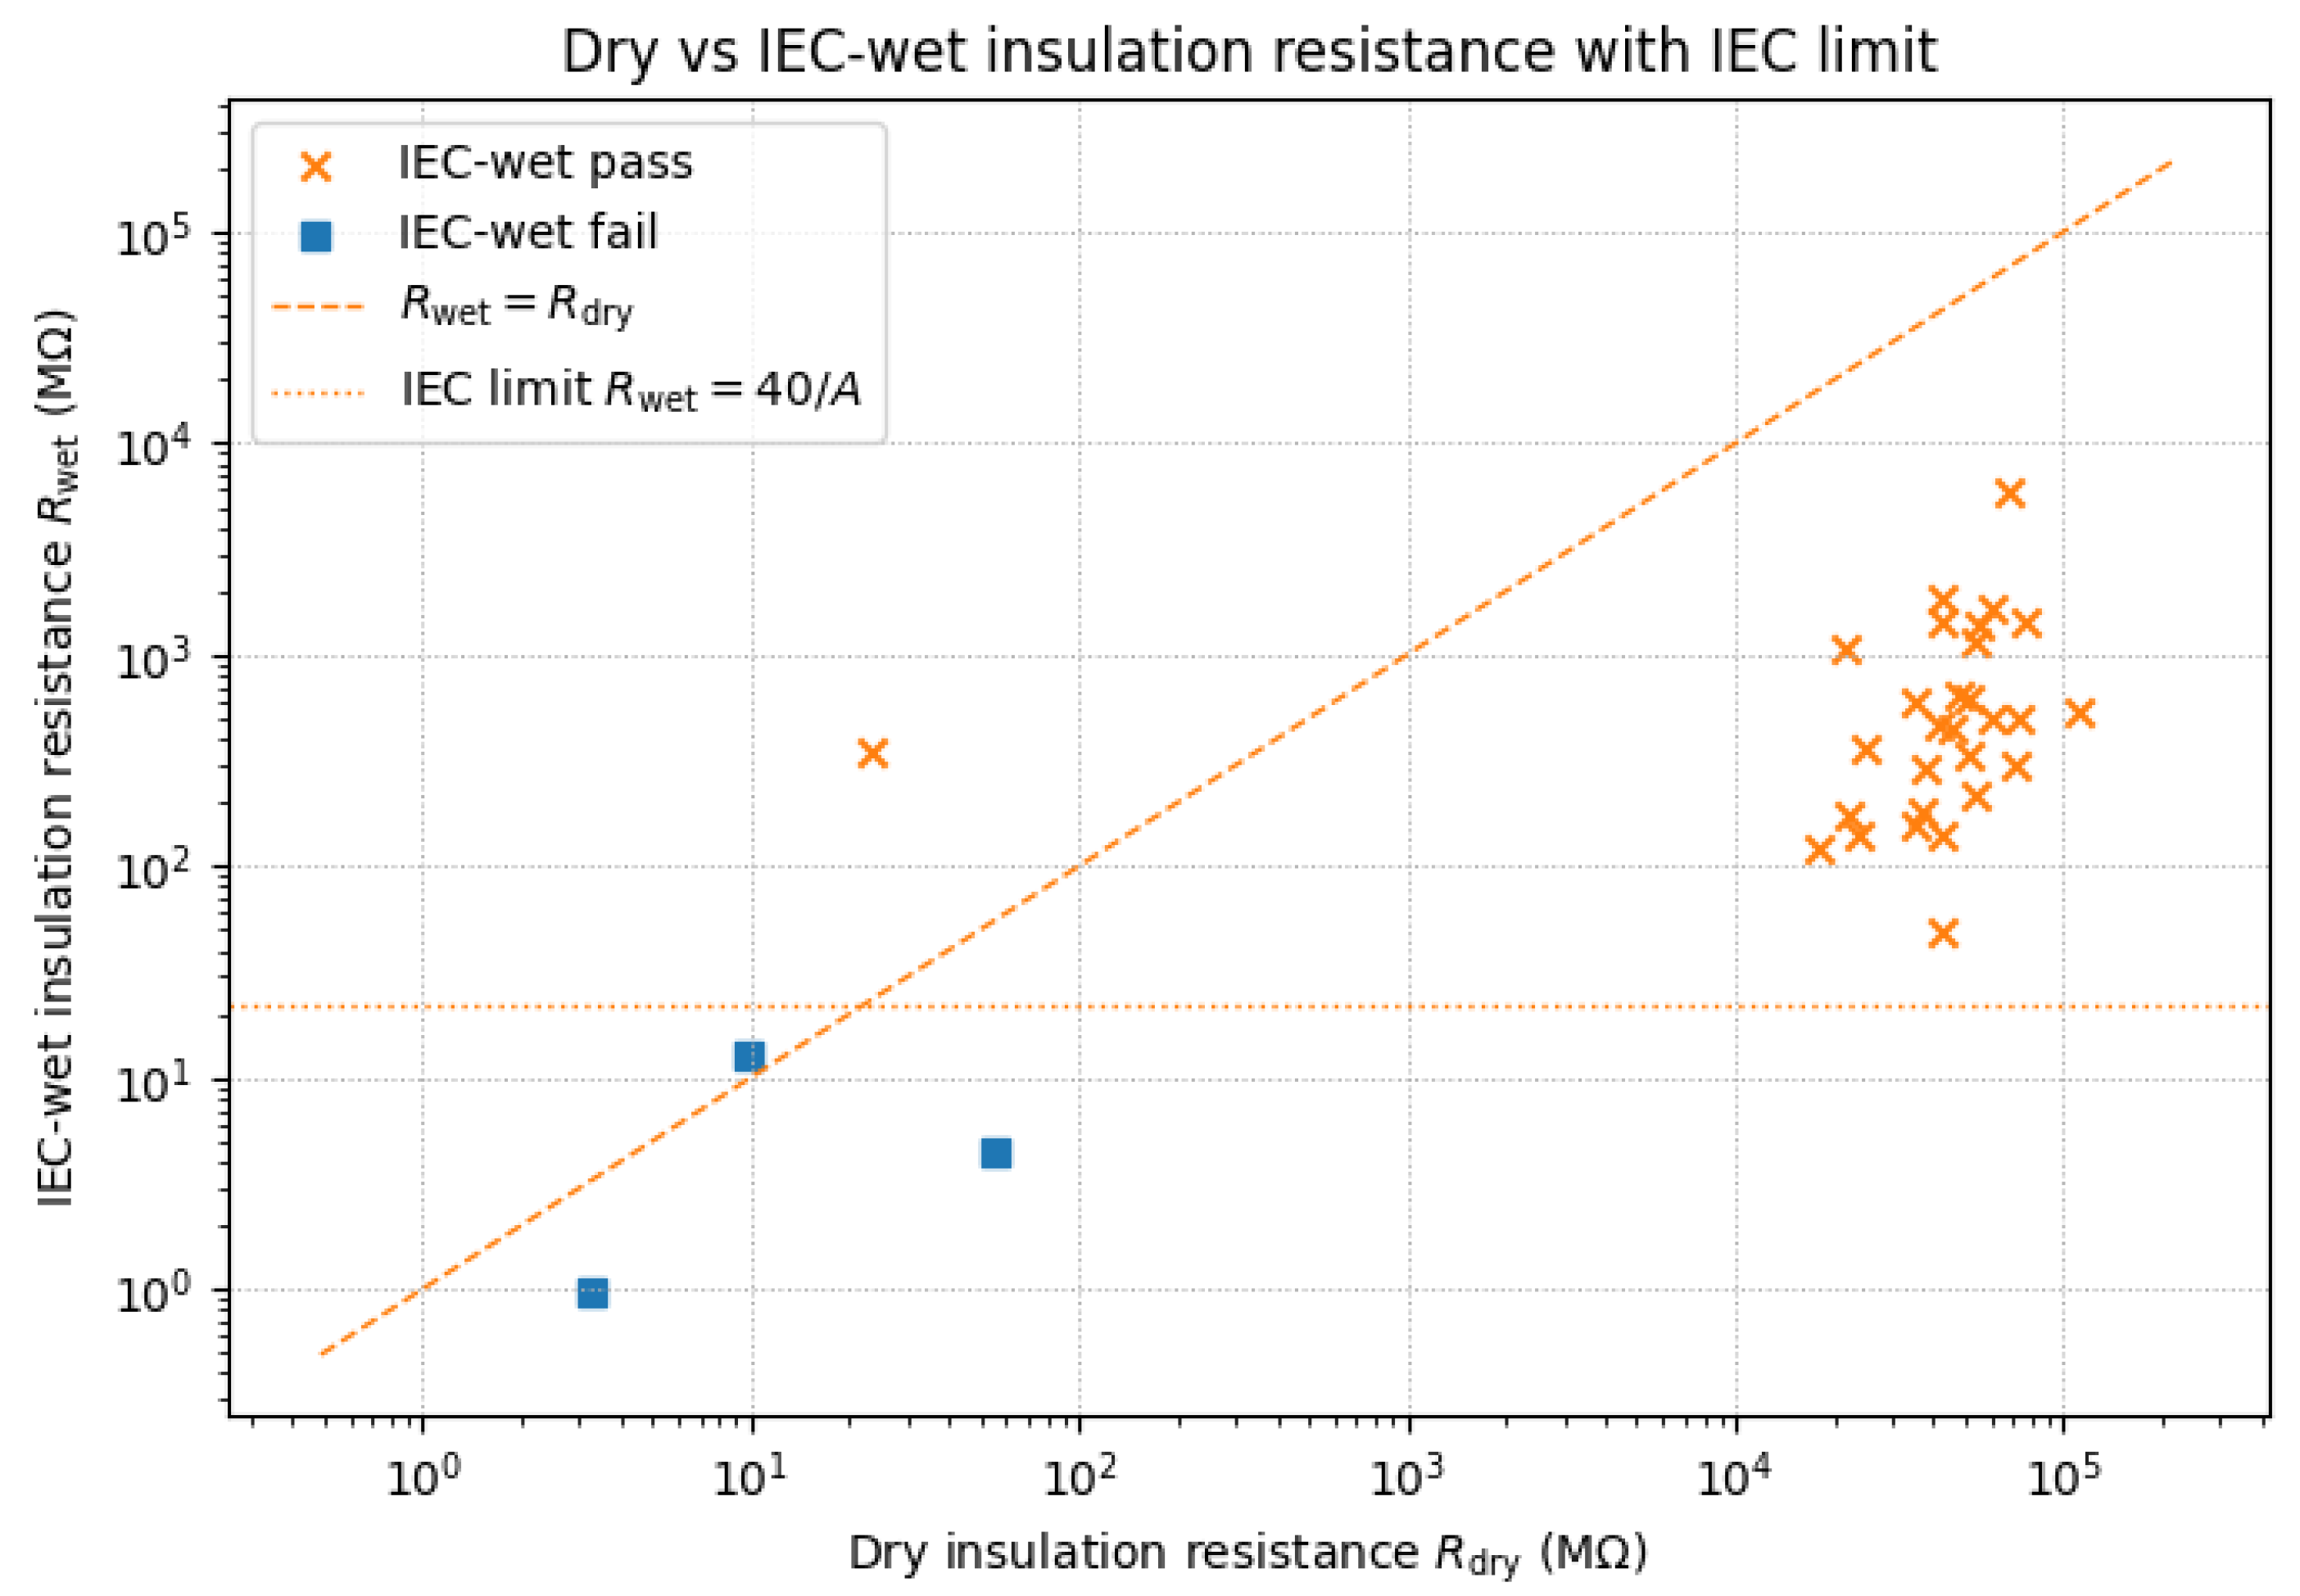
Figure 6.
Sensitivity and specificity of IEC-wet failure prediction as a function of the dry-test threshold T on Rdry (assuming A = 1.8 m²).
Figure 6.
Sensitivity and specificity of IEC-wet failure prediction as a function of the dry-test threshold T on Rdry (assuming A = 1.8 m²).
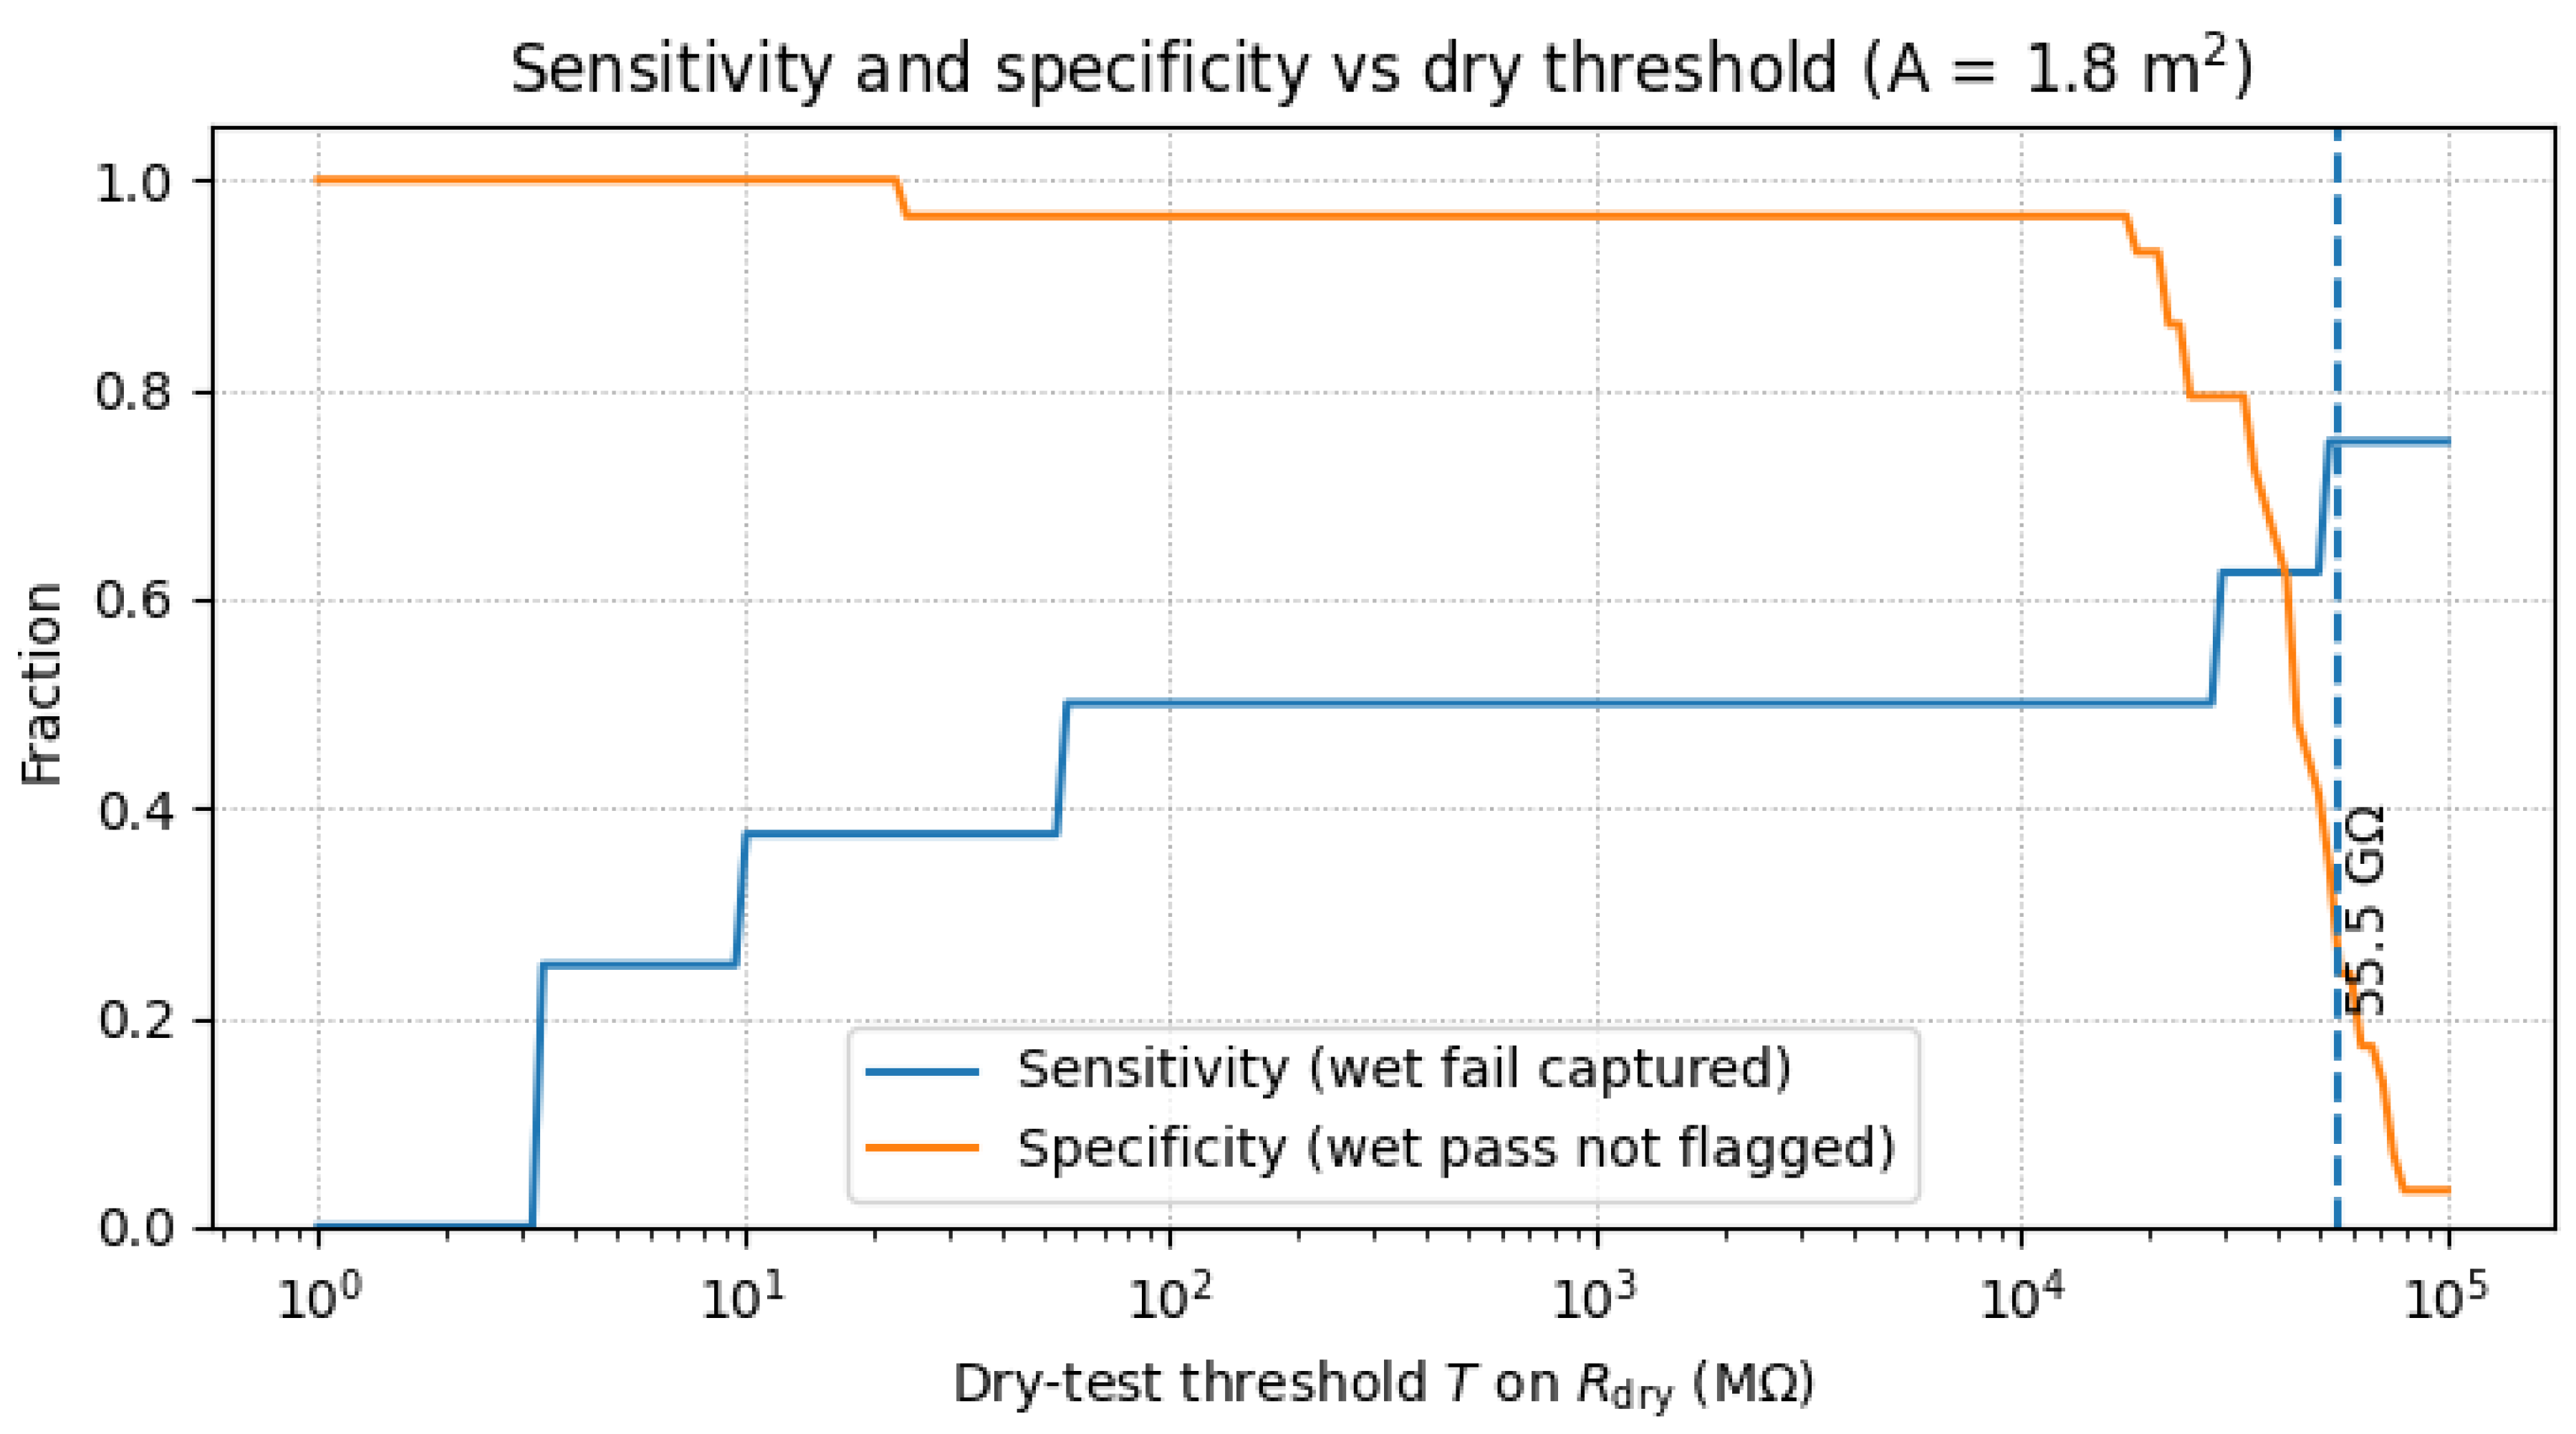
Figure 7.
Figure 7. Schematic illustration of dew condensation on the elytra of the Namib desert beetle. Owing to its high infrared emissivity and surface micro-texture, dew preferentially forms in the valleys between bumps [22].
Figure 7.
Figure 7. Schematic illustration of dew condensation on the elytra of the Namib desert beetle. Owing to its high infrared emissivity and surface micro-texture, dew preferentially forms in the valleys between bumps [22].
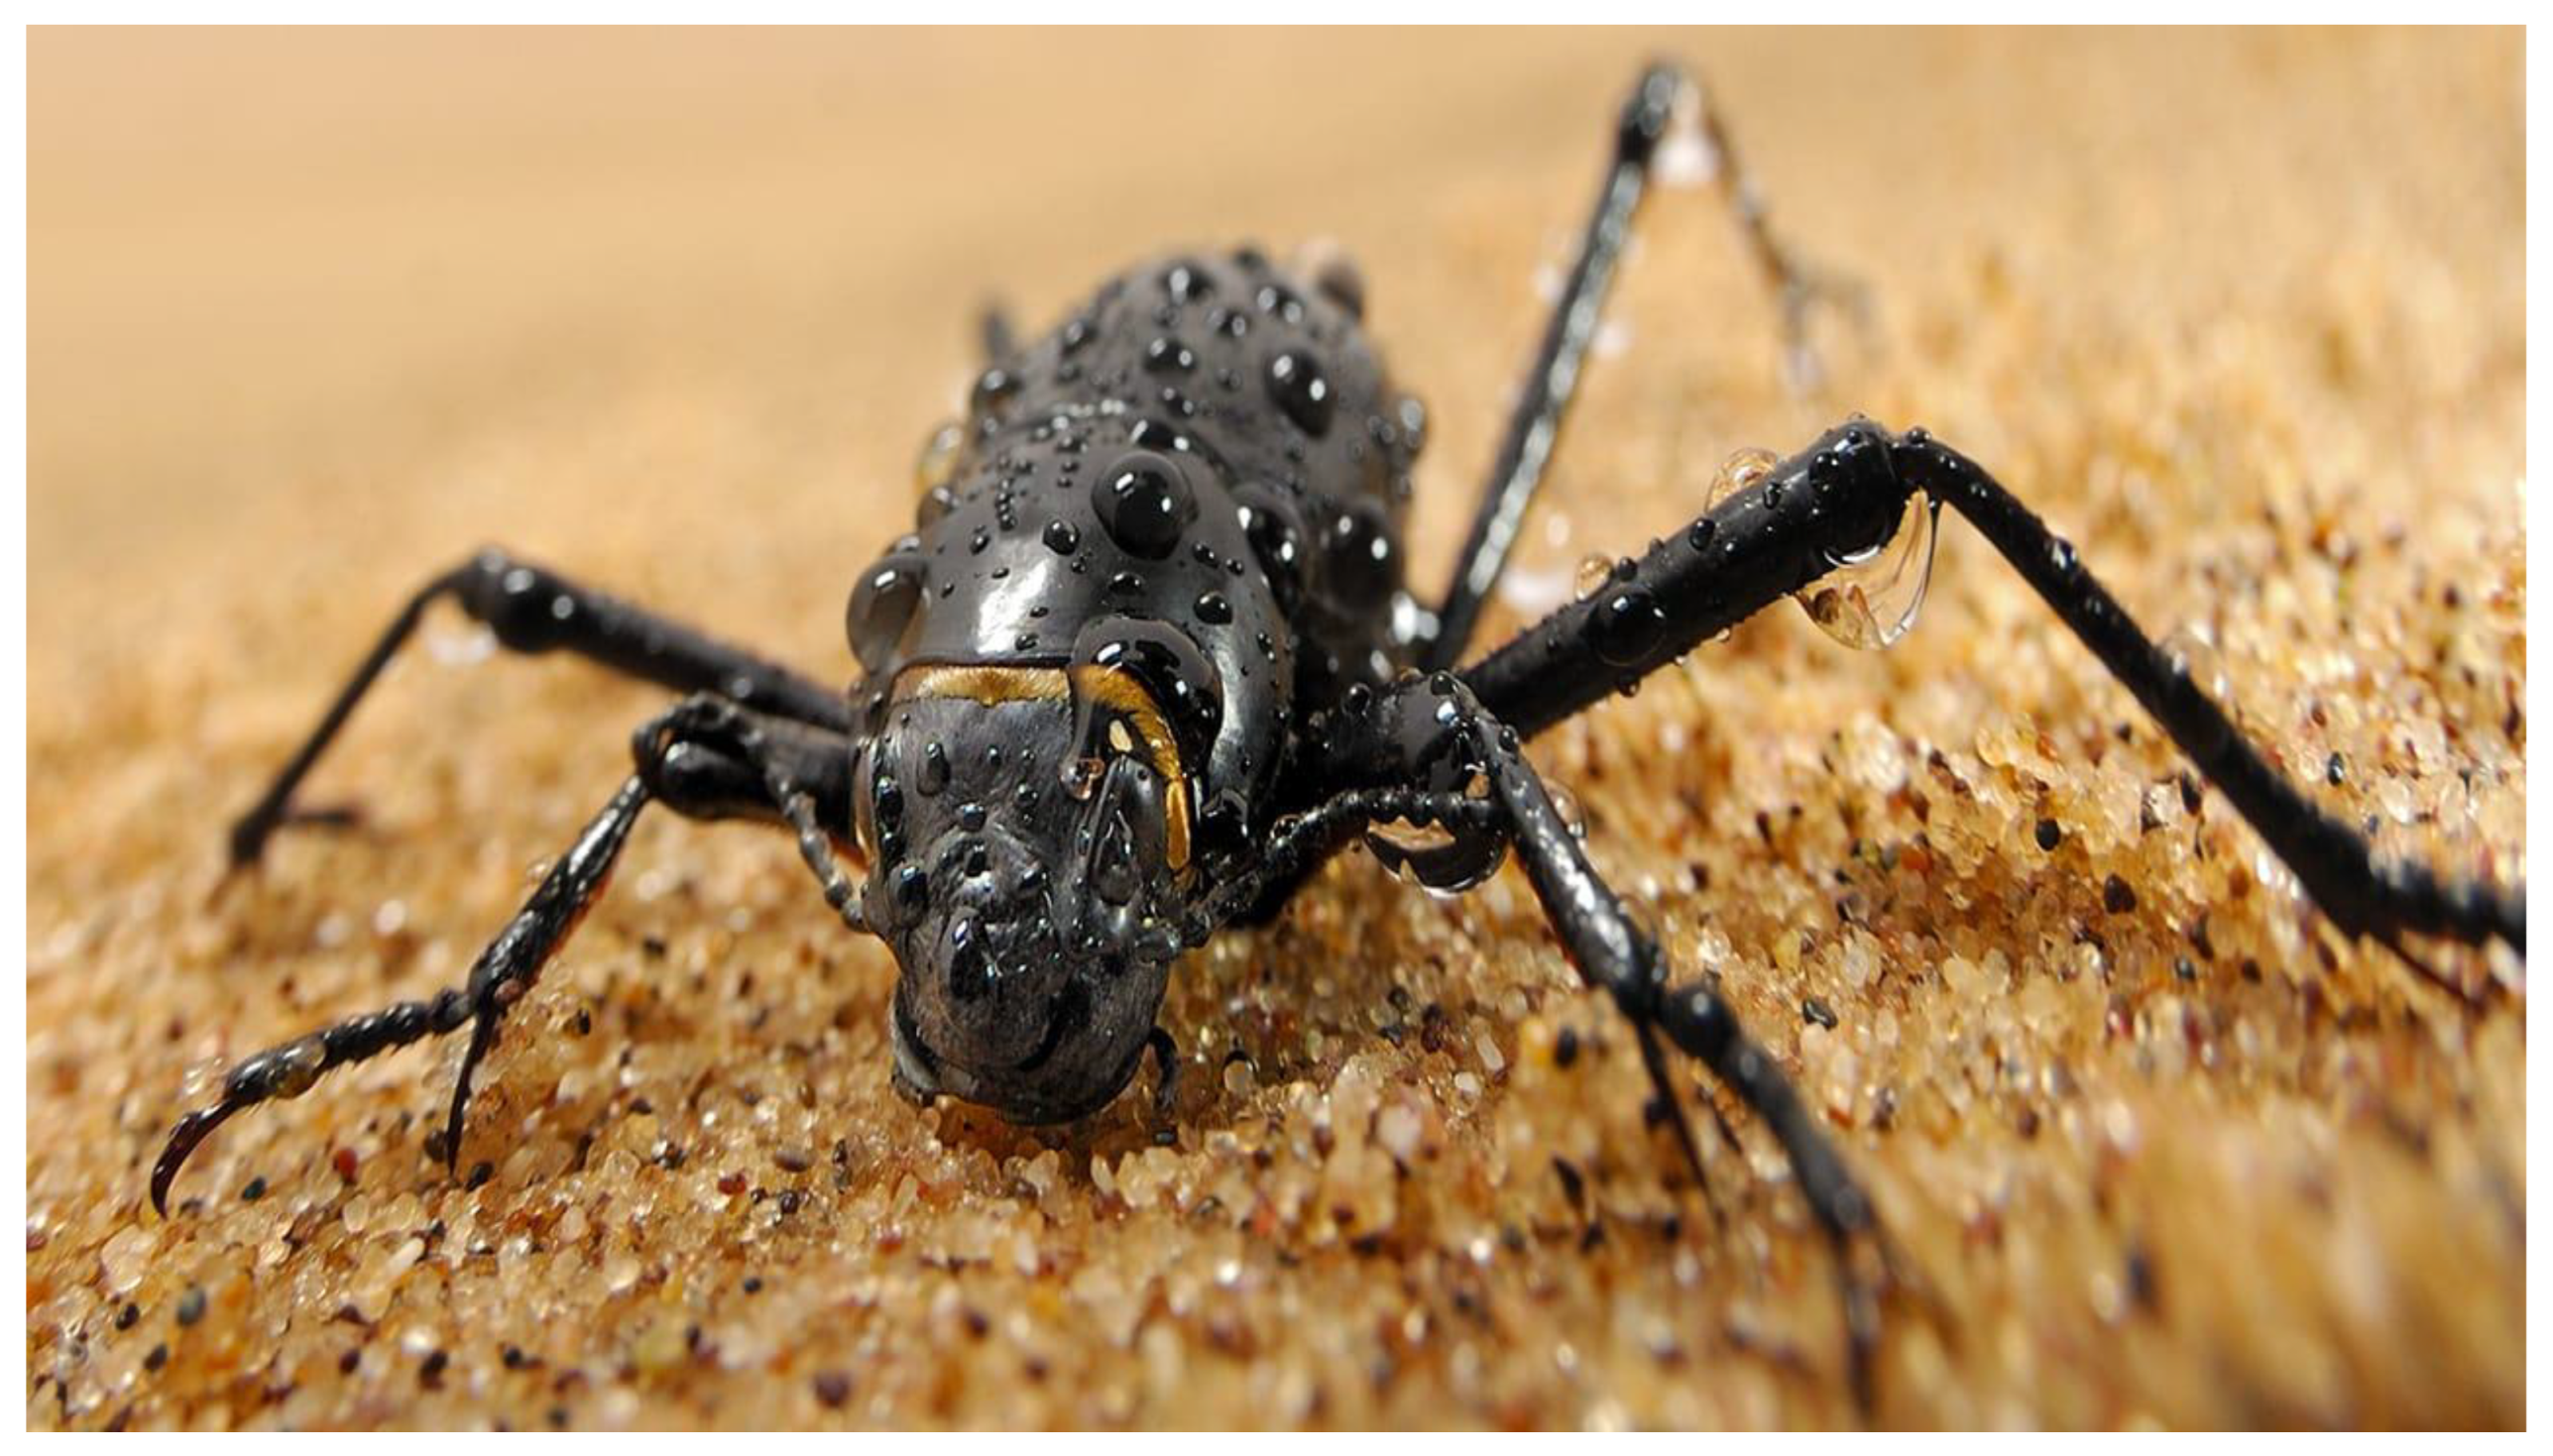

Table 1.
Dry and IEC-wet insulation resistance of the 37 field-aged PV modules and dry-to-wet ratio. Units: k = kΩ, M = MΩ, G = GΩ.
Table 1.
Dry and IEC-wet insulation resistance of the 37 field-aged PV modules and dry-to-wet ratio. Units: k = kΩ, M = MΩ, G = GΩ.
| Panel No. | Rwet | Unit (wet) | Rdry | Unit (dry) | Ratio Rdry/Rwet |
|---|---|---|---|---|---|
| 1 | 1828 | M | 42.3 | G | 23.14 |
| 2 | 356 | M | 24.9 | G | 69.94 |
| 3 | 1051 | M | 21.5 | G | 20.46 |
| 4 | 183.4 | M | 36.7 | G | 200.11 |
| 5 | 216 | M | 53.7 | G | 248.61 |
| 6 | 1158 | M | 54.2 | G | 46.80 |
| 7 | 5.99 | G | 68.7 | G | 11.47 |
| 8 | 1658 | M | 61.1 | G | 36.85 |
| 9 | 1405 | M | 75.6 | G | 53.81 |
| 10 | 12.58 | M | 9.87 | M | 0.78 |
| 11 | 0 | Ω | 3.3 | M | 0.00 |
| 12 | 49.5 | M | 42.4 | G | 856.57 |
| 13 | 1365 | M | 55.5 | G | 40.66 |
| 14 | 977 | k | 3.27 | M | 3.35 |
| 15 | 0 | Ω | 110.4 | G | 0.00 |
| 16 | 0 | Ω | 29.5 | G | 0.00 |
| 17 | 504 | M | 60 | G | 119.05 |
| 18 | 332 | M | 50.9 | G | 153.31 |
| 19 | 537 | M | 110 | G | 204.84 |
| 20 | 647 | M | 48.3 | G | 74.65 |
| 21 | 495 | M | 72.8 | G | 147.07 |
| 22 | 0 | Ω | 52.3 | G | 0.00 |
| 23 | 157.4 | M | 35.2 | G | 223.63 |
| 24 | 175.4 | M | 21.9 | G | 124.86 |
| 25 | 139.4 | M | 42.1 | G | 302.01 |
| 26 | 142.3 | M | 23.9 | G | 167.96 |
| 27 | 120.2 | M | 18.08 | G | 150.42 |
| 28 | 0 | Ω | 103.5 | G | 0.00 |
| 29 | 300 | M | 70.8 | G | 236.00 |
| 30 | 471 | M | 41.7 | G | 88.54 |
| 31 | 454 | M | 45.6 | G | 100.44 |
| 32 | 610 | M | 50.8 | G | 83.28 |
| 33 | 349 | M | 23.1 | M | 0.07 |
| 34 | 4.38 | M | 54.9 | M | 12.53 |
| 35 | 1435 | M | 42.3 | G | 29.48 |
| 36 | 594 | M | 35 | G | 58.92 |
| 37 | 290 | M | 37.6 | G | 129.66 |
Table 2.
Summary statistics for dry and IEC-wet insulation resistance and dry-to-wet ratio (N = 37).
Table 2.
Summary statistics for dry and IEC-wet insulation resistance and dry-to-wet ratio (N = 37).
| Metric | Rdry | Rwet | Ratio R_dry/R_wet |
|---|---|---|---|
| Median | 42.4 GΩ | 462.5 MΩ | 109.7× |
| Mean | (not used; skewed) | (not used; skewed) | 543.5× |
| Minimum (non-zero) | 3.27 MΩ (Panel 14) | 4.38 MΩ (Panel 34) | 0.07× (Panel 33) |
| Maximum | 110.4 GΩ (Panel 15) | 5.99 GΩ (Panel 7) | 856.6× (Panel 12) |
Table 3.
Compliance of the 37 field-aged modules with the IEC 40 MΩ·m² insulation-resistance criterion for typical module areas.
Table 3.
Compliance of the 37 field-aged modules with the IEC 40 MΩ·m² insulation-resistance criterion for typical module areas.
| Assumed area A [m²] | Limit R = 40/A [MΩ] | IEC-wet pass [count] | IEC-wet pass [count] | Dry-pass/wet-fail modules [count] |
|---|---|---|---|---|
| 1.6 | 25.0 | 4 | 8 | 5 |
| 1.8 | 22.2 | 3 | 8 | 5 |
| 2.0 | 20.0 | 3 | 8 | 5 |
Disclaimer/Publisher’s Note: The statements, opinions and data contained in all publications are solely those of the individual author(s) and contributor(s) and not of MDPI and/or the editor(s). MDPI and/or the editor(s) disclaim responsibility for any injury to people or property resulting from any ideas, methods, instructions or products referred to in the content. |
© 2025 by the authors. Licensee MDPI, Basel, Switzerland. This article is an open access article distributed under the terms and conditions of the Creative Commons Attribution (CC BY) license (https://creativecommons.org/licenses/by/4.0/).
Copyright: This open access article is published under a Creative Commons CC BY 4.0 license, which permit the free download, distribution, and reuse, provided that the author and preprint are cited in any reuse.


