
Submitted:
22 July 2025
Posted:
29 July 2025
You are already at the latest version
Abstract
This study examines the long-term degradation of a crystalline silicon photovoltaic (PV) module after 13 years of exposure to a harsh desert environment, marked by high ambient temperatures (up to 45°C), elevated UV index levels (> 11 during peak months), and high solar irradiance (over 1000 W/m²). Performance analysis under standard test conditions (STC) reveals a 29.61% reduction in maximum power output (Pmp), a 5.63% decline in short-circuit current (Isc), and a fill-factor decrease to 58.86%. Forecasting analysis indicates that, at the observed degradation rate, the module’s power output is projected to fall to 53.29 W by year 25, well below warranty expectations. Notably, the module reached the 80% power rating threshold within 13 years, significantly earlier than the 25-year lifespan claimed by manufacturers. Electroluminescence (EL) imaging identifies significant inactive regions caused by microcracks and interconnect failures, while visual inspection shows encapsulant yellowing and frame corrosion, consistent with UV and thermal degradation effects. These results highlight the necessity for PV modules with improved UV and thermal stability to maintain durability and efficiency in extreme climates, supporting the sustainable deployment of solar energy in desert regions.
Keywords:
solar PV module
; degradation
; harsh environment
; desert conditions
1. Introduction
Outdoor performance degradation in PV modules arises from various stressors, including extreme temperature fluctu- ations, intense solar radiation, and high UV. These factors, often encountered in desert or similarly harsh environments like those in Saudi Arabia, lead to a gradual decline in elec- trical output over time, with most PV module manufacturers claiming to retain 80% of initial capacity after 25 years [1,2,3]. However, performance degradation can be accelerated by environmental conditions, resulting in significant declines within only a few years in some cases. Degradation mecha- nisms in PV modules manifest as reductions in power output, often due to material wear or cell failure, and are compounded by additional structural issues linked to environmental expo- sure, such as hail impact, high temperatures, UV, and dust accumulation [4,5].
2. Experimental Location
This paper makes a significant contribution by evaluating the performance of crystalline silicon (c-Si) PV modules that have operated for over 13 years under the desert conditions of Dhahran [6], Saudi Arabia (26.3071° N, 50.1459° E), specif- ically at King Fahd University of Petroleum and Minerals. The study seeks to address research gaps in understanding the long-term reliability of these PV modules and to improve PV qualification standards across diverse geographic and cli- matic environments. Results indicate notable deviations from existing literature, attributed to the extreme environmental conditions of the installation site. Figures 1, 2, and 3 illustrate the factors impacting PV module durability in Dhahran: Figure 1 shows annual temperature data with summer peaks of 43°C to 46°C, indicating substantial thermal stress; Figure 2 demonstrates persistently high UV levels, which accelerate material degradation; and Figure 3 highlights solar irradiation levels often exceeding 1000 W/m², adding stress through high energy exposure. Together, these figures underscore the challenging environmental conditions that affect the long-term reliability of PV modules in Dhahran [7].
3. Environmental Stressors
Figure 1 displays the annual temperature profile in Dhahran, where peak temperatures reach approximately 45 °C during summer. Such high temperatures introduce thermal stress that accelerates the aging of module materials, particularly the encapsulant, leading to discoloration, reduced optical trans- parency, and structural weakening. Figure 2 illustrates the UV index throughout the year, with consistently high levels, especially from May to August, reaching values above 10. This intense UV exposure exacerbates the photodegradation of polymeric materials in the module, reducing light transmission and impacting energy efficiency. Figure 3 shows the daily solar irradiance, peaking above 1000 W/m² around midday. This high irradiance contributes to significant thermal cycling and elevates the operating temperature of the module, further stressing the materials [8,9,10].
A. Impact on Rear Side:
The rear side of the module Figure 4a exhibits pro- nounced yellowing and discoloration, indicative of extensive photodegradation of the encapsulant material. This degrada- tion can be attributed to the combined effects of high UV exposure (Figure 2) and elevated temperatures (Figure 1), which compromise the encapsulant’s optical and mechanical properties. The visible discoloration around the junction box and the presence of corrosion along the frame edges suggest potential moisture ingress and exposure to environmental contaminants. Over time, such degradation not only affects the structural integrity of the module but also reduces its electrical insulation, impacting safety and performance.
B. Impact on Front Side
The front side of the module as given in Figure 4b displays crystalline silicon cells with yellowing around the edges and within the inter-cell encapsulant. This yellowing is a clear sign of UV-induced degradation, as shown in Figure 2, which limits the transmission of light to the cells and reduces power generation efficiency. The high solar irradiance levels indicated in Figure 3 likely contribute to further thermal stress and accelerated material aging. The frame also shows signs of wear, which may be due to repeated thermal cycling, as suggested by the daily irradiance variations, and prolonged exposure to high temperatures (Figure 1).
C. Electroluminescence (EL) Test
The image given in Figure 4c reveals distinct areas of degradation and damage across multiple cells. Electrolumines- cence imaging is a non-destructive diagnostic technique com- monly employed to assess microstructural defects within PV cells, providing insight into degradation mechanisms affecting module performance [11,12,13].
D. Observed Defects
The EL image (Figure 4c) displays several dark regions within individual cells, indicating areas with diminished or no current flow, which are symptomatic of inactive or partially inactive regions. These dark areas are typically associated with microcracks, broken cells, and cell interconnect fail- ures, which can occur due to prolonged exposure to thermal cycling, mechanical stress, and other environmental factors. The presence of these defects suggests a substantial loss in electrical conductivity, contributing to the overall reduction in the module’s power output.
E. Specific Degradation Patterns
Notably, the image shows areas with varied intensity across the cells, with some regions appearing more degraded than others. This variation in brightness is often attributed to non-uniform degradation of the encapsulant, which results in differential stress distribution across the module. Additionally, some cells display diagonal or irregular dark lines, which may indicate cracks or potential breaks in the cell structure, impairing charge carrier transport and thereby reducing the effective current generation.
4. Implications for Performance
The presence of these defects correlates with the observed decline in electrical parameters, as shown in Table 1, par- ticularly in terms of reduced maximum power output and fill factor. The EL imaging highlights the impact of environmental stressors, such as high UV exposure, temperature fluctuations, and mechanical stress, on the long-term reliability of the module. The concentration and severity of defects underscore the need for durable encapsulation materials and robust cell interconnect designs to mitigate the effects of harsh operational environments.
5. Results and Discussion
The module has been in operation for over 13 years under the desert conditions of Dhahran, Saudi Arabia (26.3071° N, 50.1459° E), at King Fahd University of Petroleum and Min- erals. The following section presents the measured electrical degradation of various parameters for the studied photovoltaic module, tested under standard test conditions (STC) at Gulf Renewable Energy Laboratories (GRL), an ISO 17025 ac- credited laboratory. The results for key electrical parameters, including maximum power (Pm), short-circuit current (Isc), short-circuit voltage (Voc), maximum voltage (Vmp), maxi- mum current (Imp), and fill factor (FF), are summarized in Table 1. The percentage decrease (PD) for each parameter is calculated using the formula:
Table 1 highlights the degradation of key performance parameters. The maximum power output (Pmp) shows a sig- nificant decrease of 29.61%, indicating a considerable loss in the module’s power-generating capability after 13 years. The short-circuit current (Isc) has decreased by 5.6%, suggesting a moderate reduction in the current generation under short- circuit conditions. The open-circuit voltage (Voc) experienced a smaller decline of 2.14%, reflecting the typical slower degra- dation of voltage compared to current. The maximum voltage (Vmp) decreased by 15.47%, and the maximum current (Imp) dropped by 16.76%, both contributing to the reduction in maximum power output. The fill factor (FF), measured at 58.86%, indicates a reduced efficiency in the module’s power conversion after prolonged exposure to desert conditions. Collectively, these results demonstrate the significant impact of environmental factors on the long-term performance and reliability of PV modules in harsh climates.
In a typical warranty or performance guarantee, PV module manufacturers often state that the module will retain at least 80% of its rated power output after 25 years. This means that under standard operating conditions, a 100 W PV module should ideally still produce 80 W after 25 years of use. However, based on the data provided in Table 2 and the observed degradation pattern, the 100 W PV module has already degraded to 79.39 W after only 13 years. This indicates that the module has reached, or even slightly exceeded, the 80% power threshold significantly earlier than expected. The 80% threshold, typically guaranteed by manufacturers as the end-of-life criterion, is calculated as:
80% Threshold = Pinitial × 0.8
∙ Forecasting PV Module Degradation Using Exponen- tial Triple Smoothing (ETS) Model
For PV module degradation forecasting, we applied the Expo- nential Triple Smoothing (ETS) model using Microsoft Excel’s (=FORECAST.ETS) function to forecast the future power output of a 100 W PV module, which, after 13 years of operation, showed a measured power of 74.09 W. The ETS model, specifically the Holt-Winters approach, is commonly used in time-series forecasting as it captures trends through three smoothing components: level, trend, and seasonality. However, in this case, the seasonal component is set to zero (=0), as the data does not exhibit seasonal variation. Instead, the model focuses on level and trend components, with smoothing factors determined automatically by Excel’s algorithm to minimize forecast error. The model is represented mathematically by the following three equations:
Level Equation:
Lt = α · (Xt − St−m) + (1 − α) · (Lt−1 + Tt−1)
where Lt is the level at time t, Xt is the observed value at time t, St−m is the seasonal component (which is zero here), and α is the level smoothing factor.
Trend Equation:
Tt = β · (Lt − Lt−1) + (1 − β) · Tt−1
where Tt represents the trend component at time t and β is the trend smoothing factor.
Forecast Equation:
Xˆt+h = Lt + h · Tt
where Xˆt+h is the forecasted power output h periods into the future and h represents the forecasting horizon.
For this forecast, Excel calculated the following smoothing factors: Alpha (0.50), Beta (0.50), and Gamma (0.00) as given in Table 3, which indicate equal weighting on the level and trend, with no seasonal component. This model was applied to predict the power output of the PV module from Year 14 to Year 25, with both lower and upper confidence bounds, as shown in Table 2.
The forecast results are further visualized in Figure 5, which illustrates the predicted degradation trend for the PV module power output over the next 12 years, including the confidence intervals. The forecast line (solid orange) shows a declining trend, aligning with the observed degradation pattern. The dotted lines represent the lower and upper confidence bounds, indicating the potential range within which actual power output might fall, thus accounting for forecast uncertainty.
The statistical metrics for model accuracy given in Table 3, including MASE (0.04), SMAPE (0.00), MAE (0.08), and RMSE (0.08), suggest that the model provides a close fit to the historical data. These low error values imply that the forecast is reliable for projecting future power degradation.
The forecast suggests that the PV module’s power will continue to decline, reaching approximately 53.29 W by Year 25, well below the 80 W threshold typically expected in PV module warranties. This forecasted degradation indicates that the PV module will fall short of the 25-year lifespan expected by manufacturers due to accelerated degradation under the environmental conditions experienced over the initial 13 years.
6. Conclusions
This study evaluates the degradation of a crystalline silicon photovoltaic (PV) module over 13 years of exposure to the extreme desert conditions of Dhahran, Saudi Arabia. Environ- mental stressors, including high temperatures (up to 45°C), intense UV radiation (> 11 during peak months), and high irradiance (exceeding 1000 W/m²), have significantly impacted the module’s performance. The module’s power output has declined by 29.61%, reaching the 80% performance threshold prematurely, and indicating a faster degradation rate than typically anticipated for such modules. Forecasting analysis projects that, if this trend continues, the module’s power will fall to approximately 53.29 W by year 25, well below expected warranty levels.
Statistical metrics, including low MASE (0.04), SMAPE (0.00), MAE (0.08), and RMSE (0.08) values, confirm the accuracy of the predictive model applied. Electroluminescence (EL) imaging reveals extensive inactive regions, attributed to microcracks, interconnect failures, and encapsulant degrada- tion. Visual inspection corroborates these findings, showing discoloration and yellowing of the encapsulant layer, which are consistent with UV and thermal degradation effects.
These results underscore the necessity for PV modules engi- neered with materials offering enhanced UV and thermal stability to withstand harsh desert climates. Such advancements are essential to improving the durability, efficiency, and cost- effectiveness of solar power systems in extreme environments, supporting the long-term viability of solar energy deployment in desert regions.
Acknowledgments
The authors would like to express their profound gratitude to King Abdullah City for Atomic and Renewable Energy (K.A. CARE) for their financial support in accomplishing this work, as well as to the Interdisciplinary Research Center for Sustainable Energy Systems (IRC-SES), King Fahd University of Petroleum and Minerals, under project No. INRE2204. The authors also extend their appreciation to the Gulf Renewable Energy Laboratory (GRL), a UL GCCLAB Joint Venture, Dammam, Saudi Arabia, for providing technical assistance and lab test reports in accordance with international standards.
References
- A. Bouaichi, P.-O. Logerais, A. El Amrani, A. Ennaoui, and C. Messaoudi, “Comprehensive analysis of aging mechanisms and design solutions for desert-resilient photovoltaic modules,” Sol. Energy Mater. Sol. Cells, vol. 267, p. 112707, 2024. [CrossRef]
- N. Kahoul, R. Chenni, H. Cheghib, and S. Mekhilef, “Evaluat- ing the reliability of crystalline silicon photovoltaic modules in harsh environment,” Renew. Energy, vol. 109, pp. 66–72, 2017. [CrossRef]
- H. Al Mahdi, P. G. Leahy, M. Alghoul, and A. P. Morrison, “A Review of Photovoltaic Module Failure and Degradation Mechanisms: Causes and Detection Techniques,” 2024. [CrossRef]
- H. Wang et al., “Potential-induced degradation: Recombination behav- ior, temperature coefficients and mismatch losses in crystalline silicon photovoltaic power plant,” Sol. Energy, vol. 188, pp. 258–264, 2019. [CrossRef]
- M. Va´zquez and I. Rey-Stolle, “Photovoltaic module reliability model based on field degradation studies,” Prog. Photovoltaics Res. Appl., vol. 16, no. 5, pp. 419–433, Aug. 2008. [CrossRef]
- B. Al-Ramadan, A. S. Aldosary, A. Al Kafy, S. Alsulamy, and Z. A. Rahaman, “Unraveling the spatiotemporal dynamics of relative humidity in major Saudi Arabian cities: A synergy of climate modeling, regression analysis, and wavelet coherence,” Theor. Appl. Climatol., vol. 155, no. 8, pp. 7909–7935, 2024. [CrossRef]
- A. Qudah, A. Almerbati, and E. M. A. Mokheimer, “Novel approach for optimizing wind-PV hybrid system for RO desalination using differential evolution algorithm,” Energy Convers. Manag., vol. 300, p. 117949, 2024. [CrossRef]
- S. Poddar, F. Rougieux, J. P. Evans, M. Kay, A. A. Prasad, and S. P. Bremner, “Accelerated degradation of photovoltaic modules under a future warmer climate,” Prog. Photovoltaics Res. Appl., vol. 32, no. 7, pp. 456–467, Jul. 2024. [CrossRef]
- Y. Lyu et al., “Impact of environmental variables on the degradation of photovoltaic components and perspectives for the reliability assess- ment methodology,” Sol. Energy, vol. 199, pp. 425–436. 2020. [CrossRef]
- B. Bora et al., “Accelerated stress testing of potential induced degradation susceptibility of PV modules under different cli- matic conditions,” Sol. Energy, vol. 223, pp. 158–167. 2021. [CrossRef]
- A. Pozza and T. Sample, “Crystalline silicon PV module degradation after 20years of field exposure studied by electrical tests, electrolumi- nescence, and LBIC,” Prog. Photovoltaics Res. Appl., vol. 24, no. 3, pp. 368–378, Mar. 2016. [CrossRef]
- V. E. Puranik, R. Kumar, and R. Gupta, “Progress in module level quantitative electroluminescence imaging of crystalline silicon PV module: A review,” Sol. Energy, vol. 264, p. 111994, 2023. [CrossRef]
- R. Khatri, S. Agarwal, I. Saha, S. K. Singh, and B. Kumar, “Study on long term reliability of photo-voltaic modules and analysis of power degradation using accelerated aging tests and electrolumines- cence technique,” Energy Procedia, vol. 8, pp. 396–401, 2011. [CrossRef]
Figure 1.
Yearly Temperature Dhahran Saudi Arabia.
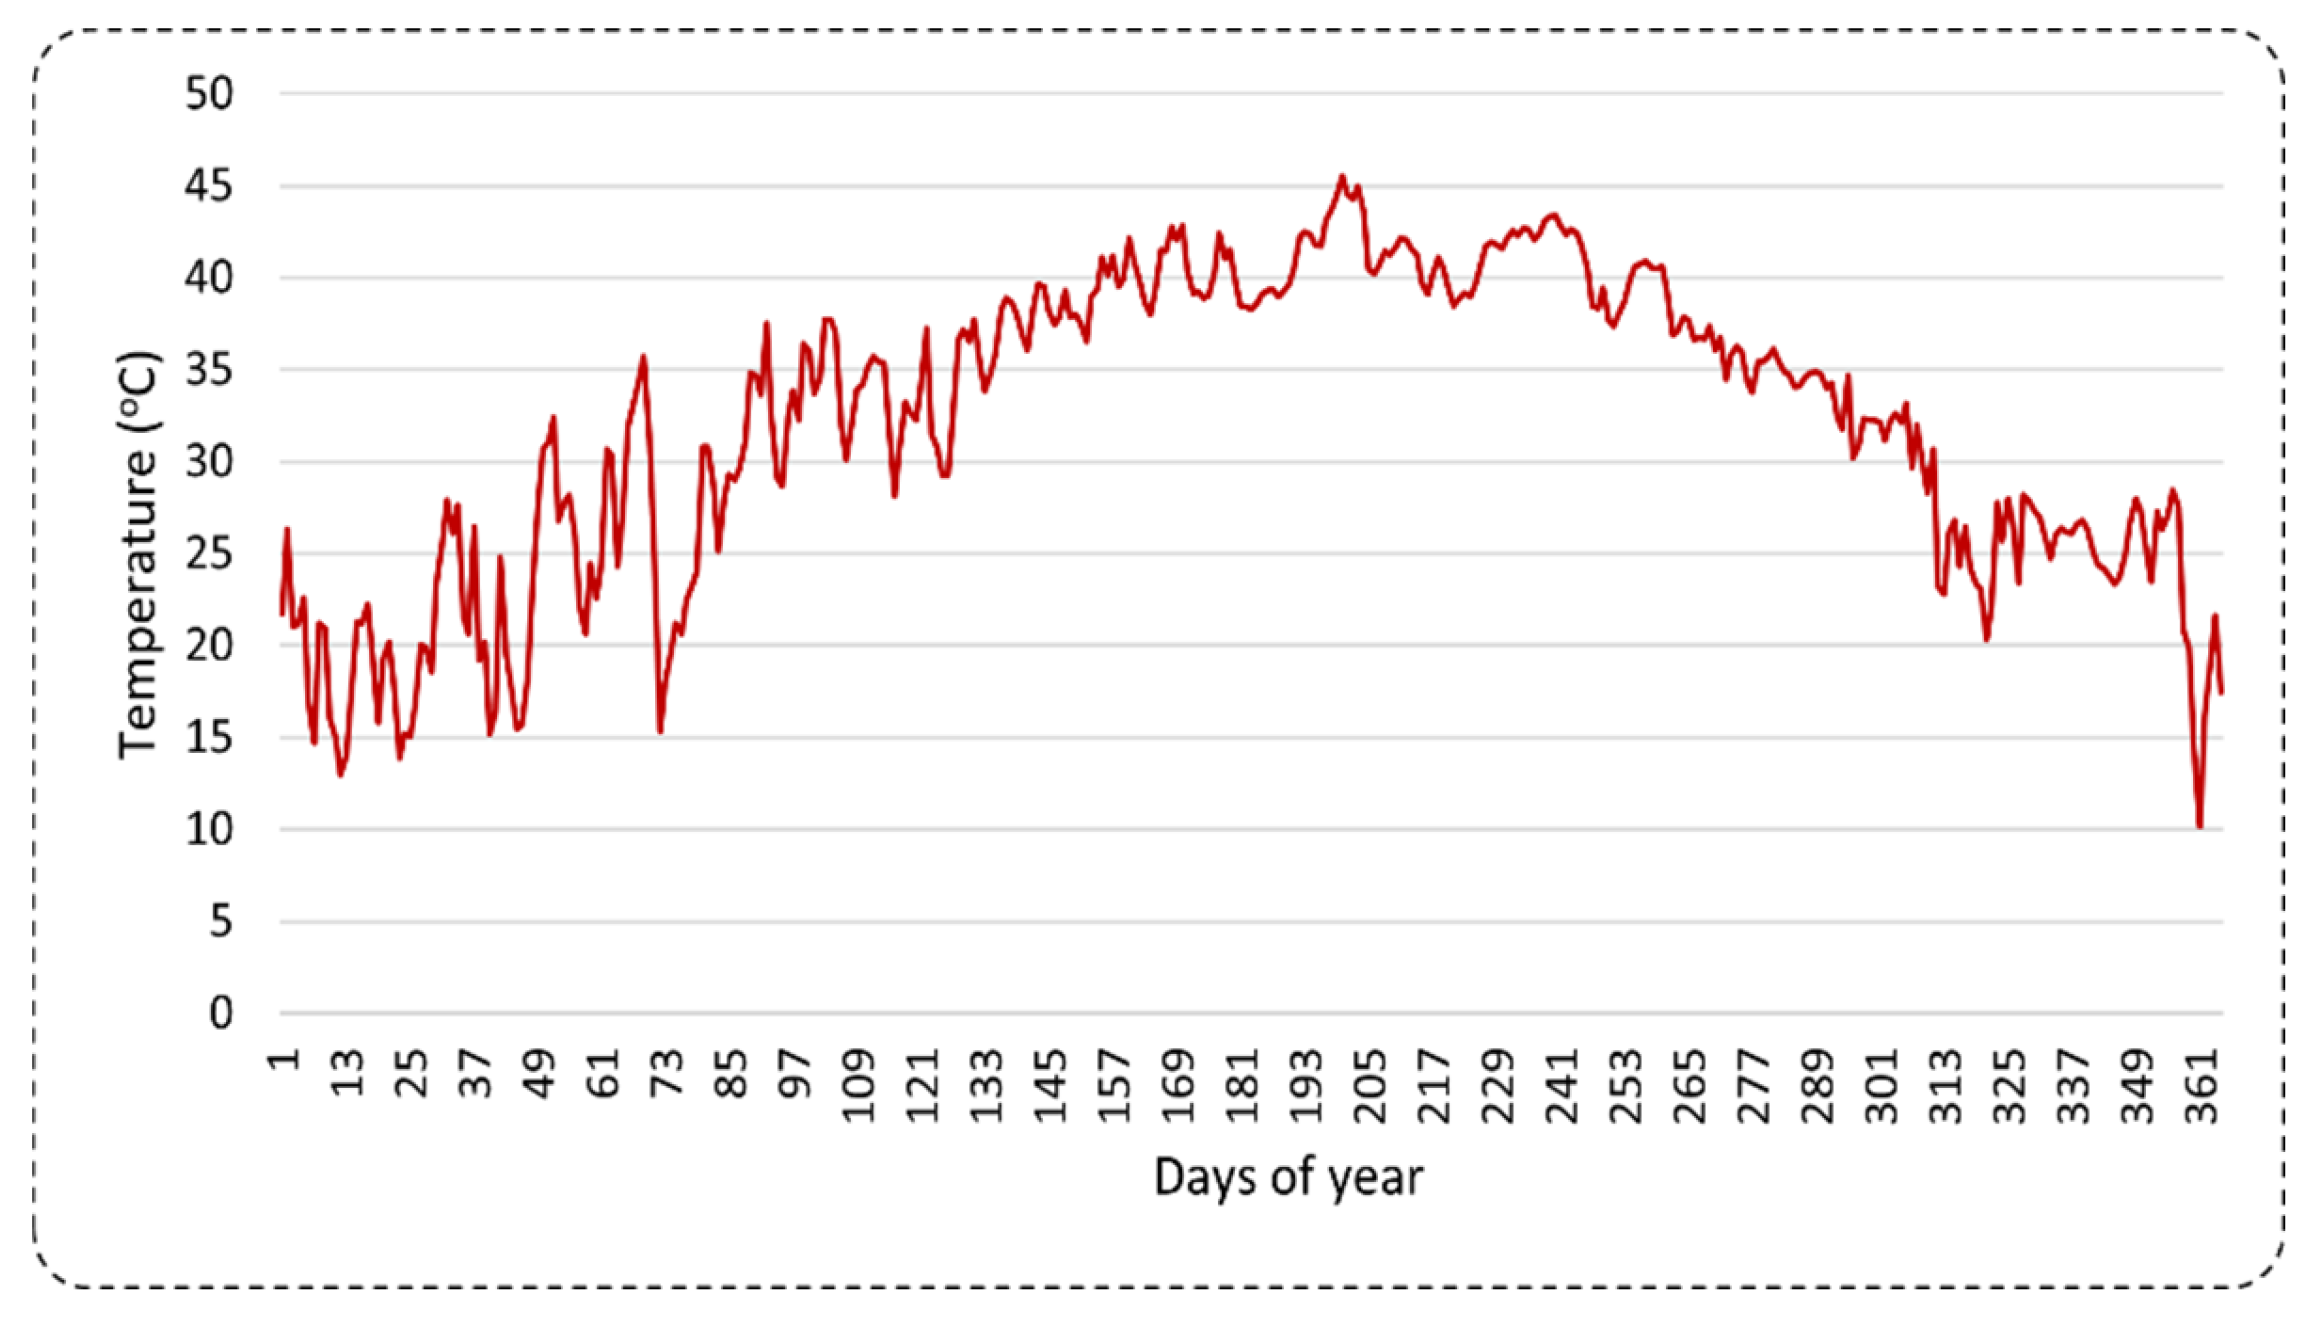
Figure 2.
UV level in Dhahran Saudi Arabia.
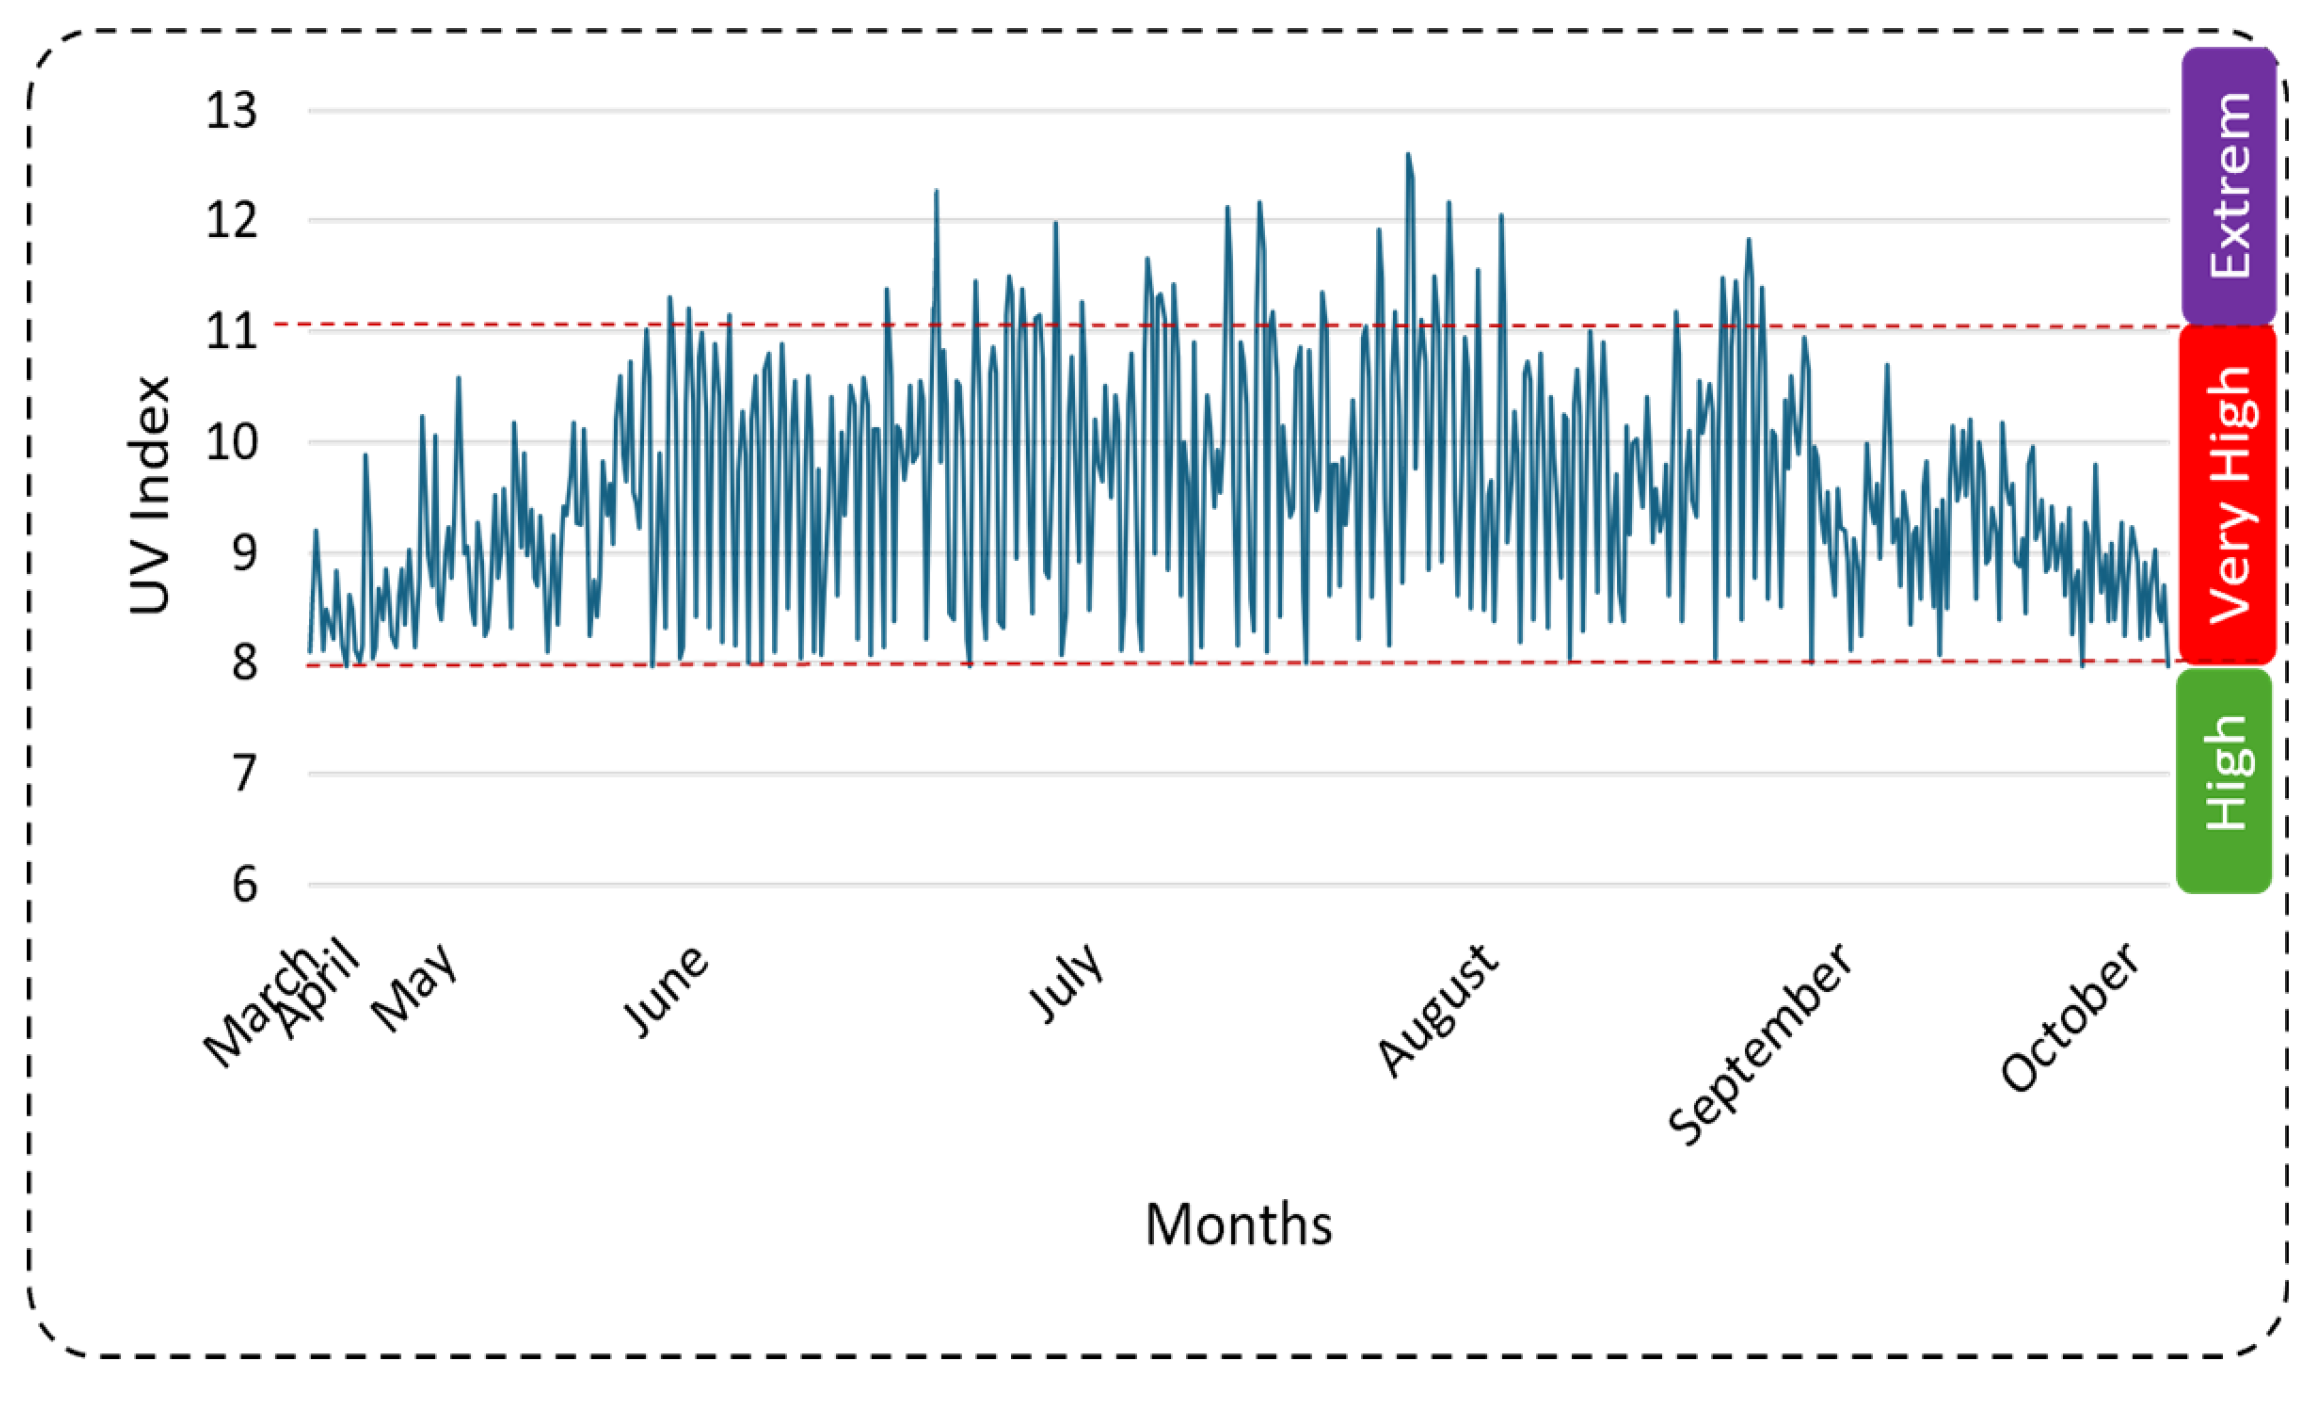
Figure 3.
Solar Irradiation at Dhahran Saudi Arabia.
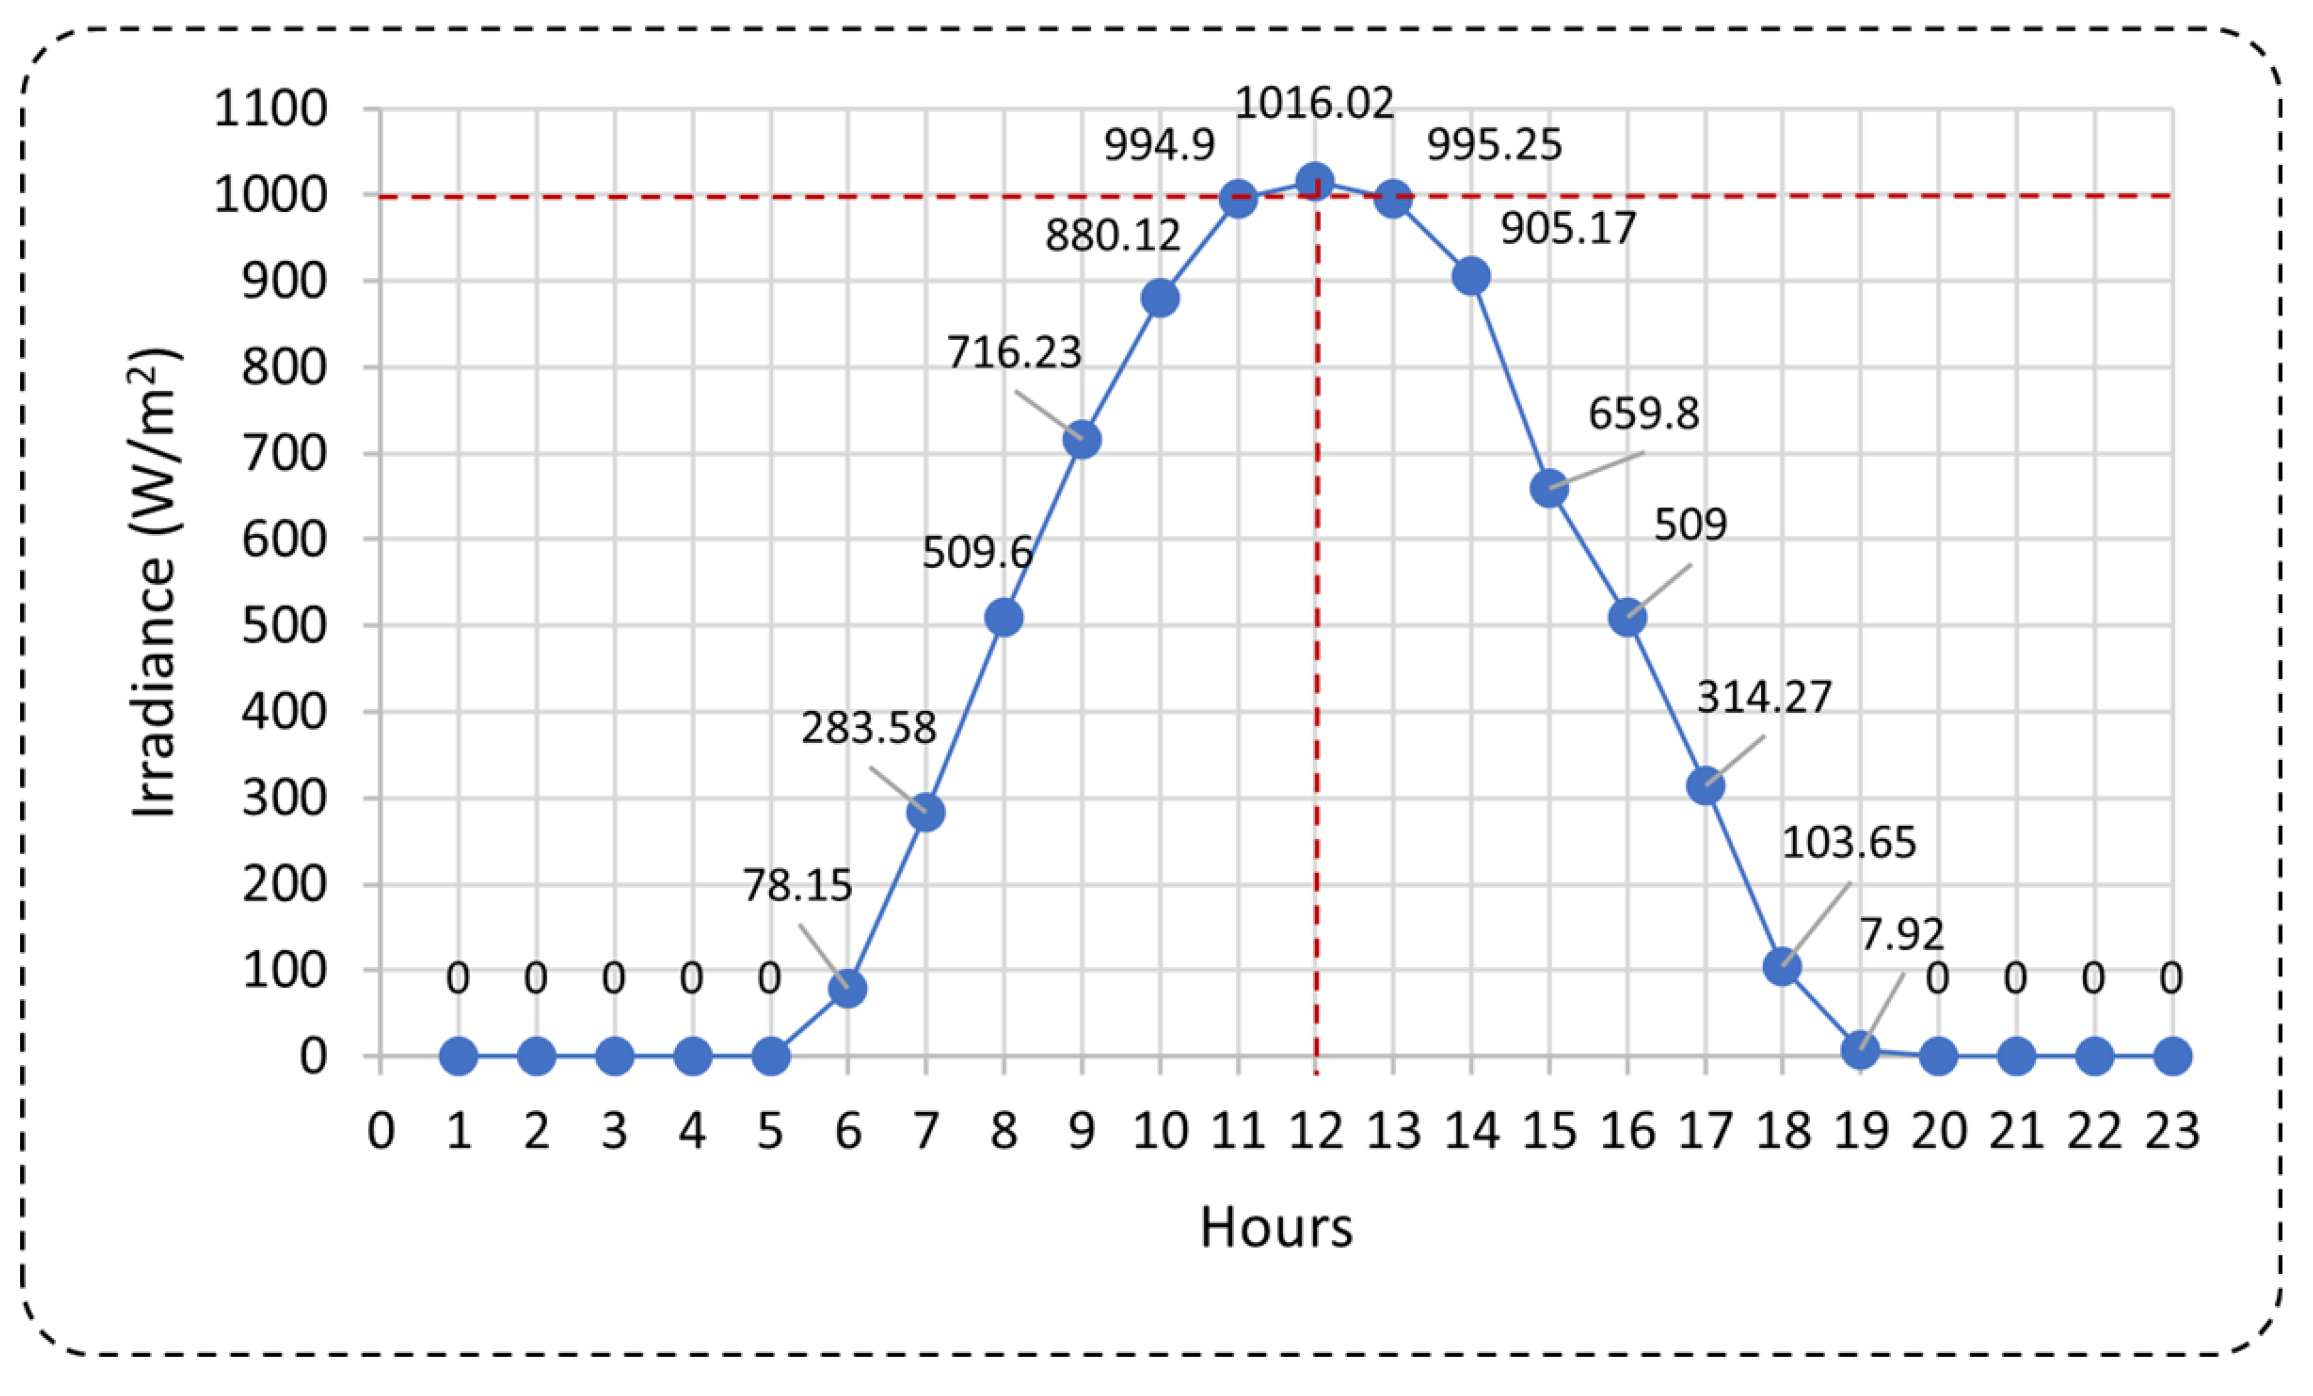
Figure 4.
(a) PV Front, (b) Back and (c) EL.
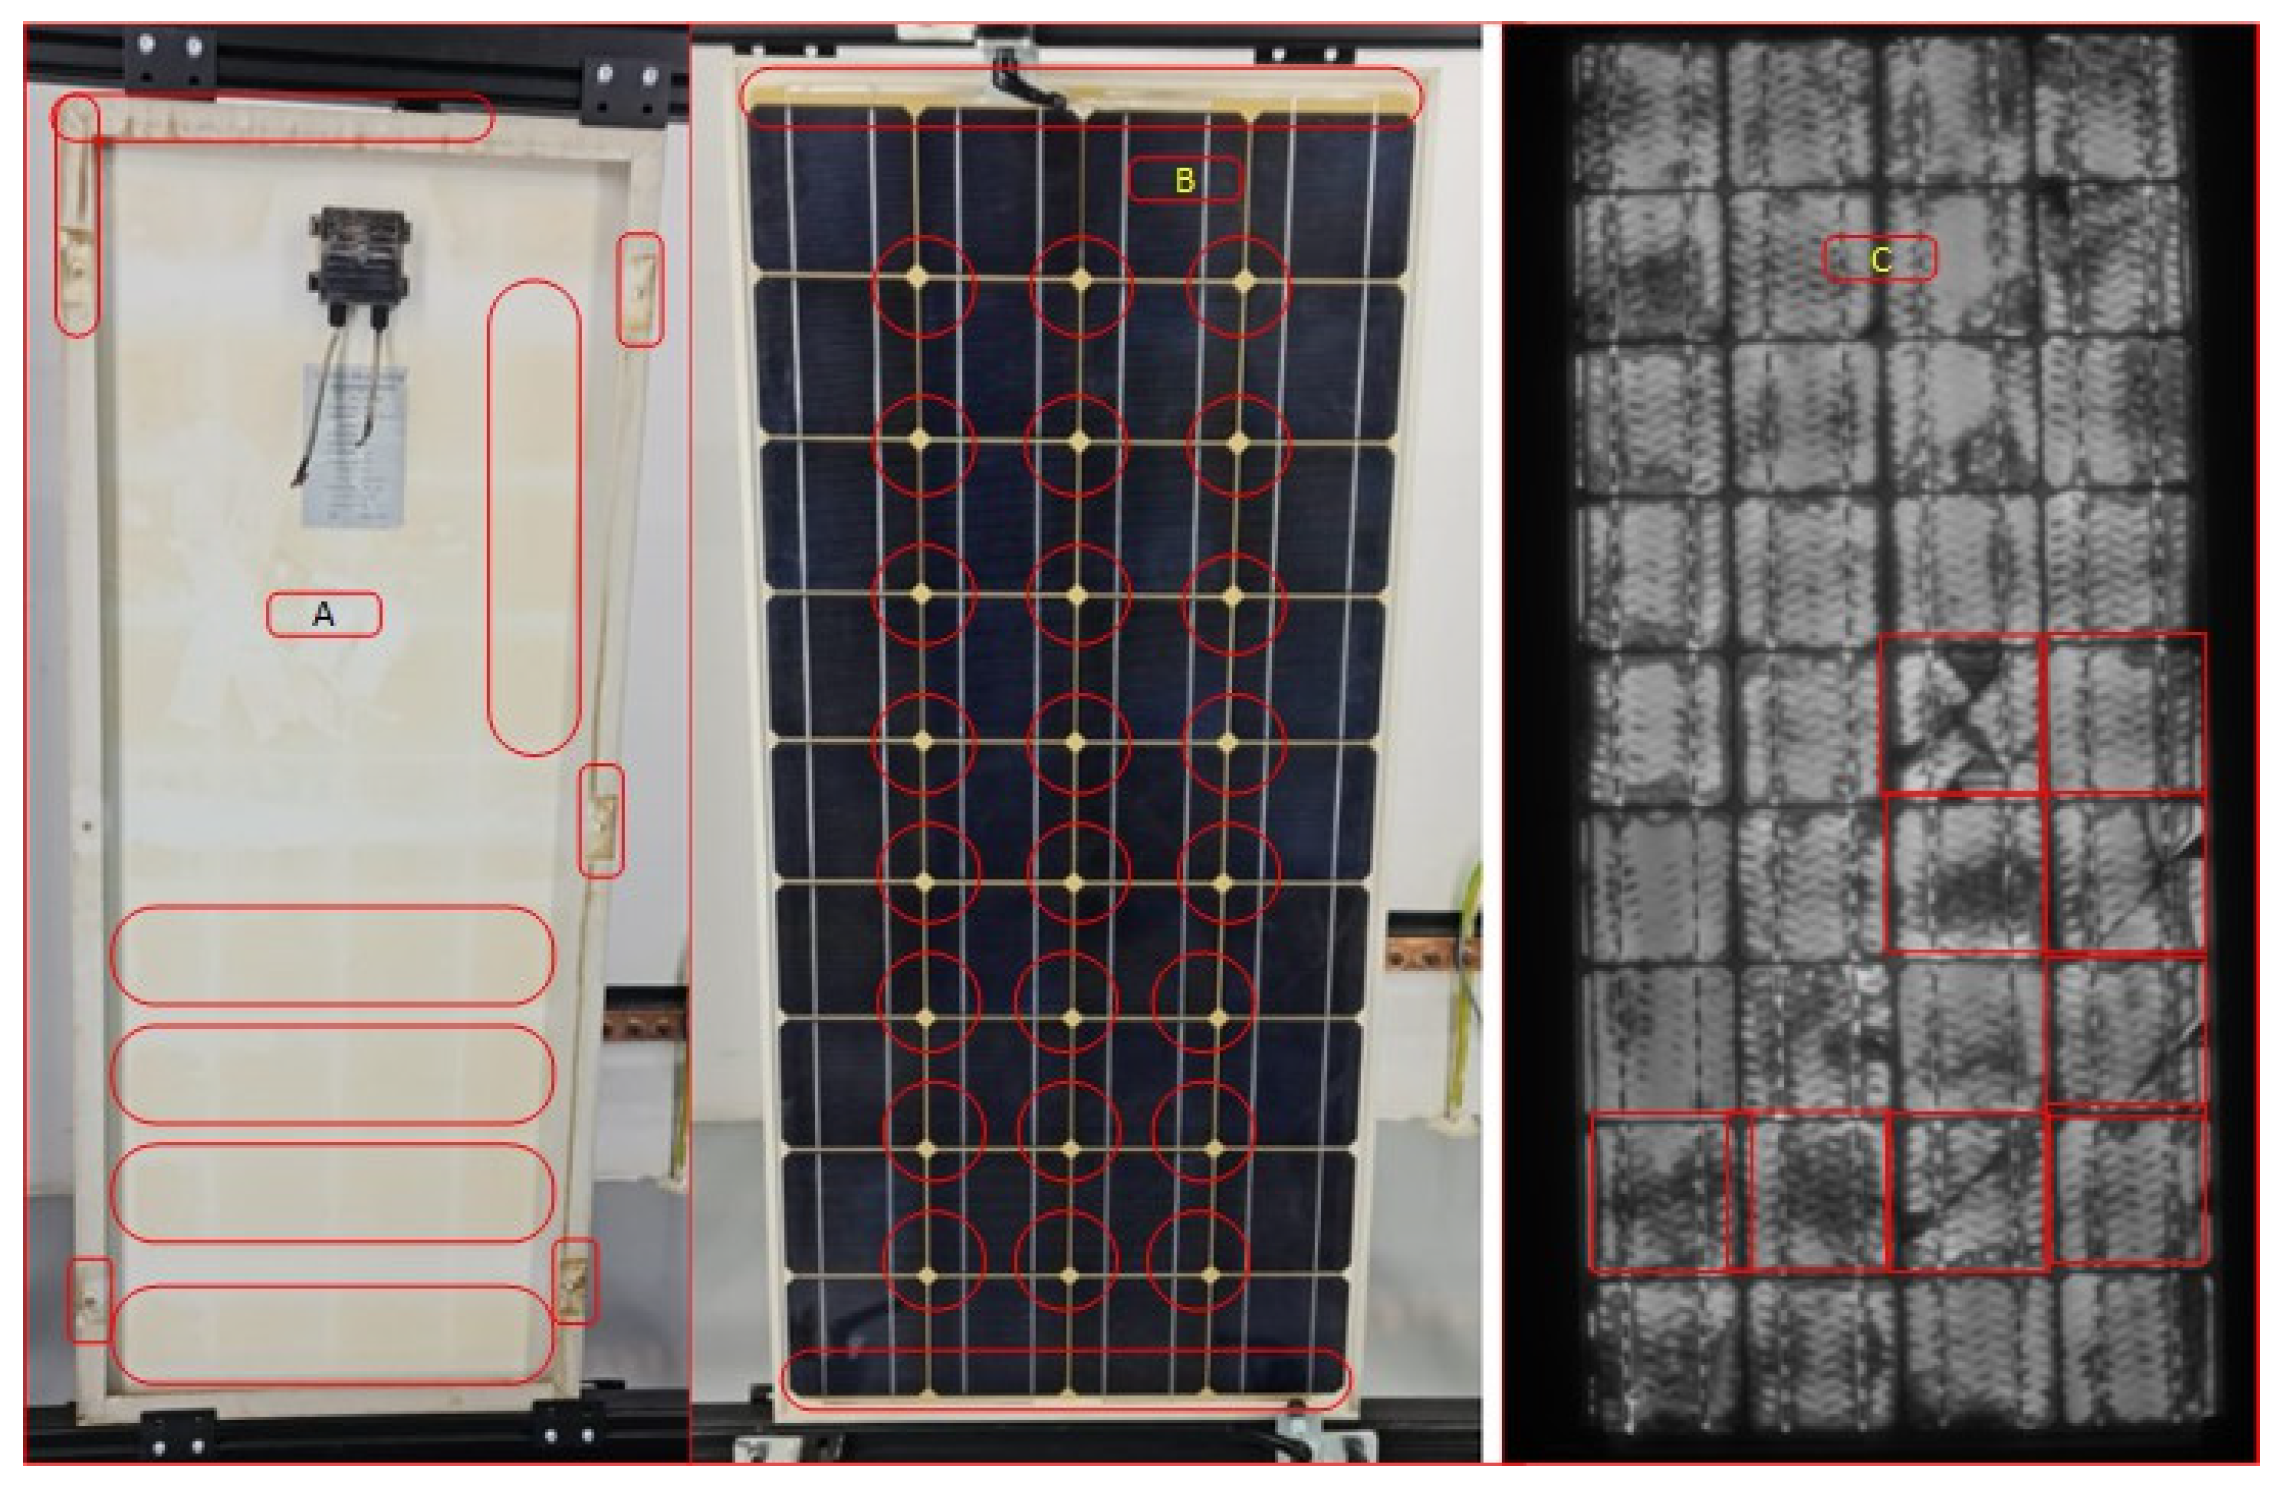
Figure 5.
Forecasted PV Module Power Output (Years 14-25) with Confidence Intervals.
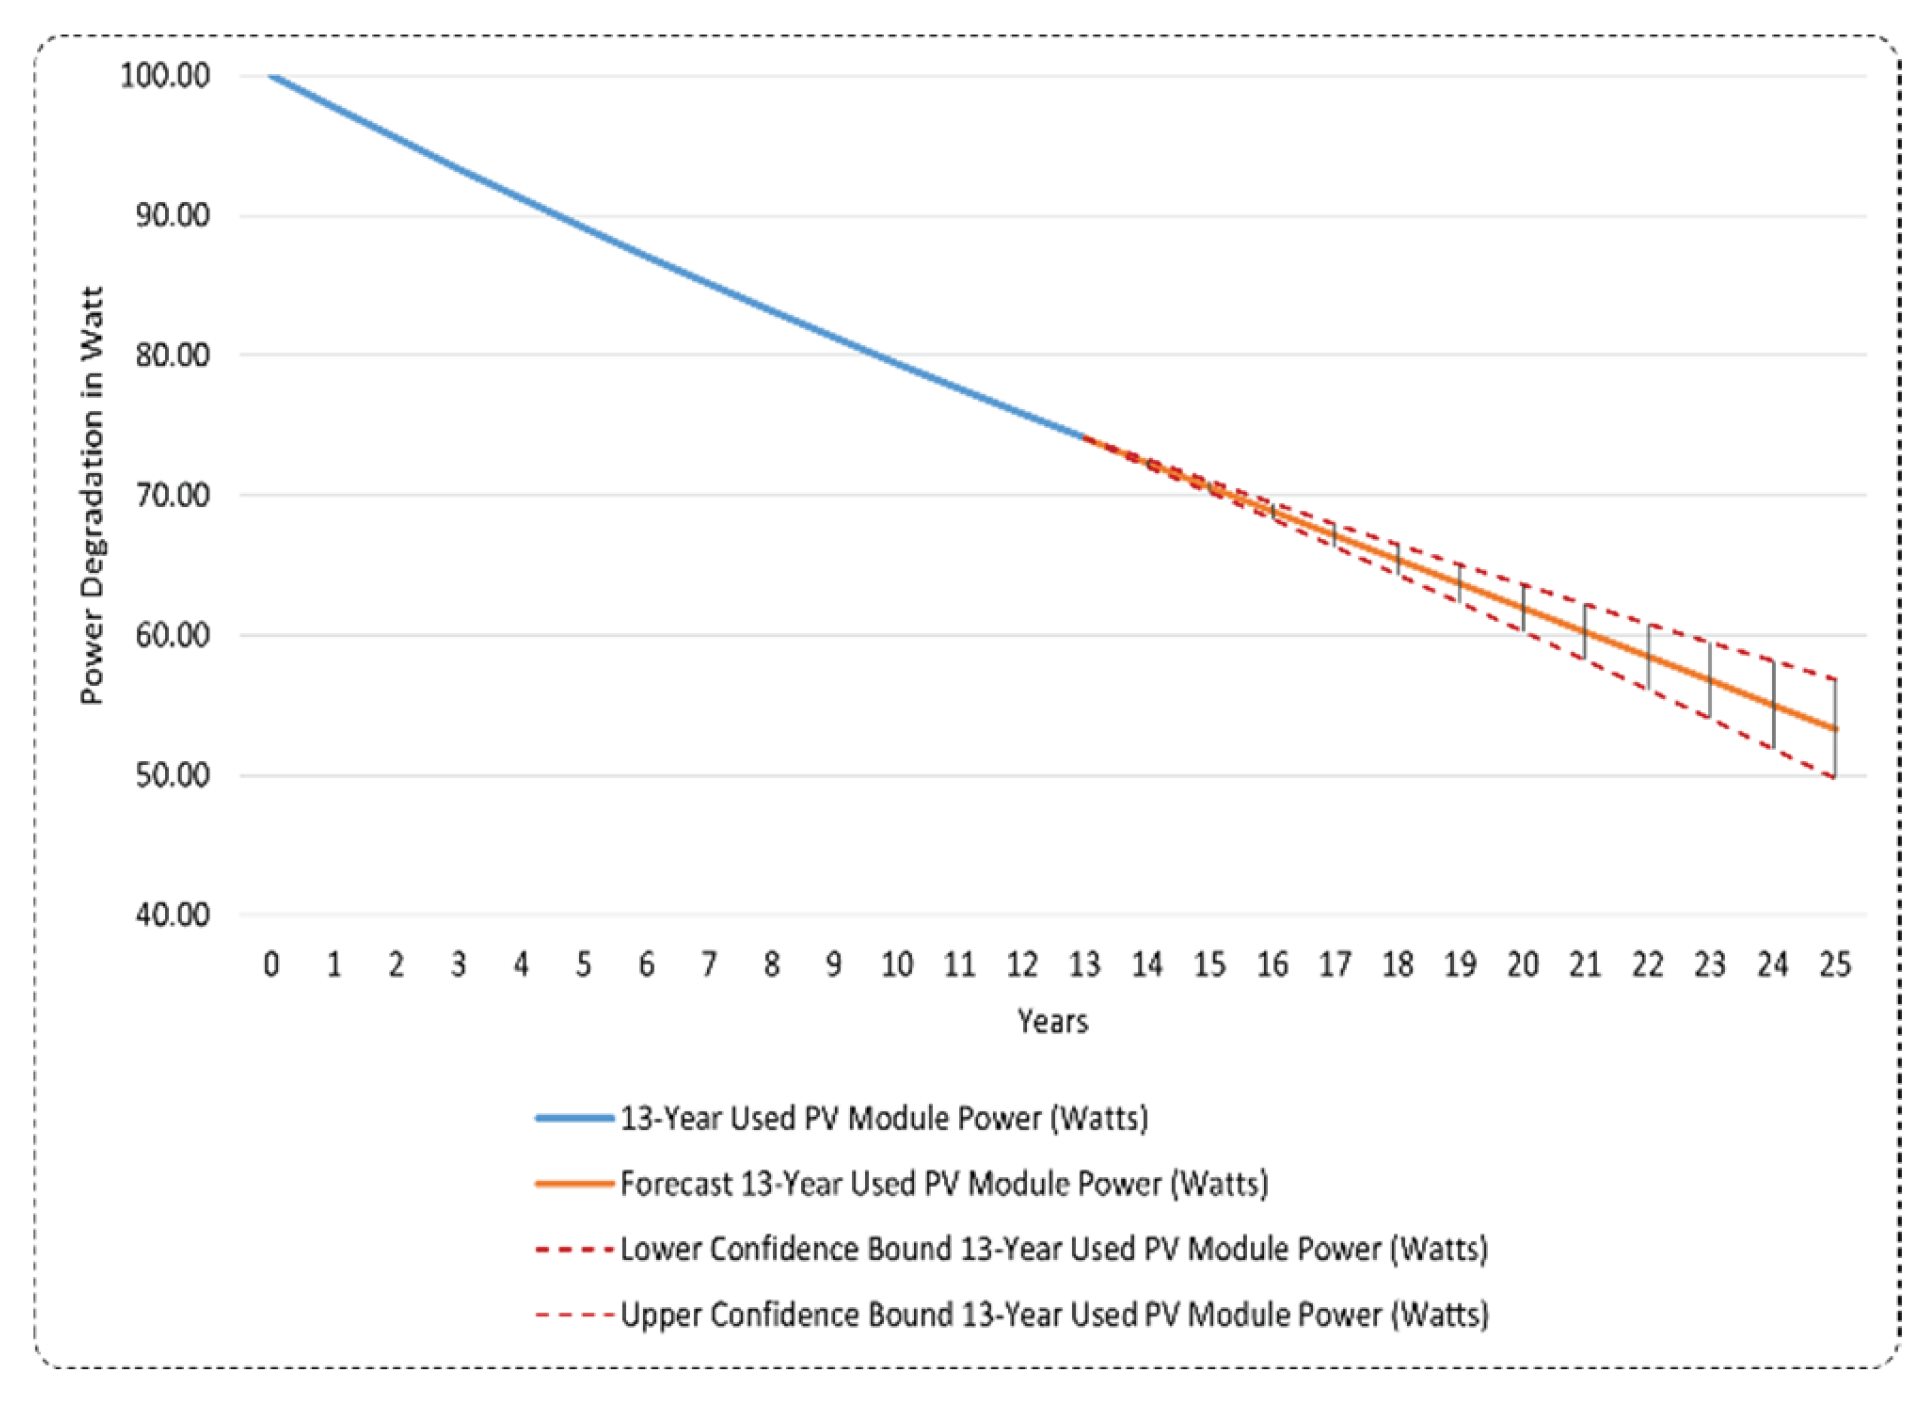

Table 1.
PV Module Degradation Results.
| Parameter | Manufacturer Data |
Lab Test Data After 13 Years |
Decrease in % |
| Pmp [W] | 100 W | 70.39 | 29.61 |
| Isc (A) | 5.68 | 5.36 | 5.63 |
| Voc (V) | 22.8 | 22.31 | 2.14 |
| Vmp [V] | 19 | 16.06 | 15.47 |
| Imp [A] | 5.26 | 4.38 | 16.76 |
| (FF) | – | 58.86% | – |
Table 2.
Forecasted PV Module Power Output with Lower and Upper. Confidence Bounds from Year 13 to Year 25.
Table 2.
Forecasted PV Module Power Output with Lower and Upper. Confidence Bounds from Year 13 to Year 25.
| Year |
13-Year Used PV Module Power (Watts) |
Forecast 13-Year Used PV Module Power (Watts) |
Lower Confidence Bound (Watts) |
Upper Confidence Bound (Watts) |
| 0 | 100.00 | |||
| 1 | 97.72 | |||
| 2 | 95.49 | |||
| 3 | 93.31 | |||
| 4 | 91.19 | |||
| 5 | 89.11 | |||
| 6 | 87.08 | |||
| 7 | 85.09 | |||
| 8 | 83.15 | |||
| 9 | 81.26 | |||
| 10 | 79.40 | |||
| 11 | 77.59 | |||
| 12 | 75.82 | |||
| 13 | 74.09 | 74.09 | 74.09 | 74.09 |
| 14 | 72.32 | 72.32 | 72.04 | 72.60 |
| 15 | 70.59 | 70.59 | 70.20 | 70.98 |
| 16 | 68.86 | 68.86 | 68.29 | 69.43 |
| 17 | 67.13 | 67.13 | 66.33 | 67.93 |
| 18 | 65.40 | 65.40 | 64.34 | 66.46 |
| 19 | 63.67 | 63.67 | 62.32 | 65.02 |
| 20 | 61.94 | 61.94 | 60.28 | 63.60 |
| 21 | 60.21 | 60.21 | 58.21 | 62.21 |
| 22 | 58.48 | 58.48 | 56.12 | 60.83 |
| 23 | 56.75 | 56.75 | 54.02 | 59.48 |
| 24 | 55.02 | 55.02 | 51.89 | 58.15 |
| 25 | 53.29 | 53.29 | 49.74 | 56.83 |
Table 3.
Statistical Parameters for Forecasting Model.
| Statistic | Value |
| Alpha | 0.50 |
| Beta | 0.50 |
| Gamma | 0.00 |
| MASE | 0.04 |
| SMAPE | 0.00 |
| MAE | 0.08 |
| RMSE | 0.08 |
Disclaimer/Publisher’s Note: The statements, opinions and data contained in all publications are solely those of the individual author(s) and contributor(s) and not of MDPI and/or the editor(s). MDPI and/or the editor(s) disclaim responsibility for any injury to people or property resulting from any ideas, methods, instructions or products referred to in the content. |
© 2025 by the authors. Licensee MDPI, Basel, Switzerland. This article is an open access article distributed under the terms and conditions of the Creative Commons Attribution (CC BY) license (http://creativecommons.org/licenses/by/4.0/).
Copyright: This open access article is published under a Creative Commons CC BY 4.0 license, which permit the free download, distribution, and reuse, provided that the author and preprint are cited in any reuse.


