
Submitted:
15 December 2025
Posted:
17 December 2025
You are already at the latest version
Abstract
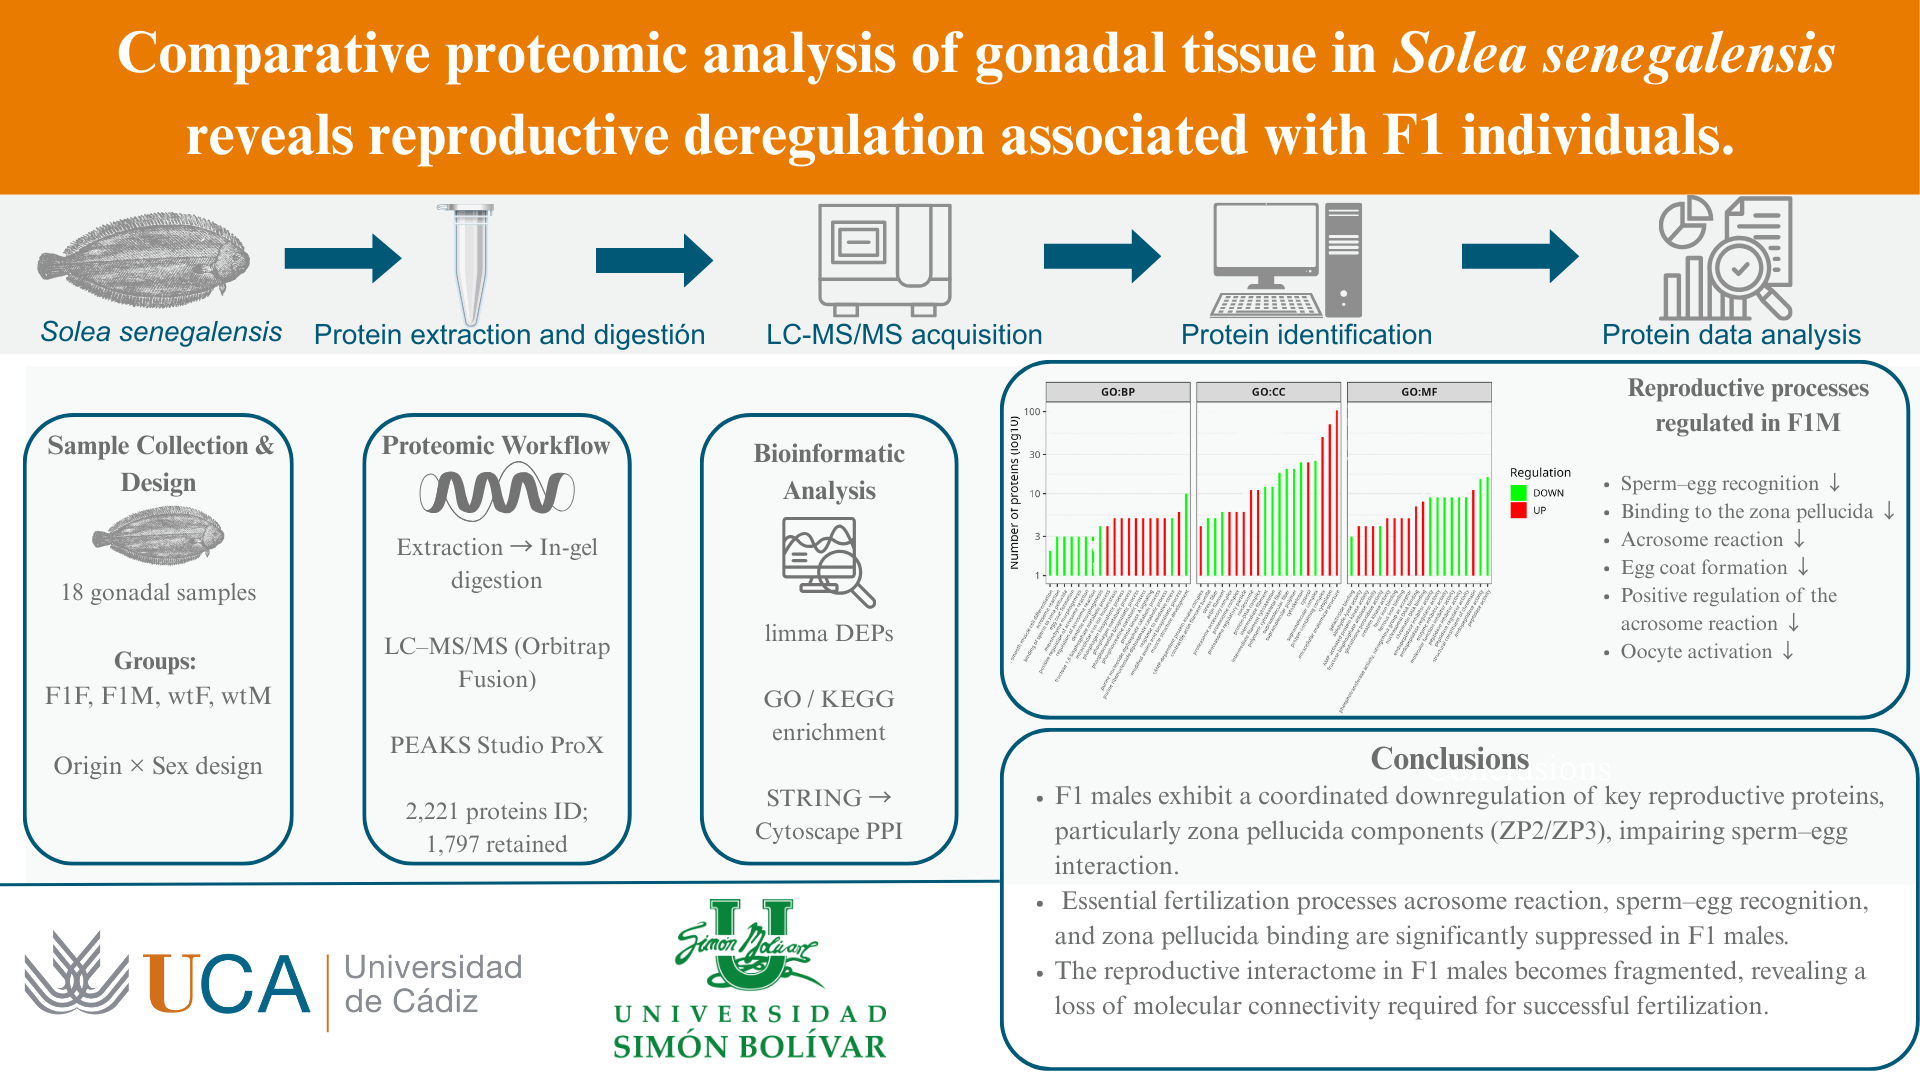
Reproductive dysfunction in captive-bred Senegalese sole (Solea senegalensis) limits the consolidation of its aquaculture production, particularly due to reduced fertility and poor sperm quality in F1 males. To elucidate the molecular mechanisms underlying this problem, a quantitative proteomic analysis was conducted on gonadal tissues from wild and F1 males and females using LC–MS/MS. A total of 2,221 proteins were identified, of which 1,797 were retained after quality filtering. Comparative analyses revealed a clear segregation by origin (F1 (cultivated) and wild) and sex (male and female), and 86 proteins were differentially expressed between F1 and wild males. Functional enrichment showed a significant downregulation of key reproductive processes in F1 males, including sperm–egg recognition, binding of sperm to zona pellucida, and acrosome reaction, suggesting impaired gamete interaction and fertilization ability. Conversely, F1 males displayed enrichment of metabolic and proteolytic pathways, indicative of compensatory energy demands. Protein–protein interaction network analysis identified a reproductive subnetwork dominated by zona pellucida sperm-binding proteins, which exhibited reduced connectivity in F1 males. These results demonstrate a coordinated suppression of molecular components essential for sperm–egg communication and acrosomal exocytosis, providing proteomic evidence for a systemic deregulation of the reproductive machinery in F1 fish. This study identifies potential protein biomarkers linked to reproductive performance, offering molecular targets to improve broodstock management and fertilization success in S. senegalensis aquaculture.
Keywords:
Solea senegalensis
; gonadal tissue
; proteomic analysis
; reproductive dysfunction
1. Introduction
Solea senegalensis (Kaup 1858) is a flatfish belonging to the Soleidae family that is mainly distributed along the Mediterranean and Atlantic coasts of southeastern Europe and northeastern Africa [1]. This species has high commercial interest being in 2023, the global harvest of Senegalese sole (S. senegalensis) from aquaculture of 2,284 tones. By 2024 it is expected to grow by 10% to about 2,600 tones [2]. For several years now, it has been proposed as a species with high potential for the diversification of aquaculture in Europe [3].
Reproduction control in aquaculture is essential to provide good quality gametes and thus obtain mass production of larvae, and to be able to implement improvement programs that allow preserving traits of commercial interest [4,5]. The main obstacle to the cultivation of S. senegalensis has been described as the reproductive dysfunction of male sole born and breeded in captivity or cultivated, F1 [6]. This dysfunction is related to reproductive behavior, such as the lack of courtship by F1 males and mate selection by females [7].
Senegalese sole is oligospermic (produces <130 μl of semen), and shows asynchronous and semicistic spermatogenesis, i.e., the differentiation of haploid spermatids into spermatozoa (spermiogenesis) takes place within the lumen of the seminiferous tubules [5,8]. However, sperm production and quality, measured in terms of sperm volume and motility, is lower in F1 sole than in wild specimens, which could be a reason for the low fertilization of the F1 [9].
In the last years, strategies aimed at addressing the reproductive problem of S. senegalensis have been diverse, including hormonal therapies [5,10,11,12], in vitro fertilization [13], or supplementing sole diet with macroalgae [14]. However, none of these interventions have yet provided a definitive solution to the problem.
Furthermore, coexistence experiments between sole have been carried out, and it has been described that F1 breeding soles that were in the presence of wild breeders, or that were previously raised, during their juvenile stage, with wild breeders, show behavioral learning capacity, which leads them to reproductive success, showing courtship activity and egg fertilization, although over time both reproductive behavior and successful spawning decrease. Furthermore, it has been determined that, in these soles, there was minimal participation of breeders in spawning and fertilization (only one pair is responsible for the offspring), which leads to a loss of genetic variability in the offspring [15,16].
With the development of omics techniques, the first transcriptome assembly was performed by Benzekri et al. [17]. Subsequently, three assemblies of the sole genome have been made [18,19,20], identifying the follicle-stimulating hormone receptor, FSHR, as the sex-determining gene of S. senegalensis [20].
Recent studies of the methylome in gonadal samples of S. senegalensis males, at different stages of maturity and of different origin (wild or reared in captivity), have shown that those reared in captivity (F1) showed higher levels of methylation than wild ones, with DMCpGs (Differentially Methylated CpGs) sites associated with genes related to sex differentiation and gonadal development [21,22]. Thus, a negative correlation has been shown between methylation at CpG sites and the expression of genes involved in calcium, TGF-beta, and MAPK signaling pathways, which were deregulated in F1 male sole. These pathways are crucial for cell differentiation, gonadal development, maturation, and cell activation, and are therefore related to reproductive processes [22]. It has been suggested that hypermethylation of the MAPK pathway and low expression of the fshr gene in F1 sole testes could result in an alteration of the endocrine axis, generating reduced fertility [22]. Furthermore, it has been shown that genes associated with olfactory receptors and behavior in S. senegalensis were overexpressed in wild males compared to F1 [22,23].
The determination of proteomic profiles in gonadal tissues provides a detailed insight into the underlying biological processes that regulate reproductive physiology in teleost fish [24]. In particular, comparative proteomics has emerged as a powerful tool for assessing changes in protein expression associated with environmental variations and the selection of successive generations in aquaculture breeding programs for commercially relevant species [25].
Breeding programs in aquaculture generate divergences in omic profiles, which can influence reproductive quality, gonadal maturation, and the expression patterns of proteins associated with essential biological functions [26].
These differences can affect gamete production and, consequently, the success of restocking and breeding programs [27]. Previous studies [28,29] have identified key proteins involved in processes such as hormonal biosynthesis, cytoskeleton remodeling, and the synthesis of signal transduction factors during gonadal differentiation in flatfish. However, the molecular mechanisms associated with adaptation in F1 individuals of Solea senegalensis remain poorly understood.
Forné et al. [30] studied changes in protein levels during spermatogenesis in two populations of Senegalese sole, one wild and one F1, finding reduced levels of proteins related to sperm motility in F1s, or increased levels of proteins involved in maintaining the redox status in F1, leading to sperm malformation. A decrease in ferritin and keratin levels in F1s has also been observed, which led to impaired fertility in F1 [31].
Under this context, the present study aims to compare the protein expression profiles in gonadal tissues of wild and F1 individuals of Solea senegalensis, utilizing a quantitative proteomic approach based on mass spectrometry. This analysis is intended to identify significant molecular differences that can provide insights into how captive conditions and selection affect the mechanisms of protein regulation in the gonads of males and females, thereby contributing to the development of more efficient reproductive management strategies for this species.
2. Materials and Methods
2.1. Individuals and sampling
The samples were grouped based on two conditions: origin (wild / F1) and sex (males / females). A total of 18 samples were processed, organized into four distinct groups (Table 1). Samples were codified using the initial letter corresponding to the origin, followed by the letter representing the sex, and a number identifying the corresponding replicate.
2.2. Protein extraction
Proteins were isolated from the organic phase generated after treatment of gonadal tissue with QiAzol Reagent and chloroform. This organic phase was treated with isopropanol to precipitate the proteins. Three washes were then performed, adding a guanidine-ethanol solution (0.3 M guanidine hydrochloride in 95% EtOH (100%)) to the protein precipitate, which was incubated at room temperature for 20 min. A final wash was then performed with 100% EtOH. Once the ethanol residue was removed, the proteins were resuspended in a Urea/DTT solution (10 M urea, 50 mM DTT in sterile water) and incubated for 1 h at room temperature. They were subsequently treated at 95 °C for 3 min and sonicated in the cold. The proteins dissolved in Urea/DTT were quantified in a QUBIT 4.0TM Fluorometer (Invitrogen) and stored at -20 ºC until later sent to the Proteomics Unit-SCAI of the University of Córdoba for sequencing.
2.3. Preparation of samples for proteomic study
Protein extracts were cleaned-up in 1D SDS-PAGE at 10% of polyacrilamyde. Samples were loaded in stacking gel and 100 V was applied until electrophoresis front reached resolving gel. After protein extract were separated 1 cm in resolving gel, the electrophoresis was finished, and the gel was stained with Commasie Blue. Protein bands were diced and kept in water until digestion. For the digestion, briefly, protein bands were firstly distained in 200 mM ammonium bicarbonate (AB)/50% acetonitrile for 15 min and 5 min in 100 %Acetonitrile. Protein was reduced by addition of 20 mM dithiothreitol in 25 mM AB and incubated for 20 min at 55 °C. The mixture was cooled to room temperature, followed by alkylation of free thiols by addition of 40 mM iodoacetamide in 25 mM BA in the dark for 20 min. After, protein bands were washed twice in 25 mM AB. Proteolytic digestion was performed by addition of Trypsin (Promega, Madison, WI), 12.5 ng/ul of enzyme in 25 mM AB and incubated at 37 ºC temperature overnight. Protein digestion was stopped by addition of trifluoroacetic acid at 1% final concentration. Digest samples were dried in speedvac.
2.4. nLC-MS2 Analysis
Briefly, nano LC was performed in Dionex Ultimate 3000 nano UPLC (Thermo Scientific) with a C18 75 μm x 50 Acclaim Pepmam column (Thermo Scientific). Previously, peptide mix was loaded in a 300-um x 5 mm Acclaim Pepmap precolumn (Thermo Scientific) in 2% acetonitrile/0.05% TFA for 5 min at 5ul/min. Peptide separation was performed at 40°C for all runs in. Mobile phase buffer A was composed of water, 0.1% formic acid. Mobile phase B was composed of 20% acetonitrile, 0.1% formic acid. Samples were separated at 300 nl/min. Mobile phase B increases to 4-45%B for 60 min; 45-90% B for 1 min, followed by a 5 min wash at 90% B and a 15 min re-equilibration at 4%B. Total time of chromatography was 85 min. Eluting peptide cations were converted to gas-phase ions by nano electrospray ionization and analyzed on a Thermo Orbitrap Fusion (Q-OT-qIT, Thermo Scientific). Mass spectrometer was operated in positive mode. Survey scans of peptide precursors from 400 to 1500 m/z were performed at 120K resolution (at 200 m/z) with a 5 × 10 ion count target. Tandem MS was performed by isolation at 1 Th with the quadrupole, CID fragmentation with normalized collision energy of 35, and rapid scan MS analysis in the ion trap. The AGC ion count target was set to 105 and the max injection time was 75 ms. Only those precursors with charge state 2–5 were sampled for MS2. The dynamic exclusion duration was set to 15 s with a 10-ppm tolerance around the selected precursor and its isotopes. Monoisotopic precursor selection was turned on. The instrument was run in top speed mode with 3 s cycles, meaning the instrument would continuously perform MS2 events until the list of non-excluded precursors diminishes to zero or 3 s, whichever is shorter. The mass spectrometry proteomics data have been deposited to the ProteomeXchange Consortium via the PRIDE [1] partner repository with the dataset identifier PXD071796.
2.5. Data analysis
The raw data were analyzed in PEAKS Studio ProX (Bioinformatics Solution Corp). The reference library is acquired from NCBI. The raw data were analyzed with parent mass error tolerance set to 15 ppm and a fragment mass error tolerance of 0.05 Da. To account for post-translational modifications and chemical labelling, the following settings were used: Carbamidomethylation of cysteine residues was set as fixed modification, methionine oxidation and Acetylation (Protein N-term) was set as variable modification. Protein unique peptides was set to larger than 1 and a high confidence score of −10IgP >20 was applied to indicate an accurately identified protein.
2.6. Bioinformatic study
Bioinformatic analysis was performed in the R environment (v4.3.1) on a quantification matrix. The data were transformed to the log2 scale and filtered to retain only proteins with valid values in at least three biological replicates. Differential expression analysis was conducted using the limma package (v3.56.2), applying linear models and contrasts between experimental groups. Proteins were considered differentially expressed (DEPs) if they met the criteria of a p-value < 0.05 and an absolute difference in log2-fold change > 0.58 Proteins.
For functional annotation, the protein sequences corresponding to the DEPs were subjected to a similarity analysis using BLASTp against the Danio rerio proteome via the NCBI web platform (https://blast.ncbi.nlm.nih.gov). The homologous identifiers obtained were processed in R and subsequently used for functional enrichment analysis of Gene Ontology (GO) terms and KEGG pathways using the online tool g:Profiler (https://biit.cs.ut.ee/gprofiler, version 2024.05).
Protein-protein interaction (PPI) networks were constructed using the differentially expressed proteins (DEPs) that were downregulated in the F1F vs. F1M comparison. The RefSeq identifiers were first converted to Danio rerio identifiers through a BLASTp analysis, and subsequently used as input for the STRING database (https://string-db.org/) version 12.0, applying a confidence score threshold of ≥ 0.7. The resulting network was exported in .graphml format and imported into Cytoscape v3.10.0 for visualization and topological analysis. Centrality metrics (degree, betweenness, and closeness) were calculated. Functional annotation and node categorization were performed through the cross-importation of specific protein lists, highlighting key proteins with reproductive functions for subsequent analysis and interpretation.
3. Results
3.1. Identification and quantification of proteins
A total of 2,221 proteins were identified across the 18 gonadal tissue samples of Solea senegalensis (Table S1). Following filtering, 1,797 proteins were retained, specifically considering those detected in at least three replicates within the same experimental group (Figure 1). The analysis of shared proteins between groups revealed a core set of 955 proteins common to all conditions, alongside group-specific expression patterns. Specifically, 9 proteins were identified exclusively in the F1F group, 18 in the F1M group, 7 in the wtF group, and 3 in the wtM group (Table S2). Furthermore, shared subgroups were observed among specific combinations, such as 8 proteins common between wtF and wtM and 19 between F1F and F1M, suggesting internal similarities between groups sharing the same origin (Figure 1).
Exploratory proteomic analysis and identification of exclusive proteins
After the normalization of the intensities, proteins detected in a minimum of two replicates within each experimental group were considered for subsequent analysis. This criterion, implemented using less restrictive thresholds, enabled an expansion of the detection scope without compromising the biological validity of the resulting data. This approach facilitated the robust identification of proteins exhibiting group-specific expression within the dataset. Consequently, a substantial number of unique proteins was detected, including 50 exclusives to wild-type individuals, 68 to F1 individuals, 385 to males, and 108 to females. This outcome clearly reveals differential expression patterns associated with both the origin and the sex of the analyzed specimens. The comparison of proteins exclusive to F1 males (F1M) vs. those of wild-type males (wtM) revealed a divergent protein expression profile (Table S3). Specifically, 33 proteins were found to be unique to wtM, and 23 were exclusive to F1M.
In the F1M group, the exclusive proteins included, among others, arpin-like protein (XP_043873833.1), filamin-binding LIM protein 1 (FBLIM1) (XP_043880017.1), cysteine and glycine-rich protein 3 (CSRP3) (XP_043880807.1), tubulin polymerization-promoting protein family member 2 (TPPP2) (XP_043883540.1), protein PAT1 homolog 1 (PATL1) (XP_043884691.1), heat shock protein 75 kDa mitochondrial (Hsp75) (XP_043906303.1|XP_043906302.1), and sarcoplasmic/endoplasmic reticulum calcium ATPase 2/ATPase 2 (SERCA2) (XP_043897940.1|XP_043897939.1), among others. These proteins were implicated in the regulation of cellular morphology, cytoskeletal stability and cell motility, microtubule dynamics, RNA processing, and calcium homeostasis. Furthermore, they are considered fundamental for the maintenance of testicular function [32,33,34]. These findings suggest that the F1M group exhibits a distinct regulatory state of the cytoskeleton and cellular mobility, possibly reflecting an adaptation or disruption related to their origin. Conversely, the proteins exclusively detected in the wtM group included components strongly linked to sperm function and gamete interaction (Table S3). These specific proteins were cilia- and flagella-associated protein 53 (CFAP53) (XP_043868067.1, XP_043868068.1), multiple isoforms of tubulin α/β (axonema), sperm acrosome membrane-associated protein 4-like (SPACA4) chain oocyte (XP_043892398.1), RIB43A-like with coiled-coils protein 2 (RIBC2) (XP_043892598.1) and, nucleoside diphosphate kinase 7 (NME 7) (XP_043900902.1, XP_043900901.1) (Table S3).
This differential profile suggests that, while F1 males maintain conserved 'core' modules (e.g., cell dynamics, metabolism, and proteostasis), they are deficient in key motility and acrosomal markers that are distinctly present in the wild-type (wt) population. This finding is entirely consistent with the dysregulation of reproductive processes inferred from subsequent Gene Ontology (GO) and Protein-Protein Interaction (PPI) analyses, which will be presented further on the paper.
3.2. Correlation and clustering analysis
The Pearson correlation coefficient (Figure S1a) demonstrated a clear segregation among the experimental groups, thus revealing a strong intragroup correlation and a lower intergroup correlation, particularly between the wild-type (wt) and F1 individuals, as well as between sexes. Additionally, the Principal Component Analysis (PCA) confirmed this structure by identifying a clear separation between males and females, and between the groups of different origin (F1 and wt), primarily along the first two principal components (Figure S1b).
Furthermore, the protein expression analysis, visualized via the heatmap (Figure 2), revealed differentiated clustering patterns of the samples based on both origin and sex. The replicates corresponding to F1 female individuals (F1F) demonstrated high internal consistency, grouping clearly into a separate cluster. In contrast, the samples from males of different origins (F1M and wtM) also showed a tendency to cluster together, albeit with greater dispersion. Wild-type females (wtF) exhibited the highest internal variability, which could potentially reflect greater biological or environmental heterogeneity. These observations from the correlation and clustering analysis collectively suggest that both origin (wild-type vs. F1) and sex contribute significantly to the overall variability of protein expression in the gonads, thereby constituting biologically relevant factors within the experimental model.
3.3. Differential expression analysis
The differential protein expression analysis was conducted for four experimental comparisons between the groups: F1 females vs. F1 males (F1F vs F1M), F1 females versus wild-type females (F1F vs wtF), F1 males versus wild-type males (F1M vs wtM), and wild-type females versus wild-type males (wtF vs wtM). To determine the differentially expressed proteins (DEPs), the following criteria were established: a p-value < 0.05 and a log2 fold change > 0.58.
In the F1F vs F1M comparison (Figure 3a), the largest number of proteins with significant changes was observed: 524 proteins were overexpressed in males and 77 were underexpressed in females, while 1178 proteins showed no significant differences. These results demonstrated a marked divergence in the proteomic profile between females and males within the F1 group. Table S4 shows the five most differentially overexpressed and underexpressed proteins in each compared group, which are indicated in Figure 3. In the F1F vs wtF comparison, 90 proteins were detected as overexpressed in the wild-type females and 27 as underexpressed in the F1 females. The majority of proteins (1331) did not exhibit significant changes (Figure 3b). The comparison between males of different origins (F1M vs wtM) (Figure 3c) showed a moderate number of differentially expressed proteins (DEPs), with 47 proteins overexpressed in the wild-type (wt) and 39 underexpressed in the F1 group, compared to 1608 proteins with no significant change in expression. Among the downregulated proteins in F1M were the enzyme glutathione peroxidase 1b (GPX1b) (XP_043879076.1), which prevents cellular damage caused by oxidative stress; keratin type II cytoskeletal 8 (KRT8) (XP_043892356.1), responsible for maintaining cellular integrity in response to stress and indirectly related to fertility, as its expression is linked to processes such as embryonic development; neuroblast differentiation-associated protein AHNAK (AHNAK) (XP_043896809.1), which regulates calcium channels, blood-brain barrier formation, embryonic development, and lipid metabolism, among other processes. Finally, in the wtF vs wtM comparison, 271 proteins were identified as overexpressed in males and 35 as underexpressed in females, while 1445 proteins showed no notorious differences (Figure 3d). The observed distribution suggests a differential regulation of the proteome associated with sex, which is maintained even under natural conditions in wild-type individuals.
3.4. Functional enrichment analysis in Gene Ontology (GO)
To characterize the biological functions associated with the differentially expressed proteins (DEPs), a functional enrichment analysis was performed for the four comparisons based on Gene Ontology (GO) annotations. The annotated DEPs were classified into the three main GO categories: Biological Process (BP), Cellular Component (CC), and Molecular Function (MF). This classification allowed for an interpretation of the functional context of the observed proteomic changes. The GO functional enrichment analysis revealed a consistent pattern of underexpression in terms associated with reproductive functions in the comparisons involving F1 males. This finding suggests a possible compromise in their mechanisms of reproductive competence under culture conditions.
In the F1F vs F1M comparison (Figure 4a), proteins underexpressed in F1 males showed significant enrichment in terms associated with reproductive functions, such as binding of sperm to zona pellucida (GO:0007339), fertilization (GO:0009566), sperm-egg recognition (GO:0035036), and regulation of reproductive process (GO:2000241). These findings reflect a reduction in proteins implicated in sperm recognition, adhesion, and fusion events. A similar trend was observed in the F1M vs wtM comparison (Figure 4c), where F1 males displayed a repression of processes such as acrosome reaction (GO:0007340), egg coat formation (GO:0035803), and supramolecular complex (GO:0099080). This suggests a systematic deregulation in functions essential for fertilization and sperm function. The F1F vs wtF comparison (Figure 4b) revealed an overexpression of proteins linked to structural processes and cytoskeleton reorganization in F1 females, including terms such as extracellular matrix structural constituent (GO:0030020), actin cytoskeleton organization (GO:0030036), and cell-matrix adhesion (GO:0007160). Concurrently, proteins underexpressed in F1F were associated with ribonucleoprotein assembly and post-transcriptional regulation, specifically spliceosomal complex (GO:0005681) and RNA binding (GO:0003723). Finally, the wtF vs wtM comparison (Figure 4d) showed an overrepresentation of metabolic processes, protein maturation, and proteasome activity in wild-type females, with terms like protein folding (GO:0006457), ATP metabolic process (GO:0046034), and proteasome complex (GO:0000502). In contrast, wild-type males showed enrichment in lipid transport and lipoprotein metabolism pathways, such as lipid localization (GO:0010876) and extracellular vesicle (GO:1903561), highlighting physiological sexual differences within the wild context.
GO Level 2 term enrichment in F1F vs F1M and F1M vs wtM comparisons
To delve deeper into the Biological Process (BP) category, an additional analysis was applied utilizing GO Level 2 terms. This hierarchical level allows for the identification of broad yet functionally informative biological processes, thereby facilitating the comparison between experimental conditions that involved F1 male individuals. Consequently, the analysis was focused solely on the F1F vs. F1M and F1M vs. wtM comparisons. This decision was made because these comparisons exhibited a greater functional diversity and biological relevance of the enriched terms, in contrast to the Cellular Component (CC) and Molecular Function (MF) categories, where the terms at this level presented less variability and interpretive contribution.
In the comparison between F1 females and F1 males (F1F vs F1M), proteins overexpressed in the females F1 were predominantly associated with intracellular transport processes. Among the most notable pathways were positive regulation of protein localization to endosome (GO:1903217), early endosome to late endosome transport (GO:0042147), and protein localization to nuclear envelope (GO:1902594) (Figure 5a). This suggests an elevated activity in mechanisms of subcellular organization and vesicular dynamics within the gonads. Conversely, F1 males showed a significant negative regulation of proteins involved in key reproductive functions. Prominent terms included sperm-egg recognition (GO:0035036), acrosome reaction (GO:0007340), egg activation (GO:0007343), and binding of sperm to zona pellucida (GO:0007339) (Figure 5b). These results point to a reduced expression of components essential for fertilization and sperm competence, which may be influenced by conditions associated with the captive environment or by differences in sexual maturation between the sexes [35].
In the comparison between F1 males and wild-type males (F1M vs. wtM), the GO Level 2 functional enrichment analysis of the Biological Process (BP) category revealed a clear contrast between overexpressed and underexpressed proteins. Proteins overexpressed in F1 males were primarily associated with metabolic and energetic processes, including phosphagen metabolic process (GO:0042400), phosphocreatine biosynthetic process (GO:0014862), glycolytic process (GO:0006096), and ADP catabolic process (GO:0046033). Furthermore, pathways related to purine ribonucleoside diphosphate catabolic process (GO:0009154) and intracellular iron ion homeostasis (GO:0006879) were also enriched (Figure 5c). This pattern indicates an increased bioenergetic and cellular maintenance activity in the gonads of F1 individuals, reflecting a possible metabolic compensation in response to culture conditions, which may demand higher energetic expenditure to sustain tissue homeostasis. Conversely, proteins underexpressed in F1 males showed a strong representation of terms linked to essential reproductive processes, such as sperm–egg recognition (GO:0035036), binding of sperm to zona pellucida (GO:0007339), acrosome reaction (GO:0007340), egg coat formation (GO:0035803), and positive regulation of acrosome reaction (GO:2000345) (Figure 5d). Since these processes are determinant for sperm maturation and spermatozoon-oocyte interaction during fertilization, their reduction suggests a dysregulation of the reproductive molecular machinery in F1 males. Additionally, underexpression of terms associated with muscle cell differentiation (GO:0042692) and muscle structure development (GO:0061061) was observed. This could reflect alterations in flagellar architecture and sperm cytoskeleton dynamics, potentially affecting motility and fertilizing competence.
These results highlight a clear functional separation: while the gonads of F1 males prioritize metabolic and energy production pathways, the gonads of wild-type individuals maintain the expression of key components associated with fertilization and sperm maturation. This evidence points to a functional reorientation of the gonadal proteome in F1 males, where the imbalance between metabolism and reproduction may represent a central mechanism in the observed decrease in reproductive capacity in cultured individuals
3.5. Functional analysis in KEGG pathways
The Kyoto Encyclopedia of Genes and Genomes (KEGG) pathway enrichment analysis revealed a predominance of processes associated with metabolism, intracellular transport, and cellular structures, although pathways related to reproduction were generally scarce. In the F1F vs. F1M comparison, a significant enrichment was observed in proteins downregulated in F1 males (or upregulated in F1 females) in pathways such as Spliceosome, RNA degradation, and Ribosome biogenesis in eukaryotes, all of which are implicated in post-transcriptional processing and protein synthesis. Conversely, overexpressed proteins (in F1 males or underexpressed in F1 females) were associated with metabolic pathways like Glycolysis/Gluconeogenesis, Apoptosis, Tight junction, Pyruvate metabolism, and Carbon metabolism. This could indicate bioenergetic and cell signaling differences between F1 females and males (Figure S2a). The F1F vs. wtF comparison evidenced a higher proportion of downregulated pathways in F1 females (i.e., enriched in wild-type females), notably Spliceosome, Ribosome biogenesis in eukaryotes, RNA degradation, and Citrate cycle (TCA cycle). This finding might suggest a possible decrease in the RNA processing machinery and energy metabolism in F1 females. Among the overexpressed pathways in F1 females were ECM-receptor interaction, Focal adhesion, Lysosome, and Ferroptosis (Figure S2b), which may be related to mechanisms of cell adhesion, intracellular degradation, and response to oxidative stress. For the F1M vs. wtM comparison, several overexpressed pathways related to metabolism were observed, including Glycolysis/Gluconeogenesis, Fatty acid degradation, Pyruvate metabolism, and Proteasome, suggesting an activation of energetic and proteolytic pathways in F1 males. Furthermore, Motor proteins and Gap junction were enriched, which could indicate changes in cytoskeleton dynamics and intercellular communication. The downregulated pathways were represented by Phagosome, Adherents junction, and Pentose phosphate pathway, although with a lower level of significance (Figure S2c), which indicates a subtle structural and functional modulation in the F1 individuals. Finally, in the wtF vs. wtM comparison, multiple overexpressed pathways enriched in wild-type females were identified, mainly linked to protein degradation and metabolic processes, such as Carbon metabolism, Proteasome, Biosynthesis of amino acids, Valine, leucine and isoleucine degradation, Fatty acid degradation, and Glycolysis/Gluconeogenesis. The downregulated pathways included Nucleocytoplasmic transport and Protein processing in endoplasmic reticulum, albeit with less representation (Figure S2d). This pattern suggests higher metabolic and proteolytic activity in wild-type females, in contrast to wild-type males.
Collectively, the KEGG analysis results highlight marked differences in metabolic and proteolytic activity between sexes and between F1 and wild-type individuals, but with scarce direct representation of pathways classically associated with reproduction.
3.6. Protein -protein interaction (PPI) network
The PPI networks constructed from the downregulated proteins in the F1F vs F1M and F1M vs wtM comparisons revealed a dense and highly modular architecture, reflecting a complex molecular coordination within the gonadal tissue. The network corresponding to F1F vs. F1M (Figure 6a) included 204 nodes and 428 edges, exhibiting a closely interconnected organization with a prominent peripheral cluster. This cluster was composed of zona pellucida (ZP) glycoproteins, including NP_001013289.1 (ZP3a.1), NP_001025291.1 (ZP3a.2), NP_001034972.2 (ZP2.1), NP_571405.2, NP_571903.2, NP_571904.2, and XP_002665864.2 (ZP4). These proteins displayed high local connectivity (degree = 30–42) and multiple links to structural and regulatory nodes, suggesting a coordinated role in sperm-oocyte recognition, fertilization, and zona pellucida remodeling processes. In contrast, the PPI network for F1M vs. wtM (Figure 6b), composed of 99 nodes and 318 edges, exhibited a more fragmented structure. In this network, ZP3a.1 and ZP3a.2 formed an isolated 17-node subnetwork with high internal cohesion (degree = 16 and 12, respectively). This pattern may indicate a loss of reproductive connectivity in F1 males, consistent with the downregulation of GO biological processes associated with sperm-egg binding (GO:0007339), acrosome reaction (GO:0007340), and fertilization (GO:0009566).
These results provide evidence that the concerted deregulation of zona pellucida glycoproteins in F1 individuals alters the reproductive interactome network, potentially affecting sperm recognition capability and fertilization efficiency. Such modifications offer a solid molecular basis to explain the low reproductive capacity observed in S. senegalensis F1 individuals, suggesting that culture conditions induce systemic proteomic reprogramming that impacts both the structural organization and the signaling pathways essential for reproductive success.
Protein-Protein Interaction (PPI) subnetwork
To more specifically examine functional connections between proteins associated with reproductive processes, Protein-Protein Interaction (PPI) subnetworks were constructed, derived from the F1F vs. F1M and F1M vs. wtM comparisons, considering only the downregulated proteins linked to GO terms related to fertilization and sperm-egg binding.
In the subnetwork corresponding to the F1F vs. F1M comparison, a set of seven key proteins (NP_001013289.1, NP_001025291.1, NP_001034972.2, NP_571405.2, NP_571903.2, NP_571904.2, and XP_002665864.2) was identified, forming a densely connected cluster (Figure 7a). These proteins, homologous to Danio rerio zona pellucida sperm-binding proteins, were associated with GO terms such as binding of sperm to zona pellucida (GO:0007339), acrosome reaction (GO:0007340), and sperm-egg recognition (GO:0035036). Within the subnetwork, NP_001013289.1 and NP_001025291.1 exhibited the highest centrality values, suggesting a regulatory role within the mechanisms of sperm recognition and adhesion. The topological organization indicates that these proteins act as coordinated functional nodes whose underexpression could compromise critical stages of oocyte maturation and fertilization in F1 females. The subnetwork obtained for the F1M vs. wtM comparison revealed three main proteins (NP_001013289.1, NP_001025291.1, and NP_999937.2), all linked to GO terms related to fertilization (acrosome reaction [GO:0007340], sperm-egg recognition [GO:0035036], and binding of sperm to zona pellucida [GO:0007339]) (Figure 7b). These proteins formed a peripheral but tightly connected module, indicating a reduced yet specific functional interaction, possibly affected by the downregulation observed in F1 males. The loss of connectivity in this group could suggest an alteration of the molecular pathways involved in sperm competence and oocyte activation.
As observed, both subnetworks provide evidence of a convergent pattern of low expression in the zona pellucida (ZP) family proteins. This suggests that the reproductive dysfunction in S. senegalensis F1 individuals may be associated with a reorganization of the molecular interactions that sustain fertilization and gametic recognition events.
4. Discussion
This study performed a comparative proteomic analysis of gonadal tissue samples from F1 and wild S. senegalensis individuals, with the objective of exploring the molecular basis associated with the low reproductive rate observed in cultured fish. The identification of 2221 proteins across 18 samples reflected a robust coverage of the gonadal proteome, comparable to similar studies in fish such as Cynoglossus semilaevis [36] and Acipenser sinensis [37], where equivalent protein numbers have been reported following the application of LC-MS/MS strategies.
The observed pattern of both shared and unique proteins per group, along with the clustering demonstrated in the correlation analyses, indicated a strong influence of both sex and origin on the protein expression profile. This suggests a significant biological divergence between F1 and wild individuals, as well as between males and females, which is consistent with findings reported in other marine fish where culture conditions have resulted in substantial physiological differences [38].
The differential expression analysis demonstrated that the F1F vs. F1M comparison yielded the highest number of Differentially Expressed Proteins (DEPs), reflecting a pronounced gonadal molecular difference under culture conditions. This finding is consistent with what has been described in Danio rerio, where sex-specific differences in gonadal protein expression are evident [28]. Comparisons between F1 and wild individuals (F1F vs. wtF and F1M vs. wtM) showed a more limited number of DEPs, which may suggest that, while alterations induced by the culture environment exist, their magnitude does not reach that observed between sexes within the same origin. Nevertheless, the wtF vs wtM comparison also evidenced significant differential regulation, indicating that proteomic sexual dimorphism is also present in wild individuals, albeit with profiles distinct from those observed in the F1 generation. One of the enzymes found to be dysregulated in F1M was glutathione peroxidase 1b (GPX1b). This enzyme is known to prevent cellular damage caused by oxidative stress, which, in humans, has been reported to be responsible for numerous types of embryonic damage [39,40]. The GPX1 enzyme has been characterized as a biochemical marker, given that its activity in spermatozoa is associated with sperm quality. Specifically, reduced activity levels have been observed in human males presenting with fertilization issues [41,42].
The GO functional analysis revealed key findings. In the F1F vs. F1M comparison, proteins overexpressed in females were associated with cytoskeletal organization and intracellular trafficking, functions necessary for oocyte development and cytoplasmic reorganization, as previously indicated by studies on teleost oocytes [43,44]. Conversely, the proteins underexpressed in males included processes directly implicated in fertilization and gamete interaction, such as acrosome reaction and binding of sperm to zona pellucida. This could, at least in part, account for the low reproductive competence observed in F1 males. A similar phenomenon has been reported in other cultured teleost species. For instance, in the greater amberjack (Seriola dumerili), male individuals exhibited a more pronounced gonadal regression and lower steroid activity compared to their wild counterparts [45]. Likewise, in domesticated rainbow trout (Oncorhynchus mykiss) populations, genomic signatures of selection were identified that could be associated with adaptation to the culture environment and changes in reproductive efficiency [46].
The results of the functional analysis in the F1M vs. wtM comparison evidenced a significant repression of biological processes associated with reproduction in F1 males, reflected by the negative enrichment of Level 2 GO terms such as sperm-egg recognition (GO:0035036), binding of sperm to zona pellucida (GO:0007339), acrosome reaction (GO:0007340), egg coat formation (GO:0035803), and positive regulation of acrosome reaction (GO:2000345). These processes are essential for gamete interaction, as they regulate sperm-oocyte adhesion, acrosomal exocytosis, and penetration of the egg envelope—all indispensable events for successful fertilization [47,48]. The underexpression of these terms suggests a functional diminution of proteins involved in sperm competence and the fertilizing capacity of F1 males. Specifically, the underexpression of proteins related to the acrosome reaction and sperm recognition indicates an alteration in the calcium-dependent exocytic machinery, which is necessary for releasing hydrolytic enzymes that enable zona pellucida penetration [49,50,51]. In flatfish, proteins homologous to the zona pellucida sperm-binding proteins (ZP2 and ZP3) and acrosomal vesicle proteins have been described as direct mediators of sperm binding and oocyte activation [52,53]. The observed reduction in these components in F1 males suggests that the processes of gamete adhesion and recognition may be partially compromised, thus impacting the efficiency of in vitro fertilization reported in cultured S. senegalensis individuals [3,11]. Furthermore, the enrichment of terms such as muscle cell differentiation (GO:0042692), muscle structure development (GO:0061061), and dendrite morphogenesis (GO:0048813) among the underexpressed proteins may reflect alterations in flagellar cytoskeletal organization, thereby affecting sperm motility. The axonemal structure of the flagellum relies on a coordinated assembly of microtubules and motor proteins such as dyneins and tubulins, the dysregulation of which has been associated with immotile or low-velocity spermatozoa in marine fish under culture conditions [54,55,56]. The finding of the term response to oxidative stress (GO:0006979) within this suppressed set reinforces the hypothesis that oxidative stress acts as a limiting factor for sperm quality in F1 males. One of the proteins observed to be downregulated in F1M was GPX1b. The overproduction of reactive oxygen species (ROS) in the gonads under environmental or metabolic stress can induce mitochondrial damage, lipid peroxidation, and sperm DNA fragmentation [57,58]. The simultaneous reduction of terms associated with antioxidant defense and muscle cell differentiation processes may reflect an accumulated physiological vulnerability in F1 individuals, manifested as a decline in sperm quality and functionality.
Collectively, the coordinated repression of GO terms linked to the acrosome reaction, sperm recognition, and response to oxidative stress highlights a multifactorial reproductive dysfunction in F1 male S. senegalensis. These results suggest that the decline in fertilizing efficiency observed in this generation may be associated with both the alteration of the sperm molecular machinery and a reduced capacity to maintain cellular integrity when subjected to culture conditions.
The KEGG pathway enrichment analysis indicated that the major differences between groups were concentrated in metabolic and intracellular processing pathways. The limited representation of classic reproduction-associated pathways reinforces the idea that the observed effects may be mediated by indirect or post-transcriptional mechanisms, rather than by the direct activation of reproductive pathways. Nevertheless, the overexpression of pathways such as "Apoptosis," "Tight junction," and "ECM-receptor interaction" could be related to gonadal remodeling mechanisms that have been reported as critical during teleost gametogenesis [60].
Finally, the Protein-Protein Interaction (PPI) analysis allowed the extraction of functional subnetworks centered on proteins linked to reproductive processes, identifying a set of proteins homologous to zona pellucida (ZP) glycoproteins, including zp3a.1 (NP_001013289.1), zp3a.2 (NP_001025291.1), zp2.1 (NP_001034972.2), zp2.3 (NP_571903.2), zp2.5 (NP_571405.2), and zp4 (XP_002665864.2). These proteins perform key functions in the formation of the oocyte extracellular matrix and in sperm-egg interaction, acting as essential components of the zona pellucida envelope in teleost fish [61]. In Danio rerio, ZP proteins have been shown to be sex-dependently expressed and localized in the ovarian follicle, directly participating in the attraction and specific binding of spermatozoa to mature oocytes [62]. Their presence has been extensively validated through transcriptomic, proteomic, and immunohistochemical studies [63]. Specifically, zp3a.1 and zp3a.2 act as ligands for sperm receptors, playing a determining role in the success of fertilization [64]. The underexpression of these proteins in F1 individuals, observed in our PPI network and GO analysis, suggests a critical impairment in the architecture and functionality of the zona pellucida. Previous studies in fish have linked the suppression of ZP genes with infertility induced by stress or suboptimal culture conditions [65,66], findings which align with those observed in F1 S. senegalensis individuals. Furthermore, ZP proteins are not only structural but also modulators of the perivitelline environment, as they are involved in the block to polyspermy and the activation of signaling pathways subsequent to fertilization [67]. The peripheral yet highly connected localization of these proteins within the protein-protein interaction (PPI) subnetwork reinforces the hypothesis that their dysfunction could indirectly impact other functional networks associated with reproductive success, including vesicular transport mechanisms and ovarian matrix remodeling.
Collectively, our results suggest that the coordinated underexpression of a group of key reproductive proteins in F1 individuals may be linked to the low fertilization rates observed in culture, offering potential biomarkers for reproductive monitoring in Solea senegalensis breeding programs. This approach has proven effective in teleosts such as Clarias Magur, where PPI network analysis successfully identified genes associated with reproductive processes [68].
5. Conclusions
The comparative proteomic analysis successfully established a robust dataset of the S. senegalensis gonadal proteome and demonstrated that protein expression profiles are strongly influenced by both sex and origin (F1 cultured vs. wild).
A distinct protein profile related to testicular function was identified in F1M compared to wtM. The F1M exclusive proteins demonstrated a deficiency in key such as acrosome reaction, sperm-egg recognition and oocyte activation.
The functional analyses revealed a multifactorial reproductive dysfunction in F1 males, marked by the coordinated repression of proteins essential for successful fertilization, which directly accounts for the low reproductive competence observed in culture.
The subnetwork for the PPI and GO results obtained for the F1M vs. wtM comparison, highlighted the underexpression in F1M of zona pellucida (ZP) homologous glycoproteins (including zp3a.1 and zp3a.2).
Supplementary Materials
The following supporting information can be downloaded at: Preprints.org.
Author Contributions
Conceptualization, L.R. (Laureana Rebordinos); methodology, M.A.-R. (Marco Anaya-Romero), A.A.-P. (Alberto Arias-Pérez), M.E.R. (María Esther Rodríguez), S.P.-B. (Silvia Portela-Bens) and M.A.M. (Manuel Alejandro Merlo); formal analysis, M.A.-R., A.A-P. and L.R.; data curation, L.R., A.A-P. and I.C. (Ismael Cross); writing—original draft preparation, M.A.-R., L.R. and A.A-P.; writing—review and editing, M.E.R. and L.R.; supervision, L.R. and A.A.-P.; project administration, L.R.; funding acquisition, L.R. and I.C. All authors have read and agreed to the published version of the manuscript.
Funding
This research was funded by the Junta de Andalucía [FEDER P20-00938; FEDER CCMM-00014], proyecto cofinanciado por la Consejería de Universidad, Investigación e Innovación de la Junta de Andalucía y por la Unión Europea a través de los fondos Next Generation EU del Plan de Recuperación, Transformación y Resiliencia.
Institutional Review Board Statement
The experimental protocol follower EU guidelines (86/609/EU).
Informed Consent Statement
Not applicable.
Data Availability Statement
The original contributions presented in this study are included in the article/Supplementary material and the mass spectrometry proteomics data have been deposited to the ProteomeXchange Consortium via the PRIDE [1] partner repository with the dataset identifier PXD071796.
Acknowledgments
To the Programa Iberoamericano de Formación de Doctores en el área de las Ciencias del Mar, Universidad de Cádiz (España), Universidad Simón Bolívar (Colombia) and Universidad Laica “Eloy Alfaro” de Manabí (Ecuador). The authors also express their gratitude to Manuel Manchado from IFAPA “El Toruño” in Cádiz, Spain, and the Servicio Central de Investigación en Cultivos Marinos (Univeristy of Cadiz) for supplying samples for this study. During the preparation of this manuscript/study, the author(s) used “Gemini” for language review.
Conflicts of Interest
The authors declare no conflicts of interest.
Abbreviations
The following abbreviations are used in this manuscript:
| AB | Adenosine diphosphate |
| ADP | Adenosine diphosphate |
| BP | Biological process |
| BLASTp | Basic Local Alignment Search Tool for proteins |
| CC | Cellular component |
| CID | Collision-induced dissociation |
| CpG | Cytosine–phosphate–guanine dinucleotide |
| DEPs | Differentially expressed proteins |
| DMCpG | Differentially methylated CpG |
| DTT | Dithiothreitol |
| ECM | Extracellular matrix |
| F1 | Cultivated or born and breed in captivity |
| F1F | Cultivated female |
| FIM | Cultivated male |
| FSHR | Follicle-stimulating hormone receptor |
| GO | Gene Ontology |
| GPX1b | Glutathione peroxidase 1b |
| KEEG | Kyoto Encyclopedia of Genes and Genomes |
| LC–MS/MS | Liquid chromatography–tandem mass spectrometry |
| MAPK | Mitogen-activated protein kinase |
| MF | Molecular function |
| PCA | Principal component analysis |
| PPI | Protein-protein interaction |
| SCAI | Servicios Centrales de Apoyo a la Investigación |
| SDS-PAGE | Sodium dodecyl sulfate – polyacrylamide gel electrophoresis |
| SPACA4 | Sperm acrosome associated 4 |
| STRING | Search Tool for the Retrieval of Interacting Genes/Proteins |
| TCA | Tricarboxylic acid |
| TFA | Trifluoride acetic acid |
| TGF-beta | Transforming growth factor beta |
| UPLC | Ultra-performance liquid chromatography |
| wt | Wild-type |
| wtF | Wild-type female |
| wtM | Wild-type male |
| XP / NP | RefSeq protein accession prefixes |
| ZP | Zona pellucida |
References
- Díaz-Ferguson, E.; Cross, I.; Barrios, M.; Pino, A.; Castro, J.; Bouza, C.; Martínez, P.; Rebordinos, L. Caracterización genética mediante microsatélites de Solea senegalensis (Soleidae, Pleuronectiformes) en poblaciones naturales de la costa atlántica del suroeste de la Península Ibérica. Ciencias Marinas 2012, 38, 129–142. Available online: http://www.scielo.org.mx/scielo.php?script=sci_arttext&pid=S0185-38802012000100010&lng=es&nrm=iso&tlng=es. [CrossRef]
- APROMAR. Aquaculture in Spain 2024. APROMAR 2024. Available online: https://apromar.es/wp-content/uploads/2025/03/Informe2024_v1.4.pdf (accessed on 27 July 2025).
- Morais, S.; Aragão, C.; Cabrita, E.; Conceição, L.E.C.; Constenla, M.; Costas, B.; Dias, J.; Duncan, N.; Engrola, S.; Estevez, A.; et al. New developments and biological insights into the farming of Solea senegalensis reinforcing its aquaculture potential. Rev. Aquacult. 2016, 8, 227–263. [Google Scholar] [CrossRef]
- Lind, C.E.; Brummett, R.E.; Ponzoni, R.W. Exploitation and conservation of fish genetic resources in Africa: issues and priorities for aquaculture development and research. Rev. Aquacult. 2012, 4, 125–141. [Google Scholar] [CrossRef]
- Chauvigné, F.; Lleberia, J.; Vilafranca, C.; Rosado, D.; Martins, M.; Silva, F.; González-López, W.; Ramos-Júdez, S.; Duncan, N.; Giménez, I.; et al. Gonadotropin induction of spermiation in Senegalese sole: Effect of temperature and stripping time. Aquaculture 2022, 550, 737844. [Google Scholar] [CrossRef]
- Martín, I.; Carazo, I.; Rasines, I.; Rodríguez, C.; Fernández, R.; Martínez, P.; Norambuena, F.; Chereguini, O.; Duncan, N. Reproductive performance of captive Senegalese sole, Solea senegalensis, according to the origin (wild or cultured) and gender. Span. J. Agric. Res. 2019, 17, e0608. [Google Scholar] [CrossRef]
- Carazo, I.; Chereguini, O.; Martín, I.; Huntingford, F.; Duncan, N. Reproductive ethogram and mate selection in captive wild senegalese sole (Solea senegalensis). Span. J. Agric. Res. 2016, 14, e0401. [Google Scholar] [CrossRef]
- García-López, Á.; Martínez-Rodríguez, G.; Sarasquete, C. Male reproductive system in senegalese sole Solea senegalensis (Kaup): Anatomy, histology and histochemistry. Histol. Histopath. 2005, 20, 1179–1189. [Google Scholar] [CrossRef]
- Cabrita, E.; Soares, F.; Dinis, M.T. Characterization of Senegalese sole, Solea senegalensis, male broodstock in terms of sperm production and quality. Aquaculture 2006, 261, 967–975. [Google Scholar] [CrossRef]
- Cabrita, E.; Soares, F.; Beirão, J.; García-López, A.; Martínez-Rodríguez, G.; Dinis, M.T. Endocrine and milt response of Senegalese sole, Solea senegalensis, males maintained in captivity. Theriogenology 2001, 75, 1–9. [Google Scholar] [CrossRef]
- Guzmán, J.M.; Cal, R.; García-López, Á.; Chereguini, O.; Kight, K.; Olmedo, M.; Sarasquete, C.; Mylonas, C.C.; Peleteiro, J.B.; Zohar, Y.; Mañanós, E.L. Effects of in vivo treatment with the dopamine antagonist pimozide and gonadotropin-releasing hormone agonist (GnRHa) on the reproductive axis of Senegalese sole (Solea senegalensis). Comp. Biochem. Physiol. A-Mol. Integr. Physiol. 2011, 158, 235–245. [Google Scholar] [CrossRef]
- Chauvigné, F.; González, W.; Ramos, S.; Ducat, C.; Duncan, N.; Giménez, I.; Cerdà, J. Seasonal-and dose-dependent effects of recombinant gonadotropins on sperm production and quality in the flatfish Solea senegalensis. Comp. Biochem. Physiol. A-Mol. Integr. Physiol. 2018, 225, 59–64. [Google Scholar] [CrossRef]
- Ramos-Júdez, S.; González-López, W.A.; Huayanay Ostos, J.; Cota Mamani, N.; Marrero Alemán, C.; Beirâo, J.; Duncan, N. Low sperm to egg ratio required for successful in vitro fertilization in a pair-spawning teleost, Senegalese sole (Solea senegalensis). R. Soc. Open Sci. 2021, 8, 201718. [Google Scholar] [CrossRef]
- Félix, F.; Silva, N.; Oliveira, C.C.V.; Cabrita, E.; Gavaia, P.J. Effects of dietary supplementation with macroalgae on sperm quality and antioxidant system in Senegales sole. Aquaculture 2024, 590, 741069. [Google Scholar] [CrossRef]
- Fatsini, E.; González, W.; Ibarra-Zatarain, Z.; Napuchi, J.; Duncan, N.J. The presence of wild Senegalese sole breeders improves courtship and reproductive success in cultured conspecifics. Aquaculture 2020, 519, 734922. [Google Scholar] [CrossRef]
- González-López, W.A.; Ramos-Júdez, S.; Duncan, N.J. Reproductive behaviour and fertilized spawns in cultured Solea senegalensis broodstock co-housed with breeders during their juvenile stages. Gen. Comp. Endocrinol. 2024, 354, 114546. [Google Scholar] [CrossRef]
- Benzekri, H.; Armesto, P.; Cousin, X.; Rovira, M.; Crespo, D.; Merlo, M.A.; Mazurais, D.; Bautista, R.; Guerrero-Fernández, D.; Fernandez-Pozo, N.; et al. De novo assembly, characterization and functional annotation of Senegalese sole (Solea senegalensis) and common sole (Solea solea) transcriptomes: integration in a database and design of a microarray. BMC Genomics 2014, 3, 952. [Google Scholar] [CrossRef]
- Guerrero-Cózar, I.; Perez-Garcia, C.; Benzekri, H.; Sánchez, J.J.; Seoane, P.; Cruz, F.; Gut, M.; Zamorano, M.J.; Claros, M.G.; Manchado, M. Development of whole genome multiplex assays and construction of an integrated genetic map using SSR markers in Senegalese sole. Sci. Rep. 2020, 10, 1–16. [Google Scholar] [CrossRef] [PubMed]
- Guerrero-Cózar, I.; Gomez-Garrido, J.; Berbel, C.; Martinez-Blanch, J.F.; Alioto, T.; Claros, M.G.; Gagnaire, P.A.; Manchado, M. Chromosome anchoring in Senegalese sole (Solea senegalensis) reveals sex-associated markers and genome rearrangements in flatfish. Sci. Rep. 2021, 11, 1–16. [Google Scholar] [CrossRef]
- de la Herrán, R.; Hermida, M.; Rubiolo, J.A.; Gómez-Garrido, J.; Cruz, F.; Robles, F.; Navajas-Pérez, R.; Blanco, A.; Villamayor, P.R.; Torres, D.; et al. A chromosome-level genome assembly enables the identification of the follicule stimulating hormone receptor as the master sex-determining gene in the flatfish Solea senegalensis. Mol. Ecol. Resour. 2023, 00, 1–19. [Google Scholar] [CrossRef]
- Ramírez, D.; Rodríguez, M.E.; Mukiibi, R.; Peñaloza, C.; D’Cotta, H.; Robledo, D.; Rebordinos, L. Methylation profile of the testes of the flatfish Solea senegalensis. Aquacult. Rep. 2024, 39, 102405. [Google Scholar] [CrossRef]
- Ramírez, D.; Anaya-Romero, M.; Rodríguez, M.E.; Arias-Pérez, A.; Mukiibi, R.; D’Cotta, H.; Robledo, D.; Rebordinos, L. Insights into Solea senegalensis Reproduction Through Gonadal Tissue Methylation Analysis and Transcriptomic Integration. Biomolecules 2025, 15, 54. [Google Scholar] [CrossRef]
- Anaya-Romero, M.; Ramírez, D.; Arias-Pérez, A.; Rodríguez, M.E.; Robledo, D.; Rebordinos, L. Comparative transcriptomic profiling of gonads in Solea senegalensis: Exploring sex, maturity, and origin variations. Aquaculture 2025, 604, 742461. [Google Scholar] [CrossRef]
- Martyniuk, C.J.; Popesku, J.T.; Chown, B.; Denslow, N.D.; Trudeau, V.L. Quantitative proteomics in teleost fish: Insights and challenges for neuroendocrine and neurotoxicology research. Gen. Comp. Endocrinol. 2012, 176, 314–320. [Google Scholar] [CrossRef]
- Carrera, M.; Piñeiro, C.; Martinez, I. Proteomic strategies to evaluate the impact of farming conditions on food quality and safety in aquaculture products. Foods 2020, 9, 1050. [Google Scholar] [CrossRef]
- Liu, Q.; Hu, S.; Tang, X.; Wang, C.; Yang, L.; Xiao, T.; Xu, B. Gonadal development and differentiation of hybrid F1 line of Ctenopharyngodon idella (♀) × Squaliobarbus curriculus (♂). Int. J. Mol. Sci. 2024, 25, 10566. [Google Scholar] [CrossRef]
- Jia, J.; Dong, C.; Han, M.; Ma, S.; Chen, W.; Dou, J.; Feng, C.; Liu, X. Multi-omics perspective on studying reproductive biology in Daphnia sinensis. Genomics 2022, 114, 110309. [Google Scholar] [CrossRef]
- Groh, K.J.; Nesatyy, V.J.; Segner, H.; Eggen, R.I.L.; Suter, M.J.F. Global proteomics analysis of testis and ovary in adult zebrafish (Danio rerio). Fish Physiol. Biochem. 2011, 37, 619–647. [Google Scholar] [CrossRef]
- Liu, Y.; Xu, W.; Zhang, X.; Wang, J.; Chen, X.; Yu, X.; Zeng, J.; Wu, Y.; Liu, L. The molecular mechanism of ovary development in Thamnaconus septentrionalis induced by rising temperature via transcriptomics and metabolomics analysis. Front. Mar. Sci. 2025, 12, 1556002. [Google Scholar] [CrossRef]
- Forné, I.; Castellana, B.; Marín-Juez, R.; Cerdà, J.; Abián, J.; Planas, J. V. Transcriptional and proteomic profiling of flatfish (Solea senegalensis) spermatogenesis. Proteomics 2011, 11, 2195–2211. [Google Scholar] [CrossRef]
- Forné, I.; Aguileiro, M.J.; Asensio, E.; Abián, J.; Cerdà, J. 2-D DIGE analysis of Senegalese sole (Solea senegalensis) testis proteome in wild-caught and hormone-treated F1 fish. Proteomics 2009, 9, 2171–2181. [Google Scholar] [CrossRef]
- Zhu, F.; Yan, P.; Zhang, J.; Cui, Y.; Zheng, M.; Cheng, Y.; Guo, Y.; Yang, X.; Guo, X.; Zhu, H. Deficiency of TPPP2, a factor linked to oligoasthenozoospermia, causes subfertility in male mice. J. Cell Mol. Med. 2019, 23, 2583–2594. [Google Scholar] [CrossRef]
- Garriga, F.; Martínez-Herández, J.; Parra-Balaguer, P.; Llavanera, M.; Yeste, M. The Sarcoplasmic/Endoplasmic reticulum Ca2+-ATPase (SERCA) is present in pig sperm and modulates their physiology over liquid preservation. Sci. Rep. 2025, 15, 4184. [Google Scholar] [CrossRef]
- Kovacevic, A.; Ordziniak, E.; Umer, N.; Arévalo, L.; Hinterlang, L.D.; Ziaeipour, S.; Suvilla, S.; Merges, G.E.; Schorle, H. Actin-related protein M1 (ARPM1) required for acrosome biogenesis and sperm function in mice. Preprint (bioRxiv) 2025. [Google Scholar] [CrossRef]
- Khan, R.; Azhar, M.; Umair, M. Decoding the genes orchestrating egg and sperm fusion reactions and their roles in fertility. Biomedicines 2024, 12, 2850. [Google Scholar] [CrossRef] [PubMed]
- Li, X.; Li, L.; Cui, Z.; Li, M.; Sun, X.; Li, Z.; Chen, Z.; Ding, L.; Xu, D.; Xu, W. Proteomic analysis to explore potential mechanism underlying pseudomale sperm defect in Cynoglossus semilaevis. Aquacult. Rep. 2025, 40, 102544. [Google Scholar] [CrossRef]
- Zhou, M.; Li, H.; Zhang, X.; Nan, Y.; Li, Y.; Jiang, W.; Chen, P.; Tan, Q. Label-free quantitative proteomic analysis reveals the characteristics of ovarian development from stage II to III in Chinese sturgeon (Acipenser sinensis). Aquaculture 2025, 597, 741928. [Google Scholar] [CrossRef]
- Esbaugh, A. J. Physiological responses of euryhaline marine fish to naturally-occurring hypersalinity. Comp. Biochem. Physiol. A-Mol. Integr. Physiol 2025, 299, 111768. [Google Scholar] [CrossRef] [PubMed]
- Johnson, M.H.; Nasr-Esfahani, M.H. Radical solutions and cultural problems: could free oxygen radicals be responsible for the impaired development of preimplantation mammalian embryos in vitro? Bioessays 1994, 16, 31–38. [Google Scholar] [CrossRef]
- Beckett, G.J.; Arthur, J.R. Selenium and endocrine systems. J. Endocrinol. 2005, 184, 455–465. [Google Scholar] [CrossRef]
- Meseguer, M.; de los Santos, M.J.; Simón, C.; Pellicer, A.; Remohí, J.; Garrido, N. Effect of sperm glutathione peroxidase 1 and 4 on embryo asymmetry and blastocyst quality in oocyte donation cycles. Fertil Steril. 2006, 85, 1376–1385. [Google Scholar] [CrossRef]
- Martinov, D.I.; Ayvazova, N.P.; Konova, E.I.; Atanasova, M.A. Glutathione content and glutathione peroxidase activity of sperm in males with unexplained infertility. J. Biomed. Clin. Res. 2021, 14, 53–61. [Google Scholar] [CrossRef]
- Lubzens, E.; Young, G.; Bobe, J.; Cerdà, J. Oogenesis in teleosts: How fish eggs are formed. Gen. Comp. Endocrinol. 2010, 165, 367–389. [Google Scholar] [CrossRef]
- Coticchio, G.; Dal Canto, M.; Renzini, M.M.; Guglielmo, M.C.; Brambillasca, F.; Turchi, D.; Novara, P.V.; Fadini, R. Oocyte maturation: Gamete-somatic cells interactions, meiotic resumption, cytoskeletal dynamics and cytoplasmic reorganization. Hum. Reprod. Update 2014, 21, 427–454. [Google Scholar] [CrossRef]
- Zupa, R.; Rodrõâguez, C.; Mylonas, C.C.; Rosenfeld, H.; Fakriadis, I.; Papadaki, M.; Peârez, J.A.; Pousis, C.; Basilone, G.; Corriero, A. Comparative study of reproductive development in wild and captive-reared greater amberjack Seriola dumerili (Risso, 1810). PLoS ONE 2017, 12, e016964. [Google Scholar] [CrossRef] [PubMed]
- Paul, K.; Restoux, G.; Phocas, F. Genome-wide detection of positive and balancing signatures of selection shared by four domesticated rainbow trout populations (Oncorhynchus mykiss). Genet. Sel. Evol. 2024, 56, 13. [Google Scholar] [CrossRef]
- Berois, N.; Arezo, M.J.; Papa, N.G. Gamete interactions in teleost fish: the egg envelope. Basic studies and perspectives as environmental biomonitor. Bio. Res. 2011, 144, 119–124. [Google Scholar] [CrossRef] [PubMed]
- Sawada, H.; Saito, T. Mechanisms of sperm–egg interactions: What ascidian fertilization research has taught us. Cells 2022, 11, 2096. [Google Scholar] [CrossRef] [PubMed]
- Gilbert, S.F. Recognition of Egg and Sperm. In Developmental Biology, 6th ed.; Sinauer Associates: Sunderland (MA), 2000; Available online: https://www.ncbi.nlm.nih.gov/books/NBK10010/.
- Okabe, M. The cell biology of mammalian fertilization. Development 2013, 140, 4471–4479. [Google Scholar] [CrossRef]
- Chang, L.; Xiang, Q.M.; Zhu, J.Q.; Chen, Y.E.; Tang, D.J.; Zhang, C.D.; Hou, C.C. Transport of acrosomal enzymes by KIFC1 via the acroframosomal cytoskeleton during spermatogenesis in Macrobrachium rosenbergii (Crustacea, Decapoda, Malacostracea). Animals 2022, 12, 991. [Google Scholar] [CrossRef]
- Howes, L.; Jones, R. Interactions between zona pellucida glycoproteins and sperm proacrosin/acrosin during fertilization. J. Reprod. Immunol. 2002, 53, 181–192. [Google Scholar] [CrossRef]
- Takahashi, K.; Kikuchi, K.; Uchida, Y.; Kanai-Kitayama, S.; Suzuki, R.; Sato, R.; Toma, K.; Geshi, M.; Akagi, S.; Nakano, M.; Yonezawa, N. Binding of Sperm to the Zona Pellucida Mediated by Sperm Carbohydrate-Binding Proteins is not Species-Specific in vitro between Pigs and Cattle. Biomolecules 2013, 3, 85–107. [Google Scholar] [CrossRef] [PubMed]
- Inaba, K. Molecular basis of sperm flagellar axonemes: structural and evolutionary aspects. Ann. N.Y. Acad. Sci. 2007, 1101, 506–526. [Google Scholar] [CrossRef]
- Linck, R.W.; Chemes, H.; Albertini, D.F. The axoneme: the propulsive engine of spermatozoa and cilia and associated ciliopathies leading to infertility. J. Assist. Reprod. Genet. 2016, 33, 141–156. [Google Scholar] [CrossRef]
- Ishikawa, T. Axoneme Structure from Motile Cilia. Cold Spring Harb. Perspect. Biol. 2017, 9, a028076. [Google Scholar] [CrossRef]
- Carrageta, D.F.; Guerra-Carvalho, B.; Sousa, M.; Barros, A.; Oliveira, P.F.; Monteiro, M.P.; Alves, M.G. Mitochondrial activation and reactive oxygen-species overproduction during sperm capacitation are independent of glucose stimuli. Antioxidants 2020, 9, 750. [Google Scholar] [CrossRef]
- Pavuluri, H.; Bakhtiary, Z.; Panner Selvam, M.K.; Hellstrom, W.J.G. Oxidative stress-associated male infertility: Current diagnostic and therapeutic approaches. Medicina 2024, 60, 1008. [Google Scholar] [CrossRef]
- Wang, Y.; Fu, X.; Li, H. Mechanisms of oxidative stress-induced sperm dysfunction. Front. Endocrinol. 2025, 16, 1520835. [Google Scholar] [CrossRef] [PubMed]
- Asakawa, S.; Kraitavin, W.; Yoshitake, K.; Igarashi, Y.; Mitsuyama, S.; Kinoshita, S.; Kambayashi, D.; Watabe, S. Transcriptome analysis of yamame (Oncorhynchus masou) in normal conditions after heat stress. Biology 2019, 8, 21. [Google Scholar] [CrossRef] [PubMed]
- Chen, Y.; Tang, H.; Wang, L.; He, J.; Guo, Y.; Liu, Y.; Liu, X.; Lin, H. Fertility enhancement but premature ovarian failure in esr1-deficient female zebrafish. Front. Endocrinol. 2018, 9, 567. [Google Scholar] [CrossRef]
- Mold, D.E.; Dinitz, A.E.; Sambandan, D.R. Regulation of zebrafish zona pellucida gene activity in developing oocytes. Biol. Reprod. 2009, 81, 101–110. [Google Scholar] [CrossRef]
- Clelland, E.; Peng, C. Endocrine/paracrine control of zebrafish ovarian development. Mol. Cell. Endocrinol. 2009, 312, 42–52. [Google Scholar] [CrossRef] [PubMed]
- Zhu, B.; Pardeshi, L.; Chen, Y.; Ge, W. Transcriptomic analysis for differentially expressed genes in ovarian follicle activation in the zebrafish. Front. Endocrinol. 2018, 9, 593. [Google Scholar] [CrossRef] [PubMed]
- Murugananthkumar, R.; Sudhakumari, C.C. Understanding the impact of stress on teleostean reproduction. Aquac. Fish. 2022, 7, 553–561. [Google Scholar] [CrossRef]
- Zhao, C.; Wang, S.; Liu, Y.; Chu, P.; Han, B.; Ning, X.; Wang, T.; Yin, S. Acute cold stress leads to zebrafish ovarian dysfunction by regulating miRNA and mRNA. Comp. Biochem. Physiol. D Genomics Proteomics 2023, 48, 101139. [Google Scholar] [CrossRef]
- Litscher, E.S.; Williams, Z.; Wassarman, P.M. Zona pellucida glycoprotein ZP3 and fertilization in mammals. Mol. Reprod. Dev. 2009, 76, 933–941. [Google Scholar] [CrossRef]
- Kushwaha, B.; Srivastava, N.; Kumar, M.S.; Kumar, R. Protein-protein networks analysis of differentially expressed genes unveils the key phenomenon of biological process with respect to reproduction in endangered catfish, C. magur. Gene 2023, 860, 147235. [Google Scholar] [CrossRef] [PubMed]
Figure 1.
Venn diagram showing distribution and overlap of proteins identified across the four experimental groups.: F1F, wtF, F1M y wtM. F1F: cultivated female, wtF: wild type female, F1M: cultivated male, and wtM: wild type male.
Figure 1.
Venn diagram showing distribution and overlap of proteins identified across the four experimental groups.: F1F, wtF, F1M y wtM. F1F: cultivated female, wtF: wild type female, F1M: cultivated male, and wtM: wild type male.
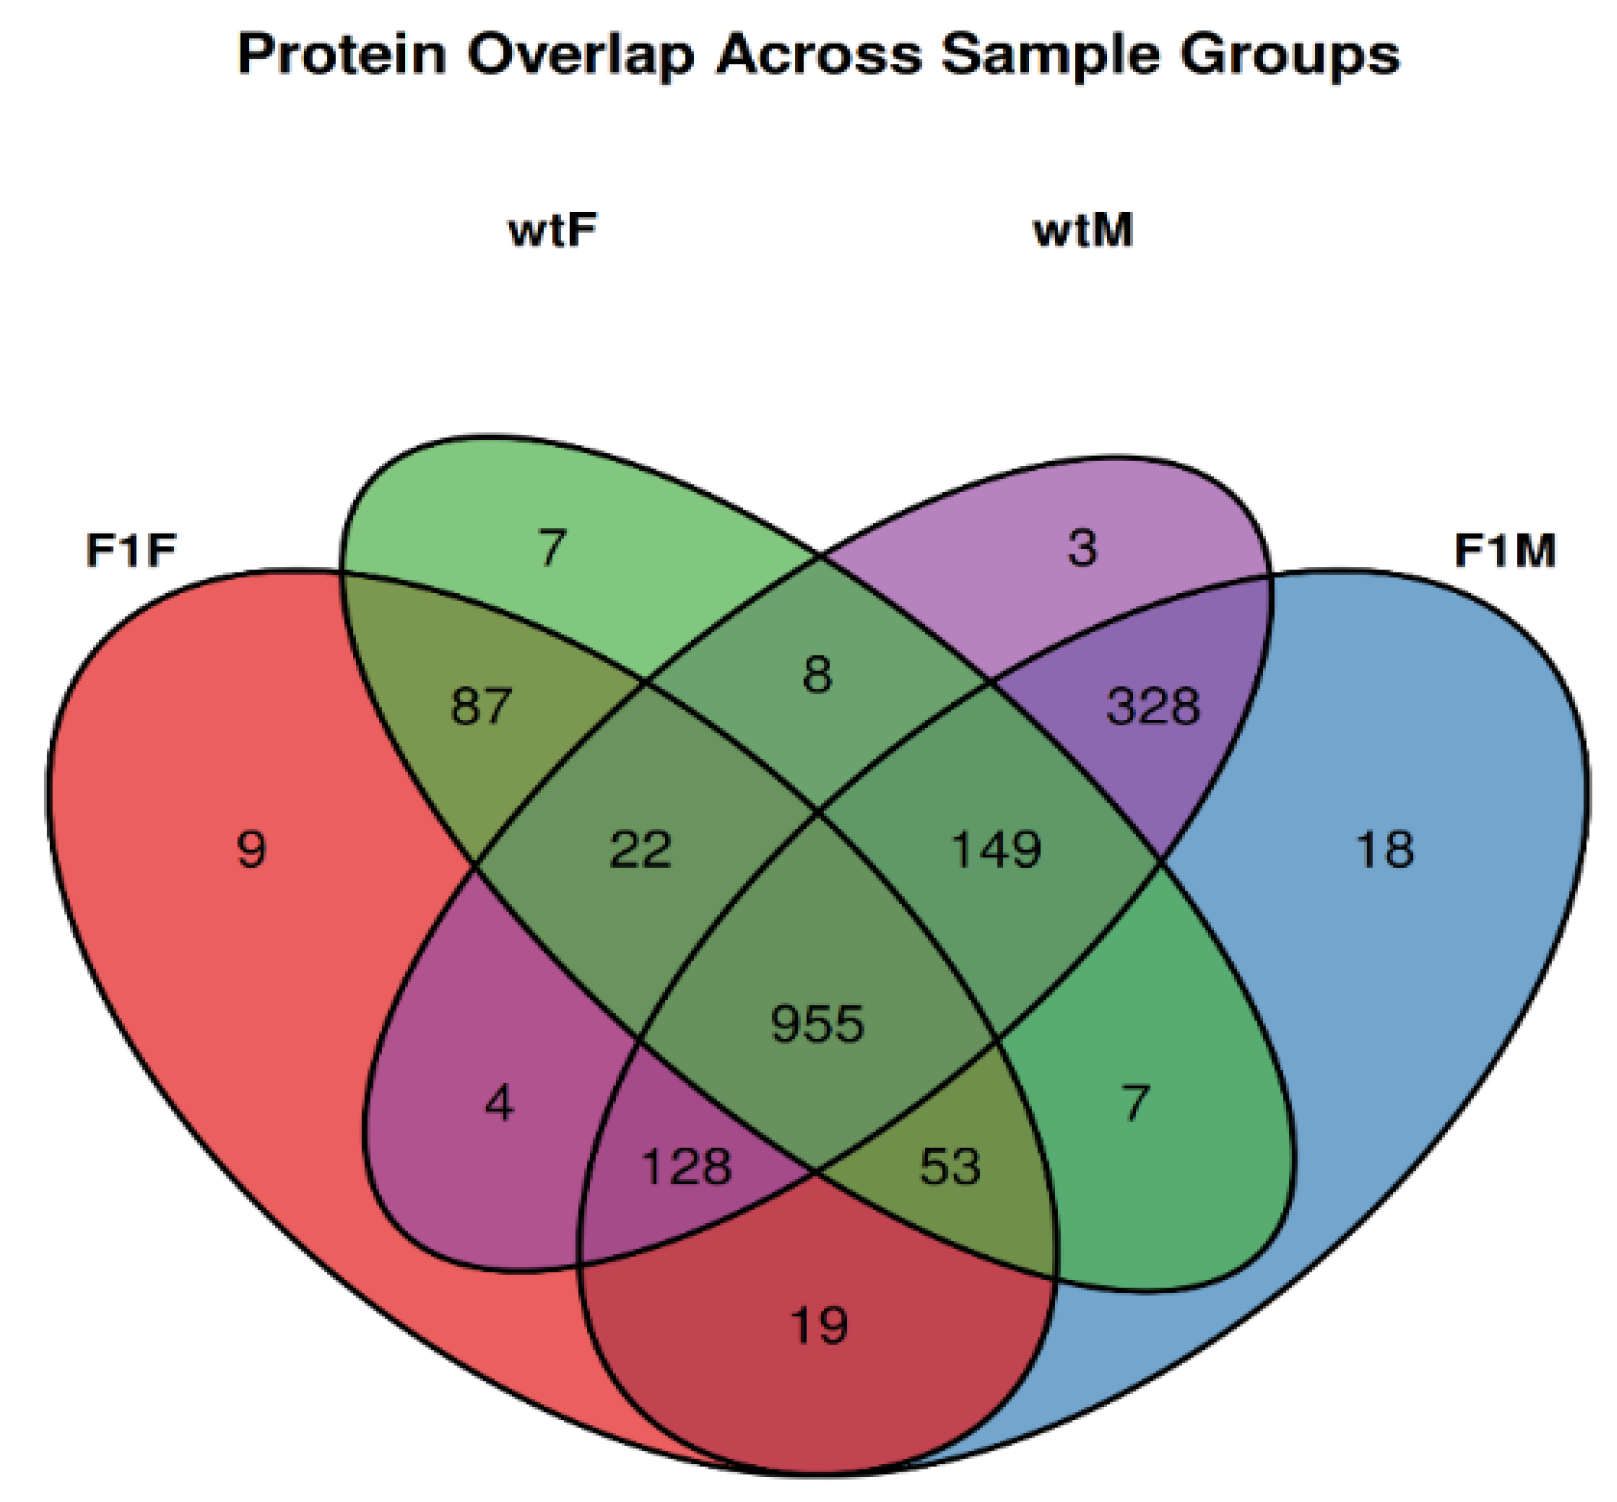
Figure 2.
Hierarchical heatmap based on the relative abundance of quantified proteins across all samples. Normalized and row-scaled values (Z-score) were utilized. Both proteins and samples were clustered using hierarchical clustering analysis with Euclidean distance and the complete linkage method. F1F: cultivated female, wtF: wild type female, F1M: cultivated male, and wtM: wild type male. The numbers from 1 to 5 correspond to the number of replicates.
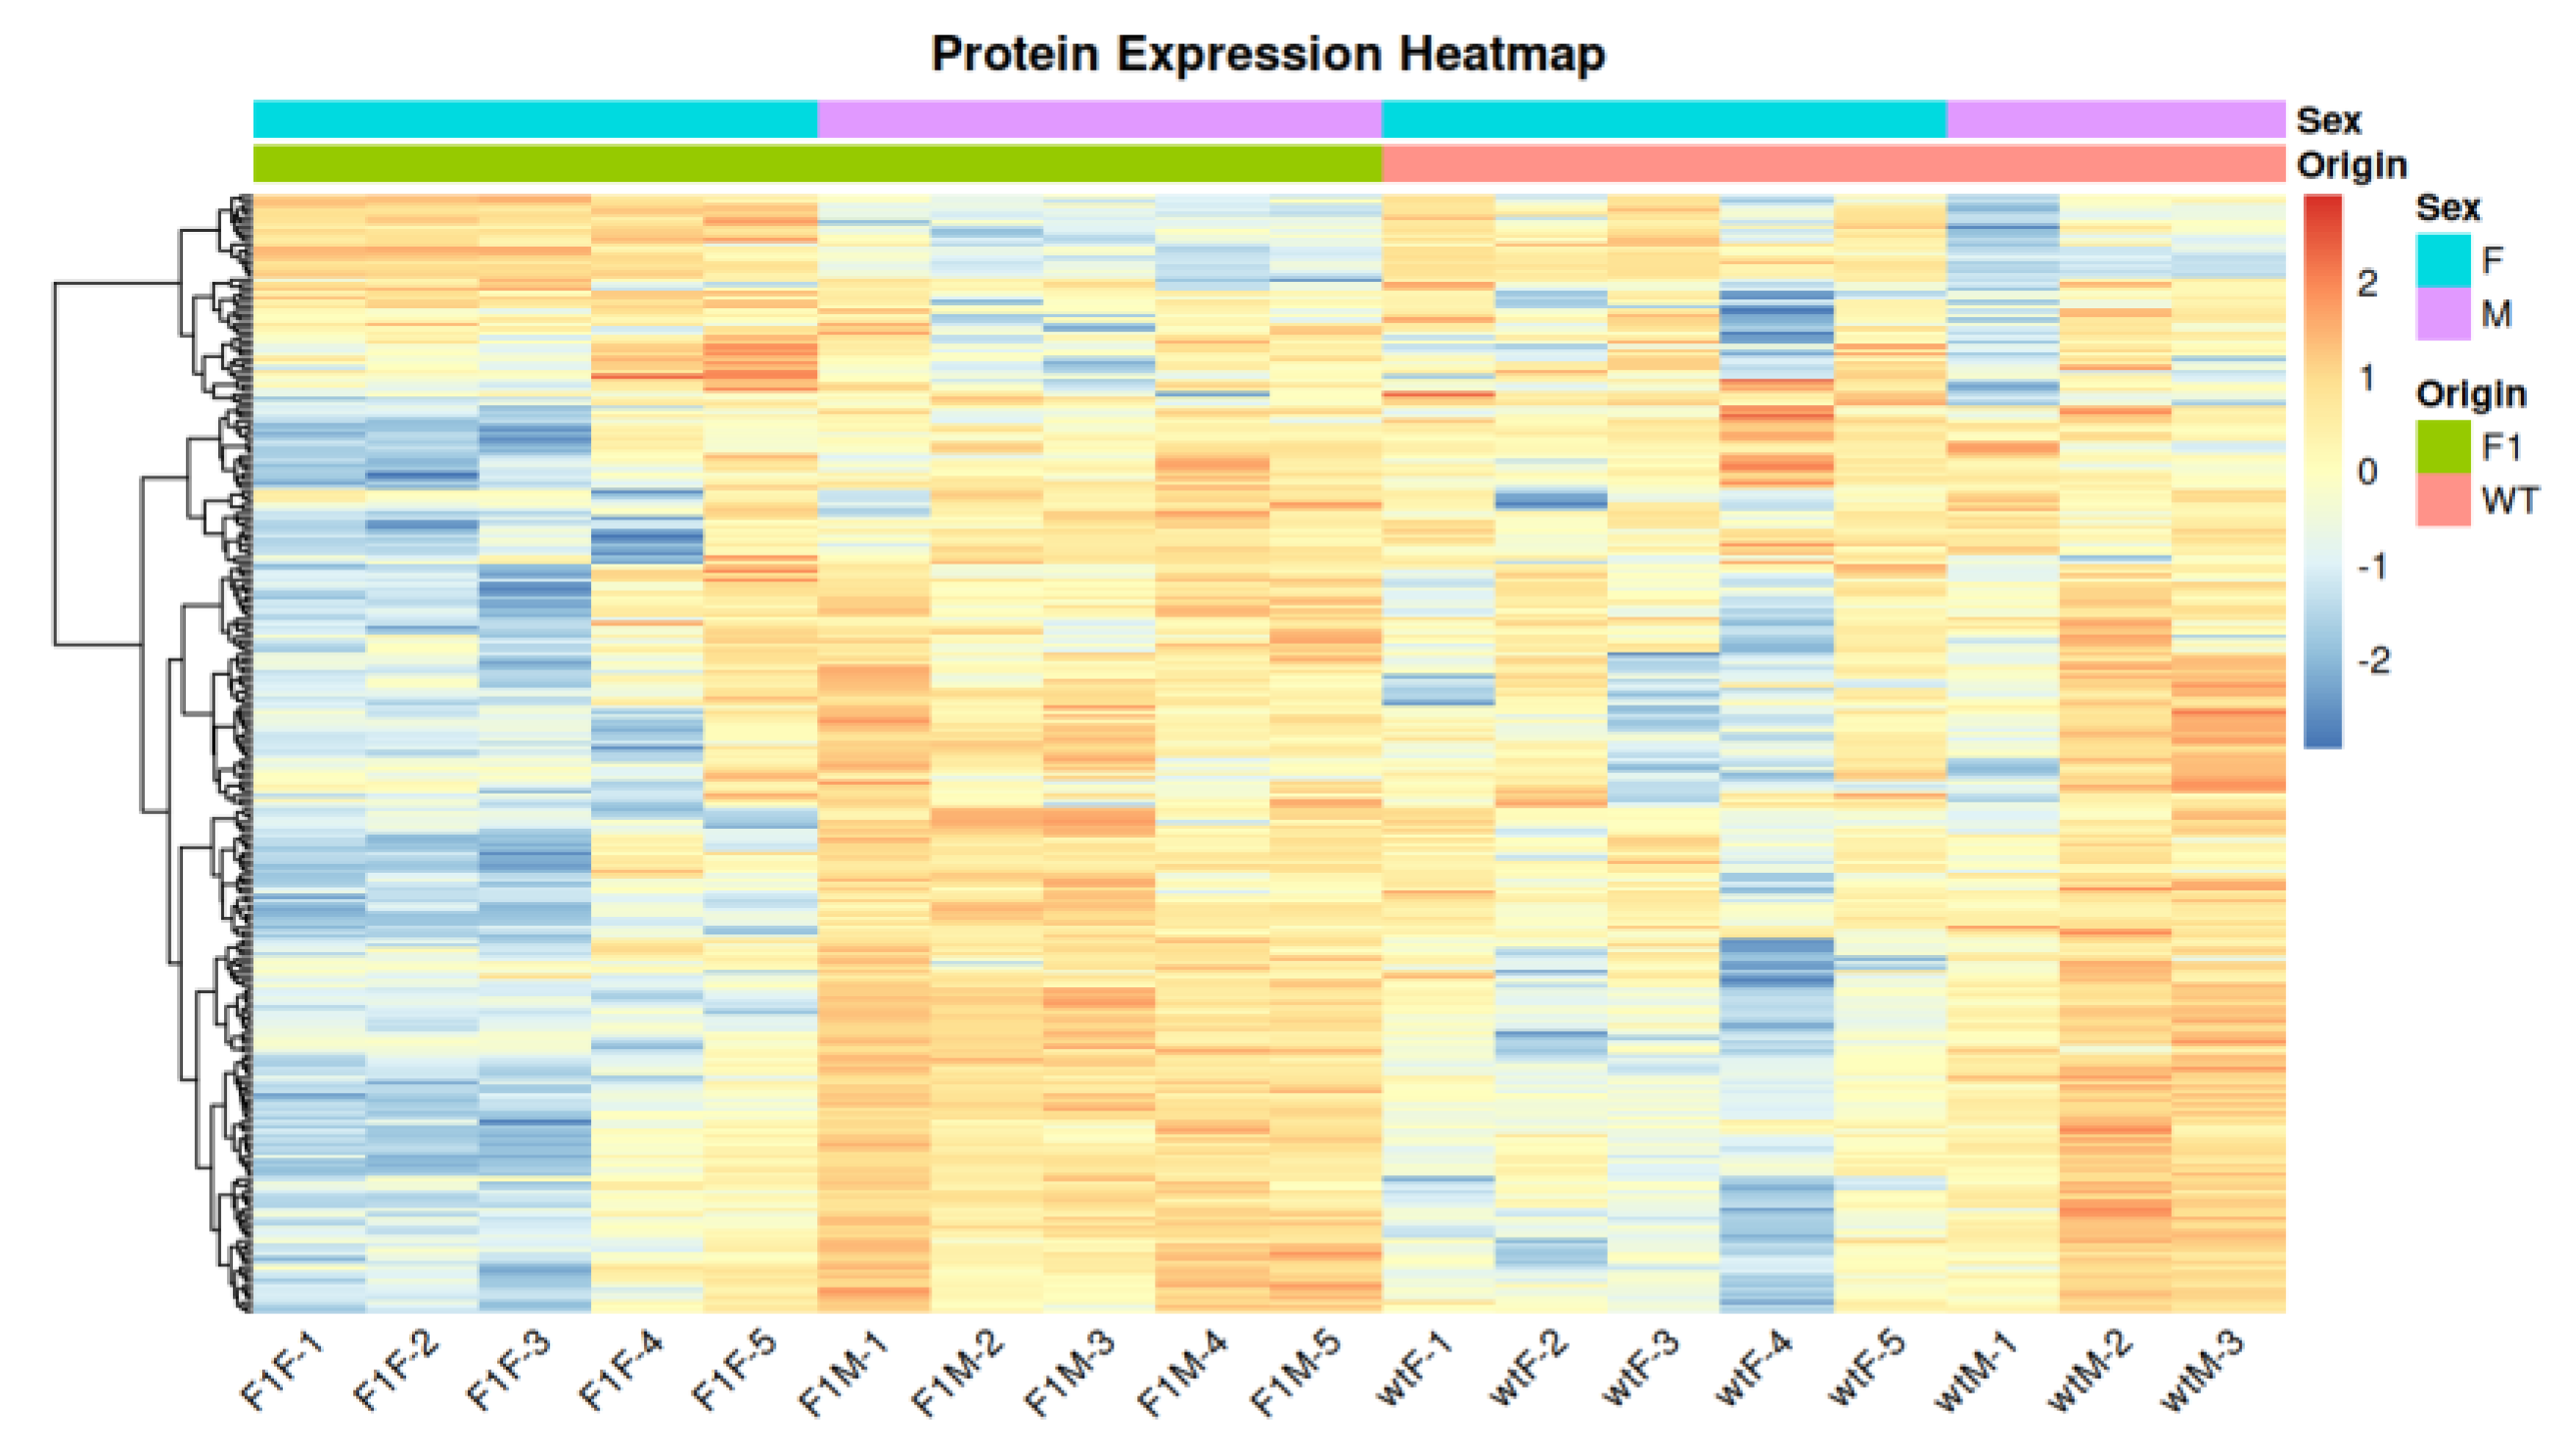
Figure 3.
Volcano plots for the differentially expressed proteins (DEPs) in the four experimental comparisons conducted between the groups: (a) F1F vs. F1M, (b) F1F vs. wtF), (c) F1M vs. wtM, and (d) wtF vs. wtM. In each graph, the X-axis represents the log2 fold change, and the Y-axis represents the -log10 of the p-value. Orange dots correspond to overexpressed proteins (UP), blue dots correspond to underexpressed proteins (DOWN), and grey dots correspond to proteins with no significant changes (NO). The established thresholds for considering a protein as differentially expressed were: a p-value of < 0.05 and a log2 fold change > 0.58. F1F: cultivated female, wtF: wild type female, F1M: cultivated male, and wtM: wild type male.
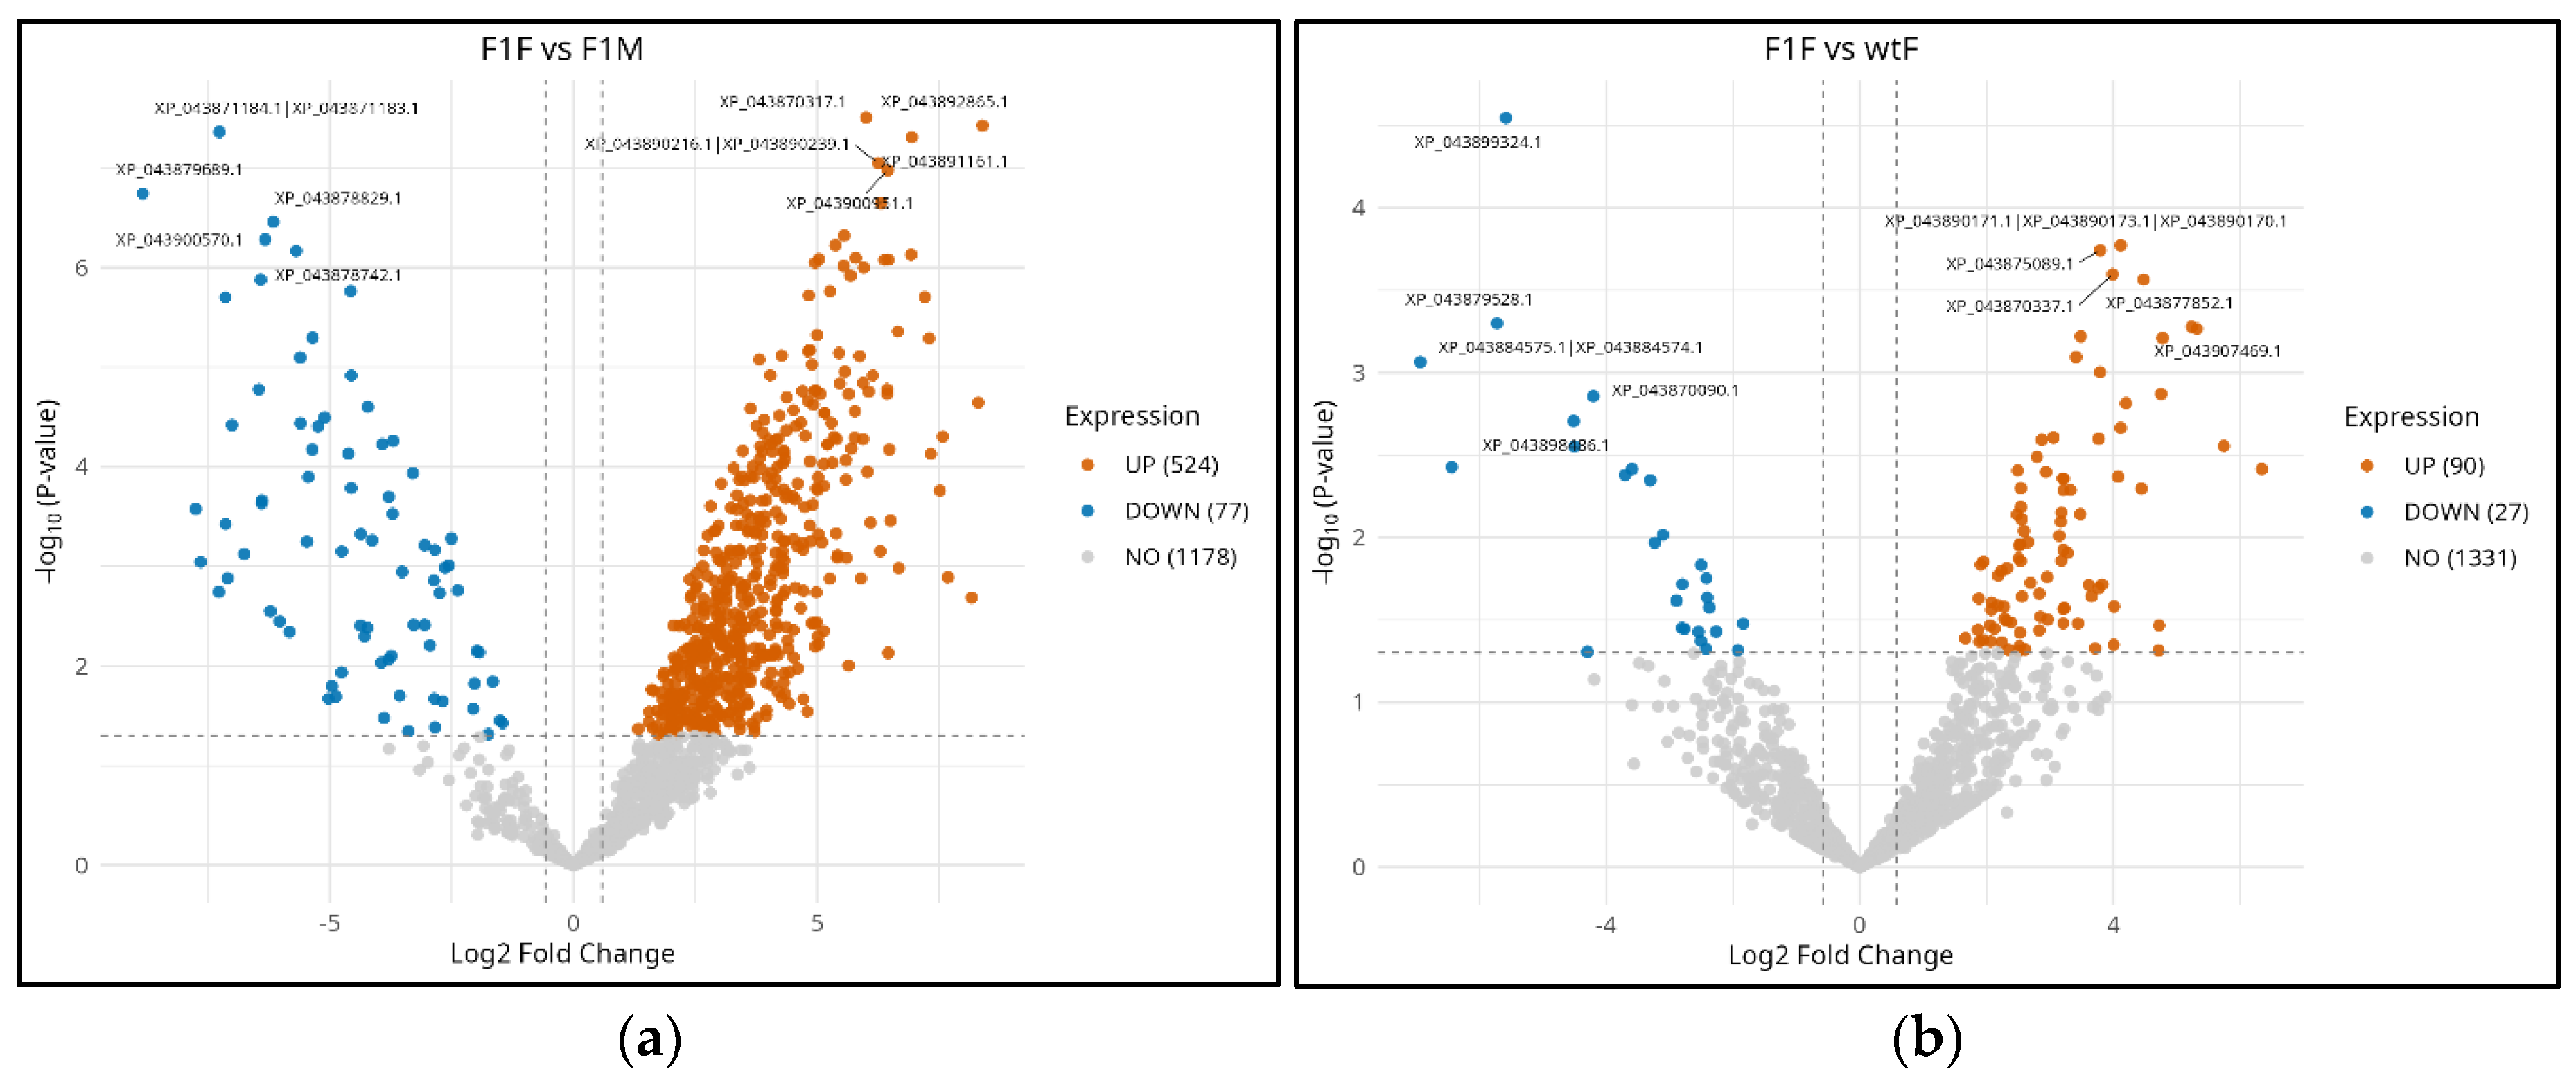
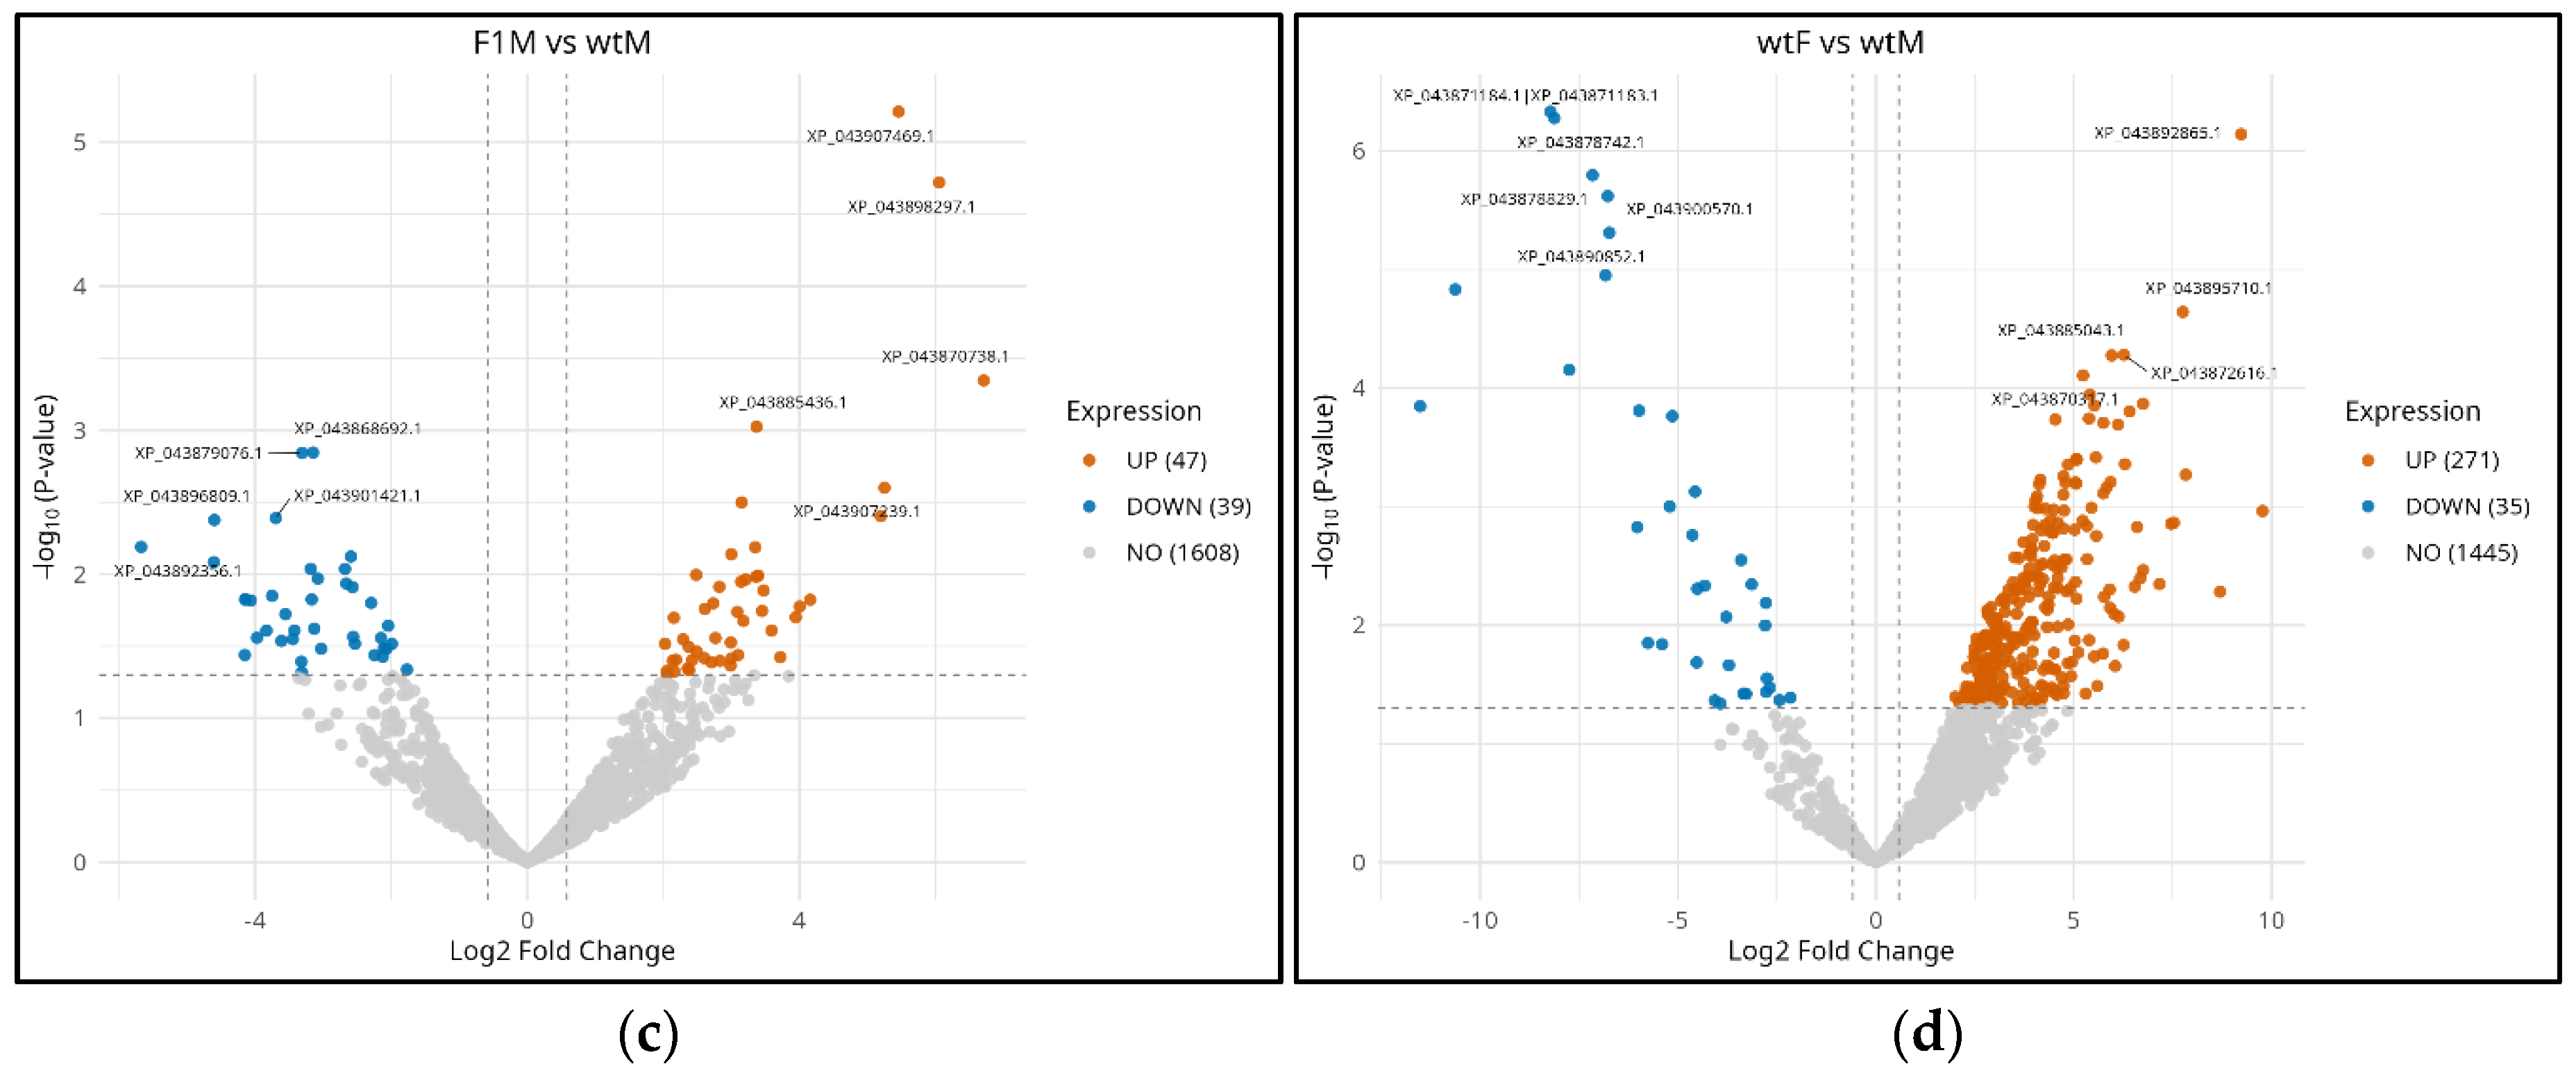
Figure 4.
The Gene Ontology (GO) term enrichment analysis in differentially expressed proteins (DEPs) for the four experimental comparisons. The 25 most significantly enriched terms are shown for each of the main GO categories: Biological Process (GO:BP), Cellular Component (GO:CC), and Molecular Function (GO:MF), across the following comparisons: (a) F1F vs. F1M, (b) F1F vs. wtF, (c) F1M vs. wtM, and (d) wtF vs. wtM. Bars indicate the number of proteins associated with each term (represented on a log10 scale), and the color denotes the differential regulation: red for overexpressed (UP) proteins and green for underexpressed (DOWN) proteins. F1F: cultivated female, wtF: wild type female, F1M: cultivated male, and wtM: wild type male.
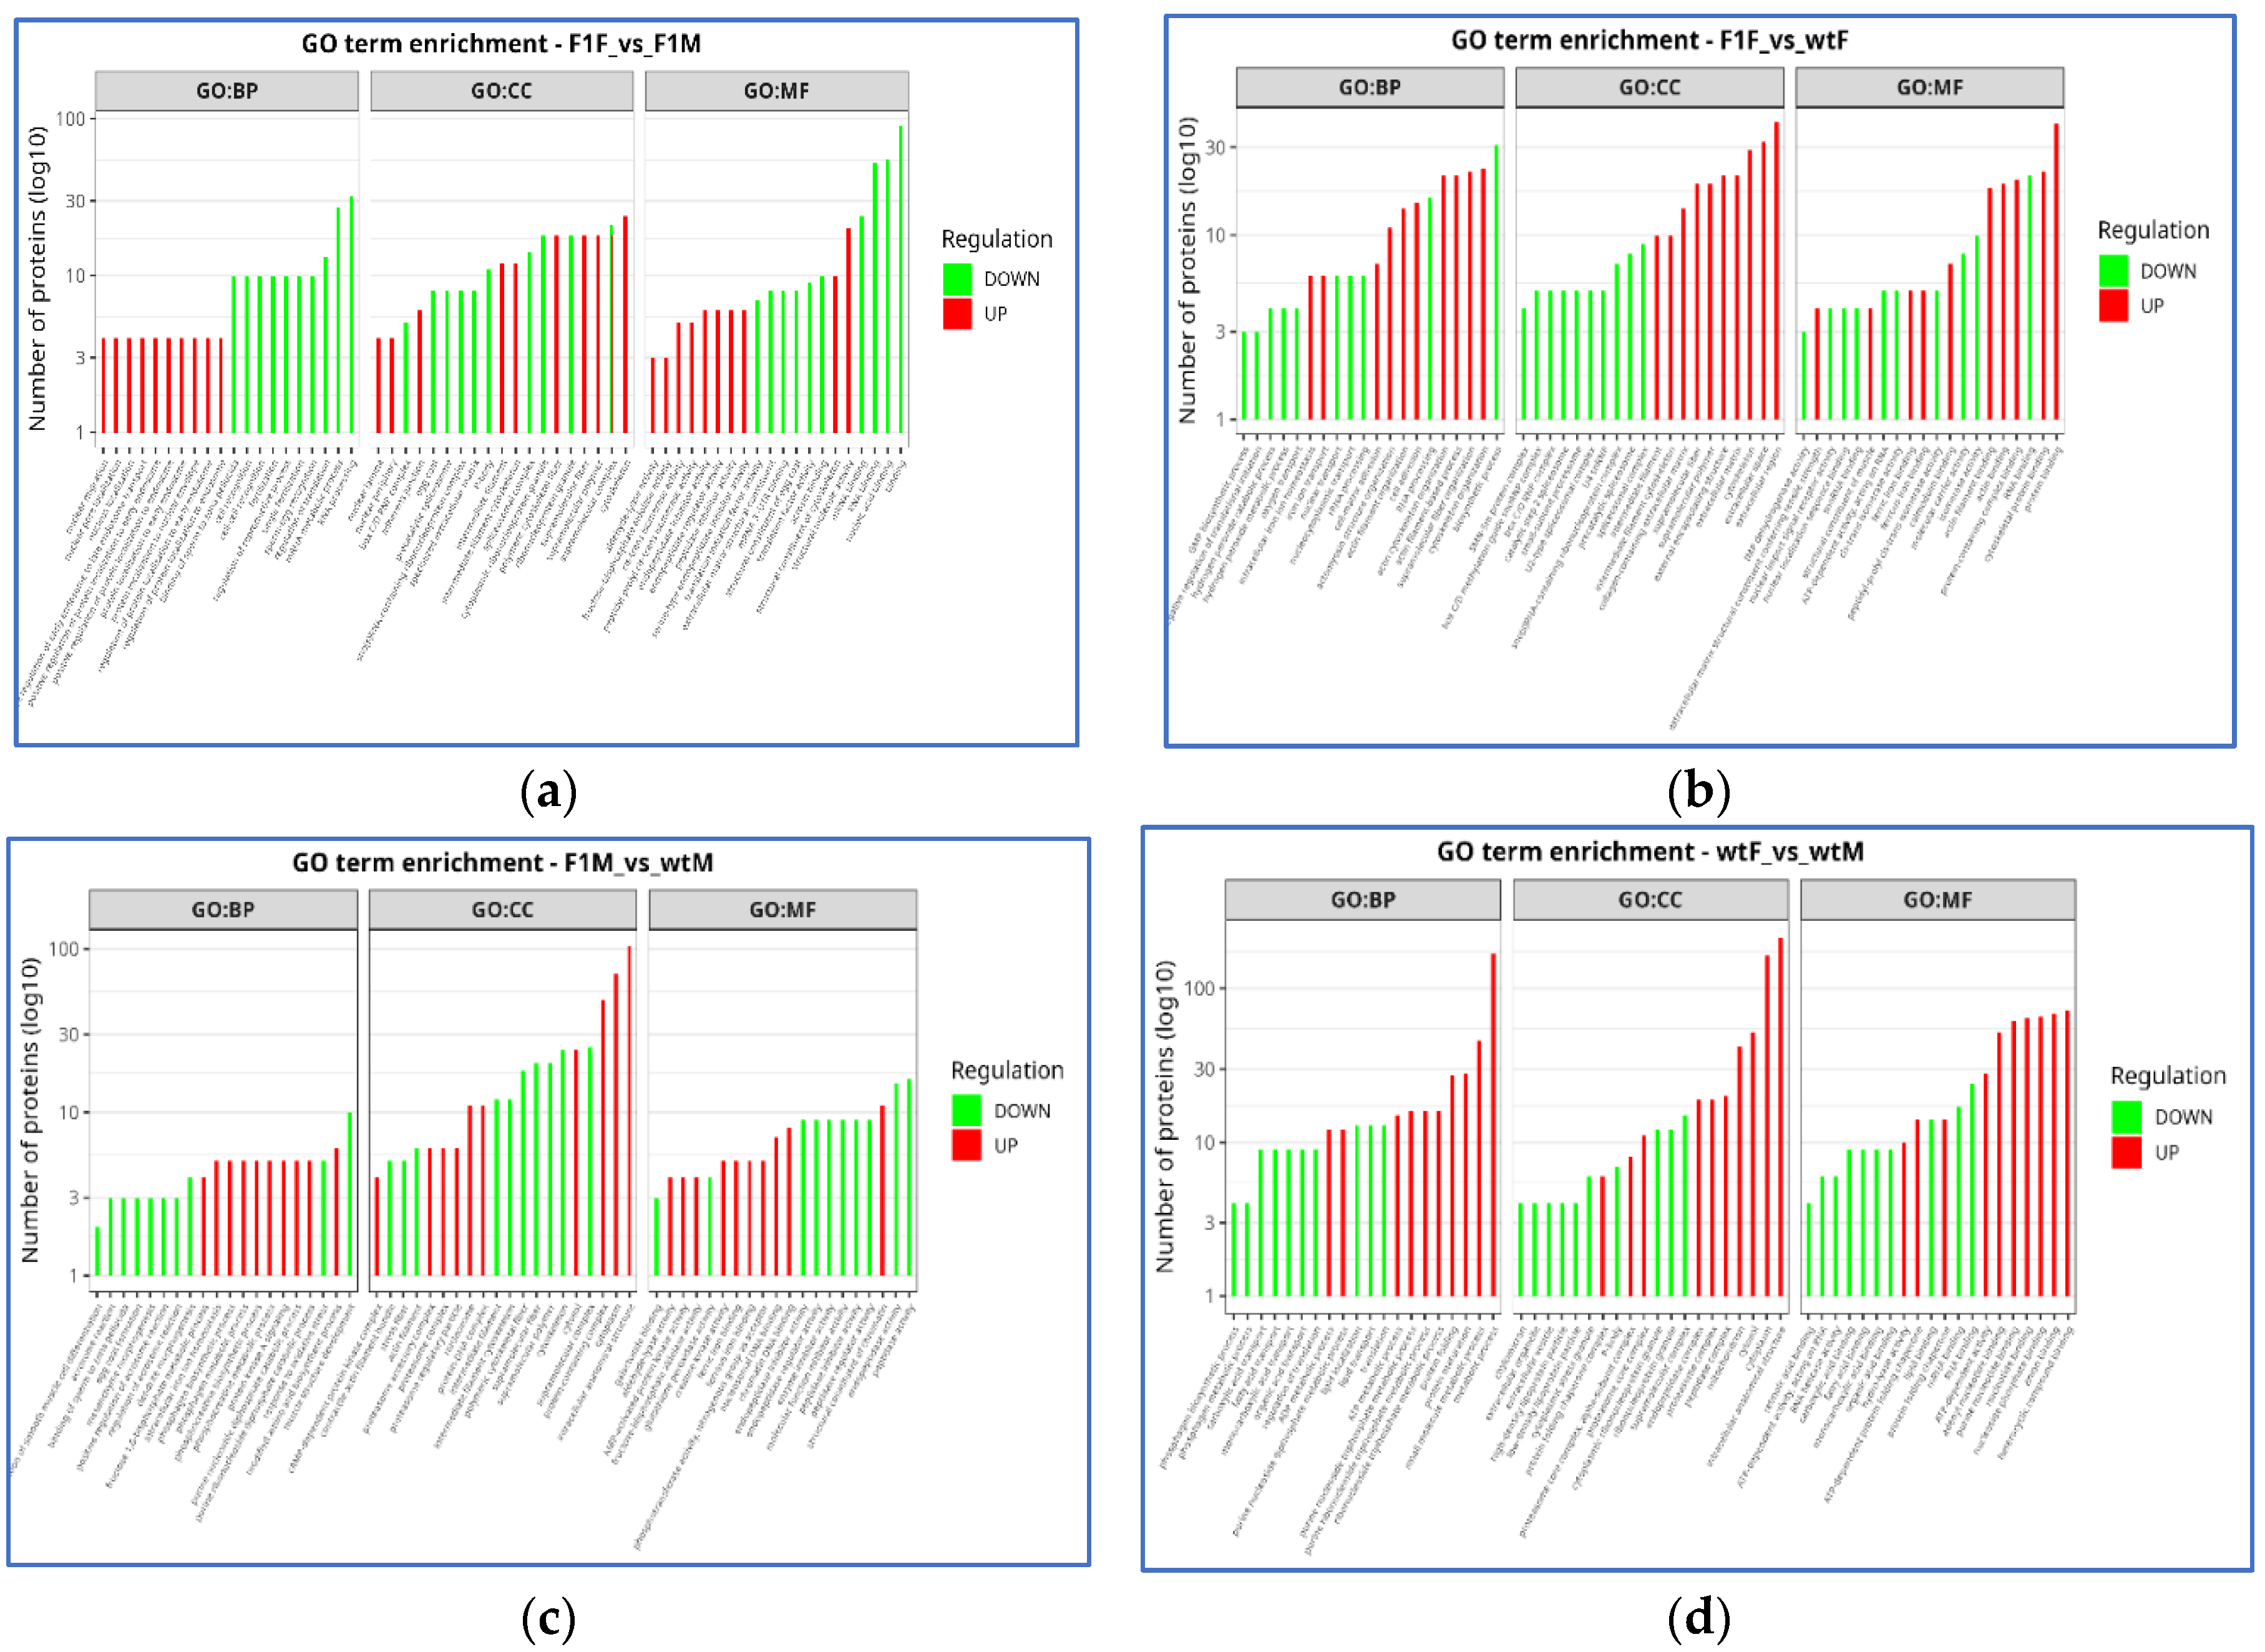
Figure 5.
The Gene Ontology (GO) Biological Process (GO:BP) terms enriched at hierarchical Level 2 from the differentially expressed proteins (DEPs). The plots show the enrichment results for (a) terms enriched in overexpressed (UP) proteins in the F1F vs. F1M comparison, (b) terms enriched in underexpressed (DOWN) proteins in the F1F vs. F1M comparison, (c) terms enriched in overexpressed (UP) proteins in the F1M vs. wtM comparison, and (d) terms enriched in underexpressed (DOWN) proteins in the F1M vs. wtM comparison. The X-axis represents the Rich Factor (the ratio between the proteins associated with a term and the total annotated proteins in that category). The size of each dot indicates the number of implicated proteins (intersection size), and the color scale reflects the level of statistical significance (-log10 of the p-value). F1F: cultivated female, wtF: wild type female, F1M: cultivated male, and wtM: wild type male.
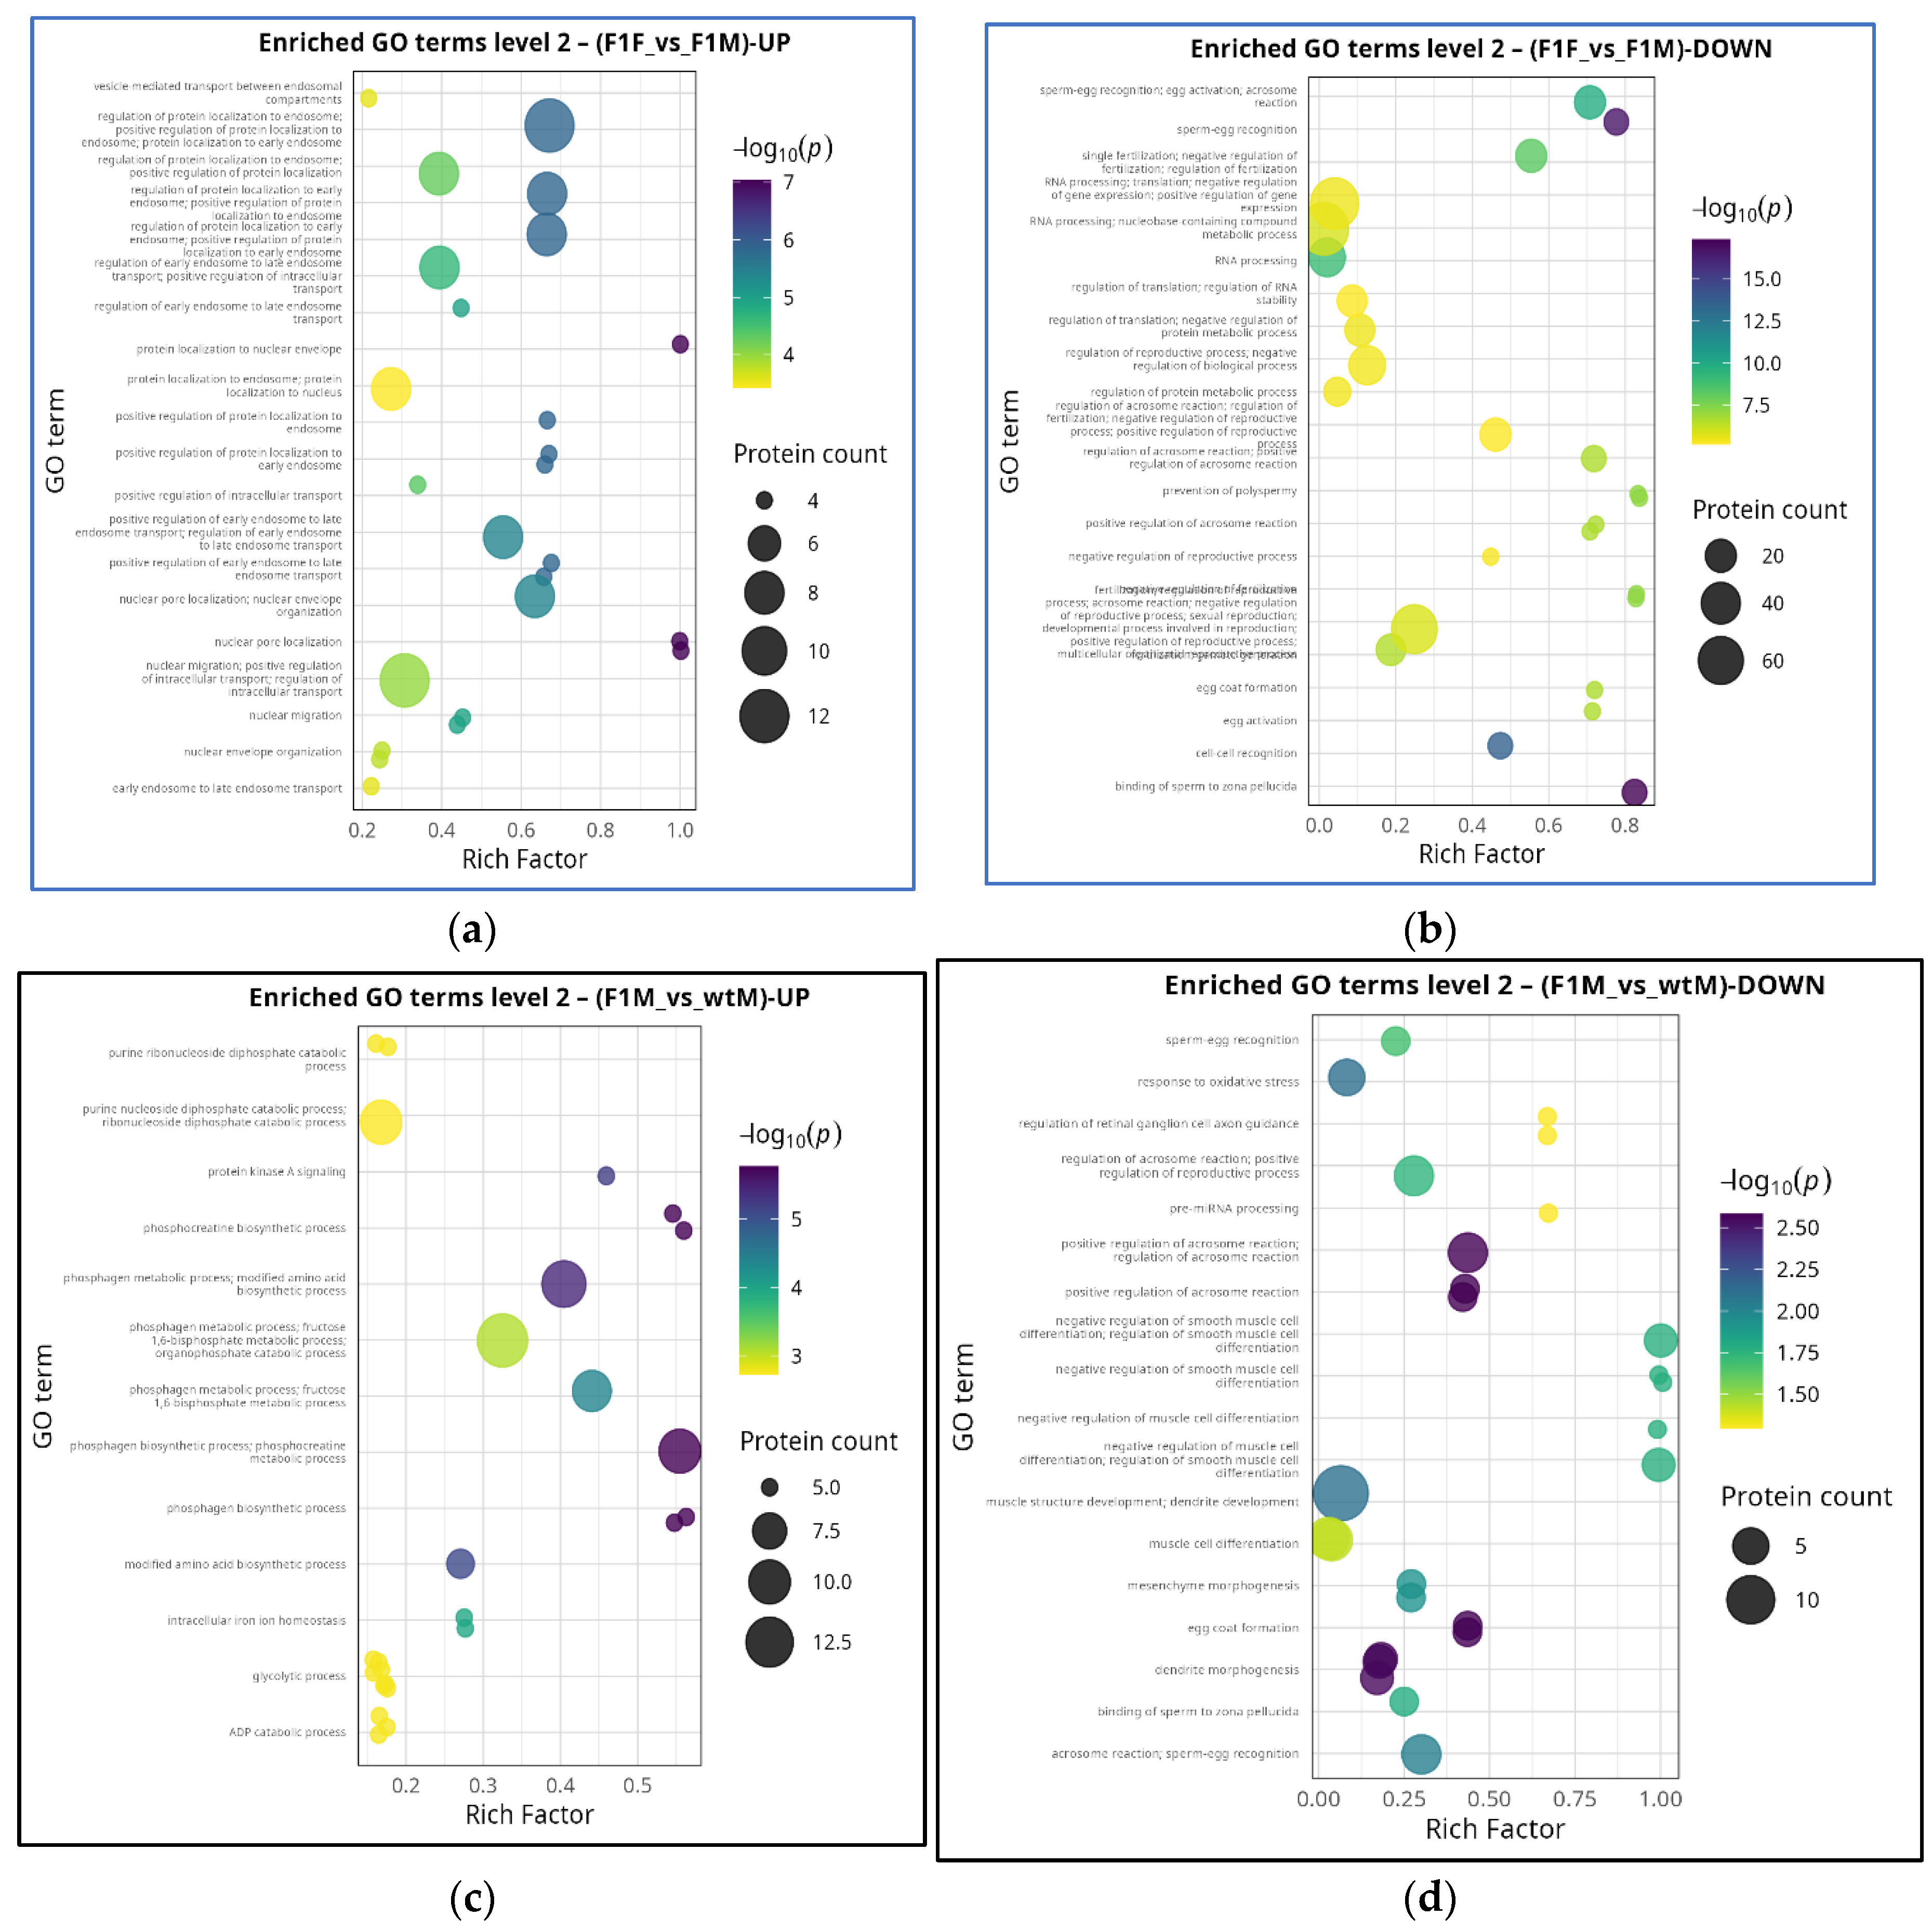
Figure 6.
Global Protein-Protein Interaction (PPI) Network constructed from the downregulated differentially expressed proteins (DEPs) in the comparisons: (a) F1F vs. F1M and (b) F1M vs. wtM. Each node represents a protein, and each edge represents a known or predicted interaction. Proteins associated with GO terms linked to reproductive processes are highlighted in color. Grey nodes correspond to proteins without a direct relationship to reproductive processes. F1F: cultivated female, wtF: wild type female, F1M: cultivated male, and wtM: wild type male.
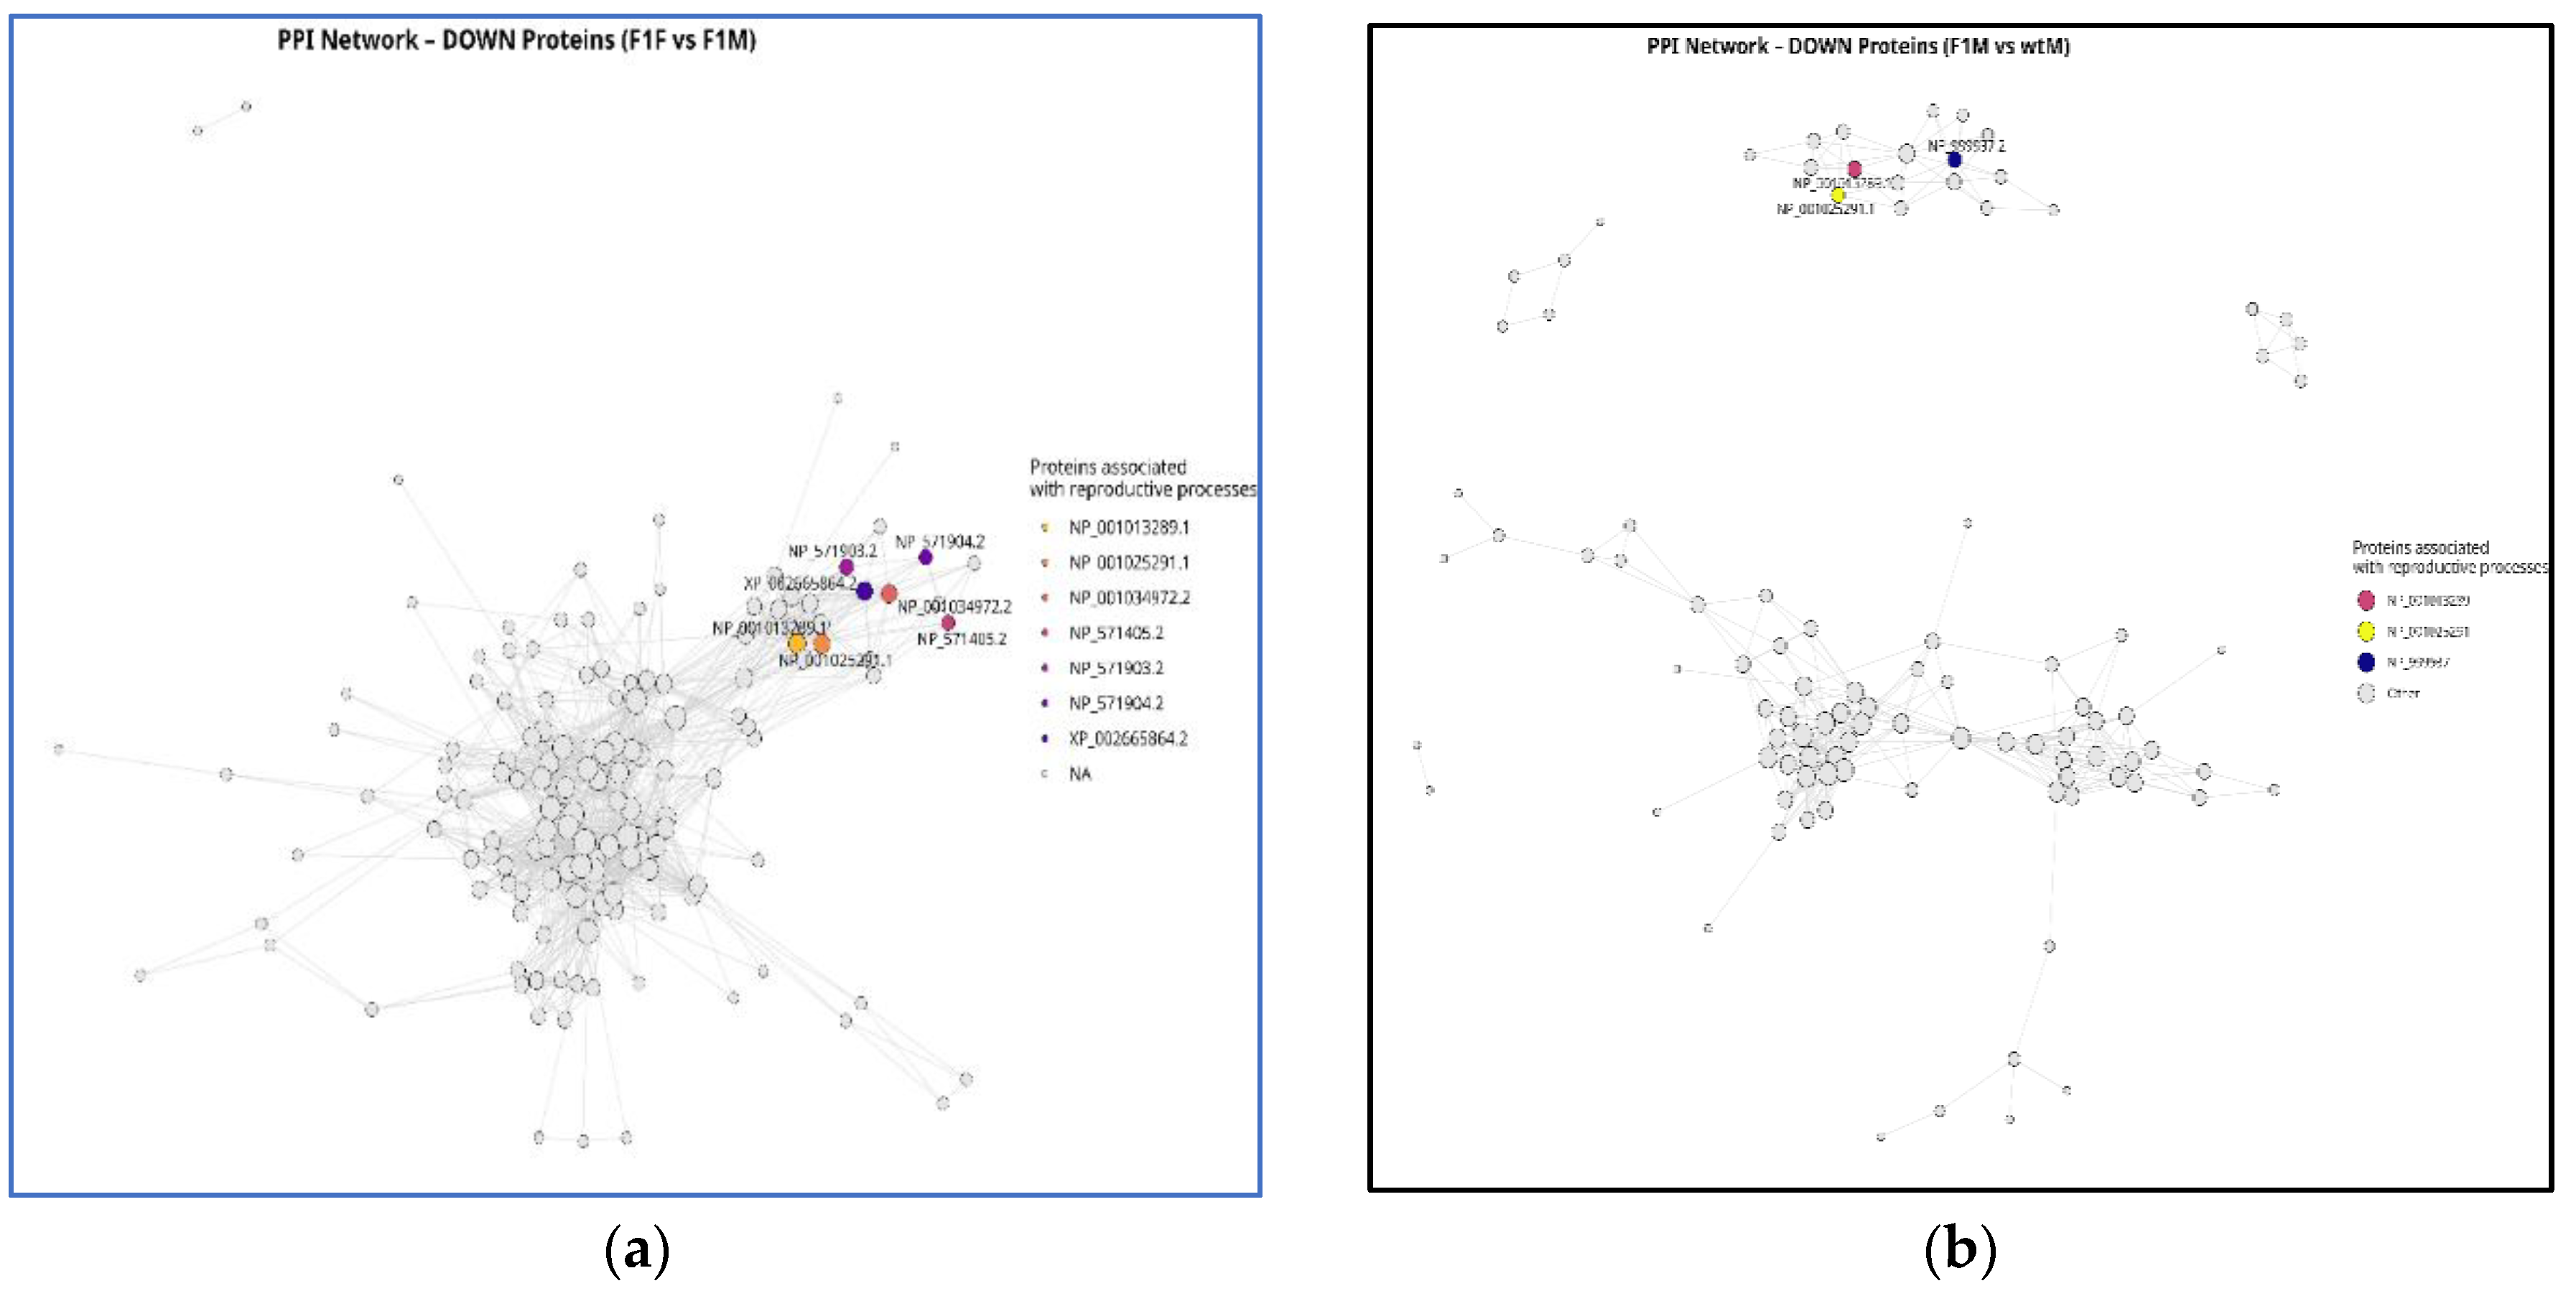
Figure 7.
Subnetwork of protein interactions associated with downregulated reproductive processes in the (a) F1F vs F1M and (b) F1M vs wtM comparisons. The figure represents subnetworks extracted from the global PPI network, composed exclusively of proteins annotated with GO terms linked to reproductive functions. Each node corresponds to a protein, and its size reflects the degree of centrality within the subnetwork (i.e., the number of direct connections it possesses). The colored proteins correspond to RefSeq identifiers of interest, such as NP_001013289.1, NP_001025291.1, and NP_001034972.2, which exhibited high connectivity values. F1F: cultivated female, wtF: wild type female, F1M: cultivated male, and wtM: wild type male.
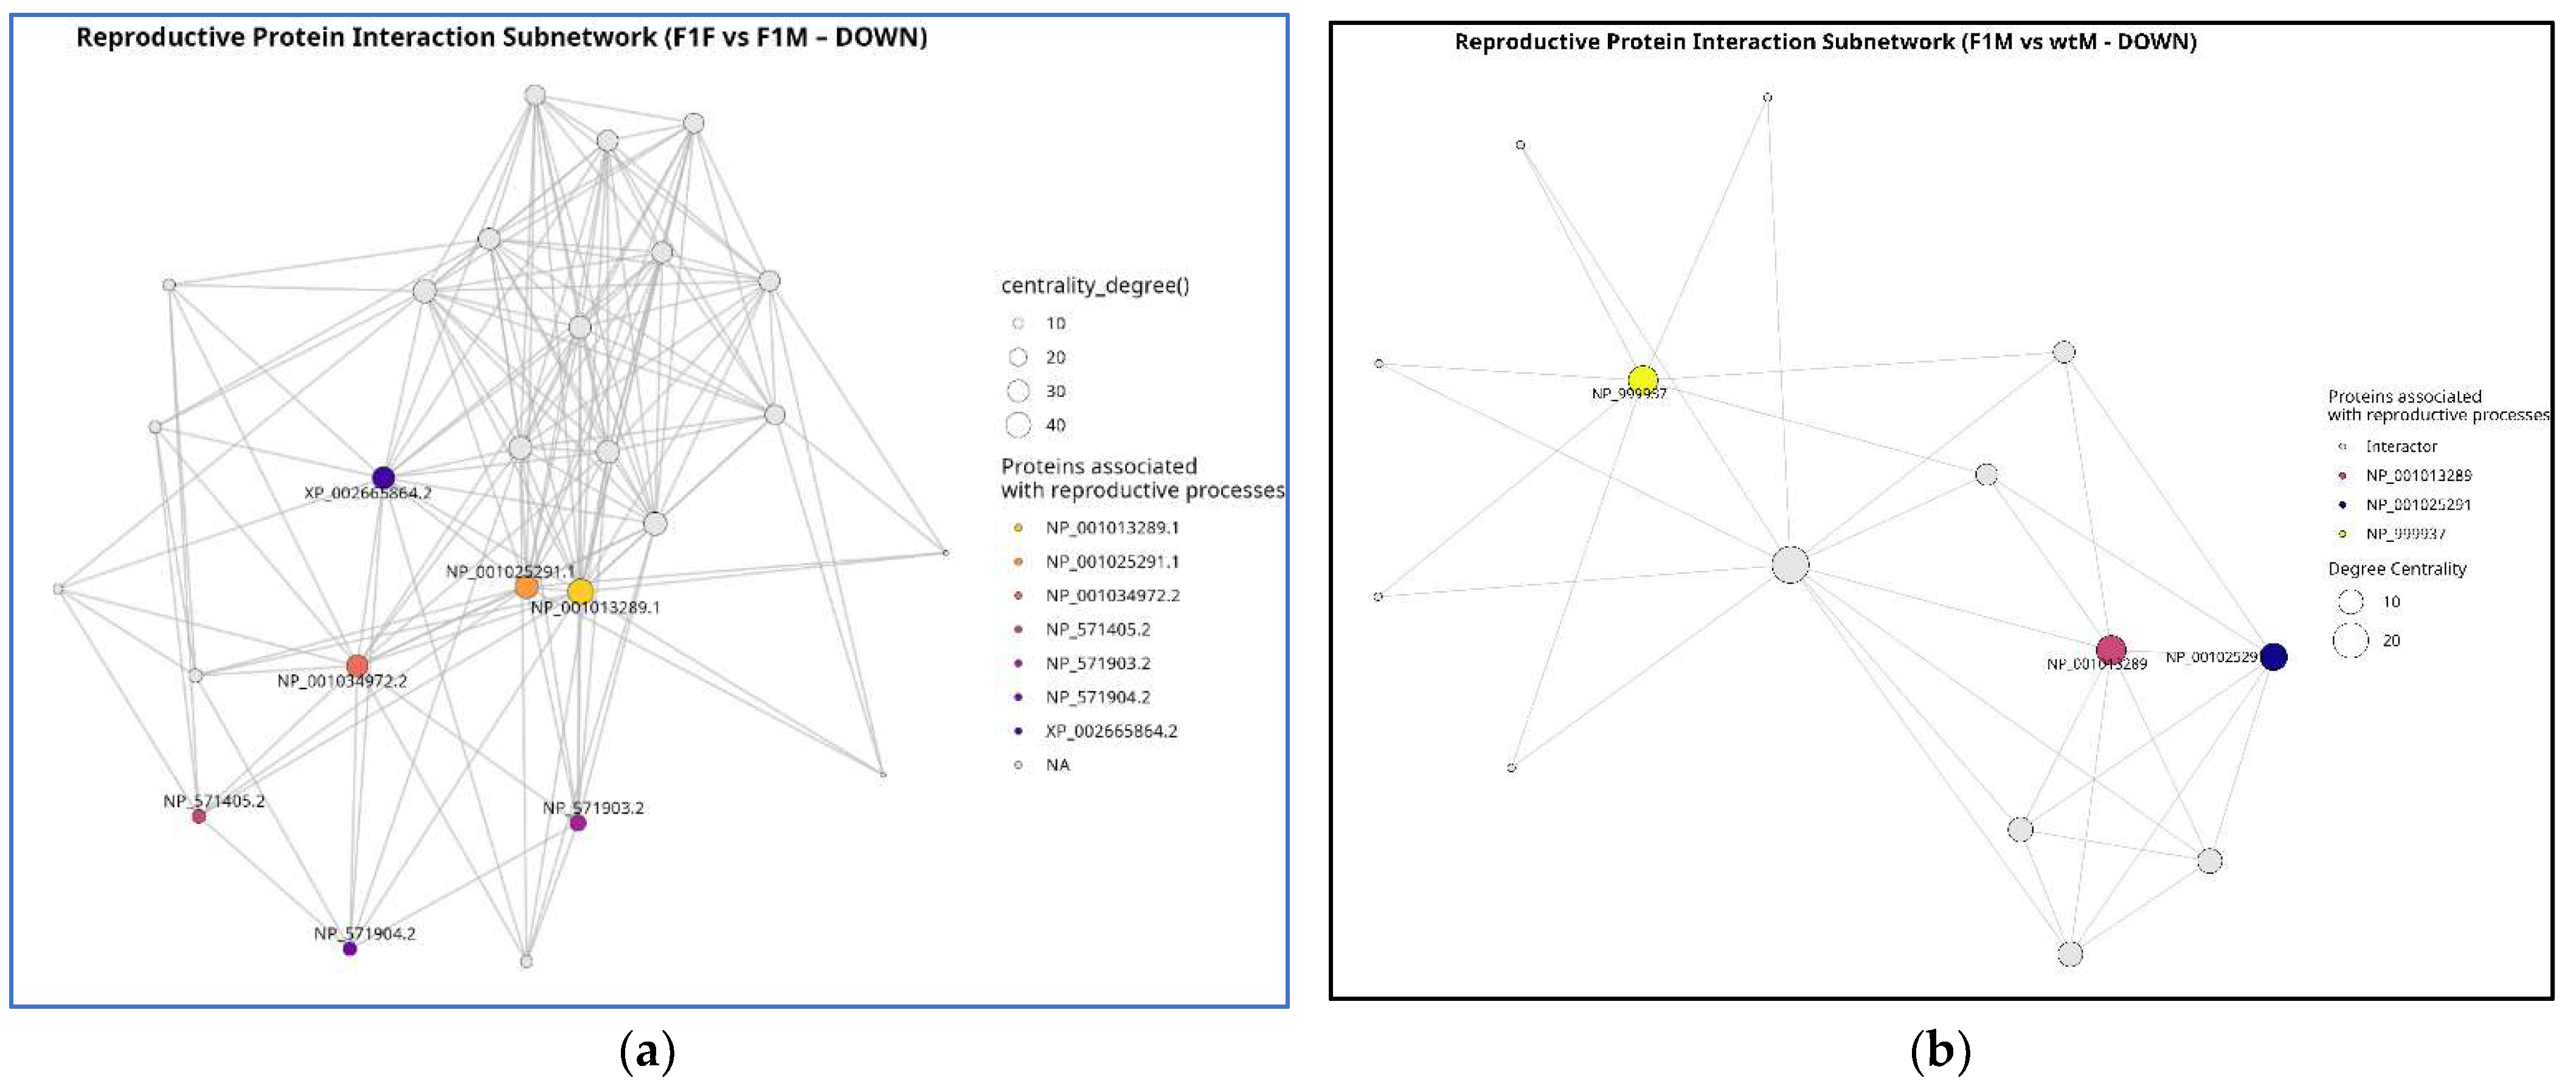

Table 1.
Summary of samples used in the study, organized by experimental group (origin and sex) and biological replicate identifiers.
Table 1.
Summary of samples used in the study, organized by experimental group (origin and sex) and biological replicate identifiers.
| Samples | Replicas | Origin1 | Sex2 | Group |
|---|---|---|---|---|
| F1F-1, F1F-2, F1F-3, F1F-4, F1F-5 | 5 | F1 | F | F1F |
| F1M-1, F1M-2, F1M-3, F1M-4, F1M-5 | 5 | F1 | M | F1M |
| wtF-1, wtF-2, wtF-3, wtF4, wtF-5 | 5 | wt | F | wtF |
| wtM-1, wtM-2, wtM-3 | 3 | wt | M | wtM |
1 F1: cultivated; wt: wild type. 2 F: female; M: male.
Disclaimer/Publisher’s Note: The statements, opinions and data contained in all publications are solely those of the individual author(s) and contributor(s) and not of MDPI and/or the editor(s). MDPI and/or the editor(s) disclaim responsibility for any injury to people or property resulting from any ideas, methods, instructions or products referred to in the content. |
© 2025 by the authors. Licensee MDPI, Basel, Switzerland. This article is an open access article distributed under the terms and conditions of the Creative Commons Attribution (CC BY) license (http://creativecommons.org/licenses/by/4.0/).
Copyright: This open access article is published under a Creative Commons CC BY 4.0 license, which permit the free download, distribution, and reuse, provided that the author and preprint are cited in any reuse.


