Submitted:
16 December 2025
Posted:
17 December 2025
You are already at the latest version
Abstract
Carbon quantum dots (CQDs) have emerged as highly versatile nanomaterials due to their tunable optical properties, excellent water dispersibility, and chemical stability. In this work, undoped, N-doped, and N,S-doped CQDs were synthesized via a simple, low-temperature bottom-up method using different molecular additives to tailor their emission behavior. Systematic characterization by UV–Vis spectroscopy, photoluminescence (PL), and quantum yield measurements (QY) confirmed that heteroatom doping effectively modulates the electronic structure of CQDs, enabling controllable emission spanning the UV to visible region. Undoped CQDs exhibited excitation-dependent blue emission arising from surface states, whereas nitrogen doping introduced mid-gap states responsible for a pronounced red-shift and dual-band emission. Co-doping with nitrogen and sulfur further intensified defect-related blue emission, leading to a noticeable enhancement in photoluminescence intensity. In addition, the nitrogen-doped CQDs were successfully employed as a sensitive fluorescent probe for Fe³⁺ ion detection. The CQDs exhibited high selectivity toward Fe³⁺ with significant fluorescence quenching, attributed to strong coordination between Fe³⁺ ions and surface functional groups. The sensing performance was optimized by studying the effects of pH, reaction time, and Fe³⁺ concentration, revealing a rapid response within 5 minutes and effective operation over a wide pH range (3–11) with maximum quenching at pH 7. A linear Stern–Volmer relationship was observed between quenching efficiency and Fe³⁺ concentration (1–200 μM), demonstrating the suitability of N-CQDs for quantitative detection. Overall, this study highlights the ability to tune CQD emission through controlled heteroatom doping and demonstrates the practical potential of N-doped CQDs as a simple, sensitive, and selective fluorescent sensor for Fe³⁺ ions in aqueous environments.
Keywords:
carbon quantum dots
; heteroatom doping
; nitrogen-doped CQDs
; nitrogen
; sulfur co-doped CQDs
; XRD analysis
; XPS analysis
; optical properties
; Fe³⁺ ion sensing
; fluorescence quenching
1. Introduction
Carbon quantum dots (CQDs) have attracted significant attention due to their distinctive optical, electronic, surface, and chemical properties. These nanoscale materials, typically a few to several tens of nanometers in size, exhibit quantum confinement, surface state, and molecular state effects, which enable tunable photoluminescence across the visible and near-infrared regions. CQDs are highly customizable; their size, surface functional groups, and heteroatom doping can be precisely tailored to modulate optical and electronic behaviors [1,2,3,4,5,6,7]. These distinctive features, together with excellent aqueous dispersibility, chemical stability, and low toxicity, render CQDs highly promising for a broad spectrum of applications, including bioimaging, fluorescence sensing, drug delivery, photocatalysis, energy storage, and optoelectronic devices such as light-emitting diodes (LEDs) and photodetectors [8,9,10,11,12]. Beyond their optical advantages, CQDs exhibit remarkable biocompatibility and water solubility, making them particularly suitable for biomedical applications such as bioimaging, biosensing, and targeted drug delivery [13,14,15,16,17]. Moreover, the presence of graphene-like sp2 carbon domains endows CQDs with favorable electrical conductivity, facilitating their integration into field-effect transistors, energy storage systems, and flexible electronic devices [18,19]. In addition, CQDs demonstrate excellent chemical and optical stability under diverse environmental conditions, further supporting their reliability for long-term practical applications [20].
CQDs can be synthesized from diverse chemical and bio-based carbon sources, including carbon nanotubes [2] , graphene, graphite, citric acid [3], ethylenediamine [5,6,21], and glucose [4], using top-down or bottom-up approaches such as hydrothermal, solvothermal, microwave-assisted, electrochemical, arc discharge, and laser ablation methods Control of synthetic parameters—including precursor type, temperature, reaction time, and pH—allows tailoring of size, surface chemistry, and optical properties [22].
Heteroatom doping—particularly with nitrogen and sulfur—has been widely explored as an efficient strategy to modulate the electronic structure of CQDs. Nitrogen atoms can introduce mid-gap states and enhance electron-donating behavior, whereas sulfur atoms contribute to additional surface defects and bonding configurations. Despite these advances, a systematic comparison of undoped, N-doped, and N,S-co-doped CQDs prepared under identical conditions is still limited in the literature. In particular, the precise effect of single and dual doping on both absorption characteristics and emission tunability remains insufficiently understood. Furthermore, while doped CQDs have shown potential in metal-ion detection, their sensing behavior is often evaluated without optimizing key parameters such as pH, reaction time, and concentration-dependent linearity, leaving knowledge gaps regarding their practical applicability. Although many studies have reported CQDs doped with nitrogen or sulfur [16,19,23], few works provide a direct, comprehensive comparison of how doping configurations influence optical properties and sensing performance under controlled and comparable conditions. Moreover, there is a lack of systematic optimization for Fe³⁺ detection using doped CQDs, especially concerning pH stability, response kinetics, and quantitative analysis.
The aim of this study is to synthesize and systematically compare the optical properties of undoped, nitrogen-doped, and nitrogen/sulfur co-doped carbon quantum dots prepared under identical experimental conditions using simple molecular additives. By employing UV–Vis absorption, photoluminescence spectroscopy, quantum yield measurements, and XPS analysis, we seek to elucidate how single and dual heteroatom doping modify the electronic structure and emission behavior of CQDs. Additionally, this work aims to evaluate the practical sensing capability of the N-doped CQDs toward Fe³⁺ ions by investigating their selectivity, pH-dependent stability, reaction kinetics, and concentration-dependent fluorescence quenching. Through this integrated approach, the study strives to identify the optimal conditions for Fe³⁺ detection and to demonstrate the potential of doped CQDs as versatile fluorescent probes for analytical applications.
2. Chemicals and Materials
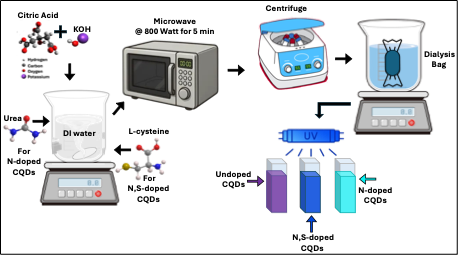
The chemicals used for the microwave-assisted synthesis of composite, doped, and undoped CQDs—including citric acid (C₆H₈O₇), potassium hydroxide (KOH), urea (CH₄N₂O), L-cysteine (C₃H₇NO₂S)—were purchased from a commercial supplier and used as received without further purification. Ultra-pure DI-water served as the solvent for all preparations. A dialysis membrane with a molecular weight cutoff (MWCO) of 500–1,000 Da was employed for sample purification. Figure 1 presents the chemical formulas of Citric Acid, Urea, and L-cysteine
3. Synthesis of Carbon Quantum Dots
3.1. Synthesis of Undoped CQDs
Undoped CQDs were synthesized in aqueous solution as follows: Citric acid and KOH were used as the primary precursors, and the synthesis was carried out using a standard household microwave oven. First, 3 g (0.014 mol) of citric acid and 1 g (0.017 mol) of KOH were dissolved in 20 mL of DI-water under continuous stirring until a clear, homogeneous solution was obtained. The solution was then subjected to microwave irradiation at 800 W for 5 minutes, resulting in rapid carbonization and the formation of a black particulate solid. The resulting solid was collected by centrifugation at 1200 rpm for 10 minutes and washed several times with DI-water and ethanol to remove residual impurities. The purified precipitate was transferred into a dialysis membrane (MWCO 500 Da) and dialyzed against deionized water for 24 hours to remove unreacted species. Subsequently, the permeate was re-dialyzed using a second membrane (MWCO 1000 Da) for three days to ensure complete purification. The final retained fraction was collected for further characterization. Under UV illumination, the synthesized sample exhibited a purple fluorescence, and was therefore designated as Purple CQDs.
3.2. Synthesis of CQDs Doped with Nitrogen
Nitrogen-doped CQD (N-CQDs) were synthesized following the same procedure used for preparing the undoped (purple) CQDs, with the addition of urea as a nitrogen source. Specifically, 0.033 mol of urea was introduced into the precursor solution prior to microwave treatment. Upon completion of the synthesis and purification steps, the resulting CQDs exhibited a cyan fluorescence under ultraviolet illumination. Therefore, this sample is referred to as Cyan CQDs throughout this work.
3.3. Synthesis of CQDs Doped with Heteroatoms of Nitrogen and Sulfur L-Cysteine
L-cysteine serves as an effective precursor for introducing both nitrogen and sulfur (S) heteroatoms into the carbon dot core structure. To synthesize dual-doped N,S-CQDs, the same procedure used for preparing the undoped (purple) CQDs was followed, with the addition of 0.016 mol of L-cysteine to the precursor solution. Upon UV illumination, the resulting CQDs exhibited a distinct blue fluorescence. Therefore, this sample is referred to as Blue CQDs throughout this work. The synthesis procedure of CQDs (purple, cyan, and blue) is outlined in Figure 2.
4. Instrumentation
X-ray diffraction (XRD) measurements were carried out using a Rigaku Ultima IV diffractometer. High-resolution transmission electron microscopy (HR-TEM) was performed using a JEOL ARM-200F microscope operated at 200 kV and equipped with dual Cs correctors. Images were acquired with an Orius camera, and data extraction and processing were conducted using Gatan software. Fourier-transform infrared (FTIR) spectra were recorded using a PerkinElmer FTIR spectrometer. Samples were mounted on the thin-film sample holder with the film surface directly facing the IR source, and measurements were collected over the wavenumber range of 400–4000 cm⁻¹. X-ray photoelectron spectroscopy (XPS) was performed using an XPS spectrometer, and the acquired spectra were analyzed with CasaXPS software. For XPS measurements, CQD dispersions were drop-cast onto 10 mm × 10 mm indium tin oxide substrates and dried in an oven prior to analysis. Optical absorption measurements were obtained using a Jasco V-770 UV–Vis–NIR spectrophotometer. Photoluminescence (PL) spectra were recorded with a Jasco fluorescence spectrometer. Quantum yield (QY) measurements of the CQD samples were carried out using a 100 mm integrating sphere attached to a Jasco spectrophotometer (ILF-835).
5. Results and Discussions
5.1. Structural Characterization
5.1.1. X-Ray Diffraction Analysis (XRD)
The non-destructive XRD analytical technique was used to determine the chemical composition, crystal structure, phase purity, and crystallite size of CQDs. When the conditions satisfy Bragg’s law, the interaction between the incident X-rays and the crystal planes produces constructive interference, resulting in a diffracted beam. Bragg’s law is expressed as [25,26]:
Where is the order of diffraction (an integer: 1, 2, 3, …), is the wavelength of the incident X-rays, is the interplanar spacing between adjacent crystal planes, and is the angle between the incident ray and the crystal plane (Bragg angle).
Figure 3(a) shows the XRD pattern for the undoped Purple CQDs. A broad diffraction peak centered at approximately 22.66°, corresponding to the (002) plane with a d-spacing of 0.39 nm, was observed. This broad feature indicates the formation of amorphous carbon structures, consistent with previously reported CQDs synthesized from sodium citrate and polyacrylamide via a hydrothermal route [27,28].
For nitrogen-doped CQDs (Cyan CQDs), the XRD pattern exhibited a slight shift of the main peak toward a lower angle. As shown in Figure 3(b), the primary diffraction peak appeared at 21°, corresponding to the (002) plane with an increased d-spacing of 0.41 nm. This shift reflects the successful incorporation of nitrogen atoms into the carbon framework [29]. Additionally, the diffraction pattern featured secondary peaks at 37° and 44°, attributed to the (110) and (100) planes, respectively [30], further confirming the presence of amorphous carbon phases [31].
The XRD pattern of the nitrogen and sulfur co-doped CQDs (Blue CQDs) is shown in Figure 3(c). A broad peak around 24°, corresponding to the (002) plane with a d-spacing of 0.336 nm, was detected. This result aligns with the findings of Elkun et al. (2025), who reported a similar interlayer spacing (0.36 nm) for CQDs derived from the sodium salt of EDTA [32]. The Blue CQD sample also displayed additional diffraction peaks at 37°, 40°, 44°, and 49°, which correspond to the (110), (100), and (102) planes. These features indicate the presence of structurally disordered carbon domains, along with dopant-induced crystalline signatures [31,33]. The appearance of these extra peaks may also be attributed to residual crystalline salts formed through reactions involving L-cysteine during synthesis [34]. Table 1 summarizes the diffraction angles, interplanar spacings, and FWHM values for both doped and undoped CQDs.
5.1.2. Transmission Electron Microscopy Analysis (TEM)
The TEM image for CQDs in Figure 4(a) reveals quasi-spherical particles with diameters in the range of approximately 2–8 nm. There are well-defined lattice fringes with an interlayer spacing of ~0.34 nm, corresponding to the (002) plane of sp2-hybridized graphitic carbon, as illustrated in Figure 4(b). Particle size analysis was performed using ImageJ software by measuring 100 individual CQDs, and the resulting size distribution is presented in the histogram in Figure 4(c). The combined TEM and XRD results confirm that the synthesized CQDs possess a predominantly graphitic structure.
5.1.3. Fourier-Transform Infrared Analysis (FTIR)
The FTIR spectrum of undoped CQDs (Purple CQDs) is shown in Figure 5(a). The spectrum exhibits absorption peaks at 3370 cm⁻¹ and 2965 cm⁻¹, corresponding to O–H and C–H stretching vibrations, respectively. These peaks confirm the presence of hydroxyl and aliphatic groups on the CQD surface. A distinct band at 1705 cm⁻¹ is attributed to the C=O stretching vibration of carboxyl (COOH) groups [35], indicating the existence of carboxylic functionalities [36]. The peak at 1456 cm⁻¹ corresponds to O–H in-plane deformation, further supporting the presence of hydroxyl groups. Additionally, the absorption band at 1581 cm⁻¹ is associated with C=C stretching, confirming the formation of unsaturated carbon domains within the CQD cores [30]. In comparison, the FTIR spectrum of N-doped CQDs (Cyan CQDs) shows a broader absorption band between 3000–3500 cm⁻¹ relative to the undoped sample (Figure 5(b)). This broadening results from the overlapping of N–H and O–H stretching vibrations. The doped CQDs also exhibit several characteristic peaks between 1210–1680 cm⁻¹, corresponding to C–N stretching vibrations [30], confirming successful N incorporation. The bending vibration of C=C bonds appears at 1575 cm⁻¹, while the peak at 1401 cm⁻¹ corresponds to C–N bending, providing further evidence of nitrogen doping [37].
Introducing L-cysteine during synthesis produced N,S-co-doped CQDs (Blue CQDs), resulting in significant variations in the FTIR spectrum (Figure 5(c)). As expected, L-cysteine contributes both N and S dopants. A key feature of S incorporation is the appearance of C=S stretching bands in the 1400–1050 cm⁻¹ region, with a prominent peak at 1083 cm⁻¹ confirming C=S vibrations. In addition, a weak C–S stretching band appears at 635 cm⁻¹ [37]. The presence of C–N vibrations also confirms nitrogen incorporation. Although the characteristic CQD bands remain present, their relative intensities differ due to the dopants. Overall, the FTIR analysis confirms that the CQDs synthesized by this method possess amino and hydroxyl surface groups, contributing to their hydrophilic nature [27,38].
5.1.4. X-Ray Photoelectron Spectroscopy Analysis (XPS)
The XPS technique enables the identification of elemental composition, oxidation states, and chemical bonding environments based on the photoelectric effect, owing to its sensitivity to surface states [39,40]. The high-resolution XPS spectra presented in Figure 6 were employed to identify the chemical states of carbon (C), oxygen (O), nitrogen (N), and sulfur (S), allowing us to verify doping and surface functional groups in the synthesized CQDs.
For the undoped Purple CQDs, only carbon and oxygen signals were detected (Figure 7(a)). The high-resolution C1s spectrum revealed four distinct components at 285 eV, 286 eV, 288 eV, and 290 eV, corresponding to C–C/C=C, C–O, C=O, and O–C=O groups, respectively. The dominant peak at 286.5 eV is attributed to C–O and C=C–OH bonding [30], consistent with FTIR results confirming the presence of hydroxyl functional groups. The O1s spectrum (Figure 7(b)) exhibited two peaks assigned to C–O=C at 532.9 eV [23] and C–O at 534.1 eV [36], further supporting the existence of carbonyl and hydroxyl groups on the CQD surface. For the N-doped Cyan CQDs, an additional N1s peak appeared, confirming successful nitrogen incorporation. As shown in Figure 7(c), the high-resolution C1s spectrum again displayed four components at 285 eV, 286 eV, 288 eV, and 289 eV, corresponding to C–N, C–O, C=O/OH–C=O, and O=C–O functional groups. The clear N1s signal verifies the formation of nitrogen-doped CQDs. In Figure 7(d), N-doping led to the appearance of pyridinic N at 397.8 eV, while graphitic N was observed at 401.5 eV and 402 eV. For N,S co-doped Blue CQDs, the C1s spectrum confirmed the presence of carbon, and additional peaks were observed in Figure 7(g) and 7(i). In Figure 7(g), N-doping resulted in pyridinic N at 399 eV and graphitic N at 401 eV and 402 eV [41]. Figure 7(i) further revealed S2p peaks at 163, 164, 166, and 168.2 eV. The peaks at 163 and 164 eV can be assigned to the 2p3/2and 2p1/2 [34] components of the C–S covalent bond, reflecting spin–orbit splitting, whereas the peaks at 166 and 168.2 eV [42] correspond to –C–SOₓ and C–S species. These observations confirm the successful dual doping of N and S in the CQDs.
5.2. Optical Characterization
5.2.1. UV-Vis Absorption Spectroscopy Analysis
The π–π* transition from electrons in conjugated aromatic structures, and n–π* transitions from electrons in functional groups such as C=O appear in the UV-Vis spectrum as characteristic peaks [42]. Figure 8(a) shows the absorption spectrum of undoped Purple CQDs, with a sharp π–π* transition at 239 nm. The position of absorption peaks depends on the synthesis method and surface groups [43]. Nitrogen doping modifies the electronic structure. As shown in Figure 8(b), N-doped Cyan CQDs exhibit a slight blue shift of the π–π* peak to 231 nm, along with a new absorption feature at 335 nm and a tail extending to 485 nm, reflecting nitrogen-induced energy states within the bandgap [44,45]. N,S co-doping Blue CQDs, Figure 8(c), further tunes the optical properties and displays peaks at ~241 nm (π–π*), 356 nm, and a tail to 450 nm, corresponding to additional states created by nitrogen and sulfur doping. These heteroatoms modify the band structure, enabling bandgap engineering and expanding absorption across the visible spectrum [46].
5.2.2. Photoluminescence (PL) Spectroscopy Analysis
Undoped Purple CQDs exhibit photoluminescence upon UV or visible excitation, with emission originating from both the carbon core and surface states. Figure 9(a) shows emission at 273 nm corresponding to the π–π* transition of the carbon core, while a broad excitation-independent peak around 422 nm arises from radiative recombination involving carbon–oxygen functional groups. The measured quantum yield is 0.03%, with low efficiency attributed to size variability and heterogeneous surface states across the CQD population.
The N-doped Cyan CQDs exhibit tunable emission due to nitrogen-induced energy states in the carbon matrix. Excitation within the absorption tail (350–420 nm) produces two emission peaks at 415 nm and 538 nm, resulting in Cyan emission (Figure 9b). The quantum yield was measured as 0.12%, with emission behavior influenced by nitrogen doping and altered quantum confinement effects. This result confirms that introducing nitrogen atoms into the carbon matrix creates new energy levels within the bandgap. Nitrogen, with an atomic radius similar to carbon and five valence electrons, can form strong bonds with carbon atoms [47,48]. The extra electrons in nitrogen relative to carbon make N-doping effectively n-type. CQDs with surfaces enriched in n-type nitrogen can transfer electrons from the LUMO to donor levels during excitation, resulting in quenching of the carbon core emission [49].
Figure 9(c) shows the PL spectra of N,S co-doped Blue CQDs. Under high-energy excitation, a weak emission near 400 nm is observed. Excitation in the 330–420 nm range produces a strong emission centered in the blue region, with only minor shifts as the excitation energy decreases. This emission arises from mid-gap energy levels introduced by heteroatom (N and S) doping. Similar observations have been reported in the literature. Akhgari et al. synthesized N,S co-doped CQDs from pomegranate juice (carbon source) and L-cysteine (N and S source) via a hydrothermal method (5 h at 200 °C), producing CQDs with blue fluorescence and a quantum yield of 4.8% [50]. Ding et al. also reported N,S co-doped carbon dots exhibiting intense blue luminescence [51]. Table 2. summarizes UV-Vis absorption, photoluminescence spectra, and quantum yield of all CQDs samples.
5.2.3. The Chromaticity Color Coordinates Measurements
The photoluminescence color coordinates obtained at different excitation wavelengths (nm) provide a quantitative description of the perceived emission color and its tunability. These coordinates establish a direct link between the material’s emission spectrum and human color perception, enabling an objective evaluation of excitation-dependent color behavior [52]. Additionally, the color coordinates of the synthesized undoped and doped CQDs were analyzed to evaluate their emission characteristics. Figure 10(a) presents the color coordinates of the undoped carbon quantum dots (Purple CQDs) under 200 nm excitation. The corresponding (x, y, z) values indicate that the emission lies in the blue region, close to the purple area of the chromaticity diagram at this excitation energy. Figure 10(b) shows the color coordinates of the N-doped CQDs (Cyan CQDs) under 240 nm excitation. The values clearly place the emission in the green region of the chromaticity diagram. Figure 10(c) displays the color coordinates of N,S co-doped CQDs (blue CQDs) under 240 nm excitation. In this case, the values confirm that the emission is located in the blue region.
5.3. Fe³⁺ Ion Sensing Using N-Doped CQDs
The selectivity of nitrogen-doped CQDs (N-CQDs) as fluorescent probes for various transition metal ions—including Fe²⁺, Cu²⁺, Zn²⁺, Ni²⁺, and Co²⁺—was previously evaluated [53]. Most of these metal ions caused only slight changes in fluorescence intensity. In contrast, Fe³⁺ ions induced significant fluorescence quenching of N-CQDs, highlighting their potential for selective Fe³⁺ detection [54]. Accordingly, the synthesized N-CQDs were employed for Fe³⁺ ion-sensing applications in this study.
Fe³⁺ Ion Sensing Experiments
Detection experiments were conducted as follows: 100 μL of the N-CQD solution was added to 3.0 mL of an aqueous Fe³⁺ solution. Fluorescence spectra were recorded using a Shimadzu RF-6000 spectrofluorophotometer, with excitation at 330 nm. To investigate the effect of Fe³⁺ concentration, varying amounts of Fe³⁺ were added to 3 mL of the CQD solution, and the emission intensity at 400 nm was monitored under 330 nm excitation. Initially, the UV-Vis spectra of N-CQDs and N-CQDs in the presence of Fe³⁺ ions were examined. As shown in Figure 11, the UV-Vis absorption spectrum of the Fe³⁺-N-CQDs sample changed significantly upon the addition of 100 µM Fe³⁺ ions, with the absorption band in the UV region (~285 nm) disappearing. This effect is primarily attributed to the interaction of Fe³⁺ ions with the surface states of the CQDs. These results clearly demonstrate that the synthesized N-CQDs can serve as an effective fluorescent probe for Fe³⁺ ion sensing.
To investigate the effect of pH on fluorescence intensity, solutions were prepared at different pH values while maintaining a constant Fe³⁺ concentration of 200 μM, and the fluorescence of the CQDs solutions was measured. Figure 12(a) shows the fluorescence intensity of CQDs across the pH range. At pH 1, the fluorescence intensity remained largely unchanged. As the pH increased from 3 to 11, the fluorescence quenching efficiency increased significantly, reaching a maximum at pH 7. Under highly acidic or basic conditions, Fe³⁺ ions can potentially hydrolyze to form iron hydroxide, which could interfere with accurate detection. However, no precipitation of iron hydroxide was observed in this study, likely because the Fe³⁺ ions were already complexed with the CQDs. These results demonstrate that the synthesized CQDs can serve as effective fluorescent sensors over a broad pH range (3–11), with optimal sensing performance at neutral pH.
Next, the effect of reaction time on the fluorescence intensity of CQDs in the presence of 200 μM Fe³⁺ ions was investigated. As shown in Figure 12(b), significant fluorescence quenching occurred within the first 5 minutes. These results indicate that neutral pH conditions yield optimal quenching within this timeframe. Therefore, for quantitative experiments, a reaction time of 5 minutes was selected to ensure stable and reliable measurements.
Using the optimized conditions, the fluorescence response of CQD solutions was investigated with varying Fe³⁺ ion concentrations. As shown in Figure 13(a), the fluorescence intensity of CQDs at 410 nm decreased progressively as the Fe³⁺ concentration increased from 0 to 200 μM. A plot of the fluorescence quenching efficiency versus Fe³⁺ concentration (1–200 μM) (Figure 13b) revealed a linear relationship. These results demonstrate that the synthesized CQDs can serve as effective sensors for Fe³⁺ ions in aqueous solutions. Furthermore, the detection limit and linear range of this method are comparable to those reported for CQDs prepared by other researchers.
6. Conclusion
In this study, undoped, nitrogen-doped, and nitrogen–sulfur co-doped carbon quantum dots were successfully synthesized using a microwave-assisted approach, yielding materials with tunable optical properties. Comprehensive characterization through UV–Vis absorption spectroscopy, photoluminescence, and quantum yield measurements confirmed that heteroatom doping effectively modulates the electronic structure of CQDs, enabling controlled emission across the UV–visible spectrum. Specifically, N-doped CQDs exhibited cyan emission, whereas N,S co-doped CQDs displayed intense blue fluorescence, clearly demonstrating the critical role of heteroatoms in bandgap engineering and emission tuning. Furthermore, the synthesized N-doped CQDs were successfully employed as selective fluorescent probes for Fe³⁺ ion detection in aqueous solutions. Systematic investigations of pH, reaction time, and Fe³⁺ ion concentration revealed rapid and sensitive fluorescence quenching behavior, with an excellent linear response over a wide concentration range. Optimal sensing performance was achieved at neutral pH with a short reaction time of 5 minutes, highlighting the efficiency and practicality of the proposed sensing platform. Overall, this work underscores the versatility of heteroatom-doped CQDs in tailoring optical properties and demonstrates their potential as efficient and selective fluorescent sensors. These findings provide valuable insights for the future development of CQD-based sensing systems and broaden their applicability in chemical sensing and optoelectronic applications.
Funding
No funds were provided to complete this data.
Data availability
The authors confirm that the data supporting the findings of this study are available and can be accessed within the article.
Acknowledgement
The authors acknowledge with thanks the University of Jeddah for its research facilities.
Competing of interests
The authors report no conflicts of interest. The author alone is responsible for the content and writing of this article.
Consent to Publish Declaration
Not applicable.
Consent to Participate
Not applicable. This study did not involve human participants.
Ethics and Consent to Participate Declarations
Not applicable.
References
- Karthik, P.S.; Himaja, A.L.; Singh, S.P. Carbon-allotropes: Synthesis methods, applications and future perspectives. Carbon Letters 2014, 15, 219–237. [Google Scholar] [CrossRef]
- Woggon, U.; Alivisatos, P. Optical Properties of Semiconductor Quantum Dots. Physics Today 1998, 51, 94–94. [Google Scholar] [CrossRef]
- Sheng, W. dong; et al. Electronic and optical properties of semiconductor and graphene quantum dots. Front Physics (Beijing) 2012, 7, 328–352. [Google Scholar] [CrossRef]
- Pourmadadi, M.; et al. Properties and application of carbon quantum dots (CQDs) in biosensors for disease detection: a comprehensive review. J Drug Deliv Sci Technol 2023, 104156. [Google Scholar] [CrossRef]
- Liu, E.; et al. Highly Emissive Carbon Dots in Solid State and Their Applications in Light-Emitting Devices and Visible Light Communication. ACS Sustain Chem Eng 2019, 7, 9301–9308. [Google Scholar] [CrossRef]
- Color Emission Carbon Dots with Quench-ResixAstant Solid-State Fluorescence for Light-Emitting Diodes. ACS Sustain Chem Eng 2021, 9, 3901–3908. [CrossRef]
- Sharma, J.; Dave, P.Y. photostabilityCarbon Dots : Zero Dimensional Fluorescent Material. Journal of Nanomaterials & Molecular Nanotechnology 2020, 10, 1–10. [Google Scholar]
- Liu, Z.; et al. Photoluminescence of carbon quantum dots : coarsely adjusted by quantum confinement effects and finely by surface trap states. Science China Chemistry 2018, 61, 490–496. [Google Scholar] [CrossRef]
- Yuan, K.; et al. Surface state modulation of red emitting carbon dots for white light-emitting diodes. J Mater Chem C Mater 2018, 6, 12631–12637. [Google Scholar] [CrossRef]
- Ding, H.; Yu, S.B.; Wei, J.S.; Xiong, H.M. Full-color light-emitting carbon dots with a surface-state-controlled luminescence mechanism. ACS Nano 2016, 10, 484–491. [Google Scholar] [CrossRef]
- Yan, F.; Zhang, H.; Xu, J.; Wu, Y.; Zang, Y.; Sun, J. Color Emission Carbon Dots with Quench-ResixAstant Solid-State Fluorescence for Light-Emitting Diodes. ACS Sustain Chem Eng 2021, 9, 3901–3908. [Google Scholar] [CrossRef]
- Kalytchuk, S.; Zdražil, L.; Scheibe, M.; Zbořil, R. Purple-emissive carbon dots enhance sensitivity of Si photodetectors to ultraviolet range. Nanoscale 2020, 12, 8379–8384. [Google Scholar] [CrossRef]
- Tungare, K.; Bhori, M.; Racherla, K.S.; Sawant, S. Synthesis, characterization and biocompatibility studies of carbon quantum dots from Phoenix dact. 3 Biotech 2020, 10, 1–14. [Google Scholar] [CrossRef] [PubMed]
- Zhao, P.; Zhu, L. Dispersibility of carbon dots in aqueous and/or organic solvents. Chemical Communications 2018, 54, 5401–5406. [Google Scholar] [CrossRef]
- Chan, K.K.; Yang, C.; Chien, Y.H.; Panwar, N.; Yong, K.T. A facile synthesis of label-free carbon dots with unique selectivity-tunable characteristics for ferric ion detection and cellular imaging applications. New Journal of Chemistry 2019, 43, 4734–4744. [Google Scholar] [CrossRef]
- Wang, Y.; Zhuang, Q.; Ni, Y. Facile Microwave-Assisted Solid-Phase Synthesis of Highly Fluorescent Nitrogen-Sulfur-Codoped Carbon Quantum Dots for Cellular Imaging Applications. Chemistry- A European Journal 2015, 21, 13004–13011. [Google Scholar] [CrossRef] [PubMed]
- Sun, X.; et al. Nano-graphene oxide for cellular imaging and drug delivery. Nano Res. 2008, 1, 203–212. [Google Scholar] [CrossRef]
- Hoang, V.C.; et al. Carbon quantum dot-based composites for energy storage and electrocatalysis: Mechanism, applications and future prospects. Nano Energy 2019, 66, 104093. [Google Scholar] [CrossRef]
- Denmark, I.; Macchi, S.; Watanabe, F.; Viswanathan, T.; Siraj, N. Effect of KOH on the Energy Storage Performance of Molasses-Based Phosphorus and Nitrogen Co-Doped Carbon. Electrochem 2021, 2, 29–41. [Google Scholar] [CrossRef]
- Dua, S.; Kumar, P.; Pani, B.; Kaur, A.; Khanna, M.; Bhatt, G. Stability of carbon quantum dots: a critical review. RSC Adv 2023, 13, 13845–13861. [Google Scholar] [CrossRef]
- Su, Z.C.; et al. Understanding and manipulating luminescence in carbon nanodots. Carbon N Y 2018, 126, 58–64. [Google Scholar] [CrossRef]
- Walaa, A.M.; Ali, M.; Omar, A.-H.; Wageh, S. Solid-State Emissive Carbon Quantum Dots (CQDs) with a Long Wavelength Emission. Journal of Nanoelectronics and Optoelectronics 2023, 18, 881–887. [Google Scholar] [CrossRef]
- 23; Cui, L.; Ren, X.; Sun, M.; Liu, H.; Xia, L. Carbon dots: Synthesis; properties; applications. Nanomaterials 2021, 11, 3419. [Google Scholar] [CrossRef]
- National Library of Medicine. Available online: https://pubchem.ncbi.nlm.nih.gov/compound/6694 (accessed on 10 December 2025).
- Joshi, M.; Bhattacharyya, A.; Ali, S.W. Characterization techniques for nanotechnology applications in textiles. Indian J Fibre Text Res 2008, 33, 304–317. [Google Scholar]
- Bunaciu, A.A.; Udriştioiu, E.G.; Aboul-Enein, H.Y.; Diffraction, X.-R. Applications. Crit Rev Anal Chem 2015, 45, 289–299. [Google Scholar] [CrossRef] [PubMed]
- Bajpai, S.K.; D’Souza, A.; Suhail, B. Blue light-emitting carbon dots (CDs) from a milk protein and their interaction with Spinacia oleracea leaf cells. Int Nano Lett 2019, 9, 203–212. [Google Scholar] [CrossRef]
- Liu, Y.; Zhou, Q.; Yuan, Y.; Wu, Y. Hydrothermal synthesis of fluorescent carbon dots from sodium citrate and polyacrylamide and their highly selective detection of lead and pyrophosphate. Carbon N Y 2017, 115, 550–560. [Google Scholar] [CrossRef]
- Hu, G. Rational synthesis of silane-functionalized carbon dots with high-efficiency full-color solid-state fluorescence for light emitting diodes. Carbon N Y 2022, 203, 1–10. [Google Scholar] [CrossRef]
- Wu, P.; Li, W.; Wu, Q.; Liu, Y.; Liu, S. Hydrothermal synthesis of nitrogen-doped carbon quantum dots from microcrystalline cellulose for the detection of Fe3+ ions in an acidic environment. RSC Adv 2017, 7, 44144–44153. [Google Scholar] [CrossRef]
- Vercelli, B.; Donnini, R.; Ghezzi, F.; Sansonetti, A.; Giovanella, U.; La Ferla, B. Nitrogen-doped carbon quantum dots obtained hydrothermally from citric acid and urea: The role of the specific nitrogen centers in their electrochemical and optical responses. Electrochim Acta 2021, 387, 138557. [Google Scholar] [CrossRef]
- Elkun, S.; Ghali, M.; Sharshar, T.; Mosaad, M.M. Carbon quantum dots from silymarin extraction for multi-fluorescent sensors, photocatalysis, and anticancer activity applications. Scientific Reports 2025, 15, 34115. [Google Scholar] [CrossRef]
- Koç, Ö.K.; Üzer, A.; Apak, R. Green synthesis of carbon dots from Calotropis procera leaves for trace level identification of isoprothiolane. ACS Appl Nano Mate 2022, 5, 5868–5881. [Google Scholar] [CrossRef]
- Sun, C.; et al. Synthesis of Nitrogen and Sulfur Co-doped Carbon Dots from Garlic for Selective Detection of Fe3+. Nanoscale Res Lett 2016, 11, 1–9. [Google Scholar] [CrossRef]
- Schneider, J.; Reckmeier, C.J.; Xiong, Y.; Von Seckendor, M.; Susha, A.S.; Rogach, A.L. Molecular Fluorescence in Citric Acid-Based Carbon Dots. J. Phys. Chem. 2017, 121, 2014−2022. [Google Scholar] [CrossRef]
- Pal, A.; Ahmad, K.; Dutta, D.; Chattopadhyay, A. Boron Doped Carbon Dots with Unusually High Photoluminescence Quantum Yield for Ratiometric Intracellular pH Sensing. ChemPhysChem 2019, 20, 1018–1027. [Google Scholar] [CrossRef]
- Qu, D.; et al. Highly luminescent S, N co-doped graphene quantum dots with broad visible absorption bands for visible light photocatalysts. Nanoscale 2013, 5, 12272–12277. [Google Scholar] [CrossRef]
- Singh, I.; Arora, R.; Dhiman, H.; Pahwa, R. Carbon quantum dots: Synthesis, characterization and biomedical applications. Turk J Pharm Sci 2018, 15, 219–230. [Google Scholar] [CrossRef]
- Stevie, F.A.; Donley, C.L. Introduction to x-ray photoelectron spectroscopy. Journal of Vacuum Science & Technology A 2020, 38, 063204. [Google Scholar] [CrossRef]
- John, B.K. A Review on Characterization Techniques for Carbon Quantum Dots and Their Applications in Agrochemical Residue Detection. J Fluoresc 2022, 32, 449–471. [Google Scholar] [CrossRef] [PubMed]
- Diac, A.; et al. Covalent conjugation of carbon dots with Rhodamine B and assessment of their photophysical properties. RSC Adv 2015, 5, 77662–77669. [Google Scholar] [CrossRef]
- Zhu, J.; et al. Blue-emitting carbon quantum dots: Ultrafast microwave synthesis, purification and strong fluorescence in organic solvents. Colloids Surf A Physicochem Eng Asp 2021, 623, 126673. [Google Scholar] [CrossRef]
- Stachurski, C.D.; et al. Optical and electrochemical tuning of hydrothermally synthesized nitrogen-doped carbon dots. Nanoscale Adv 2020, 2, 3375–3383. [Google Scholar] [CrossRef]
- Ragazzon, G.; Cadranel, A.; Ushakova, E.V.; Wang, Y.; Guldi, D.M. Review Optical processes in carbon nanocolloids. CHEM 2021, 7, 606–628. [Google Scholar] [CrossRef]
- Roy, P.; Chen, P.C.; Periasamy, A.P.; Chen, Y.N.; Chang, H.T. Photoluminescent carbon nanodots: Synthesis, physicochemical properties and analytical applications. Materials Today 2015, 18, 447–458. [Google Scholar] [CrossRef]
- Xiang, X.; Wang, L.; Zhang, J.; Cheng, B.; Yu, J.; Macyk, W.; Chalcogenide, C. CdSe, CdTe) Quantum Dots for Solar-to-Fuel Conversion. Adv Photonics Res 2022, 3, 2200065. [Google Scholar] [CrossRef]
- Dsouza, S.D. The importance of surface states in N-doped carbon quantum dots. Carbon N Y 2021, 183, 1–11. [Google Scholar] [CrossRef]
- Park, Y.; Yoo, J.; Lim, B.; Kwon, W.; Rhee, S.W. Improving the functionality of carbon nanodots: Doping and surface functionalization. J Mater Chem A Mater 2016, 4, 11582–11603. [Google Scholar] [CrossRef]
- Ng, H.K.M.; Lim, G.K.; Leo, C.P. Comparison between hydrothermal and microwave-assisted synthesis of carbon dots from biowaste and chemical for heavy metal detection : A review. Microchemical Journal 2021, 165, 106116. [Google Scholar] [CrossRef]
- Akhgari, F.; Samadi, N.S.; Farhadi, K.; Akhgari, M. A green one-pot synthesis of nitrogen and sulfur co-doped carbon quantum dots for sensitive and selective detection of cephalexin. Canadian Journal of Chemistry 2017, 95, 641–648. [Google Scholar] [CrossRef]
- Ding, H.; Weia, J.-S.; Xiong, H.-M. Nitrogen and sulfur co-doped carbon dots with strong blue luminescence. Nanoscale 2014, 6, 13817–13823. [Google Scholar] [CrossRef]
- Demir, H.V.; Nizamoglu, S.; Erdem, T.; Mutlugun, E.; Gaponik, N.; Eychmüller, A. Quantum dot integrated LEDs using photonic and excitonic color conversion. Nano Today 2011, 6, 632–647. [Google Scholar] [CrossRef]
- Bruno, F.; Sciortino, A.; Buscarino, G.; Cannas, M.; Gelardi, F.M.; Messina, F.; Agnello, S. Sensing of Transition Metals by Top-Down Carbon Dots. Applied Sciences 2021, 11, 10360. [Google Scholar] [CrossRef]
- 54; Sun, C.; Zhang, Y.; Wang, P.; Yang, Y.; Wang, Y.; Xu, J.; Wang, Y.; Yu, W.W. Synthesis of Nitrogen and Sulfur Co-doped Carbon Dots from Garlic for Selective Detection of Fe3+. Nanoscale Research Letters 2016, 11, 110. [Google Scholar] [CrossRef]
Figure 1.
The chemical formulas of Citric Acid, Urea, and L-cysteine, redrawn from reference [24].
Figure 1.
The chemical formulas of Citric Acid, Urea, and L-cysteine, redrawn from reference [24].
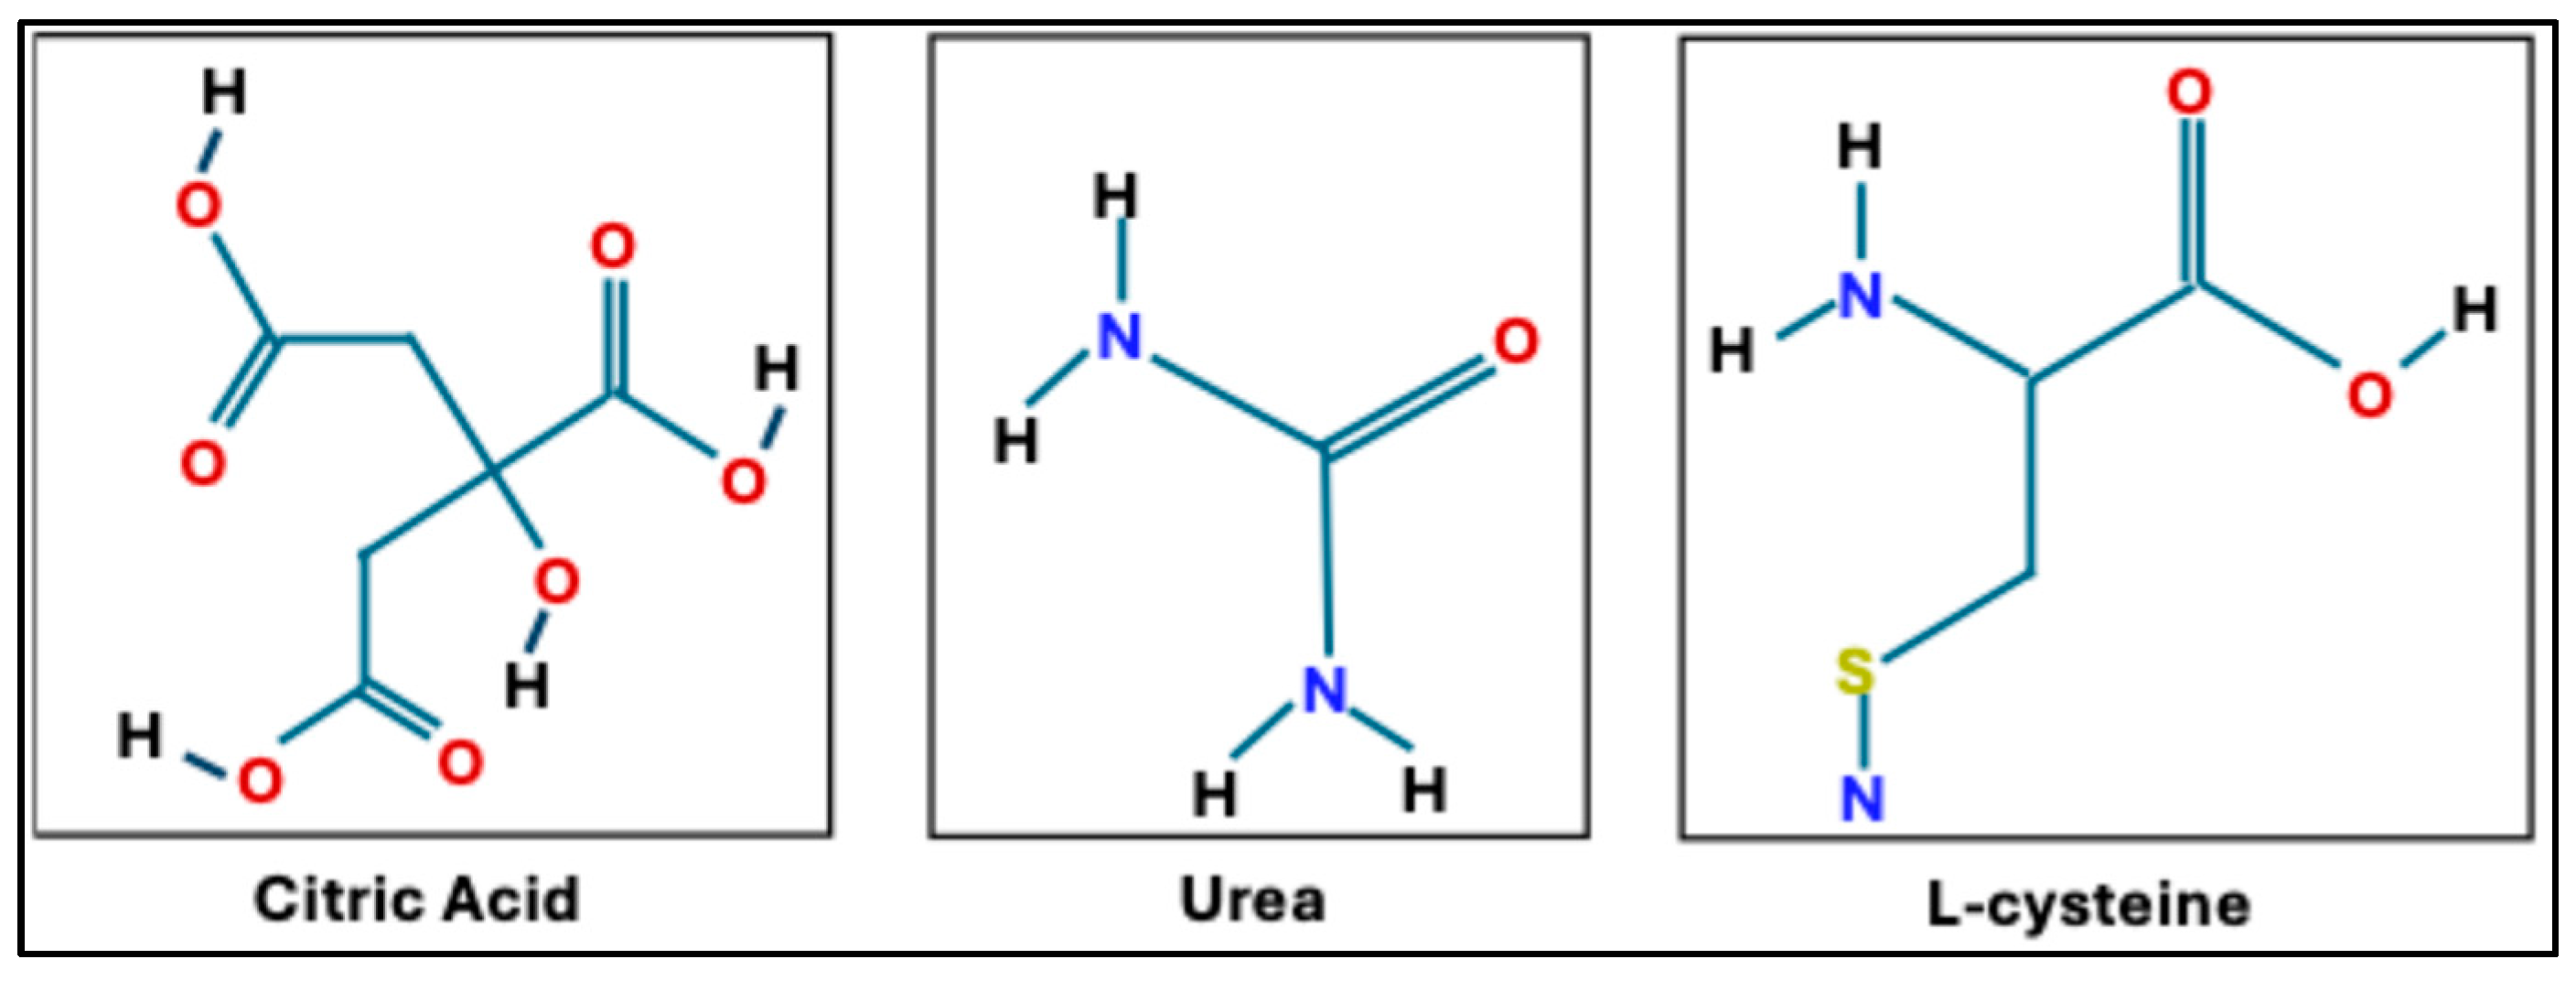
Figure 2.
Schematic diagram for the synthesis of CQDs by microwave method.
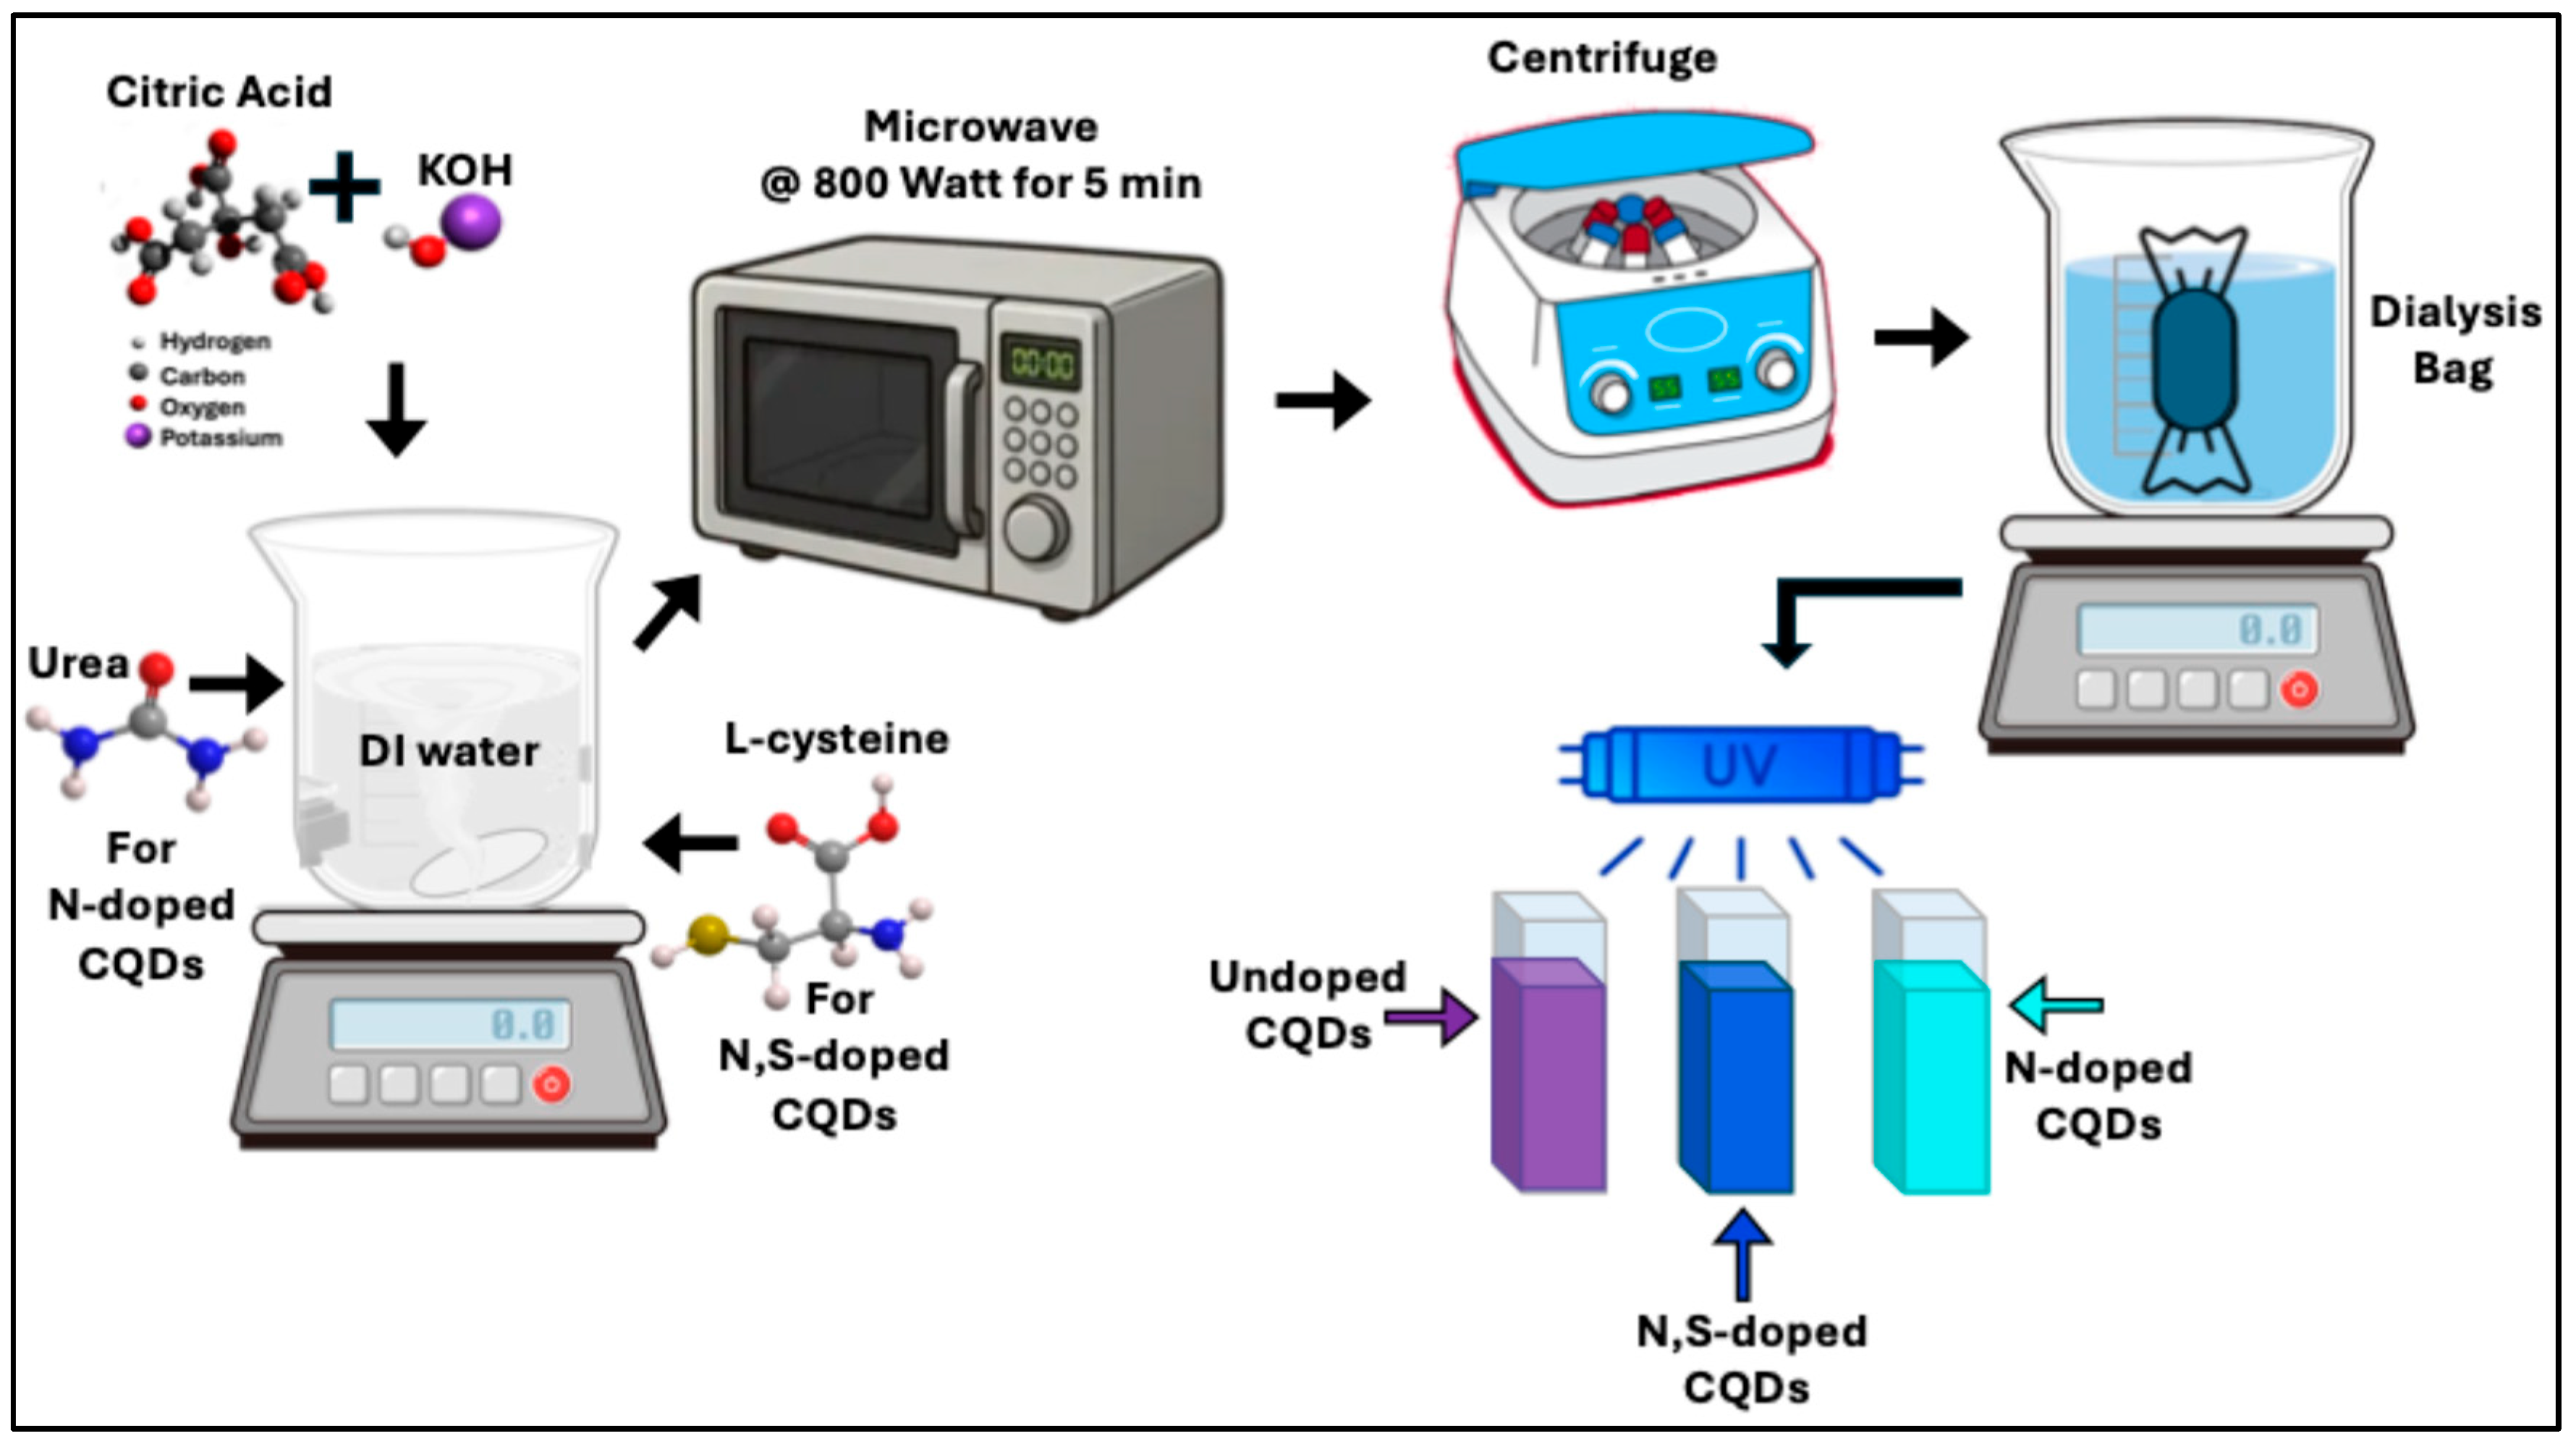
Figure 3.
XRD patterns of (a) Purple CQDs, (b) Cyan CQDs, and (c) Blue CQDs.
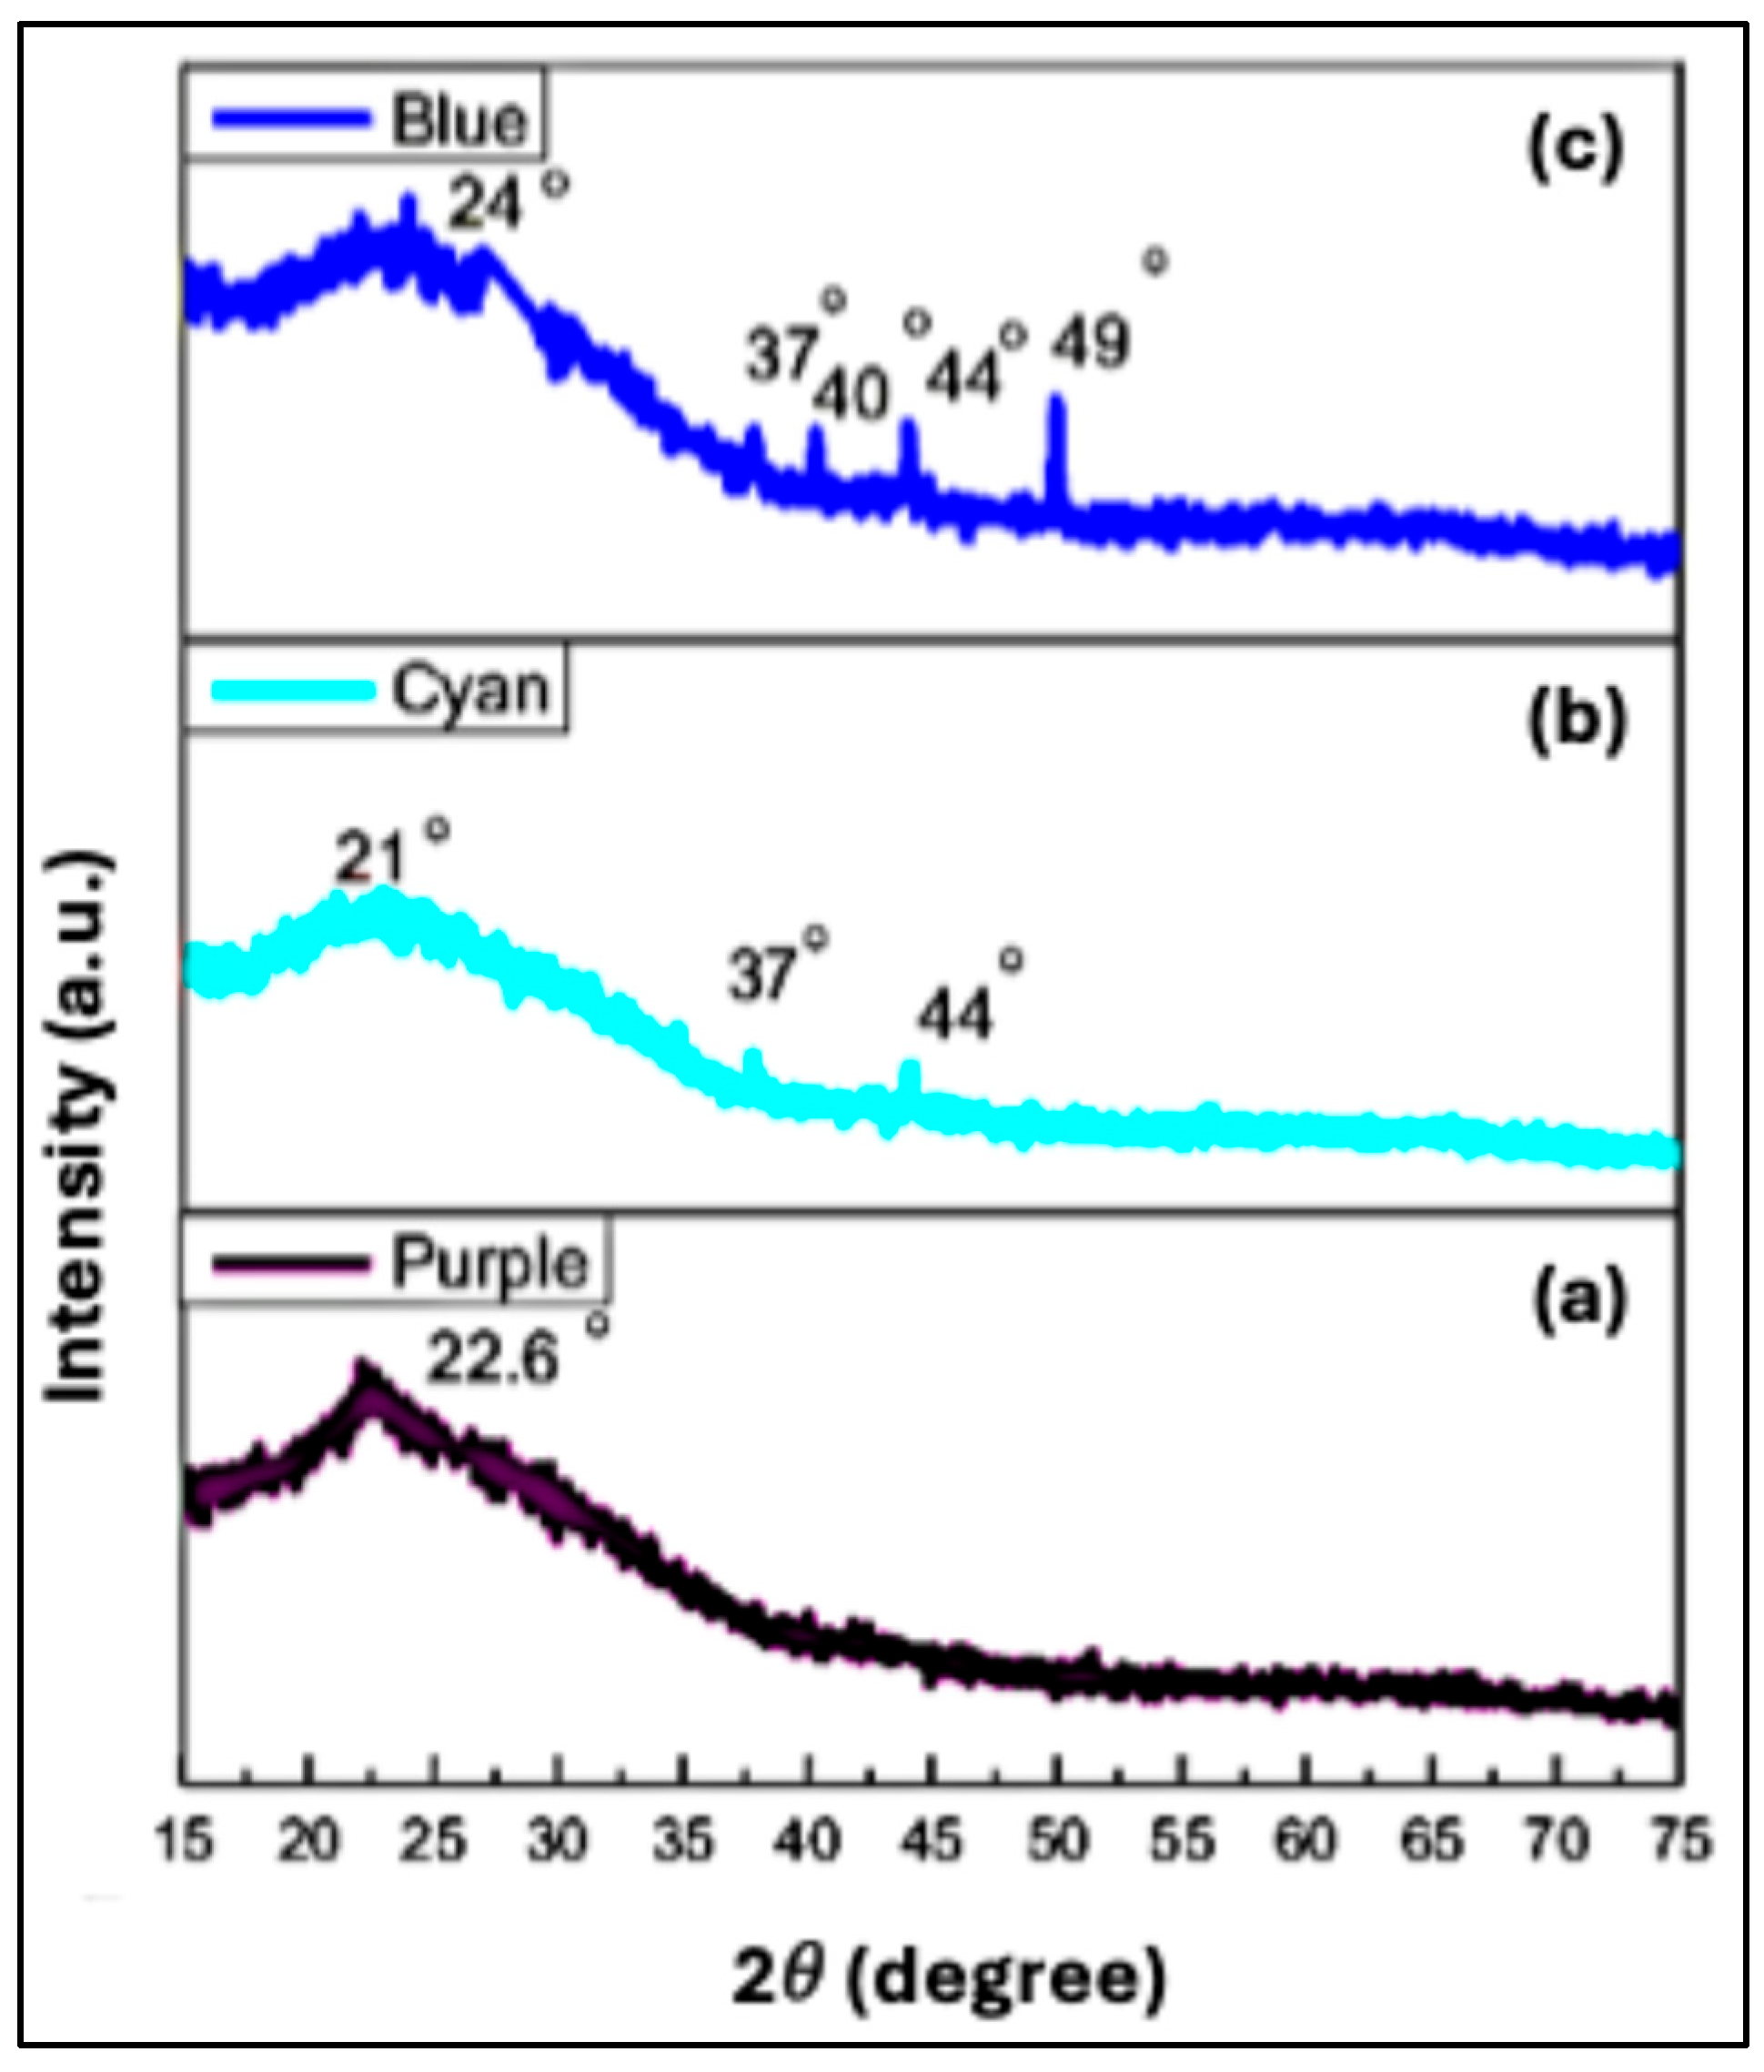
Figure 4.
(a) TEM images of the CQDs, with red insets showing the particle size distribution; (b) TEM images of the CQDs with lattice fringes highlighted in the inset of Figure (a); and (c) Particle size histograms.
Figure 4.
(a) TEM images of the CQDs, with red insets showing the particle size distribution; (b) TEM images of the CQDs with lattice fringes highlighted in the inset of Figure (a); and (c) Particle size histograms.

Figure 5.
FTIR spectra of (a) Undoped CQDs (Purple), (b) N-doped CQDs (Cyan), and (c) N,S co-doped CQDs (Blue), illustrating the evolution of surface functional groups resulting from heteroatom doping.
Figure 5.
FTIR spectra of (a) Undoped CQDs (Purple), (b) N-doped CQDs (Cyan), and (c) N,S co-doped CQDs (Blue), illustrating the evolution of surface functional groups resulting from heteroatom doping.
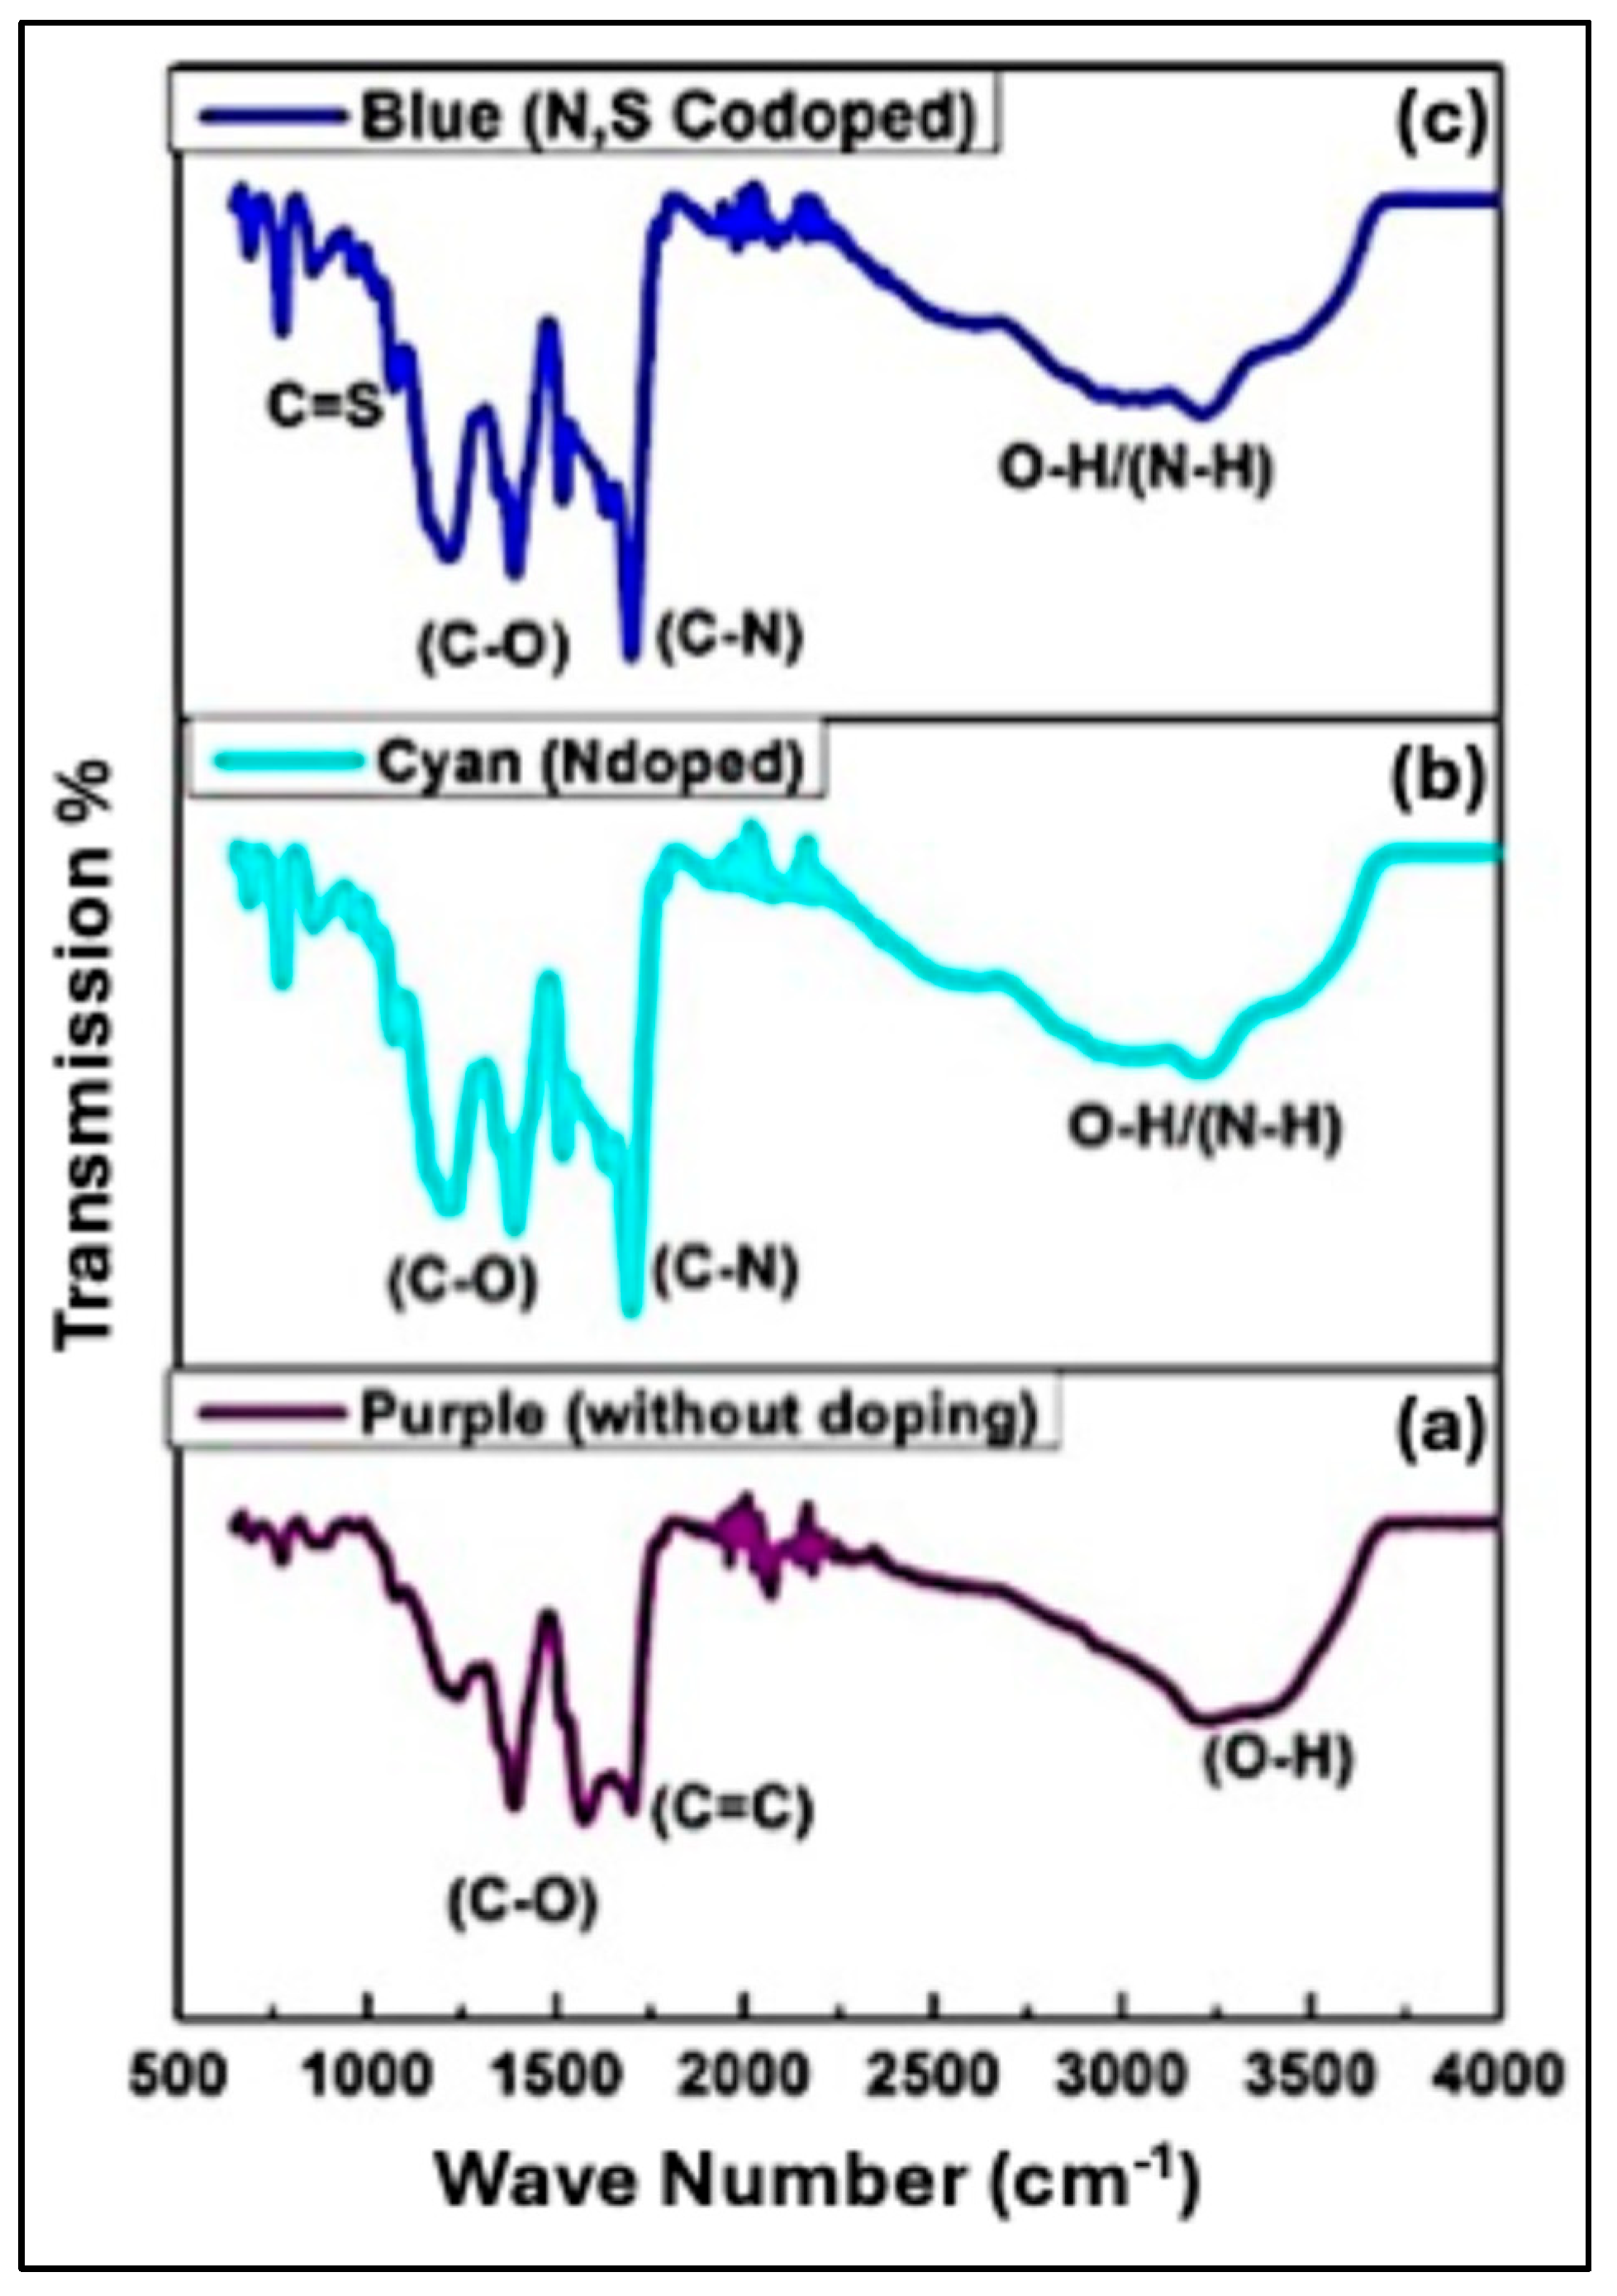
Figure 6.
XPS patterns of (a) Purple CQDs, (b) Cyan CQDs, and (c) Blue CQDs.
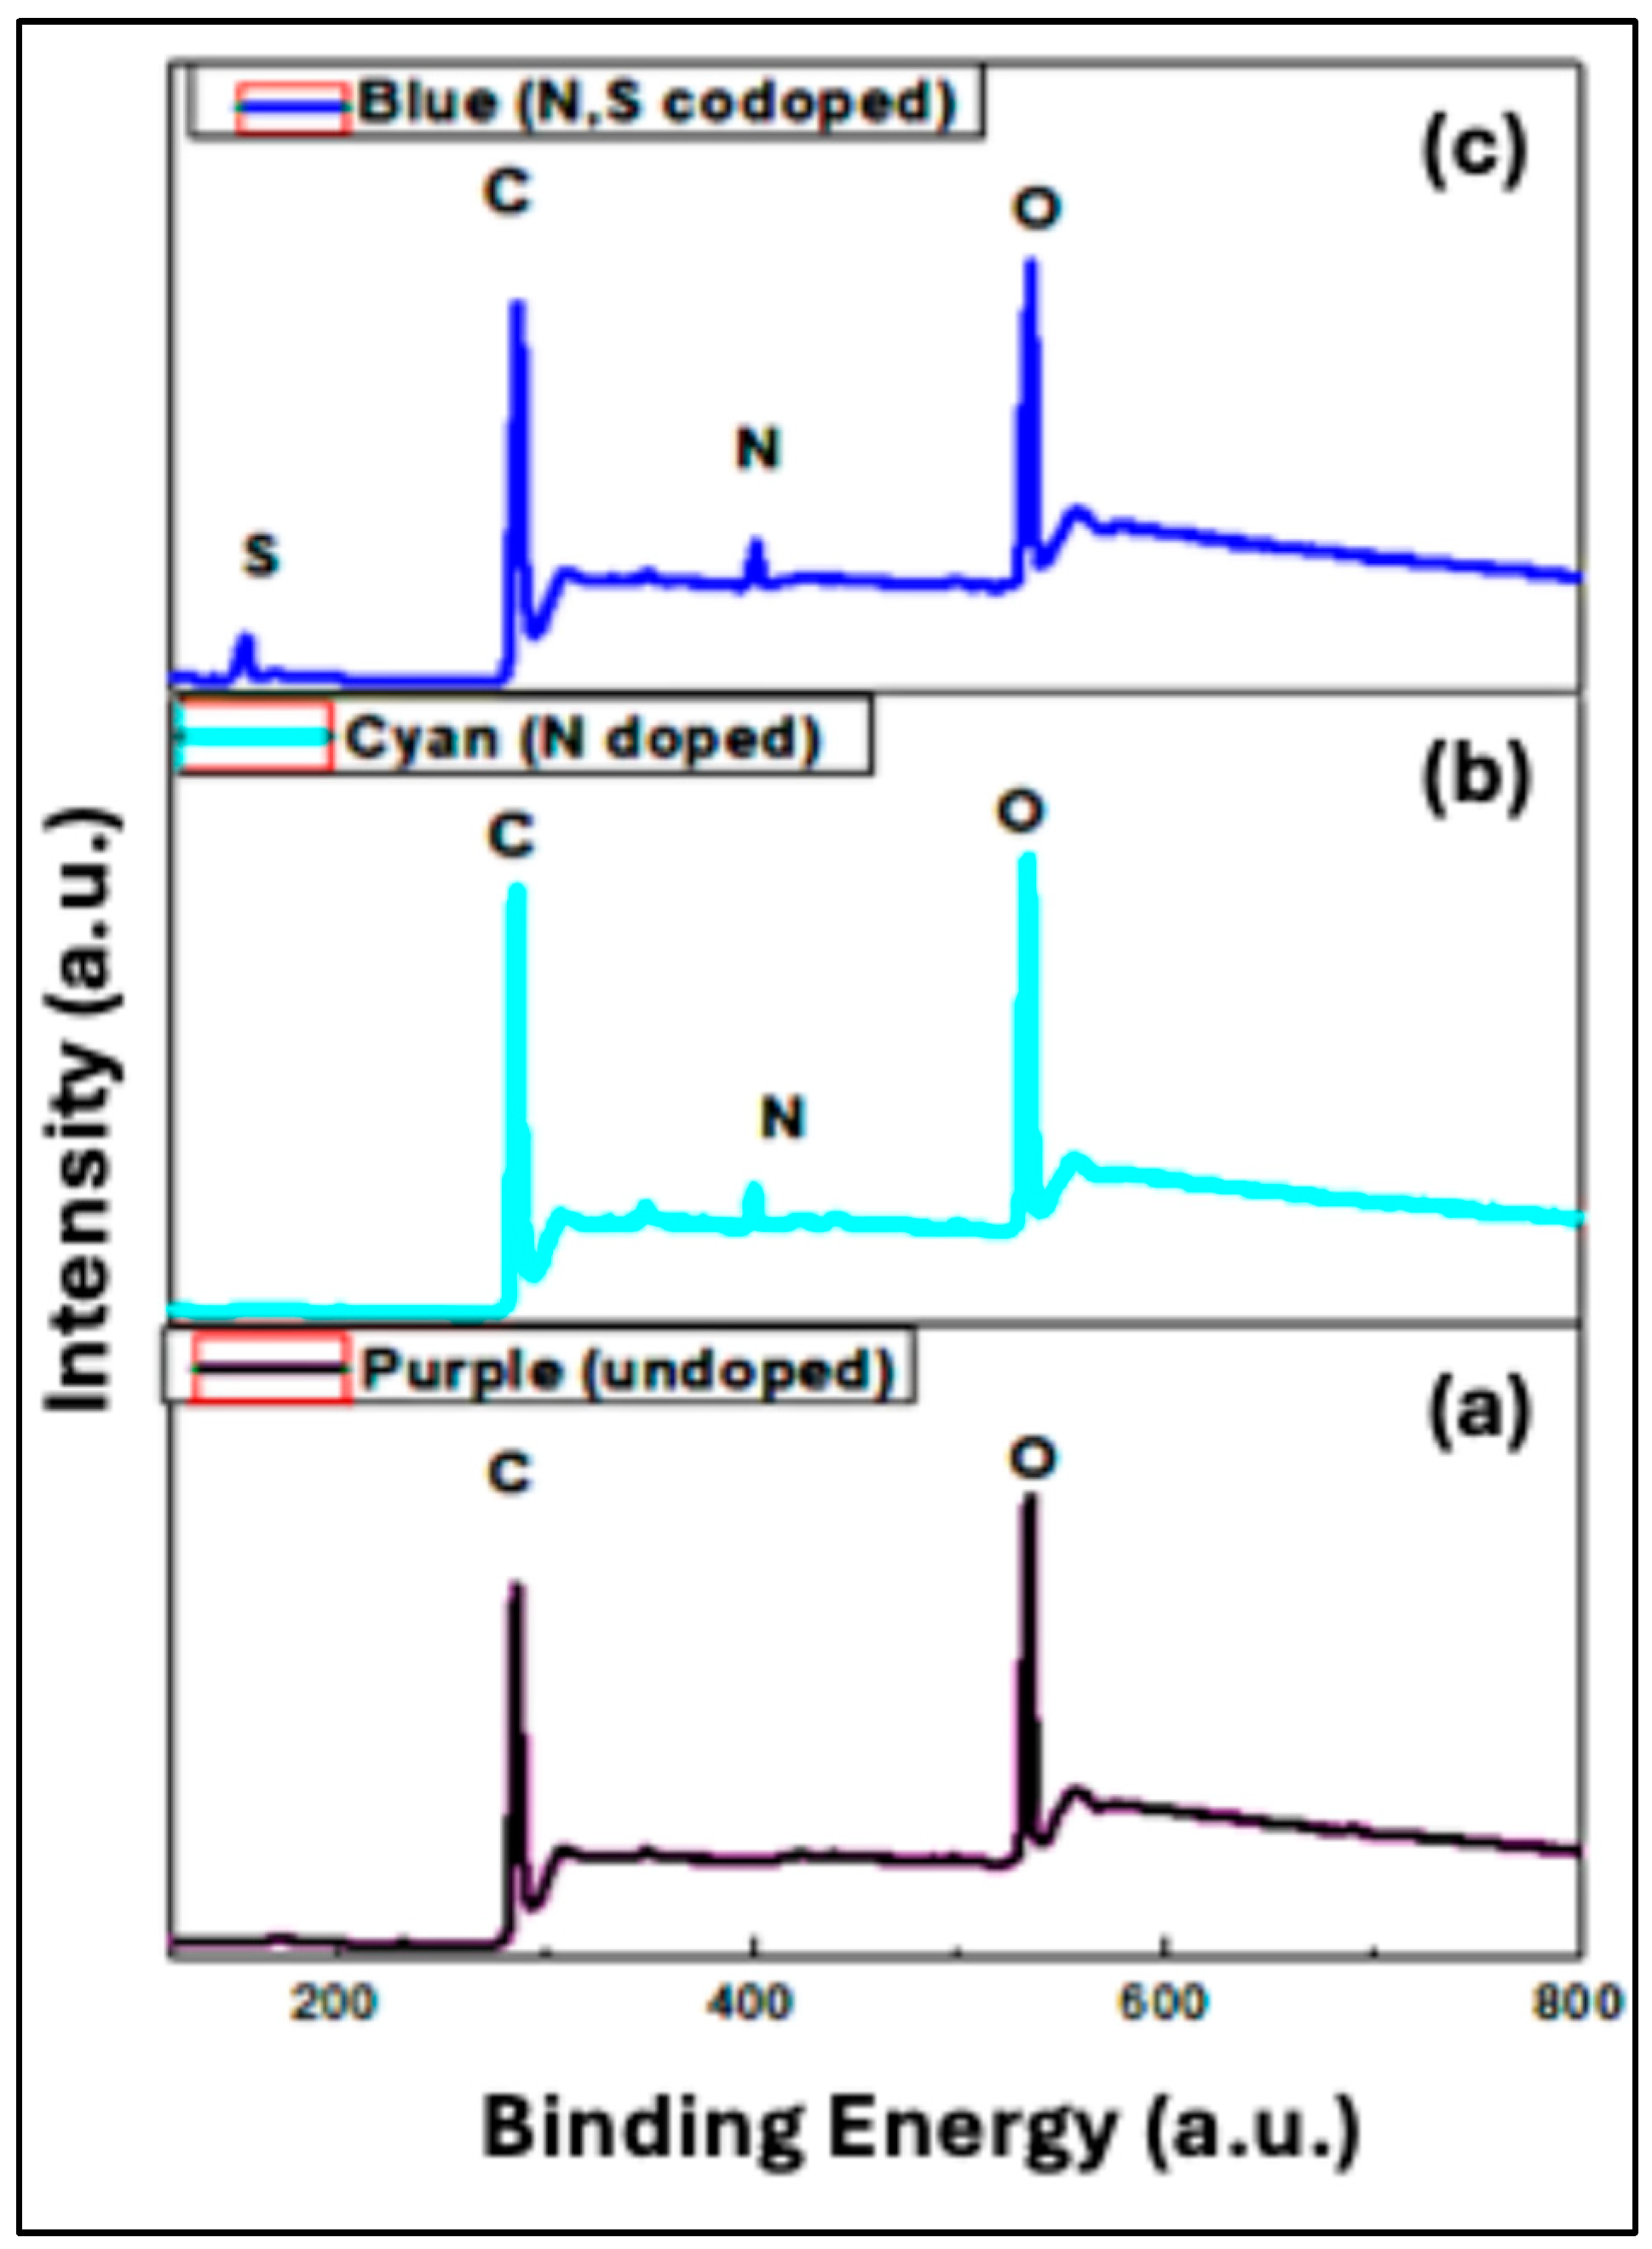
Figure 7.
High-resolution XPS spectra of CQDs. (a–b) Undoped CQDs (purple) showing the C1s and O1s peaks, (c–d) N-doped CQDs (cyan) displaying the C1s, O1s, and N1s peaks, and (f–i) N,S co-doped CQDs (blue) highlighting the C1s, O1s, N1s, and S 2p peaks.
Figure 7.
High-resolution XPS spectra of CQDs. (a–b) Undoped CQDs (purple) showing the C1s and O1s peaks, (c–d) N-doped CQDs (cyan) displaying the C1s, O1s, and N1s peaks, and (f–i) N,S co-doped CQDs (blue) highlighting the C1s, O1s, N1s, and S 2p peaks.
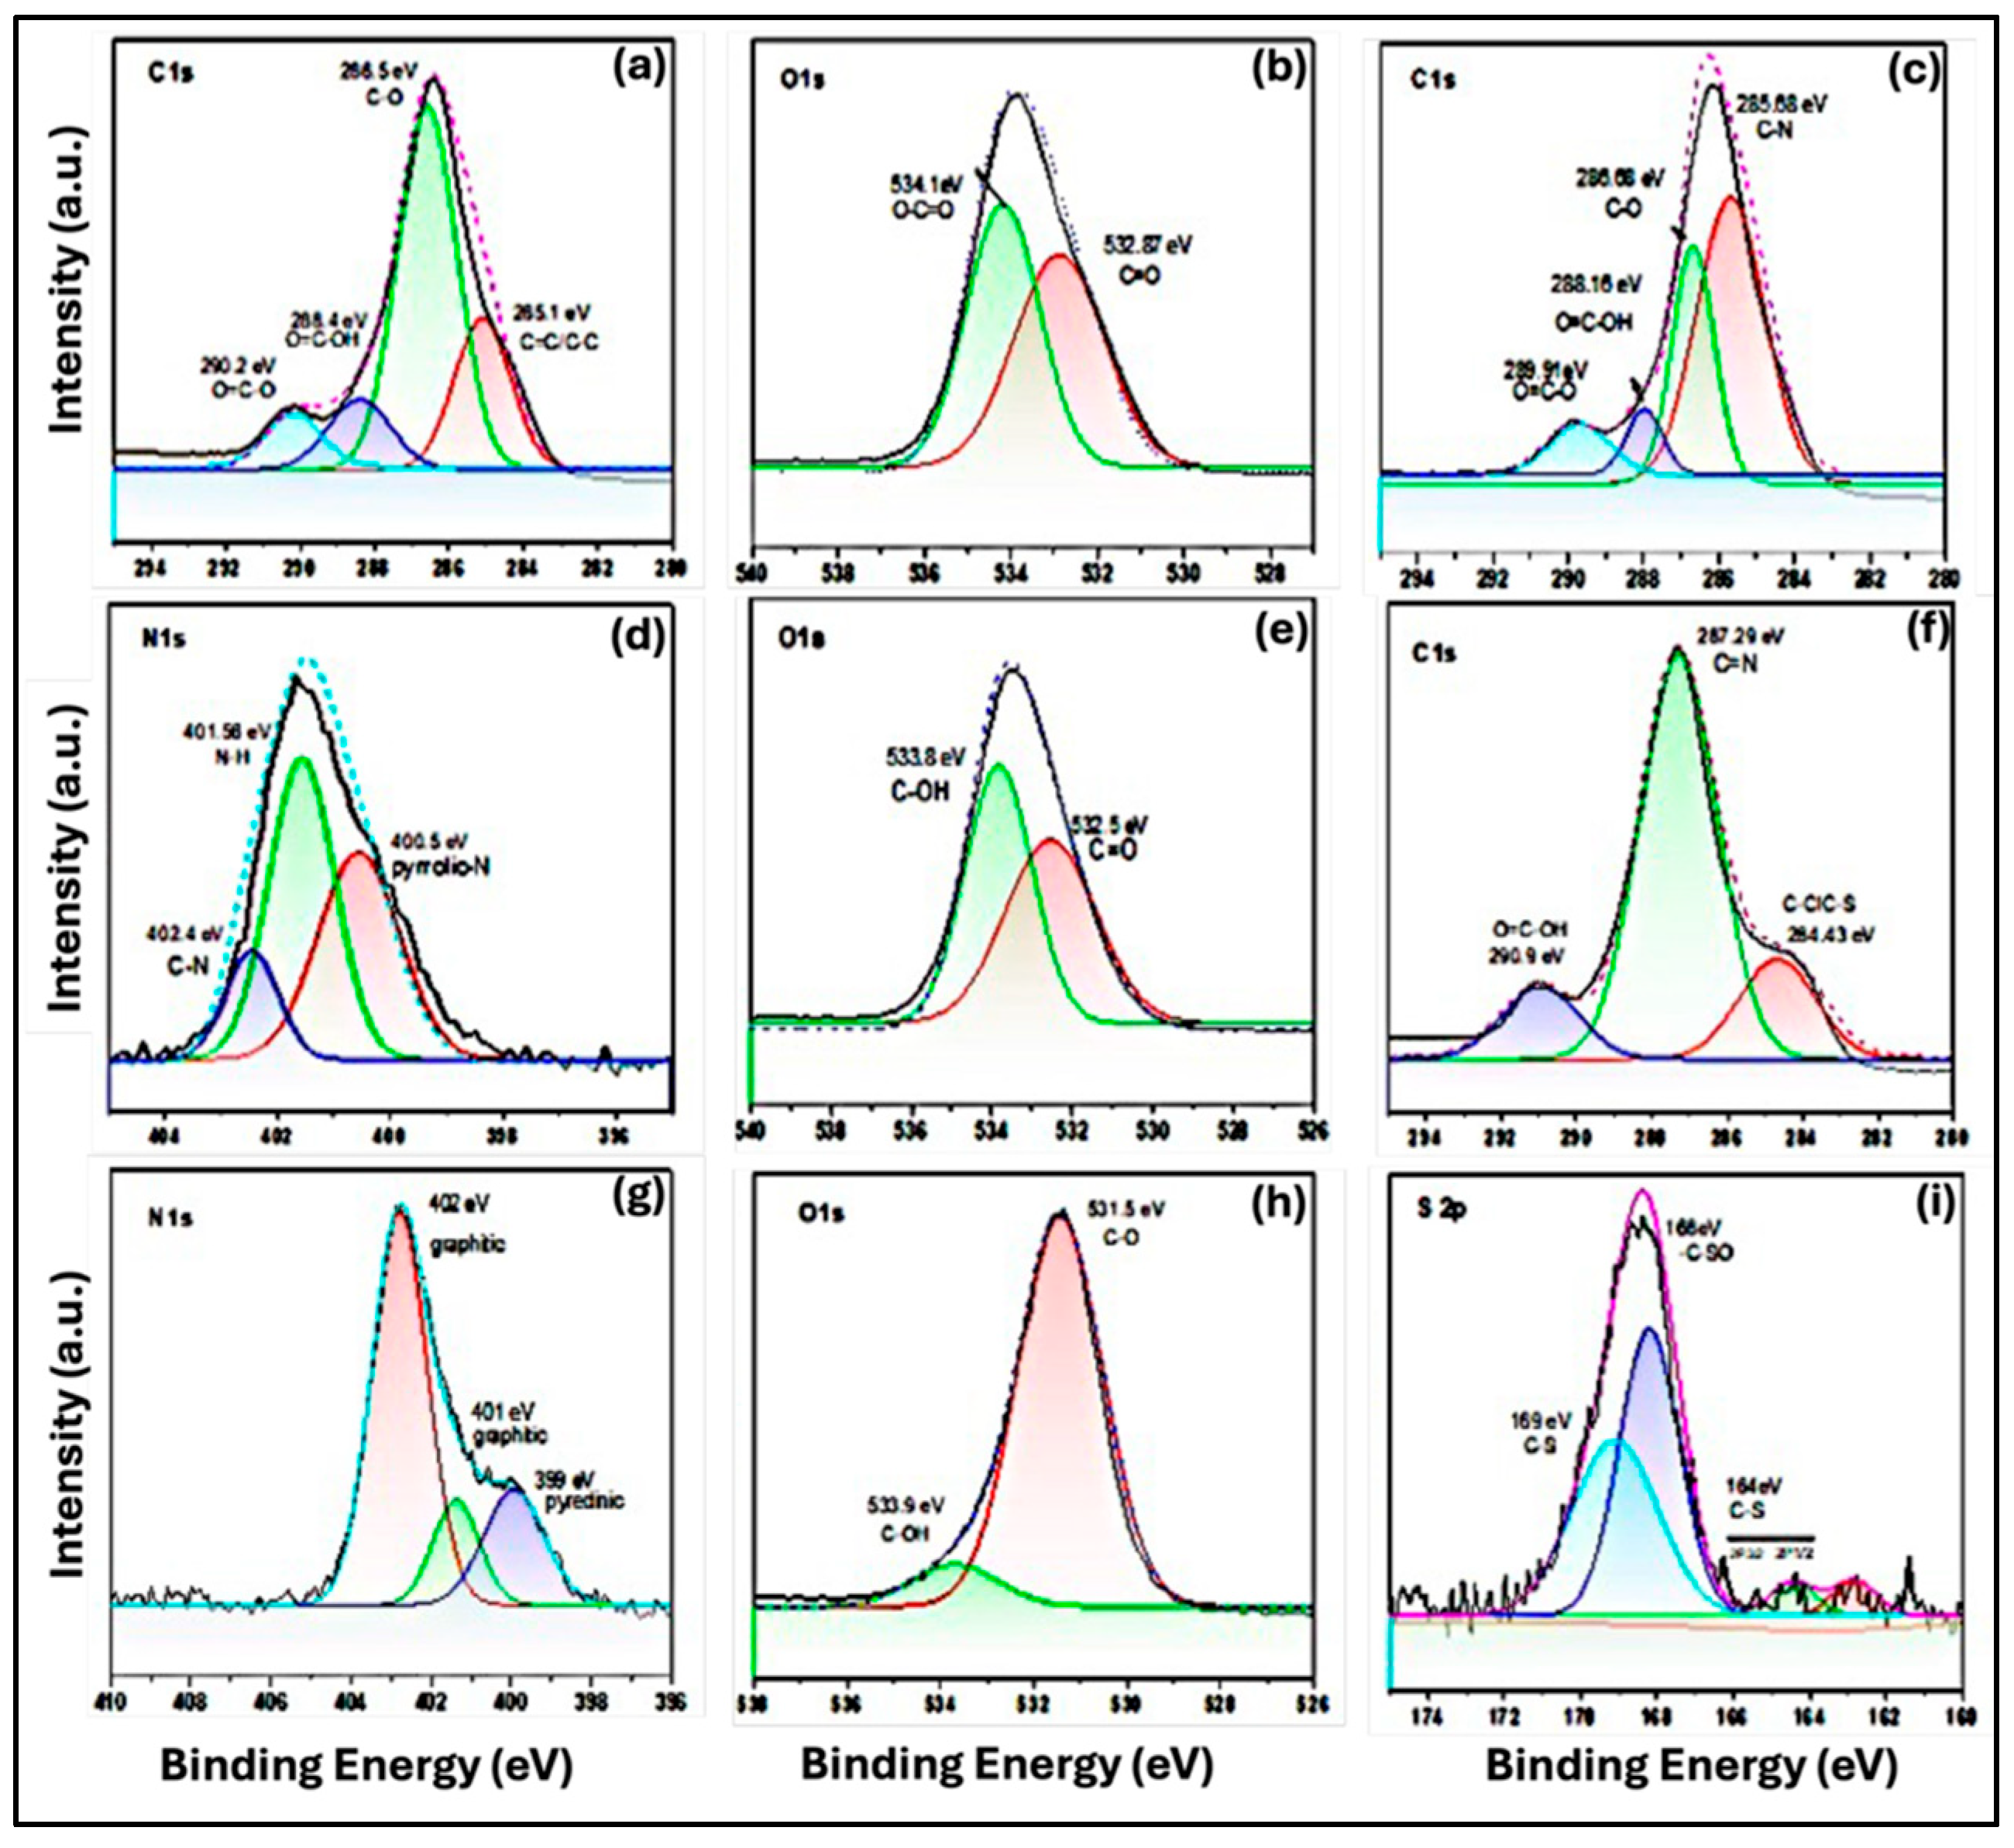
Figure 8.
UV–Vis absorption spectra of CQDs in aqueous solution: (a) Undoped Purple CQDs, (b) N-doped Cyan CQDs (), and (c) N,S–co-doped Blue CQDs.
Figure 8.
UV–Vis absorption spectra of CQDs in aqueous solution: (a) Undoped Purple CQDs, (b) N-doped Cyan CQDs (), and (c) N,S–co-doped Blue CQDs.
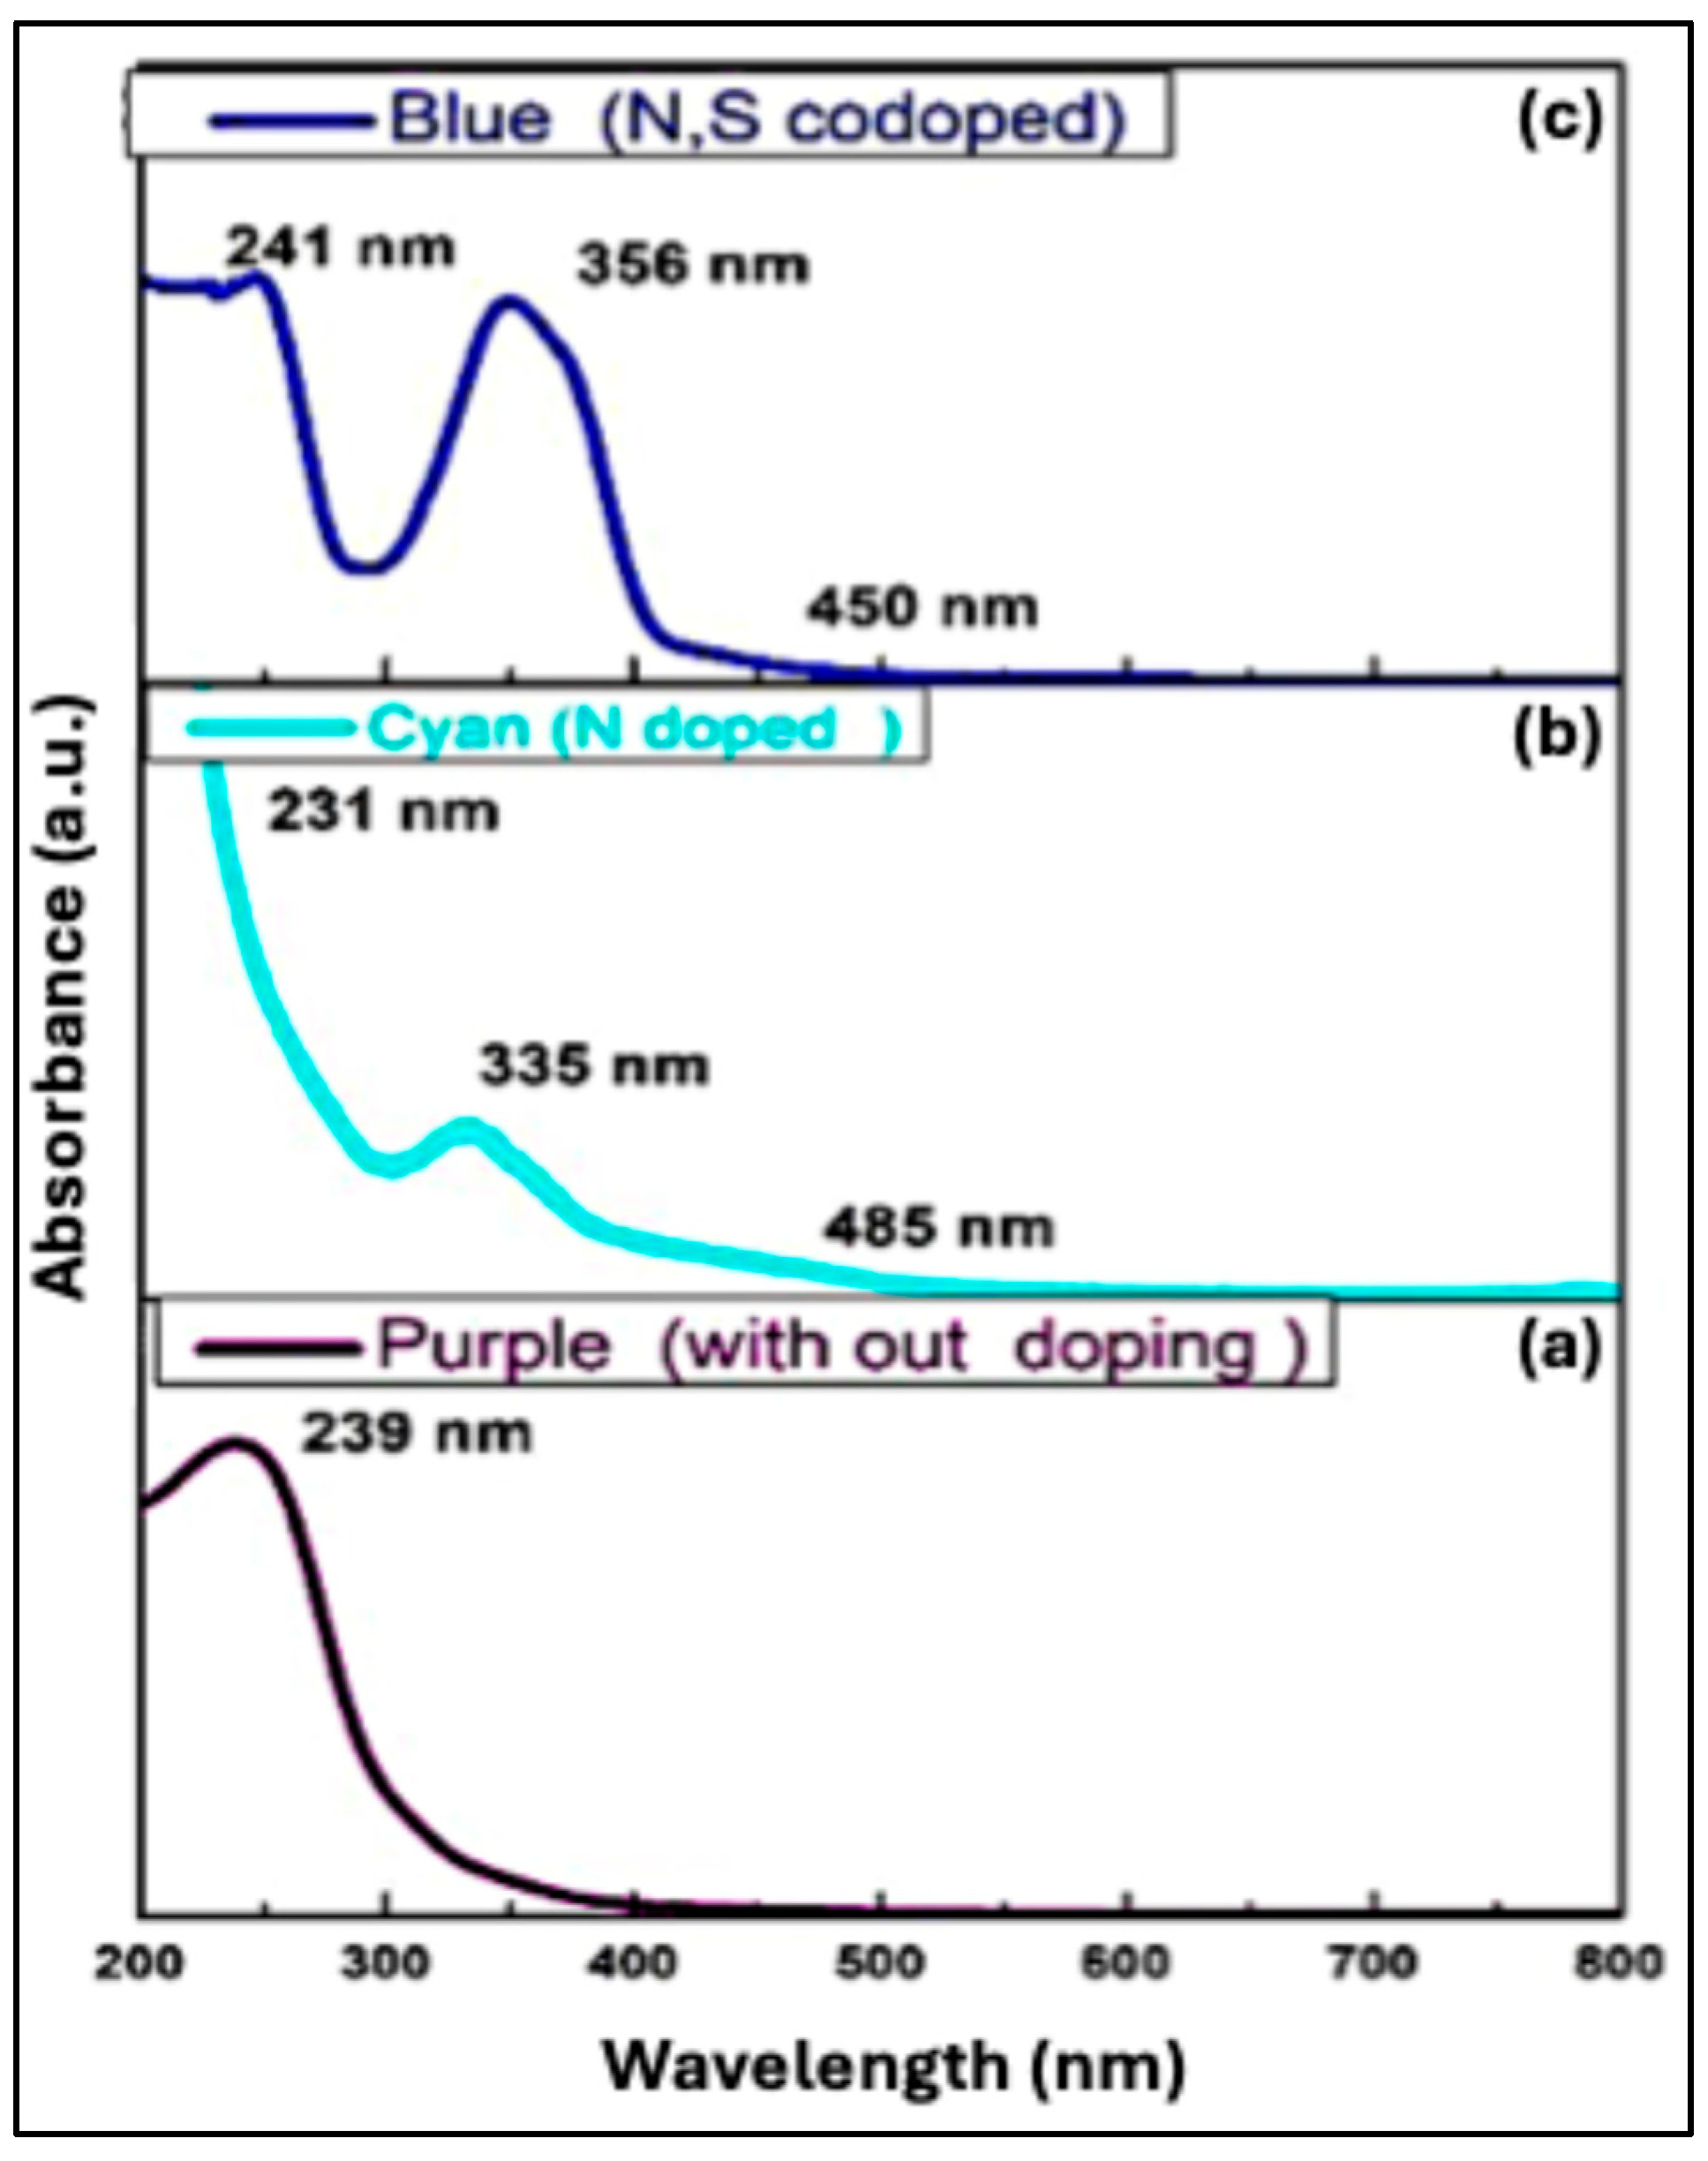
Figure 9.
Photoluminescence spectra of (a) undoped Purple CQDs, (b) N-doped Cyan CQDs, and N, S-doped Blue CQDs. Inset: photographs of CQDs under daylight (left) and UV light (right).
Figure 9.
Photoluminescence spectra of (a) undoped Purple CQDs, (b) N-doped Cyan CQDs, and N, S-doped Blue CQDs. Inset: photographs of CQDs under daylight (left) and UV light (right).
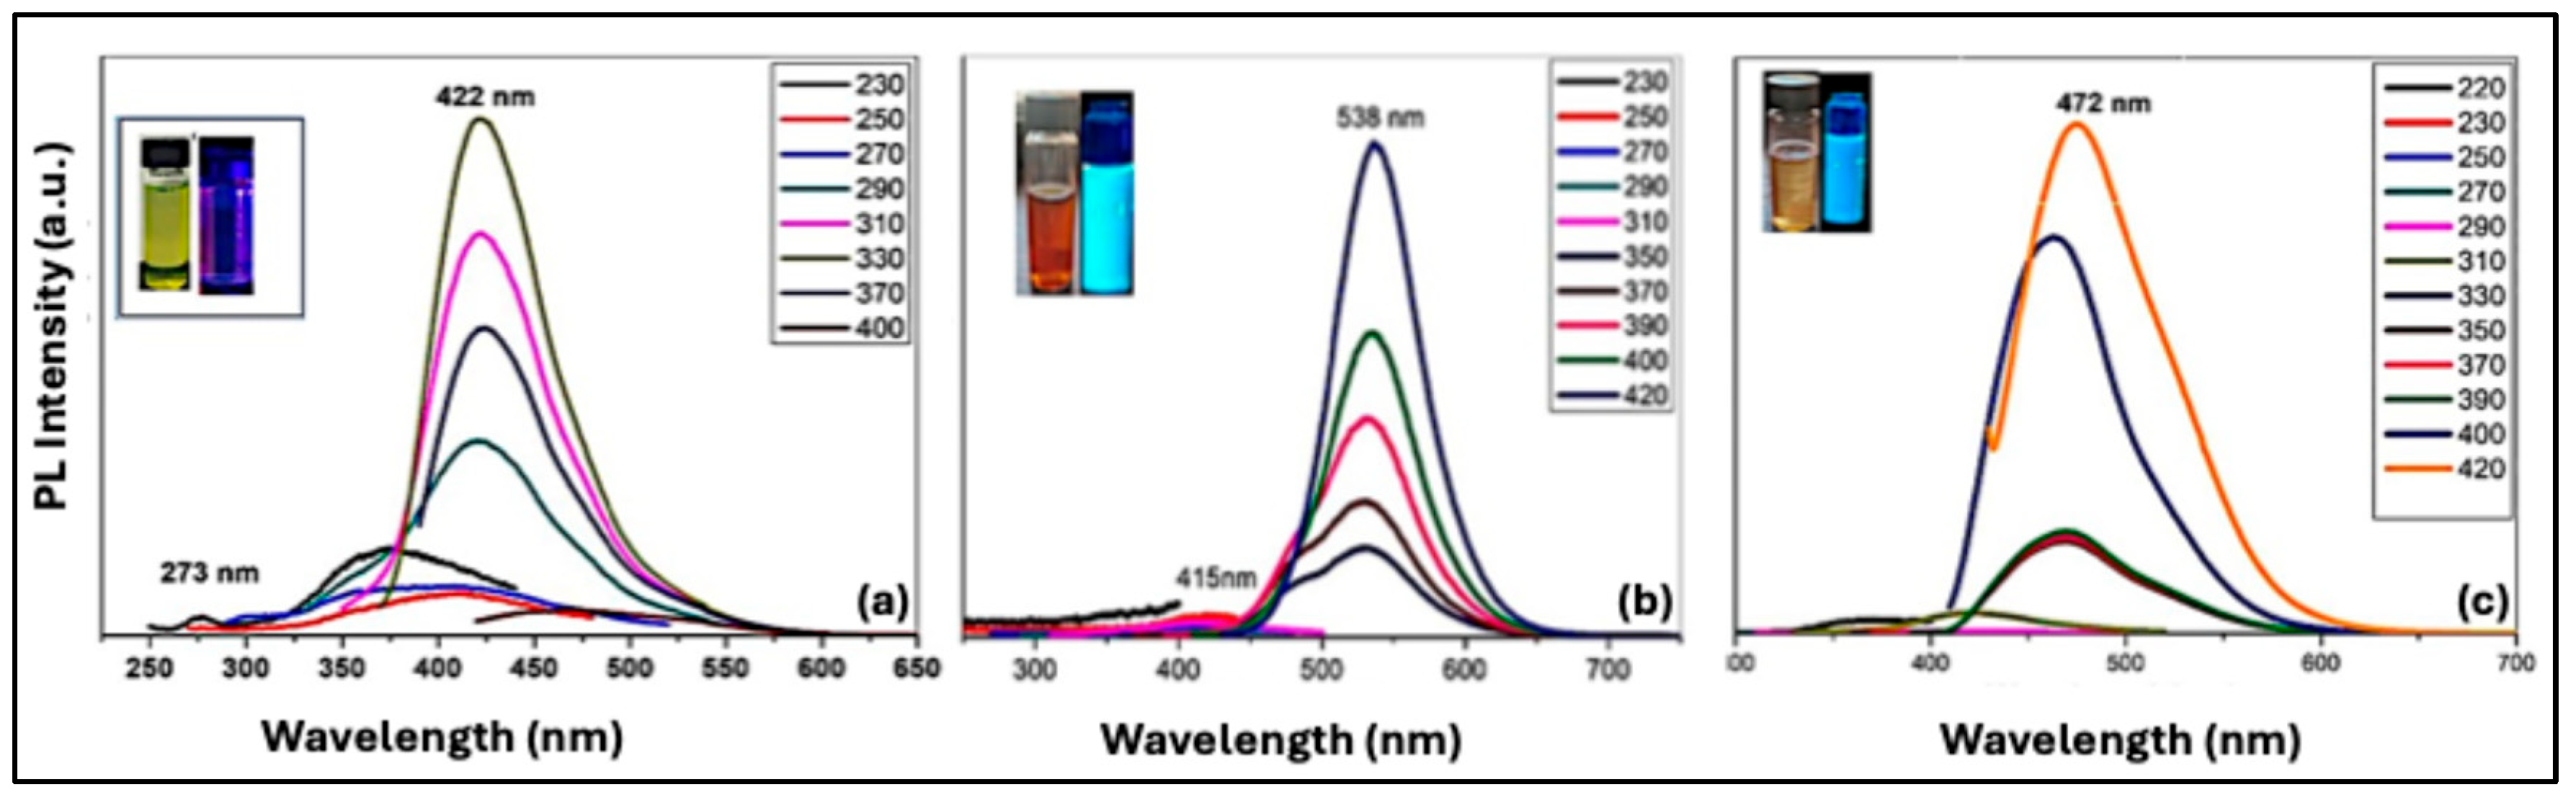
Figure 10.
Color coordinates of CQDs under different excitation wavelengths: (a) undoped Purple CQDs excited at 200 nm; (b) N-doped Cyan CQDs excited at 240 nm; and (c) N, S co-doped Blue CQDs excited at 240 nm.
Figure 10.
Color coordinates of CQDs under different excitation wavelengths: (a) undoped Purple CQDs excited at 200 nm; (b) N-doped Cyan CQDs excited at 240 nm; and (c) N, S co-doped Blue CQDs excited at 240 nm.
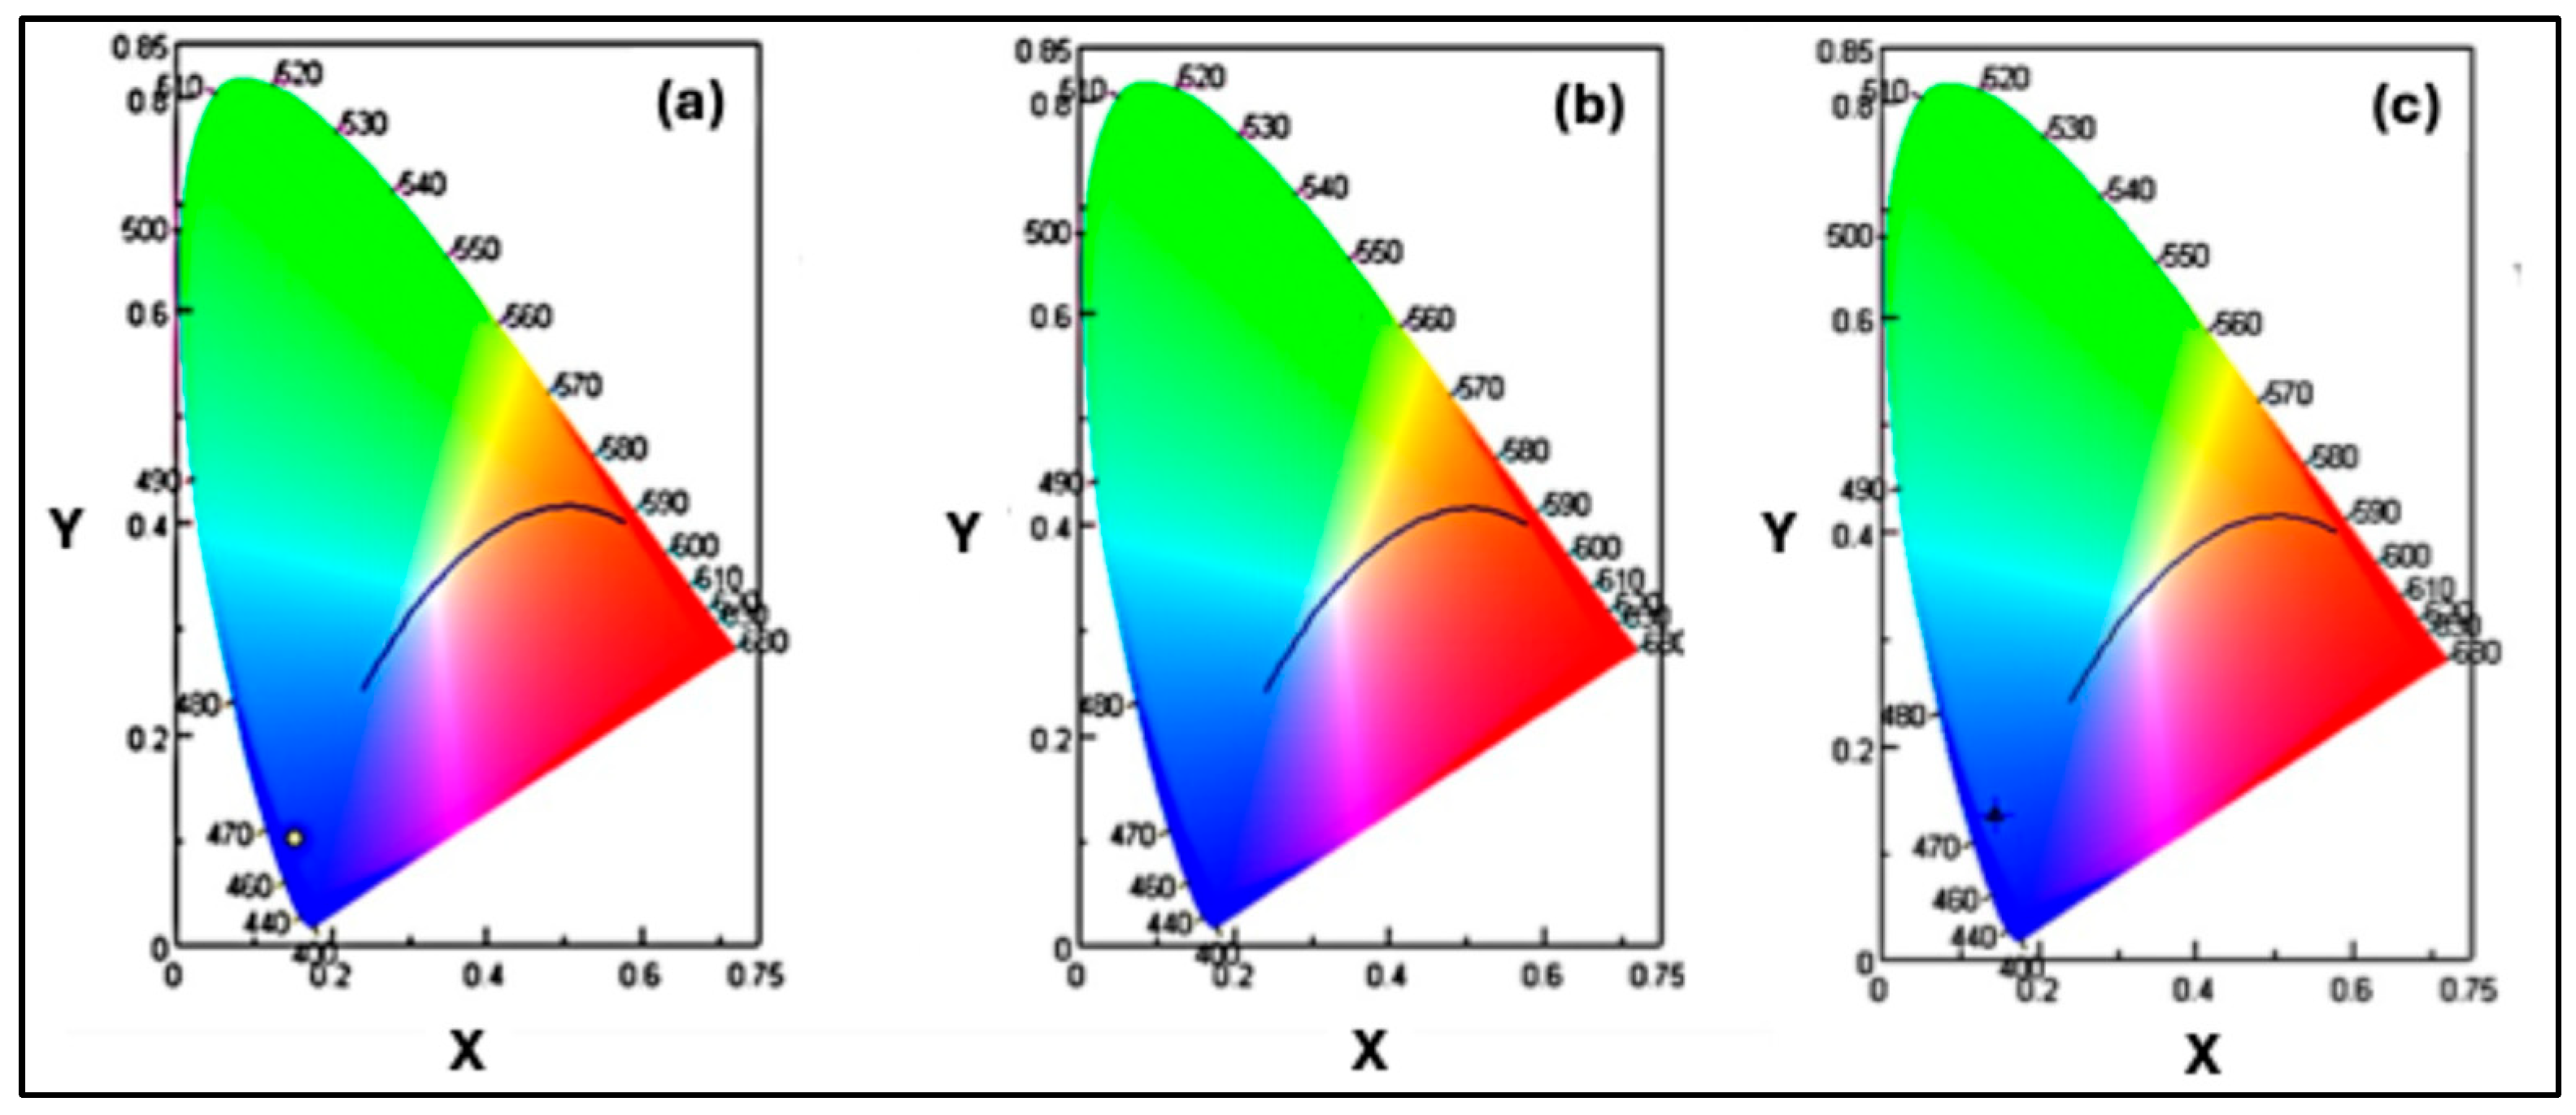
Figure 11.
UV–Vis absorption spectra of CQDs and CQDs samples containing Fe³⁺ ions.
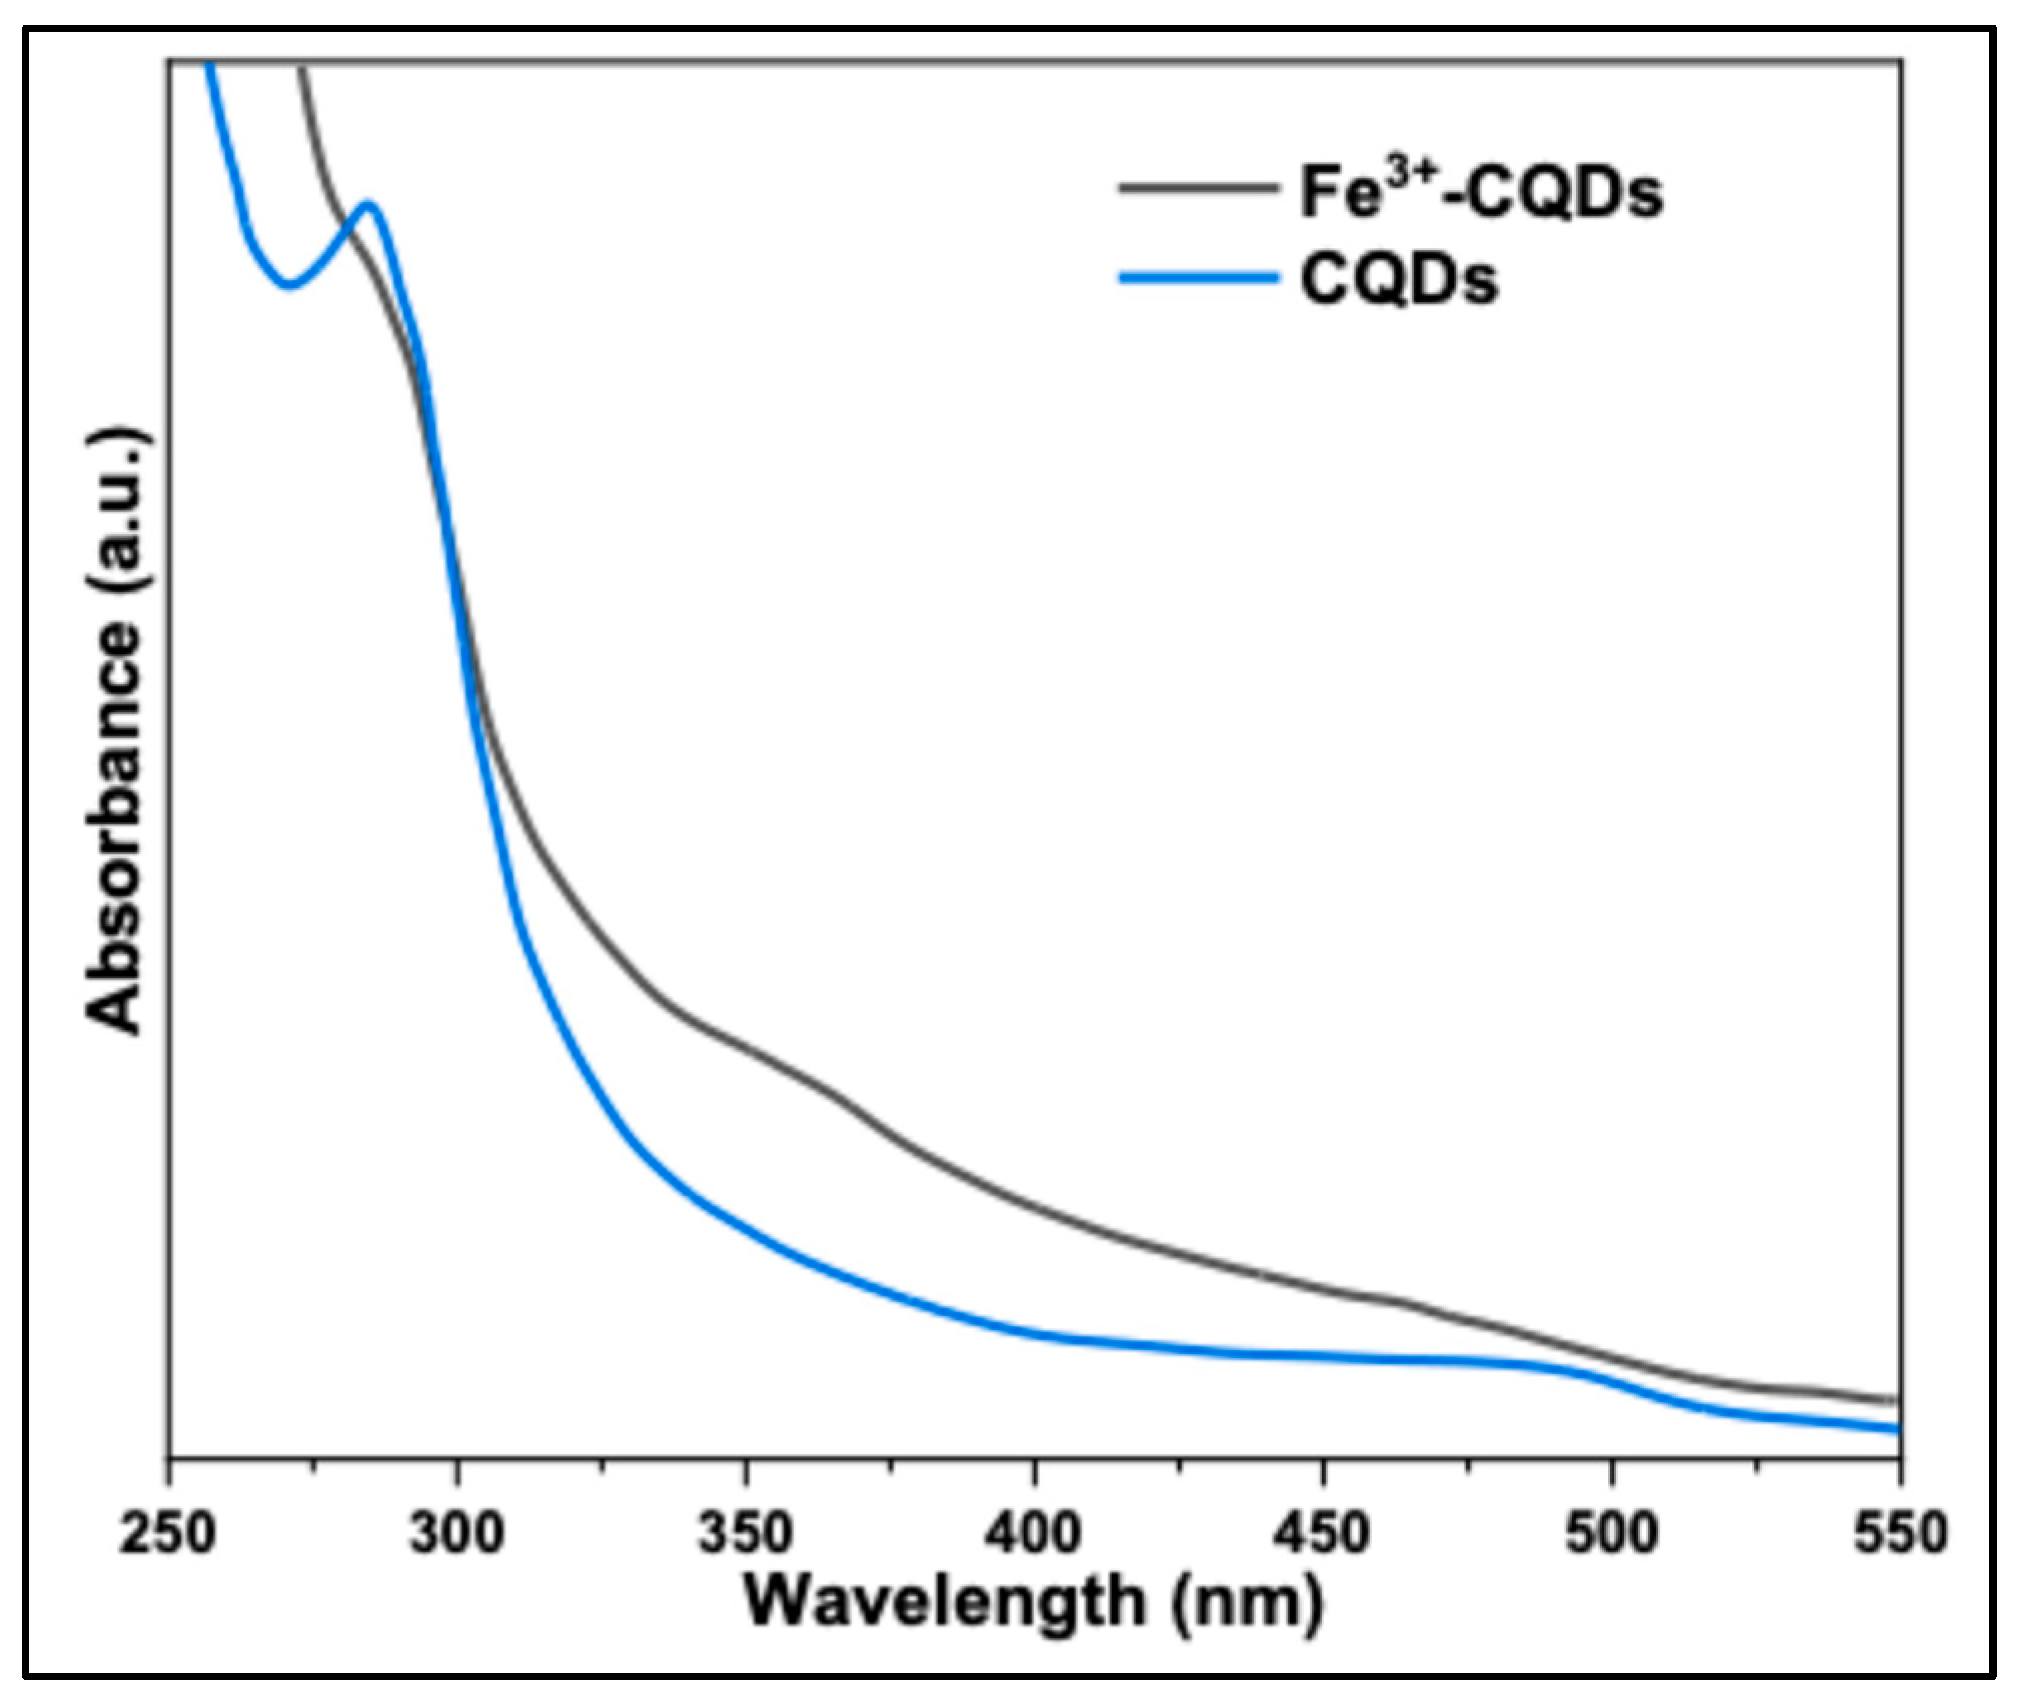
Figure 12.
(a) Effect of pH (1–11) on the fluorescence intensity of CQDs in the presence of 200 μM Fe³⁺ ions, (b) Effect of reaction time on the fluorescence intensity of CQDs in the presence of 200 μM Fe³⁺ ions.
Figure 12.
(a) Effect of pH (1–11) on the fluorescence intensity of CQDs in the presence of 200 μM Fe³⁺ ions, (b) Effect of reaction time on the fluorescence intensity of CQDs in the presence of 200 μM Fe³⁺ ions.
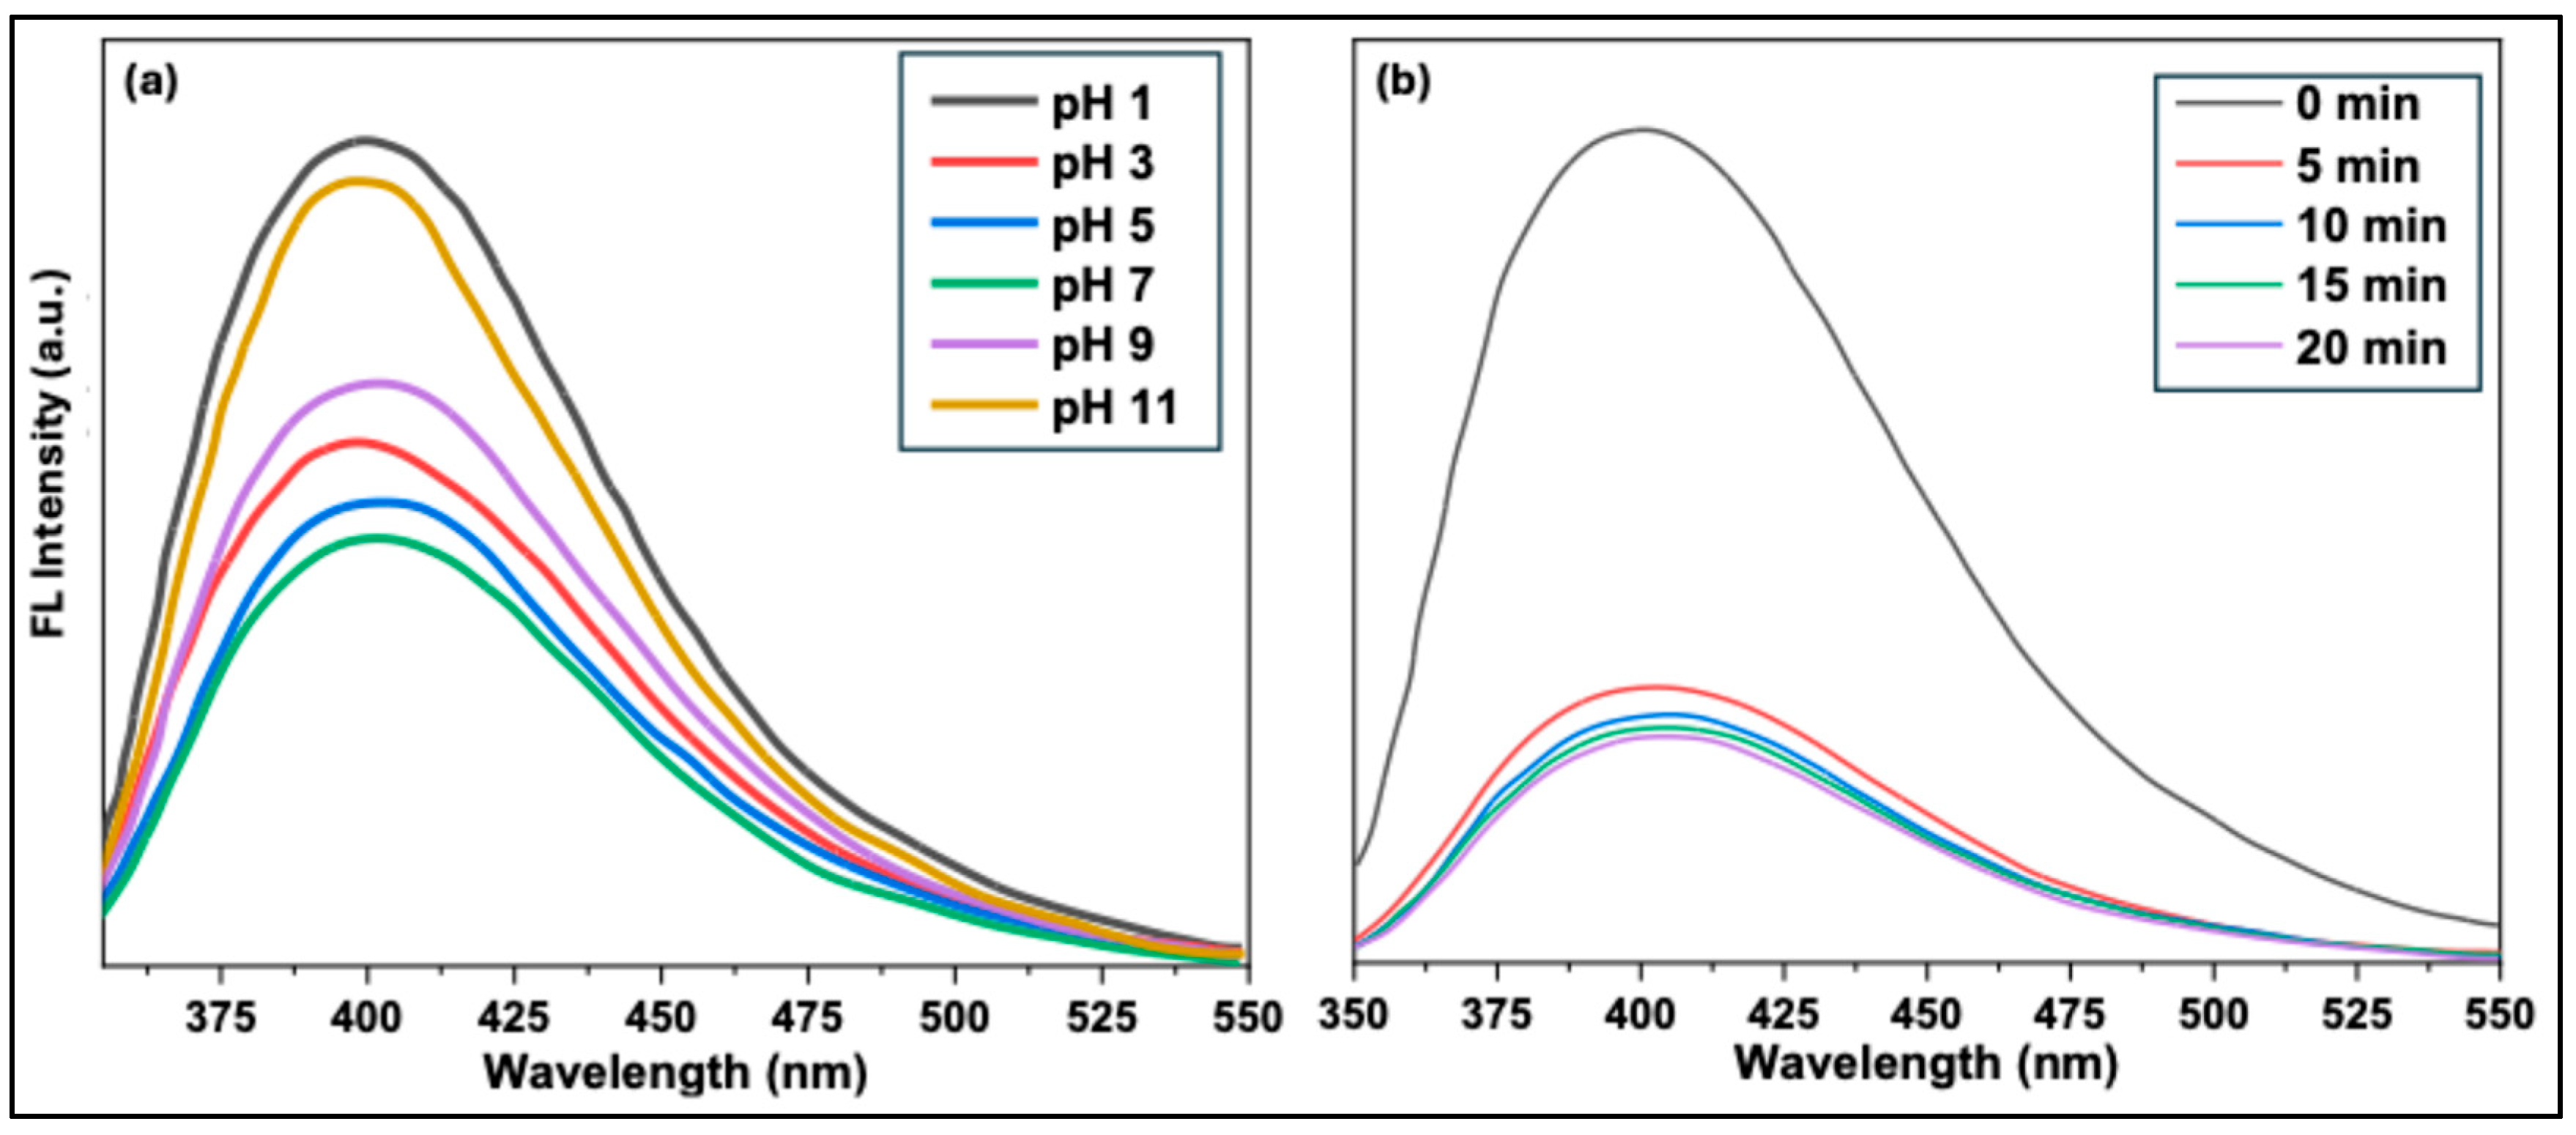
Figure 13.
(a) Fluorescence emission spectra of CQDs in the presence of varying Fe³⁺ ion concentrations (0–200 µM). (b) Linear Stern–Volmer quenching plot as a function of Fe³⁺ ion concentration in the range of 0–200 µM.
Figure 13.
(a) Fluorescence emission spectra of CQDs in the presence of varying Fe³⁺ ion concentrations (0–200 µM). (b) Linear Stern–Volmer quenching plot as a function of Fe³⁺ ion concentration in the range of 0–200 µM.
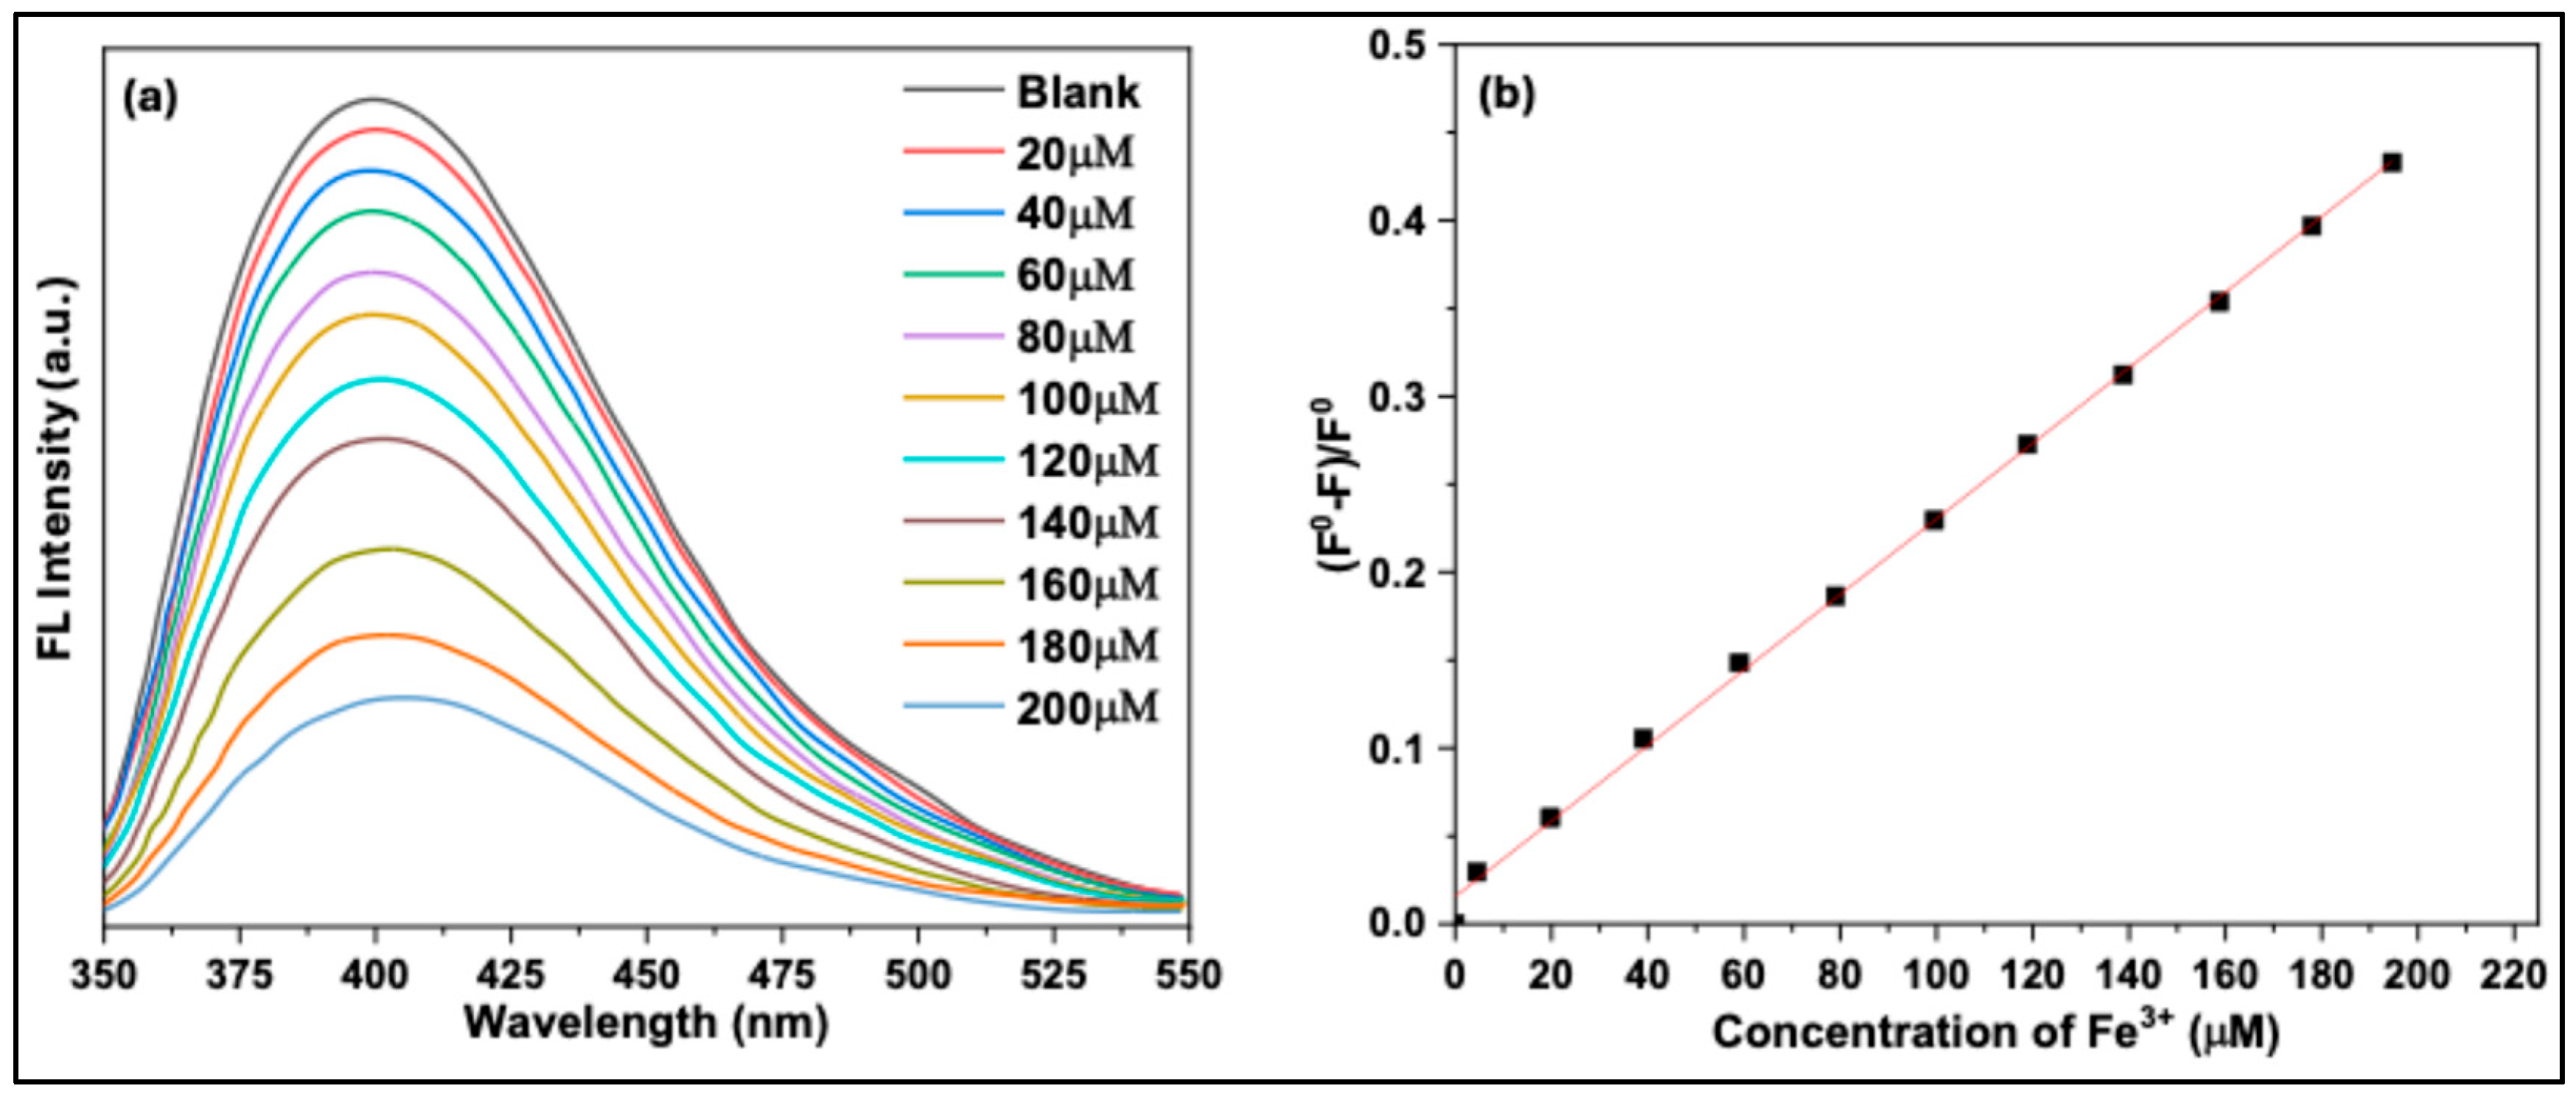

Table 1.
The diffraction angle, inter-planer spacing, and FWHM of un doped and doped CQDs.
| Sample Name | (°) | Spacing d (nm) | FWHM (rad) |
|---|---|---|---|
| Purple CQDS | 22.66 | 0.390 | 0.622 |
| Cyan CQDs | 21.00 | 0.410 | 0.643 |
| 37.80 | 0.237 | 0.100 | |
| 44.00 | 0.215 | 0.101 | |
| Blue CQDs | 24.00 | 0.363 | 0.602 |
| 37.80 | 0.237 | 0.100 | |
| 40.00 | 0.223 | 0.100 | |
| 44.00 | 0.215 | 0.101 | |
| 49.00 | 0.182 | 0.100 |
Table 2.
UV-Vis absorption, photoluminescence spectra, and quantum yield of all CQD samples.
| Sample Name | UV-Vis (nm) | PL (nm) | QY (%) |
|---|---|---|---|
| Purple CQDS | 239 | 237, 422 | 0.03 |
| Cyan CQDs | 231, 335, 485 | 415, 583 | 0.12 |
| Blue CQDs | 241, 356, 450 | 474 | 0.04 |
Disclaimer/Publisher’s Note: The statements, opinions and data contained in all publications are solely those of the individual author(s) and contributor(s) and not of MDPI and/or the editor(s). MDPI and/or the editor(s) disclaim responsibility for any injury to people or property resulting from any ideas, methods, instructions or products referred to in the content. |
© 2025 by the authors. Licensee MDPI, Basel, Switzerland. This article is an open access article distributed under the terms and conditions of the Creative Commons Attribution (CC BY) license (http://creativecommons.org/licenses/by/4.0/).
Copyright: This open access article is published under a Creative Commons CC BY 4.0 license, which permit the free download, distribution, and reuse, provided that the author and preprint are cited in any reuse.


