
Submitted:
16 December 2025
Posted:
17 December 2025
You are already at the latest version
Abstract
Packaging plays a crucial role in product preservation and distribution but also constitutes a major source of environmental burden. In the beverage sector, where unit value is low, secondary and tertiary packaging significantly influence the environmental profile of the final product. This study applies a standardized Life Cycle Assessment (LCA) approach to evaluate the environmental impacts of five packaging configurations for aluminum beverage cans. The analysis compares three current market scenarios with two alternative solutions based on reusable plastic crates (RPCs). The system boundaries include production, distribution, end-of-life, and, where applicable, reverse logistics. A functional unit of one fully packaged 0.33 L aluminum can is adopted. Results reveal that while single-use cardboard solutions achieve favorable performance under certain impact categories, reusable systems outperform them when a sufficient number of reuse cycles is achieved and reverse logistics are efficiently managed. Sensitivity analyses highlight the critical influence of transport distances and reuse frequency on overall impacts, with performance deteriorating for reusable systems beyond 200 km or below 50 reuse cycles. These findings underscore the importance of logistics optimization and reuse planning to maximize environmental benefits. The study contributes to current research by providing a comprehensive comparison of entire packaging systems, addressing a gap in LCA literature, and offering practical guidance for the transition toward circular packaging strategies in line with recent EU regulatory targets.
Keywords:
cans system packaging
; circular economy
; end-of-life
; life cycle assessment
; pallet
; reverse logistic
; reusable plastic crates
; reuse scenario
; secondary packaging
; waste scenarios
1. Introduction
In recent years, packaging sustainability has become a central topic in both scientific and policy debates, as the packaging sector is one of the main contributors to resource consumption and waste generation [1]. In Europe, for example, 39% of the 54.1 million tons of plastics converted in 2022 were used for packaging applications [2], and in 2023 alone, 79.7 million tons of packaging waste were generated in the European Union (EU), corresponding to 177.8 kg per inhabitant [3]. Although packaging plays a crucial role in protecting products, enabling their transport and reducing product losses, the predominance of linear production and consumption models has rendered current practices environmentally unsustainable, highlighting the need for a fundamental rethinking of existing systems [4,5].
EU has long regulated the management of packaging and packaging waste through Directive 94/62/EC [6], which sought to harmonize national measures and promote reuse and recycling in order to limit the environmental impact of packaging [7]. More recently, Regulation (EU) 2025/40 [8] has replaced the Directive, introducing binding reuse targets, restrictions on single-use packaging and stricter recyclability requirements. This regulatory shift establishes a pathway to ensure that all packaging is recyclable or reusable in a technically and economically feasible manner by 2030 [9]. The overarching objective is to shift the packaging system from a linear model (“take-make-use-waste”) to a circular one [10].
To effectively reduce the environmental impacts associated with packaging systems, it is essential to compare different packaging configurations and evaluate the environmental footprint of both conventional and innovative alternatives, selecting the least impactful options. In the absence of such assessments, the packaging sector will remain misaligned with the EU’s objective of achieving a carbon-neutral economy by 2050. Current projections indicate that packaging-related greenhouse gas emissions could rise to 66 million tons of CO₂ equivalent by 2030 and to 93 million tons per year by 2040 [11]. As a result, the success and sustainability of new solutions depend on a clear understanding of the impacts and benefits associated with innovative packaging systems throughout their entire life cycle [12]. In this context, the consolidated and standardized methodological framework for environmental impact evaluation is Life Cycle Assessment (LCA), widely recognized as the most effective approach for assessing ecological performance and as a fundamental decision-support tool for sustainability-oriented strategies [13]. LCA enables the systematic analysis and quantification of potential environmental impacts generated across all stages of the life cycle, from raw-material extraction through production, use and end-of-life management [14].
The scientific literature includes a substantial body of LCA studies on packaging, particularly in the food and beverage sector [12,15,16,17,18], which is among the most impactful industries in terms of packaging material consumption and resulting waste generation [19]. Most LCA studies that investigate or compare the environmental burdens of different packaging solutions focus almost exclusively on primary packaging, often neglecting the other packaging levels [20]. For example, Krauter et al. [21], in their review of packaging systems in the cereal and confectionery sectors, observed that most of the 28 studies examined reported information only for the primary level, rather than considering the packaging system as an integrated whole.
The packaging system comprises primary, secondary and tertiary components, with the latter two ensuring unit aggregation, pallet stability and efficient distribution throughout the supply chain. Specifically, secondary packaging groups multiple units for purchase, while tertiary packaging, also referred to as transport or distribution packaging, is intended for the handling and movement of multiple sales units or grouped packages [22,23]. Together, these levels define the overall packaging system [24].
Therefore, an effective packaging solution can no longer be assessed solely based on its primary packaging. A comprehensive packaging system perspective that includes secondary and tertiary components is required to ensure a robust and meaningful environmental evaluation [21].
Building on these considerations, the present study aims to assess the environmental impacts of beverage can packaging systems using LCA, with a specific focus on the secondary and tertiary packaging levels. In the beverage sector, where the product content often has a relatively low unit value, the packaging system represents one of the main contributors to the overall environmental impact of the final product system [20]. Several studies have already demonstrated that aluminum cans, together with polyethylene terephthalate (PET) bottles, are among the least impactful primary packaging solutions for beverages across multiple environmental impact categories when compared with glass bottles [16,25,26], challenging common consumer perceptions [27]. In particular, De Feo et al. [25] showed that aluminum cans generate lower environmental impacts than 0.33 L PET bottles and exhibit results comparable to those of 0.5 L PET bottles (considering one liter of packaged beverage). Similarly, the study conducted by The Energy and Resources Institute (TERI) [28] found that aluminum cans perform better than PET, glass and carton alternatives across several impact categories, primarily due to their high recyclability, substantial recycled content and lightweight nature.
This raises a central question: which packaging configuration provides the most environmentally sustainable solution for palletizing and distributing beverage cans when assessed from a life cycle perspective? To answer this question, the study compares five packaging system configurations, using one fully packaged can as the functional unit, including three current scenarios and two alternative scenarios. The current scenarios, namely Current Scenario 1 (CS1), Current Scenario 2 (CS2) and Current Scenario 3 (CS3), represent the secondary packaging solutions most commonly adopted within the beverage supply chain. These configurations use widely applied materials such as shrinkable low-density polyethylene (LDPE) film, paperboard boxes, high-density polyethylene (HDPE) pallets and linear low-density polyethylene (LLDPE) stretch film as secondary or tertiary packaging components [21].
In contrast, the alternative scenarios, Alternative Scenario 1 (AS1) and Alternative Scenario 2 (AS2), examine emerging options based on the use of reusable and foldable containers as secondary packaging. These scenarios reflect the growing shift within the packaging sector toward reuse oriented systems [29,30].
In the waste management hierarchy established by Directive 2008/98/EC [31] reuse is positioned as the second most preferred option, immediately after waste prevention, recognizing the capacity of reusable systems to reduce environmental impacts by limiting the demand for virgin materials [32]. In the packaging sector, reuse schemes generally refer to delivery models in which a single package completes multiple trips, rotations or uses for the same purpose for which it was originally designed [33,34].
In this context, an emerging frontier, particularly within beverage supply chains, is the use of Returnable Transport Items (RTIs). RTIs are defined as all means used to assemble goods for transportation, storage, handling and product protection that are returned for further use. Examples include pallets with or without cash deposits, as well as all forms of reusable crates, trays, boxes, roll pallets, barrels, trolleys, pallet collars and lids [23]. Pallets, which account for 61% of the global RTI share, and portable crates, which account for 13%, are the most widely adopted RTIs [35].
In the alternative scenarios considered in this study, two different sizes of reusable plastic crates (RPCs) are used, while pallets are employed across all scenarios.
In general, the reuse of secondary and tertiary packaging, such as crates and pallets, is easier to implement than the reuse of primary packaging in direct contact with food [36], yet it remains an area that is largely underexplored in LCA research according to the authors’ knowledge. As a consequence, the environmental performance of reusable versus single-use packaging alternatives continues to be the subject of active scientific debate, with no definitive consensus emerging from existing studies [37]. One of the main reasons for this lack of agreement lies in the logistical complexity associated with reusable systems [32,38]. By contrast, single-use packaging generally simplifies logistics for manufacturers and retailers, particularly within increasingly extended and fragmented global supply chains [32].
On the basis of this contextual analysis, the study has three aims: (i) to conduct a standardized LCA comparing current single use and alternative reusable secondary and tertiary packaging scenarios for beverage cans, a topic insufficiently explored in existing literature; (ii) to assess the influence on the impact results of distinct logistic configurations, particularly regarding the implementation or absence of reverse logistics loops, on the resulting environmental impacts; and (iii) to determine the conditions under which reusable systems achieve superior environmental performance relative to single use options.
2. Results and Discussion
The environmental impact assessment of the five packaging systems was carried out using the ReCiPe 2016 method. The default hierarchical perspective (H), which reflects the most widely accepted policy assumptions regarding time horizon and related parameters [41], was adopted. A midpoint, or problem-oriented, analysis was first conducted. This approach is associated with relatively low uncertainty, but it produces results across a large number of impact categories, which can complicate interpretation. For this reason, an endpoint, or damage-oriented, analysis is also presented, as it aggregates impacts into three overarching damage categories and thereby facilitates interpretation of the results [14].
A total of 18 midpoint impact categories were considered [39]: Global Warming Potential (GWP); Stratospheric Ozone Depletion (SOD); Ionizing Radiation (IR); Ozone Formation, Human Health (OF-HH); Fine Particulate Matter Formation (FPMF); Ozone Formation Terrestrial Ecosystems (OF-TE); Terrestrial Acidification (TA); Freshwater Eutrophication (FE); Marine Eutrophication (ME); Terrestrial Ecotoxicity (TEcotox); Freshwater Ecotoxicity (FEcotox); Marine Ecotoxicity (MEcotox); Human Carcinogenic Toxicity (HCTox); Human non-Carcinogenic Toxicity (HnCTox); Land Use (LU); Mineral Resource Scarcity (MRS); Fossil Resource Scarcity (FRS); Water Consumption (WC).
The midpoint results were subsequently aggregated into three endpoint categories: Human health (μDALY), Ecosystem health (species 10+⁸yrs) and Resource depletion (USD2013). A sensitivity analysis was also carried out on the most representative midpoint categories, namely GW (g CO₂ eq), FPMF (mg PM₂.₅ eq), TA (mg SO₂ eq), and FRS (g oil eq) [42] to assess how the results vary as a function of two key parameters: transport distance and the number of reuses of the crates.
2.1. Life Cycle Impact Assessment: Midpoint Analysis and Interpretation
Figure 1 illustrates the environmental performance of the packaging scenarios based on the midpoint impact categories. For each category, the impacts are expressed as percentages relative to the scenario with the highest value.
The results indicate that for most of the impact categories considered, the worst-performing scenario is CS2, followed by CS1, as both are single-use systems relying on virgin LDPE for secondary and tertiary packaging to stabilize pallets. From a life cycle assessment perspective, the literature confirms that the production of LDPE films is energy-intensive and based on fossil feedstocks, resulting in significant impacts on fossil resource use, energy consumption, and greenhouse-gas emissions [40,41]. These impacts are exacerbated by the end-of-life profile of shrink film, a typical single-use plastic with low and often impractical recyclability in practice [32]. The environmental burden of CS2 is further amplified by the additional cardboard base, which increases the packaging weight per can and therefore the environmental weight.
Beyond the quantifiable midpoint impacts of standard LCA methodologies, it is critical to acknowledge additional systemic environmental pressures associated with such packaging. Polymers used in polyethylene (PE) films, indeed, due to their long hydrocarbon chain structure, are highly impactful because they are resistant to natural degradation mechanisms [42] and contribute to the growing issue of plastic waste and microplastic formation [43]. While these effects are not captured by conventional LCA impact categories, they represent relevant qualitative considerations regarding the long-term environmental implications of single-use polyethylene packaging.
CS3, which replaces plastic films with cardboard for secondary packaging, shows better environmental performance. Cardboard is widely recognized as one of the most environmentally favorable packaging materials in terms of greenhouse gas emissions and waste generation [44]. Moreover, in modelling the end-of-life phase, higher landfill (11.6%) and thermal treatment rates (33%) were assumed for the plastics used in CS1 and CS2, compared with 5.5% and 6.5%, respectively, for the cardboard waste stream in CS3. Landfilling and incineration are known to generate more significant negative impacts than recycling [26], further penalizing CS1 and CS2 compared to CS3. Despite its overall advantages, CS3, however, performs less favorably for Stratospheric Ozone Depletion (SOD), Marine Eutrophication (ME) and Mineral Resource Scarcity (MRS). These results reflect the characteristics of paper production, which requires sodium hydroxide and produces large quantities of sludge ash requiring disposal [45], and is also associated with nutrient releases into water bodies [46]. Regarding the LU category, which measures the degree of land alteration associated with production processes [47], instead, CS3 exhibits negative values, thanks to the high recycled content of its cardboard (approximately 80%), reducing the demand for virgin raw materials and the number of trees harvested.
The alternative scenarios (AS1 and AS2), which employ reusable polypropylene (PP) crates with 50 cycles of use, show superior environmental profiles. Although reuse systems entails additional resource consumption due to activities such as washing, added weight, more vehicles and a more complex logistics chain [36], their overall environmental benefits surpass those of single-use systems. Between the two, AS2 outperforms AS1 mainly due to the higher number of cans that can be transported per pallet, which leads to a more efficient distribution chain.
The findings of this work align with evidence reported in prior research. One investigation comparing disposable and multi-use containers for the transport of pharmaceutical and biological products showed that adopting reusable packaging can lead to a reduction of roughly 75% in GW impacts [48]. This pronounced advantage stems from the intrinsic inefficiency of single-use systems, which must rely on the manufacture of approximately thirty thousand new containers to meet the required functional performance, whereas the reusable alternative achieves the same service level with fewer than eight hundred units [48].
Other studies, including those focusing primarily on primary packaging, report similar findings. Rasines et al. [49], who compared wooden, cardboard and RPCs for fresh produce transportation through LCA application, found that reusable systems were the most environmentally favourable. Abejón et al. [50] likewise reported that RPCs outperformed cardboard boxes across all impact categories. In line with these evidences, Camps Posino [51] showed that the use of reusable PP packaging for meal delivery reduces the carbon footprint by 63% compared to single use alternatives. Nevertheless, several authors emphasize that the environmental performance of reusable systems depends strongly on factors such as annual reuse frequency, service life, maximum number of reuse cycles, stock levels, washing rates and logistic geography, all of which shape the overall environmental profile of reusable packaging [52,53]. This issue is addressed in the Sensitivity Analysis section, where variations in key parameters, specifically transport distances and the number of reuse cycles, are shown to significantly influence the relative performance of the alternative scenarios.
In general, although RPCs emerge as the most favorable option, the broader landscape remains complex and no universally optimal solution exists [54]. For instance, Koskela et al. [46] reported results that deviate from the prevailing evidence. In their comparison of highly reusable HDPE crates, with more than seven hundred cycles, and recyclable corrugated cardboard boxes for bread transport, the single use cardboard scenario outperformed the reusable one, underscoring the decisive influence of transport related burdens on the sustainability of packaging systems.
The results presented thus far refer to the logistics configuration that includes a dedicated reverse logistics process for the collection of PP crates (Figure 8b). When the crates are instead retrieved simultaneously during the delivery of new loads (Figure 8c), thereby eliminating the need for a dedicated return trip, the results differ substantially. This comparison applies exclusively to the alternative scenarios AS1 and AS2, as they are the only configurations that incorporate a reusable logistics cycle; the single use scenarios remain unaffected. As expected, the configuration without dedicated reverse logistics, in which crates are collected along standard distribution routes, proves to be environmentally more favorable because it avoids the impacts associated with additional transport operations. Table 1 reports, for AS1 and AS2, the additional environmental impact (Δ) of the dedicated reverse logistics configuration compared to the simultaneous retrieval configuration. The positive values across all impact categories highlight the superior environmental performance of the system that avoids dedicated return trips.
The quantitative results of this study indicate that environmental impacts can be reduced by more than 10% when the logistics system does not require dedicated return trips. This finding is consistent with Issifu and Sumaila [55], who reported similar benefits for reusable primary packaging, confirming that reusable systems, particularly when supported by efficient return logistics, can substantially outperform single use alternatives.
2.2. Impacts Throughout the Life Cycle
To identify which life cycle stage, namely production, distribution, end-of-life or reverse logistics, contributes most to the overall environmental impact the analysis was carried out at a greater level of detail adopting the following impact categories: GW; FPMF; TA and FRS (Figure 2). This selection followed established simplification strategies aimed at enhancing the interpretability and communication of results without affecting the core analytical outcomes, the identification of environmental hotspots and comparative life-cycle rankings [56]. The categories were chosen based on their environmental relevance and scientific robustness and for their direct alignment with key United Nations Sustainable Development Goals (SDGs). This ensures the assessment captures dominant burdens related to energy, emissions, and resource use, while linking environmental performance to broader sustainability priorities such as climate action (SDG 13), human health (SDG 3), ecosystem protection (SDG 15) [57].
For the GW category, the packaging production stage is the dominant contributor in all conventional scenarios (CS1, CS2 and CS3), accounting for 66.1%, 67.1% and 69.9% of total impacts, respectively. This stage is highly energy-intensive and includes processes such as raw material extraction, manufacturing and energy use. In particular, the production of petroleum-derived plastic granules for LDPE films is especially impactful, as it contributes to GW through emissions associated with crude oil extraction and natural gas processing [44]. Conversely, the distribution stage represents the least impactful phase, contributing only 5.5% in CS1, 5.2% in CS2 and 6.0% in CS3. In the alternative scenarios (AS1 and AS2), the distribution and reverse-logistics activities required for the retrieval of reusable crates become the most significant contributors, accounting for 43.8% in AS1 and 47.4% in AS2. Although the production of PP crates is intrinsically more impactful than the manufacture of cardboard boxes, as noted in [46], their repeated use significantly mitigates the cumulative GW impact over the life cycle. The reverse-logistics stage also includes crate washing, which previous studies identify as a non-negligible source of environmental burden [58], although in this study washing applies to only 25% of returned crates. Across all scenarios, the end-of-life stage contributes to GW impacts. In CS3, despite the use of cardboard, end-of-life still generates relevant emissions due to the single-use nature of the system, since recycling processes require additional energy and resources [59], contributing 24% to the overall GW impact.
Similarly, for the FPMF, TE and FRS categories, the production phase remains the main source of impact in the conventional scenarios, whereas distribution and reverse-logistics activities become more relevant in the alternative scenarios. With regard to the end-of-life stage, for FPMF, TE and FRS, this phase generates environmental benefits in all scenarios due to energy recovery and recycling processes (55.4% for plastic materials and 85.1% for cardboard), which contribute to material and energy savings. For the FRS category, recycling leads to a direct reduction in fossil resource consumption, quantified as -19.8% for CS1, -15.6% for CS2, -23.0% for CS3, -14.3% for AS1 and -12.8% for AS2. In CS1, CS2 and CS3, these environmental savings are more pronounced due to the larger quantities of material being recycled. The CS3 scenario shows higher performance because the use of cardboard reduces the reliance on plastics within the packaging system and consequently mitigates the impacts associated with fossil-based materials [45].
2.3. Impact Assessment: Endpoint Analysis and Interpretation
Figure 3 presents a comparative overview of the scenarios under investigation, evaluated across the three endpoint impact categories: Human Health, Ecosystems and Resources.
The CS2 configuration is confirmed as the worst-performing scenario from an endpoint perspective. In the Human Health and Ecosystems categories, AS2 achieves the best performance due to the higher number of cans transported per logistics cycle. In the Ecosystems category, CS3, although a single-use system, performs better than the alternative AS1, owing to the use of lighter cardboard packaging compared with plastic containers and to the greater number of cans that can be transported per pallet, but above all because the cardboard system generates a credit in the midpoint LU category. According to the ReCiPe 2016 impact pathway, LU contributes exclusively to the endpoint Ecosystems damage; therefore, avoided land occupation associated with recycled or lightweight cardboard results directly in a lower biodiversity loss at the endpoint level [39]. With regard to the Resource Depletion category, CS3 is identified as the best-performing scenario, surpassing both alternative configurations. This outcome is primarily attributed to the characteristics of cardboard, whose production and end-of-life management are associated with lower environmental burdens. Unlike plastics, which are derived from fossil feedstocks, cardboard originates from renewable natural sources. As a result, the extraction and production of plastic raw materials entail significantly higher environmental impacts. Moreover, cardboard exhibits a very high recycling rate (approximately 85%), which further reduces reliance on virgin raw materials and lowers overall environmental impacts [60].
2.4. Sensitivity Analysis: Variation of Transport Distance and Number of Crate Reuses
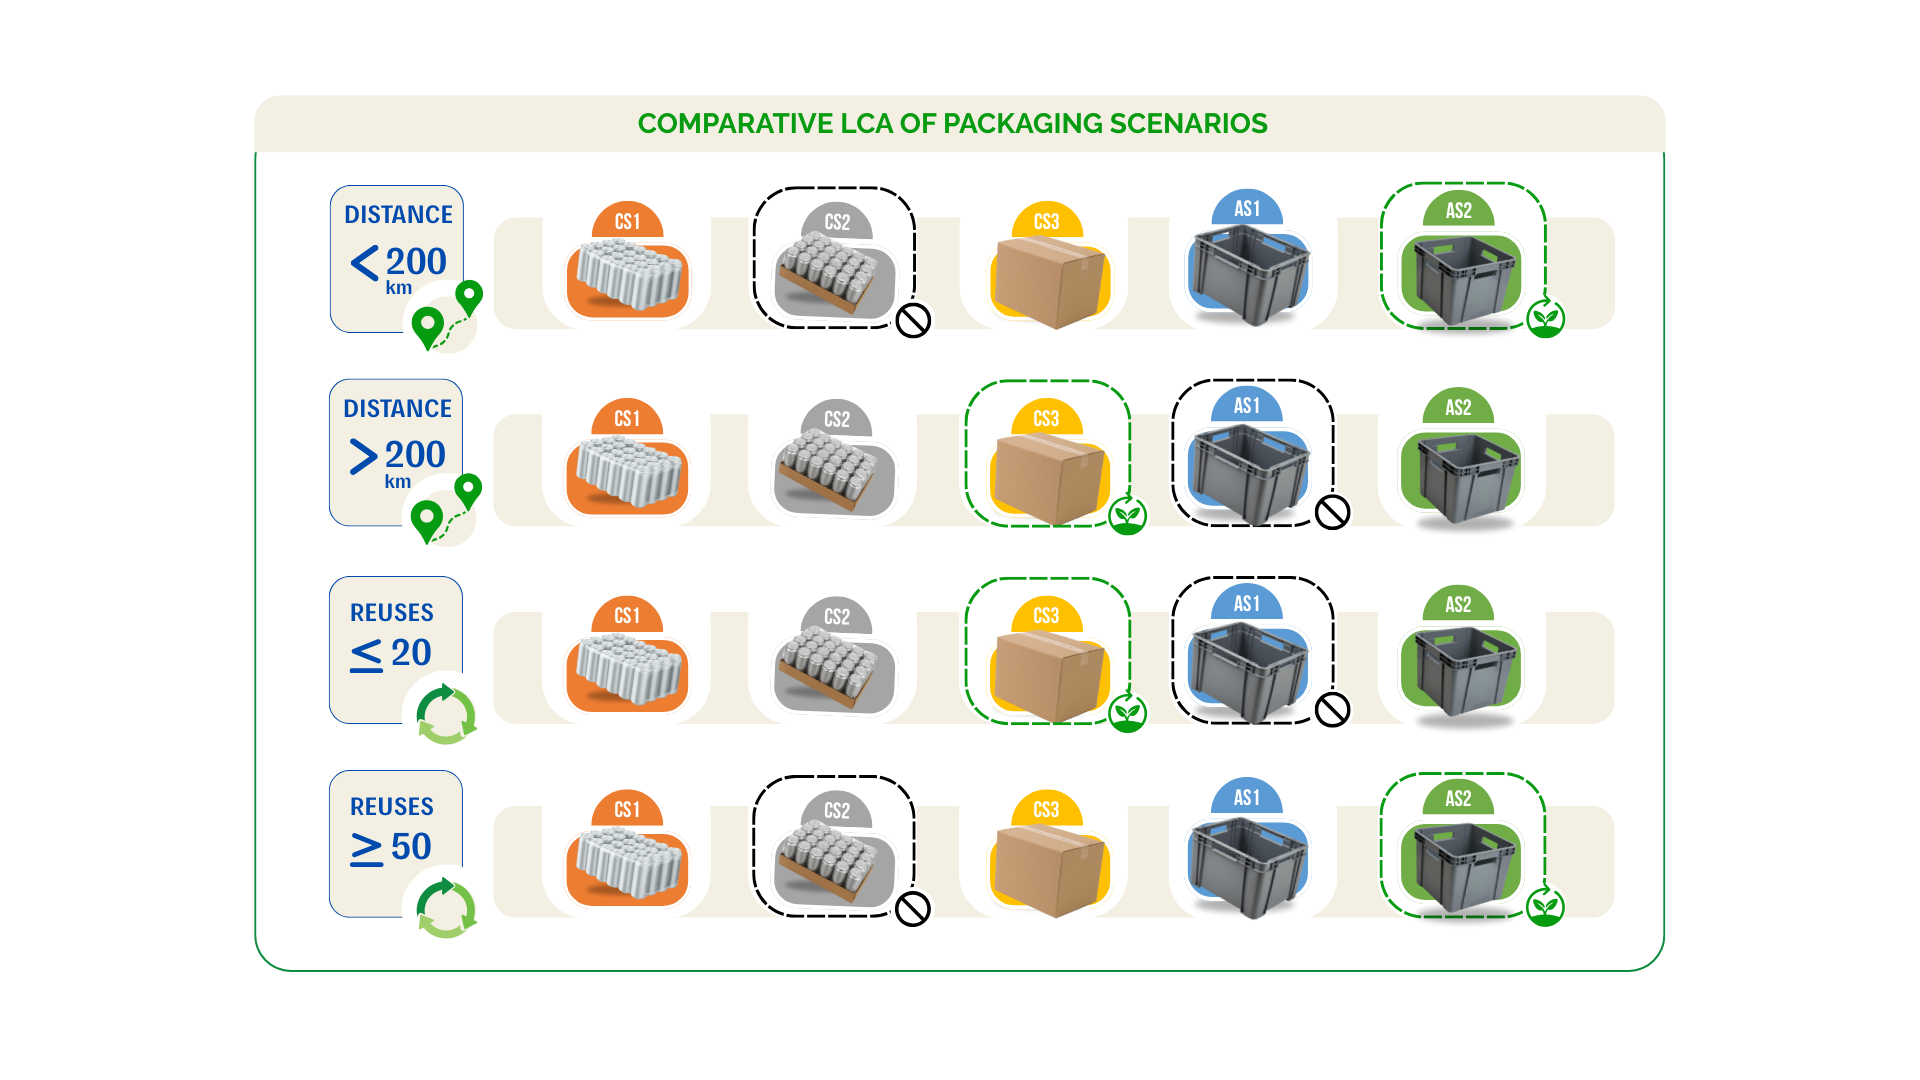
Sensitivity analysis is a widely adopted procedure in LCA studies, in which input data or model parameters are systematically varied to evaluate their influence on the output results [61]. This analysis is a critical tool for assessing the robustness and reliability of study findings [26]. In the present work, following the approach suggested by Espinoza-Orias and Lundquist [30], two key parameters were selected for sensitivity assessment: (i) the transport distance between the packaging plant and distribution centers and (ii) the number of crate reuses. As reported in Table 2, minimum and maximum variations were applied to these parameters relative to the baseline scenario.
A preliminary analysis examined the transport distance parameter. Assuming a fixed number of fifty crate reuses for the alternative scenarios AS1 and AS2 and varying only the transport distances relative to the baseline case, the results were calculated for the following impact categories: GW (a), FPMF (b), TA (c) and FRS (d). The corresponding outcomes are shown in Figure 4.
For all scenarios, an approximately linear relationship between total GW CO₂ emissions and transport distance was observed. Shorter transport distances are associated with lower emissions due to reduced fuel consumption, whereas increasing the distance to 500 km results in a substantial rise in CO₂ emissions. AS1 and AS2 exhibit a more pronounced increase in emissions than the current scenarios: the steeper slope connecting the baseline and maximum variation values highlights the greater influence of logistics on the emission profile of these configurations. This effect is also explained by the higher mass of the reusable packaging systems, which leads to a greater weight per can during transport. Since the weight of the reusable packaging is not distributed across the number of reuses in the transport phase, each trip bears the full weight load. Consequently, changes in transport distance have a proportionally larger effect on the total emissions of the alternative scenarios than on the conventional ones. Beyond 200 km, AS1 already shows a higher environmental impact than CS3, attributable to weight allocation per can and to the characteristics of the cardboard used in CS3.
These results align with the observations of Del Borghi et al. [62], who reported that GWP increases proportionally with transport distance. According to their study, the environmental advantage of reusable systems depends strongly on careful planning of collection and return routes. When distances are not minimized, the benefits gained from eliminating the need for new disposable crates are substantially diminished.
Similar trends were observed for the FPMF and TA impact categories. Under short-distance conditions, AS1 and AS2 outperform the current scenarios due to the substantial reduction in logistics-related emissions. Conversely, under the maximum variation conditions, the strong dependence on logistics results in significantly worse outcomes for the alternative scenarios, leading to lower environmental efficiency than the conventional configurations. With regard to FRS, which reflects the difficulty of extracting fossil resources relative to current consumption [63], the increase in fuel demand under the maximum-distance scenario leads to markedly higher environmental impacts for all cases. Once again, for transport distances exceeding 200 km, AS1 and AS2 exhibit worse environmental performance than CS3. These findings are consistent with the observations of Levi et al. [64], who reported that as transport distance increases, the cardboard-based configuration becomes the most environmentally advantageous option across all impact categories.
The sensitivity analysis was then extended to assess the influence of the number of crate reuses in the alternative scenarios AS1 and AS2, while keeping the transport distance between the packaging plant and distribution centers constant at 200 km. As shown in Table 2, the number of reuses ranges from 20 to 200: twenty reuses represent the minimum threshold at which tangible environmental benefits begin to emerge, whereas two hundred reuses correspond to an asymptotic value beyond which further reductions in impacts become negligible [64]. The impact categories considered, GW, FPMF, TA and FRS, were evaluated by expressing the results as percentage values relative to the worst-performing scenario (AS2) (Figure 5).
When 200 reuses are considered, both AS1 and AS2 become the most environmentally efficient configurations across all impact categories. Under the 20-reuse condition, by contrast, AS1 becomes the least sustainable option in every category examined. This result is directly linked to the distribution of the PP crate weight and, consequently, to the emissions associated with their production processes. Because the weight of the reusable crates is allocated across a variable number of cycles, the resulting unitary environmental burdens differ substantially. For example, in the 20-reuse condition, the weight of the container per can increases by 150% in AS1 and by 149.8% in AS2, thereby generating considerably higher impacts. As the number of reuse cycles increases, environmental performance improves because the production phase is amortized over a greater number of uses.
Previous studies further emphasize the importance of reuse frequency. Accorsi et al. [65] reported that RPCs become environmentally favorable compared with single-use alternatives, for example in terms of GW, after approximately fifteen rotations. Del Borghi et al. [60] considered fifty reuses, a value adopted as the baseline scenario in the present work, whereas López-Gálvez et al. [56] identified one hundred fifty reuses as the minimum number of cycles required to achieve optimal performance in reuse systems. The dependence of environmental performance on the number of rotations is therefore a critical factor in determining the optimal solution.
Another important consideration is the presence of an asymptotic threshold, beyond which additional increases in reuse frequency no longer yield perceptible or significant reductions in total system emissions [64]. This plateau effect has also been documented for primary-packaging systems by Simon et al. [64] and Accorsi et al. [53], who showed that refilling cycles beyond a certain limit do not provide meaningful environmental benefits. This behavior is attributed to the fact that an infinite number of reuses is physically unattainable: the intrinsic properties of containers and their constituent materials impose mechanical and structural constraints. Wear, mechanical stress and material degradation set a practical upper limit to reuse, which depends on both material characteristics and operational conditions. In addition to these inherent material limitations, unavoidable losses further restrict the effective number of reuse cycles. Such losses include deliberate retirement, where packaging is withdrawn from service, typically following quality inspection before reconditioning or refilling, and accidental losses during distribution, where packaging is misplaced or discarded at various points in the cycle for reasons outside the control of system operators, regardless of its physical condition [32]. These phenomena limit the achievable number of reuses, complicate system logistics and, consequently, reduce the potential environmental benefits of reuse strategies.
The sensitivity analysis therefore shows that, when the two variables are considered jointly, the findings are consistent with those of Rasines et al. [49]: the larger the RPC logistics network, the greater the number of rotations required for reusable crates to achieve lower impacts than single-use alternatives.
3. Materials and Methods
The methodological framework of this research follows the ISO 14040 and ISO 14044 standards for LCA [66,67]. A distinctive feature of LCA is its focus on products from a life-cycle perspective [68]. In the present context, where current and alternative scenarios are compared, a consequential approach is adopted. The first three phases of LCA, namely (i) goal and scope definition, (ii) life cycle inventory, and (iii) life cycle impact assessment, are described in the following subsections, together with a detailed presentation of the different packaging systems and logistics configurations. The final phase, the interpretation and discussion of results, has already been addressed in the previous section.
3.1. Goal and Scope Definition
As a first step, the goal of the study was defined as comparing, through an LCA approach from raw material extraction to end-of-life, different alternatives for secondary and tertiary packaging of beverage cans and assessing the potential of RPCs as an alternative solution. In line with Espinoza-Orias and Lundquist [30], the analysis aimed to determine, under varying conditions, the extent to which each scenario performs better or worse than the others. The overarching scope was therefore to identify, under sensitivity assumptions, the environmentally “lightest” alternative [68]. The system boundaries, which specify what is included and excluded in the modelling, are shown in Figure 6.
The assessment encompasses the following life cycle stages: (i) extraction and production of raw materials required for manufacturing all secondary and tertiary packaging components, including LDPE film, cardboard, LLDPE film, HDPE pallets, PP crates and other packaging elements; (ii) transport of materials to the packaging plant; (iii) packaging operations and palletization of beverage cans; (iv) distribution of packaged products, including transport from the packaging plant to distribution centers, from distribution centers to retailers and, where applicable, the reverse logistics flow of reusable packaging; (v) washing operations in the alternative scenarios; (vi) end-of-life management of packaging components, including transport to treatment facilities and final processing through recycling, landfilling or energy recovery.
The following phases are excluded from the system boundaries: (i) internal logistics within distribution centers and retail stores; (ii) production, use, end-of-life management and full life cycle profile of primary packaging, as it is common to all scenarios and does not influence their comparative assessment; (iii) logistics of the end-of-life chain.
With respect to the functional unit (FU), which defines the reference flow used to normalize all inputs and outputs [67] and constitutes the basis for comparing the investigated alternatives [69], most studies in the beverage sector adopt a unit quantity of transported liquid as the FU [70,71,72,73]. However, these contributions focus primarily on primary packaging alternatives and therefore do not capture the environmental implications associated with secondary and tertiary packaging stages.
To ensure a coherent and comparable assessment across the scenarios analyzed in the present study, the chosen FU is one 0.33 L aluminum beverage can. The standard dimensions of a commercially available 0.33 L can are approximately 14.6 cm in height and 5.8 cm in body diameter [74]. This FU ensures that all inflows and outflows are standardized to a single unit of product and allows a direct comparison of the relative logistics efficiencies of the alternative packaging systems. Accordingly, all inventory data and results reported in this study are normalized per single can.
Environmental impacts were assessed using the ReCiPe 2016 Midpoint and Endpoint (H) v1.07 / World (2010) H method and the SimaPro 9.0.0.2 software, which provides comprehensive foreground and background datasets [14]. When a material or process is selected in SimaPro, the software automatically incorporates all upstream processes, such as raw material extraction, refining and intermediate manufacturing, according to the structure of the selected dataset. Primary data were partly obtained from industrial partners, whereas secondary data were retrieved from the software’s background databases. The Ecoinvent v3 database was used as the main source of background information, including data on the Italian electricity mix, raw material production, fuel generation, infrastructure requirements and transport fleets, as the study is geographically confined to the Italian territory.
Impact allocation and inventory calculations were carried out following the cut-off by classification system model. As a result, the environmental burdens associated with the recycling of materials at end-of-life are excluded from the present system boundaries, because these impacts are assigned to the subsequent product system that uses the recovered materials [75]. This implies that all environmental burdens related to separate collection, sorting, washing, drying and regranulation of waste materials are allocated exclusively to the recycling scenario, while the corresponding credit for the amount of primary material not produced is deducted from this balance [43].
3.2. Scenarios Description
Current Scenario 1 (CS1), Current Scenario 2 (CS2) and Current Scenario 3 (CS3) correspond to the packaging configurations currently adopted in the market, whereas Alternative Scenario 1 (AS1) and Alternative Scenario 2 (AS2) represent solutions that are either not yet implemented or only partially applied within the beverage sector. The scenarios differ in the materials used for secondary packaging, which in turn influence the pallet-level arrangement and the overall load configuration.
For the modelling phase, Euro pallets made of HDPE (dimensions 1200 × 800 × 150 mm) [76] were adopted as the reference tertiary packaging. The pallet height varies according to the packaged material, since the pallet configuration is determined by the type of secondary packaging employed [65,73]. A detailed description of each scenario is provided below, while a graphical overview, grouped by secondary and tertiary packaging levels, is presented in Figure 7.
CS1 uses an LDPE shrink film as secondary packaging, wrapping 24 cans to provide compactness and stability. The packed cans are arranged on Euro pallets, with a single-wall corrugated cardboard interlayer placed between each level. This configuration accommodates seven layers of cans, requiring eight interlayers per pallet. To stabilize the multi-level load, an LLDPE stretch film is applied. Each layer contains eight packs, resulting in a total of 1,344 cans per pallet.
CS2 employs a cardboard tray (35 × 25 × 8 cm) as secondary packaging, containing 24 cans wrapped in an LDPE shrink film. Pallets are organized with single-wall corrugated cardboard interlayers between each layer. This arrangement also accommodates seven layers of cans per pallet, with eight interlayers in total, and stabilization is ensured using LLDPE stretch film. As in CS1, each layer contains eight packs, yielding 1,344 cans per pallet.
CS3 uses a cardboard box (30 × 40 × 30 cm) as secondary packaging, capable of holding two layers of cans for a total of 48 cans per box. The boxed cans are palletized without interlayers, since the boxes regularize the load and provide intrinsic stability. Cardboard corner protectors are applied for additional edge protection, and LLDPE stretch film is used to stabilize the multi-layer load. Each pallet accommodates five layers of eight boxes, resulting in 1,920 cans per pallet.
In all current scenarios, plastic is used as tertiary packaging, and in CS1 and CS2 it also serves as secondary packaging. Due to its low weight and low cost [77], plastic remains the most commonly adopted solution in conventional systems.
AS1 considers RPCs made of PP with base dimensions of 60 × 40 × 32 cm, manufactured through injection molding [54]. These crates are characterized by stackability, foldability, which allows volume reduction when collapsed, and reusability, similarly to those used by Accorsi et al. [65] in their modelling. Given the internal height of each crate, cans were arranged in two layers, accommodating a total of 60 cans per RPC. The crates are equipped with an interlocking system which, combined with the downward force of the stacked load, provides sufficient stability to eliminate the need for LLDPE stretch film. On the pallet, the crates were arranged in six layers, each containing four crates, yielding a total of 1,440 cans per pallet.
AS2 follows a similar configuration. The secondary packaging consists of reusable PP crates (30 × 40 × 32 cm), with smaller base dimensions than those in AS1 and closer to those used in the current scenarios. Each crate holds 24 cans per layer; with two layers per crate, the total capacity is 48 cans per RPC. Pallets were arranged in six layers, each containing eight crates, resulting in a total of 2,304 cans per pallet. Owing to the inherent stability of these crates, LLDPE stretch film was not required.
For both alternative scenarios, a reuse cycle, defined as filling, emptying, collection, sorting and reconditioning [30], was assumed to occur fifty times per crate.
With regard to tertiary packaging components, recycled fiber content was considered for the cardboard sheets, whereas the LLDPE stretch film and the PP crates were assumed to be manufactured entirely from virgin PE and virgin PP.
3.3. Logistics Description
An illustration of the different logistics is shown in Figure 8.
For all scenarios, the forward supply chain begins with the production of secondary and tertiary packaging, which is then transported to the packaging plant. After assembly, the packaged beverages are delivered to distribution centers and subsequently to retailers. In the alternative scenarios involving reusable packaging (AS1 and AS2), logistics become more complex [32]. The configuration of the logistics system depends on the type of packaging employed [65]. The PP crates used as secondary packaging in AS1 and AS2 must be returned to the packaging plant for washing and reconditioning before reuse.
Two distinct logistical cycles can therefore be assumed: (i) switch-pool systems, in which each participant in the supply chain is responsible for a portion of the crates, including cleaning, inspection, maintenance and storage, and (ii) systems with or without dedicated reverse logistics, in which a single actor manages the collection and handling of crates [24,36]. The present study focuses on the latter two configurations, described as follows (Figure 8b, Figure 8c).
In the reverse logistics configuration, empty crates are collected through a separate recovery cycle (retailers to distribution centers to pooling center to packaging plant) that is distinct from the forward distribution cycle. This strategy is highly efficient in terms of vehicle loading for crate retrieval but requires approximately twice the transport resources compared with the alternative approach.
In the configuration without reverse logistics, empty PP crates are collected simultaneously with retail deliveries. They are transferred to the distribution centers and subsequently returned along the supply chain to the packaging plant. It is assumed that the number of crates collected at retail matches the number delivered; however, because the crates are collapsible, additional units may potentially be retrieved. This strategy minimizes empty truck trips and, thanks to the foldable design of the crates, offers flexibility in handling discrepancies between delivered and collected quantities.
In both logistical configurations, a pooler actor [53,65], is included to manage the collection, washing, drying and inspection of reusable crates. After washing, performed using sodium percarbonate as the cleaning agent, the crates are dried and inspected for damage. For modelling simplicity, the pooler is assumed to be co-located with the packaging plant in this study.
3.4. End-of-Life Description
The end-of-life (EoL) stage of packaging waste represents an additional relevant source of environmental impact to be considered [20]. For the single-use packaging components used in the current scenarios (CS1, CS2 and CS3), including LDPE and LLDPE films, cardboard bases, cardboard boxes, interlayers and corner protectors, the EoL was modelled assuming a standard municipal solid waste collection system. For single-use plastic materials, three EoL pathways were considered: recycling, energy recovery through incineration and landfill disposal, each modelled according to the proportional distribution characteristic of the Italian waste management context. Similar modelling assumptions were applied to cardboard, although with different proportions across recycling, energy recovery and landfill.
For the RPCs used in AS1 and AS2, the EoL was modelled by assuming that, once discarded by the pooler at the end of their service life, they were partially recycled, partially sent to energy recovery and partially landfilled.
3.5. Life Cycle Inventory
The data used for modelling were collected from multiple sources. Secondary data were obtained from the scientific literature, technical documents published by Italian sector consortia and the Ecoinvent v3 database. Primary data were collected directly from suppliers operating within the Italian context and from field information gathered through interviews with logistics stakeholders. The following sections present the key datasets used for modelling packaging systems, logistics processes and EoL scenarios.
3.5.1. Packagings Data
Table 3 lists all packaging components used across the different scenarios, highlighting their specific combinations and the corresponding weight of each component per individual sales unit. For each scenario, the number of required packaging units is also reported.
Table 4 reports the pallet configuration for each scenario, including the number of cans per secondary packaging unit, the number of cans per layer, the total number of cans per pallet and the resulting pallet weight and height. These parameters vary according to the secondary packaging system adopted in each scenario. Pallet height, which can reach a maximum of 180 cm [73], changes accordingly. To ensure comparability across scenarios, all data were normalized to the number of cans transported per pallet, expressing the packaging weight relative to the total palletized load.
The data were normalized to the FU defined in the goal and scope, namely one can. For each scenario, the mass of each packaging component was allocated to the number of cans contained in the corresponding packaging configuration. For RPC1 in AS1 and RPC2 in AS2, fifty reuses were considered, as reported in Table 5.
Considering the allocation of secondary packaging weight per can and accounting for fifty reuse cycles, the secondary packaging in AS1 (RPC1), although initially seventy-five times heavier than the CS3 cardboard box, resulted in an allocated weight per can that was 84% lower than that of the cardboard box.
For the washing phase of RPCs in AS1 and AS2, the detergent, water and energy consumption per container were derived from Levi et al. [64]. The allocation per can accounted not only for the number of cans but also for the washing rate. Specifically, it was assumed that not all crates returning to the pooling center required washing; only 25% were washed, as reported by Levi et al. [64]. By contrast, Accorsi et al. [53,65] assumed a 50% washing rate, since in their case the reusable crates were in direct contact with the cans, which required more frequent inspection and washing. The data used in this study are summarized in Table 6.
3.5.2. Logistics Data
As stated, the study focused on national distribution and considered only road transport, which represents the main freight transport mode in Italy (87.3% in 2021, according to the Comité National Routier [78]). For direct logistics, the following distances were assumed: (i) from the production site to the packaging plant, 150 km, mainly on highways or extra-urban roads, using Euro 5 trucks of 16 to 32 tons (i.e., S1 in Figure 8); (ii) from the packaging plant to the distribution center, 200 km (i.e., S2), mainly on highways and extra-urban roads, using Euro 5 trucks of 16 to 32 tons, as reported in Accorsi et al. [50]; (iii) from the distribution center to retailers, 30 km (S3) on urban roads, using Euro 5 trucks of 3.5 to 7 tons, following Ferrara et al. [79].
For the alternative scenarios AS1 and AS2, which include product reuse, additional distances associated with reverse logistics were incorporated: (i) from retailers to distribution centers, 30 km (S5) on urban roads with Euro 5 trucks of 3.5 to 7 tons; (ii) from distribution centers to the pooling center, 200 km (S6) on highways and extra-urban roads, using Euro 5 trucks of 16 to 32 tons; (iii) from the pooling center to the packaging plant, assumed negligible.
For the EoL phase, a distance of 30 km was assumed between retailers or the pooling center and the waste management facility (S4). This distance, applied across all disposal scenarios, corresponds to the average distance between municipalities and waste management centers in Italy [80].
All transport data were modelled in kilograms per FU per kilometer traveled.
3.5.3. End-of-Life Data
The resources, material and energy requirements for recycling, incineration and landfill processes were obtained from Ecoinvent v3. The EoL management of the different materials was derived from data provided by the National Packaging Consortium for the Italian context. According to the “2022 Management Report” by Corepla, plastic waste follows these EoL pathways: 55.4% recycling, 33.0% energy recovery and 11.6% landfill disposal [81]. Among the two recycling options, mechanical and chemical, only mechanical recycling was considered, as it is currently the most widely applied. Mechanical recycling enables the production of secondary materials with low energy demand, relatively low costs and high-quality recycled outputs [82].
For paper and cardboard materials, data were obtained from the “Comieco Annual Report 2022,” which reports the following national EoL distribution: 85.1% recycling, 6.54% energy recovery and 8.5% landfill disposal. A high share of recycling is feasible because these materials pertain to secondary packaging and do not come into direct contact with food. Furthermore, European Directive 2018/852 establishes a minimum requirement of 75% recycled cardboard by 2025 and 80% by 2030 [83].
It was assumed that RPCs after twenty reuse cycles and HDPE pallets after twenty reuse cycles follow the same EoL pathways as the other plastic materials described above.
4. Conclusions
This comparative LCA of five beverage can packaging configurations (three single-use and two reusable crate-based systems) reveals that reusable PP crate systems (AS1 and AS2) achieved the most favorable environmental performance for most of impact categories considered. In contrast, among the single-use scenarios, the plastic film–intensive configuration (CS2) exhibited the highest impacts, followed by the other shrink-wrap-based case (CS1). The scenario utilizing primarily cardboard packaging (CS3) performed better than the plastic-heavy cases due to lower EoL burdens and high recycled content, although it showed slightly higher impacts in categories linked to pulp production (e.g., ozone depletion and eutrophication). These findings underscore the influence of material choice and waste management: single-use plastics (LDPE films) incurred significant greenhouse gas and disposal impacts, whereas cardboard proved more benign in most respects (aside from certain paper-related emissions).
Despite the overall advantages of reuse, including economic benefits because costs can be distributed over multiple use cycles [36], the present study highlights important trade-offs. Reusable systems incur additional burdens from manufacturing durable crates, washing processes, and reverse logistics, yet these overheads are offset when crates are reused sufficiently over their lifespan. The benefits of reuse are highly contingent on achieving high rotation cycles and efficient backhauling: sensitivity analyses showed that long transport distances or low reuse frequencies can erode or even negate the environmental gains of crate reuse. Notably, eliminating dedicated return trips by collecting empty crates during regular product deliveries markedly improved the impact of the reusable scenarios. These findings underline that reverse logistics optimization is pivotal for maximizing the sustainability of reuse-oriented packaging systems.
From a policy and strategic perspective, these results support initiatives to replace single-use secondary/tertiary packaging with well-managed reusable systems, but also emphasize the need for careful supply chain coordination. Policymakers and industry stakeholders should consider not only material selection but also the logistical framework, investing in collapsible, lightweight package designs and synchronized distribution-return networks to minimize transport burdens. In this direction, the adoption of RFID technologies [32] and digital packaging passports [38] can greatly facilitate monitoring and traceability, enabling smoother implementation and scalability of reuse systems. Moreover, optimizing crate retrieval (for example, through pooled crate systems or aligning returns with deliveries) can significantly enhance environmental outcomes. Overall, the study suggests that shifting toward reuse can substantially reduce packaging waste and emissions, aligning with circular economy goals, provided that reuse frequency is high and reverse logistics are efficient. As packaging regulations increasingly promote reuse and resource efficiency, the insights from this work can inform more nuanced packaging policy and logistics strategies that account for real-world operational conditions.
Future research should explore long-term performance and durability of reusable containers in practice, investigate consumer and operational barriers to large-scale adoption of reuse models, and extend LCA comparisons to other packaging formats and regions. Such studies would further clarify the conditions under which reusable packaging delivers net environmental benefits and help drive evidence-based decisions in sustainable packaging development. In addition, future studies should examine more deeply the economic, social, and logistical implications of implementing these systems in practice, working closely with all stakeholders in the supply chain to capture the operational realities that influence successful adoption.
Author Contributions
Conceptualization, G.D.F. and C.F.; methodology, G.D.F. and C.F.; software, G.M. and C.F.; validation, G.D.F. and C.F.; formal analysis, G.M. and G.D.F.; investigation, V.R. and C.F.; resources, G.D.F.; data curation, C.F. and V.R.; writing—original draft preparation, G.M.; writing—review and editing, G.D.F. and C.F.; visualization, C.F.; supervision, G.D.F. All authors have read and agreed to the published version of the manuscript.
Funding
This research received no external funding.
Data Availability Statement
The original contributions presented in this study are included in the article. Further inquiries can be directed to the corresponding author.
Conflicts of Interest
The authors declare no conflicts of interest.
Abbreviations
The following abbreviations are used in this manuscript:
| AS1 | Alternative Scenario 1 |
| AS2 | Alternative Scenario 2 |
| CS1 | Current Scenario 1 |
| CS2 | Current Scenario 2 |
| CS3 | Current Scenario 3 |
| EoL | End-of-Life |
| EU | European Union |
| FPMF | Fine Particulate Matter Formation |
| FRS | Fossil Resource Scarcity |
| FU | Functional Unit |
| GW | Global Warming |
| HDPE | High-Density Polyethylene |
| LU | Land Use |
| LCA | Life Cycle Assessment |
| LDPE | Low-Density Polyethylene |
| LLDPE | Linear Low-Density Polyethylene |
| PE | Polyethylene |
| PET | Polyethylene Terephthalate |
| PP | Polypropylene |
| RPC | Reusable Plastic Crate |
| RTI | Returnable Trasport Item |
| TA | Terrestrial Acidification |
References
- Caspers, J.; Coroama, V.C.; Sadetzky, L.; Süßbauer, E.; Finkbeiner, M. Measuring the Climate Change Impact of Household Food and Beverage Packaging — A Life Cycle Assessment of a Living Lab. Sustain. Prod. Consum. 2023, 42, 259–267. [Google Scholar] [CrossRef]
- Union, P.O. of the E. Publication Detail. Available online: https://op.europa.eu/en/publication-detail/-/publication/ (accessed on 19 November 2025).
- Plastic packaging waste in the EU: 35.3 kg per person. Available online: https://ec.europa.eu/eurostat/web/products-eurostat-news/w/ddn-20251022-1 (accessed on 7 November 2025).
- Pauer, E.; Wohner, B.; Heinrich, V.; Tacker, M. Assessing the Environmental Sustainability of Food Packaging: An Extended Life Cycle Assessment Including Packaging-Related Food Losses and Waste and Circularity Assessment. Sustainability 2019, 11, 925. [Google Scholar] [CrossRef]
- Dörnyei, K.R.; Uysal-Unalan, I.; Krauter, V.; Weinrich, R.; Incarnato, L.; Karlovits, I.; Colelli, G.; Chrysochou, P.; Fenech, M.C.; Pettersen, M.K.; et al. Sustainable Food Packaging: An Updated Definition Following a Holistic Approach. Front. Sustain. Food Syst. 2023, 7. [Google Scholar] [CrossRef]
- European Parliament and Council Directive 94/62/EC of 20 December 1994 on Packaging and Packaging Waste; 1994; Vol. 365.
- Tencati, A.; Pogutz, S.; Moda, B.; Brambilla, M.; Cacia, C. Prevention Policies Addressing Packaging and Packaging Waste: Some Emerging Trends. Waste Manag. 2016, 56, 35–45. [Google Scholar] [CrossRef]
- Regulation (EU) 2025/40 of the European Parliament and of the Council of 19 December 2024 on Packaging and Packaging Waste, Amending Regulation (EU) 2019/1020 and Directive (EU) 2019/904, and Repealing Directive 94/62/EC (Text with EEA Relevance); 2024.
- Sepúlveda-Carter, J.; Moreno de Castro, J.L.; Marín, L.; Baños, P.; Rodríguez, M.S.; Arrieta, M.P. Regulatory Frameworks and State-of-the-Art Decontamination Technologies for Recycled Polystyrene for Food Contact Applications. Polymers 2025, 17, 658. [Google Scholar] [CrossRef] [PubMed]
- Liu, W.; Zhu, Z.; Ye, S. A Framework Towards Design for Circular Packaging (DfCP): Design Knowledge, Challenges and Opportunities. Circ. Econ. Sustain. 2023, 3, 2109–2125. [Google Scholar] [CrossRef]
- COMMISSION STAFF WORKING DOCUMENT IMPACT ASSESSMENT REPORT Accompanying the Document Proposal for a Regulation of the European Parliament and the Council on Packaging and Packaging Waste, Amending Regulation (EU) 2019/1020, and Repealing Directive 94/62/EC; 2022.
- Bremenkamp, I.; Sousa Gallagher, M.J. Life Cycle Assessment Methods for Investigating Novel Food Packaging Systems. Environ. Sci. Adv. 2024, 3, 1337–1350. [Google Scholar] [CrossRef]
- Ott, D.; Goyal, S.; Reuss, R.; Gutzeit, H.O.; Liebscher, J.; Dautz, J.; Degieter, M.; de Steur, H.; Zannini, E. LCA as Decision Support Tool in the Food and Feed Sector: Evidence from R&D Case Studies. Environ. Syst. Decis. 2023, 43, 129–141. [Google Scholar] [CrossRef]
- Val, S.; Lambán, M.P. Enhancing Sustainability with LCA: A Comparative Analysis of Design and Manufacturing Processes. Processes 2025, 13, 195. [Google Scholar] [CrossRef]
- Falkenstein, E.; Wellenreuther, F.; Detzel, A. LCA Studies Comparing Beverage Cartons and Alternative Packaging: Can Overall Conclusions Be Drawn? Int. J. Life Cycle Assess. 2010, 15, 938–945. [Google Scholar] [CrossRef]
- Brock, A.; Williams, I. Life Cycle Assessment of Beverage Packaging. Detritus 2020, 13, 47–61. [Google Scholar] [CrossRef]
- Cappiello, G.; Aversa, C.; Genovesi, A.; Barletta, M. Life Cycle Assessment (LCA) of Bio-Based Packaging Solutions for Extended Shelf-Life (ESL) Milk. Environ. Sci. Pollut. Res. Int. 2022, 29, 18617–18628. [Google Scholar] [CrossRef]
- Kim, S.Y.; Kang, D.H.; Charoensri, K.; Ryu, J.R.; Shin, Y.J.; Park, H.J. Comparative Life Cycle Assessment of Reusable and Disposable Distribution Packaging for Fresh Food. Sustainability 2023, 15, 16448. [Google Scholar] [CrossRef]
- Operato, L.; Panzeri, A.; Masoero, G.; Gallo, A.; Gomes, L.; Hamd, W. Food Packaging Use and Post-Consumer Plastic Waste Management: A Comprehensive Review. Front. Food Sci. Technol. 2025, 5. [Google Scholar] [CrossRef]
- Molina-Besch, K.; Wikström, F.; Williams, H. The Environmental Impact of Packaging in Food Supply Chains—Does Life Cycle Assessment of Food Provide the Full Picture? Int. J. Life Cycle Assess. 2019, 24, 37–50. [Google Scholar] [CrossRef]
- Krauter, V.; Bauer, A.-S.; Milousi, M.; Dörnyei, K.R.; Ganczewski, G.; Leppik, K.; Krepil, J.; Varzakas, T. Cereal and Confectionary Packaging: Assessment of Sustainability and Environmental Impact with a Special Focus on Greenhouse Gas Emissions. Foods 2022, 11, 1347. [Google Scholar] [CrossRef]
- Protocolo_global.Pdf.
- Katsanakis, N.; Ibn-Mohammed, T.; Moradlou, H.; Godsell, J. Circular Economy Strategies for Life Cycle Management of Returnable Transport Items. Sustain. Prod. Consum. 2023, 43, 333–348. [Google Scholar] [CrossRef]
- ISO 18601:2013. Available online: https://www.iso.org/standard/55869.html (accessed on 17 November 2025).
- De Feo, G.; Ferrara, C.; Minichini, F. Comparison between the Perceived and Actual Environmental Sustainability of Beverage Packagings in Glass, Plastic, and Aluminium. J. Clean. Prod. 2022, 333, 130158. [Google Scholar] [CrossRef]
- Dolci, G.; Puricelli, S.; Cecere, G.; Tua, C.; Fava, F.; Rigamonti, L.; Grosso, M. How Does Plastic Compare with Alternative Materials in the Packaging Sector? A Systematic Review of LCA Studies. Waste Manag. Res. 2025, 43, 339–357. [Google Scholar] [CrossRef] [PubMed]
- Boesen, S.; Bey, N.; Niero, M. Environmental Sustainability of Liquid Food Packaging: Is There a Gap between Danish Consumers’ Perception and Learnings from Life Cycle Assessment? J. Clean. Prod. 2019, 210, 1193–1206. [Google Scholar] [CrossRef]
- Sustainable-Beverage-Packaging-Final-Report.
- Unlocking a Reuse Revolution: Scaling Returnable Packaging. Available online: https://www.ellenmacarthurfoundation.org/scaling-returnable-packaging/overview (accessed on 19 November 2025).
- Espinoza-Orias, N.; Lundquist, L. Life Cycle Assessment of Reusable Food and Beverage Packaging Systems: A Proposal of Good Practice. J. Clean. Prod. 2025, 499, 145207. [Google Scholar] [CrossRef]
- Directive 2008/98/EC of the European Parliament and of the Council of 19 November 2008 on Waste and Repealing Certain Directives (Text with EEA Relevance); 2008; Vol. 312.
- Coelho, P.M.; Corona, B.; ten Klooster, R.; Worrell, E. Sustainability of Reusable Packaging–Current Situation and Trends. Resour. Conserv. Recycl. X 2020, 6, 100037. [Google Scholar] [CrossRef]
- ISO 18603:2013. Available online: https://www.iso.org/standard/55871.html (accessed on 19 November 2025).
- Reuse in the Treaty EMF April 2023 Final-V2.
- McCrea, A. Reusable Packaging Association Publishes 2023 Reusable Transport Packaging State of the Industry Report. In Reusable Packag. Assoc.; 2023. [Google Scholar]
- Mahmoudi, M.; Parviziomran, I. Reusable Packaging in Supply Chains: A Review of Environmental and Economic Impacts, Logistics System Designs, and Operations Management. Int. J. Prod. Econ. 2020, 228, 107730. [Google Scholar] [CrossRef]
- Žilvinas, Z. The Role of Reusable Packaging Implementation Toward More Sustainable Supply Chain. Manag. Theory Stud. Rural Bus. Infrastruct. Dev. 2024, 46, 190–201. [Google Scholar]
- Ellsworth-Krebs, K.; Rampen, C.; Rogers, E.; Dudley, L.; Wishart, L. Circular Economy Infrastructure: Why We Need Track and Trace for Reusable Packaging. Sustain. Prod. Consum. 2022, 29, 249–258. [Google Scholar] [CrossRef]
- Huijbregts, M.A.J.; Steinmann, Z.J.N.; Elshout, P.M.F.; Stam, G.; Verones, F.; Vieira, M.; Zijp, M.; Hollander, A.; van Zelm, R. ReCiPe2016: A Harmonised Life Cycle Impact Assessment Method at Midpoint and Endpoint Level. Int. J. Life Cycle Assess. 2017, 22, 138–147. [Google Scholar] [CrossRef]
- Blanco, I.; Ingrao, C.; Siracusa, V. Life-Cycle Assessment in the Polymeric Sector: A Comprehensive Review of Application Experiences on the Italian Scale. Polymers 2020, 12, 1212. [Google Scholar] [CrossRef] [PubMed]
- Siracusa, V.; Rosa, M.D.; Romani, S.; Rocculi, P.; Tylewicz, U. Life Cycle Assessment of Multilayer Polymer Film Used on Food Packaging Field. Procedia Food Sci. 2011, 1, 235–239. [Google Scholar] [CrossRef]
- Moharir, R.V.; Kumar, S. Structural Characterization of LDPE Films to Analyse the Impact of Heavy Metals and Effect of UV Pre-Treatment on Polymer Degradation. J. Clean. Prod. 2021, 298, 126670. [Google Scholar] [CrossRef]
- Walichnowska, P.; Tomporowski, A.; Kłos, Z.; Rudawska, A.; Bembenek, M. Sustainability in Beverage Packaging Technology: Life Cycle Analysis and Waste Management Scenarios. Sustainability 2025, 17, 6594. [Google Scholar] [CrossRef]
- Desole, M.P.; Gisario, A.; Fedele, L.; Aversa, C.; Barletta, M. Life Cycle Assessment of Secondary Packaging: Expanded Polystyrene versus Bioplastic-Coated Corrugated Cardboard. Sustain. Prod. Consum. 2024, 46, 11–28. [Google Scholar] [CrossRef]
- Valentini, F.; Dorigato, A. Comparative Life Cycle Assessment of Plastic and Paper Packaging for Pasta. J. Mater. Cycles Waste Manag. 2025, 27, 937–948. [Google Scholar] [CrossRef]
- Koskela, S.; Dahlbo, H.; Judl, J.; Korhonen, M.-R.; Niininen, M. Reusable Plastic Crate or Recyclable Cardboard Box? A Comparison of Two Delivery Systems. J. Clean. Prod. 2014, 69, 83–90. [Google Scholar] [CrossRef]
- Milà i Canals, L.; Bauer, C.; Depestele, J.; Dubreuil, A.; Freiermuth Knuchel, R.; Gaillard, G.; Michelsen, O.; Müller-Wenk, R.; Rydgren, B. Key Elements in a Framework for Land Use Impact Assessment Within LCA (11 Pp). Int. J. Life Cycle Assess. 2007, 12, 5–15. [Google Scholar] [CrossRef]
- Goellner, K.N.; Sparrow, E. An Environmental Impact Comparison of Single-Use and Reusable Thermally Controlled Shipping Containers. Int. J. Life Cycle Assess. 2014, 19, 611–619. [Google Scholar] [CrossRef]
- Rasines, L.; San Miguel, G.; Corona, B.; Aguayo, E. Addressing the Circularity and Sustainability of Different Single-Use and Reusable Crates Used for Fresh Fruit and Vegetables Packaging. Food Packag. Shelf Life 2024, 46, 101391. [Google Scholar] [CrossRef]
- When Plastic Packaging Should Be Preferred: Life Cycle Analysis of Packages for Fruit and Vegetable Distribution in the Spanish Peninsular Market. Resour. Conserv. Recycl. 2020, 155, 104666. [CrossRef]
- Camps-Posino, L.; Batlle-Bayer, L.; Bala, A.; Song, G.; Qian, H.; Aldaco, R.; Xifré, R.; Fullana-i-Palmer, P. Potential Climate Benefits of Reusable Packaging in Food Delivery Services. A Chinese Case Study. Sci. Total Environ. 2021, 794, 148570. [Google Scholar] [CrossRef] [PubMed]
- Tsiliyannis, C.A. Parametric Analysis of Environmental Performance of Reused/Recycled Packaging. Environ. Sci. Technol. 2005, 39, 9770–9777. [Google Scholar] [CrossRef] [PubMed]
- Accorsi, R.; Cascini, A.; Cholette, S.; Manzini, R.; Mora, C. Economic and Environmental Assessment of Reusable Plastic Containers: A Food Catering Supply Chain Case Study. Int. J. Prod. Econ. 2014, 152, 88–101. [Google Scholar] [CrossRef]
- Tua, C.; Biganzoli, L.; Grosso, M.; Rigamonti, L. Life Cycle Assessment of Reusable Plastic Crates (RPCs). Resources 2019, 8, 110. [Google Scholar] [CrossRef]
- Issifu, I.; Sumaila, U.R. Is Reusable Beverage Packaging Better than Single–Use Plastic? Sustain. Futur. 2025, 10, 101275. [Google Scholar] [CrossRef]
- Beemsterboer, S.; Baumann, H.; Wallbaum, H. Ways to Get Work Done: A Review and Systematisation of Simplification Practices in the LCA Literature. Int. J. Life Cycle Assess. 2020, 25, 2154–2168. [Google Scholar] [CrossRef]
- Indicators and Assessment of the Environmental Impact of EU Consumption; Sala, S., Beylot, A., Corrado, S., Crenna, E., Sanyé-Mengual, E., Secchi, M., European Commission, Eds.; Publications Office: Luxembourg, 2019; ISBN 978-92-79-99672-6. [Google Scholar]
- López-Gálvez, F.; Rasines, L.; Conesa, E.; Gómez, P.A.; Artés-Hernández, F.; Aguayo, E. Reusable Plastic Crates (RPCs) for Fresh Produce (Case Study on Cauliflowers): Sustainable Packaging but Potential Salmonella Survival and Risk of Cross-Contamination. Foods 2021, 10, 1254. [Google Scholar] [CrossRef]
- Ketkale, H.; Simske, S. A LifeCycle Analysis and Economic Cost Analysis of Corrugated Cardboard Box Reuse and Recycling in the United States. Resources 2023, 12, 22. [Google Scholar] [CrossRef]
- Cardboard Vs Plastic: Which Packaging Is More Sustainable? | ShunPoly. Available online: https://shunpoly.com/article/is-cardboard-more-sustainable-than-plastic?utm_source=chatgpt.com (accessed on 24 November 2025).
- Laurent, A.; Weidema, B.P.; Bare, J.; Liao, X.; de Souza, D.M.; Pizzol, M.; Sala, S.; Schreiber, H.; Thonemann, N.; Verones, F. Methodological Review and Detailed Guidance for the Life Cycle Interpretation Phase. J. Ind. Ecol. 2020, 24, 986–1003. [Google Scholar] [CrossRef]
- Del Borghi, A.; Parodi, S.; Moreschi, L.; Gallo, M. Sustainable Packaging: An Evaluation of Crates for Food through a Life Cycle Approach. Int. J. Life Cycle Assess. 2021, 26, 753–766. [Google Scholar] [CrossRef]
- Arvidsson, R.; Svanström, M.; Harvey, S.; Sandén, B.A. Life-Cycle Impact Assessment Methods for Physical Energy Scarcity: Considerations and Suggestions. Int. J. Life Cycle Assess. 2021, 26, 2339–2354. [Google Scholar] [CrossRef]
- Levi, M.; Cortesi, S.; Vezzoli, C.; Salvia, G. A Comparative Life Cycle Assessment of Disposable and Reusable Packaging for the Distribution of Italian Fruit and Vegetables. Packag. Technol. Sci. 2011, 24, 387–400. [Google Scholar] [CrossRef]
- Accorsi, R.; Battarra, I.; Guidani, B.; Manzini, R.; Ronzoni, M.; Volpe, L. Augmented Spatial LCA for Comparing Reusable and Recyclable Food Packaging Containers Networks. J. Clean. Prod. 2022, 375, 134027. [Google Scholar] [CrossRef]
- ISO 14040:2006. Available online: https://www.iso.org/standard/37456.html (accessed on 4 November 2025).
- ISO 14044:2006. Available online: https://www.iso.org/standard/38498.html (accessed on 4 November 2025).
- Finnveden, G.; Hauschild, M.Z.; Ekvall, T.; Guinée, J.; Heijungs, R.; Hellweg, S.; Koehler, A.; Pennington, D.; Suh, S. Recent Developments in Life Cycle Assessment. J. Environ. Manage. 2009, 91, 1–21. [Google Scholar] [CrossRef]
- Cucurachi, S.; Scherer, L.; Guinée, J.; Tukker, A. Life Cycle Assessment of Food Systems. One Earth 2019, 1, 292–297. [Google Scholar] [CrossRef]
- Simon, B.; Amor, M.B.; Földényi, R. Life Cycle Impact Assessment of Beverage Packaging Systems: Focus on the Collection of Post-Consumer Bottles. J. Clean. Prod. 2016, 112, 238–248. [Google Scholar] [CrossRef]
- Krajnc, D.; Pintarič, Z.; Kravanja, Z. Comparative Life Cycle Assessment of Alternative Packaging Materials for Beverages; 21 May 2020; pp. 257–272. [Google Scholar]
- JBE_Comparative_LCA-10.20.2023.Pdf.
- Ferrara, C.; De Feo, G. Comparative Life Cycle Assessment of Alternative Systems for Wine Packaging in Italy. J. Clean. Prod. 2020, 259, 120888. [Google Scholar] [CrossRef]
- BB-CPS-330-A237.
- Giacomella, L.; De Keyser, E.; Mathijs, E.; Vranken, L. Avoidable Food Waste and Household Size: A Life Cycle Comparison of Packaged and Unpackaged Fruits and Vegetables. Sustain. Prod. Consum. 2025, 61, 1–14. [Google Scholar] [CrossRef]
- Euro Size 1200x800mm HDPE Food Grade Stackable Plastic Pallet - Pa PALLET. Available online: https://papallet.com/product/euro-size-1200x800mm-hdpe-food-grade-stackable-plastic-pallet/?utm_source=chatgpt.com (accessed on 24 November 2025).
- Georgakoudis, E.D.; Pechlivanidou, G.G.; Tipi, N.S. Sustainable Packaging Design: Packaging Optimization and Material Reduction for Environmental Protection and Economic Benefits to Industry and Society. Appl. Sci. 2025, 15, 8289. [Google Scholar] [CrossRef]
- Italy | COMITE NATIONAL ROUTIER. Available online: https://www.cnr.fr/en/detail-pays/15 (accessed on 23 November 2025).
- Ferrara, C.; De Feo, G.; Picone, V. LCA of Glass Versus PET Mineral Water Bottles: An Italian Case Study. Recycling 2021, 6, 50. [Google Scholar] [CrossRef]
- Mondello, G.; Salomone, R.; Ioppolo, G.; Saija, G.; Sparacia, S.; Lucchetti, M.C. Comparative LCA of Alternative Scenarios for Waste Treatment: The Case of Food Waste Production by the Mass-Retail Sector. Sustainability 2017, 9, 827. [Google Scholar] [CrossRef]
- Corepla_relazione_sulla_gestione_2022__0-4-1.Pdf.
- Abedsoltan, H. A Focused Review on Recycling and Hydrolysis Techniques of Polyethylene Terephthalate. Polym. Eng. Sci. 2023, 63, 2651–2674. [Google Scholar] [CrossRef]
- Https://Eur-Lex.Europa.Eu/Legal-Content/EN/TXT/?uri=CELEX:32018L0852 - EU Exit Web Archive - The National Archives. Available online: https://webarchive.nationalarchives.gov.uk/eu-exit/20201210201442/https://eur-lex.europa.eu/legal-content/EN/TXT/?uri=CELEX:32018L0852 (accessed on 14 November 2025).
Figure 1.
Environmental comparison of the packaging scenarios for the midpoint impact categories of ReCiPe 2016. Acronyms: CS: Current Scenario; AS: Alternative Scenario.
Figure 1.
Environmental comparison of the packaging scenarios for the midpoint impact categories of ReCiPe 2016. Acronyms: CS: Current Scenario; AS: Alternative Scenario.
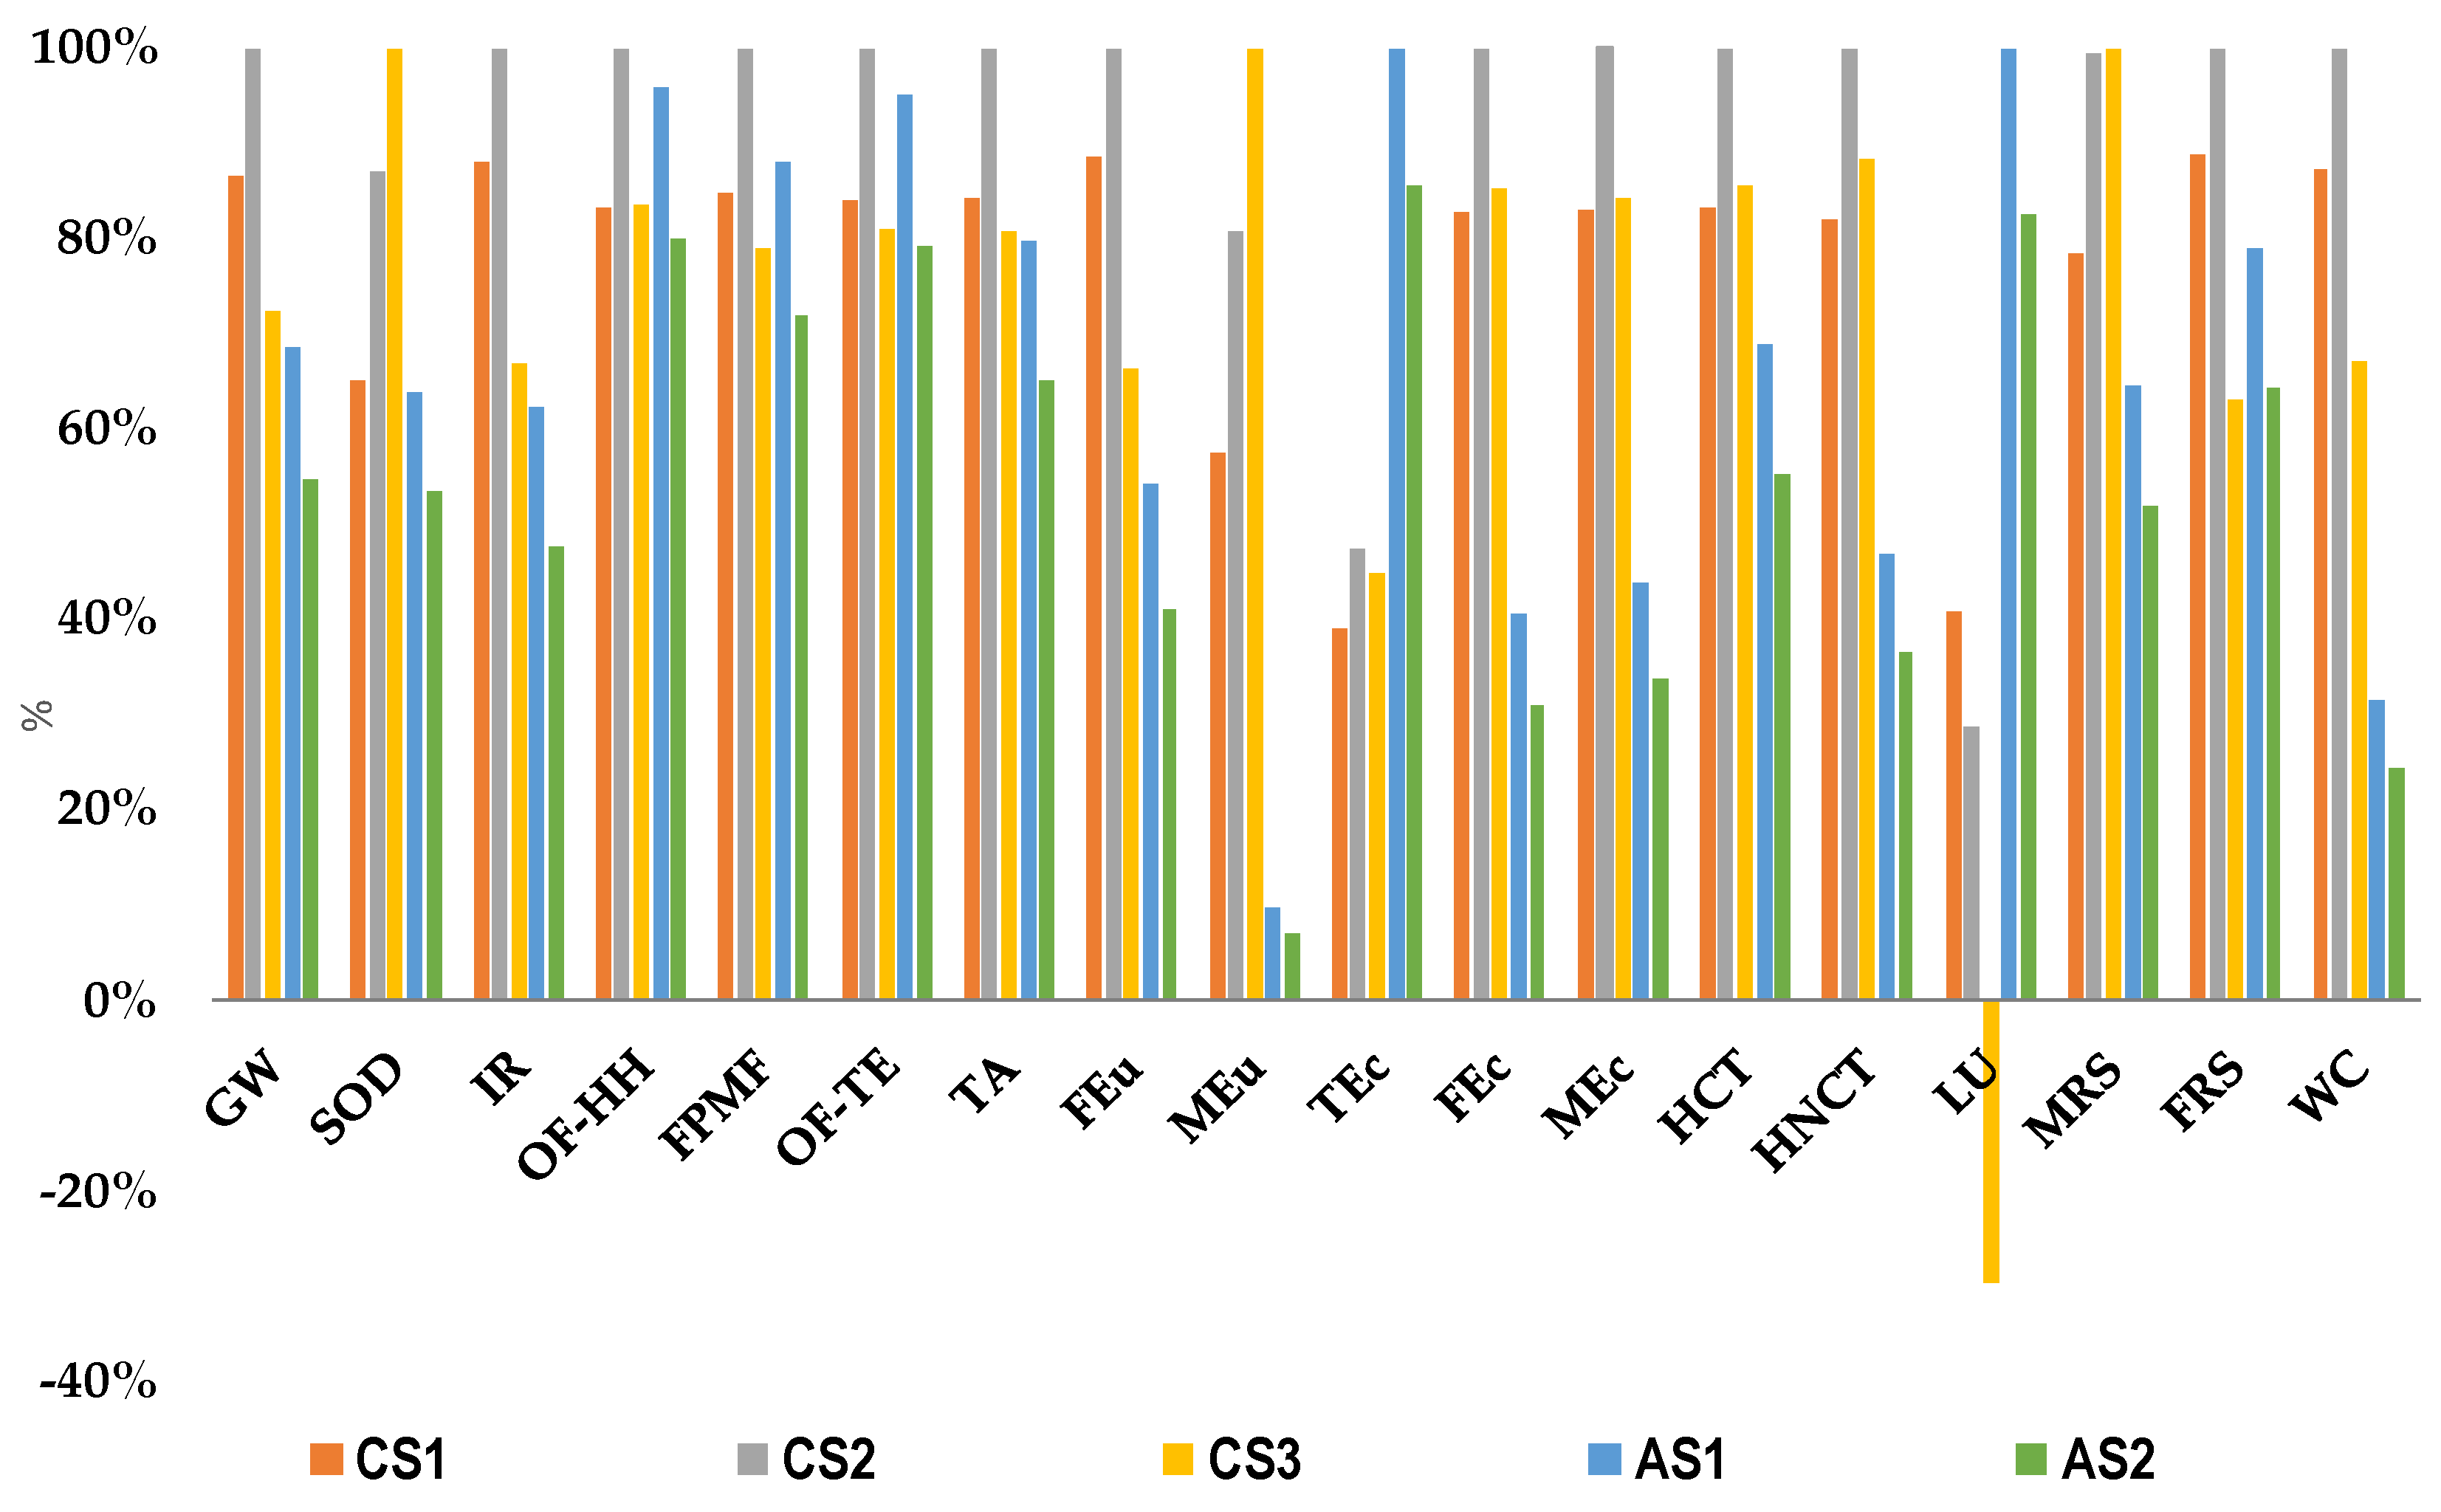
Figure 2.
Midpoint contribution of each life cycle stage, packaging production, distribution, end-of-life, and reverse logistic, to Global Warming (g CO₂eq) (a), Fine Particulate Matter Formation (mg PM₂.₅eq) (b), Terrestrial Acidification (mg SO₂eq) (c), and Fossil Resource Scarcity (g oil eq) (d). Acronyms: CS: Current Scenario; AS: Alternative Scenario.
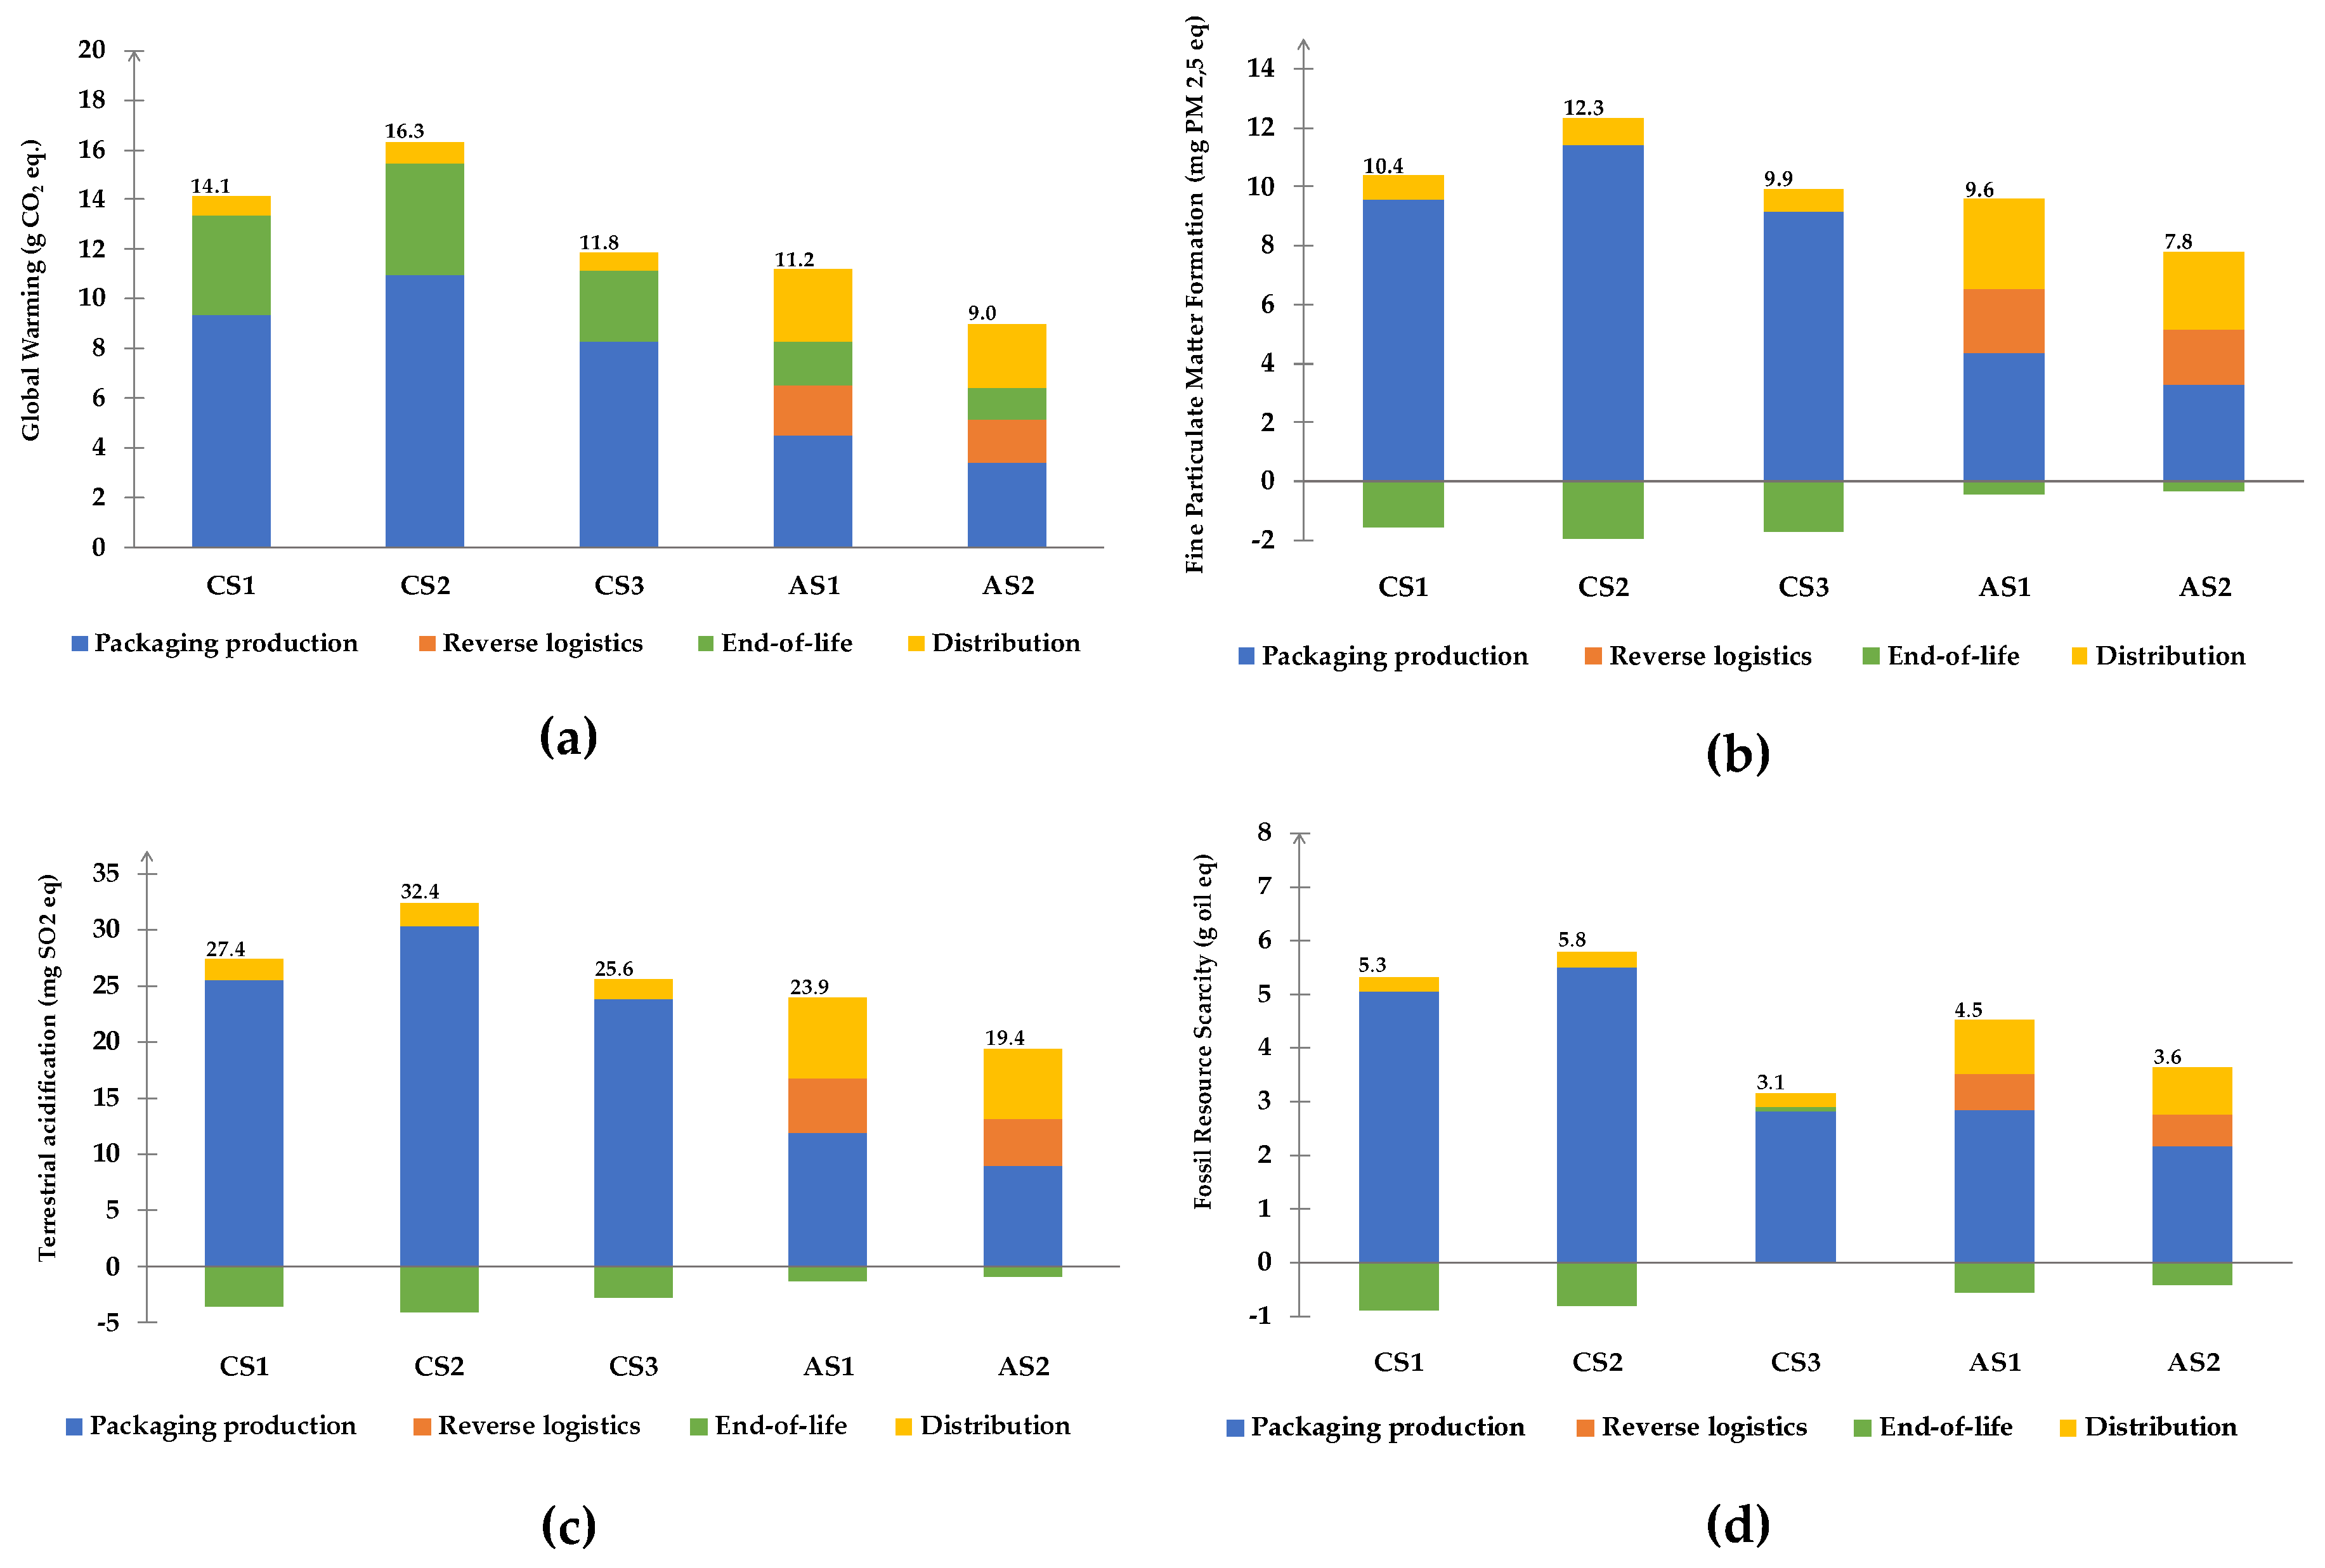
Figure 3.
Comparative assessment of packaging scenarios across the three endpoint impact categories, Human Health, Ecosystems, and Resources (ReCiPe 2016). Acronyms: CS: Current Scenario; AS: Alternative Scenario.
Figure 3.
Comparative assessment of packaging scenarios across the three endpoint impact categories, Human Health, Ecosystems, and Resources (ReCiPe 2016). Acronyms: CS: Current Scenario; AS: Alternative Scenario.
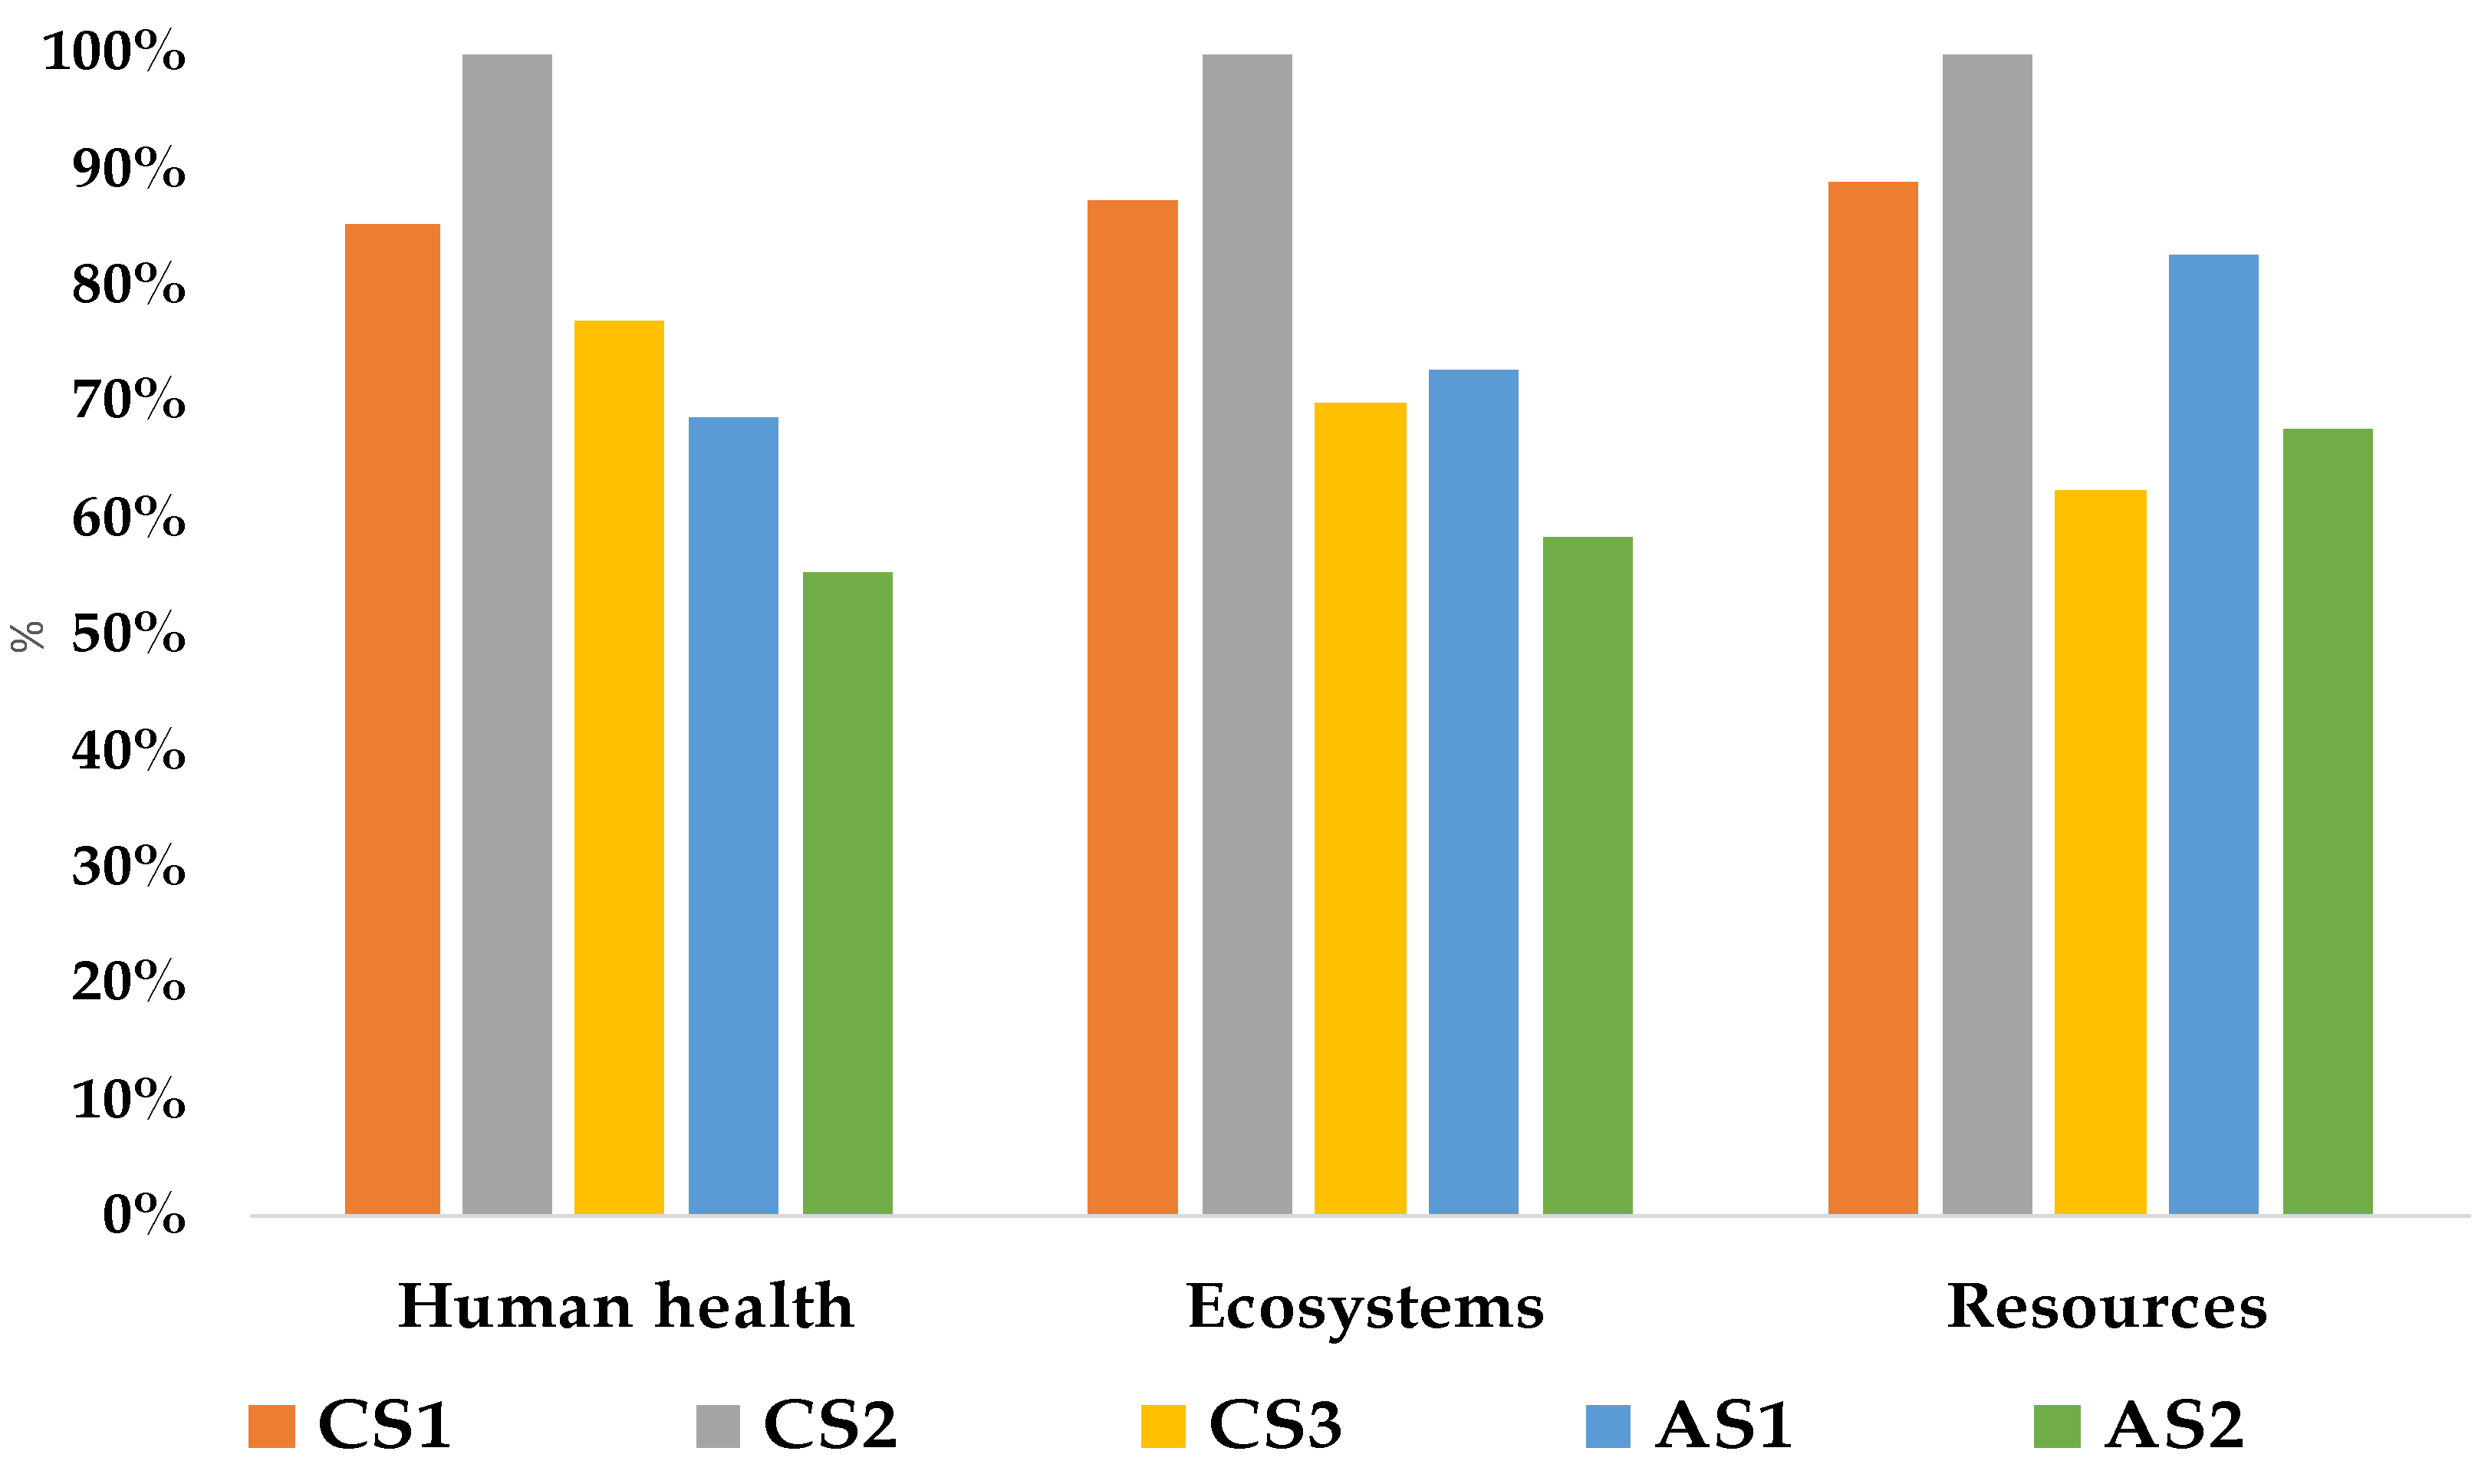
Figure 4.
Sensitivity analysis of transport distance across all scenarios. Relative changes in midpoint impact categories, Global Warming (a) Fine Particulate Matter Formation (b), Terrestrial Acidification (c), and Fossil Resource Scarcity (d) are shown for minimum and maximum transport distances with respect to baseline configurations. Acronyms: CS: Current Scenario; AS: Alternative Scenario.
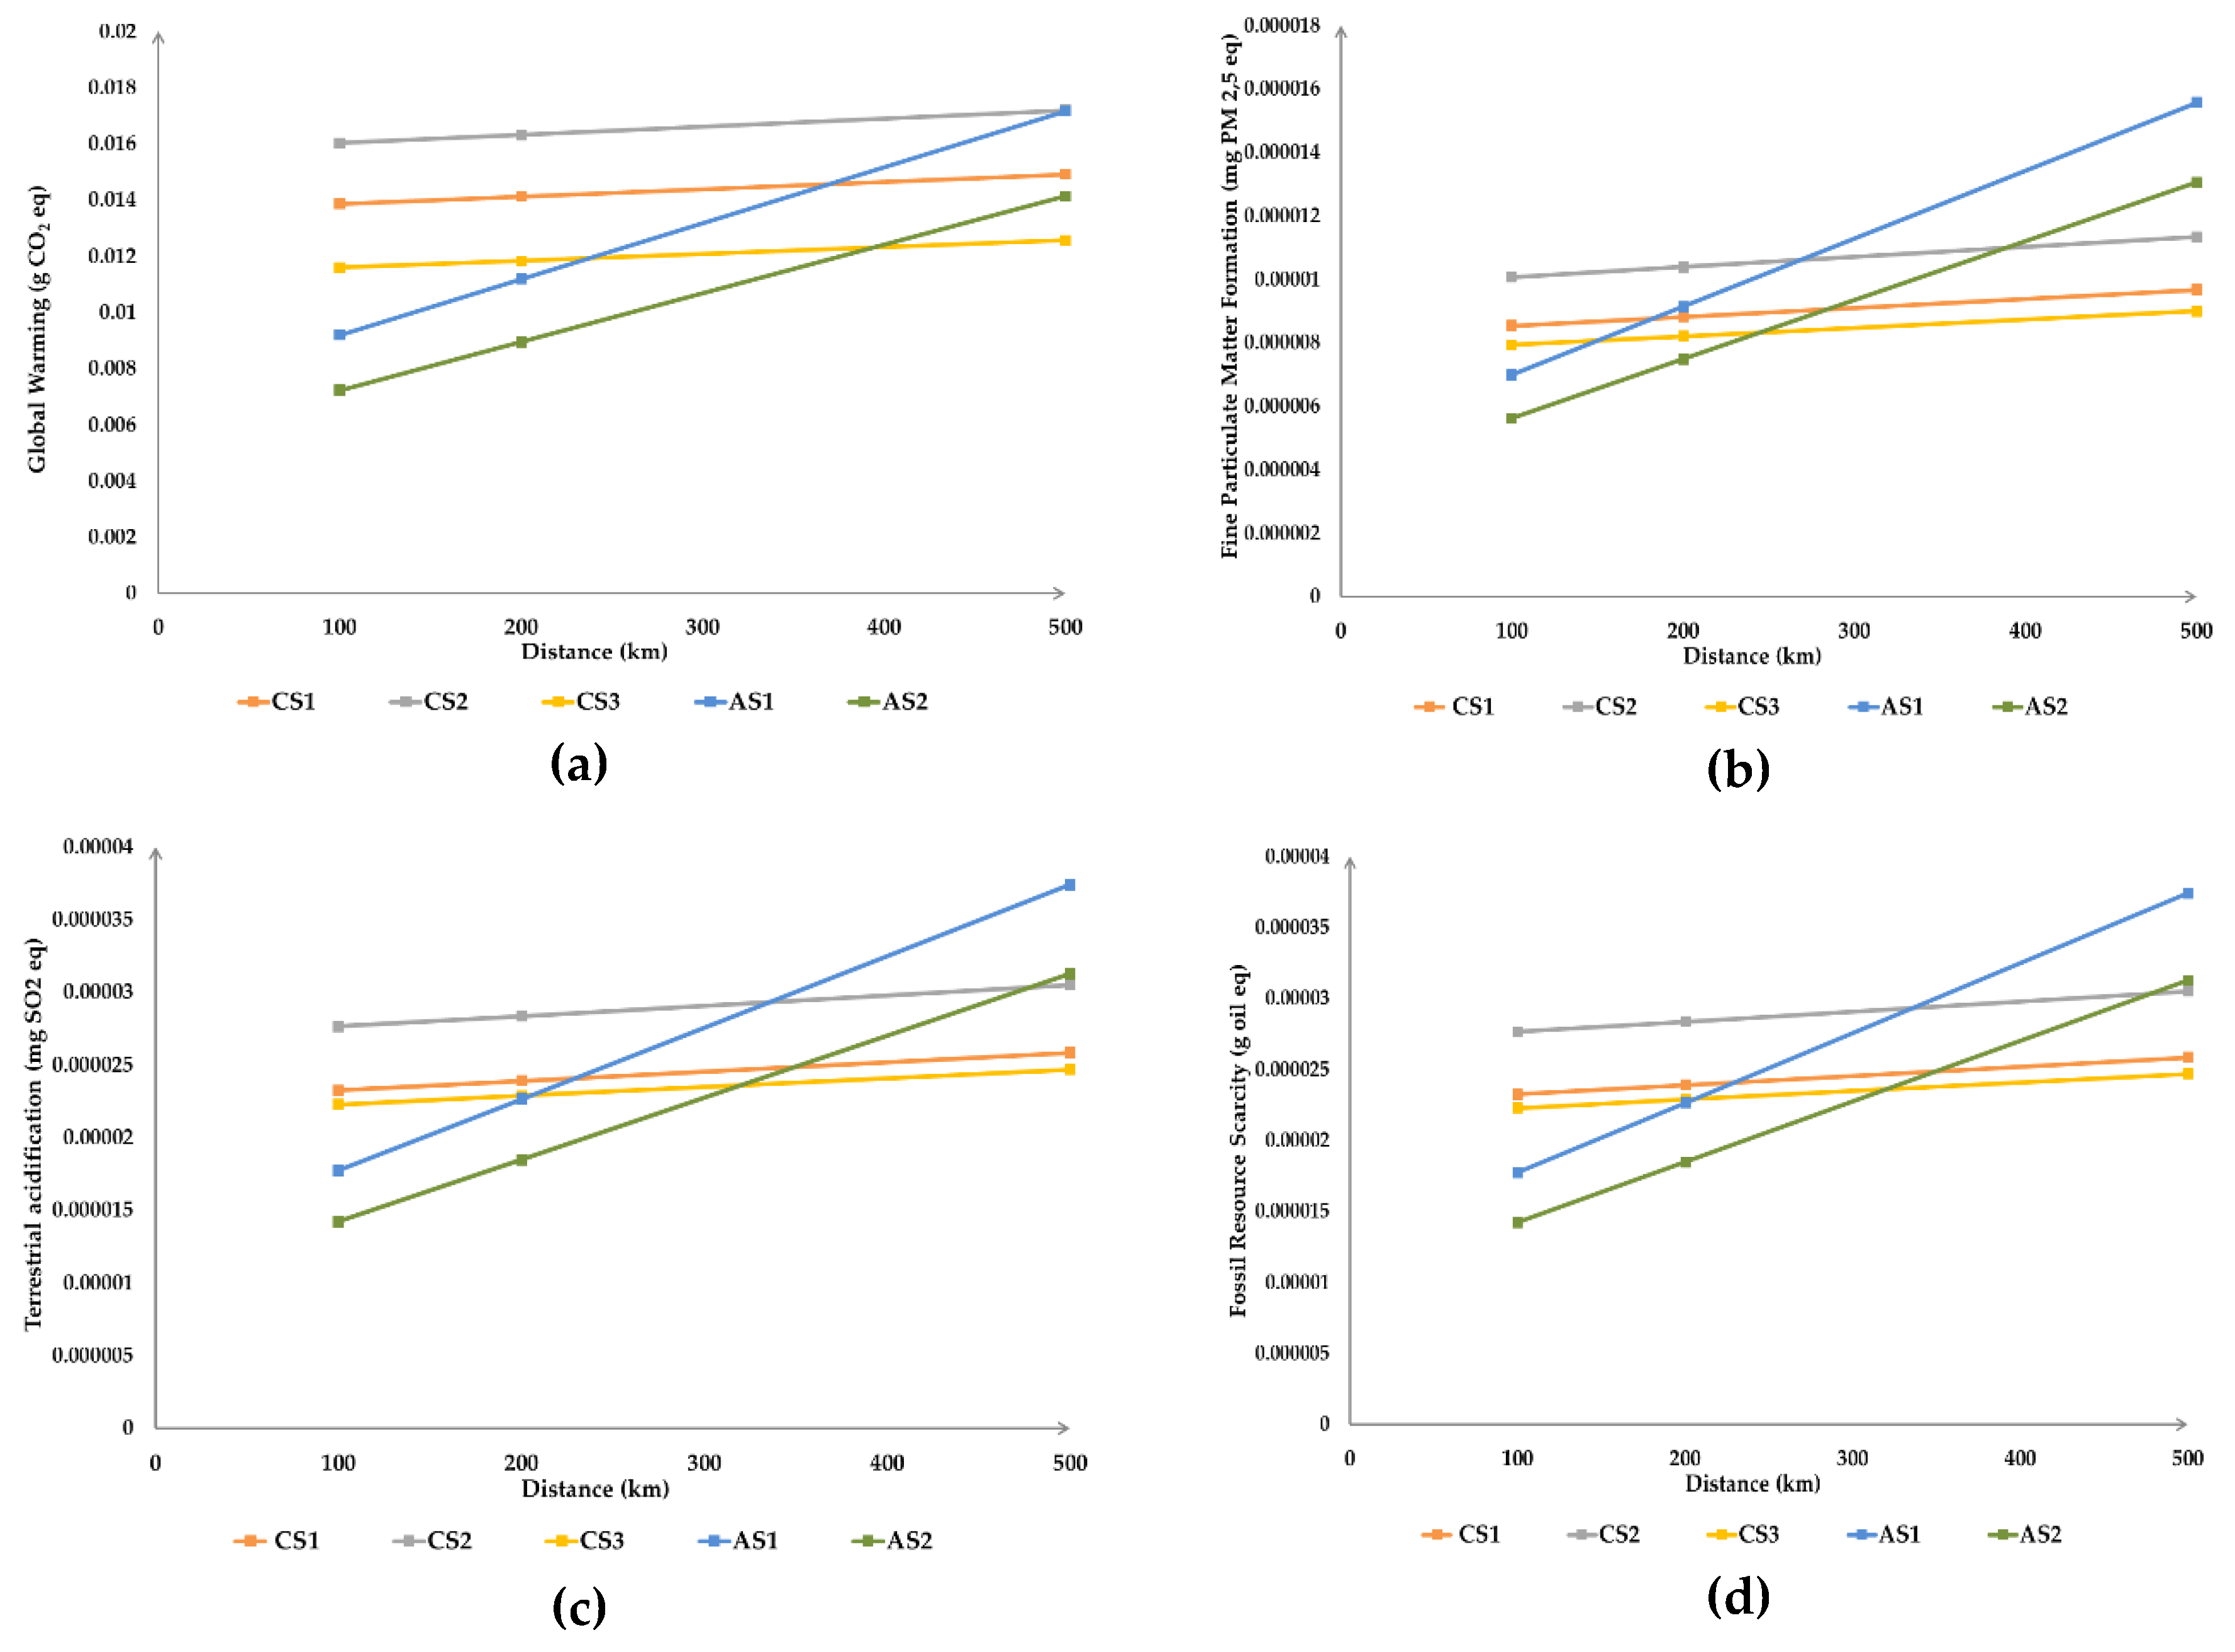
Figure 5.
Effect of the number of crate reuses, ranging from 20 (minimum variation) (a) to 200 (maximum variation) (b), on Midpoint impact categories Global Warming, Fine Particulate Matter Formation, Terrestrial Acidification, Fossil Resource Scarcity, with transport distance fixed at 200 km. Midpoint impacts are expressed as percentages relative to the worst-performing scenario. Acronyms: CS: Current Scenario; AS: Alternative Scenario.
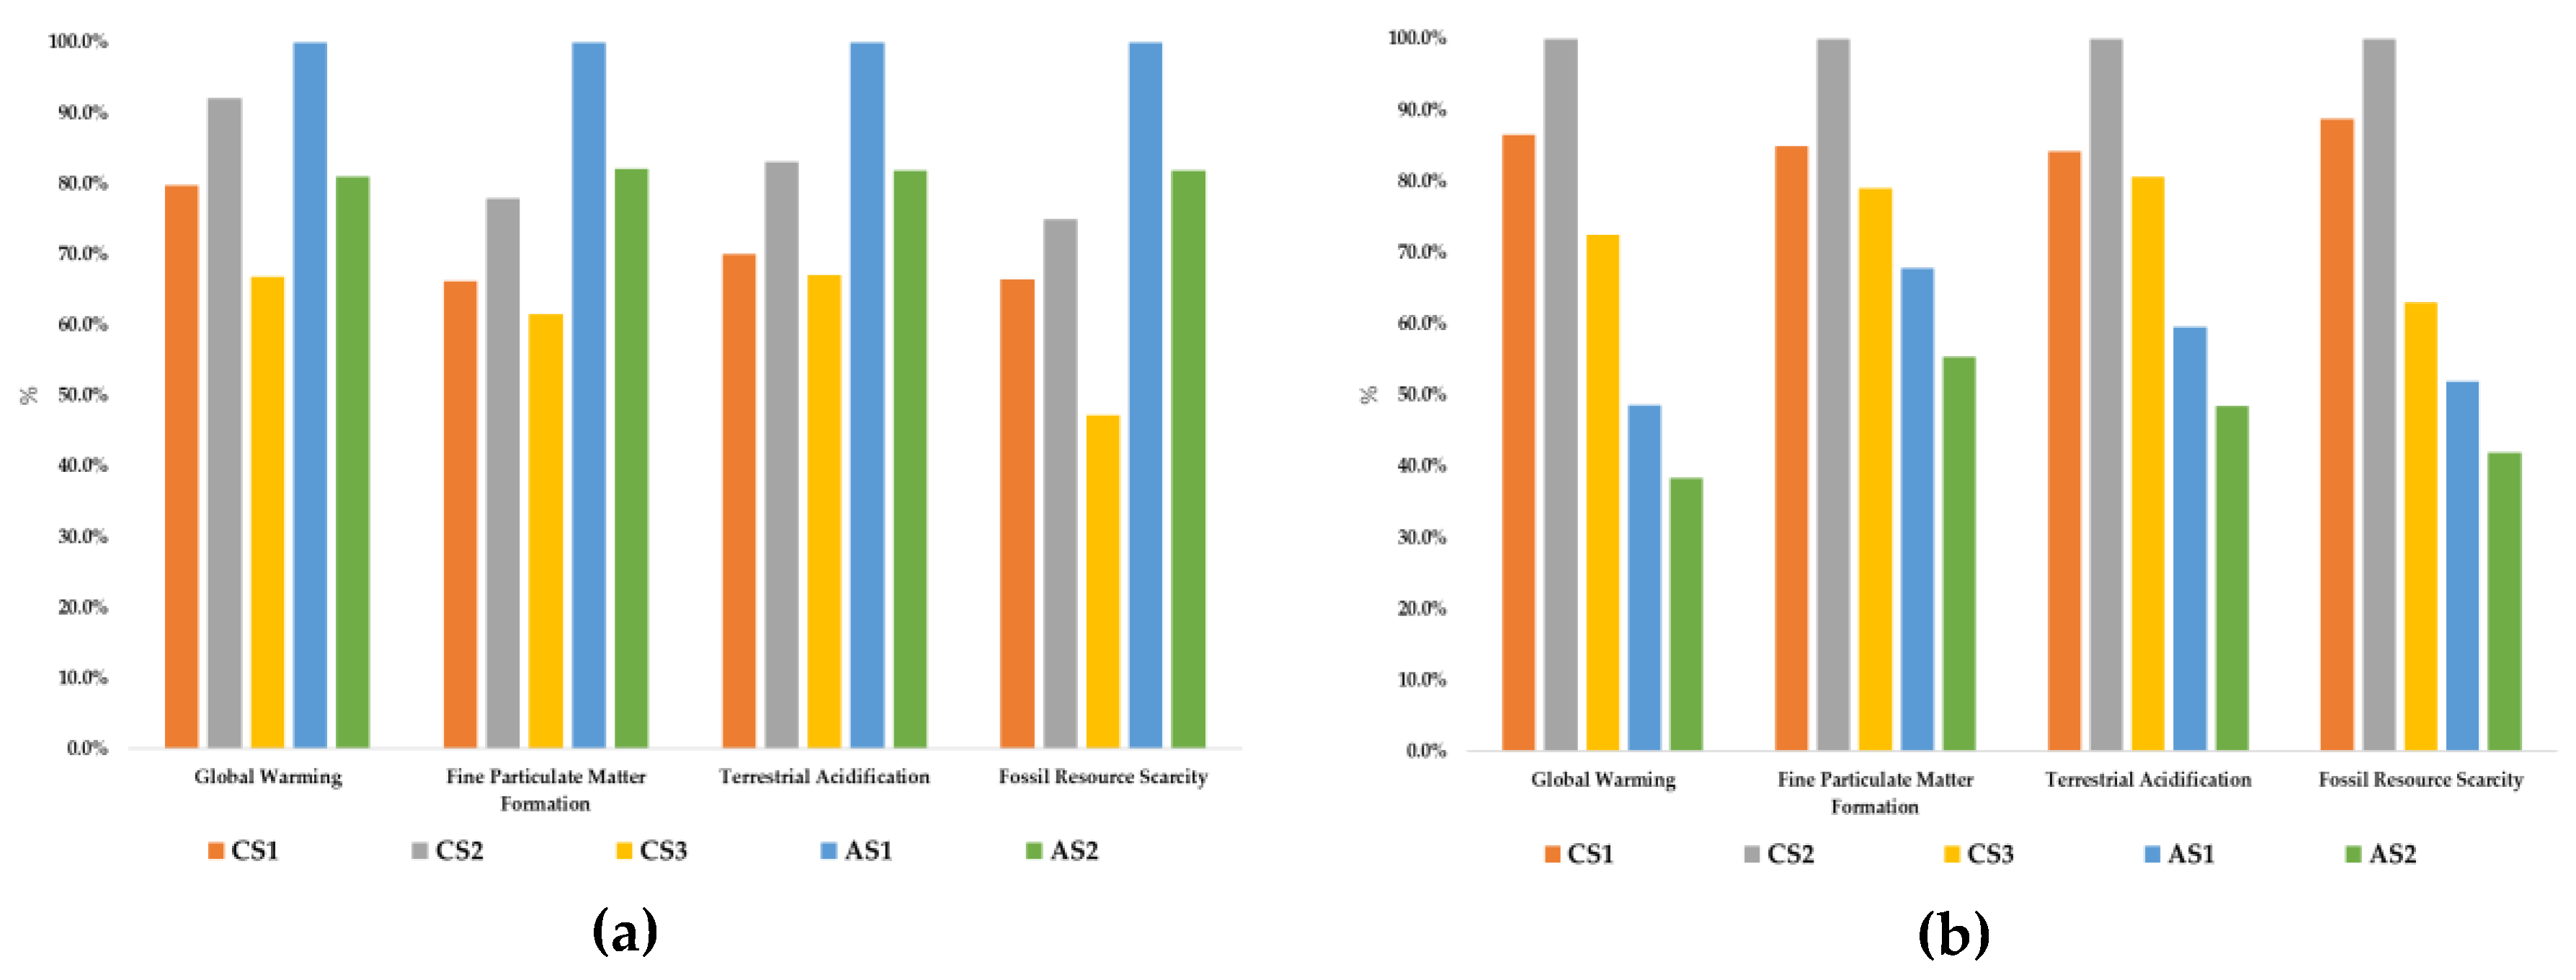
Figure 6.
System boundaries, indicating the life-cycle phases in which input and output flows were modeled. Acronyms: CS: Current Scenario; AS: Alternative Scenario.
Figure 6.
System boundaries, indicating the life-cycle phases in which input and output flows were modeled. Acronyms: CS: Current Scenario; AS: Alternative Scenario.
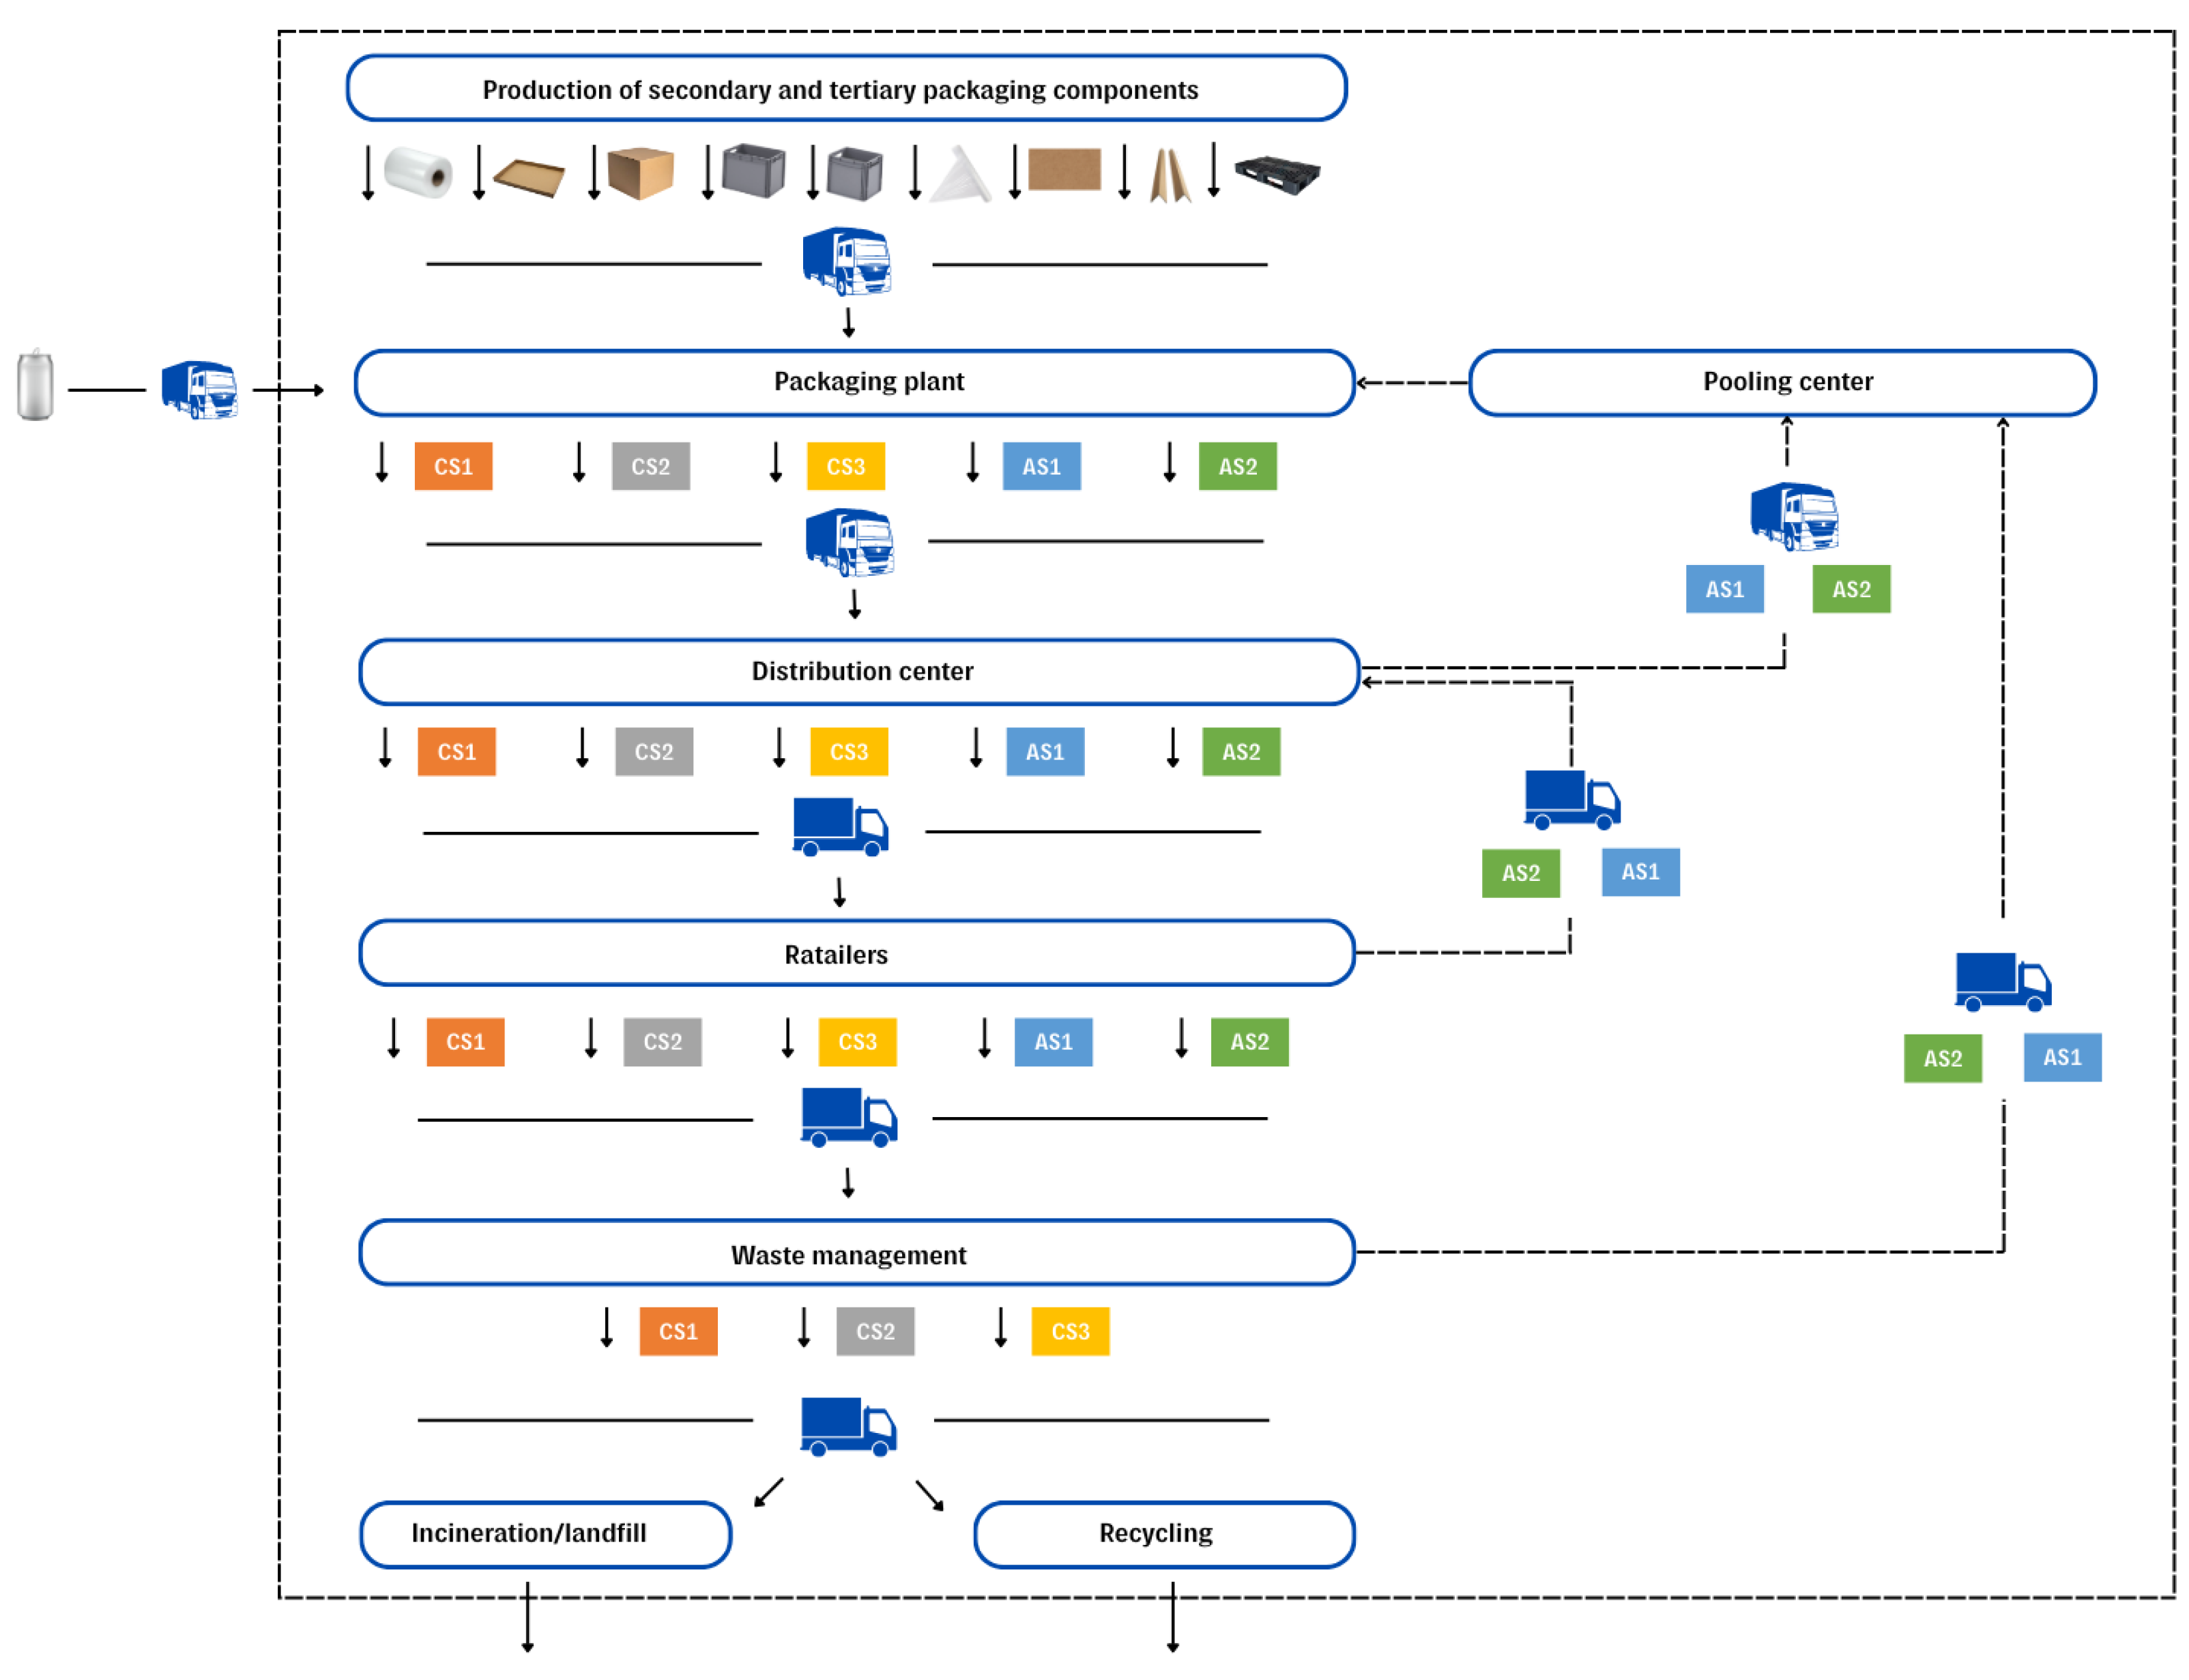
Figure 7.
Secondary and tertiary packaging specifications for scenarios, including packaging type, component dimensions, unit capacity, and number of units per secondary packaging and pallet. Acronyms: CS: Current Scenario; AS: Alternative Scenario.
Figure 7.
Secondary and tertiary packaging specifications for scenarios, including packaging type, component dimensions, unit capacity, and number of units per secondary packaging and pallet. Acronyms: CS: Current Scenario; AS: Alternative Scenario.
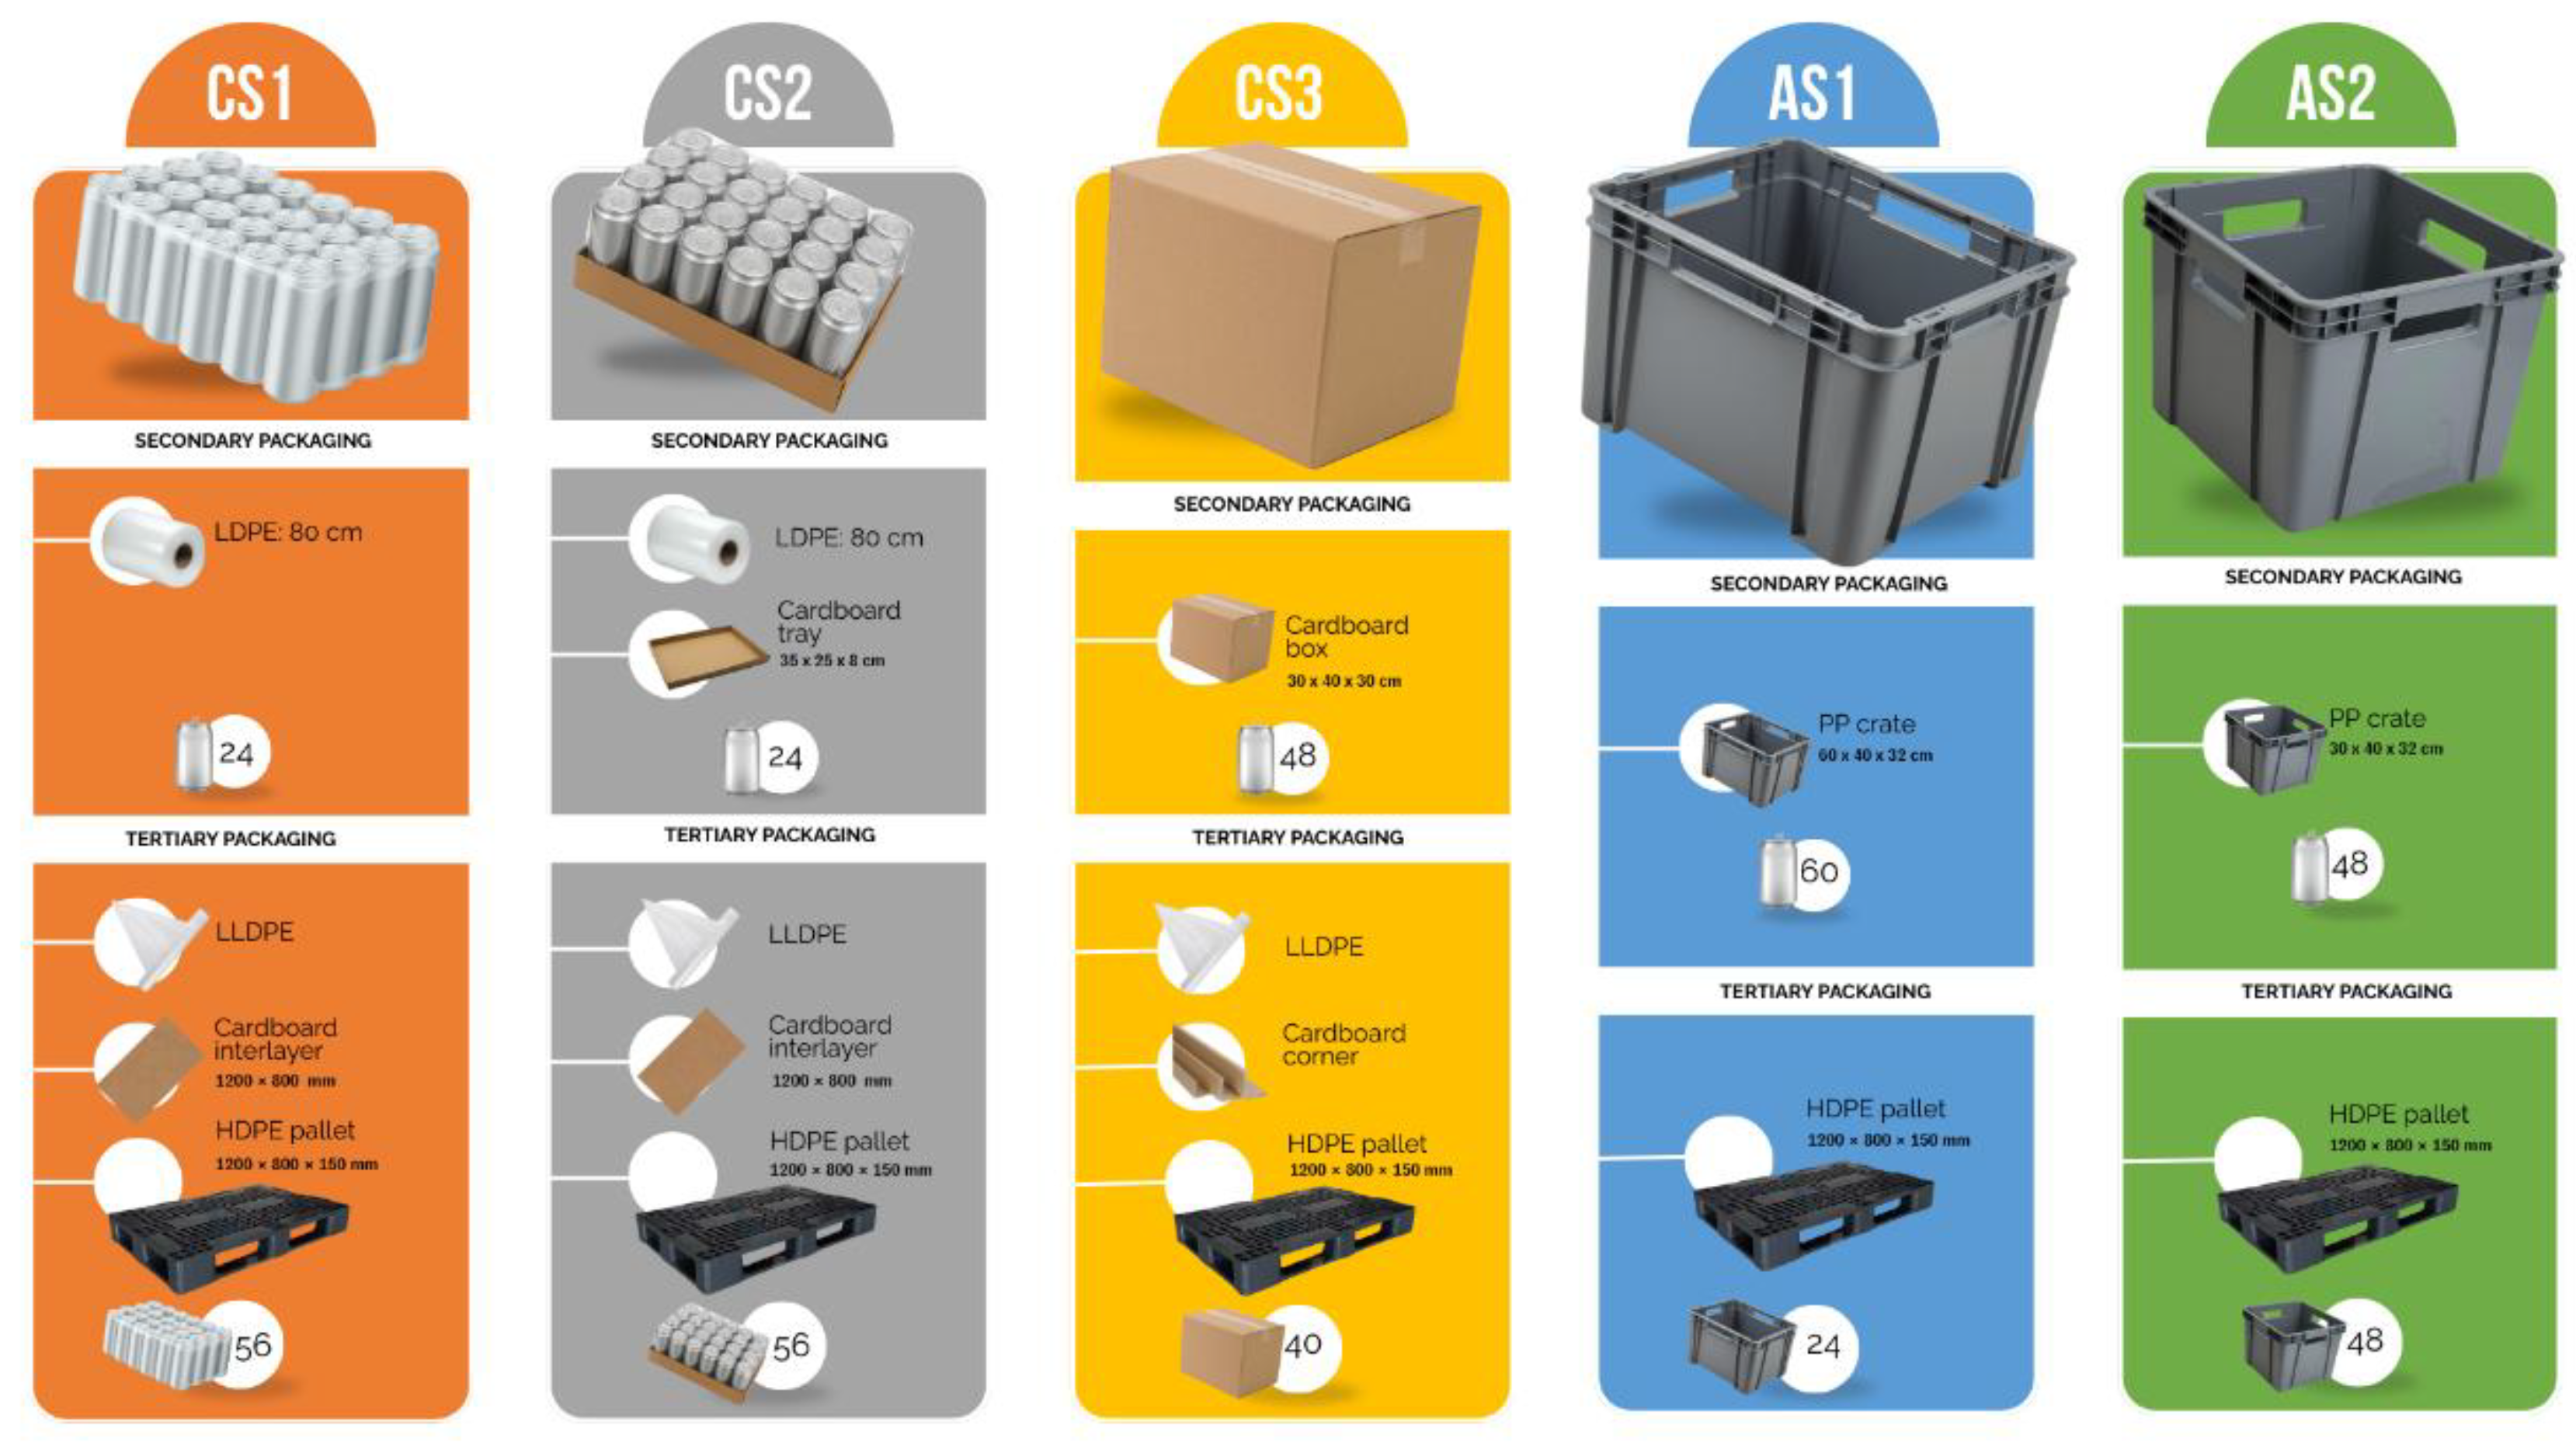
Figure 8.
Schematic representation of the three logistics configurations: conventional forward logistics(a), integrated forward and reverse logistics(b), and forward logistics without reverse flows(c). The configurations with (b) and without (c) reverse logistics refer to the alternative scenarios AS1 and AS2, respectively.
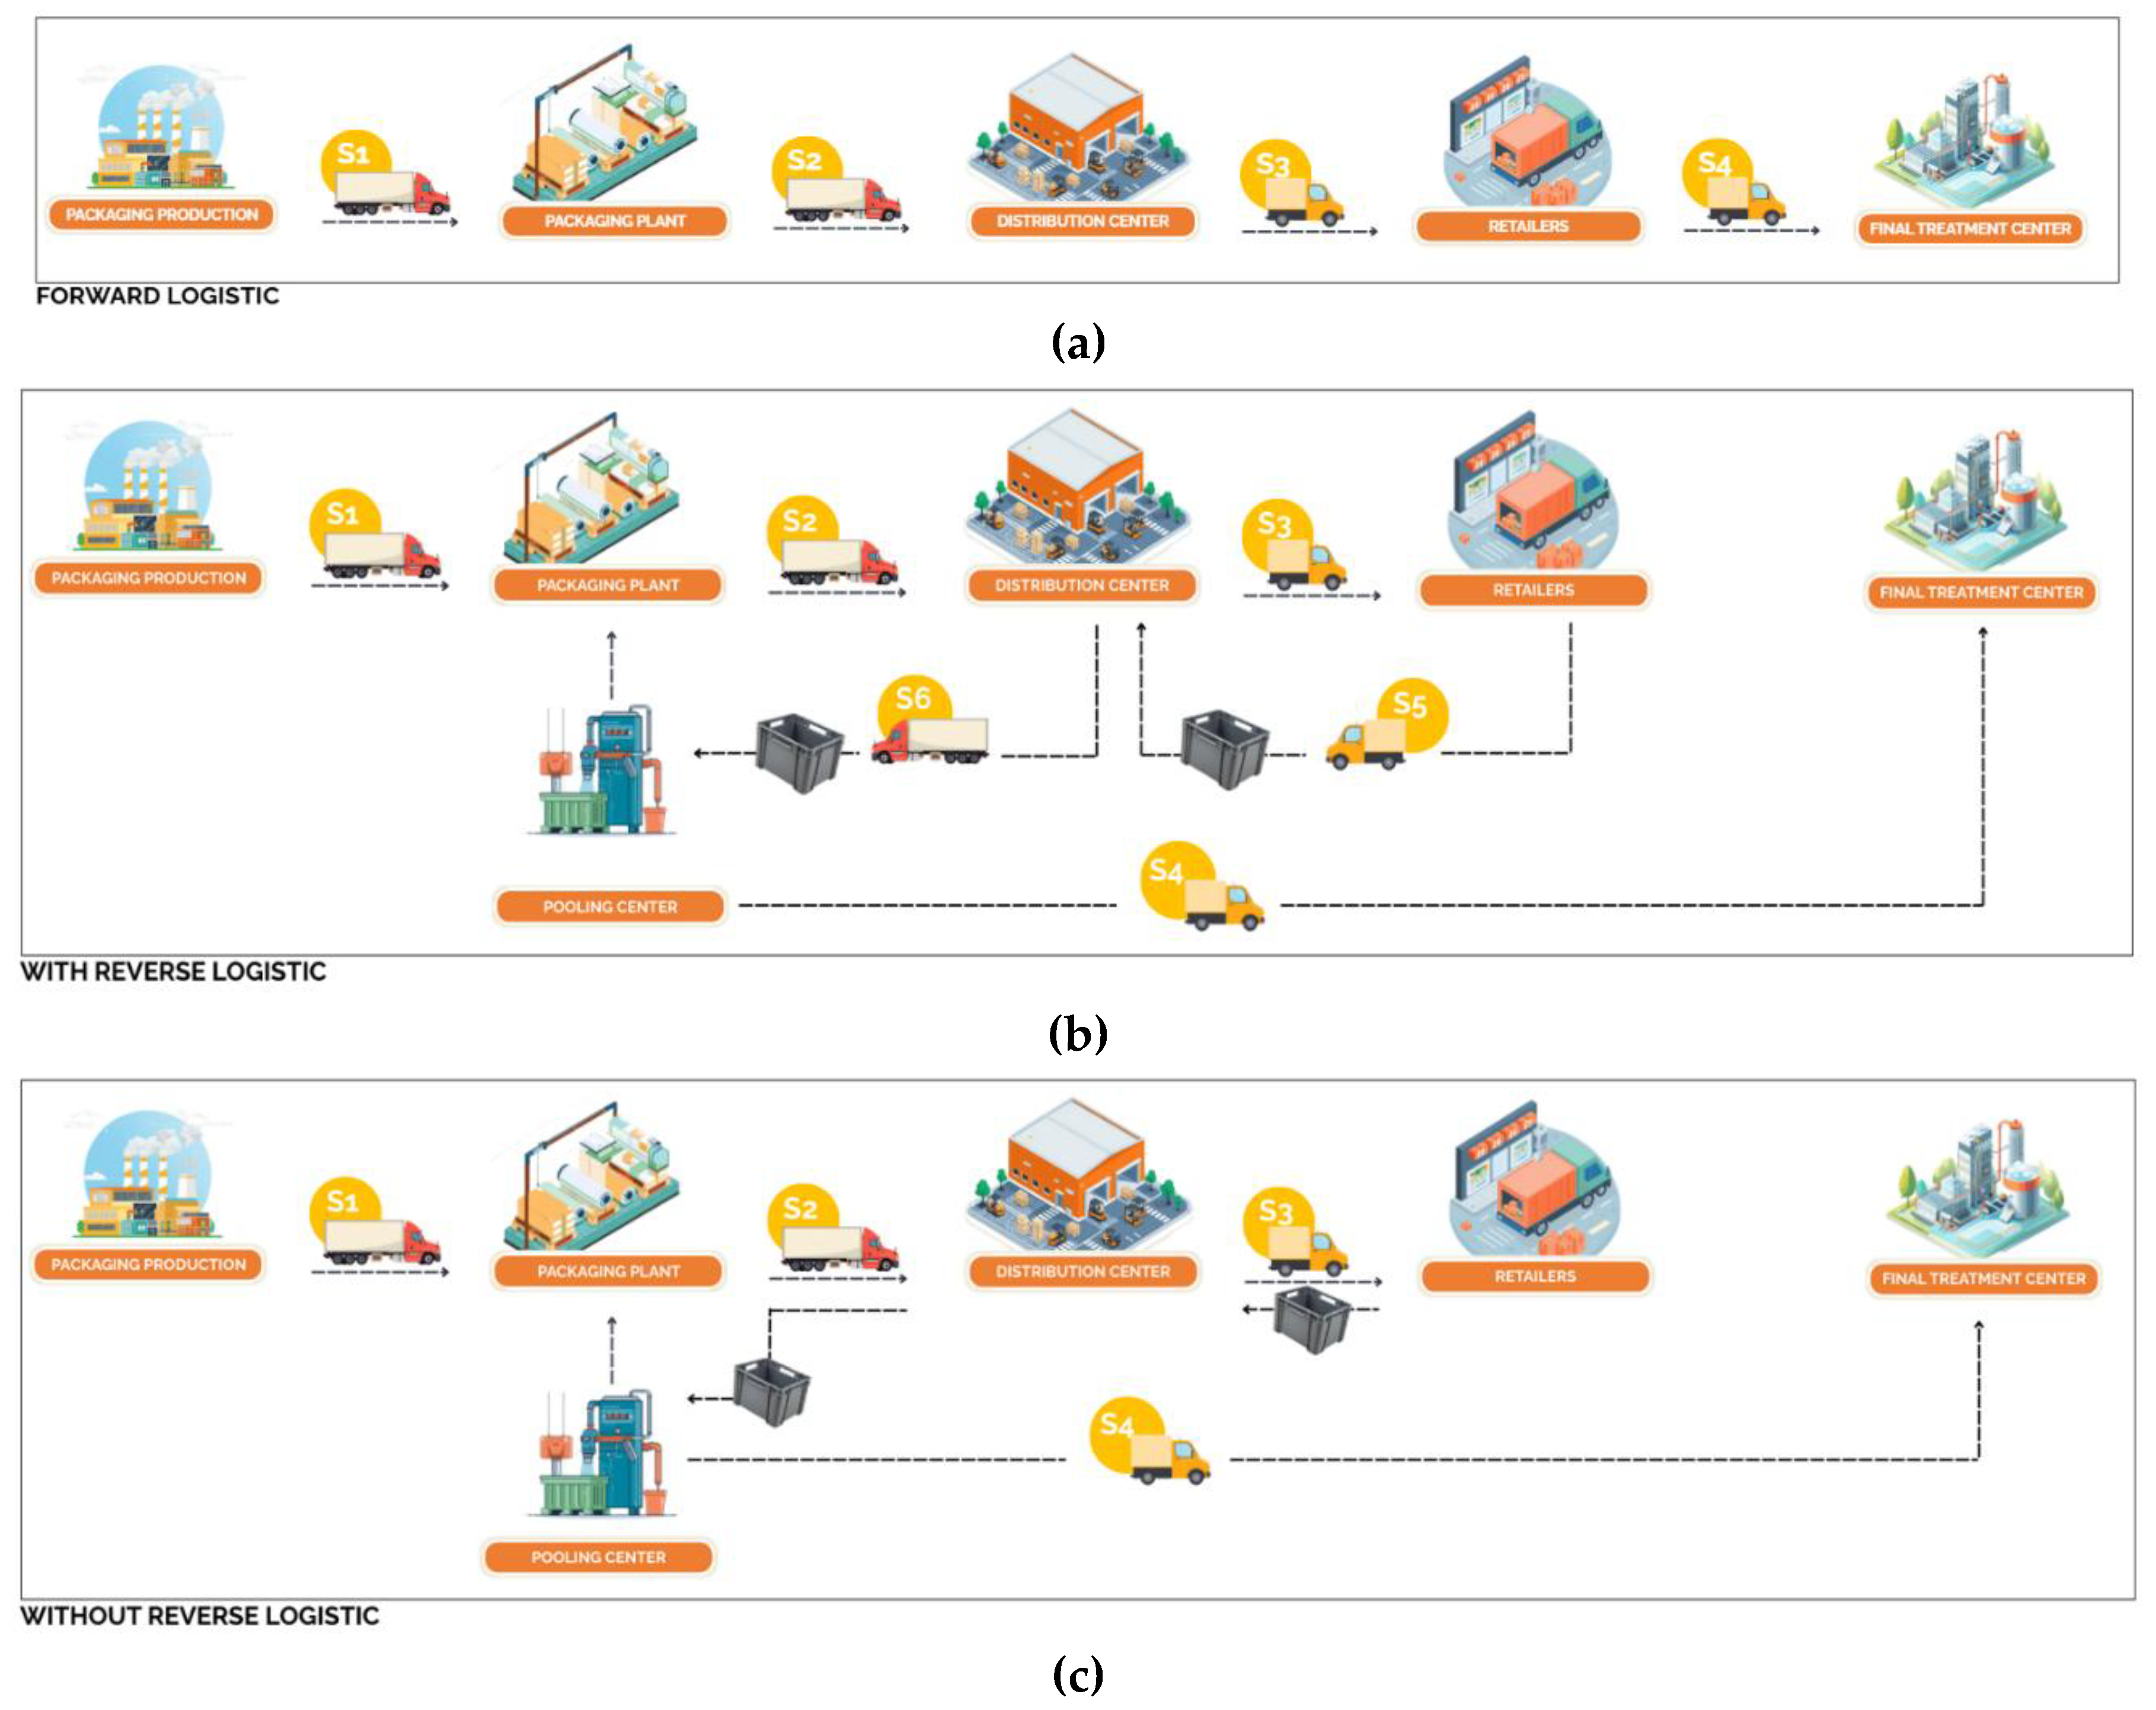

Table 1.
Difference values (Δ) in Midpoint impacts for alternative scenarios AS1 and AS2, calculated as: (Impact of configuration with reverse logistic) − (Impact of configuration without reverse logistic). All positive values indicate that the logistics model with a dedicated reverse collection process has a higher environmental burden across every impact category.
| Impact categories | Unit | AS1 | AS2 |
|---|---|---|---|
| Global warming (GW) | kg CO2eq | 1.99×10⁻³ | 1.73×10⁻³ |
| Stratospheric ozone depletion (SOD) | kg CFC11eq | 1.49×10⁻⁹ | 1.30×10⁻⁹ |
| Ionizing radiation (IR) | kBq Co-60 eq | 4.68×10⁻⁵ | 4.06×10⁻⁵ |
| Ozone formation, Human health (OF-HH) | kg NOx eq | 6.47×10⁻⁶ | 5.61×10⁻⁶ |
| Fine particulate matter formation (FPMF) | kg PM2.5 eq | 2.14×10⁻⁶ | 1.86×10⁻⁶ |
| Ozone formation, Terrestrial ecosystems (OF-TE) | kg NOx eq | 6.64×10⁻⁶ | 5.76×10⁻⁶ |
| Terrestrial acidification (TA) | kg SO2 eq | 4.92×10⁻⁶ | 4.26×10⁻⁶ |
| Freshwater eutrophication (FE) | kg P eq | 3.91×10⁻⁷ | 3.39×10⁻⁷ |
| Marine eutrophication (ME) | kg N eq | 1.20×10⁻⁸ | 1.04×10⁻⁸ |
| Terrestrial ecotoxicity (TEcotox) | kg 1,4-DCB | 3.57×10⁻² | 3.09×10⁻² |
| Freshwater ecotoxicity (FEeotox) | kg 1,4-DCB | 3.91×10⁻⁵ | 3.39×10⁻⁵ |
| Marine ecotoxicity (MEcotox) | kg 1,4-DCB | 7.10×10⁻⁵ | 6.16×10⁻⁵ |
| Human carcinogenic toxicity (HCTox) | kg 1,4-DCB | 8.04×10⁻⁵ | 6.97×10⁻⁵ |
| Human non-carcinogenic toxicity (HnCTox) | kg 1,4-DCB | 1.37×10⁻³ | 1.19×10⁻³ |
| Land use (LU) | m2a crop eq | 1.06×10⁻⁴ | 9.17×10⁻⁵ |
| Mineral resource scarcity (MRS) | kg Cu eq | 3.99×10⁻⁶ | 3.46×10⁻⁶ |
| Fossil resource scarcity (FRS) | kg oil eq | 6.86×10⁻⁴ | 5.95×10⁻⁴ |
| Water consumption (WC) | m3 | 3.37×10⁻⁶ | 2.92×10⁻⁶ |
Table 2.
Parameter ranges used in the sensitivity analysis, reporting minimum and maximum variations applied to transport distance and crate reuse cycles relative to the baseline scenario.
Table 2.
Parameter ranges used in the sensitivity analysis, reporting minimum and maximum variations applied to transport distance and crate reuse cycles relative to the baseline scenario.
| Parameter | Minimum variation | Baseline case | Maximum variation |
|---|---|---|---|
| Distribution distance (km) | 100 | 200 | 500 |
| Number of reuses (n°) | 20 | 50 | 200 |
Table 3.
Packaging components used in each scenario with dimensions, unit weight, and the number of units required at secondary and tertiary packaging level.
Table 3.
Packaging components used in each scenario with dimensions, unit weight, and the number of units required at secondary and tertiary packaging level.
| Packaging component | Dimension | Weight | CS1 | CS2 | CS3 | AS1 | AS2 |
|---|---|---|---|---|---|---|---|
| Secondary level | |||||||
| LDPE shrink film | 80 cm | 0.040 kg | 56 | 56 | - | - | - |
| Cardboard tray | 35 x 25 x 8 cm | 0.040 kg | - | 56 | - | - | - |
| Cardboard box | 30 x 40 x 30 cm | 0.300 kg | - | - | 40 | - | - |
| RPC 1 | 60 x 40 x 32 cm | 3.000 kg | - | - | - | 24 | - |
| RPC 2 | 30 x 40 x 32 cm | 2.200 kg | - | - | - | - | 48 |
| Tertiary level | |||||||
| Corner protector (X4) | - | 1.128 kg | - | - | 1 | - | - |
| Carboard interlayer | 120 x 80 cm | 0.576 kg | 8 | 8 | - | - | - |
| LLDPE film | 60 m | 0.633 kg | 1 | 1 | 1 | - | - |
| HDPE pallet | 120 x 80 x 15cm | 14.500 kg | 1 | 1 | 1 | 1 | 1 |
Table 4.
Pallet configuration for each scenario with the number of cans per secondary packaging unit, cans per layer, total pallet capacity, and the resulting pallet weight and height.
Table 4.
Pallet configuration for each scenario with the number of cans per secondary packaging unit, cans per layer, total pallet capacity, and the resulting pallet weight and height.
| Scenarios | Number of cans per secondary packaging unit | Number of cans per layer | Number of cans per pallet | Weight | Height |
|---|---|---|---|---|---|
| CS1 | 24 | 192 | 1344 | 22.0 kg | 1.00 m |
| CS2 | 24 | 192 | 1344 | 27.0kg | 1.00 m |
| CS3 | 48 | 384 | 1920 | 28.0kg | 1.50 m |
| AS1 | 60 | 240 | 1440 | 86.5 kg | 1.92 m |
| AS2 | 48 | 384 | 2304 | 120.0 kg | 1.92 m |
Table 5.
Packaging components normalized to the functional unit (one can). For each scenario, the mass of each packaging item is allocated to the number of cans contained in the corresponding packaging configuration. Reusable RPCs in AS1 (RPC1) and AS2 (RPC2) were normalized, assuming 50 reuse cycles.
| Normalized data (g/can) | ||||||
|---|---|---|---|---|---|---|
| Packaging components | Unit weight per single package (kg) | CS1 | CS2 | CS3 | AS1 | AS2 |
| Secondary level | ||||||
| LDPE shrink film | 0.040 | 1.667 | 1.667 | - | - | - |
| Cardboard tray | 0.040 | - | 1.667 | - | - | - |
| Cardboard box | 0.300 | - | - | 6.250 | - | - |
| RPC 1 | 3.000 | - | - | - | 1.000 | - |
| RPC 2 | 2.200 | - | - | - | - | 0.920 |
| Tertiary level | ||||||
| Corner protector (X4) | 1.128 | - | - | 0.588 | - | - |
| Carboard interlayer | 0.576 | 3.000 | 3.000 | - | - | - |
| LLDPE film | 0.633 | 0.471 | 0.471 | 0.330 | - | - |
| HDPE pallet | 14.500 | 10.789 | 10.789 | 7.552 | 10.069 | 6.293 |
Table 6.
Detergent, water, and energy consumption for RPC washing in scenarios AS1 and AS2. Values per crate were allocated to a single can considering the number of cans per crate and a 25% washing rate.
Table 6.
Detergent, water, and energy consumption for RPC washing in scenarios AS1 and AS2. Values per crate were allocated to a single can considering the number of cans per crate and a 25% washing rate.
| RPC washing | |||
|---|---|---|---|
| AS1 | AS2 | ||
| Consumption per crate | Consumption per can | ||
| Detergent | 0.500 g | 0.002883 | 0.002604 |
| Water | 0.100 kg | 0.000417 | 0.000521 |
| Energy | 0.036 kWh | 0.000150 | 0.000188 |
Disclaimer/Publisher’s Note: The statements, opinions and data contained in all publications are solely those of the individual author(s) and contributor(s) and not of MDPI and/or the editor(s). MDPI and/or the editor(s) disclaim responsibility for any injury to people or property resulting from any ideas, methods, instructions or products referred to in the content. |
© 2025 by the authors. Licensee MDPI, Basel, Switzerland. This article is an open access article distributed under the terms and conditions of the Creative Commons Attribution (CC BY) license (http://creativecommons.org/licenses/by/4.0/).
Copyright: This open access article is published under a Creative Commons CC BY 4.0 license, which permit the free download, distribution, and reuse, provided that the author and preprint are cited in any reuse.


