

Submitted:
13 August 2024
Posted:
14 August 2024
You are already at the latest version
Abstract
This paper adopts a systems firm-centered perspective on the environmental assessment of recyclable glass and PET soft drink containers. We employ LCA and discrete-event simulation modelling for the environmental assessment of the two soft drinks packaging alternatives in operational terms, over the entire supply chain, over a period of three years. The assessment is based on real data collected from a large soft-drinks producer and its suppliers. The research and practice contribution of the paper is twofold: first, it introduces a methodological framework for environmental assessment of companies’ packaging environmental impact under different product and operations strategies, and secondly, it provides a holistic environmental assessment of the two packaging materials (PET and glass) taking into account specific operational issues, such as product mix and recycling and reuse options, and activity interdependences and stochasticity. The results of the simulation experiments confirm at system level, for glass, the importance for sustainability, to increase the number of reuse cycles and the percentage of used bottles collected for refilling, whereas for PET, to increase the percentage of recycled PET in new bottles.
Keywords:
soft-drink packaging
; holistic environmental assessment
; reuse
; recycle
; PET
; glass
; simulation modelling
; LCA
1. Introduction
Over the last decades, demand for plastics has increased significantly, and by 2050, it is expected to reach 34 billion metric tons per annum [1]. Plastic-based materials are the most widely used medium in packaging and represent the largest application of polymers with about 26% of the total volume. [2]. Most of these polymers are polyethylene (PE), polyethylene terephthalate (PET), polypropylene (PP) and polystyrene (PS) [4]. Petrochemicals (petroleum and natural gas) are used in the production of many synthetic plastics, such as PET [2]. None of these plastics categories are biodegradable. As a result, they accumulate, rather than decompose, in landfills or the natural environment [5]. The polluting effects of plastics, especially for sea waters and their harming effects for fisheries, have been at the center of public discourse since the sixties [6]. Lately, there is also concern for nanoparticles in plastics which can accumulate in the human brain [7]. Today, the significant negative environmental, health and economic impact of certain plastic products calls more intensely for the setting up of a specific legal framework to effectively reduce those negative effects [8]. For this reason, at the European level, the EU 2019/904 Directive was adopted, which sets specific objectives, as well as requirements, from all European Member States. In addition, for each type of plastics-based packaging, alternative solutions are searched and evaluated, in order to find the most environmentally sustainable one, with the aim of replacing plastic with more environmental-friendly materials.
In the particular study reported in this paper, we examine the environmental performance vis-à-vis, and in conjunction with, packaging alternatives for liquid food, specifically for bottles used for non-alcoholic drinks. Due to hotter climate and increasing avoidance of alcohol, the consumption of such refreshments follows an ever increasing trend. It is estimated that the soft drinks market in the USA will reach in 2028 the 320 billion dollars mark, from 253 billion in 2016 [9]. Similar trends are observed for the European market [10], especially for Greece, which is the focus of this study [11,12]. Today, all over the world, the majority of soft drinks are distributed and available in PET bottles because PET is rugged, clear, durable and odor-resistant, and also has low carbon dioxide permeability [14]. Although PET recycling processes are available with questionable results [15], PET recycling has not been carried out at the same rate as PET production mainly due to the general public’s association of plastic with disposable package [16,17]. As reported in the Paris Climate Agreement documents, plastic design and production must be improved to make reuse, repair and recycle easier, to keep the plastic production away from fossil fuels, and to cut greenhouse gas emissions [18], while the UN has been concerned about policies for promoting the collection of used packages and recycling technologies [19].
For the soft drinks industry, the most popular alternatives to PET bottles are aluminium cans and glass bottles. Clearly, the former are closer to plastic ones, as far as ease of consumption and littering are concerned, while the latter seem more environmental-friendly as they can be re-filled and reused. However, the collection of used bottles and their return to be refilled is not very convenient for individual consumers, so currently they seem more appropriate for professional use. In a survey conducted by de Feo et al. [13], it was found that, in general, in terms of environmental sustainability, glass bottles perform better than aluminum cans and plastic bottles, under specific circumstances. This is a disputable generalization as different studies in different application domains and in varying spatial and temporal contexts indicated different results. The majority of the studies employ, in one way or another, Life Cycle Assessment (LCA) which is used for quantifying the environmental impacts of packaging throughout the life cycle of various artefacts, thus providing an objective way to assess and propose effective solutions that contribute to the mitigation of their environmental impacts [20]. LCA is commonly used for eco-design during initial product package development [21], but also in order to identify the most undesirable environmental aspects in packaging already used, and improve them [22].
A number of studies have been conducted for the environmental performance of glass bottles and their comparison with plastic ones in different contexts. Amienyo et al. [23,24] found that the climate change impacts of a glass beverage bottle reused three times are comparable to a single used PET or aluminum package. However, if the PET bottles have 60% reusable content (recycled plastic), reuses need to be increased to twenty. Similar results, i.e., the environmental impacts of the two materials are comparable as the number of glass bottles reuses increases and the percentage of recyclable plastic decreases, were reported in other studies [22]. Tua et al. [25] examined the moderating factor of transportation distance and found that, for a certain range, the number of reuses needed to be incremented proportionally to distance to be comparable with PET. Comparing the impacts of reusable PET bottles with glass ones, glass bottles reused 20-25 times seem comparable to PET ones used around 15 times. Transportation distance is again a mediating factor [26]. End of life management (for instance plastic open-burning) is also an issue that can shift environmental impact results towards reusable glass bottles [27]. The same patterns of results were found for wine packaging (sparkling and non-sparkling) [28,29,30].
Rarely companies use a single packaging alternative and environmental impacts depend on the operational conditions within companies and their supply chains. Hence, it is more important, instead, or in addition to, simple static LCA assessments of individual packaging alternatives to assess the impact of the packaging choices of firms in their specific operational context. Defining and assessing scenarios of different mixtures of packaging alternative in different operational/logistic conditions would be of high value to soft drinks companies because it can provide suggestions for improvement activities that reduce packaging environmental footprint. Our study is a step in this direction with the limitation that only environmental and not economic assessment was carried out.
Hence, in this paper, our main aim is not to compare the environmental performance of PET plastic bottles for soft drinks with glass ones in vitro. We concentrate on the process of assessing different packaging and recycling strategies for better environmental performance in the specific context of operational improvement of a soft drinks manufacturer. We explore the environmental performance of the two packaging media in the context of specific product mixes and different recycling strategies under different scenarios of cyclical supply chain operations, taking into account varying conditions of demand. We rely on real reference data of large soft drinks producer in Greece, and we initially perform LCA analysis for the two packaging media for two different contents (carbonated and non-carbonated non-alcoholic drinks) and for different percentages of recycled materials (rPET for the case of PET bottles). Glass is indifferent to content, but PET bottles for carbonated content need to have different specifications from those for non-carbonated ones. Following LCA for each packaging option, we estimate the environmental burden for the two packaging solutions in a 3-year basis, taking into account different glass bottle reuse possibilities (number of reuses) and different empty bottle return rates (percentages). We carry out this analysis taking into account operational/logistic characteristics and by using a discrete-event simulation model of the two media logistical processes corresponding to their life cycles in the context of the specific company. Discrete-event simulation captures the dynamics of the logistic network, while LCA provides environmental assessment for individual artefacts, such as packages, that circulated in the network.
The rest of the paper is organized as follows: First, by analyzing the related processes, we determine the variables (environmental aspects) and their values to be used in the LCA of the three alternative packaging options. The case company’s processes and data are taken into account. Next, the two-stage research methodology used is presented: first, the LCA calculations for the three packaging options carried out, at the single bottle level, and then the discrete-event simulation model developed with its context and assumptions. The analytic presentation of the results of the simulations follows. The paper concludes by discussing the results and by drawing the conclusions of the research.
2. Materials and Methods
In general, LCA is performed for a single product unit along the value chain, from the point of raw materials extraction to the final disposal of the product. Independent of the constituting material, for the case of soft drinks packaging, the value chain can be considered as consisting of four stages, or macro activities, which have significant effects on the natural environment: production of bottles, bottling operations, transportation/distribution and use/consumption/ disposal. The latter can be decomposed into its constituent parts for more detailed analysis. When recycling, or reuse, takes place, such as in the cases of returnable glass bottles and rPET, the reverse logistic path is (or, can) also (be) taken into account. Basic/conventional LCA considers these activities as being relatively independent for a unit of (each) product, aggregating and distributing scale effects (such as percentage of glass bottles that are returned for refilling) to the product unit data [31]. Recycled packaging re-enters the system as negative contribution to the environmental impact of new material/packaging. However, in parallel with such LCA studies, consideration to larger production lots, over longer time horizons of distribution and consumption, has also been given by various scholars [25]. In line with such studies, in this paper, we adopt a systems perspective, considering production and consumption volumes along the supply chain, inevitably over longer time horizons. For the case of glass bottles, this supply chain has the form and characteristics of closed loop supply chain, or logistics network [32]. Before a supply-chain consideration, we look closer at the individual stages/activities relying on case/reference data of the largest domestic soft drinks producer in Greece.
2.1. The Case Company and Its Activities
The company is located in the geographical region of Peloponnese and is one of the largest producers of soft drinks in Greece. It has a bottling capacity of 85 million units per year. Around 88% of its total production is bottled in PET bottles, while in the remaining 12% glass bottles are used as containers. The company operates a production line for PET bottles using PET granules as raw material, while glass bottles are supplied by a local supplier. The product range of the reference case company includes carbonated and non-carbonated soft drinks in PET bottles with a capacity of 330 mL, 500 mL and 1500 mL and carbonated and non-carbonated soft drinks in glass bottles with a capacity of 330 mL. In the company, 89% of all products produced are carbonated or carbonated soft drinks bottled in PET and glass bottles with a capacity of 330 mL. As a result, this study focuses on 330 mL bottles.
At the time of the study, every new glass bottle consisted of 70% recycled glass and 30% new glass composition (Table 1). The weight of every such glass bottle is 196 g and the energy consumed to produce one bottle is equal to 208.3 Wh. A percentage of glass bottles, after their use, are returned to the company, where, after washing, they are refilled. In a glass bottle the above process can be repeated six times, so each glass bottle used can be used for bottling a total of seven times. After six reuses there are superficial lesions in bottles (emulsions, etc.) and they have to be discarded. The minimum required number of reuses of bottles to achieve sustainability targets is variable and directly dependent on their travel distance (from industry to consumer) [25,26].
Washing a returnable glass bottle requires: 8.6 Wh, 300 mL of water at 90 ⁰C and 8.6 mL of 50% caustic soda solution. Then, after a stage of quality control, washed returned bottles enter the bottling line. The energy and chemical elements used for washing each single bottle are shown in Table 2.
Regarding PET bottles, in the specific reference case, PET beans are made of 8% recycled PET (r-PET) and 92% virgin PET. In order to comply with the European Directive on plastic [8], the company’s goal is to increase the percentage of recycled PET in the next few years. Bottles intended for carbonate-free soft drinks weigh 18.9 g, while bottles intended for carbonated soft drinks weigh 23.3 g and the energy consumed to produce one bottle in both cases is 38.91 Wh. After their use, PET bottles are recycled at a rate of 34%, of which 8% is converted back into PET granules for the production of new bottles. The remaining is used in other applications, not related to food or drink packaging.

Table 1.
Glass bottle composition.
| Material | Type | Weight (g) |
|---|---|---|
| Silica sand | SiO2 | 144,45 |
| Soda ash | Na2CO3 | 31,36 |
| Calcium carbonate | CaCO3 | 10,19 |
| Potassium oxide | K2O | 0,98 |
| Magnesium oxide | MgCO3 | 7,06 |
| Aluminum oxide | Al2O3 | 1,96 |
| Total | 196,00 |
Table 2.
Inputs and outputs of the washing process of returnable glass bottles, per glass bottle (data for the specific case study).
Table 2.
Inputs and outputs of the washing process of returnable glass bottles, per glass bottle (data for the specific case study).
| Category | Quantity | Unit |
|---|---|---|
| Input | ||
| Electricity | 8,60 | Wh |
| Water | 0,30 | L |
| Detergent (50% caustic soda solution at 90 ⁰C) | 8,60 | mL |
| Output | ||
| Effluent | 0,30 | L |
Figure 1 and Figure 2 below depict input-output diagrams for the production processes of glass and PET bottles, respectively.
In the soft drinks bottling process, with or without carbonate, in glass containers, bottles enter the bottling line where they are filled with soft drinks of different flavors (1st packaging stage). Then, an aluminum stopper is inserted and a plastic label is glued (1st packaging stage). Next is the packaging in six-packs using plastic film (2nd packaging stage). In the final stage of packaging, six-packs are stacked on wooden pallets (3rd packaging stage). A cardboard sheet is inserted between layers to guarantee stability (3rd packaging stage). Each pallet carries a total of 1944 bottles. In the final stage, pallets are wrapped with a plastic film (3rd packaging stage), so that can be transported easily and safely, and that their overturning is avoided. The energy consumed in the above processes is 30.06 Wh per bottle. Every pallet weighs 1059.64 kg. Pallets are then transported from the factory to the distribution center over a distance of 150 km by 16-32 ton Euro 5 trucks, and then from the distribution center to retailers over an average distance of 35 km by 3.5-7.5 ton Euro 5 trucks (data from the bottling industry). Used bottles are returned from retailers to the distribution center and then to the bottling plant (total 185 km) in 16-32 ton Euro 5 trucks. The weight of the pallet with returnable bottles is 418.12 kg. Table 3 shows the weights of packaging materials per bottle.
As far as plastic bottles are concerned, the bottling process of carbonated soft drinks commences with the arrival of bottles in the bottling line and their automatic their filling. A high-density HDPE stopper is then inserted and a plastic label is glued in every bottle (1st packaging stage). Next is the packaging in six-packs using a plastic film (2nd packaging stage). At the final stage of packaging, six-packs are stacked on wooden pallets (3rd packaging stage), where cardboard is used to separate layers (3rd packaging paper tray stage). Each pallet carries a total of 1944 bottles. Finally, pallets are wrapped with plastic film (3rd packaging stage). The energy consumed for the above processes is 20.11 Wh per flask. The weight each pallet, carrying 1944 bottles of carbonated soft drinks is 725.56 kg. So, due to reduced weight, fuel consumption in transport is significantly less compared to glass packaging. The pallets are then transported from the factory to the distribution center and then from the distribution center to the retailers in the same way as in the case of glass bottles.
The same procedures are followed in bottling carbonate-free soft drinks in PET bottles. The only difference is the weight of pallets, which is 716.42 kg, so fuel consumption is a little less (insignificant) compared to transporting pallets of carbonated soft drinks. Table 4 depicts the weights of constituents per bottle for both carbonated and non-carbonated drinks, whereas Table 5 depicts the products’ distribution/transport data.
Table 3.
Weights per bottle for glass packaging, for bottling carbonated and non-carbonated soft drinks (330 mL per bottle).
Table 3.
Weights per bottle for glass packaging, for bottling carbonated and non-carbonated soft drinks (330 mL per bottle).
| Steps | Packaging Component | Weight (g) |
|---|---|---|
| 1st Packaging | Glass bottle | 196.00 |
| Aluminum cap | 1.59 | |
| PE label | 0.54 | |
| Glue | 2.00 | |
| 2nd Packaging | Film PE | 1.83 |
| 3rd Packaging | PE stretch film | 0.17 |
| Cardboard sheet | 1.63 | |
| Wood pallet | 11.32 | |
| Total | 215.1 |
Table 4.
Weights per bottle for 330 mL PET bottle, for bottling carbonated and non-carbonated soft drinks.
Table 4.
Weights per bottle for 330 mL PET bottle, for bottling carbonated and non-carbonated soft drinks.
| Packaging Component |
PET bottle for carbonated soft drinks | PET bottle for non-carbonated soft drinks | |
|---|---|---|---|
| Steps | Weight (g) | Weight (g) | |
| 1st Packaging | PET bottle | 23.30 | 18.90 |
| Cap HDPE | 2.35 | 2.05 | |
| PE label | 0.55 | 0.55 | |
| Glue | 2.00 | 2.00 | |
| 2nd Packaging | Film PE | 1.92 | 1.92 |
| 3rd Packaging | PE stretch film | 0.17 | 0.17 |
| Cardboard sheet | 1.63 | 1.63 | |
| Wood pallet | 11.32 | 11.32 | |
| Total | 43.20 | 38,50 |
Table 5.
Distribution/transport data for glass and PET bottles.
| Packaging System |
First distribution1 | Second distribution2 | Returnable bottles |
|---|---|---|---|
| kgkm | kgkm | kgkm | |
| Glass bottle | 81.8 | 19.1 | 39.8 |
| PET bottle for carbonated soft drinks | 56.0 | 13.1 | |
| PET bottle for non-carbonated soft drinks | 55.3 | 12.9 |
Figure 3 and Figure 4 show the flow diagrams of the processes carried out in the bottling firm, during the production of soft drink bottles for glass and PET bottles, respectively.
Industry provided data for a full calendar year (2022) indicated that 2,867,400 new glass bottles were used to bottle 10,245,300 soft drinks of various flavors. This practically means that each new glass bottle was bottled 3.57 times (once as a new bottle and 2.57 times as a reusable/returnable bottle). This indicates that only a percentage of glass bottles are returned to the company. Some of them are discarded after the first, or consecutive uses (mainly by household consumers), but some may have been returned up to six (6) times. The number of reuses is a critical parameter for assessing the packaging lifecycle and consumer behavior has a direct influence on collection systems, as demonstrated by the study by Simon et al. [25]. Usually, beyond six returns, the company cannot use them as there are observable alterations. However, as technology advances new glass bottles are available which allow for more reuse cycles without problems [19].
2.2. Methodology
2.2.1. LCA Calculations
We followed a two-stage methodology. First, using the information and analysis of Section 2.1, static LCA assessment was accomplished for the three packaging options: glass, PET for carbonated drinks and PET for non-carbonated drinks. The data were collected from the glass bottle manufacturer that supplies the case company, as well as from the case company, which also manufactures PET bottles. Additional data and factor values for the case of Greece were obtained from the literature [33,34,35,36,37,38,39,40,41,42,43,44]. Data were input into the SimaPro 8 software for performing Life Cycle Assessment (LCA and for determining the most adverse environmental impact categories defined by the ReCiPe 2016 method [45]. ReCiPe provides a harmonized implementation of cause-effect pathways for the calculation of both midpoint and endpoint characterization factors [46]. According to this method, the total environmental impact categories studied are eighteen at midpoint level, which are reduced to three at endpoint level. The results obtained are based on the evaluation method ReCiPe 2016 Midpoint (H)/ Endpoint (H) in a hierarchical perspective. For transportation activities, the Ecoinvent v.3 database was used.
Initial explorative LCA calculations, again for all three packaging options, at the level of single bottle, along the four life cycle stages (production of bottles, bottling, distribution/transportation, and disposal), indicated the six categories with the highest environmental impact. These were: global warming (g CO2 eq), fine particulate matter (FPM) formation (mg PM2.5 eq), terrestrial acidification (mg SO2 eq), terrestrial ecotoxicity (g 1.4-DCB), human non-carcinogenic (HNC) toxicity (g 1.4-DCB) and fossil resource scarcity (FRS) (g oil eq). It should be noted that storage and use at the end customer are not considered explicitly as, beyond the difficulties involved in assessment [47], they are beyond the control of the company. They were assumed to be constant for all packaging options. The values determined and used in the second stage of the methodology are shown in the tables in section 2.2.2. Different percentages of recycled PET are reflected in different values of aspects in the “Disposal” stage. These data were obtained from midpoint analysis.
The six environmental aspects that most affect the endpoint outcome were analyzed and the sources that cause them were identified in order to prioritize them and investigate if and how much they can be improved. Table 6 below shows the comparative results of the three different packaging choices for the specific company, at the bottle level, assuming an average of 3.57 (re)uses for glass bottles, for the six worst midpoint impact categories of ReCiPe 2016 (H) hierarchical perspective.
Following, an analysis per stage in the value chain concluded that, as far as the impact of Global Warming is concerned, for the case of PET bottles, it seems to be an important factor in the production of bottles, whereas for glass bottles it has a reduced impact in the same activity due to the reuse of bottles. In bottling operations, the worst choice is the glass bottle, mainly due to the process of washing the returned bottles. Regarding distribution/transportation, in the case of PET bottles, values are 50% lower than the value for glass bottles due to their lower weight.
Regarding the environmental aspect of Fine Particulate Matter Formation PM2.5, a significant reduction of the burden was observed in the case of glass bottle (15% in total), due to the recycling reflected in the disposal values. Otherwise, it would be prohibitive to use this packaging option. In the environmental aspects of Terrestrial Acidification and Terrestrial Ecotoxicity, the impact of the use of detergents for washing reusable glass bottles is reflected in the plant operation (bottling) parameter. The values of the Terrestrial Ecotoxicity aspect depend on the distribution/transportation, and since the weight of glass bottles is significantly greater than the corresponding weight of pallets carrying PET bottles, we see that the value of this factor is 100% greater than in the case of glass bottles. The Human Non-carcinogenic Toxicity (HNC) aspect is adversely affected by the processes that take place during the glass recycling stage and this is illustrated by the positive and very high value of the disposal factor in the case of glass bottle packaging. The positive element of recycling (not reuse) is the gain in resources that are used as raw material again to produce new glass bottles, but we cannot avoid the stage of processing the raw material to create the bottle, which gives us this unfavorable result. Finally, regarding the environmental aspect of Fossil Resources Scarcity (FRS), it was observed that PET bottles perform worse than glass bottles. This is because in the case of the glass bottle there is a large percentage of positive contribution to the disposal factor which stems from the correspondingly large percentage of recycling/reuse.
In general, the midpoint level is used in order to identify the most adverse impact categories by making comparisons. It also facilitates the comparison of impacts of operations’ policies at specific contexts, as in our case, where absolute, detailed values are not necessary. For a complete picture of impacts one must refer to the cumulative effect of the eighteen categories of the midpoint level, according to the application of the LCA method. This result is illustrated in the Endpoint level as depicted below for the case of 3.57 and 7 reuses of glass bottles, in Table 7 and Table 8, respectively.
2.2.2. Discrete Event Model Construction
In the second stage, a discrete event simulation model of the soft drinks supply chain was developed. A block diagram of the model is depicted in Figure 5. Blocks in bold lines indicate the activities/stages for which LCA data from the first stage of the methodology were used (as in Table 6). In order to facilitate simulation and keep simulation running times at reasonable ranges, items flowing through the model were palettes of bottles (rather than individual bottles). Hence, LCA data were transformed from the unit of single bottle to palette (values for single bottles multiplied by 1944) (Table 9, Table 10, Table 11 and Table 12).
As a discrete-event model, the model assumes a “push” operation, i.e., customer orders trigger the different activities/stages of the model and push items (pallets) in the consecutive stages of the value chain. Demand is generated (“arrives”) at specific time intervals that follow a normal distribution with parameters varying according to the month of the year. The distribution parameters were determined by fitting company demand data (mean values) and by “translating” it to inter-arrival time intervals. The standard deviations were set to 10% of the mean values. The aggregated demand data were then rationed according to the demand for specific packaging options (glass, carbonated and non-carbonated). Initial rationing was also according to the company-supplied data (percentages of 14:70:16, for the three options above, respectively). Hence, in the model, once demand was generated, orders followed one of the three possible paths in that analogy.
Orders for carbonated and non-carbonated PET bottles followed open loop paths, consisting of the aforementioned stages: production of bottles, bottling operations, distribution and use, and disposal. In the model, the cycle time of every stage was also distributed normally and was approximately equal to the average time interval between orders (mean 0.01 days and standard deviation 0.001 days for all stages, with the exception of the return transportation which was distributed normally with parameters (0.015; 0.005) to account for the collection delay). This was a sought after operation by the case company as it was aiming at subscribing to the principles of lean manufacturing (takt time rate-based production of minimal inventories) [48]. At the time of the study, in the company there were efforts towards lean-six sigma operations [49]. In simulations, scenarios of varying demand were accomplished by varying the inter-arrival periods. Table 13 depicts the inter-arrival intervals for the three main demand scenarios: normal, increased by 30%, and increased by 30% during the summer months (May to September).
The environmental impact of each stage in the six categories depicted above was inscribed in the model. Impact values were accumulated as pallets were flowing through the stages, and total values were recorded at the end of every simulation run. The impact of the distribution activity was calculated according to the specific distance assumed. In the simulations presented in the paper, a total distance of 185Km was used.
Orders for glass packaging followed a closed loop path. Two sets of values were used for this packaging option, in two distinct paths: one for the initial use of bottles that included bottle production and one for the reuse of empty bottles that excluded this activity and included the washing of used bottles. According to the maximum allowed reuse value, bottles re-entered the system (were returned) or were disposed. Of those pallets “eligible” for reuse, only a percentage was actually returned and re-entered the system. New bottles entered the system only if used bottles were not available. Scenarios with different maximum reuse values and return rates were executed and evaluated. All scenarios were evaluated over a time period of three years (1080 days).
Table 13.
Mean inter-arrival times for different values of demand (days).
| Month | Initial demand | Increased demand by 30% | Increased demand by 30% in summer |
|---|---|---|---|
| 1 | 0,01657 | 0,01159 | 0,01657 |
| 2 | 0,01583 | 0,01108 | 0,01583 |
| 3 | 0,00879 | 0,00615 | 0,00879 |
| 4 | 0,00781 | 0,00547 | 0,00781 |
| 5 | 0,00882 | 0,00617 | 0,00617 |
| 6 | 0,00694 | 0,00486 | 0,00486 |
| 7 | 0,00580 | 0,00406 | 0,00406 |
| 8 | 0,00702 | 0,00492 | 0,00492 |
| 9 | 0,00798 | 0,00559 | 0,00559 |
| 10 | 0,01171 | 0,00820 | 0,01171 |
| 11 | 0,01329 | 0,00930 | 0,01329 |
| 12 | 0,01245 | 0,00871 | 0,01245 |
3. Simulations, Results and Commenting
The model was developed in the ExtendSim graphical discrete event simulation environment. The model developed was initially validated against firm data, i.e., whether it produced the expected number of products over various time periods. Similarly, the model was checked for consistency regarding the bottles withdrawn after maximum use and those discarded before reuse. Verification by manual calculations for single runs was also carried out.
Every simulation scenario was executed 100 times and 97.5% Confidence Intervals were calculated automatically by the simulation software. In all the analyses mean values (of the 100 runs) were used. Environmental aspect values were accumulated and stored temporarily after each simulation run, before being averaged at the end of the 100 runs.
Given that the firm produces and distributes three types of products regarding bottling materials, i.e., glass, PET for carbonated drinks, and PET for non-carbonated drinks, in addition to other parameters, scenarios with different analogies of such products were assessed for the six aforementioned environmental aspects.
3.1. The Effect of Different Percentages of Returned Glass Bottles
Figure 7 depicts the effect of different percentages of returned glass bottles for different analogies of glass and PET bottles (for carbonated and non-carbonated drinks, respectively). Three different analogies were assessed: the existing 14/70/16 and two additional ones with higher percentages of glass containers, i.e., 30/57/13 and 40/49/11. In all the cases, a maximum of 7 uses for glass bottles was assumed. The results indicate, as expected, that as the number of glass bottles increases, and the percentage of returned bottles increases, total Global Warming is reduced. It seems that there is a deflection point around 80% return rate, after which the impact of this aspect improves significantly. Glass bottle return rates higher than 85%, in product mixes with increased percentage of glass bottles (40%), become the best choice as far as this aspect is concerned. In all aspects with the exception of Terrestrial Ecotoxicity and Fossil Resource Scarcity a trend was observed in which product mixes with high percentages of glass bottles perform worse. Things improve as the return rate is increased. In all cases, Terrestrial Ecotoxicity values increase as the number of returned glass bottles increases. As it was already indicated, this is because of the use of detergents in the washing of the bottles returned. Fossil Resource Scarcity exhibits the opposite trend, i.e., glass dominated mixes perform better, due to the glass bottles reuse.
3.2. The Effect of Using Recycled PET in New Plastic Bottles
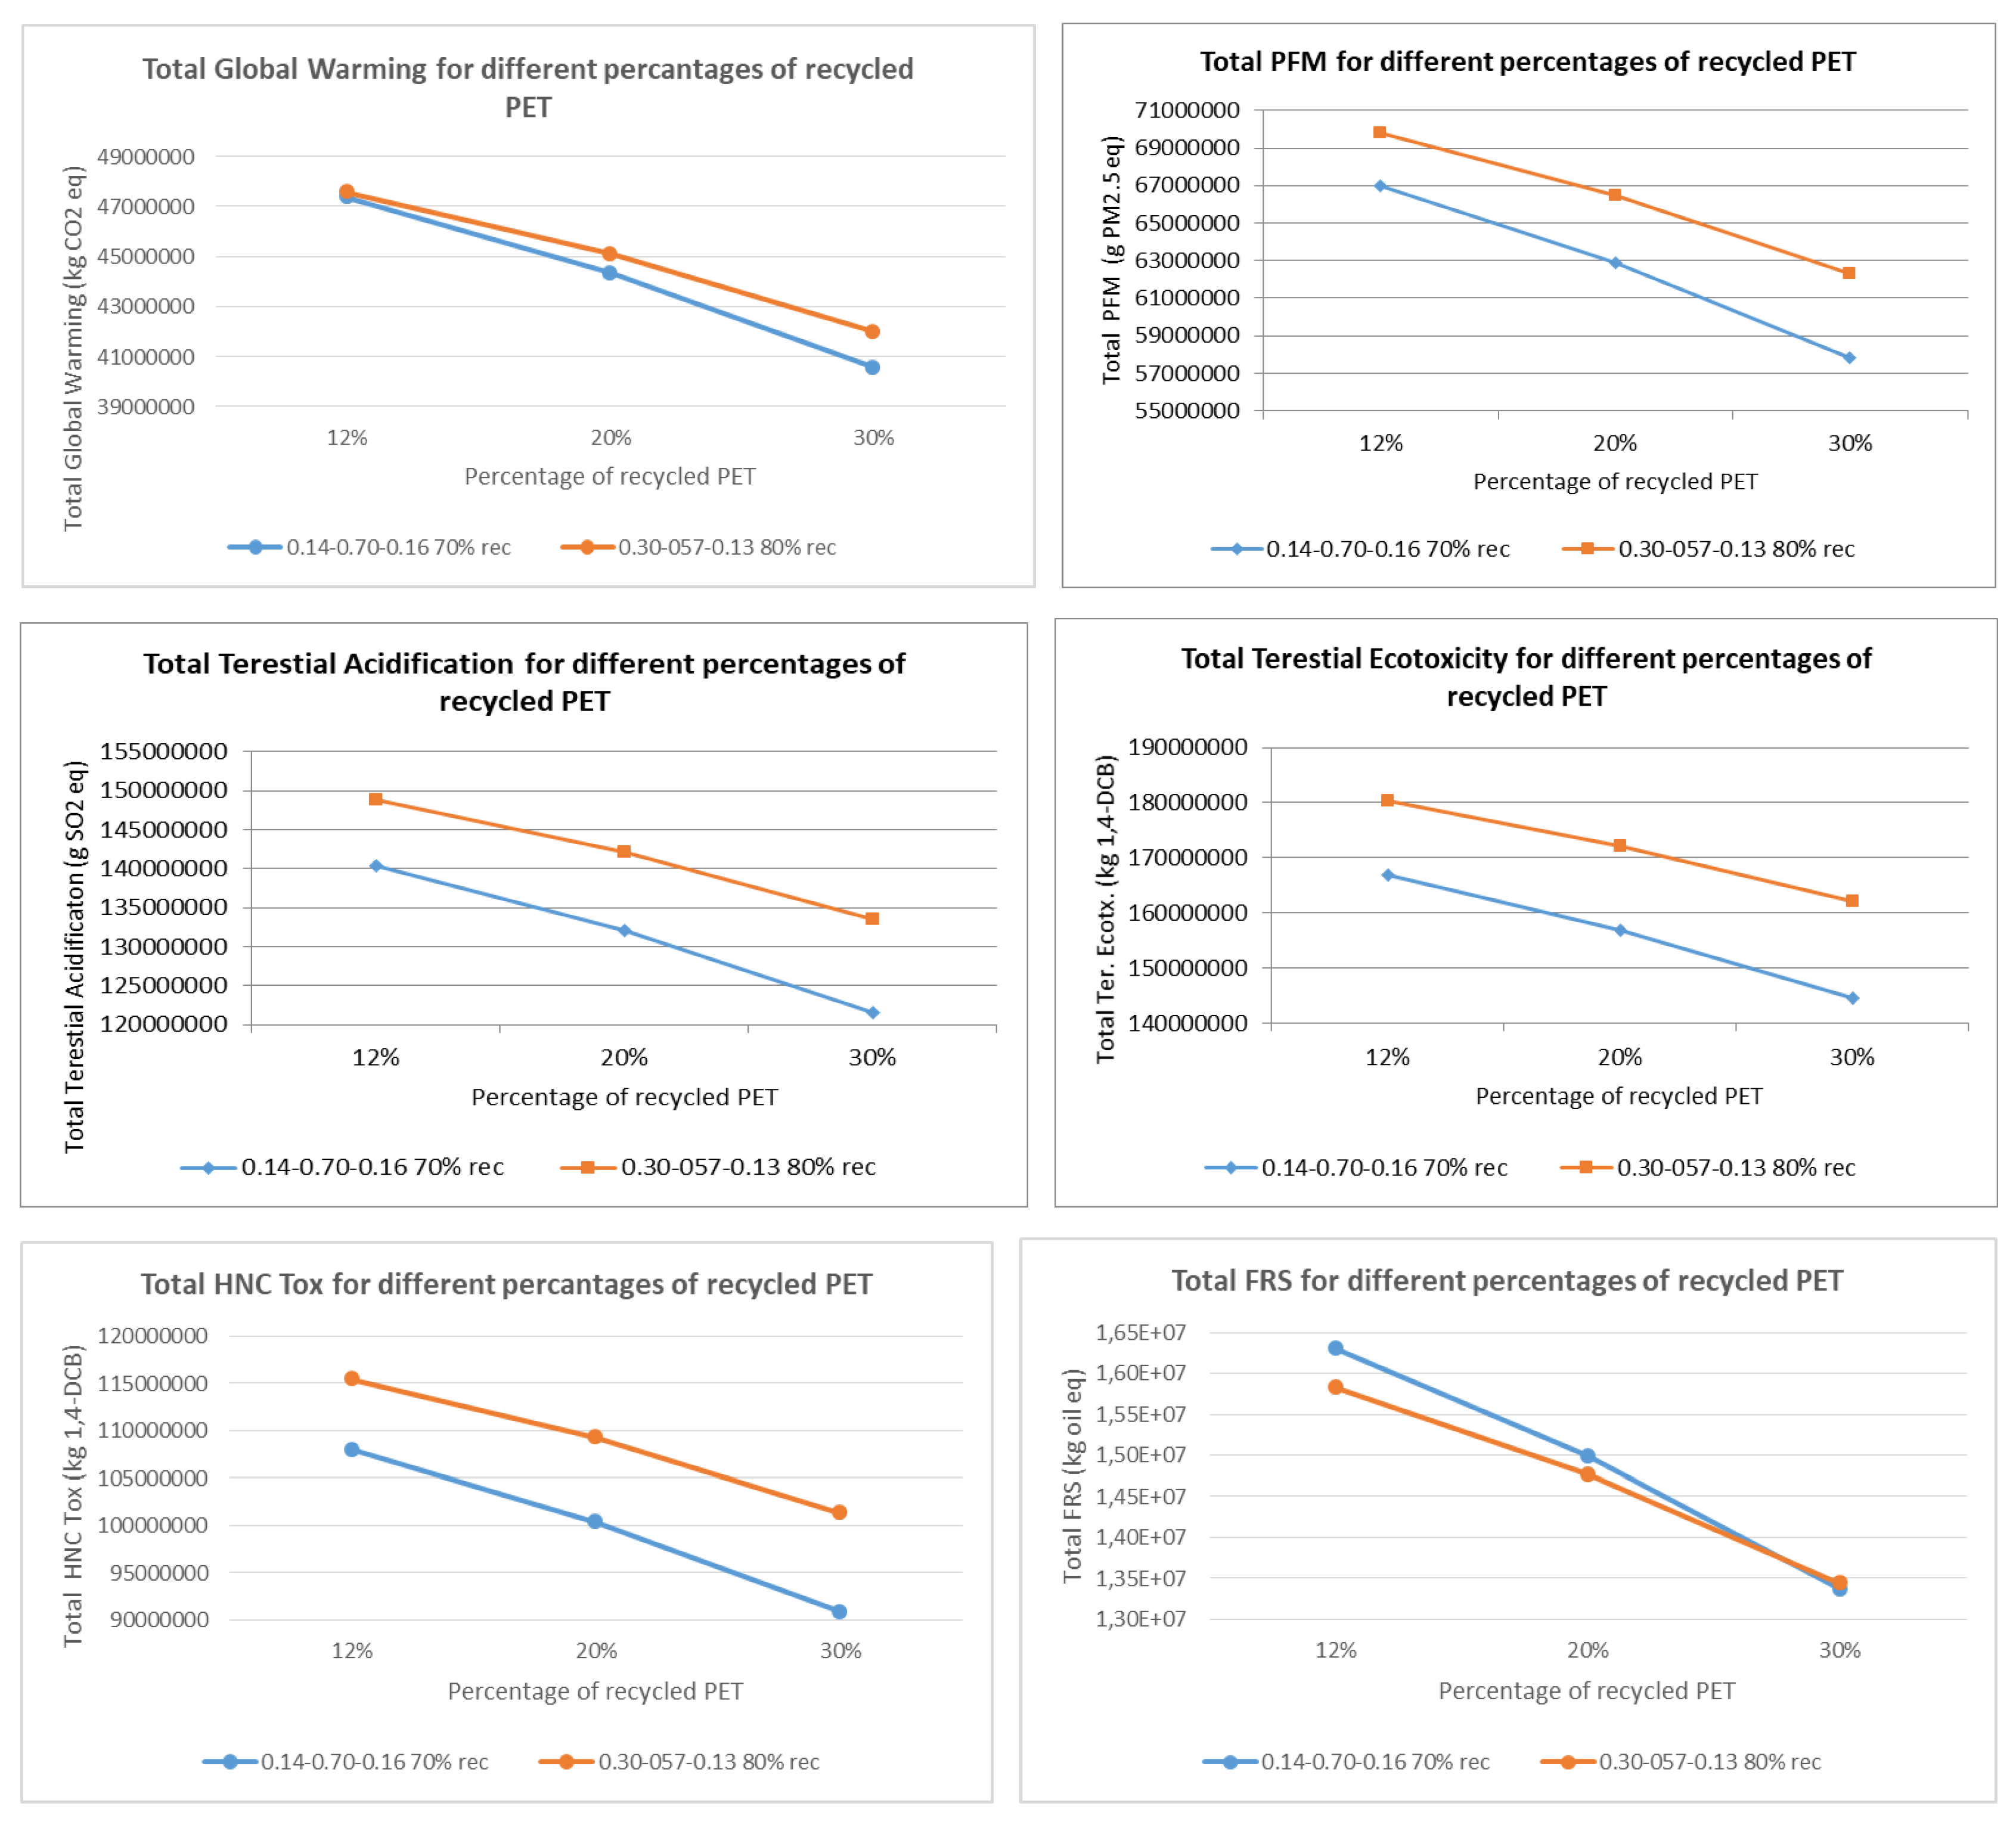
For many, recycled PET seems a promising solution for mitigating the negative environmental impacts of plastics [50]. So, a number of scenarios were simulated to examine the effect of increasing the percentage of rPET in plastic bottles. Three alternative possibilities were assessed for the participation of recycled PET in new bottles for both carbonated and non-carbonated drinks: 12%, 20% and 30% (tables 10 and 11). Alternatives were assessed for two different product mixes (14/70/16 and 30/57/13) and for 7 uses of glass bottles). A return rate of 70% for glass bottles was assumed.
The results of the simulations indicate that in all the cases (environmental aspects) increasing the percentage of recycled PET improves the overall environmental performance of packaging in the company. As expected, this is more evident in the product mix vastly dominated by plastic (initial 14/70/16). Again, this trend is reversed in FRS, where only high percentages of recycled plastic seem to outperform a mix with increased glass participation.
Figure 8.
The effect of using recycled PET in new plastic bottles on the six environmental aspects.
3.3. System Response to Varying Demand and Maximum Uses of Returned Glass Bottles
To test the response of the six environmental aspects to varying maximum reuses of glass bottles and variation in demand, two simulation scenarios were assessed against normal operating conditions, for a product mix of increased glass content (30/57/13). In the first scenario, it was assumed a 30% increase in demand for the whole year and a maximum use of 10 cycles for the glass bottles, whereas in the second a 30% increase in demand during the summer years (demand inter-arrival data in Table 13). The aim of the latter experiment was to see if the periodic increase in demand results in an increase in the use of new glass bottles and worsening of the related aspects/metrics. In all the cases, 70% reuse rate was assumed.
The results depicted in Figure 9 suggest that increase in demand, either periodic or permanent, results in worse environmental performance in all aspects. As expected, a periodic increase in demand has lower impact on performance than a permanent one. The negative effects of increased demand are not compensated by increasing the maximum number of glass bottle reuses. The increase in the percentage of glass bottles returned, from 70% to 90%, has a comparatively small impact on the values of the metrics and on the overall environmental performance of the firm.
3.4. Environmental Impact per Bottle Produced
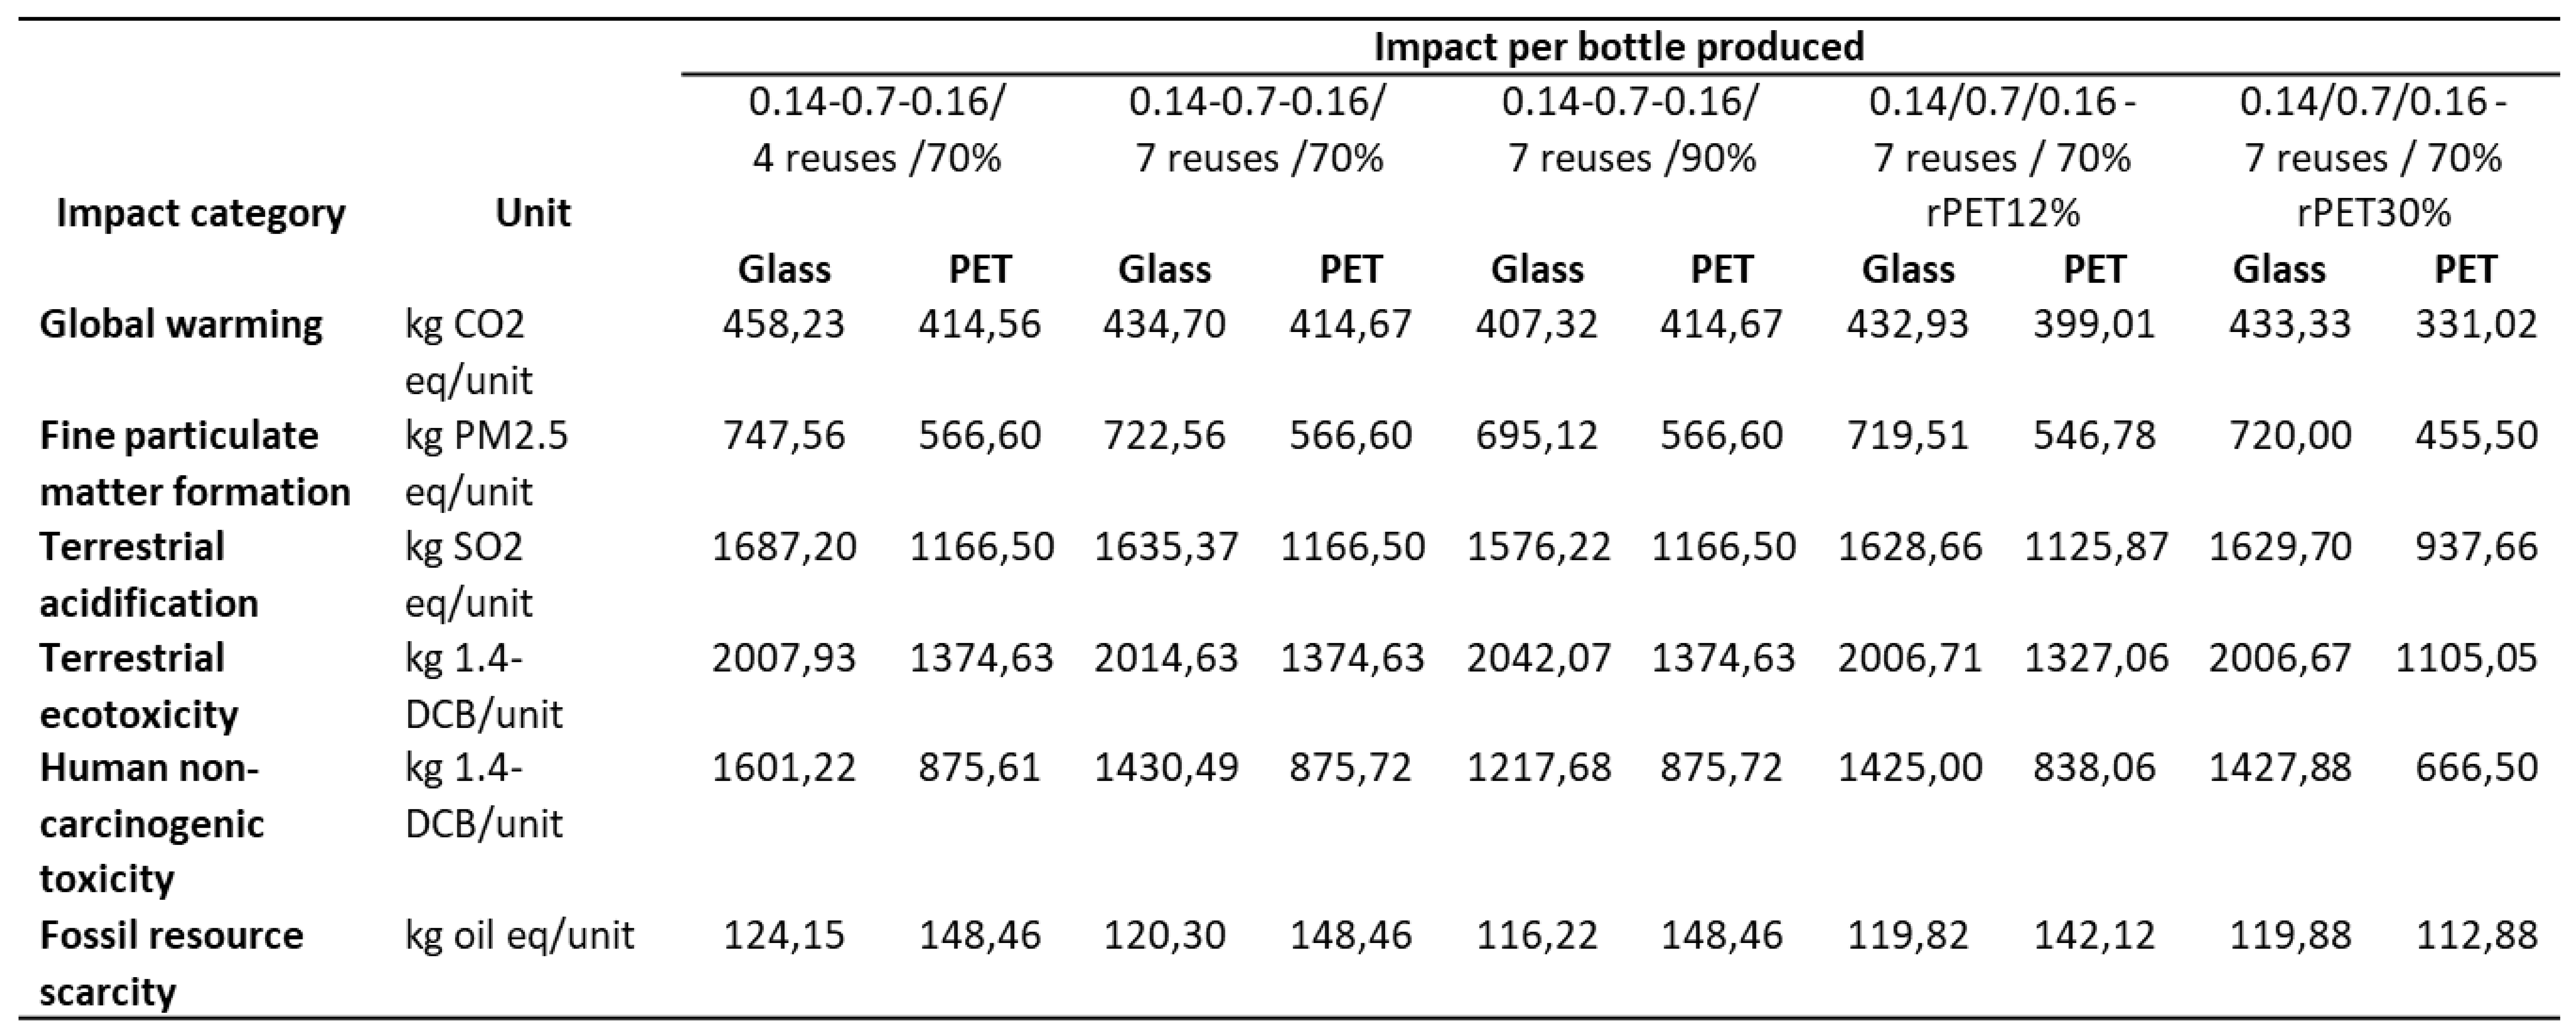
Simulation results were used to assess the environmental impact per bottle of non-alcoholic drink produced for the two packaging materials: plastic and glass. Table 14 shows the results for a number of scenarios simulated. PET includes both carbonated and non-carbonated drinks. PET outperforms glass in all cases with the exception of Global Warming and Fossil Resource Scarcity, when recycled PET is not used, or used in small percentage (12%).
4. Discussion and Conclusions
As it was already indicated, rarely companies use a single packaging alternative for their products and the environmental impacts of packaging options depend on the operational conditions within companies and their supply chains. In this direction, in this paper, first we aimed at showing a systems firm-centered methodology for assessing the environmental impact of the packaging choices of firms in their specific operational context.
Using real LCA data and a discrete-event simulation model we explored the environmental performance of plastic (PET) and glass bottles in the context of specific product mixes and different recycling strategies under different scenarios of cyclical supply chain operations, taking into account varying conditions of demand. We relied on real reference data of a large soft drinks producer in Greece, and we initially performed LCA calculations for the two packaging media for two different contents (carbonated and non-carbonated non-alcoholic drinks) and for various percentages of recycled materials (rPET for the case of PET bottles). Then, using a discrete-event simulation model, we defined, implemented and assessed scenarios of different mixtures of packaging alternatives in different operational/logistic conditions.
Beyond its methodological contribution of our research, the results of the simulation experiments carried out confirmed previously published studies comparing glass and PET bottle use. Regarding environmental performance, glass can be competitive to plastic, especially in the categories of ecosystem and resource protection, if the percentage of returned bottles is high and the number of reuses is increased. These targets become higher as the percentage of recycled PET used in new PET bottles is increased.
The main factors that influenced the results at the single item static LCA seem to dominate the dynamic supply-chain-wide analysis too. For instance, in washing the returned glass bottles, not environmentally friendly chemical detergents and hot water (90°C) are used. To improve these conditions, these detergents could be replaced with biodegradable ones suitable for industrial use by reducing environmental pollution, and/or detergents that do not require such high water temperatures for their action, thus reducing energy requirements. In addition, another action that would give better results in the case of the glass bottle would be to use washing cleaners that during their use are friendlier to the surface and structure of the glass, so as not to create the characteristic lesions (white spots-emulsions) that reduce the number of reuses of the returned bottle. Moreover, developments in transport technologies, in particular the future use of electric trucks, would help to reduce the environmental footprint principally of the heavier glass bottles. Reducing the weight of glass bottles is also a sought after technological target, despite the practical limitations involved.
The above principally concern the glass bottle industry and are not under the direct control of soft drinks producers. What the latter can do, in cooperation with public and other types of organizations (e.g., NGO), is to put more effort in the collection and handling of empty used glass bottles, so very high percentages of bottles are reused. Regarding PET packaging, for which many bottlers, as the case company in the paper, have their own production facilities, setting higher standards for using recycled PET is a more than desired objective. In the scenarios examined in the paper, rather conservative percentages of recycled PET were assumed, because recycling small empty PET bottles (and aluminum cans) is not very easy in areas with small dispersed empty-space consumption points, as in Greece. Consumers should be constantly informed about the significant benefits of recycling, and prompted to do it by providing incentives and setting easy to reach recycling points.
References
- Geyer, R.; Jambeck, R.J; Law, L.K. Production, use, and fate of all plastics ever made. Sci. Adv. 2017, 3 (7), e1700782. [CrossRef]
- Mendes, A.C.; Pedersen, G.A. Perspectives on sustainable food packaging:–is bio-based plastics a solution? Trends in Food Sci. Technol. 2021, 112, 839–846. [CrossRef]
- Pal, M.; Devrani, M.; Hadush, A. Recent developments in food packaging technologies. Beverage Food World 2019, 46, 21–25. https://www.researchgate.net/publication/ 330555330_Recent_developments_in_food_packaging_technologies.
- Tulashie, S.K.; Boadu, E.K.; Dapaah, S. Plastic waste to fuel via pyrolysis: A key way to solving the severe plastic waste problem in Ghana. Therm Sci Eng Prog. 2019(11):417-424. [CrossRef]
- Barnes, D.K.A.; Galgani, F.; Thompson, R.C.; Barlaz, M. Accumulation and fragmentation of plastic debris in global environments. Philos. Trans. R. Soc. 2009, B 364, 1985-1998. [CrossRef]
- Mann, M.E. The New Climate War: The Fight to Take our Planet Back. Scribe Publications: London, UK, 2021.
- Waring, R.H.; Harris, R.M.; Mitchell S.C. Plastic contamination of the food chain: A threat to human health? Maturitas 2018, 115, 64-68.
- Directive (EU) 2019/904 of the European Parliament and of the Council of 5 June 2019 on the reduction of the impact of certain plastic product on the environment. Official Journal of the European Union 2019, L 155, 12.6.2019.
- Grand View Research: U.S. Soft Drinks Market Size, Share & Trends Analysis Report By Product (Carbonated Drinks, Packaged Water, Iced/RTD Tea Drinks, Fruit Beverages, Energy Drinks) And Segment Forecasts, 2018 – 2025, San Francisco, CA (2018).
- FoodDrink Europe: Data & Trends: EU food and drink industry. Brussels (2016).
- ICAP: 40 High Performance Sectors in Greece, Athens Chamber of Industry and Commerce, Athens (2016).
- Mirasgedis, S., Georgopoulou, E., Sarafidis, Y., Papagiannaki, K., Lalas, D.P.: The impact of climate change on the pattern of demand for bottled water and non-alcoholic beverages. Business Strategy and the Environment 23, 272–288 (2014).
- De Feo, G.; Ferrara, C.; Minichini, F. Comparison between the perceived and actual environmental sustainability of beverage packagings in glass, plastic, and aluminium. J. Clean. Prod. 2022, 333, 130158. [CrossRef]
- Ahmad, S.M.; Ahmad, A.S. The impact of polyethylene terephthalate waste on different bituminous designs. Springer 2022, 69:53. [CrossRef]
- Allen, D.; Linsley, C.; Spoelman, N.; Johl, A. The Fraud of Plastic Recycling: How Big Oil and the Plastics Industry Deceived the Public for Decades and Caused the Plastic Waste Crisis. Center for Climate Integrity 2024.
- Duarte, L.T.; e Silva, E.M.P.; Branco, J.R.T.; Lins, V.F.C. Production and characterization of thermally sprayed polyethylene terephthalate coatings. Surf Coat Technol 2004, 182(2-3):261-267. [CrossRef]
- Sarker, M.; Rashid, M.M. Thermal Degradation of Poly (ethylene terephthalate) Waste Soft Drinks Bottles and Low Density Polyethylene Grocery Bags. Intern J Sustain Energy Environ 2013 1(3):78-86. http://www.ijsee.com/IJSEE_VOL.%201,%20NO.%203.
- Lebreton, L.; Andrady, A. Future scenarios of global plastic waste generation and disposal. Palgrave Commun. 2019, 5(1):1-11. [CrossRef]
- Islam, M.D.; Lee, Z.; Shaleh, A.; Soo, H.S. The United Nations Assembly resolution to end plastic pollution: Challenges to effective policy interventions. Env Dev Sustain 2024, 26.
- Guignone, G.; Calmon, L. J.; Vieira, D.; Bravo, A. BIM and LCA integration methodologies: A critical analysis and proposed guidelines. Journal of Building Engineering 2023, 73, 106780. [CrossRef]
- Pauer, E.; Heinrich, V.; Tacker, M. Methods for the Assessment of Environmental Sustainability of Packaging: A review. IJRDO 2017, 3, 6. https://www.ijrdo.org/index.php/ar/article/view/86/75.
- Ferrara, C.; De Feo, G.; Picone, V. LCA of Glass Versus PET Mineral Water Bottles: An Italian Case Study. Recycling 2021, 6, 50. [CrossRef]
- Amienyo, D.; Gujba, H.; Stichnothe, H.; Azapagic, A. Life cycle environmental impacts of carbonated soft drinks. International Journal of Life Cycle Assessment 2013, 18(1), 77-92. [CrossRef]
- Almeida, C.M.V.B.; Rodrigues, A.J.M.; Agostinho, F.; Giannetti, B.F. Material selection for environmental responsibility: the case of soft drinks packaging in Brazil. J Clean Prod 2017, 142, 172-179. [CrossRef]
- Τua, C.; Grosso, M.; Rigamonti, L. Reusing glass bottles in Italy: A life cycle assessment evaluation. Paper presented at the Procedia CIRP 2020. [CrossRef]
- Simon, B.; Amor, M. B.; Földényi, R. Life cycle impact assessment of beverage packaging systems: Focus on the collection of post-consumer bottles. Journal of Cleaner Production 2016, 112, 238-248. [CrossRef]
- Boutros, M.; Saba, S.; Manneh, R. Life cycle assessment of two packaging materials for carbonated beverage (polyethylene terephthalate vs. glass): Case study for the Lebanese context and importance of the end-of-life scenarios. J Clean Prod 2021, 314, 128289. [CrossRef]
- Ponstein, H. J.; Meyer-Aurich, A.; Prochnow, A. Greenhouse gas emissions and mitigation options for German wine production. Journal of Cleaner Production 2019, 212, 800-809. [CrossRef]
- Cleary, J. Life cycle assessment of wine and spirit packaging at the product and the municipal scale: A Toronto, Canada case study. J Clean Prod 2013, 44, 143-151. [CrossRef]
- Ferrara, C.; De Feo, G. Comparative life-cycle assessment of alternative systems for wine packaging in Italy. J Clean Prod 2020, 259, 120888. [CrossRef]
- Stefanini, R.; Borghesi, G.; Ronzano, A.; Vignali, G. Plastic or glass: a new environmental assessment with a marine litter indicator for the comparison of pasteurized milk bottles. International Journal of Life Cycle Assessment 2021, 26(4), 767-784. [CrossRef]
- Ramanathan, U.; He, Q.; Subramanian, N.; Gunasekaran, A.; Sarpong, D. Collaborative closed-loop supply chain framework for sustainable manufacturing: Evidence from the Indian packaging industry. Technol Forcast Soc Change 2023, 191, 122489. [CrossRef]
- IPCC (2013) Climate change 2013: The Physical Science Basis. In: Stocker, T.F.; Qin, D.; Plattner, G.K.; Tignor, M.; Allen S.K.; Boschung, J.; Nauels, A.; Xia, Y.; Bex, V.; Midgley, P.M. (eds). Contribution of working group I to the fifth assessment report of the intergovernmental panel on climate change. Cambridge University Press, Cambridge, p. 1535. [CrossRef]
- WMO (2011) Scientific Assessment of Ozone Depletion: 2010, Global Ozone Research and Monitoring Project-report no.52. World Meteorological Organization, Geneva. https://ozone.unep.org/sites/default/files/2019-05/00-SAP-2010-Assement-report.pdf.
- Frischknecht, R.; Braunschweig, A.; Hofstetter, P.; Suter, P. Human health damages due to ionising radiation in life cycle impact assessment. Environmental Impact Asses Rev (20) 2000, 20:159–189. [CrossRef]
- van Zelm, R.; Preiss, P.; nan Goethem, T.; Van Dingenen, R., Huijbregts, M.A.J. Regionalized life cycle impact assessment of air pollution on the global scale: Damage to human health and vegetation. Atmos Environ 2016, 134:129–137. [CrossRef]
- Roy, P-O.; Azevedo, L.B.; Margni, M.; van Zelm, R.; Deschênes, L.; Huijbregts, M.A.J. Characterization factors for terrestrial acidification at the global scale: A systematic analysis of spatial variability and uncertainty. Sci Total Environ 2014, 500:270–276. [CrossRef]
- van Zelm, R.; Huijbregts, M.A.J.; Van de Meent, D. USES-LCA 2.0-a global nested multi-media fate, exposure, and effects model. Int J Life Cycle Assess 2009, 14(30):282–284. [CrossRef]
- Curran, M.; Hellweg, S.; Beck, J. Is there any empirical support for biodiversity offset policy? Ecol Appl 2014, 24:617–632. [CrossRef]
- Doell, P.; Siebert, S. Global modeling of irrigation water requirements. Water Resour Res 2002, 38:1037. [CrossRef]
- Hoekstra, A.Y.; Mekonnen, M.M. The Water Footprint of Humanity. PNAS 2012, 109:3232–3237. [CrossRef]
- Vieira, M.D.M.; Ponsioen, T.C.; Goedkoop, M.; Huijbregts, M.A.J. Surplus ore potential as a scarcity indicator for resource extraction. J Indus Ecol. 2016. [CrossRef]
- Jungbluth, N.; Frischknecht, R. Cumulative energy demand. In: Hischier R, Weidema B (eds). Implementation of Life Cycle Impact Assessment Methods. Ecoinvent centre 2010, St Gallen, pp. 33–40. https://ecoinvent.org/wp-content/uploads/2020/08/201007_hischier_weidema_implementation_of_lcia_methods.pdf.
- Helmes, R.J.K.; Huijbregts, M.A.J.; Henderson, A.D.; Jolliet, O. Spatially explicit fate factors of phosphorous emissions to freshwater at the global scale. Int J Life Cycle Assess 2012, 17:646–654. [CrossRef]
- Huijbregts, M.A.J.; Steinmann, Z.J.N.; Elshout, P.M.F.; Stam, G.; Verones, F.; Vieira, M.; Zijp, M.; Hollander, A.; van Zelm, R. ReCiPe2016: A harmonised life cycle impact assessment method at midpoint and endpoint Level. Int. J. Life Cycle Assess. 2017, 22, 138–147. [CrossRef]
- Goedkoop, M.; Heijungs, R.; Huijbregts, M.; Schryver, A.D.; Struijs, J.; van Zelm, R. ReCiPe 2008: A life cycle impact assessment method which comprises harmonised category indicators at the midpoint and the endpoint level. First edition 2009, Report I: Characterisation. Ministry of Housing, Spatial Planning and Environment (VROM) 2013, Amsterdam, The Netherlands.
- Gomes, T.S.; Visconte, L.L.Y.; Pacheco, E.B.A.V. Life Cycle Assessment of Polyethylene Terephthalate Packaging: An Overview. J Polym Environ 2019, 27, 533–548.
- Adamides, E.D.; Karacapilidis, N.; Pylarinou, H.; Koumanakos, D. Supporting collaboration in the development and management of lean supply networks. Prod Plan Control 2008, 19:35-52. [CrossRef]
- Brenig-Jones, M.; Dowdall, J. Lean Six Sigma For Leaders: A practical guide for leaders to transform the way they run their organization. 2018, Wiley: Chichester, UK.
- Nardi, P.C.C.; da Silva, R.L.M.; Ribeiro, E.M.S.; de Oliveira, S.V.W.B. Proposal for a methodology to monitor sustainability in the production of soft drinks in Ref PET. J Clean Prod 2017, 151, 218-234.
Figure 1.
Flow chart of glass bottle production plant.
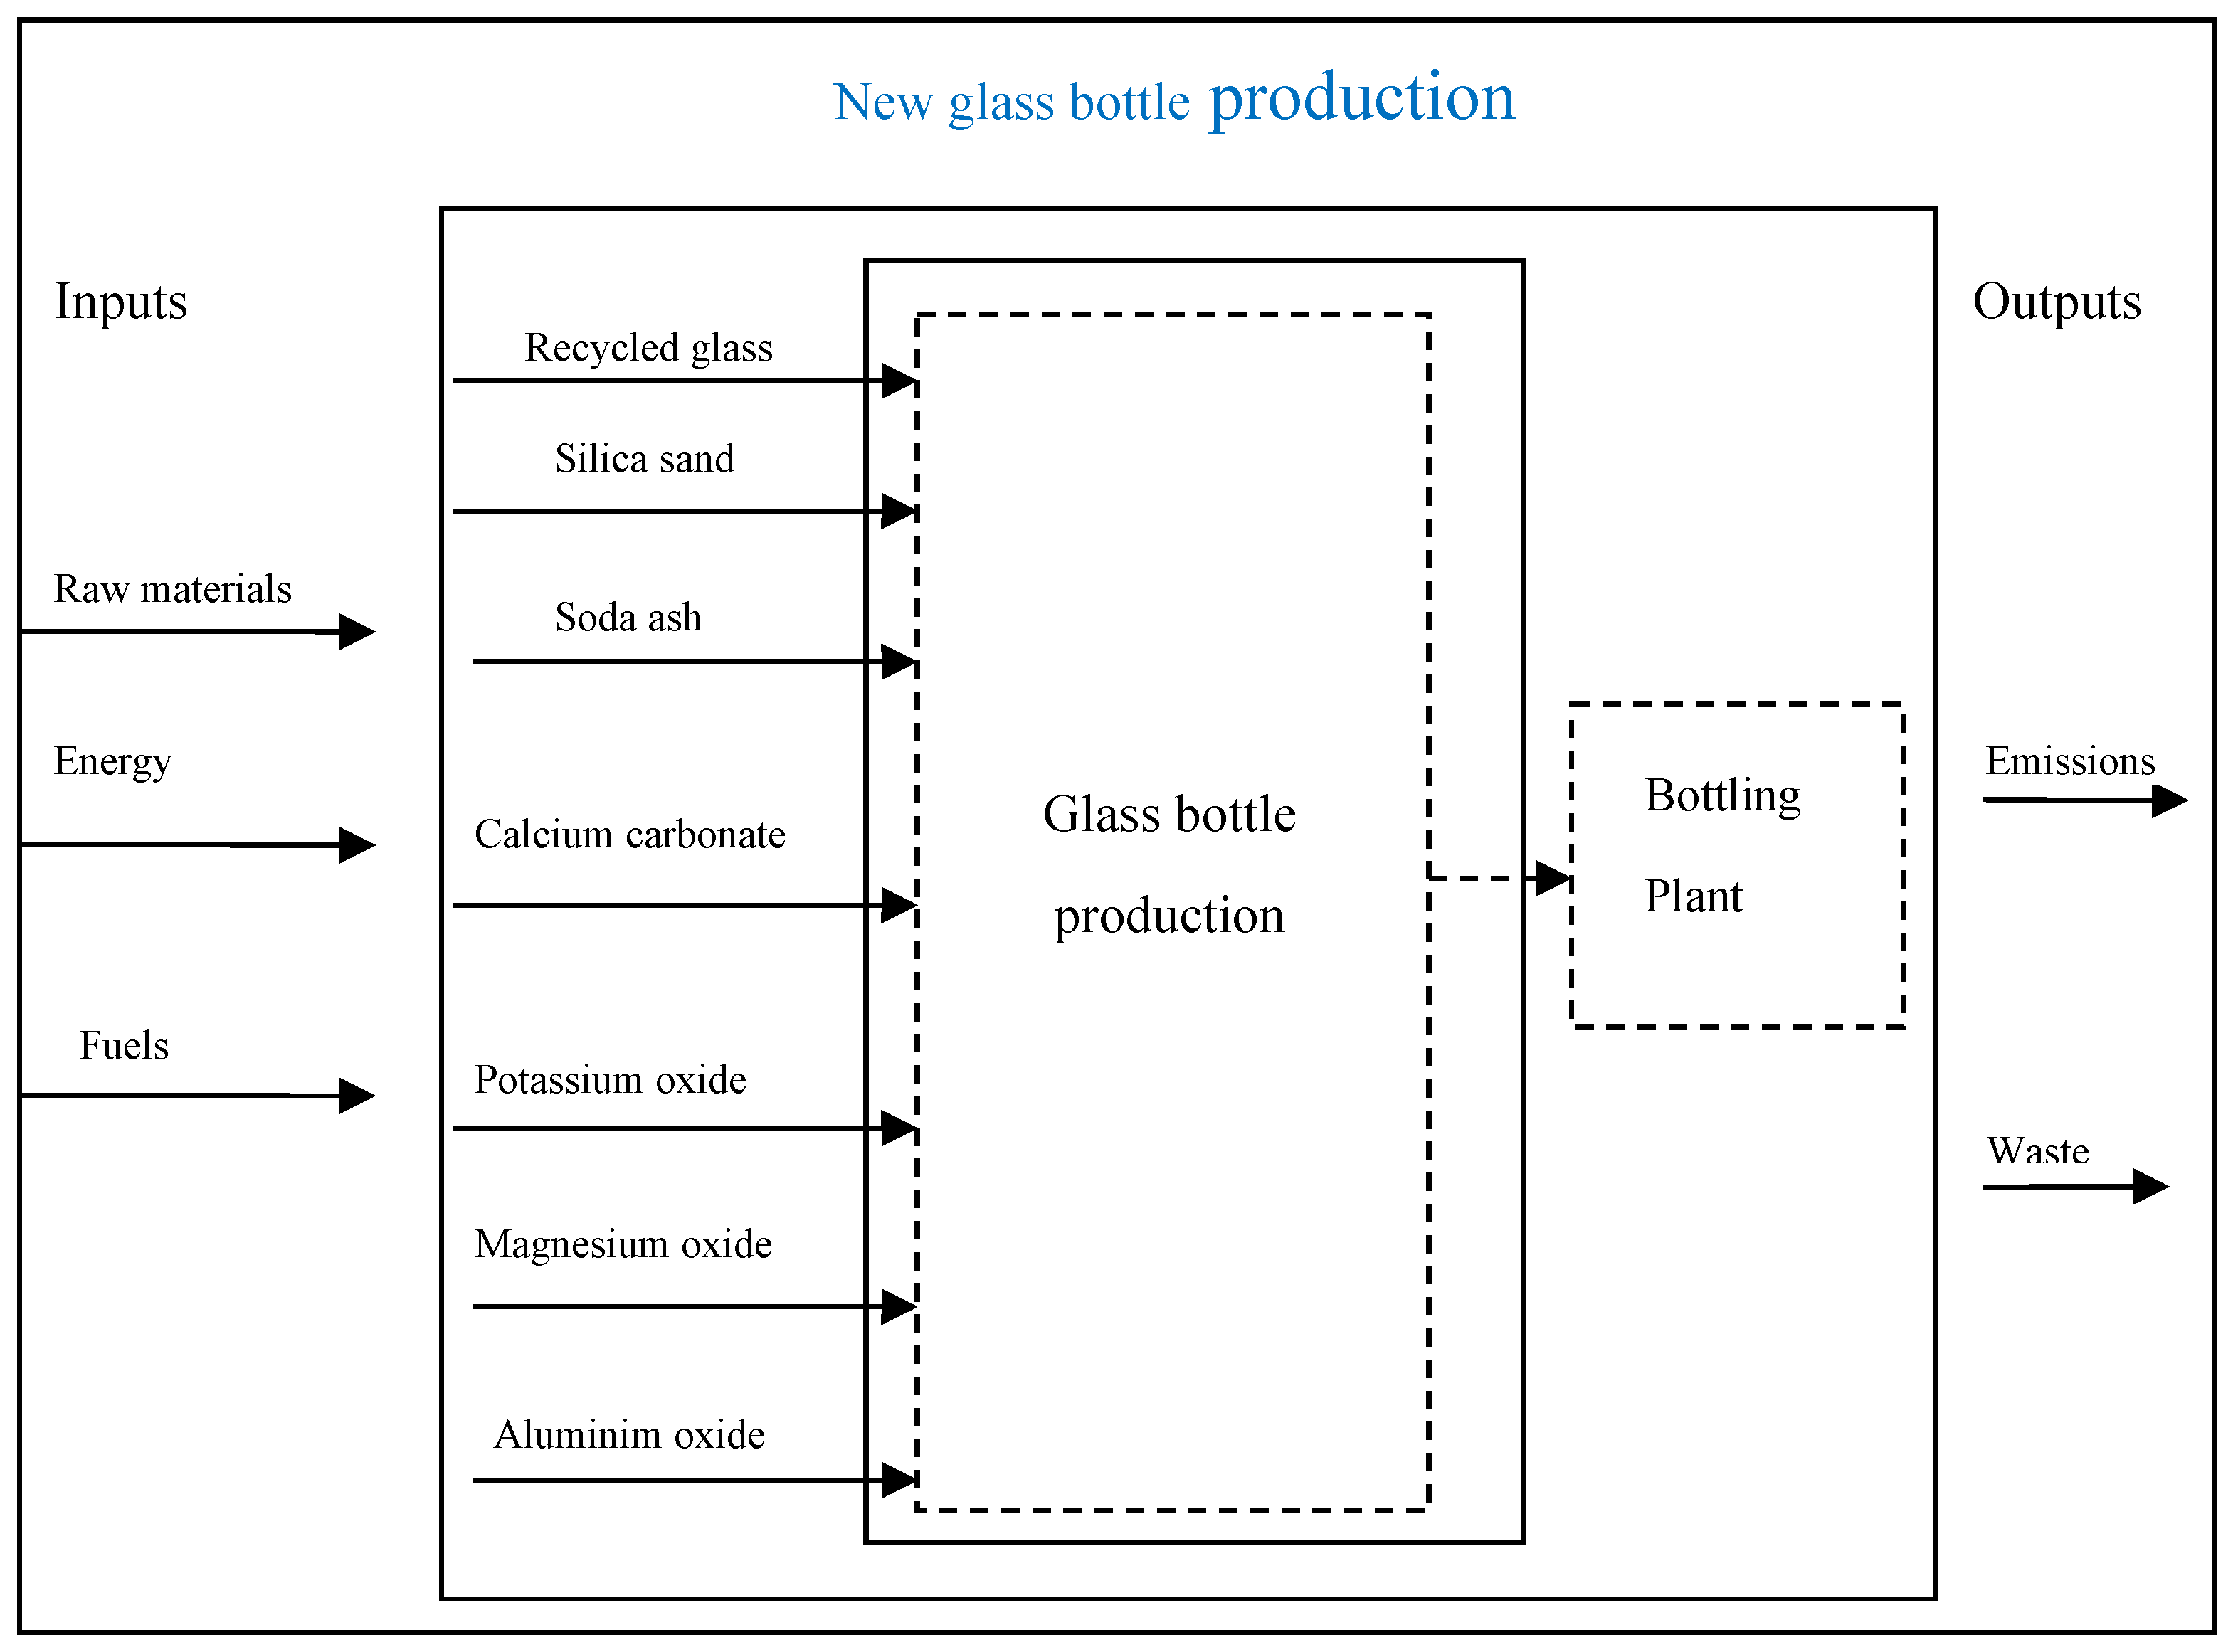
Figure 2.
Flow chart of PET bottle production plant.
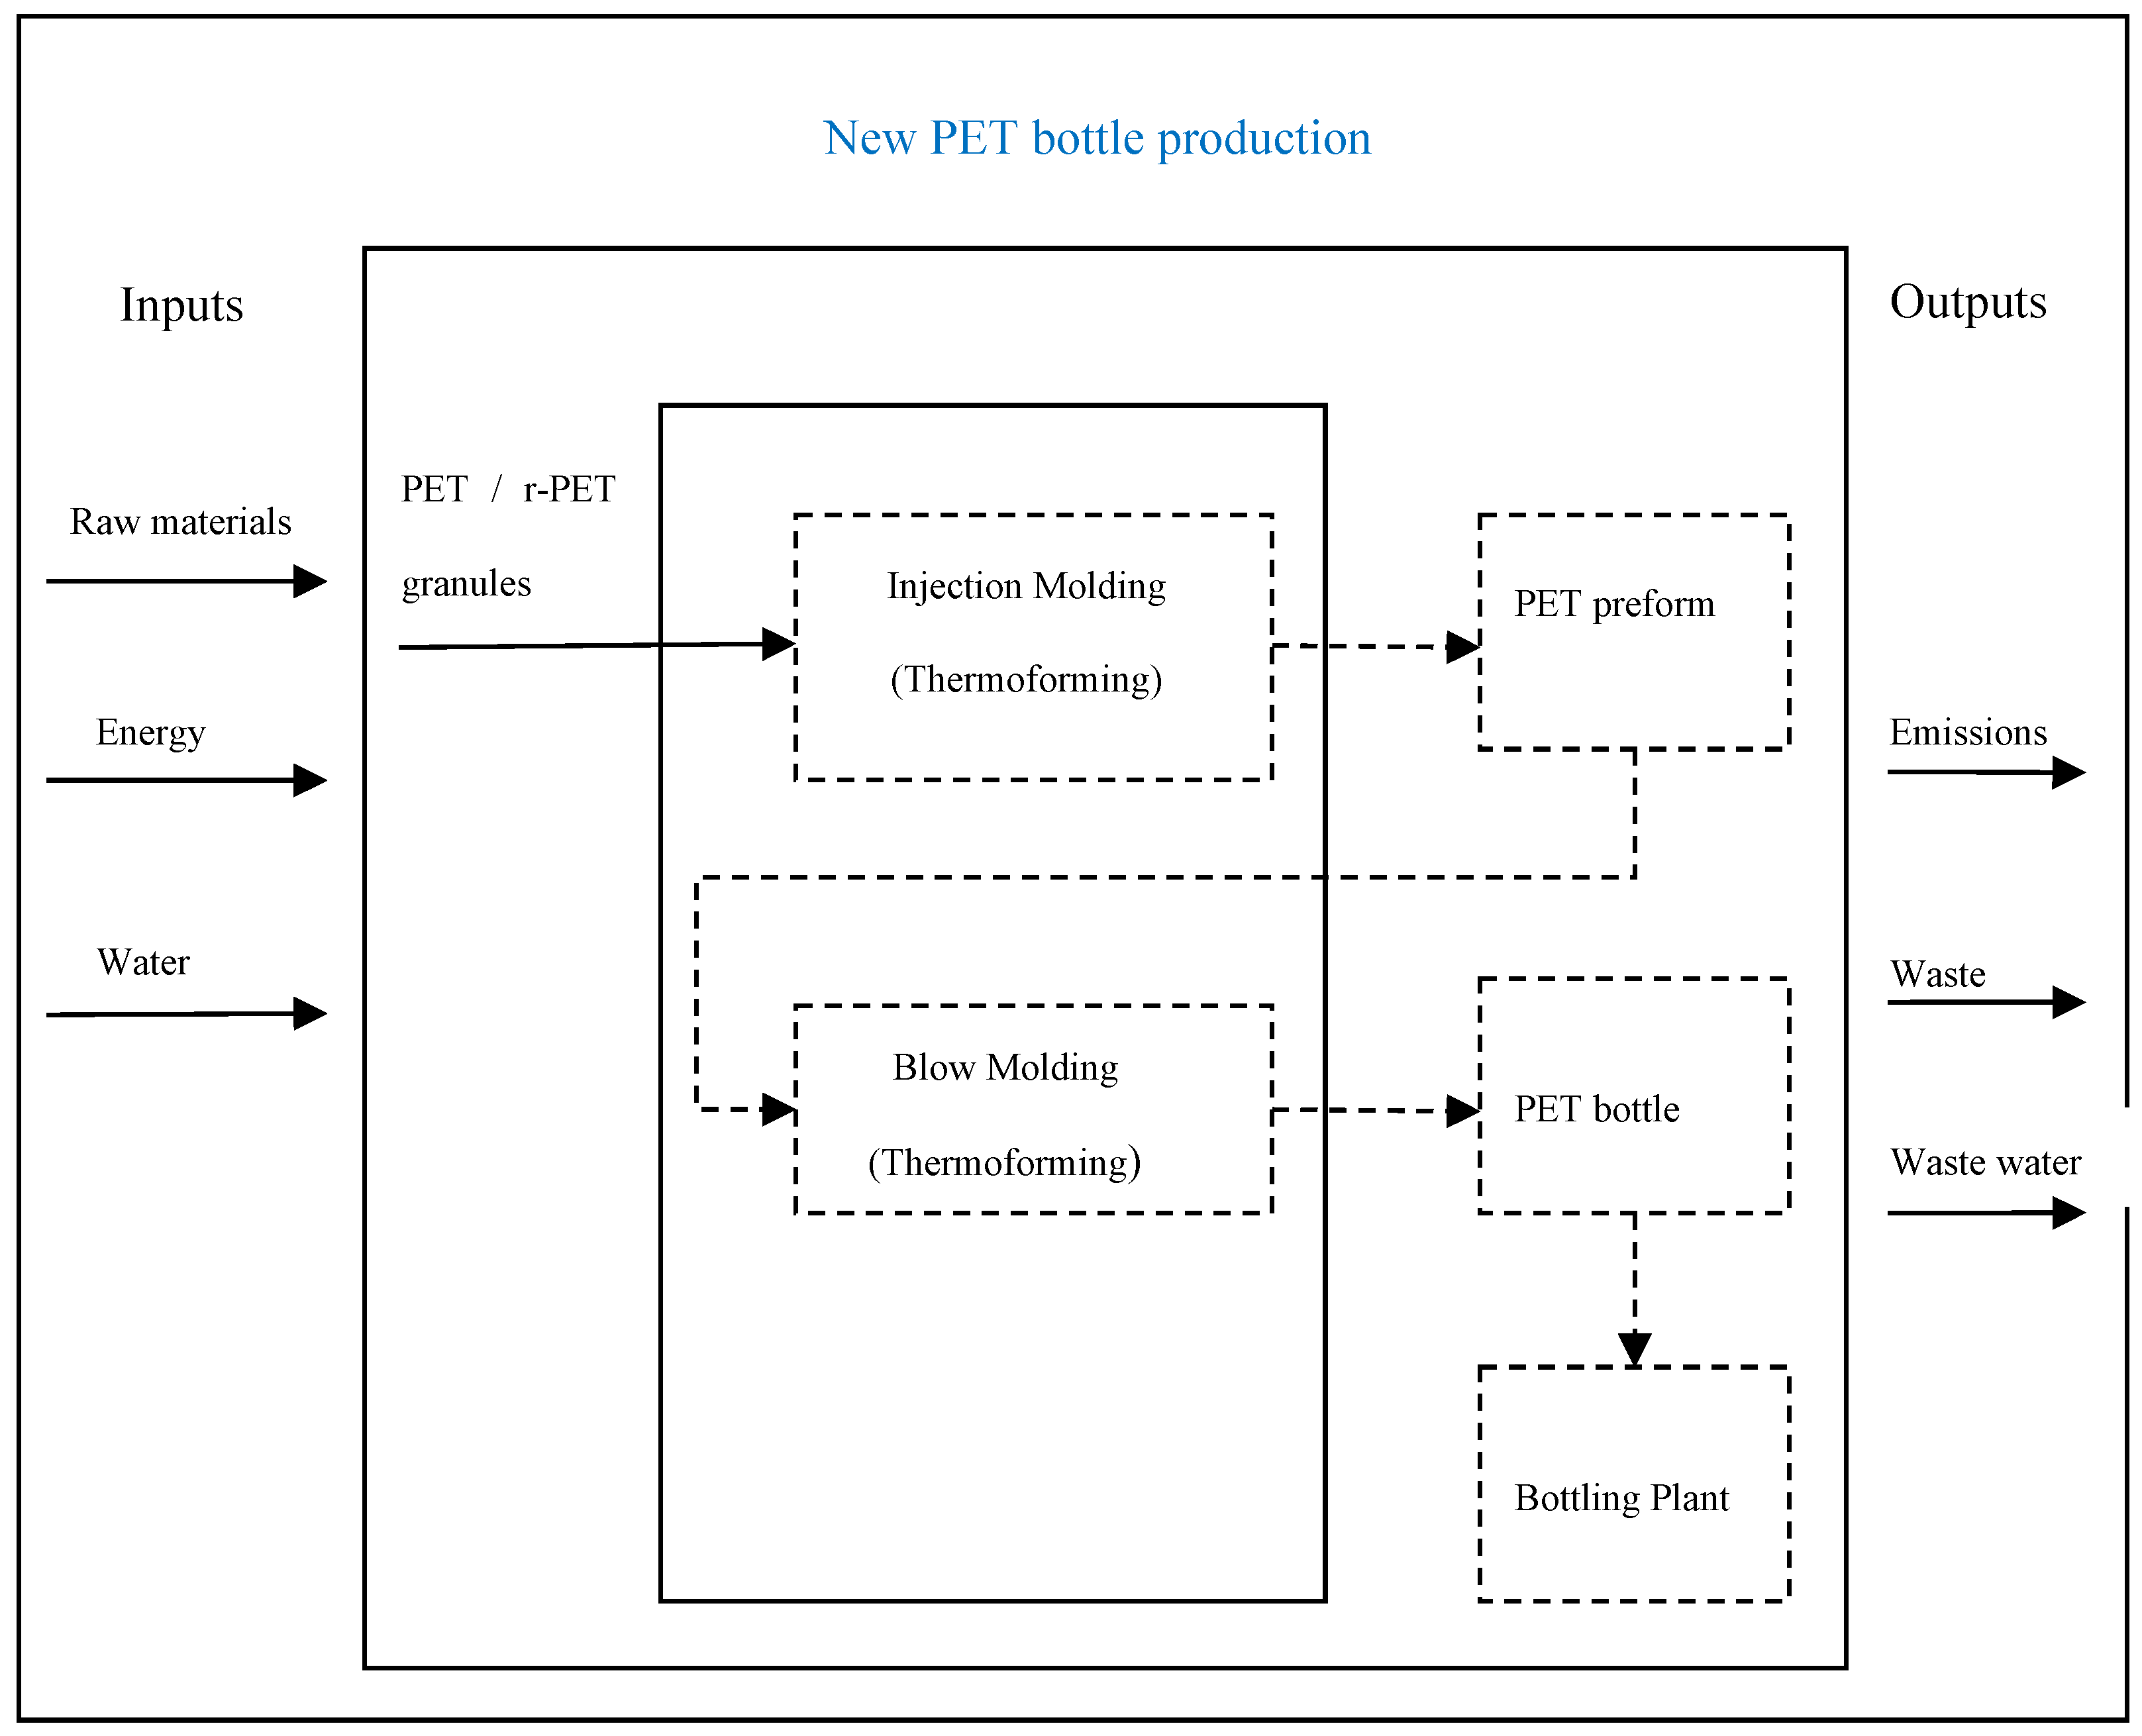
Figure 3.
Flow diagram of bottling process for carbonated and non-carbonated soft drink in glass bottles.
Figure 3.
Flow diagram of bottling process for carbonated and non-carbonated soft drink in glass bottles.
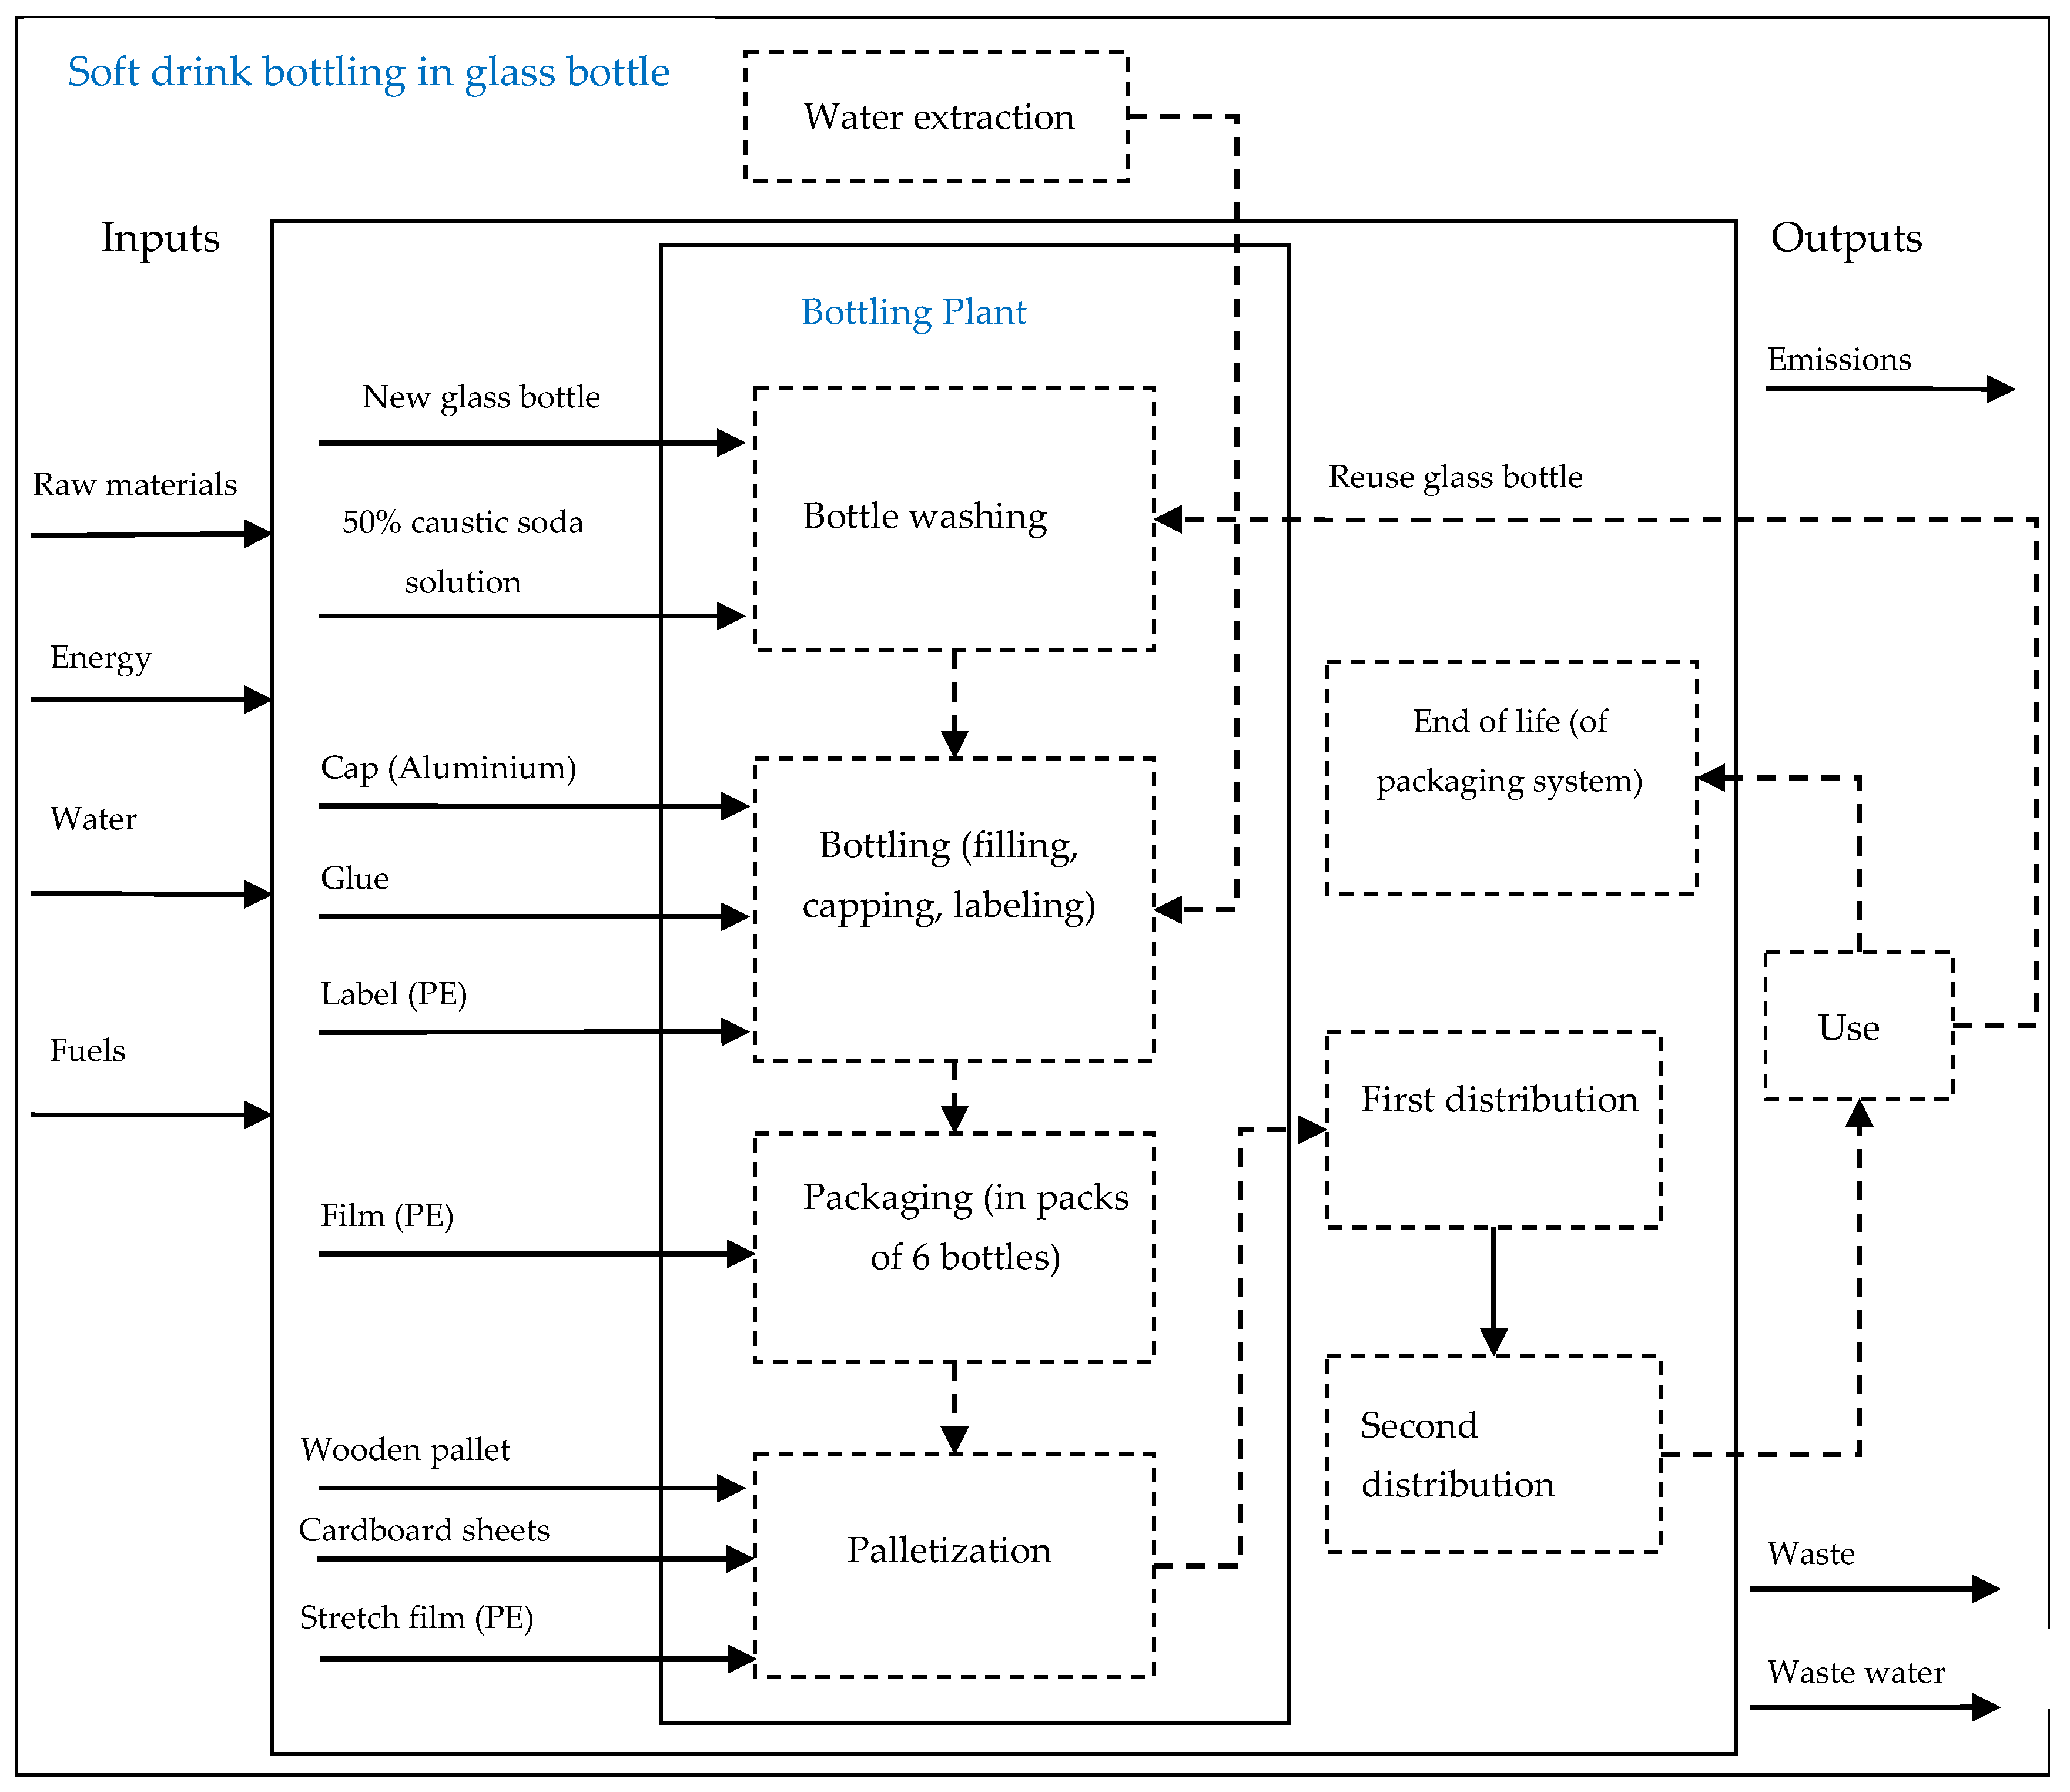
Figure 4.
Flow diagram of bottling processes for carbonated or non-carbonated soft drink in PET bottles.
Figure 4.
Flow diagram of bottling processes for carbonated or non-carbonated soft drink in PET bottles.
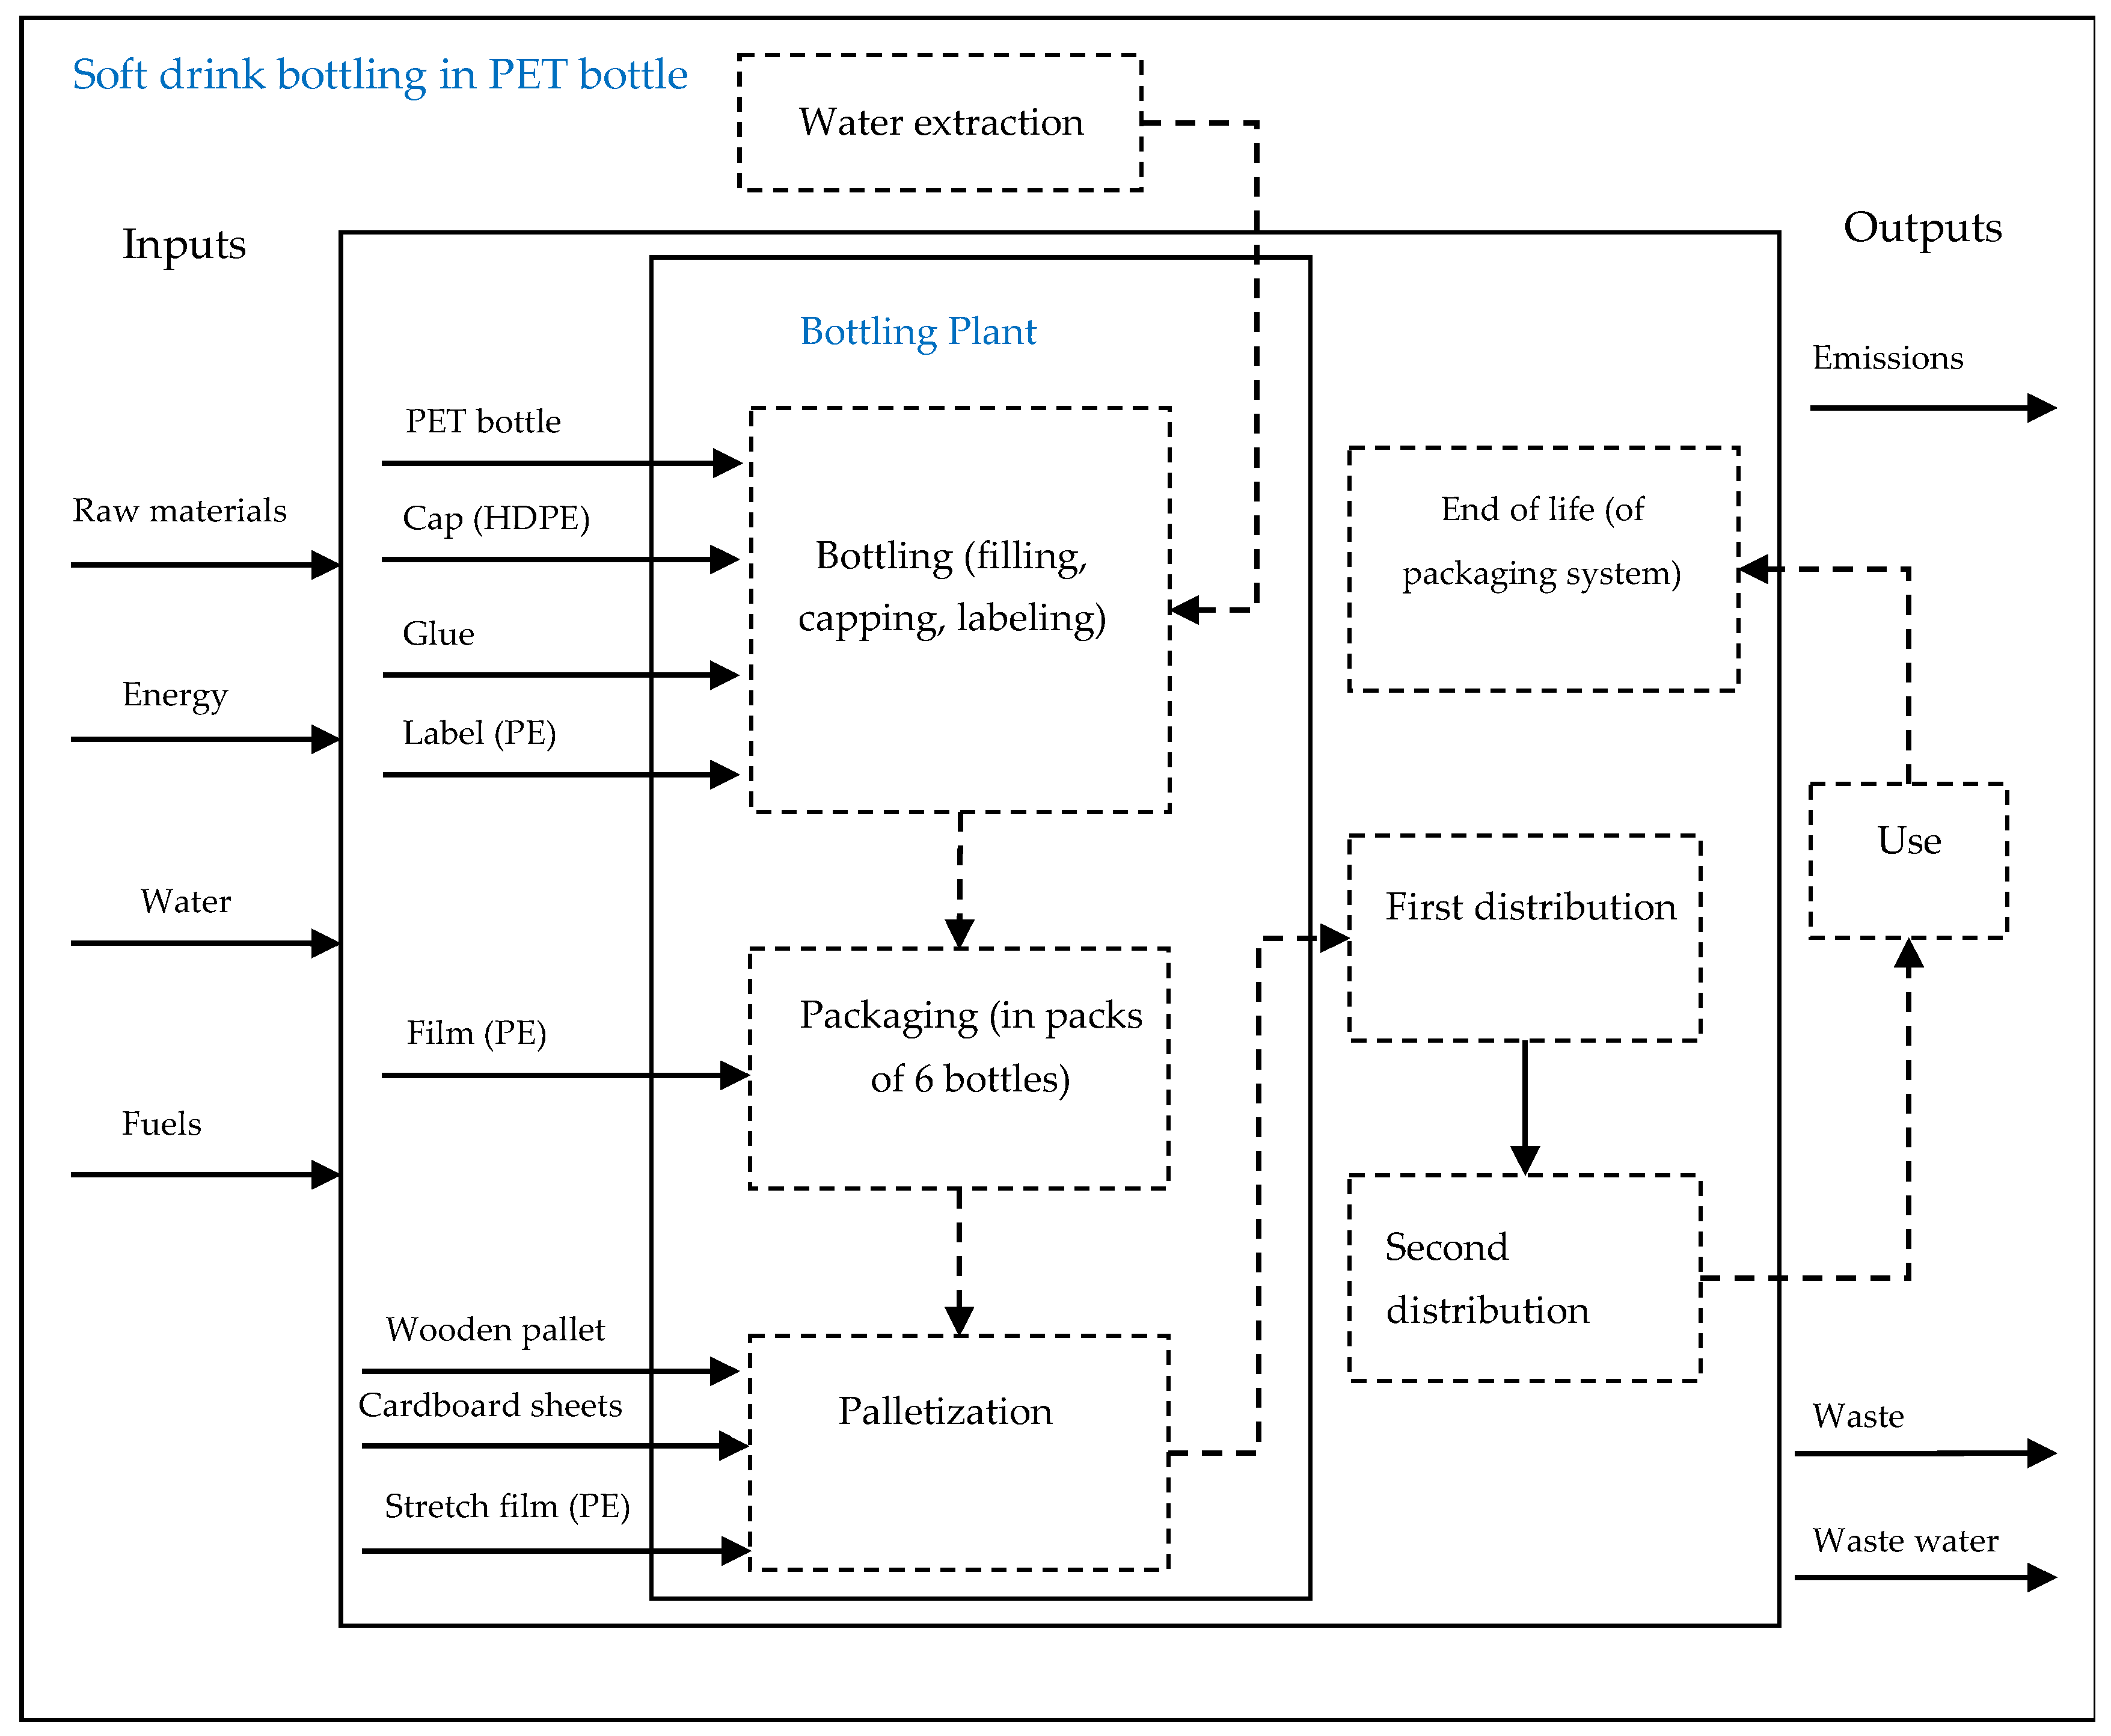
Figure 5.
Block diagram of the simulation model.
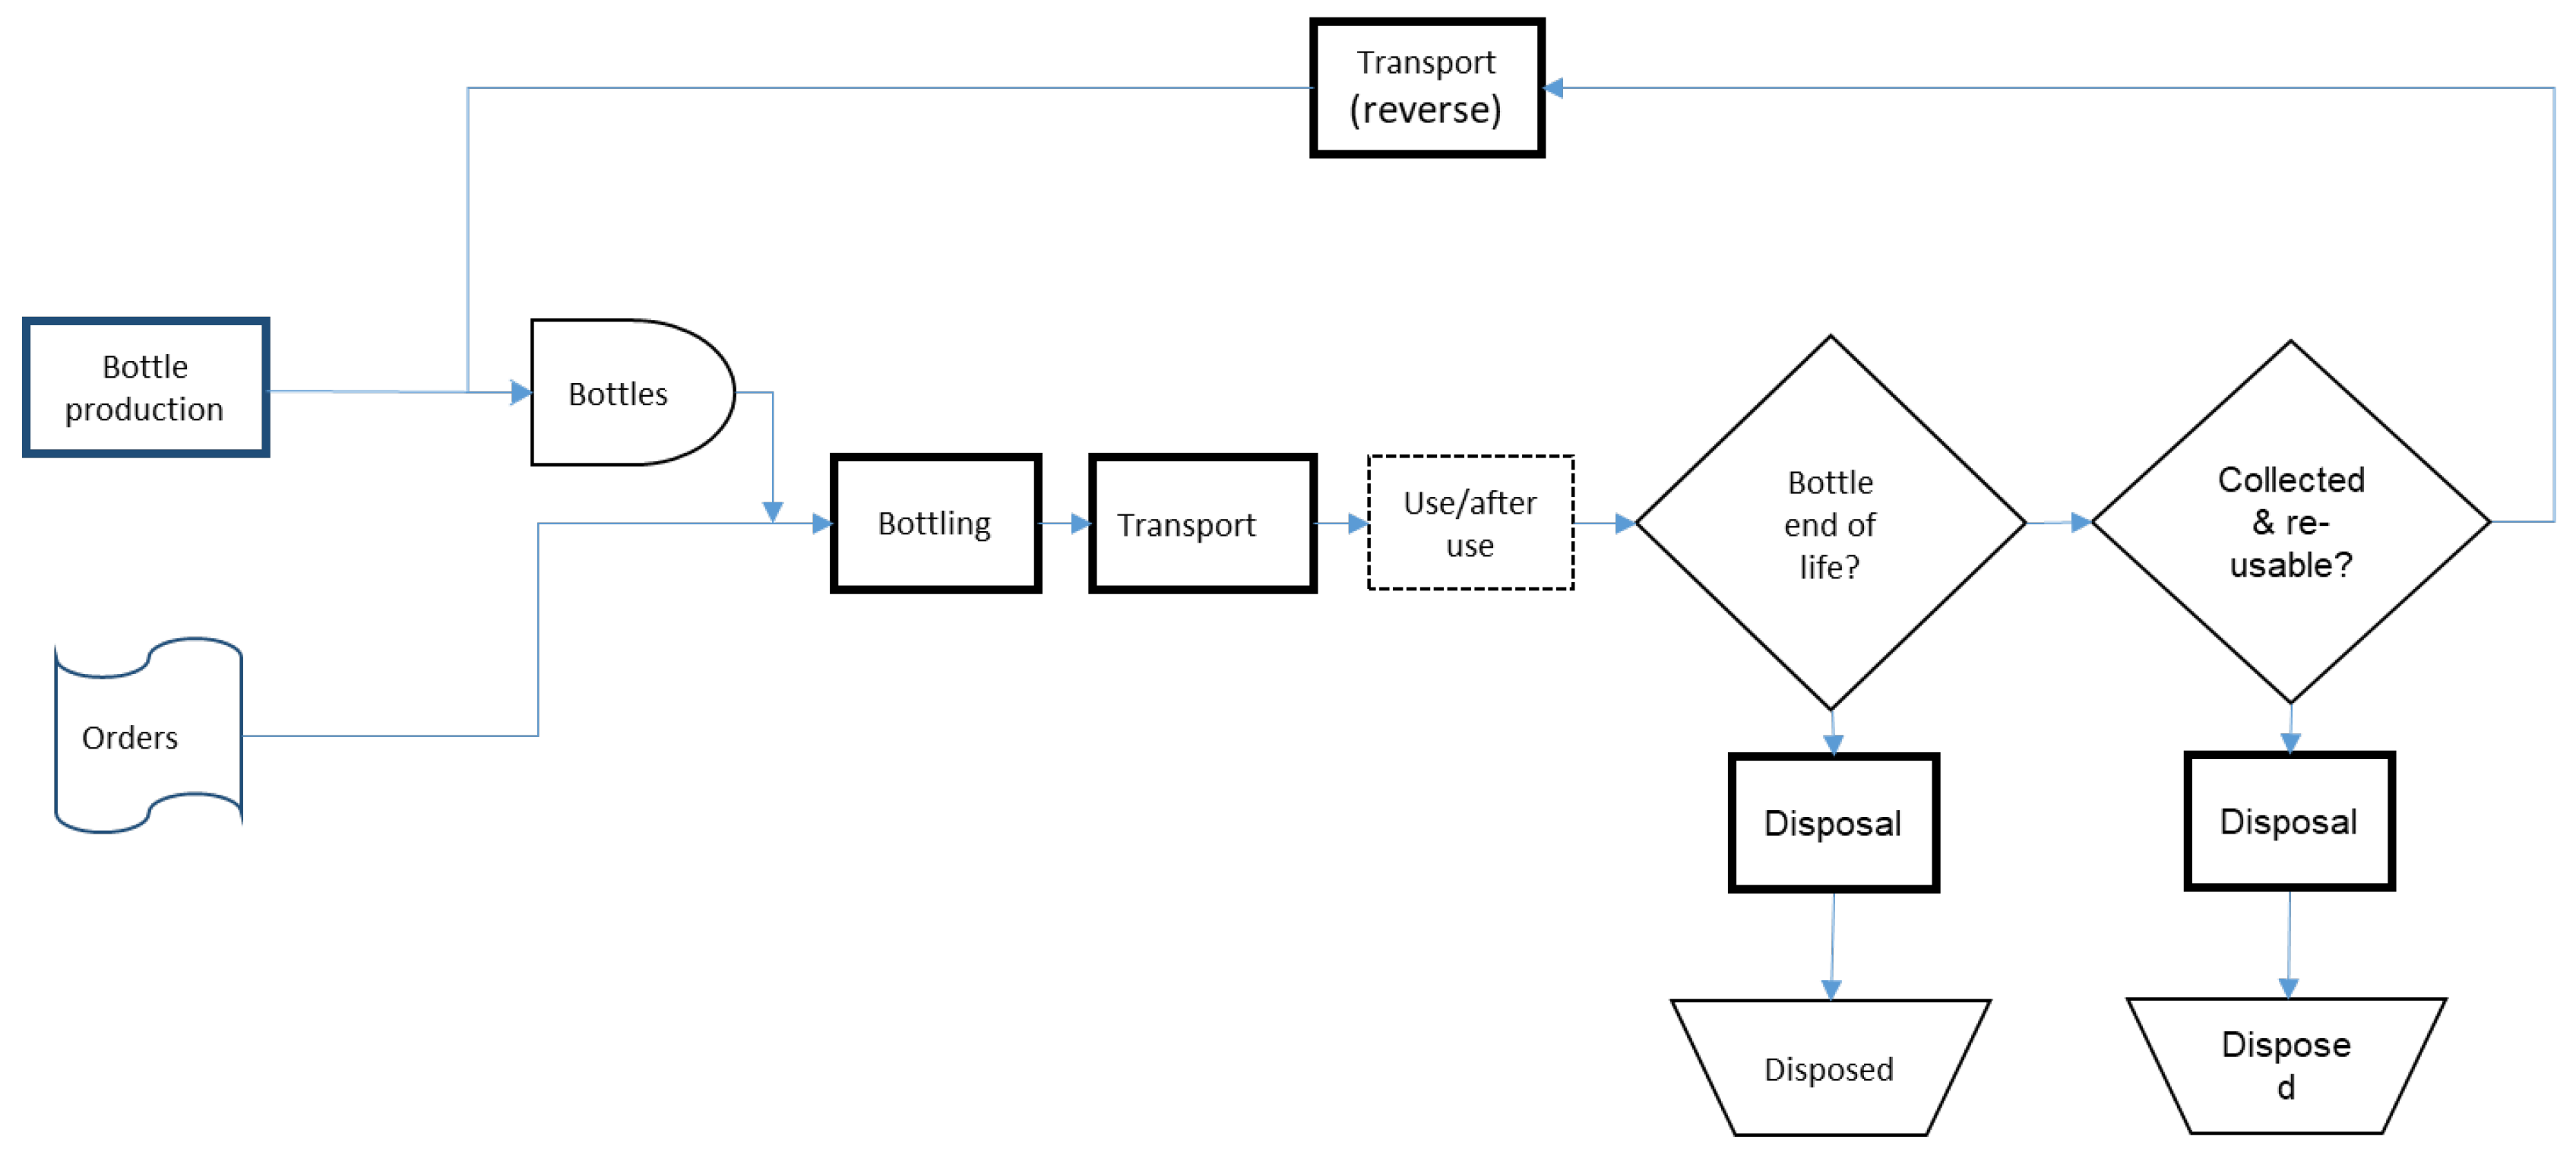
Figure 7.
The effect of different percentages of returned glass bottles on the six environmental aspects.
Figure 7.
The effect of different percentages of returned glass bottles on the six environmental aspects.
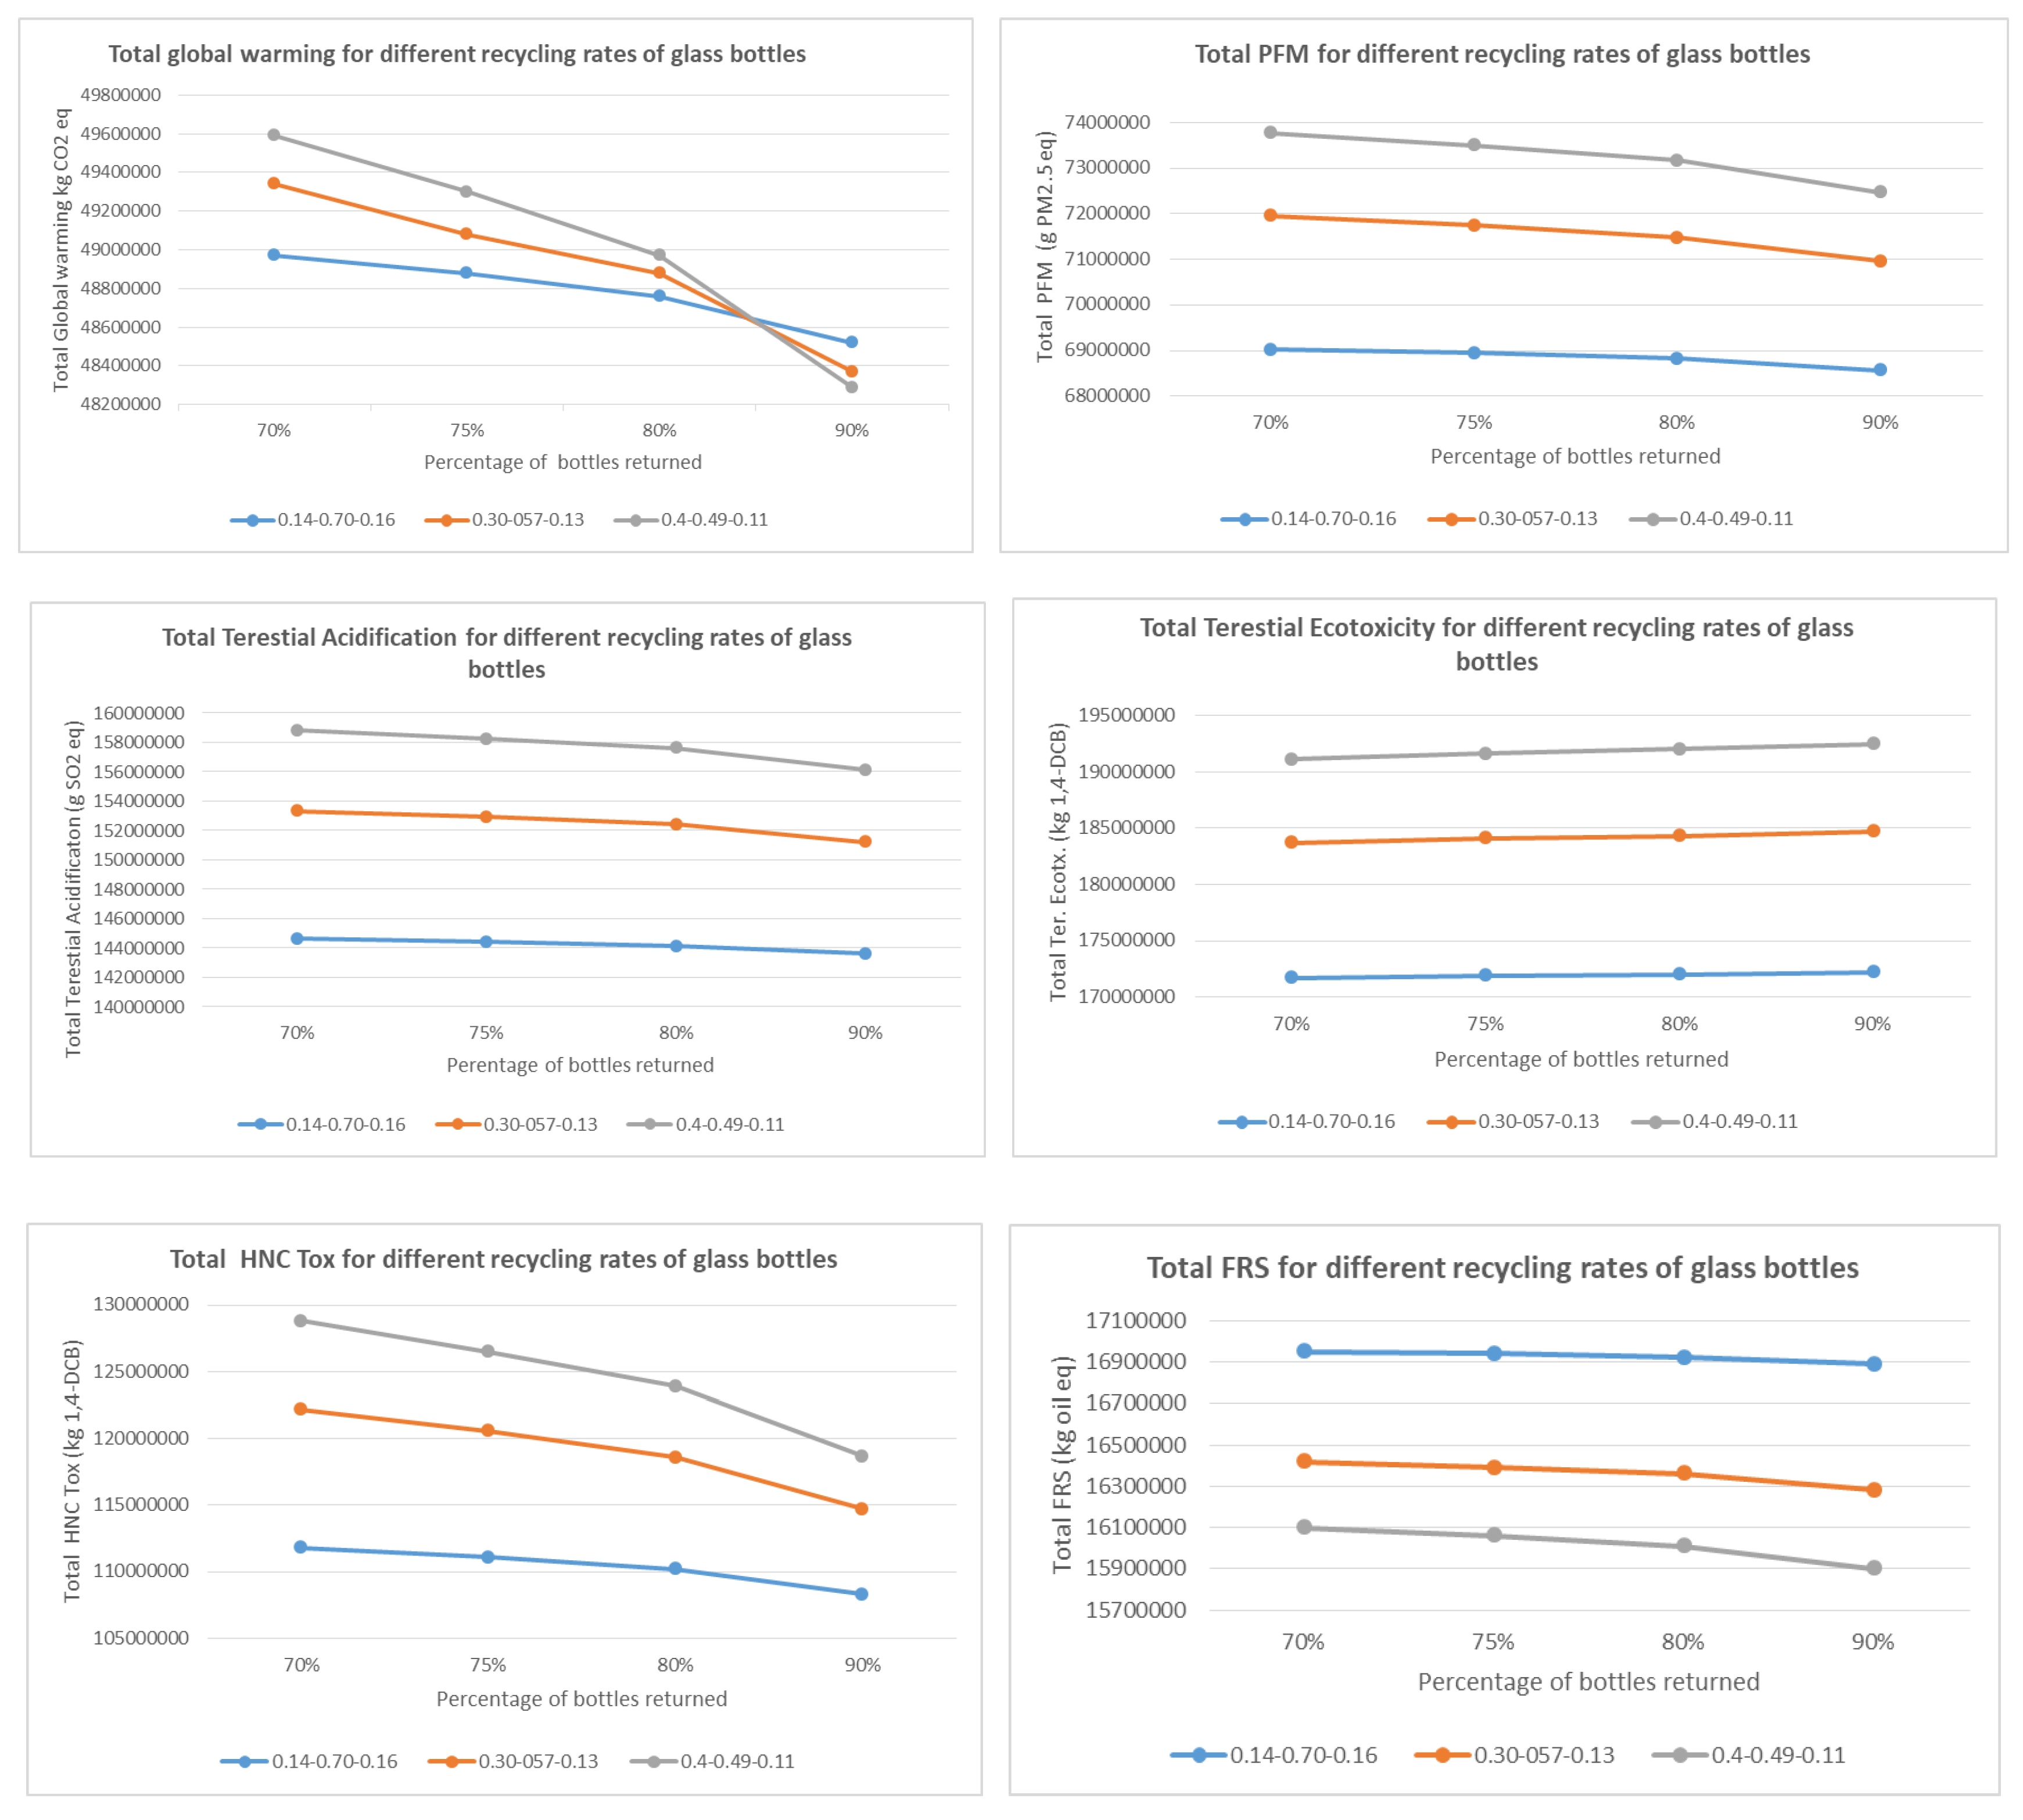
Figure 9.
The effect of variation in demand and on the maximum reuses of glass bottles.
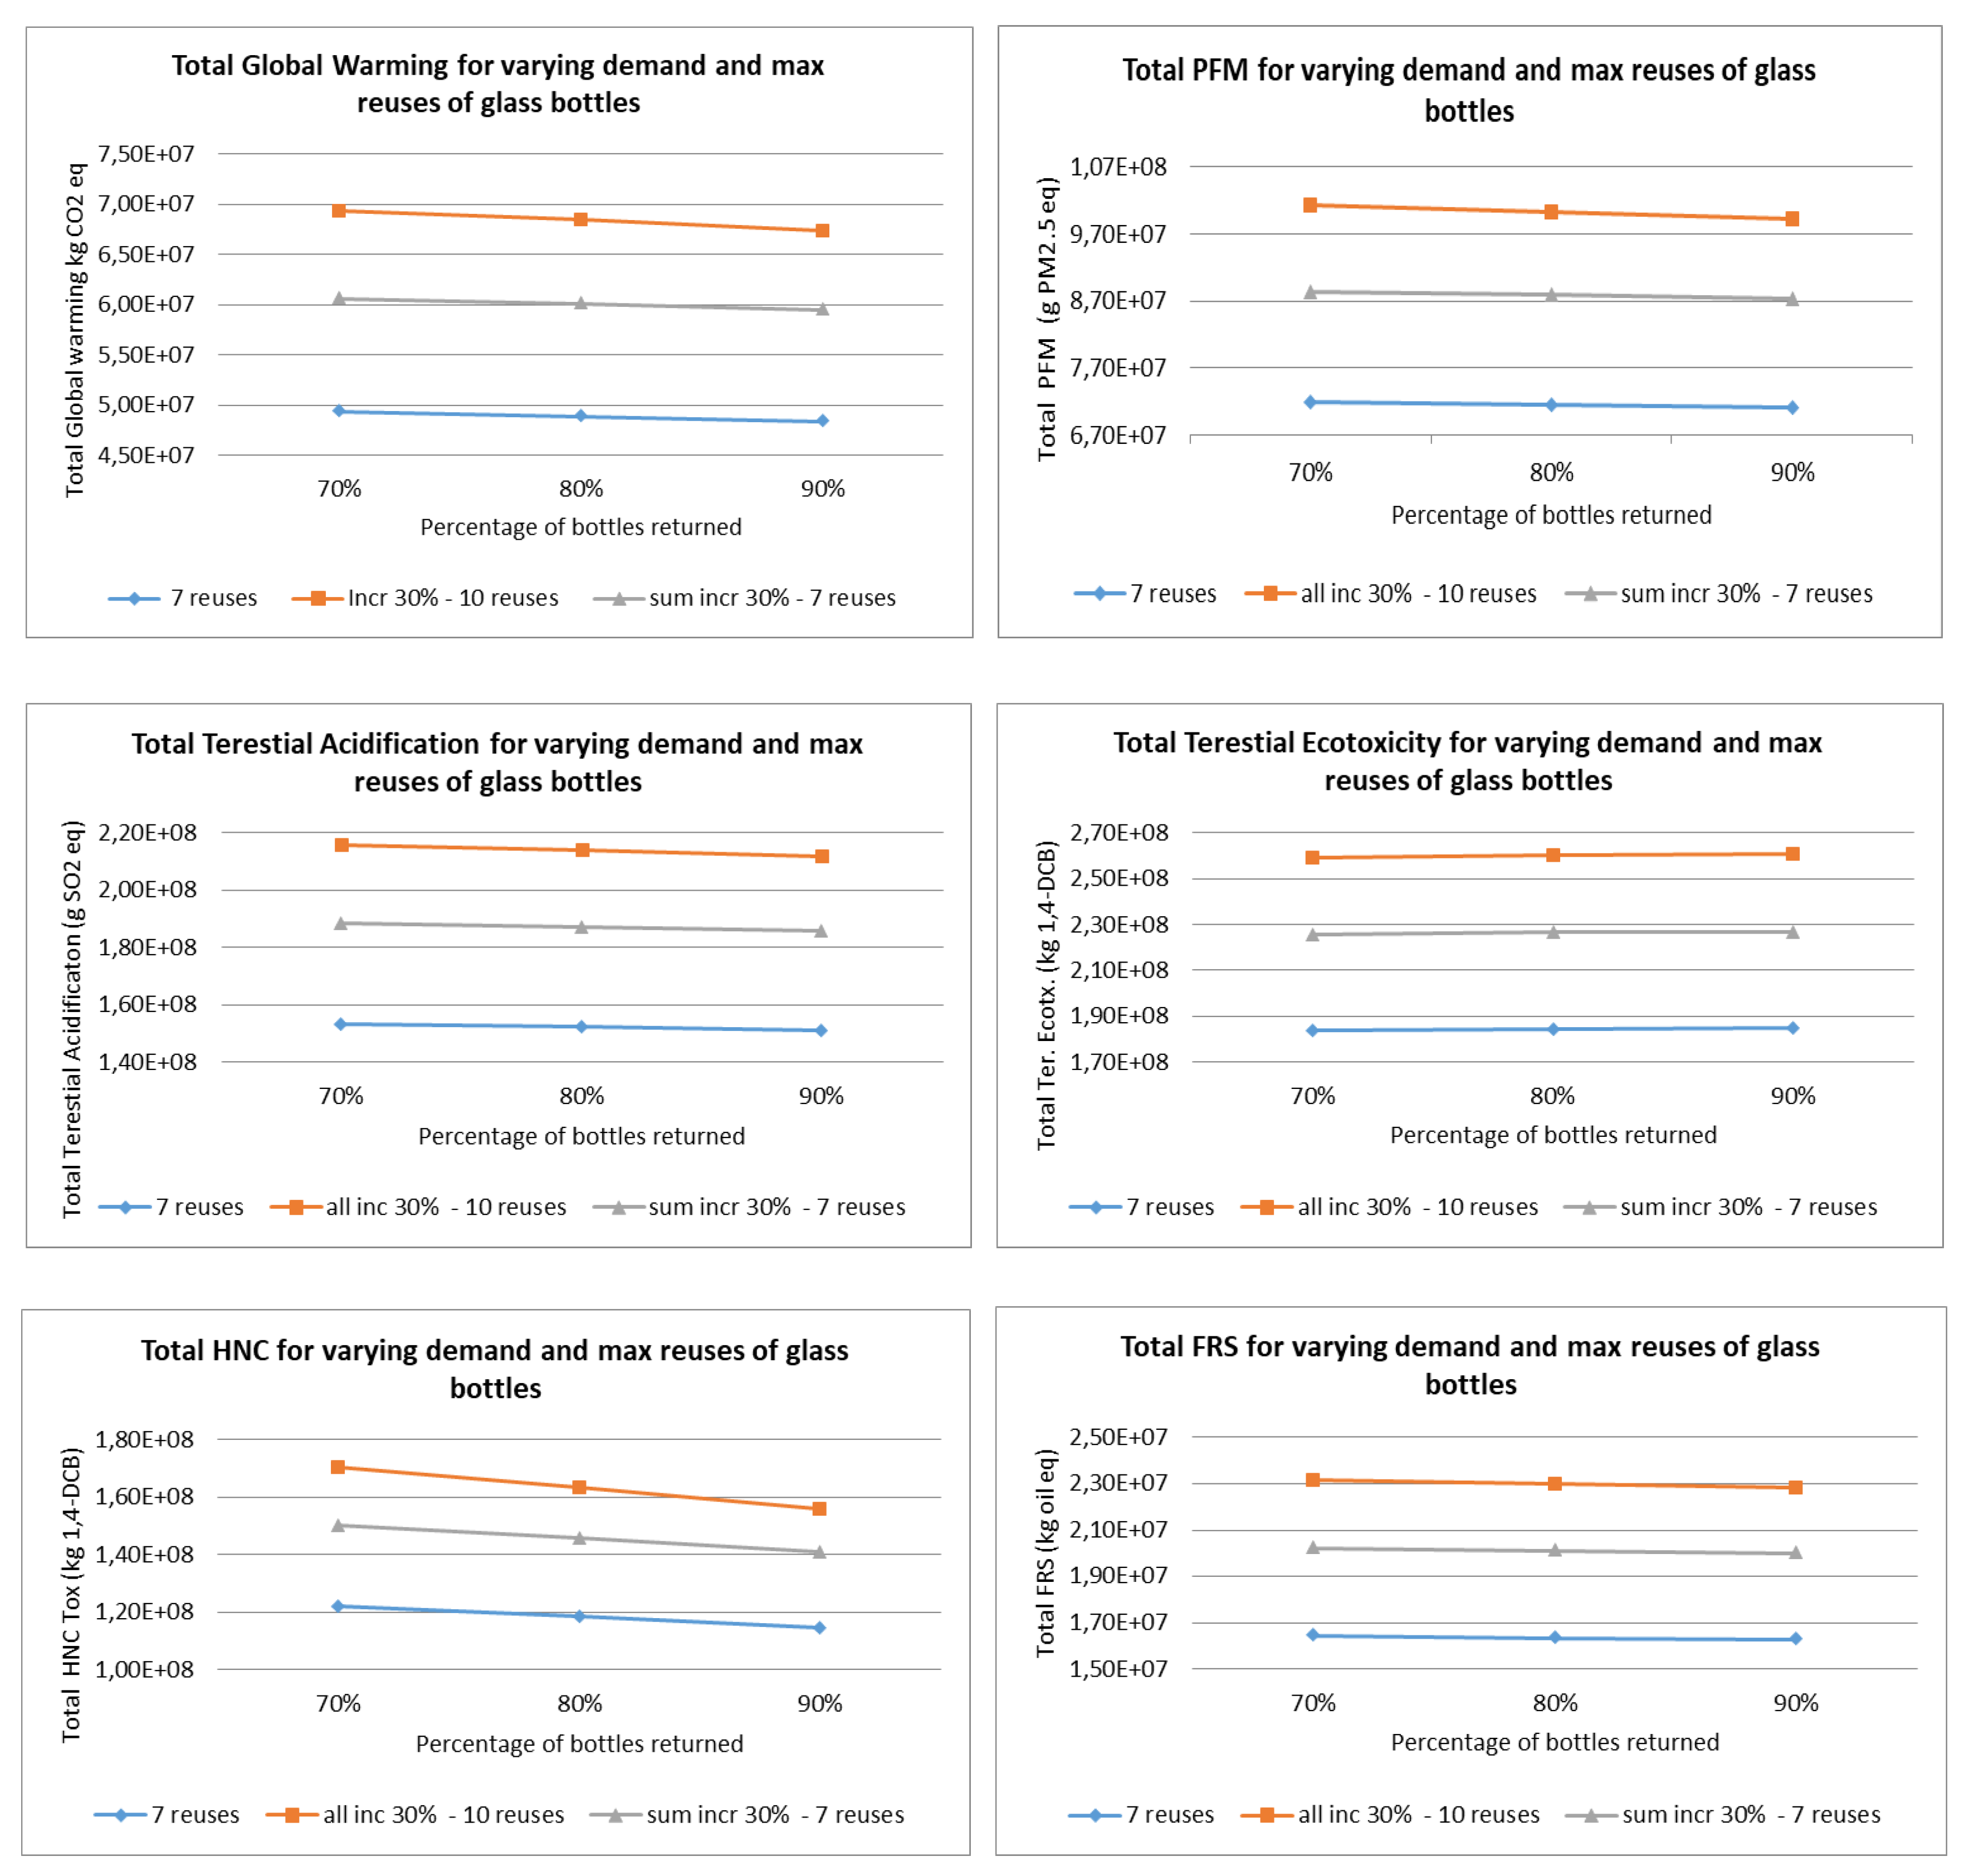
Table 6.
Comparative results for the six worst performing midpoint impact categories.
| Midpoint Category | Unit | Glass bottle | PET bottle for carbonated soft drinks | PET bottle for non-carbonated soft drinks |
|---|---|---|---|---|
| Global warming | g CO2 eq | 241.5 | 218.50 | 191.50 |
| Fine particulate matter formation | mg PM2.5 eq | 387.10 | 294.00 | 259.80 |
| Terrestrial acidification | mg SO2 eq | 872.30 | 605.50 | 536.50 |
| Terrestrial ecotoxicity | g 1,4-DCB | 1055.40 | 710.40 | 638.10 |
| Human non-carcinogenic toxicity | g 1,4-DCB | 878.50 | 461.90 | 403.40 |
| Fossil resource scarcity | g oil eq | 64.30 | 78.22 | 68.30 |
Table 7.
Results for endpoint impact categories, for the specific case (3.57 reuses).
| Endpoint Category | Unit | Glass bottle | PET bottle for carbonated soft drinks | PET bottle for non-carbonated soft drinks |
|---|---|---|---|---|
| Human health | DALY | 7.25 x 10⁻⁷ | 5.53 x 10⁻⁷ | 4.87 x 10⁻⁷ |
| Ecosystems | species x yr | 1.28 x 10⁻⁹ | 1.10 x 10⁻⁹ | 9.75 x 10⁻¹⁰ |
| Resources | USD2013 | 1.58 x 10⁻² | 2.49 x 10⁻² | 2.15 x 10⁻² |
Table 8.
Results for endpoint impact categories, for the specific case (7 reuses).
| Endpoint Category | Unit | Glass bottle | PET bottle for carbonated soft drinks | PET bottle for non-carbonated soft drinks |
|---|---|---|---|---|
| Human health | DALY | 6.08 x 10⁻⁷ | 5.53 x 10⁻⁷ | 4.87 x 10⁻⁷ |
| Ecosystems | species x yr | 1.09 x 10⁻⁹ | 1.10 x 10⁻⁹ | 9.75 x 10⁻¹⁰ |
| Resources | USD2013 | 1.50 x 10⁻² | 2.49 x 10⁻² | 2.15 x 10⁻² |
Table 9.
Environmental aspect values for PET bottles for carbonated content.
| Impact category | Unit | Production of PET bottle carbon | Bottle Plant Operation | Distribution | Disposal 12% recycled |
Disposal 20% recycled |
Disposal 30% recycled |
|---|---|---|---|---|---|---|---|
| Global warming | kg CO2 eq | 311.04 | 71.54 | 35.38 | -11.68 | -48.60 | -94.87 |
| Fine particulate matter formation | kg PM2.5 eq | 0.48 | 0.11 | 0.03 | -0.07 | -0.12 | -0.18 |
| Terrestrial acidification | kg SO2 eq | 0.96 | 0.24 | 0.07 | -0.15 | -0.25 | -0.38 |
| Terrestrial ecotoxicity | kg 1.4-DCB | 865.08 | 152.22 | 482.11 | -178.46 | -299.38 | -449.06 |
| Human non-carcinogenic toxicity | kg 1.4-DCB | 318.82 | 82.04 | 28.58 | 429.62 | 351.86 | 254.66 |
| Fossil resource scarcity | kg oil eq | 122.28 | 31.49 | 11.08 | -19.40 | -32.66 | -49.18 |
Table 10.
Environmental aspect values for PET bottles for non-carbonated content.
| Impact category | Unit | Production of PET bottle non-carbon | Bottle Plant Operation | Distribution | Disposal 12% recycled |
Disposal 20% recycled |
Disposal 30% recycled |
|---|---|---|---|---|---|---|---|
| Global warming | kg CO2 eq | 262.44 | 70.18 | 34.99 | -11.60 | -43.93 | -84.56 |
| Fine particulate matter formation | kg PM2.5 eq | 0.41 | 0.11 | 0.03 | -0.06 | -0.11 | -0.16 |
| Terrestrial acidification | kg SO2 eq | 0.82 | 0.24 | 0.06 | -0.13 | -0.22 | -0.33 |
| Terrestrial ecotoxicity | kg 1.4-DCB | 721.22 | 149.30 | 476.28 | -160.38 | -268.27 | -402.41 |
| Human non-carcinogenic toxicity | kg 1.4-DCB | 279.94 | 81.45 | 28.19 | 359.64 | 291.60 | 206.06 |
| Fossil resource scarcity | kg oil eq | 102.45 | 30.52 | 10.93 | -16.95 | -28.58 | -42.96 |
Table 11.
Environmental aspect values for glass bottles – initial bottling.
| Impact category | Unit | Production of glass | Bottle Plant Operation | Distribution (per Km) | Disposal |
|---|---|---|---|---|---|
| Global warming | kg CO2 eq | 577.37 | 202.18 | 0.28 | -43.55 |
| Fine particulate matter formation | kg PM2.5 eq | 1152.79 | 394.63 | 0.23 | -466.56 |
| Terrestrial acidification | kg SO2 eq | 2546.64 | 861.19 | 0.52 | -1020.60 |
| Terrestrial ecotoxicity | kg 1.4-DCB | 1489.10 | 748.44 | 3.80 | -874.80 |
| Human non-carcinogenic toxicity | kg 1.4-DCB | 1146.96 | 495.72 | 0.23 | 2060.64 |
| Fossil resource scarcity | kg oil eq | 179.43 | 64.54 | 0.09 | -76.01 |
Table 12.
Environmental aspect values for glass bottles – repeated bottlings.
| Impact category | Unit | Production of glass | Bottle Plant Operation | Distribution per Km | Disposal |
|---|---|---|---|---|---|
| Global warming | kg CO2 eq | 0 | 246.89 | 0.28 | 23.52 |
| Fine particulate matter formation | kg PM2.5 eq | 0 | 542.38 | 0.23 | 1.28 |
| Terrestrial acidification | kg SO2 eq | 0 | 1246.10 | 0.52 | 3.17 |
| Terrestrial ecotoxicity | kg 1.4-DCB | 0 | 966.17 | 3.80 | 0.87 |
| Human non-carcinogenic toxicity (HNC) | kg 1.4-DCB | 0 | 559.87 | 0.23 | 295.49 |
| Fossil resource scarcity | kg oil eq | 0 | 77.95 | 0.09 | 0.22 |
Table 14.
Environmental performance of the two packaging materials for different operational conditions.
Table 14.
Environmental performance of the two packaging materials for different operational conditions.
Disclaimer/Publisher’s Note: The statements, opinions and data contained in all publications are solely those of the individual author(s) and contributor(s) and not of MDPI and/or the editor(s). MDPI and/or the editor(s) disclaim responsibility for any injury to people or property resulting from any ideas, methods, instructions or products referred to in the content. |
© 2024 by the authors. Licensee MDPI, Basel, Switzerland. This article is an open access article distributed under the terms and conditions of the Creative Commons Attribution (CC BY) license (http://creativecommons.org/licenses/by/4.0/).
Copyright: This open access article is published under a Creative Commons CC BY 4.0 license, which permit the free download, distribution, and reuse, provided that the author and preprint are cited in any reuse.


