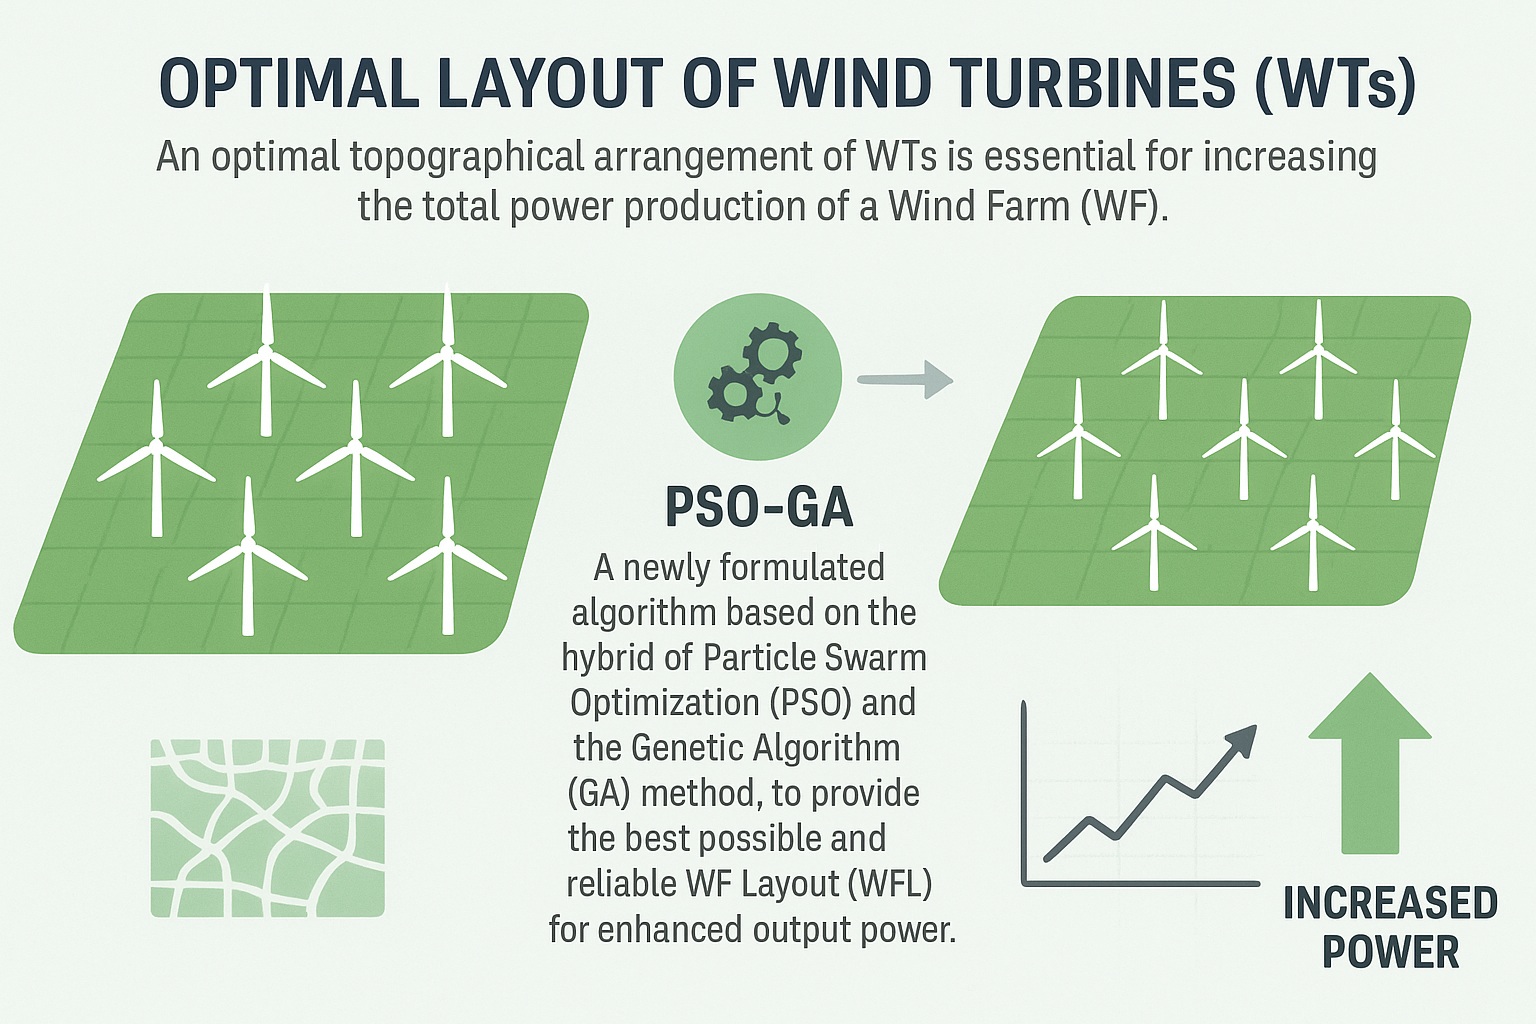
1. Introduction
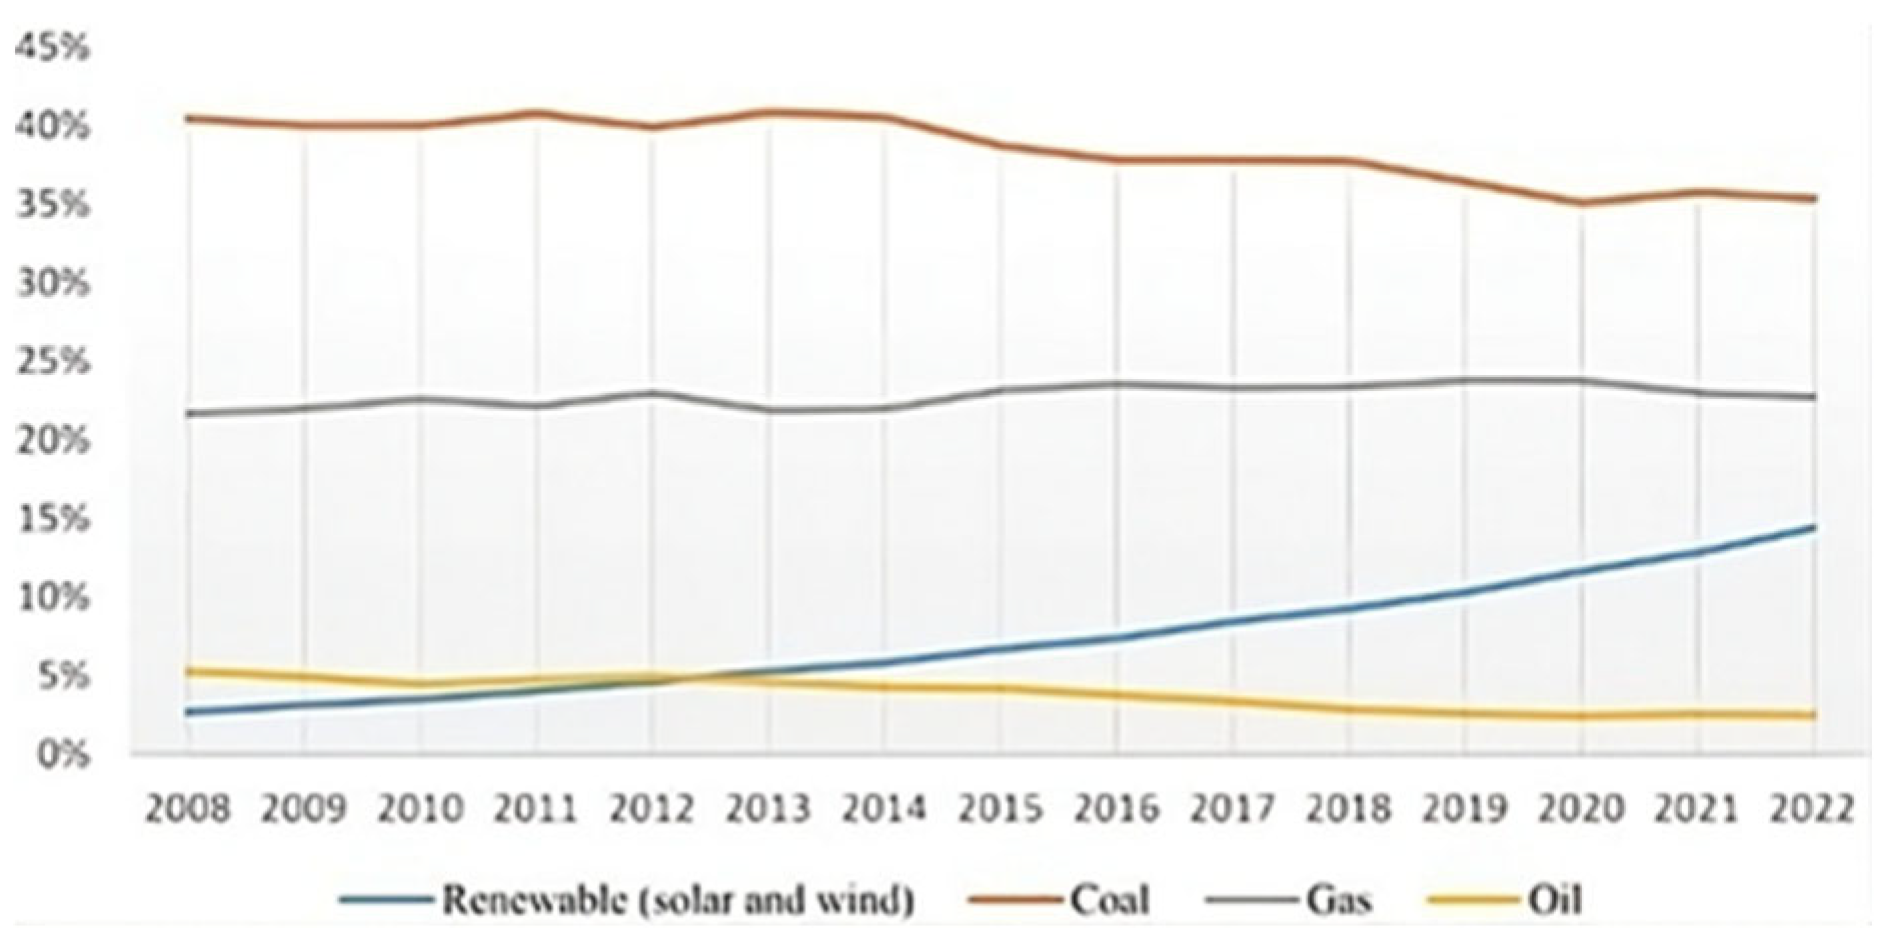
Figure 1 illustrates how the share of renewable power production in the world's power generation has been steadily increasing due to record-breaking new solar and wind construction. In 2022, solar and wind power accounted for 14% of the world's electrical power production; the Statistical Review of World Energy 2023 also provides this information. As a result, expanding the usage of renewable energy sources has gained popularity [
1].
The idea of Wind Energy has currently become among the most familiar clean and sustainable sources of electricity in the entire world. As the world desperately requires a means to curtail climate change and reliance on fossil fuels [
2]. Wind Energy is increasingly playing an important role in the global transition to renewable Energy [
3]. According to a 2021 report by GWEC (Global Wind Energy Council), currently wind energy represents the second-largest renewable energy source, and its role, according to the projections, will grow to 25 percent of overall non-conventional energy by 2035 [
4].
It gets more difficult to develop a WF as the number of turbines increases, since their area grows in proportion to their number. Consequently, there has been a marked shift in emphasis toward curtailing the cost of electricity production, optimizing the architecture of wind farms, and making the most efficient use of wind energy [
5]. The WF Layout improvement process challenge is non-linear and constrained, which relies on multiple variables. A poorly designed Wind Turbine (WT) layout will counteract the operation and negatively impact on WT wake effect [
6]. The accurate simulation of the wake effect is one of the most challenging and computationally challenging problems in the improvement process challenge. There have been a number of WF layouts planned recently for enhanced electrical production while minimizing the wake losses.
The nonlinear wake boundary was taken into assessment when Frandsen et al. [
7] updated the Jensen wake model [
8]. Additionally, by taking into account basic wind environments in terms of energy expenditure, Mittal and Mitra [
9] used the Jensen wake model for best possible Wind Farm (WF). Furthermore, using a new goal function, Şişbot, et al. [
10] replicated the Jensen wake model with comparable findings and improved energy cost findings. Long and Zhang [
11] a WF layout design concept based on Cartesian coordinates and a two-echelon grid. A new systematic model based on Yang et al.'s Gaussian wake model was employed by Bastankhah and Porté-Agel [
12]. The Park wake model was employed by Yang, et al. [
13], the two-dimensional Jensen-Gaussian wake model was employed by Gao, et al. [
14], and Sun, et al. [
15] used 3-D analytical wake models to represent wake deficit. While any of the models can be used to calculate energy produced by the WF. In contrast to the other models, because of its ease of use and ability to compute the energy yield in the shortest amount of time, the Jensen model is the most popular for WFLO. The study by Pérez, Mínguez [
16] and Wu and Porté-Agel [
17] asserted that for evaluating energy yields, the Jensen model works better. For the following reason, the Jensen wake model was employed in this study, the range of improvement process methods that consider the interplay between the wakes of different turbines determines the placement of turbines in a WF. This paper provides an efficient hybrid evolutionary method designed integrated with Jensen’s model to improve wind farm layouts considering wake interaction effects, aiming to maximize electrical energy capture.
2. Literature Review
Most of the scholars have utilized meta-heuristic methods (MHMs) to tackle the challenges of WF layout (WFL). Mosetti et al. [
18] presented a method for optimizing big wind farms with the goal of extracting the most energy for the lowest installation cost. In order to extend production capacity while minimizing the number of installed turbines and amount of area engaged, Grady, et al. [
19] used a genetic algorithm strategy to determine the best location for WTs. A process for the best positioning and configuration of WTs within a WF was presented by Marmidis, et al. [
20] was based on the Monte Carlo simulation method. A Monte Carlo-like random search procedural approach was used by Sood et al. [
21] to discover the best location for several WTs in a small WF under various wake effects.
Another significant move in the proper improvement process of wind farms and which can possibly enhance the efficiency and effectiveness of wind energy production steps, is Masoudi and Baneshi [
22]. To find the target goals, Boersma, et al. [
23] proposed the model, which is a combination of a gradient-based improvement process and evolutionary algorithms. They recommended that the fatigue load can be accommodated by this model, maximum energy can be produced, and the proposed model additionally provides frequency control. Sun, et al. [
24] carried out research to optimize wind turbine design and location to achieve maximum energy production with minimum effect on the environment. The aim of the study was to see how wind speed-up influences the average wind speed of WTs. Tang, et al. [
25] explained that by optimizing the placement and operation of turbines, by coordination of turbine cooperation helps to maximize the energy output of wind farms and reduce their impact on the environment and local communities.
Shakoor, et al. [
26] formulated a newly formulated area rotation scheme to regulate the orientation and dimensions of a WF layout. They formulated a newly formulated method to place the turbines in such a way as to maximize their output while also providing sufficient space between adjacent turbines. Stanley, et al. [
27] demonstrated the effectiveness of their method by applying it to a test case with 16 turbines and two hub heights. They show that the optimized WF layout with two different hub heights findings in a 4.7% increase in energy compared to the design with a single hub height. Stanley and Ning [
28] presented a multi-objective improvement process strategy-based model to determine the fatigue damage that a wind turbine's partial waking causes. The suggested arrangement minimizes damage to the farm's turbines while optimizing the WF's yearly energy output. Bouchekara, et al. [
29] formulated a hybrid model to WTs settlement in a WF in a way that maximizes energy production, minimizes costs, and minimizes environmental impacts. Ramli and Bouchekara [
30] demonstrated the Multi-Objective Electric Charged Particles improvement process to produce more diverse and robust solutions, which can lead to significant improvements in WF performance.
It is understandable that there is a gap in the introduction of new algorithms to improve the quality of the solutions, despite the fact that these significant and varied issues of the WFL-DO challenge have been handled. The phrase "no free lunch" (NFL) is the source of this theory [
31]. In accordance with this theory, it is believed that no single MHM is capable of managing all of the improvement process tasks and identifying the global solutions that work best. It is difficult to develop new algorithms or strategies to enhance existing MHMs for more dynamic handling of complex improvement process in the NFL. This paper seeks to address the research gap by creating an innovative modified version of Particle Swarm improvement process (PSO) integrated with the Genetic Algorithm (GA), termed PSO-GA, to tackle the WFL-DO challenge. Because GA improves on PSO-found solutions while PSO investigates several regions, PSO-GA can effectively handle issues with multiple local optima. In the first phase of the framework, PSO improves the original variables; in the second phase, variables are changed for improved fitness.
3. Materials and Methods
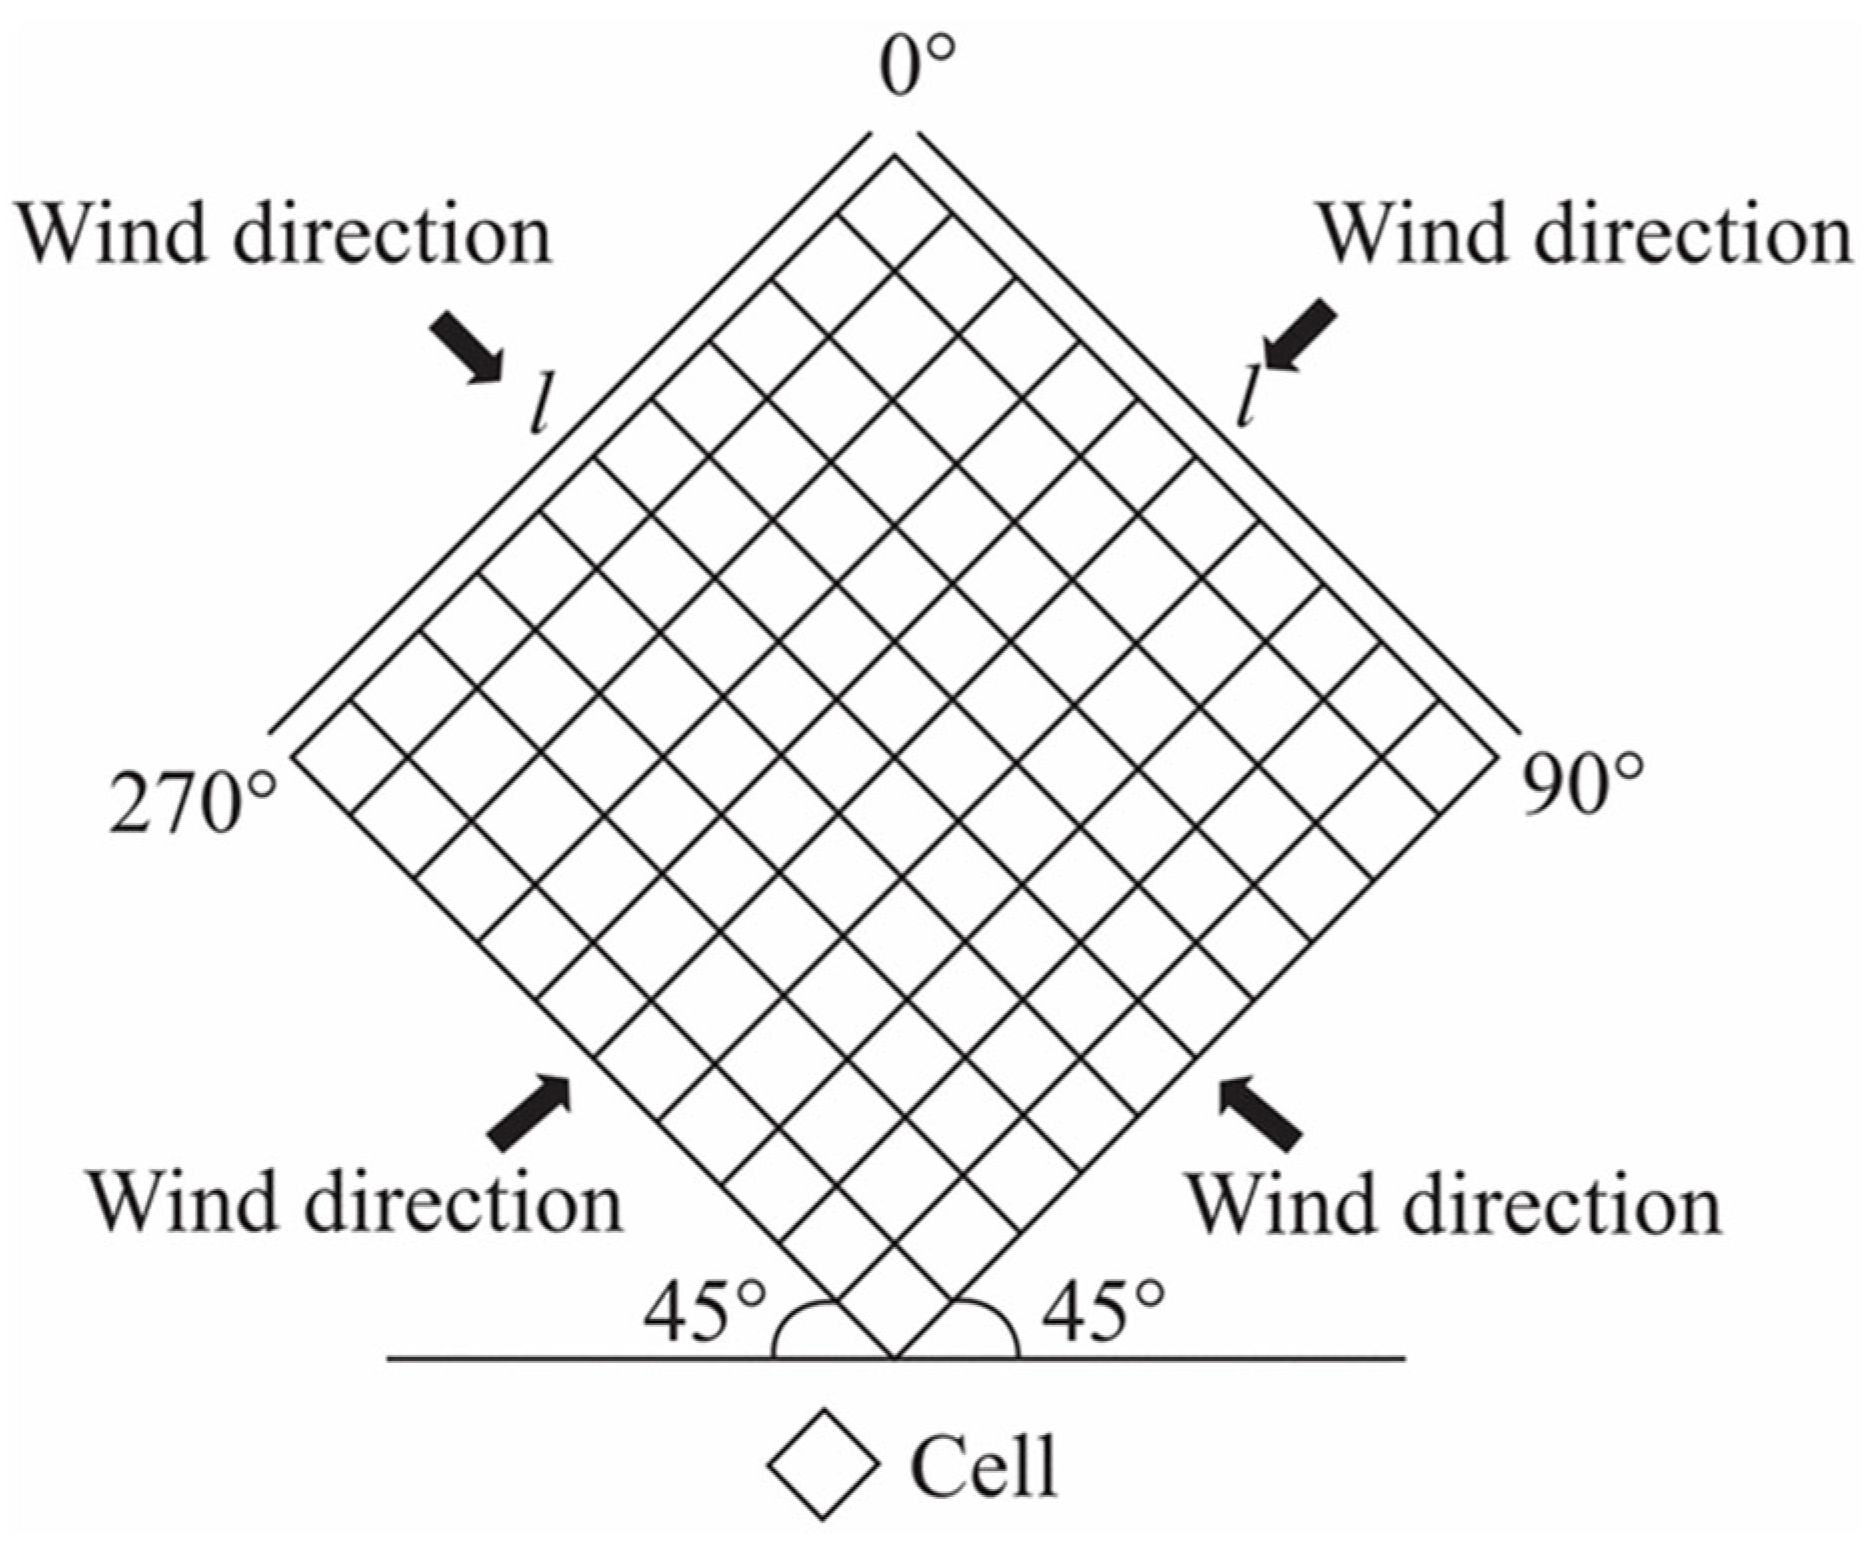
For a WF to be successful, the WTs must be positioned in the most efficient manner possible. This is because if the turbines are not properly positioned, they may not be able to produce the maximum amount of energy they are capable of generating. This is due to the wake effect, which can reduce the amount of energy produced by the WF if the turbines are not placed correctly [
32]. A square region that is subdivided into Nc identical cells (Nc=100) is used to analyze the WF that is being studied in this research. Each individual cell measures 5d by 5d, where "d" represents the diameter of the turbine. The pivot of each cell is considered to be a potential location for the installation of a wind turbine, with one being the maximum number of turbines that can be placed there, as demonstrated in
Figure 2. As a result, to lower the total cost per power unit, the suggested strategy must optimize a WF's turbine arrangement [
33].
Three wind speed scenarios—constant wind direction with constant wind speed, variable wind direction with constant wind speed, and variable wind direction with variable wind speed—are used to analyze the suggested PSO-GA on a multi-objective improvement process challenge (MOP). For the first time, a new version of Particle Swarm improvement process, known as the PSO-GA method, has been formulated to solve the WFL-DO challenge. The GA strategy is incorporated in PSO-GA to improve solution quality. The effectiveness of the PSO-GA procedural approach in comparison to other competing approaches has been confirmed through extensive simulations and comparisons to address the multi-objective programming aspects of wind turbine placement issues on conventional land areas.
3.1. Wake Model
It is difficult to predict wake losses in wind farms because of the complex nonlinear dynamics from which they originate. First, a variety of climatic, aerodynamic, and control factors affect how quickly wind strikes a turbine's blades and starts their motion. These factors include wind speed, turbulence level, the aerodynamic properties of the airfoil used in the blades, and the pitch angle of each blade separately. Each turbine model functions at a different ideal rate after taking into assessment all phases of nonlinear friction loss. Power is produced by a rotor driving a gearbox and a final generator. Simultaneously, the airflow leaving the turbine has a lower velocity than the incoming flow. Additionally, turbulence is created when turbine blades rotate, and its intensity can change depending on a number of factors, including the turbine's yaw angle, initial wind speed, turbulence intensity, and blade rotation speed. The resulting contrails distribute both vertically and horizontally, dispersing over time in a way that is nearly unforeseeable. Reasonable wake modelling can more accurately estimate wake loss because these impacting factors are complex.
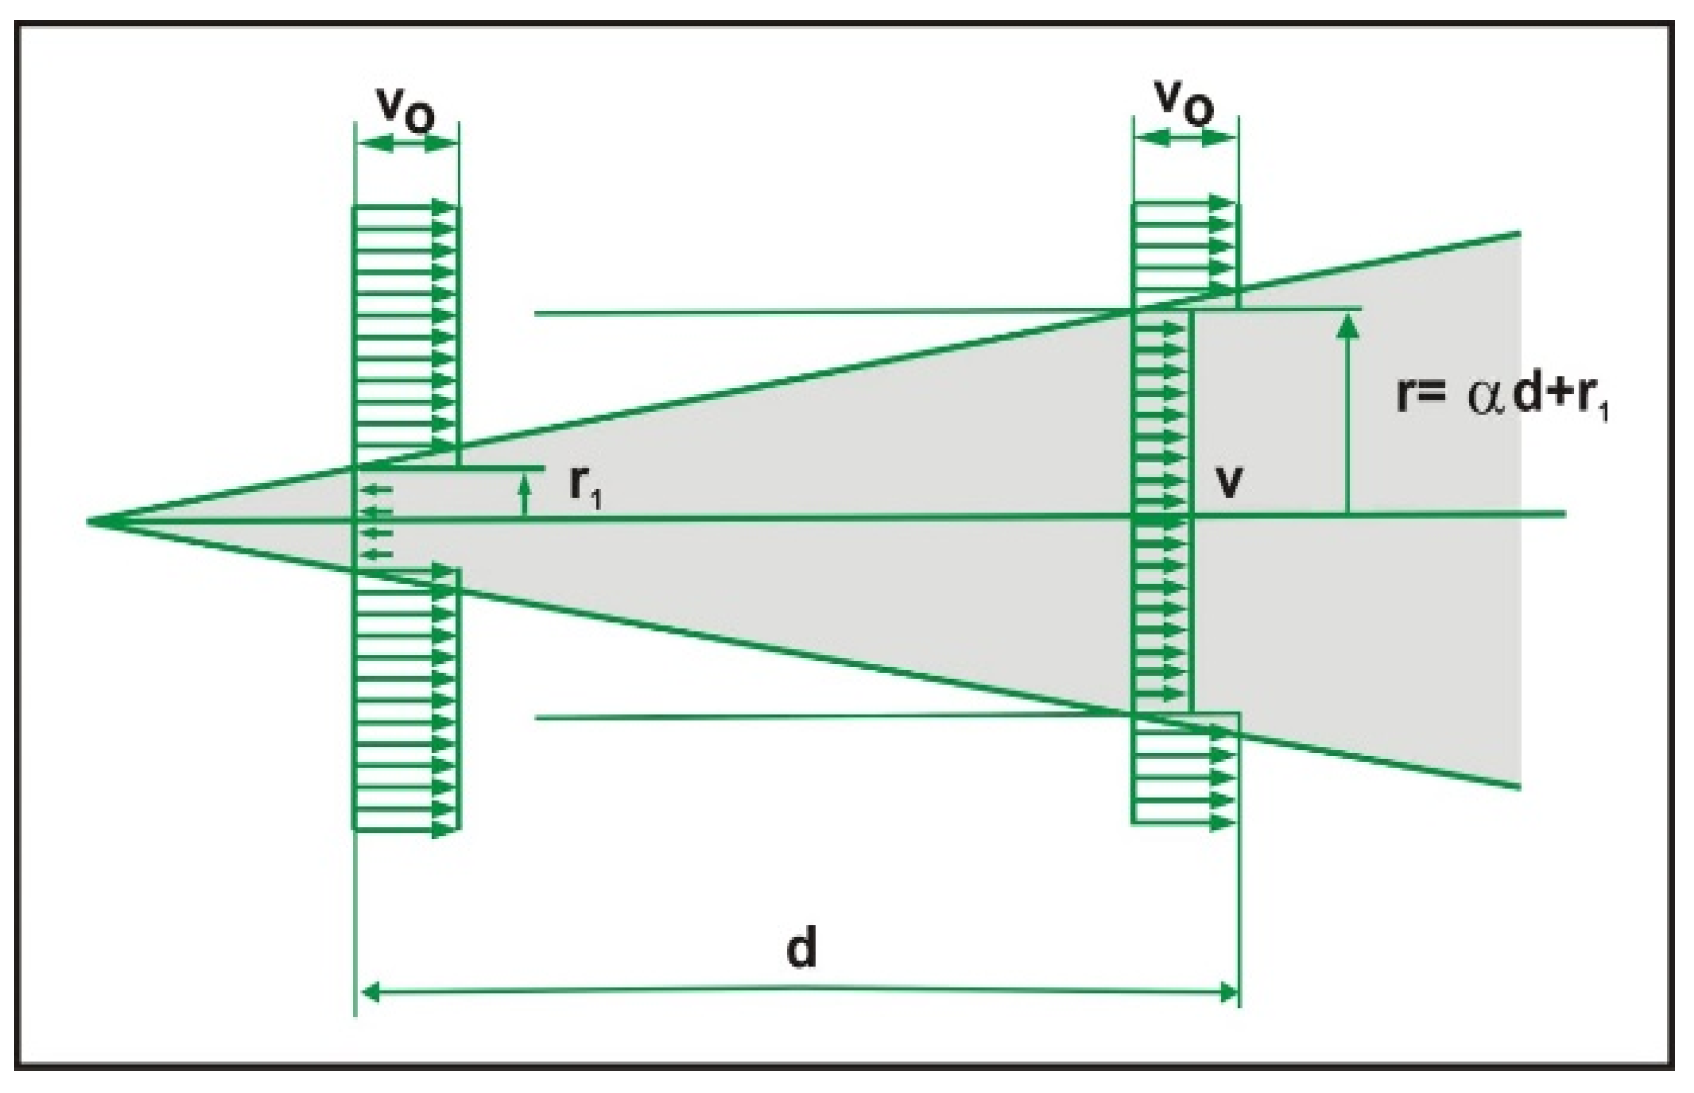
The wake left behind by the installed WTs (WTs) interrupts the WF, and the WTs are coupled with other WTs in the setup. The figure 3 illustrates the wake created behind a single wind turbine. As wind with free-stream velocity strikes the rotor, part of its kinetic energy is extracted to produce power. This extraction slows the airflow immediately behind the rotor, creating a region of reduced velocity. The wake gradually expands downstream due to turbulence and mixing with the surrounding air, and its radius grows linearly with distance. The relation 4 demonstrates how the wake radius increases from (rotor radius) where α is the axial induction factor and it is estimated from thrust coefficient given in the relation 3. The shaded region, therefore represents the zone of disturbed airflow extending downstream of the turbine. Eq 1 depicts that if there is no wake loss then downstream velocity of i
th turbine is same as free stream wind velocity.
Betz limit is used to measure wind speed for downstream wind turbine as mentioned in equation 2.
where, r represents the wake radius at distance of d behind the turbine
The wake radius r can be calculated from equation 4.
r
1 called the downstream radius of wind turbine and can be measured by eq 5, and α is the wake decay constant and was calculated by following eq 6.
The wind speed that a turbine experiences when its wake is not completely formed is known as the partial wake wind speed. The wind speed in this area, which is nearer the upstream turbine, may change. It takes into account the wake model and how the wake only partially covers the rotor area of the downstream turbine, which slows down the wind relative to undisturbed flow.
is the wake-affected area of the ith turbine,
is total area covered by the rotor of the ith turbine.
A WT encounters numerous wake effect forms from the upstream and/or downstream WTs in the final scenario [
34]. For example, the resultant v is represented as follows when numerous full wake effects (apart from partial wake effects) occurring on the i
th WT are taken into account.
m
i denotes the quantity of WTs under wake loss.
Figure 3.
Diagram of the single wake effect model.
Figure 3.
Diagram of the single wake effect model.
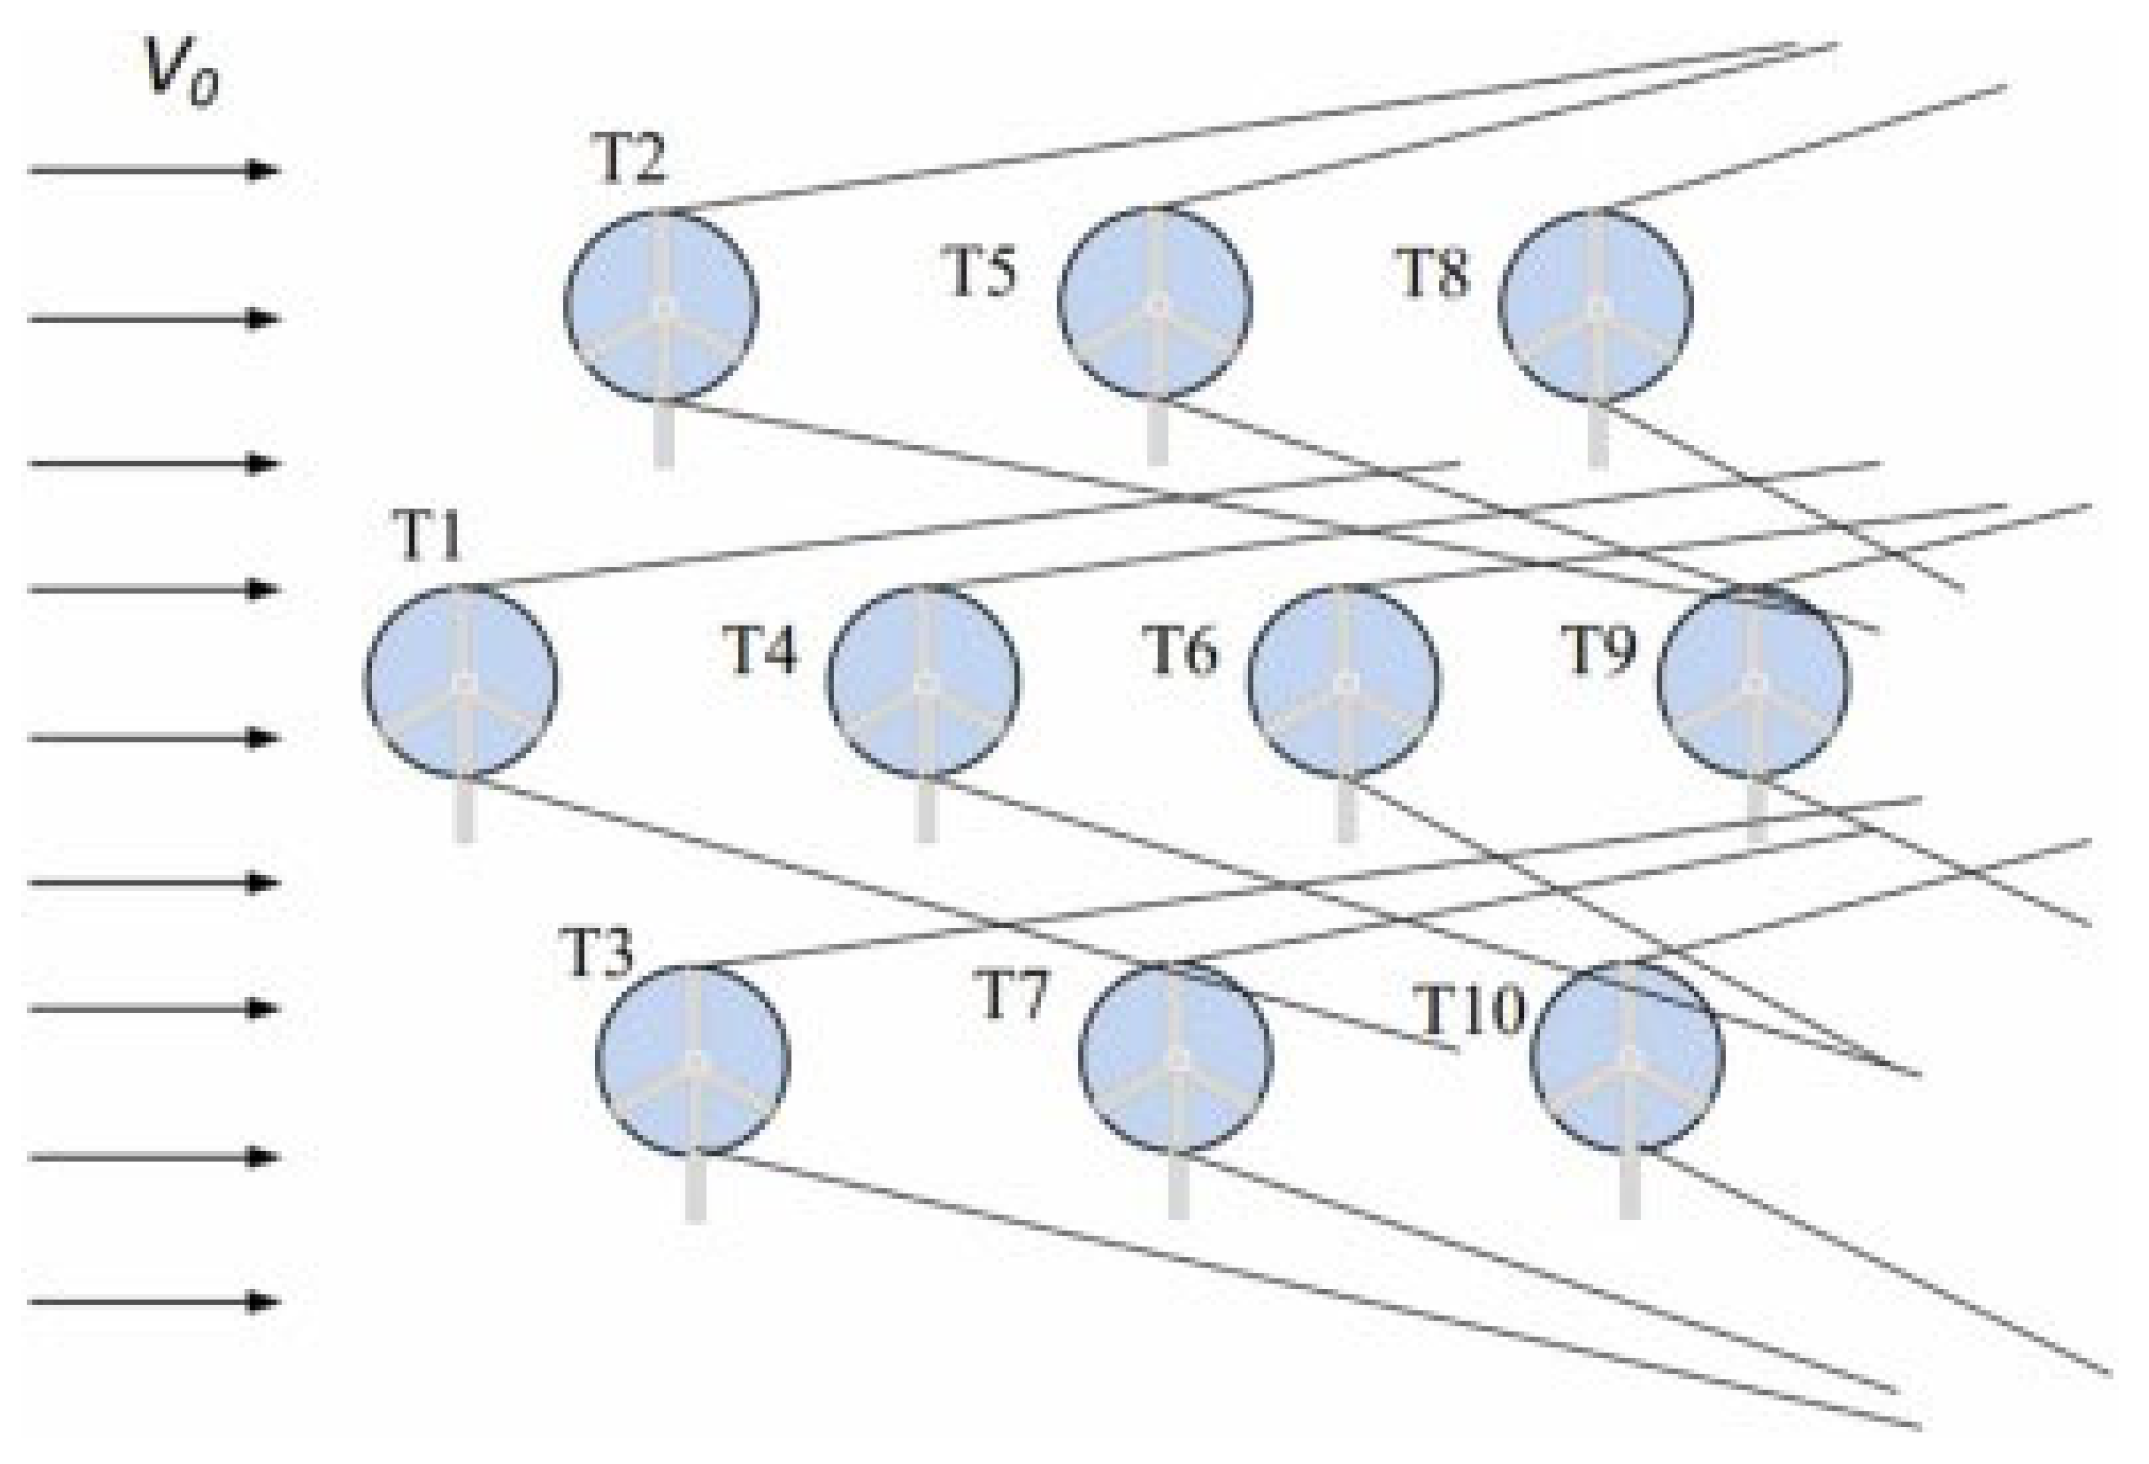
Figure 4 demonstrates how wakes behave in a WF with several turbines placed in rows. As upstream turbines generate wakes, downstream turbines are forced to operate in airflows with reduced velocity and higher turbulence. Each turbine in the array, therefore, experiences different inflow conditions depending on its position relative to the wakes created by others. This overlapping or “multiple wake effect” findings in reduced energy yield and efficiency for downstream turbines. The figure also demonstrates the spacing between turbines, which is a critical design factor; greater spacing helps minimize wake overlap but requires more land, while tighter spacing increases wake losses.
3.2. Power Model
A wind turbine's energy yield (P
wt) depends on several variables. Total electrical power (available) by the turbine is measured from eq 9.
Where,
ρ is air density, v is the wind velocity, r is the rotor radius & Cp is Power coefficient
Downstream power taken out from the turbine is measured by the following equation 10 [
35].
Where, v is the downstream wind velocity.
Total available electrical power taken out from the turbine is measured by the following equation 11.
Where, v is free stream wind velocity.
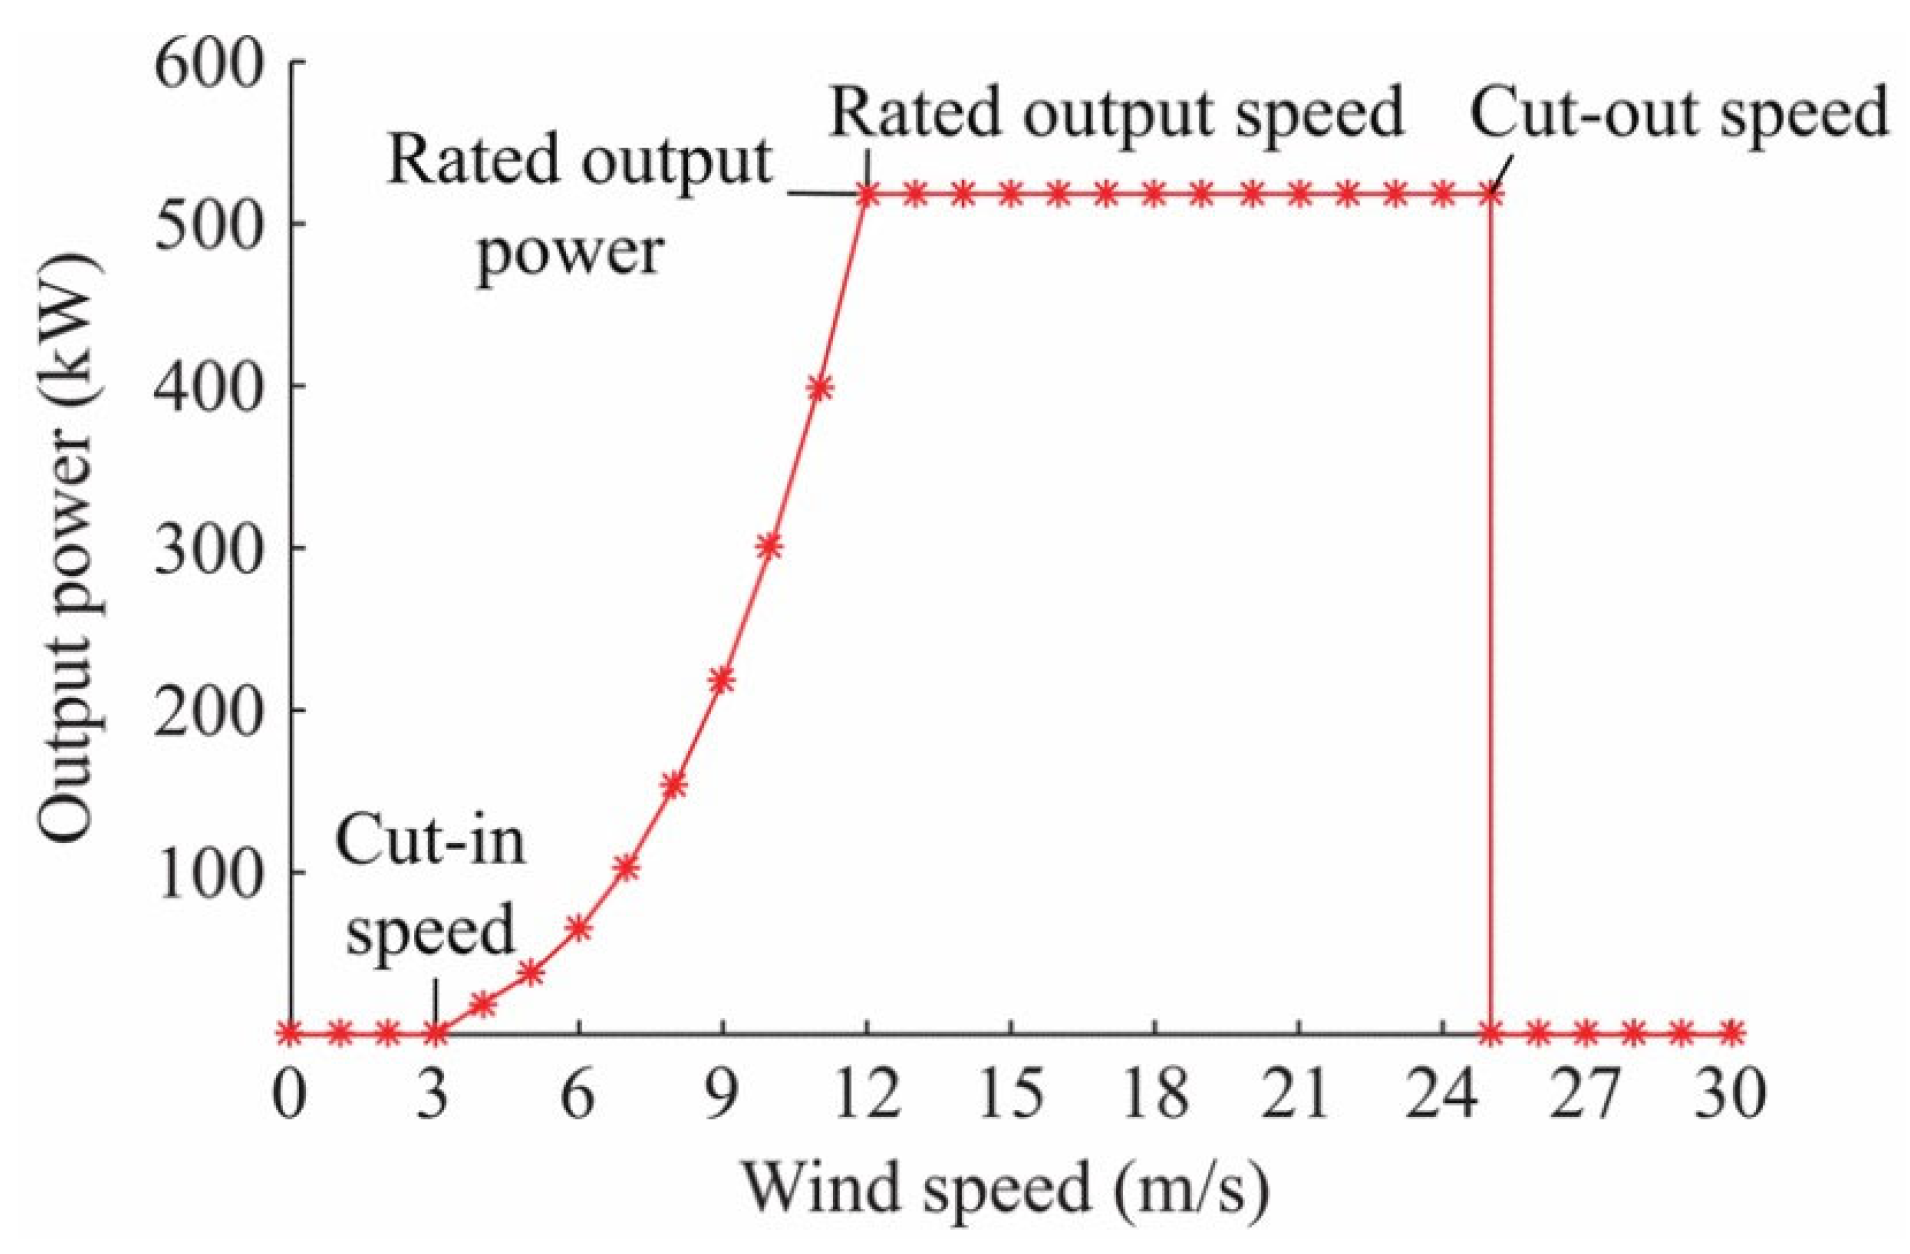
The following relation (12) determines the cut-in, cut-out, rated wind speeds, and associated output power for each WT, as shown in
Figure 5.
3.3. Cost Model
The cost of the whole WF is measured by
Where N is the total number of WTs
3.4. Objective Function
Objective functions of the study are as under.
3.5. Constraints Modeling
The first restriction that needs to be taken into account is that every wind turbine needs to be situated inside the land where the WF is intended to be constructed. This restriction can be stated as follows:
Another constraint to be considered is that two nearby WTs must be at a distance limit of. The following is a mathematical formulation of this limitation.
In this study, y-axis distance is chosen to be eight times the wind turbine's rotor radius.
3.6. Energy Efficiency Index (EEI)
The EEI is the effectiveness with which a wind farm design transforms available land area into usable electrical power.
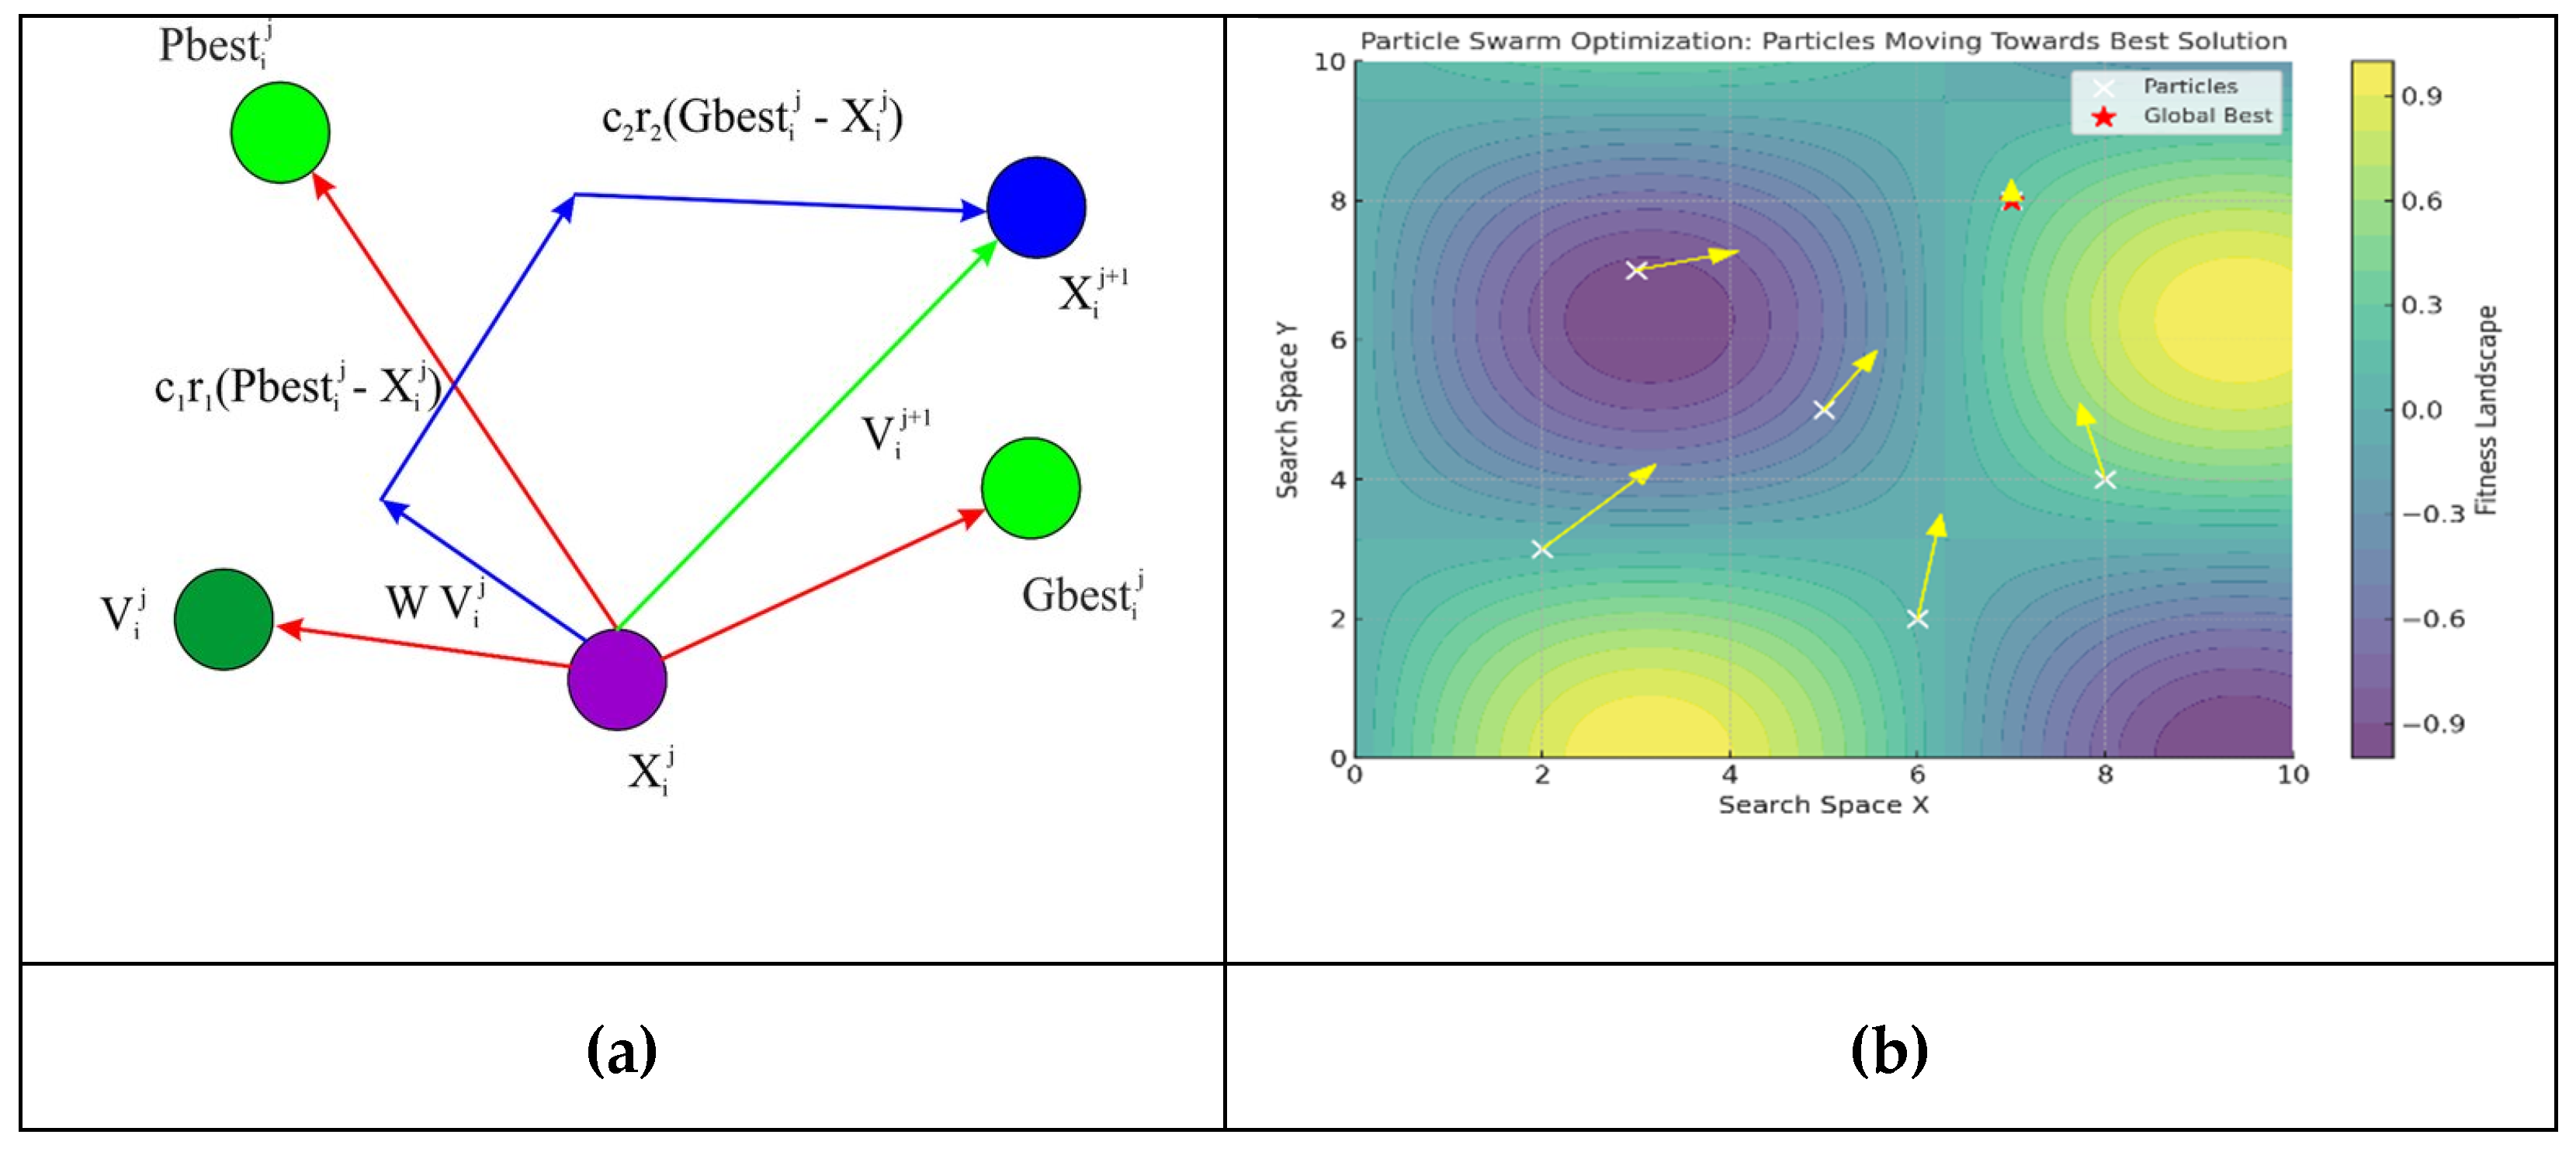
3.7. Particle Swarm Improvement Process (PSO) Algorithm
Particle Swarm improvement process (PSO) is a computer-based strategy for solving challenging problems where we must identify the most desirable solution among a large number of options available to us. PSO is based on the flight behavior of birds in flocks or fish in schools. And when a bunch of birds are seeking food, no one knows the exact location of the food. But by testing one after another and improving by observing the best position that has been discovered to date, they finally get to the food. The same concept is employed by PSO to find the answers to mathematics and engineering problems [
37].
In PSO, the algorithm treats every possible solution as a particle, and together these particles form a swarm searching for the best result. There are two things that each particle possesses: Position -the solution it is proposing at the moment.
Where X represents the turbine position.
Velocity reflects the direction and pace at which it will progress towards a superior solution. In the search, every particle recalls.
= Inertia weight, = Particle best position, = Global best position, & are random variables, while, = Freestream wind velocity.
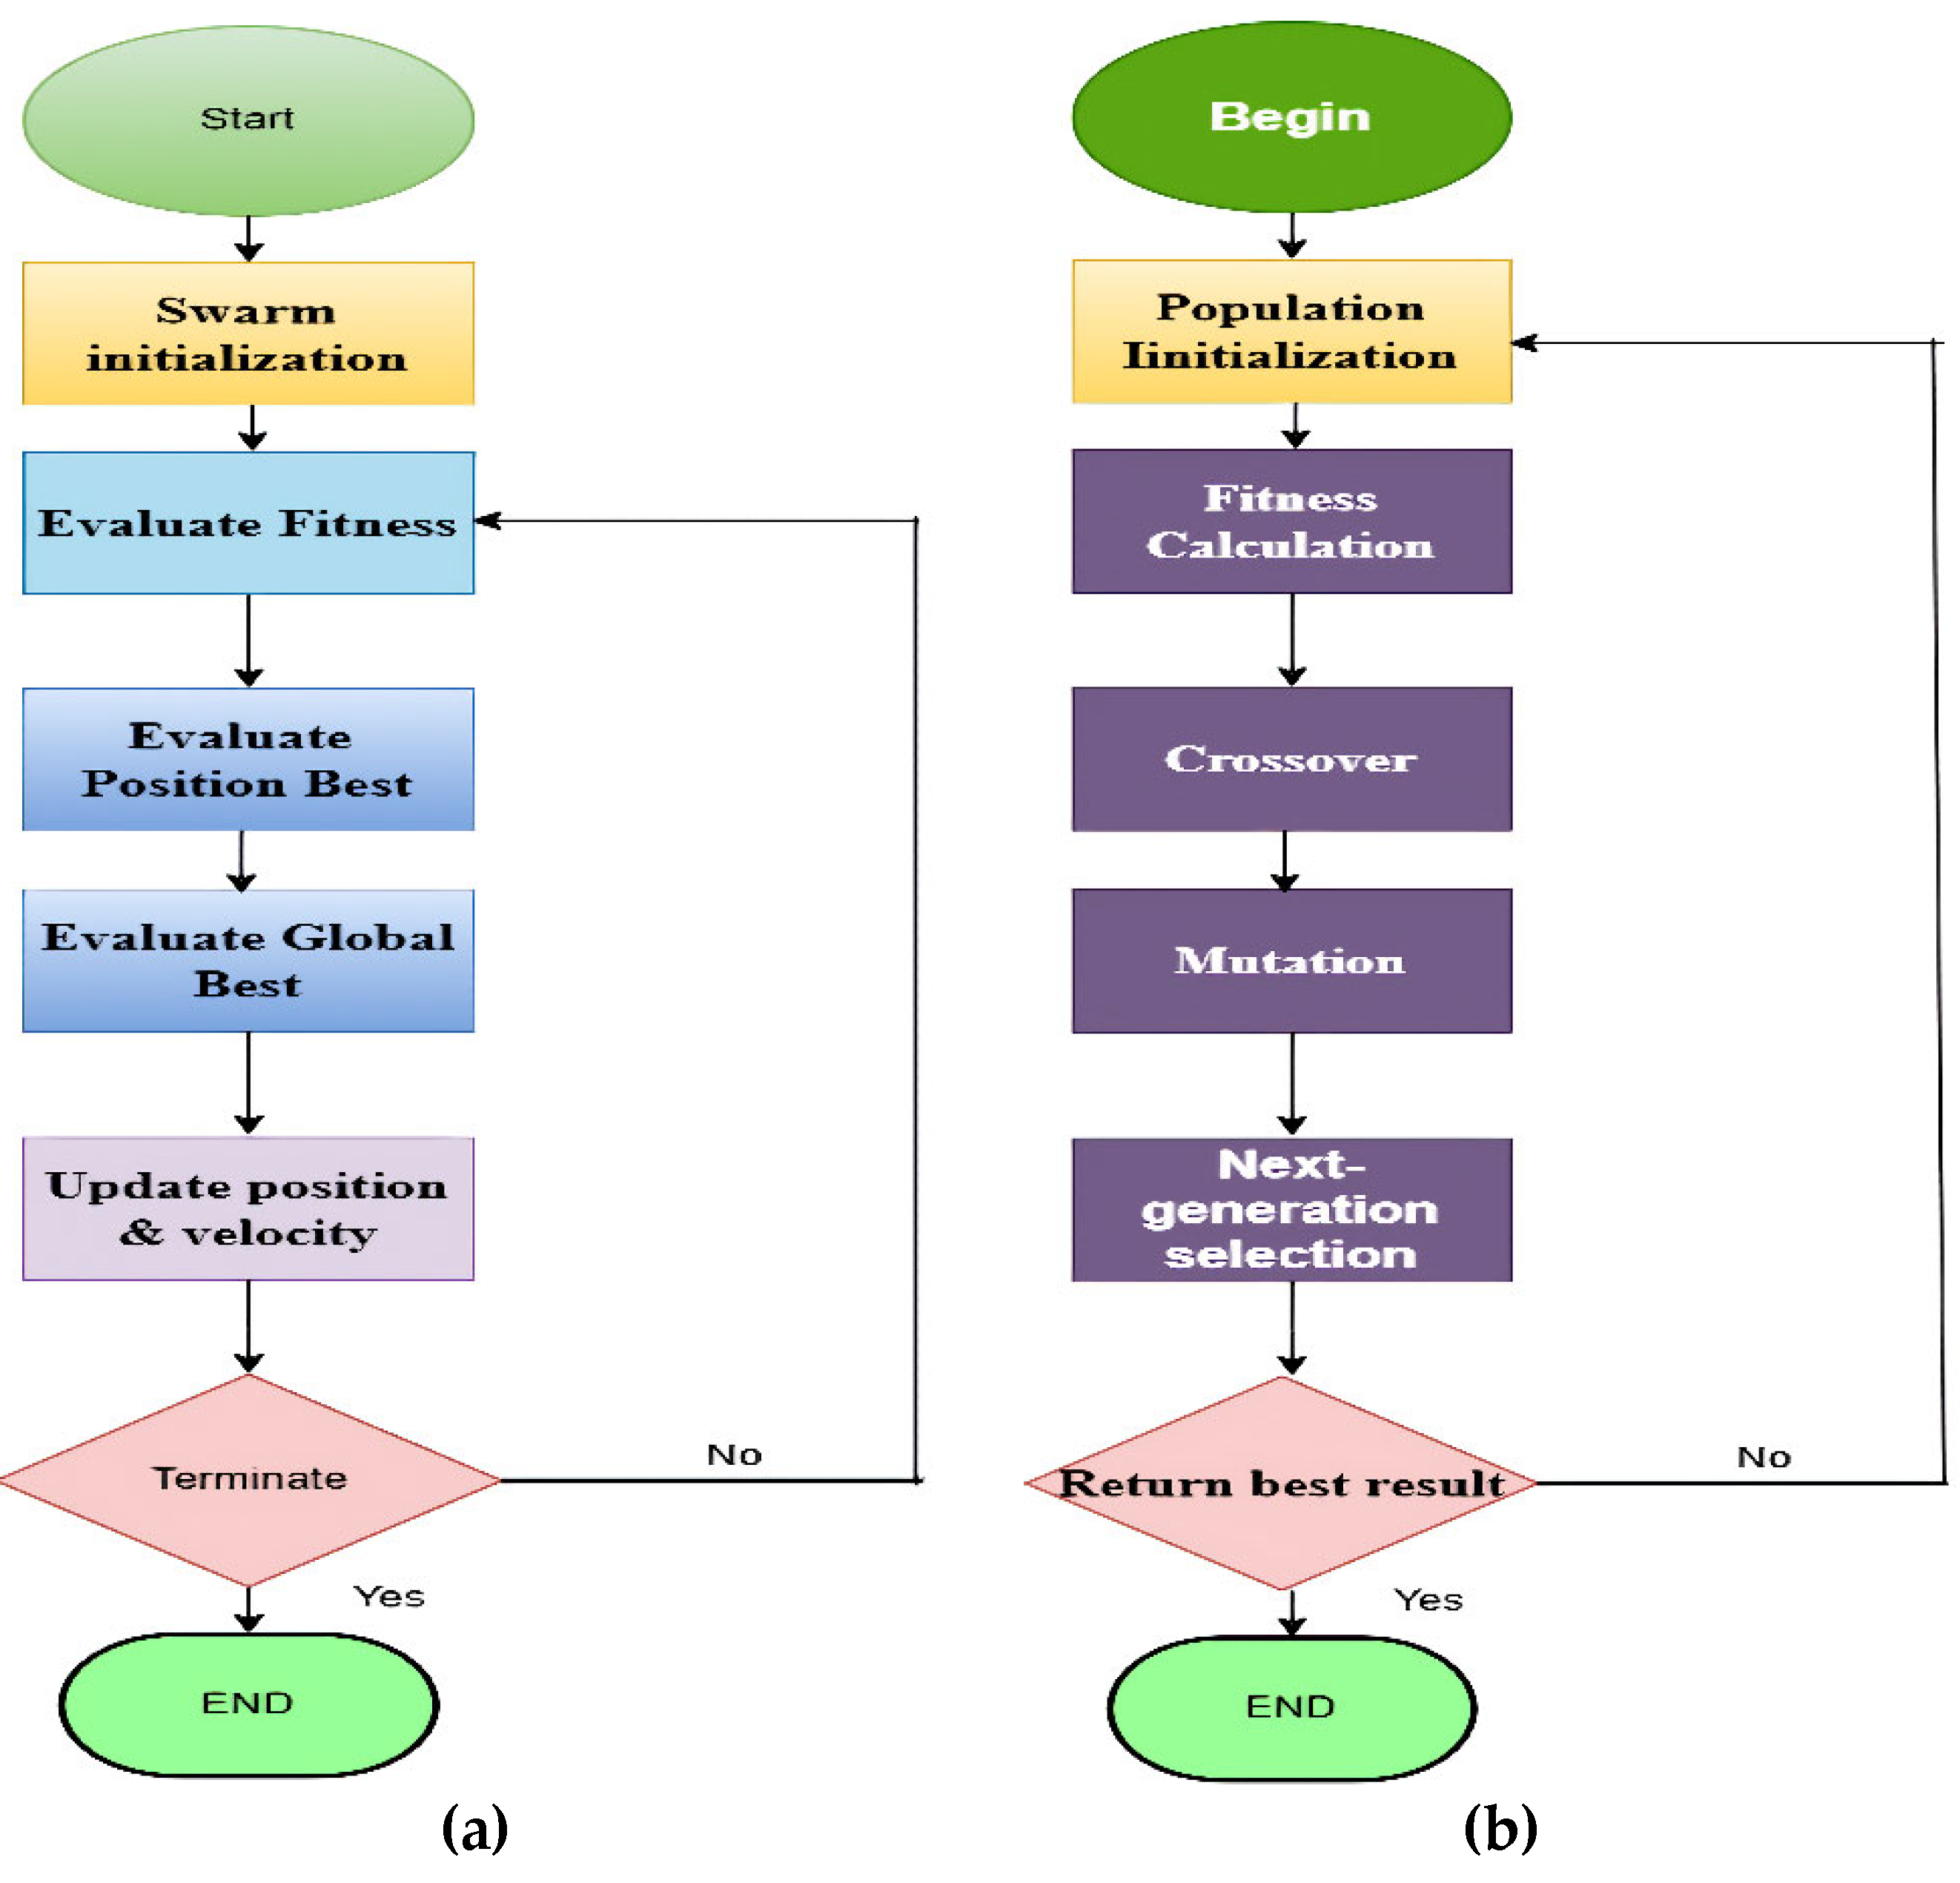
Figure 6 (a) represents the Flow Chart of the PSO Algorithm:
The iteration procedure of any particle in each generation is illustrated in
Figure 7 (a) and
Figure 7 (b). A sociological analysis of the velocity update formula reveals that the influence of the particle's prior velocity is the first component of this updated formula (Eq. 15). Because it demonstrates that the particle conducts inertial motion in accordance with its own velocity and has confidence in its current moving state, the parameter ω is referred to as the inertia weight. The distance between the particle's current location and its ideal location determines the second component, often known as the "cognitive" item. It refers to the particle's own reasoning, that is, the movement brought about by its own experiences [
36].
3.8. Genetic Algorithm (GA)
According to El-Shorbagy and El-Refaey [
38], the GA is an appropriate tool for addressing improvement process problems that involve a large number of variables and limitations. The Genetic Algorithm (GA) is a population-based improvement process method inspired by the principle of natural selection. It employs genetic operators such as selection, crossover, and mutation to evolve better solutions across generations. A population size of 500, a generation count of 2000, a crossover rate of 0.7, and a mutation rate of 0.02 are used in this study. The GA follows a structured sequence: random initialization, fitness evaluation, parent selection, crossover, mutation, and elitist replacement.
Figure 6 (b) presents the flowchart of the GA improvement process.
Genetic Algorithm (GA) is a search method that is based on artificial intelligence and has been widely applied in a range of engineering domains. It is able to identify the best possible result on a global scale [
39].
Simply: A Genetic Algorithm is survival of the fittest, but in computer problems. It can continually experiment with solutions until it finds a solution that functions well by replicating the mechanisms by which nature has provided species with improvements over time.
3.9. Proposed (PSO-GA) Algorithm
The hybrid PSO-GA method, which combines the global search capability of PSO with the solution refining capabilities of GA, can enhance the turbine placement in WF layout improvement process. This is especially helpful for complicated improvement process problems with a large search space and several local optima. In order to update the turbine placements, the hybrid algorithm would take into account both the best possible solution currently determined by PSO and the new solutions produced by GA's crossover and mutation. Turbine layouts produced using this strategy are more resilient and effective and are less likely to deviate from ideal configurations.
Recent improvements in the engineering improvement process have allowed for the move from traditional trial-and-error design techniques to fully automated ones. This is primarily due to the rapid development of metaheuristic search algorithms, which have been shown to be efficient and robust when dealing with real-world issues. Many scholars have already investigated the subject of best possible layout design for wind farms. But still, there is a gap present.
4. Results
The objective of this research was to evaluate the effectiveness of the PSO-GA hybrid algorithm in optimizing the layout of WTs (WTs) for maximizing the electrical energy yield of a WF while adhering to industry-standard separation distances to avoid wake interference. Through extensive simulation using the proposed framework, the PSO-GA strategy demonstrated significant improvement in both energy yield and cost efficiency of the WF. The case studies analyzed three different WF configurations, each involving a 2 km × 2 km area subdivided into 100 cells of 200 m × 200 m. The framework was tested under varying conditions of wind speed, and wind turbine direction with a consistent focus on the minimization of wake interference while maintaining high turbine efficiency & power generation output. PSO algorithm explored a broad search space, effectively navigating through multiple local optima to identify promising candidate solutions. The PSO's ability to adjust the particle positions in the search space using its velocity and acceleration coefficients allowed it to investigate various regions of the WF layout space without getting stuck in suboptimal solutions. The PSO variables are used for the quick response; the particle restriction variables are inertia weight coefficient = 0.5, Acceleration coefficient constants C1=2.5, C2=2.5, and the maximum number of iterations Itermax=100. A uniform distribution is applied in picking random numbers R1 and R2 between 0 and 1.
Once the PSO had determined a near-best possible layout, the GA was used to refine the positions of the turbines, improving the energy yield and further reducing the wake interference. The genetic operators (crossover and mutation) enabled the algorithm to explore variations in turbine positioning, balancing power yield improvement process with the minimization of wake effects. Through the iterative refinement process, the PSO-GA algorithm outperformed standalone PSO and GA algorithms in terms of the total electrical energy yield, with a substantial increase in energy yield over conventional layout configurations. The improvement process ensured that each turbine was placed in a location that maximized its energy capture potential, while also preventing excessive overlap in the wake regions of adjacent turbines.
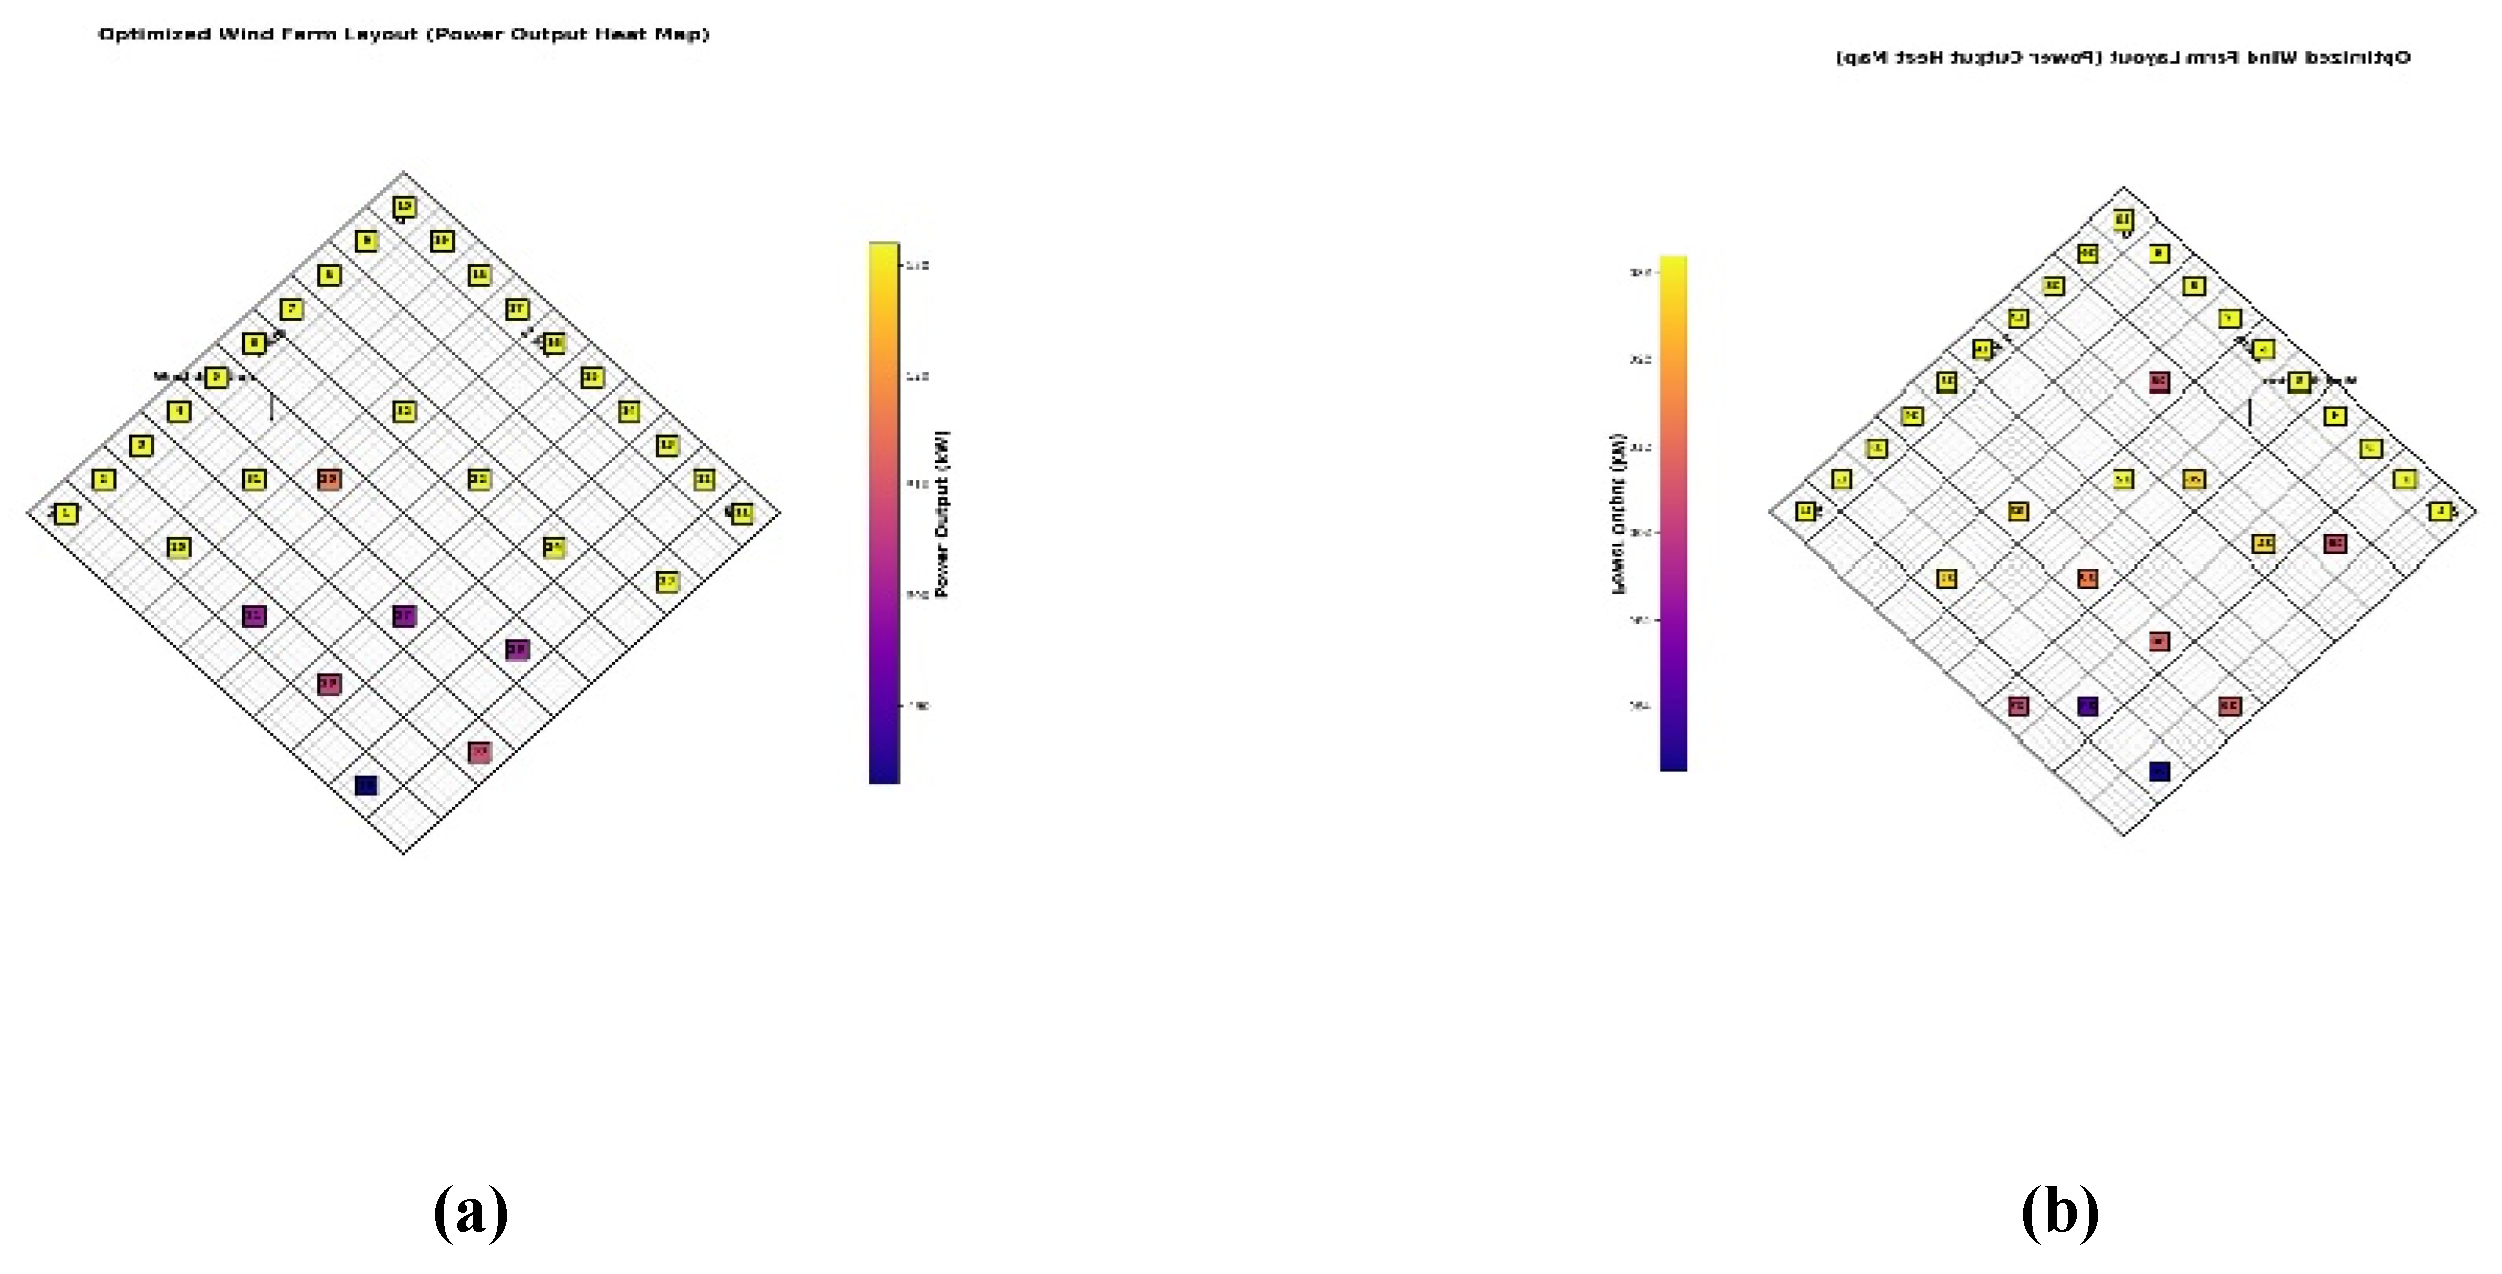
4.1. Case 1
Figure 10 (a) represents the improved layout obtained through the proposed hybrid PSO-GA approach. While
Figure 10 (b) reflects the reference layout used for comparison.
Figure 8.
Layout of wind farm (
a). Layout of wind farm by the proposed work (
b). Layout of wind farm by [
40].
Figure 8.
Layout of wind farm (
a). Layout of wind farm by the proposed work (
b). Layout of wind farm by [
40].
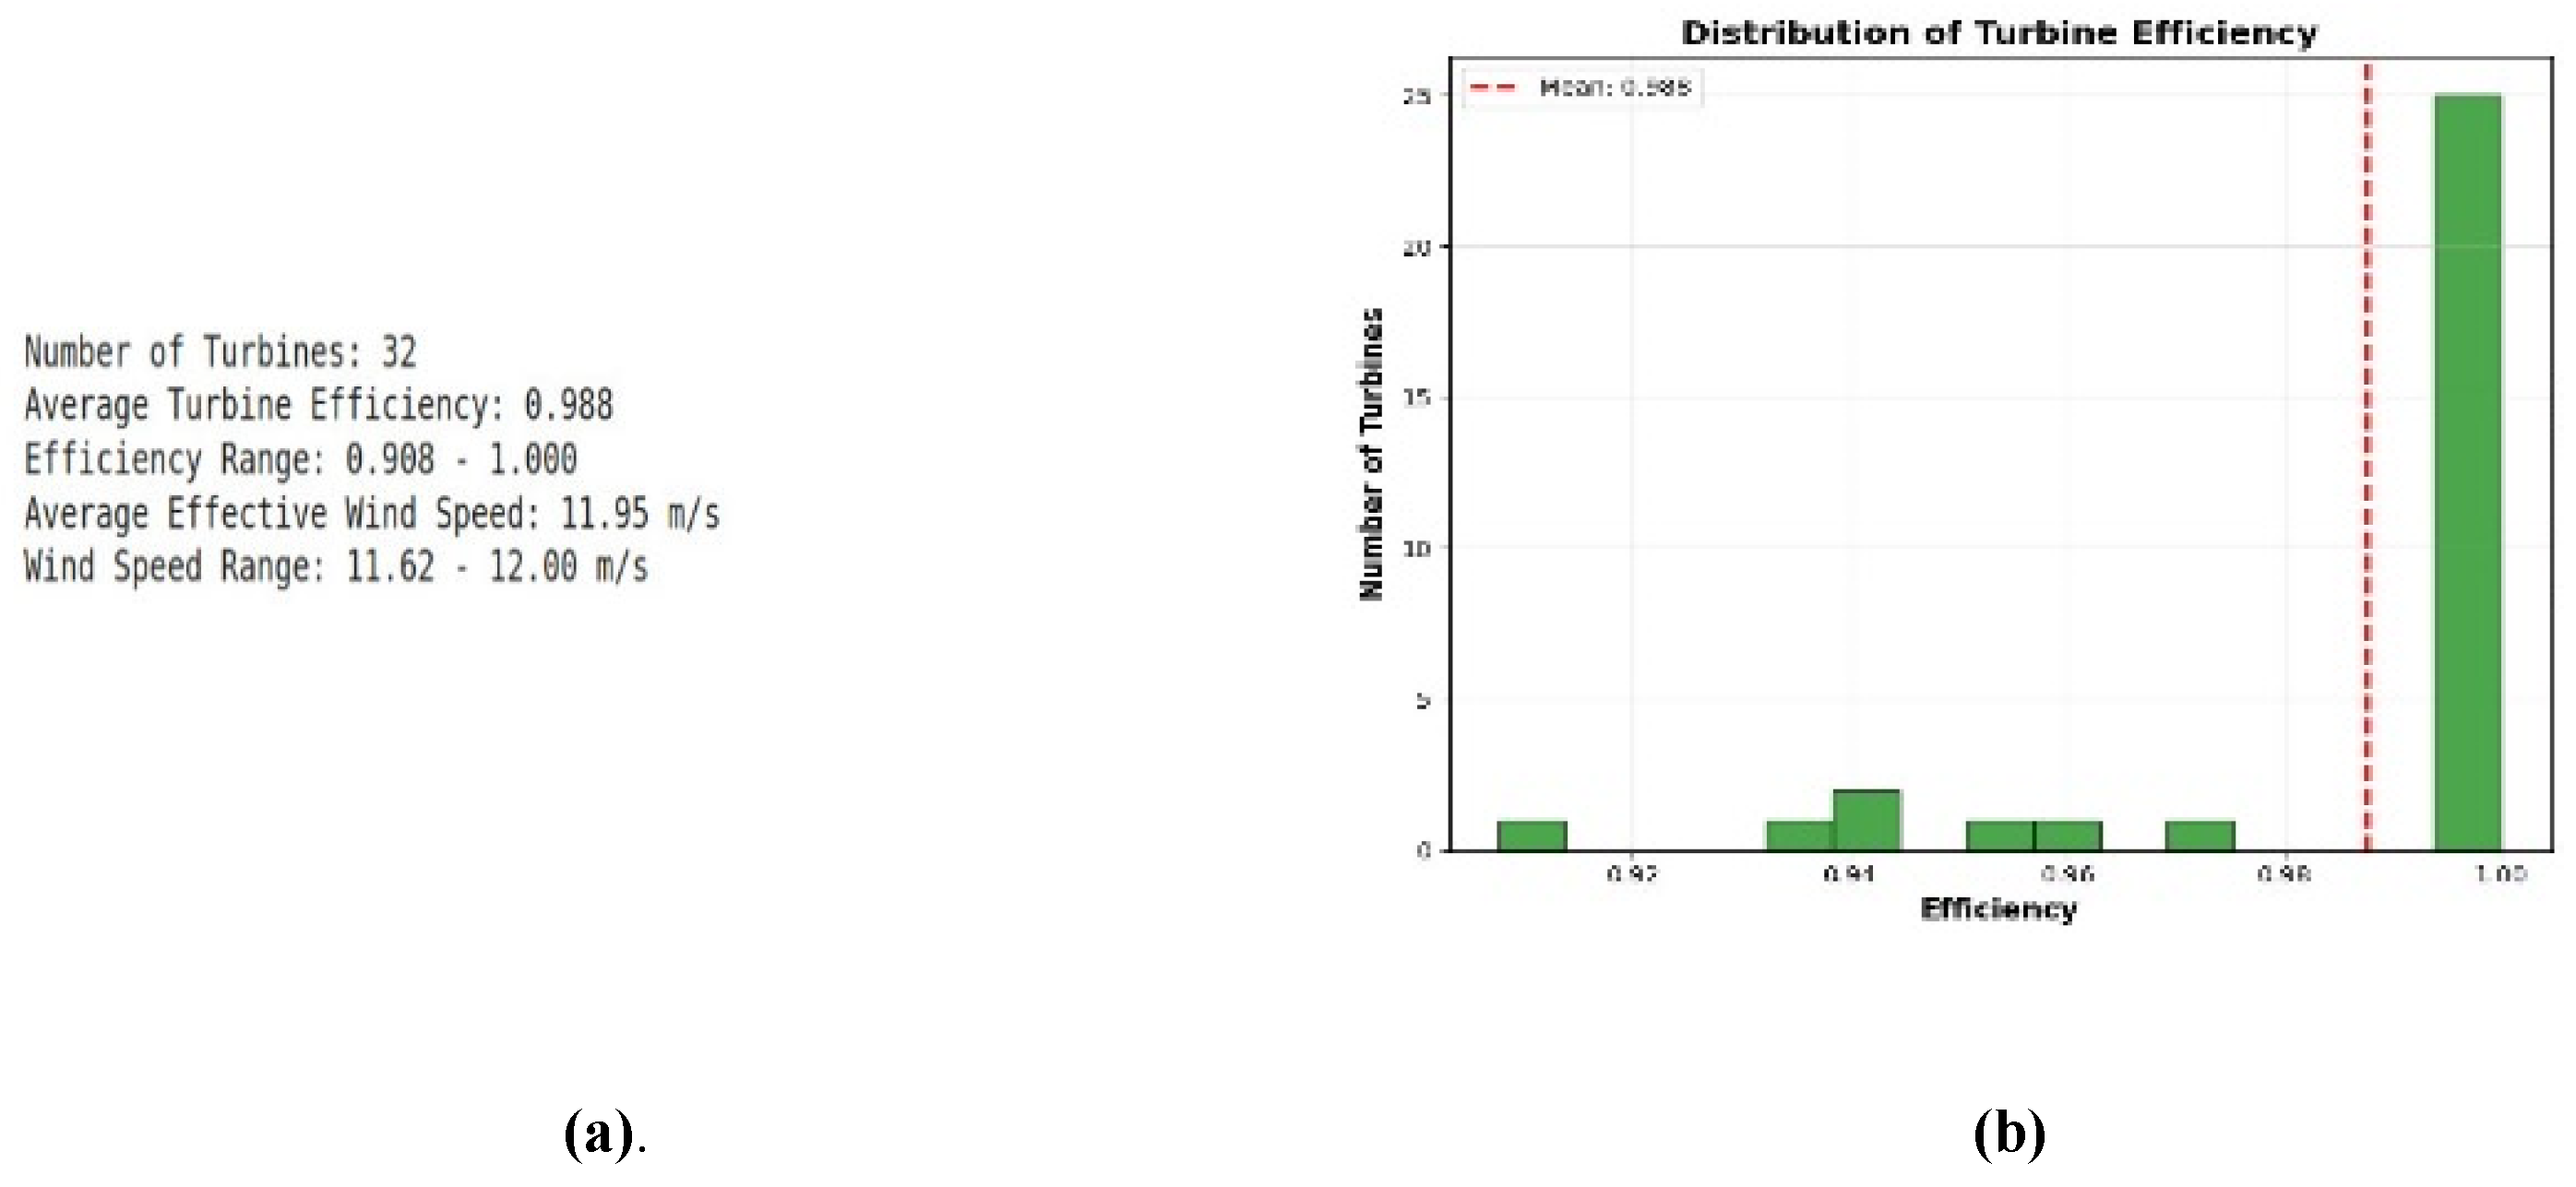
The optimum configuration produces a maximum power output with 32 turbines working under a uniform inflow wind speed of 12 m/s, as shown in
Figure 9(a) and 9(b). An average turbine efficiency of roughly 98.8% and individual turbine efficiencies ranging from 98.8% to 100% show that the algorithm converges on a highly efficient configuration. There is little variance in the effective wind speed distribution between 11.62 and 12.00 m/s throughout the farm.
Table 1 demonstrates the performance of the proposed layout with previous research. The proposed strategy extracts 16389.73 kW, which is higher than the earlier reported 16326.55 kW. A major difference appears in wake losses: the proposed configuration records 199.06 units, in place of 262.21 units, indicating that the proposed layout better minimizes wake interactions. Overall, the proposed layout demonstrates superior optimization by enhancing power capture and reducing wake-induced losses, outperforming the approach presented in [
40].
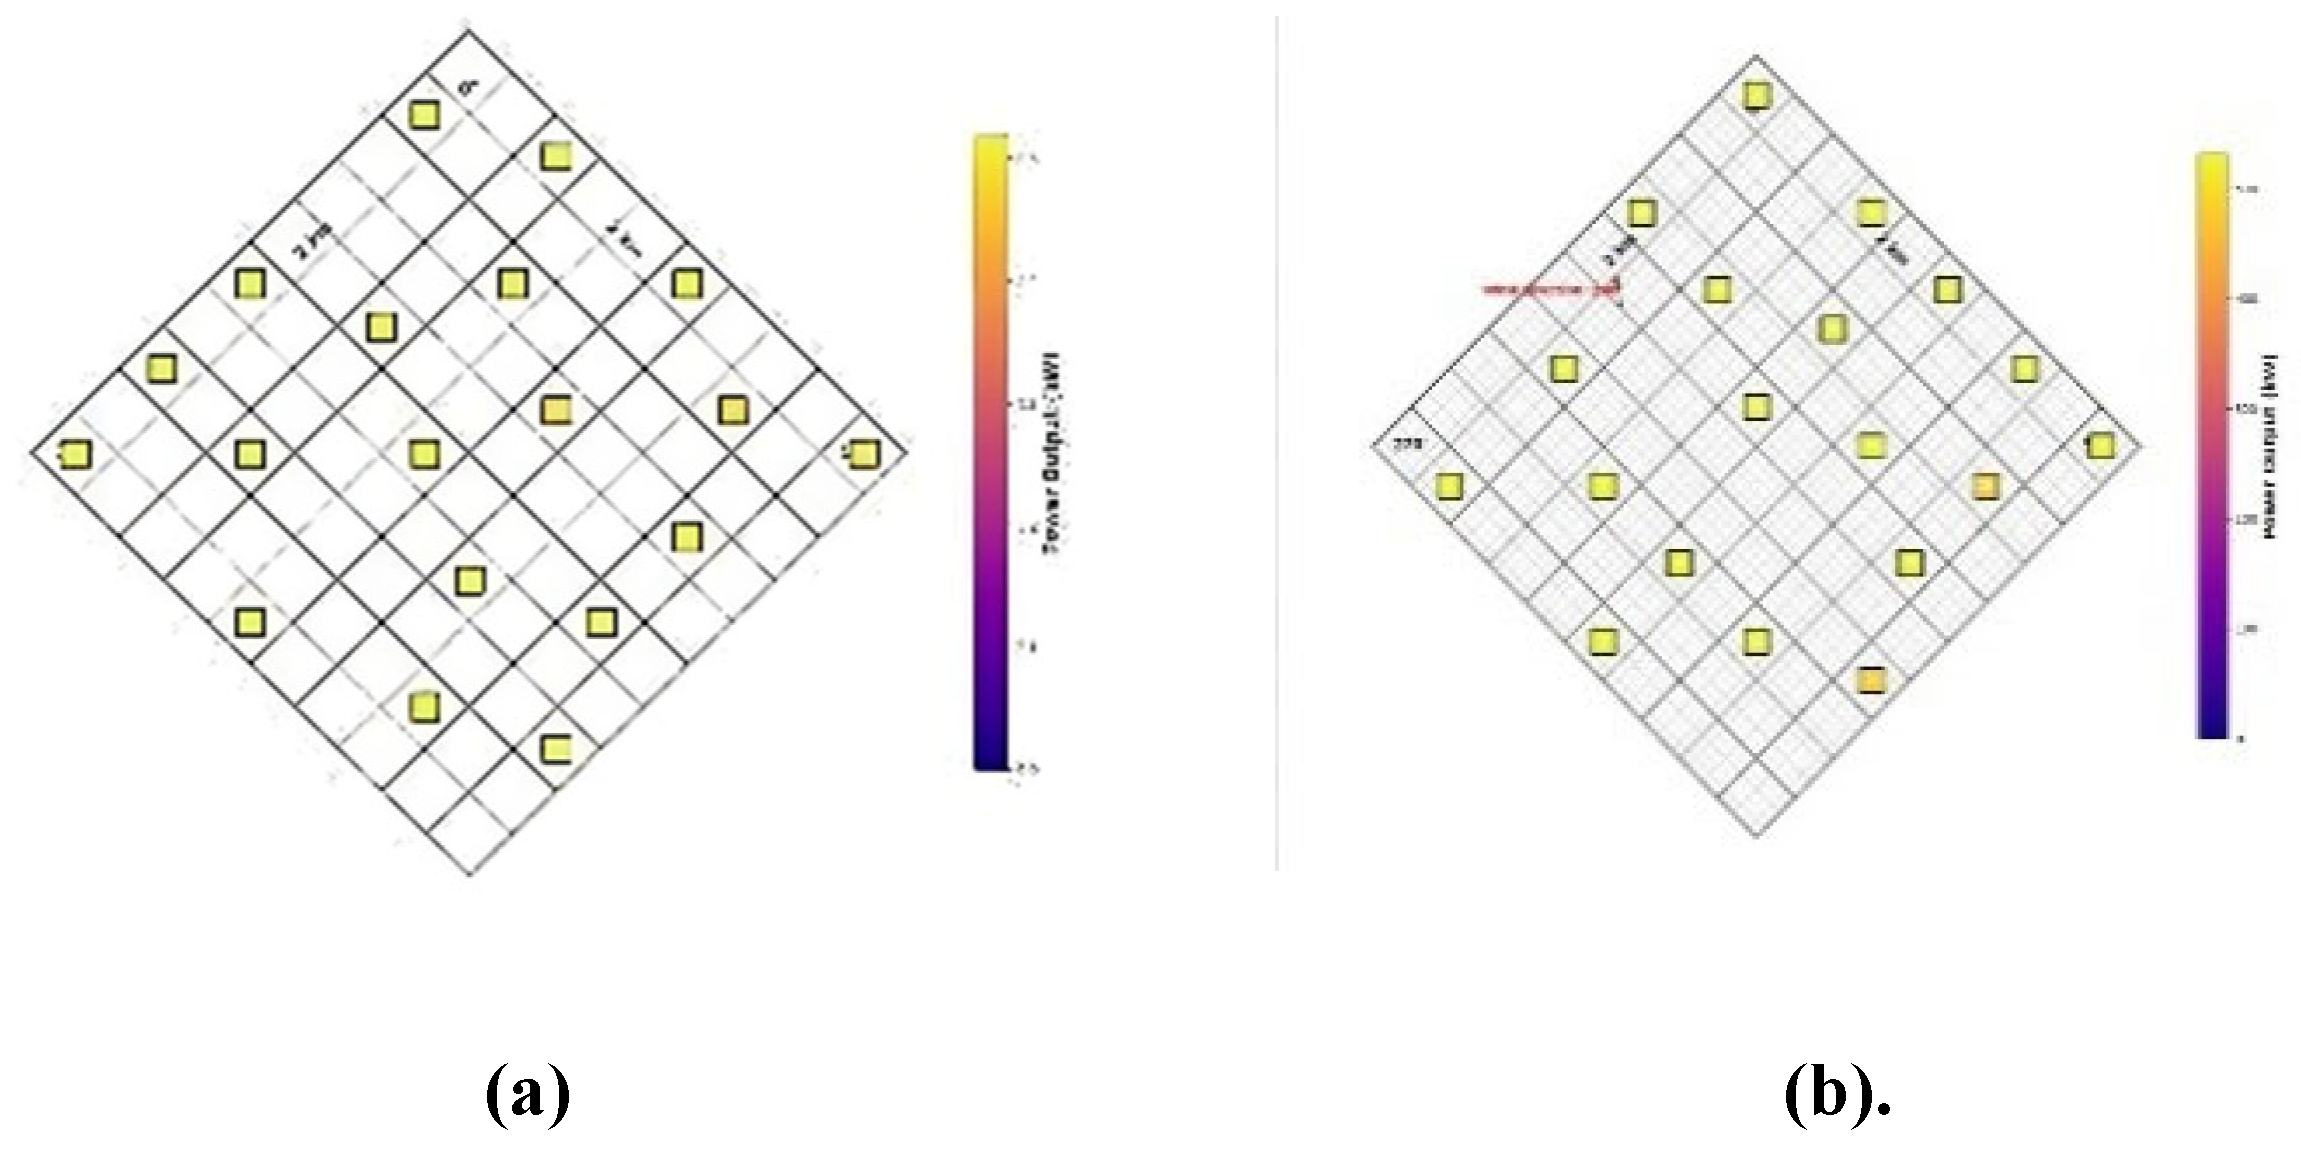
4.2. Case 2
Figure 10 (a) represents the improved layout obtained through the proposed hybrid PSO-GA approach. While
Figure 10 (b) reflects the reference layout used for comparison.
Figure 10.
Layout of wind farm (
a). Layout of wind farm by the proposed work (
b). Layout of wind farm by [
40].
Figure 10.
Layout of wind farm (
a). Layout of wind farm by the proposed work (
b). Layout of wind farm by [
40].
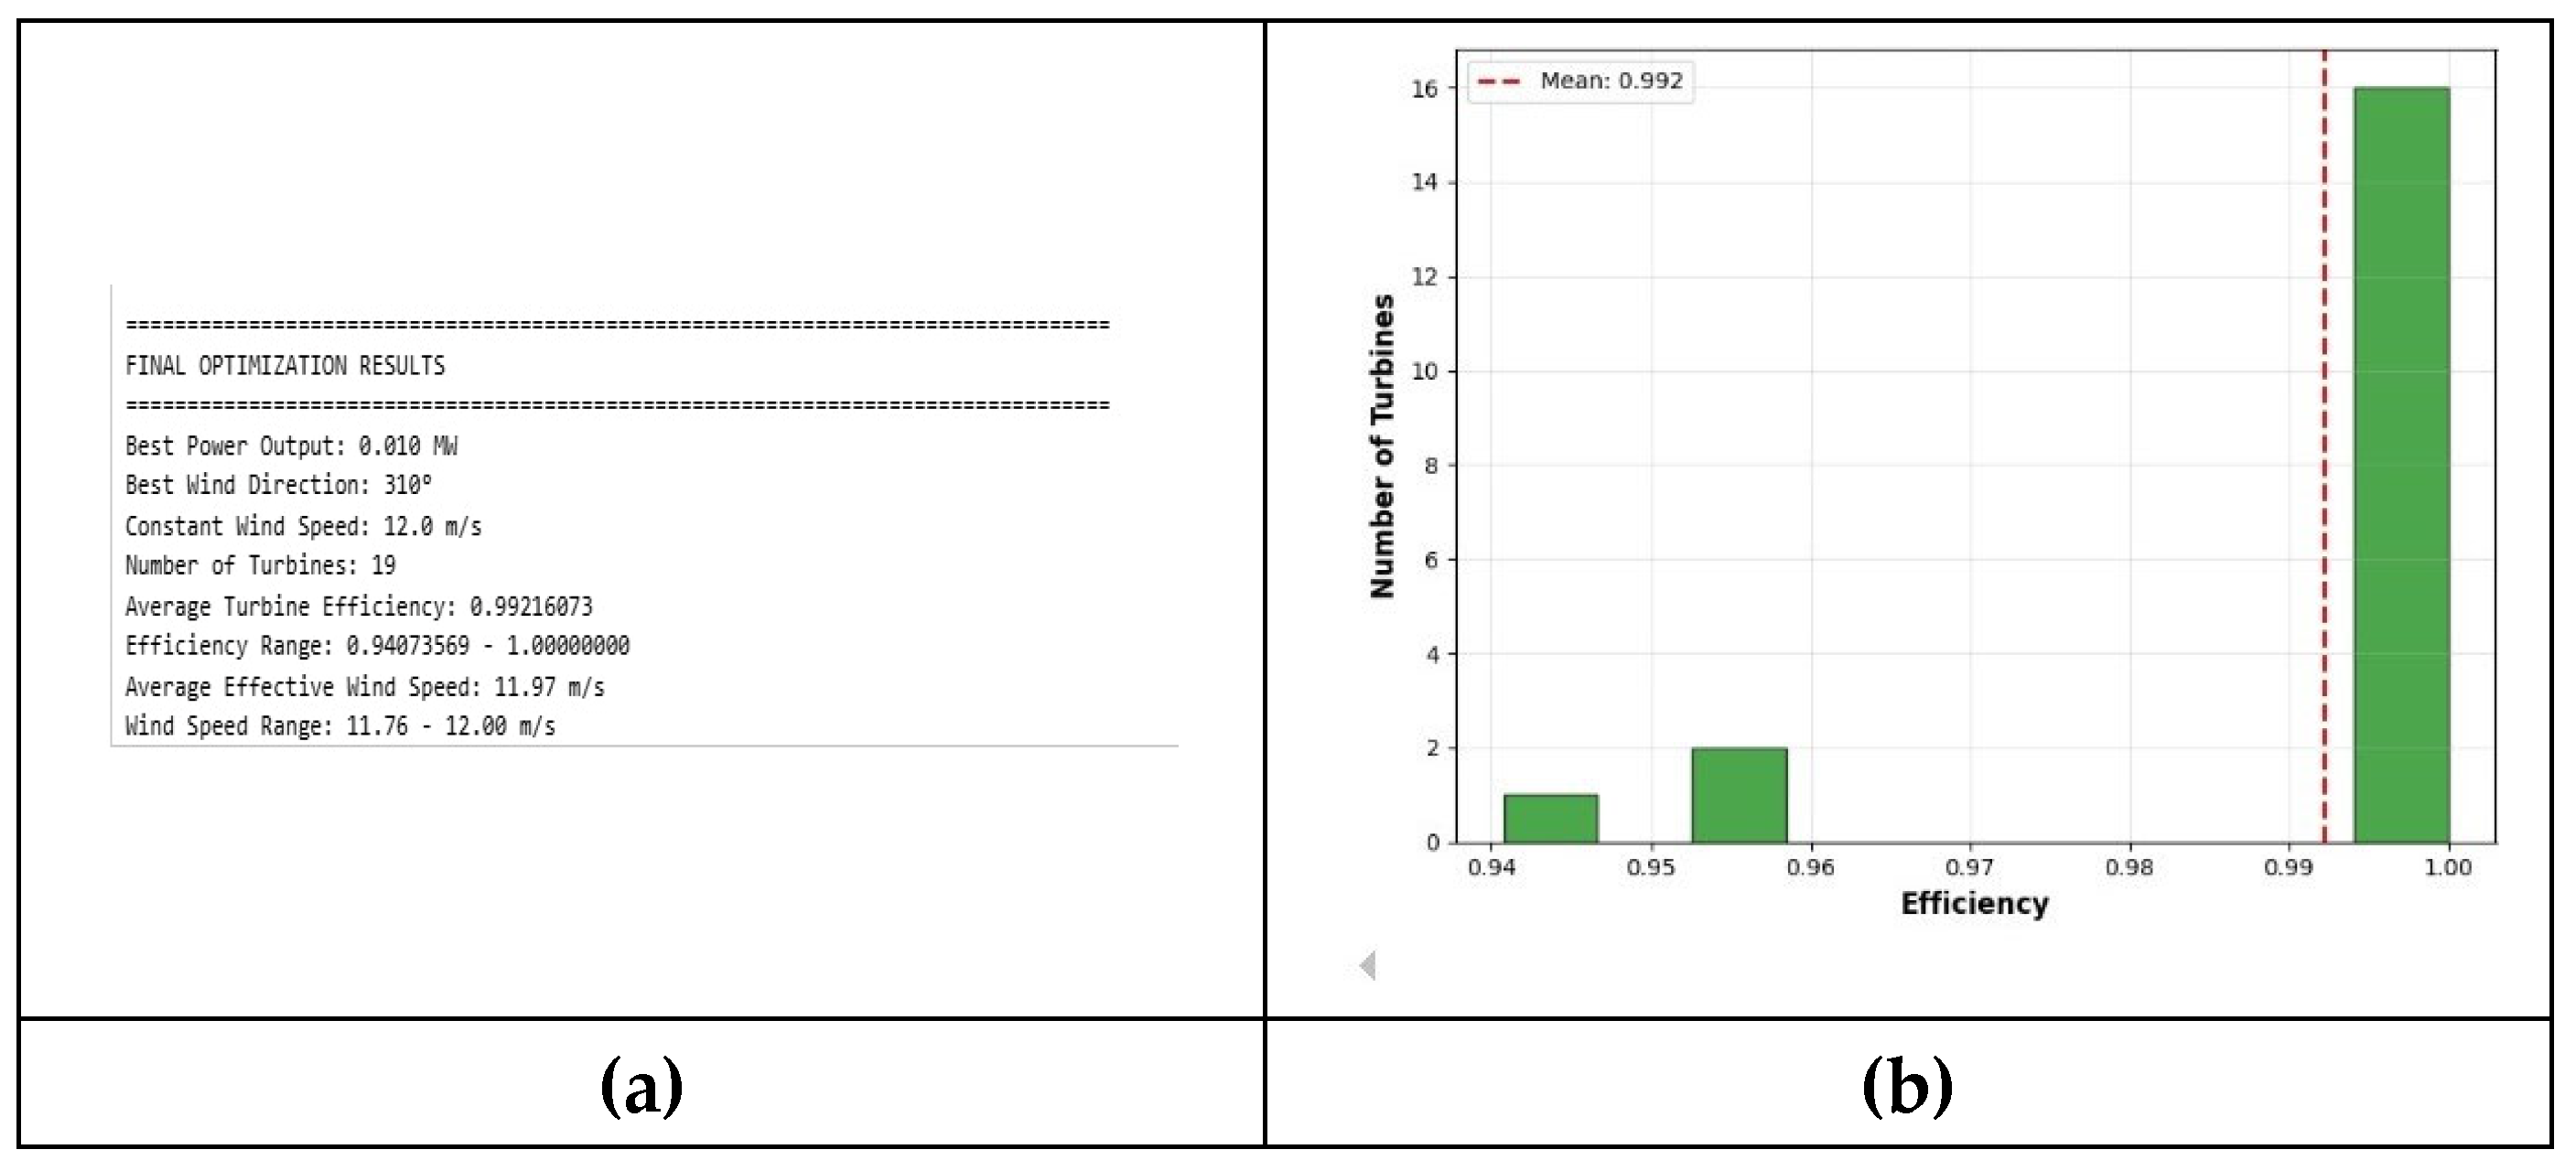
The optimum configuration produces a maximum power output with 19 turbines working under a uniform inflow wind speed of 12 m/s, as shown in
Figure 11(a) and 11(b). With an average turbine efficiency of roughly 99.2% and individual turbine efficiencies ranging from 94.98% to 100%, the algorithm converges on a highly efficient arrangement. There is little fluctuation in the effective wind speed distribution between 11.76 and 12.00 m/s throughout the farm.
The performance of the proposed layout with the previous research is shown in
Table 2. The suggested method extracts 9770.8 kW, which is marginally more than the 9741.3 kW. Wake loss indicate a significant difference: the suggested configuration records 78.7968 units, instead of 108.3 units. This suggests that the proposed structure more effectively reduces wake interactions. Overall, by improving power capture and lowering wake-induced losses, the proposed configuration exhibits improved optimization than the technique existing in [
40].
4.3. Case 3
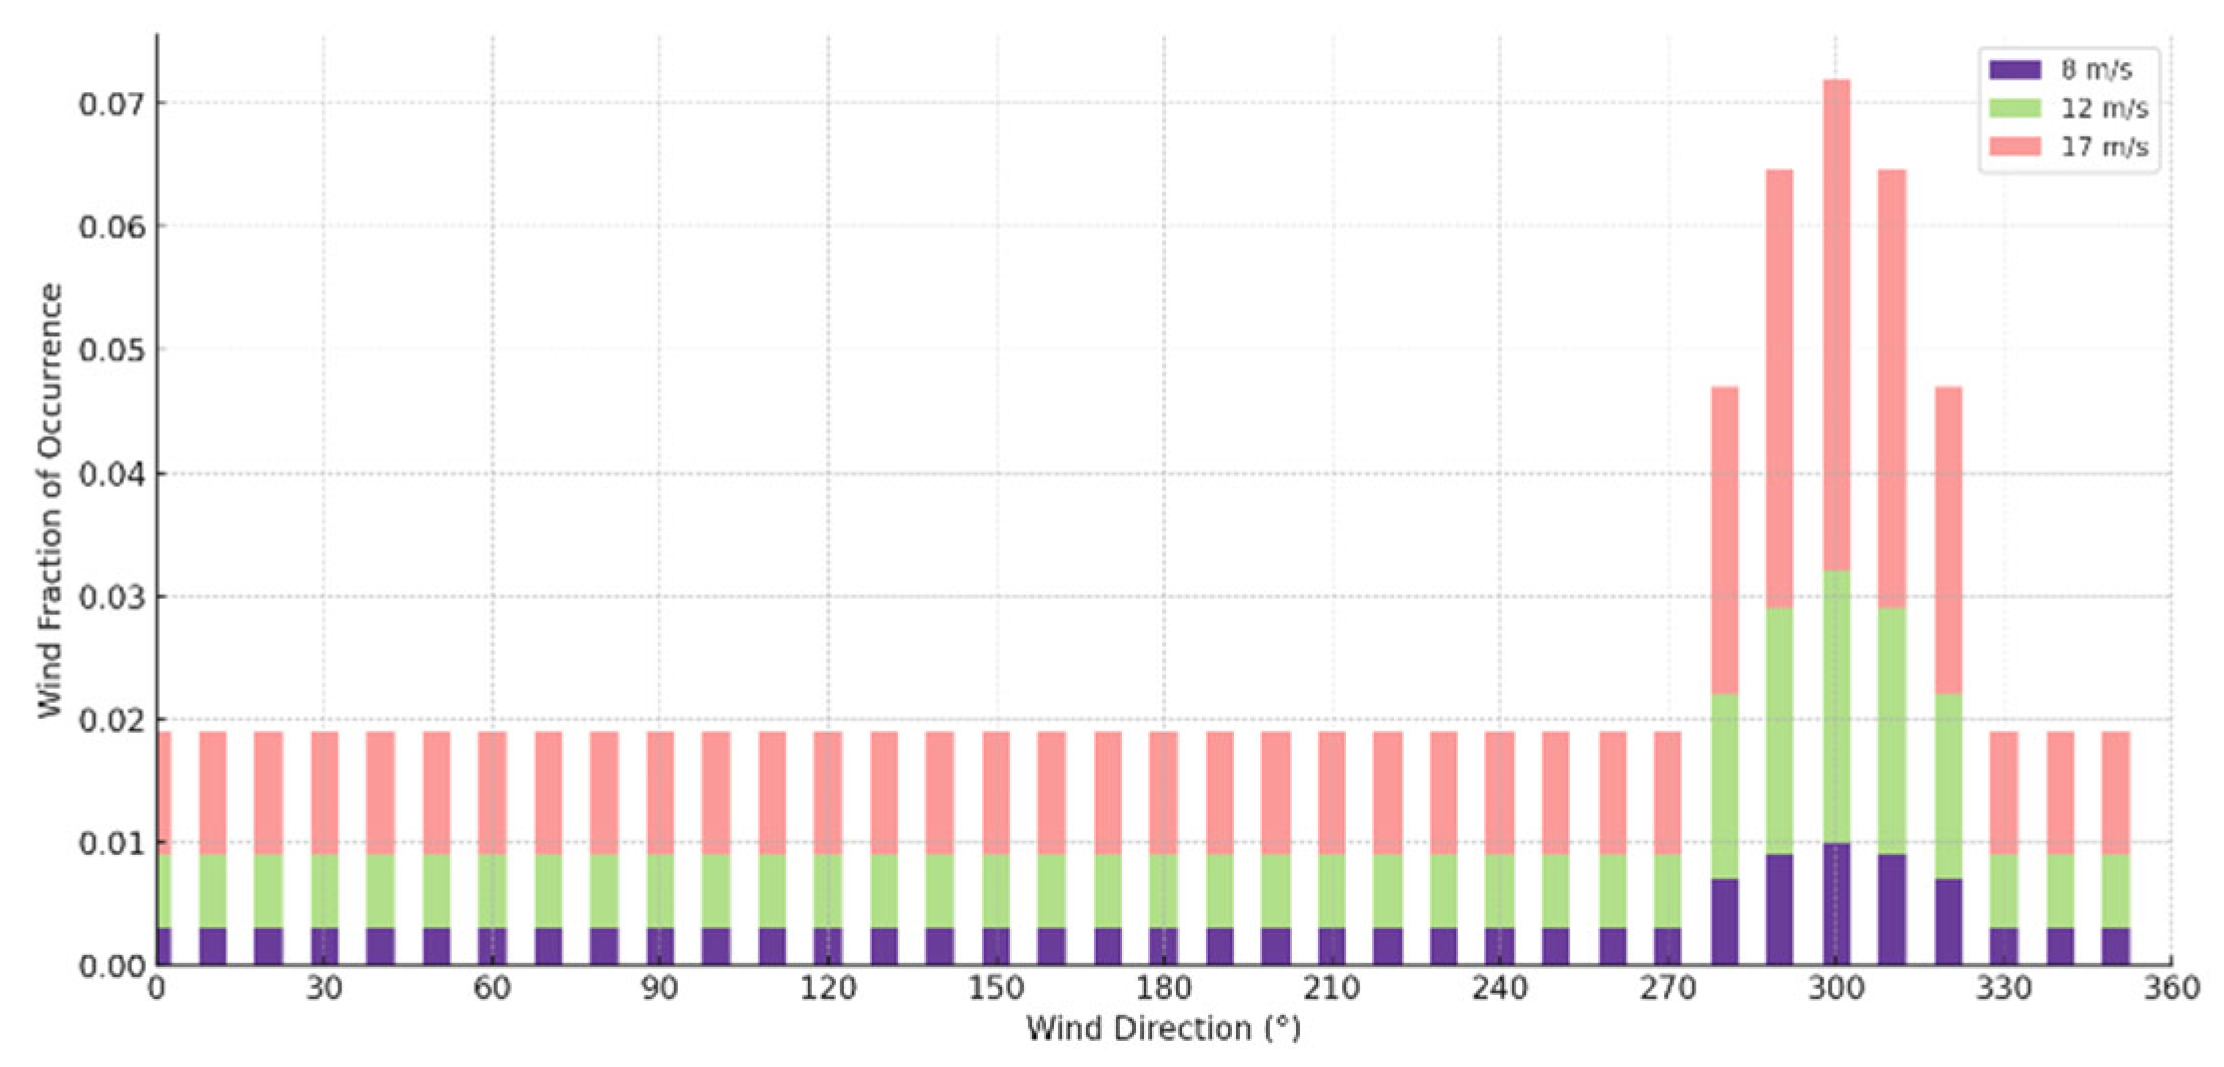
Figure 12 illustrates that the chance of wind speed is higher when the wind direction is between 270
o and 350
o. The performance of the suggested layout with the earlier study is shown in
Table 3. The suggested method extracts 7713.79 kW, which is somewhat more than the 7,690.46 kW. Wake losses indicate a significant difference: the proposed configuration records 62.21 units, instead of 85.54 units, suggesting that the proposed layout more effectively reduces wake interactions. Overall, by improving power capture and lowering wake-induced losses, the proposed layout do better than the method implemented in [
40].
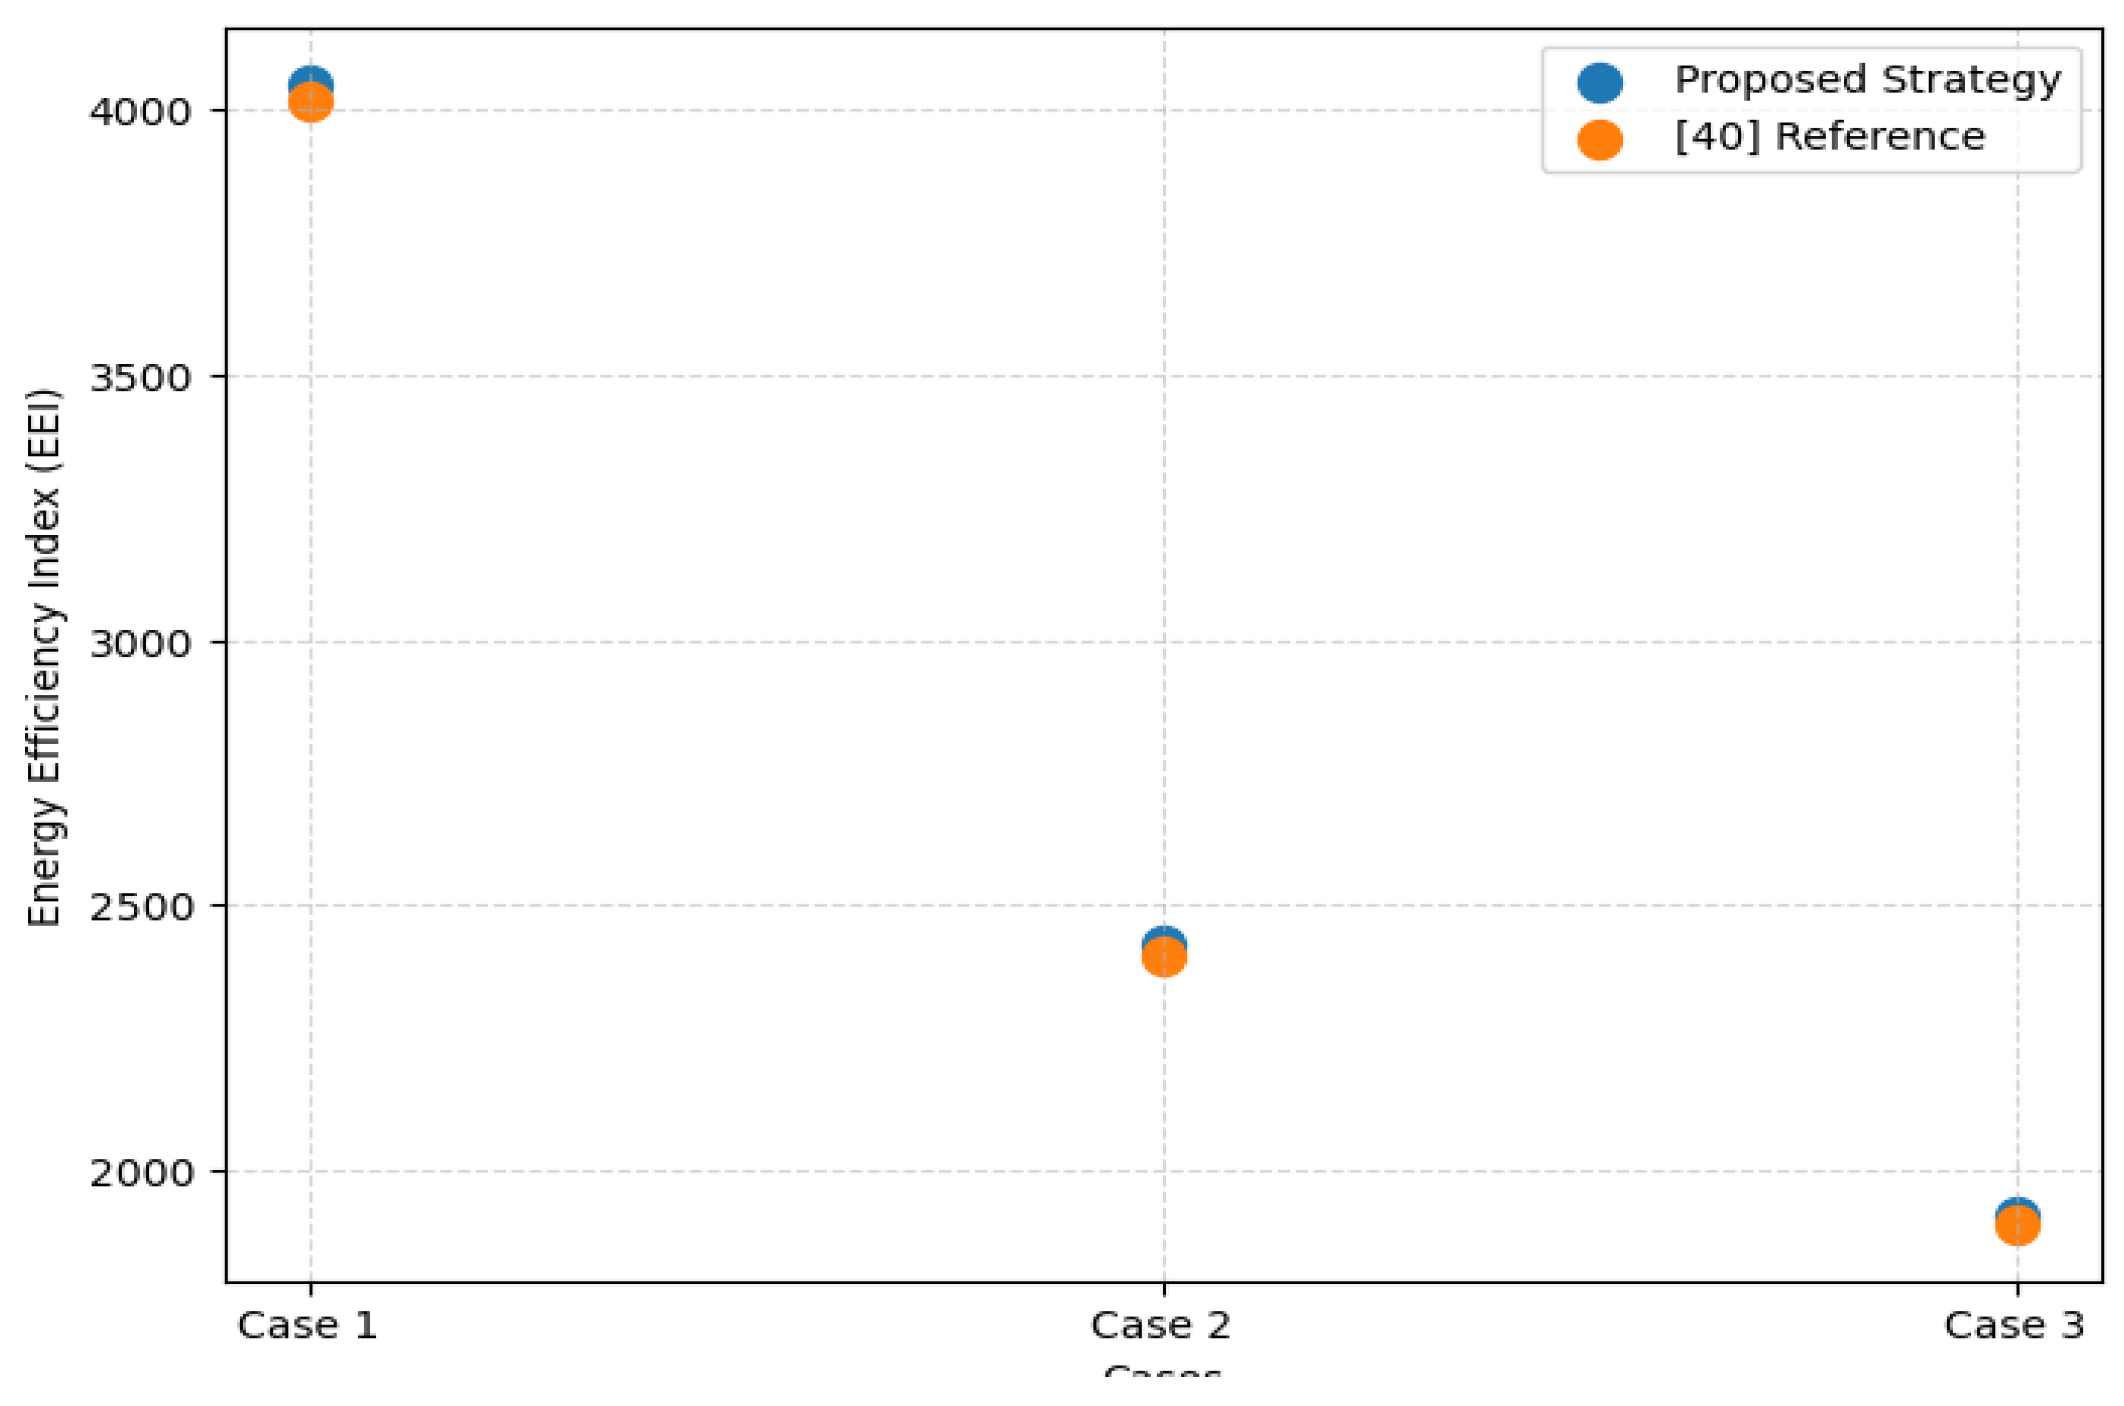
The Energy Efficiency Index (EEI) values for three distinct test cases employing two wind-farm layout optimization strategies, the Proposed Strategy and the reference approach described in the paper [
40] are shown in
Table 4. The EEI measures the layout's quality for each scenario based on how well the available wind-farm area is transformed into electrical power that can be used. Better performance is indicated by higher EEI scores. The paired t-test in
Table 4 demonstrates that the improvement is statistically significant and that the Proposed Strategy consistently produces higher EEI values for each case.
Figure 15 demonstrates that, in comparison to the method applied [
40], the suggested optimization methodology is effective in improving wind-farm layout performance.
Figure 13.
EEI Comparison: Proposed Strategy vs Reference [
40].
Figure 13.
EEI Comparison: Proposed Strategy vs Reference [
40].
5. Conclusion
This study presents a novel hybrid optimization technique that successfully combines Hybrid PSO-GA integrated with the Jensen wake model to address the WFLO problem in actual wind conditions. Unlike previous research this approach incorporates a dynamic goal function that takes cost, energy yield, and efficiency by minimizing the wake loss. The paper delineated the optimum WFLOs under the three case studies of wind speed and direction. In order to obtain the maximum possible output power, each WT's position was appropriately selected. In short, the hybrid PSO-GA algorithm provided a very effective method for optimizing wind farm layouts, leading to significant increases in power output and cost effectiveness while preventing severe wake disruption. The algorithm's practical relevance in real-world wind farm design is demonstrated by its robustness across many case studies and its capacity to manage the trade-off between electricity generation and turbine cost. The suggested PSO-GA significantly reduced wake-loss and improve the efficiency, 0.4%, 0.3%, and 0.3%, respectively, in the case studies as compared to existing WFLO technique. Future work could focus on algorithm's performance by incorporating advanced techniques such as multi-objective improvement process to simultaneously optimize for multiple objectives, such as environmental impact and operational costs.
Author Contributions
This work presents An Efficient Hybrid Evolutionary Algorithm for Enhanced WF Electrical Energy Yield. Muhammad Rashid, Abdur Raheem and Rabia Shakoor conceived the initial idea. Muhammad Rashid, Abdur Raheem, Rabia Shakoor established the methodological strategy. Muhammad Rashid, Muhammad I. Masud and Zeeshan Ahmad Arfeen formulated the software component. Muhammad Rashid and Abdur Raheem oversaw the validation process. Muhammad Rashid prepared the initial draft; Muhammad Rashid, Zeeshan Ahmad Arfeen and Touqeer Ahmed Jumani contributed to revisions and edits. Abdur Raheem and Rabia Shakoor provided overall supervision. All authors have reviewed and approved the final manuscript for publication.
Funding
Authors received no external funding for this research.
Data Availability Statement
Data will be provided on demand.
Conflicts of Interest
The authors declare no conflicts of interest.
Abbreviations
The following abbreviations are used in this manuscript:
| EEI |
Energy Efficiency Index |
| GA |
Genetic Algorithm |
| GWEC |
Global Wind Energy Council |
| MHMs |
Meta-heuristic Methods |
| MOP |
multi-objective improvement process |
| NFL |
No Free Lunch |
| PSO |
Particle Swarm Optimization |
| WF |
Wind Farm |
| WFL |
Wind Farm Layout |
| WFLO |
Wind Farm Layout Optimization |
| WFL-DO |
Wind Farm Discrete Optimization |
| WT |
Wind Turbine |
References
- Yu, X. and W. Zhang, A teaching-learning-based optimization algorithm with reinforcement learning to address wind farm layout optimization problem. Applied Soft Computing, 2024. 151. [CrossRef]
- Xiong, L., et al., Modeling and stability issues of voltage-source converter-dominated power systems: A review. CSEE Journal of Power and Energy Systems, 2020. 8(6): p. 1530-1549.
- Wang, L., et al., Wind turbine wakes modeling and applications: Past, present, and future. Ocean Engineering, 2024. 309.
- Roga, S., et al., Recent technology and challenges of wind energy generation: A review. Sustainable Energy Technologies and Assessments, 2022. 52. [CrossRef]
- Hou, P., et al., Optimized placement of wind turbines in large-scale offshore wind farm using particle swarm optimization algorithm. IEEE Transactions on Sustainable Energy, 2015. 6(4): p. 1272-1282. [CrossRef]
- Abdelsalam, A.M. and M.A. El-Shorbagy, Optimization of wind turbines siting in a wind farm using genetic algorithm based local search. Renewable Energy, 2018. 123: p. 748-755. [CrossRef]
- Frandsen, S., et al., Analytical modelling of wind speed deficit in large offshore wind farms. Wind Energy, 2006. 9(1-2): p. 39-53.
- Barthelmie, R.J., et al. Modelling and measurements of wakes in large wind farms. in Journal of Physics: Conference Series. 2007. IOP Publishing.
- Mittal, P. and K. Mitra, Determining layout of a wind farm with optimal number of turbines: A decomposition based approach. Journal of cleaner production, 2018. 202: p. 342-359. [CrossRef]
- Şişbot, S., et al., Optimal positioning of wind turbines on Gökçeada using multi-objective genetic algorithm. Wind Energy: An International Journal for Progress and Applications in Wind Power Conversion Technology, 2010. 13(4): p. 297-306.
- Long, H. and Z. Zhang, A two-echelon wind farm layout planning model. IEEE Transactions on Sustainable Energy, 2015. 6(3): p. 863-871. [CrossRef]
- Bastankhah, M. and F. Porté-Agel, A new analytical model for wind-turbine wakes. Renewable energy, 2014. 70: p. 116-123. [CrossRef]
- Yang, Q., J. Hu, and S.-s. Law, Optimization of wind farm layout with modified genetic algorithm based on boolean code. Journal of Wind Engineering and Industrial Aerodynamics, 2018. 181: p. 61-68. [CrossRef]
- Gao, X., H. Yang, and L. Lu, Optimization of wind turbine layout position in a wind farm using a newly-developed two-dimensional wake model. Applied Energy, 2016. 174: p. 192-200. [CrossRef]
- Sun, H., X. Gao, and H. Yang, A review of full-scale wind-field measurements of the wind-turbine wake effect and a measurement of the wake-interaction effect. Renewable and Sustainable Energy Reviews, 2020. 132: p. 110042. [CrossRef]
- Pérez, B., R. Mínguez, and R. Guanche, Offshore wind farm layout optimization using mathematical programming techniques. Renewable energy, 2013. 53: p. 389-399. [CrossRef]
- Wu, Y.-T. and F. Porté-Agel, Simulation of turbulent flow inside and above wind farms: model validation and layout effects. Boundary-layer meteorology, 2013. 146(2): p. 181-205. [CrossRef]
- Mosetti, G., C. Poloni, and B. Diviacco, Optimization of wind turbine positioning in large windfarms by means of a genetic algorithm. Journal of Wind Engineering and Industrial Aerodynamics, 1994. 51(1): p. 105-116. [CrossRef]
- Grady, S.A., M.Y. Hussaini, and M.M. Abdullah, Placement of wind turbines using genetic algorithms. Renewable Energy, 2005. 30(2): p. 259-270. [CrossRef]
- Marmidis, G., S. Lazarou, and E. Pyrgioti, Optimal placement of wind turbines in a wind park using Monte Carlo simulation. Renewable Energy, 2008. 33(7): p. 1455-1460. [CrossRef]
- Sood, P., V. Winstead, and P. Steevens. Optimal placement of wind turbines: A Monte Carlo approach with large historical data set. in 2010 IEEE international conference on electro/information technology. 2010. IEEE.
- Masoudi, S.M. and M. Baneshi, Layout optimization of a wind farm considering grids of various resolutions, wake effect, and realistic wind speed and wind direction data: A techno-economic assessment. Energy, 2022. 244. [CrossRef]
- Boersma, S., et al., A control-oriented dynamic wind farm model: WFSim. Wind Energy Science, 2018. 3(1): p. 75-95. [CrossRef]
- Sun, H., et al., Wind turbine power modelling and optimization using artificial neural network with wind field experimental data. Applied Energy, 2020. 280: p. 115880. [CrossRef]
- Tang, X.-Y., et al., Optimization of wind farm layout with optimum coordination of turbine cooperations. Computers & Industrial Engineering, 2022. 164. [CrossRef]
- Shakoor, R., et al., Wind farm layout optimization using area dimensions and definite point selection techniques. Renewable energy, 2016. 88: p. 154-163. [CrossRef]
- Stanley, A.P.J., A. Ning, and K. Dykes, Optimization of turbine design in wind farms with multiple hub heights, using exact analytic gradients and structural constraints. Wind Energy, 2019. 22(5): p. 605-619. [CrossRef]
- Stanley, A.P. and A. Ning, Coupled wind turbine design and layout optimization with nonhomogeneous wind turbines. Wind Energy Science, 2019. 4(1): p. 99-114. [CrossRef]
- Bouchekara, H.R., et al., Wind Farm Layout Optimization/Expansion with Real Wind Turbines Using a Multi-Objective EA Based on an Enhanced Inverted Generational Distance Metric Combined with the Two-Archive Algorithm 2. Sustainability, 2023. 15(3): p. 2525. [CrossRef]
- Ramli, M.A.M. and H.R.E.H. Bouchekara, Wind Farm Layout Optimization Considering Obstacles Using a Binary Most Valuable Player Algorithm. IEEE Access, 2020. 8: p. 131553-131564. [CrossRef]
- Wolpert, D.H. and W.G. Macready, No free lunch theorems for optimization. IEEE transactions on evolutionary computation, 2002. 1(1): p. 67-82. [CrossRef]
- Chowdhury, S., et al., Optimizing the arrangement and the selection of turbines for wind farms subject to varying wind conditions. Renewable Energy, 2013. 52: p. 273-282. [CrossRef]
- Cao, L., et al., Wind farm layout optimization to minimize the wake induced turbulence effect on wind turbines. Applied Energy, 2022. 323. [CrossRef]
- Shakoor, R., et al., Wake effect modeling: A review of wind farm layout optimization using Jensen׳s model. Renewable and Sustainable Energy Reviews, 2016. 58: p. 1048-1059. [CrossRef]
- Biswas, P.P., P.N. Suganthan, and G.A. Amaratunga. Optimal placement of wind turbines in a windfarm using L-SHADE algorithm. in 2017 IEEE Congress on Evolutionary Computation (CEC). 2017. IEEE.
- Wang, D., D. Tan, and L. Liu, Particle swarm optimization algorithm: an overview. Soft Computing, 2017. 22(2): p. 387-408.
- Kennedy, J. and R. Eberhart. Particle swarm optimization In Proceedings of ICNN’95-International Conference on Neural Networks. in the ICNN'95-International Conference on Neural Networks. 2002.
- El-Shorbagy, M.A. and A.M. El-Refaey, A hybrid genetic–firefly algorithm for engineering design problems. Journal of Computational Design and Engineering, 2022. 9(2): p. 706-730. [CrossRef]
- Haldurai, L., T. Madhubala, and R. Rajalakshmi, A study on genetic algorithm and its applications. Int. J. Comput. Sci. Eng, 2016. 4(10): p. 139-143.
- Asaah, P., L. Hao, and J. Ji, Optimal Placement of Wind Turbines in Wind Farm Layout Using Particle Swarm Optimization. Journal of Modern Power Systems and Clean Energy, 2021. 9(2): p. 367-375. [CrossRef]
|
Disclaimer/Publisher’s Note: The statements, opinions and data contained in all publications are solely those of the individual author(s) and contributor(s) and not of MDPI and/or the editor(s). MDPI and/or the editor(s) disclaim responsibility for any injury to people or property resulting from any ideas, methods, instructions or products referred to in the content. |
© 2025 by the authors. Licensee MDPI, Basel, Switzerland. This article is an open access article distributed under the terms and conditions of the Creative Commons Attribution (CC BY) license (http://creativecommons.org/licenses/by/4.0/).