Submitted:
02 July 2024
Posted:
04 July 2024
You are already at the latest version
Abstract
This study optimizes the placement and farm layout of Vertical Axis Wind Turbines (VAWTs) using a neural fuzzy network, an advanced machine learning system, and meta-heuristic algorithms. The methodology introduces a novel approach to enhance turbine efficiency and overall farm performance. The objective is to determine the optimal configuration of vertical axis wind turbines using a neural-fuzzy system and meta-heuristic optimizers. Turbine efficiency and power generation rates are assessed through three-dimensional numerical simulations based on the Reynolds-averaged Navier-Stokes equations. This innovative design, featuring straight blades with bevel-angle vortex generators, represents a significant advancement over traditional straight-blade VAWTs. Comparative analyses demonstrate that the oblique configuration exhibits higher average output moment and power. A novel concept integrates the strengths of Darrieus VAWTs, enhancing efficiency through vortex generator integration. Simulation results are validated with empirical data, confirming the superior aerodynamic efficiency and increased power generation of the oblique configuration. Inspired by the optimal group movements of birds, this study recommends adopting the oblique arrangement for improved wind turbine performance.
Keywords:
Darrieus Turbine
; Optimizations
; Turbines Configuration
; Neural-fuzzy system
; Machine Learning
1. Introduction
Climate change is one of the vital issues of life on earth that has changed different parts of human life for many years. Human activities on land cause climate variables to change in an alarming direction. The temperature increasing that we face every day are influenced by the emission of greenhouse gases, which is still increasing, and these changes will affect human life and the environment in the future[1]. As the global population continues to grow, the Earth faces an increasing need to meet their demands. One of the most important human needs todays is the need for energy. There are many ways to produce this energy all over the world, such as the use of power plants, various types of turbines, etc., but with the increase in the use of fossil fuels, environmental pollution is also an essential problem. Wind energy has developed rapidly nowadays due to its zero CO2 emissions[2]. For this purpose, the use of clean and renewable energies has attracted the attention of many countries. One of the most important issues in this field is the development and use of wind turbines. Wind turbines are generally divided into 2 categories[3].
Vertical axis wind turbines (VAWTs) and horizontal axis wind turbines (HAWT) have pros and cons. VAWTs often boast quieter operation, a valuable trait in noise-sensitive or residential areas, thanks to their lower height and slower blade tip speed[4]. Additionally, they may pose lower risks of bird collisions due to their design. However, despite these advantages, VAWTs might have limitations in terms of efficiency compared to larger-scale HAWTs, particularly in optimal wind conditions[5]. Their energy output may not match that of HAWTs. VAWTs are typically installed at lower altitudes and fall under the category of low-altitude wind turbines, contributing to lower installation costs[6]. Continuous research and development efforts aim to optimize VAWT performance, addressing efficiency and reliability concerns while furthering their potential in the renewable energy landscape[7].
In 2018, Li et al. [1] introduced a truncated-cone-shaped apparatus designed to harness wind more efficiently. They affixed this device above and below a vertical-axis wind turbine (VAWT) with straight blades to enhance wind capture and boost inflow velocity. This modification resulted in a 24.2% enhancement in the turbine's self-starting capability compared to the VAWT without vortex generators[8]. It is important to note that integrating this gathering tool led to a general increase in both the radius and height of the turbine. Other research endeavors have explored the impact of altering the blade pitch angle, as seen in the studies conducted by Rezaeiha et al. [9] and Lei et al.[7].
Upon extensive literature analysis, it became evident that optimizing a Darrieus VAWT to leverage the advantages of a straight-blade design was imperative [10]. In light of this notion, the authors embarked on crafting a novel Darrieus VAWT blueprint, aiming to achieve superior performance metrics: elevated average moment, minimized moment fluctuations, cost-effective blade production, and heightened power generation. The proposed configuration involves a distinct rotation of 30° forward and backward from the directional angles in the upper and lower sections concerning the central part. Consequently, this arrangement establishes a 60° directional angle between the tips of the first and third segments.
According to the extensive needs of humans for this energy, turbines should be such that they can be used in smaller spaces, such as the roof of apartments, which is the best option for using VAWT[10]. According to the different types of these turbines, the Darius vertical turbine with smooth blades has the highest efficiency among the rest of its types. When these turbines are placed together with a special arrangement, they produce different powers[11]. In this article, with the help of artificial intelligence tools and numerical fluid dynamics calculations, the relations between these turbines have been optimized, and the distances between them have been optimized, which has been done with the help of meta-heuristic optimization algorithms.
Another important issue in research is the use of vortex generators. Vortex generators, as seen in this research, improve the aerodynamics performance of the turbine blades, and their efficiency increases, which is a positive and useful thing. In the following, several special layouts were analyzed and investigated, and with the help of meta-heuristic optimization algorithms and fuzzy-neural system design, the distances between them were optimized. A particular layout was investigated as a farm.
2. Geometry
The general specifications of VAWT with vortex generator used in this research are uniformly set across all configurations for fair comparison, as detailed in Table 1
In Figure 1, the geometry of this turbine with vortex generators is depicted.
In this article, after reviewing different airfoils, the authors decided to choose NACA4412 to perform the simulation. Najafi et al. [12] performed an analysis on H-TYPE VAWT, and they found that NACA4412 had better performance. The vortex generator employed on the NACA 4412 airfoil functions by managing the separation of the boundary layer, thereby enhancing the airfoil's aerodynamic performance[13].
Research on the NACA 4412 indicated that the implementation of vortex generators resulted in a notable improvement, with a 28% increase in the lift coefficient and a 6.5° expansion in the stall angle when compared to the performance of the clean airfoil, Mueller-Vahl et al.[14]. An examination of the aerodynamic and vortex attributes in wind turbines, along with an exploration of their correlation with the impact of spacing on vortex generators, reveals insights into the effectiveness of these generators in regulating the flow within turbines, Li et al.[15]. The turbines rotate about the Z-axis in a positive direction, with the directional angle measured in the X-Y plane starting at zero along the Y-axis. Throughout each cycle, the directional angle advances from 0° to 360° in a clockwise fashion. It is noteworthy that the overall directional angle of the turbine is defined by the angle of the midpoint of its first blade. The flow direction is parallel to the X-axis, extending from a directional angle of 90° to 270°. The radius is defined by measuring from the center of the turbine to the midpoint of its blade. For each airfoil, its center lies at 51.23% of the chord length. The second and third blades position themselves at directional angles of 120° and 240°, respectively, as depicted in Figure 2.
3. Domain Analysis of Turbines
In this section, the intended domains for the analysis of different layouts are depicted. As shown in Figure 3, Figure 4, Figure 5 and Figure 6the domain is a rectangular cuboid with measurements of 11D and 5D in the X and Y directions, respectively, encompassing both fixed and rotating zones. Consistent airflow under sea-level conditions of the sea-level atmosphere, maintaining a steady velocity of 7 m/s along the X-axis, passes over the turbine. For this investigation, five iterative and suitable setups have been chosen. Identical spatial regions have been chosen to ensure an equitable comparison between each configuration.
4. CFD Simulation and Approach
Several research endeavors have utilized the k-ω SST turbulence model in analyzing the flow dynamics, both in 2D and 3D scenarios, around VAWTs. McLaren et al. [16]extensively explored the flow field encompassing a straight-blade VAWT at a Reynolds number of 2.9E+5, employing diverse turbulence models. Their investigation highlighted that in comparison to Sheldahl et al.'s experimental data[17], the outcomes derived from the k-ω SST model displayed a remarkable proximity. Therefore, this study will embrace the k-ω SST turbulence model owing to its superior conformity with experimental data and its demonstrated efficacy in prior simulations. The anticipated turbine's turbulent, incompressible, and transient flows in three dimensions are simulated by solving the Reynolds-Averaged Navier-Stokes (RANS) equations. This process involves employing the k-ω SST turbulence model. Ensuring the synchronization of pressure and velocity involves the utilization of a pressure-based solver in double precision. This solver employs an implicit formulation and applies the SIMPLEC algorithm. Pressure variables are discretized using a second-order scheme, while momentum variables are treated with a second-order upwind scheme. These measures collectively aim to enhance the accuracy and stability of the simulation. To ascertain solution convergence at every physical time step during the simulation, a convergence threshold of 1E-5 is established for continuity, k, and ω terms.
Additionally, for the three velocity components, a criterion of 1E-7 is chosen. Generally, an average of 20 iterations per time step is deemed necessary to achieve convergence. Estimations based on the blade's chord length indicate a free stream Reynolds number of approximately 1.5E+6. Remarkably, this value significantly elevates to 4E+6, specifically on the turbine blades themselves.
5. Mesh Quality of Geometries
In this part of the study, the elementalization of the desired turbine geometry is depicted. As can be seen in Figure 7, the elementalization of the boundary layer has been applied to the walls of the turbine blades by calculating Y+, which has an accuracy of 1e-5.
6. Time Independence Study
Prior to conducting a grid independence assessment in dynamic mode, the precise selection of a time step corresponding to a designated rotational speed holds paramount importance. Establishing an appropriate time step for a particular rotational speed facilitates the subsequent calculation of others coherently. To analyze the behavior of a mobile VG-wind turbine utilizing a static mode's definitive grid, various time steps—0.001, 0.0005, 0.0001, and 0.00005 seconds—were meticulously examined and subjected to rigorous testing.
7. Validation of CFD Modeling
To validate the dependability of the computational simulation employed in this study, it is imperative to utilize experimental records derived from a vertical-axis wind turbine (VAWT) featuring straight blades. The chosen turbine should share similarities with the current model in terms of airfoil cross-section, number of blades, and overall dimensions, particularly when exploring various Tip Speed Ratios (TSRs). Unfortunately, within the available experimental datasets, a comprehensive set of suitable information for a straight-blade VAWT could not be identified. Instead, the investigation conducted by Elkhoury et al. [18] offers relevant insights. Elkhoury et al. examined a VAWT equipped with straight blades, as detailed in Table 1, through both numerical simulations and experimental analyses. In this section, the experimental data extracted from Elkhoury et al. at a consistent free-stream velocity of 8 m/s is applied to authenticate the current computational simulation.
8. CFD Simulation Configurations
In this part of the study, all the desired states with the boundary conditions and ranges mentioned in the previous sections have been analyzed and investigated with the help of numerical fluid dynamics. In the following, explanations and results obtained from numerical fluid dynamics are given for each arrangement. In the next sections, the CFD results for 5 different configurations are given in Figure 8, Figure 9, Figure 10 and Figure 11. The selected configurations have been selected from similar studies[18,19,20].
9. Total Moment and Power Generation
In this section, the power and moment of each turbine and each configuration were calculated, and the data will be prepared for transfer to neural fuzzy artificial intelligence. Also, the value of the pressure coefficient was calculated with the help of Equation (1). The moment generated by the wind turbine can be calculated using the formula:
In Equation (1), It is the power coefficient (efficiency of the turbine), which varies depending on the turbine design and wind conditions, is the air density, A is the swept area of the turbine, R is the radius of the turbine, and V is the wind speed. The power generated by the wind turbine is the product of moment and angular velocity. The formula is:
10. Neural-Fuzzy Design
In this section, the relationship between the X and Y coordinates of each turbine and their output power is found with the help of a neural fuzzy system design. This simulation has 10 inputs ( and one output (output power), which was done with the help of these data obtained from numerical fluid dynamics. The geometry coordinates are provided in Table 2. The system designed from this simulation is depicted in the Figure 13.
11. Configuration Coordinate Optimization
11.1. Artificial Bee Colony Optimizer
The Artificial Bee Colony (ABC) algorithm is a stochastic search method rooted in swarm intelligence, drawing inspiration from the foraging behavior of honey bee swarms. Within this algorithmic framework, every candidate solution is analogous to the location of a food source within the search space. The effectiveness of each solution is evaluated by considering the quality of the nectar amount associated with the corresponding food source, serving as a fitness evaluator.[21].
11.2. Fireflies Algorithms
Firefly algorithm is one of the new metaheuristic algorithms for optimization problems. The flashing behavior of fireflies inspires the algorithm. In the algorithm, randomly generated solutions will be considered as fireflies, and brightness is assigned depending on their performance on the objective function[22].
11.3. Grasshoppers Optimization Algorithms
The Grasshoppers Algorithms algorithm employs mathematical modeling to imitate the behavior of grasshopper swarms in nature, aiming to address optimization problems. The performance of the GOA algorithm is initially assessed using a series of test problems, including CEC2005, to qualitatively and quantitatively evaluate its effectiveness and validate its capabilities.[23].
11.4. Whales Optimization Algorithms
The Whale Optimization Algorithm, inspired by the behaviors of humpback whales, is introduced. The WOA algorithm undergoes benchmarking across 29 widely recognized test functions. The outcomes on unimodal functions demonstrate WOA's exceptional exploitation capabilities, while the results on multimodal functions confirm WOA's effective exploration abilities[24]. In this section, after obtaining the relationships between the distances of the turbines and their production power, the optimization of these distances has been discussed with the help of meta-heuristic optimization algorithms. In this section, with the help of optimization algorithms of Artificial Bee Colony (ABC), Fireflies Algorithms(FA), Grasshoppers Algorithms(GOA), and Whales Algorithms(WOA), the distances between turbines have been optimized in order to achieve more power. In Table 3 and Figure 14, the results obtained from the optimization and the percentage of power optimization with new distances and convergence diagrams of the optimizers are given.
From the obtained results, the ABC algorithm has a higher output (11.98%) than other algorithms due to the optimized distances. The distances obtained from this analysis are shown in Table 4.
According to the obtained optimized distances, and the oblique configuration was the best layout, these distances were expanded and analyzed as a field with the help of numerical fluid dynamics.
11.5. Developed Oblique Configuration
After several layouts were investigated, a neural fuzzy network trained their data, and the relationships between turbine spacing and output power were obtained. In the next steps, with the help of meta-heuristic optimization algorithms, the distances between the turbines were optimized, and the analysis was done for new distances, the results of which are given below:
11.6. Mesh Quality of Oblique Configuration
After calculating the optimized distances with the help of meta-heuristic optimization algorithms, the optimized distances were modeled and discussed with the help of numerical fluid dynamics method. According to the distances obtained, we will have a model that is like the oblique configuration. After simulating the desired problem, the obtained results are as follows.
The obtained results prove that the neural fuzzy system made an acceptable guess, whose error is 0.08582292, which is an acceptable error. From this analysis, it can be concluded that 5 turbines with vortex generators are the best configuration among the others.
12. Results and Discussion
The performance of the Darrieus turbine with a straight blade was analyzed and investigated by mentioning the boundary conditions. According to the existing systems, the accuracy of the grid was done with high accuracy. In this analysis, the inlet velocity of the wind was 7 m/s. The numerical fluid dynamics results of the 5 desired configurations were conducted and analyzed. The oblique configuration has the highest efficiency and power generation, with about 164. To further investigate this problem, with the help of meta-heuristic optimization algorithms and neural fuzzy system design for this problem, the distances between 5 turbines were optimized and discussed as a complete farm. Were investigated. With the help of optimizing the distances between the turbines, the production power increased by 12.1%, and it had the highest amount of production power among other arrangements, reaching 942 watt/sec. Figure 12 compares coefficients with each other, specifically (a) the moment coefficient of an individual blade and (b) the total moment coefficient of the entire turbine. The overall moment coefficient is defined by equation (3).[25].
Within equation 3, represents either the moment of an individual blade or the moment of the entire turbine. Both coefficients are depicted in relation to the directional angle throughout a complete cycle. For a thorough quantitative evaluation of the performance of both turbines, two additional parameters are introduced: the mean of the total moment coefficient () and the variance in the total moment coefficient. The average of the total moment coefficient, , represents the mean value of over one cycle. The maximum total moment coefficient from its average is defined by Equation (3) [26] as a dimensionless parameter that provides an analysis of fluctuations in the total moment coefficient.
A comprehensive analysis of these results will be presented in the next sections of the article. Considering the constant rotational speed in each modeling, it is noteworthy that the graphs of power factor and torque for each rotational speed show similar trends. Hence, a single and specific representation is sufficient to depict the performance of turbines.
Figure 18 illustrates that within TSRs ranging from 0.19 to 0.32 and 1 to 1.19, the errors observed in the current results in comparison to the experimental data approach zero. Contrastingly, in Figure 19, within TSRs spanning from 0.32 to 0.98 and 1.19 to 1.45, the average of these errors amounts to approximately 11.36%. Given the comparison conducted against experimental data, it is evident that a notably favorable correspondence exists between the current findings and the experimental data.
Figure 20 illustrates the correlation between the total moment coefficient's average and deviation at a rotational speed of 120 rpm, plotted against the Tip Speed Ratio (TSR) at a constant wind speed of 7 m/s. Remarkably, the average total moment coefficient of VG-VAWT exhibits a notable enhancement as TSR increases. This finding aligns with the outcomes reported by Alaimo et al. [27], who demonstrated a comparable increase in the average total moment coefficient for straight-blade Vertical Axis Wind Turbines (VAWTs) beyond a TSR threshold of approximately 0.9. This consistency in results emphasizes the positive influence of higher TSR on the performance of VG-VAWT systems.
13. Conclusions
The paper introduces a novel wind turbine termed the VG-straight blade vertical axis wind turbine. This innovative design aims to amalgamate the advantages of straight-blade VAWTs, striving for enhanced performance such as elevated average moments, minimized moment fluctuations, and cost-effective production. The turbine's heightened output moment is primarily attributed to its straight-blade components, while the directional angle disparity between these straight-blade segments and vortex generators facilitates its smooth operation. By conducting numerical analyses under specific conditions - a constant wind speed of 7 meters per second, ensuring self-starting capacity, and operational mode with TSRs below or equal to 1.8 - the aerodynamic efficiencies of these turbines were thoroughly scrutinized. Comparative evaluations encompassing metrics like the average total moment coefficient and its cyclic deviation from the mean were made among the turbines and an oblique farm configuration. The study derived several notable conclusions from this investigation. In this study, it was observed that the oblique arrangement has a better aerodynamic performance than other arrangements. For example, the amount of power produced in V-shaped, triangular, etc. layouts were finally 164 watts per second, but it reached 164.4 watts per second in diagonal layouts. Also, by optimizing the distances, it was concluded that output power could be increased by 12.2% without additional cost or special work. It is believed that the use of vertical turbines with vortex generators and diagonal arrangement increases the output power and has a higher justification than other arrangements.
References
- Li, Y.; Tong, G.; Zhao, B.; Feng, F.; Tagawa, K. Study on Aerodynamic Performance of a Straight-Bladed VAWT Using a Wind-Gathering Device With Polyline Hexagonal Pyramid Shape. Front. Energy Res. 2022, 10. [Google Scholar] [CrossRef]
- Porté-Agel, F.; Bastankhah, M.; Shamsoddin, S. Wind-Turbine and Wind-Farm Flows: A Review. Bound.-Layer Meteorol. 2020, 174, 1–59. [Google Scholar] [CrossRef] [PubMed]
- Chen, J.; Liu, P.; Xu, H.; Chen, L.; Yang, M.; Yang, L. A detailed investigation of a novel vertical axis Darrieus wind rotor with two sets of blades. J. Renew. Sustain. Energy 2017, 9. [Google Scholar] [CrossRef]
- Butt, A.H.; Akbar, B.; Aslam, J.; Akram, N.; Soudagar, M.E.M.; Márquez, F.P.G.; Younis, Y.; Uddin, E. Development of a Linear Acoustic Array for Aero-Acoustic Quantification of Camber-Bladed Vertical Axis Wind Turbine. Sensors 2020, 20, 5954. [Google Scholar] [CrossRef] [PubMed]
- Kuang, L.; Su, J.; Chen, Y.; Han, Z.; Zhou, D.; Zhang, K.; Zhao, Y.; Bao, Y. Wind-capture-accelerate device for performance improvement of vertical-axis wind turbines: External diffuser system. Energy 2021, 239, 122196. [Google Scholar] [CrossRef]
- Yue, Q. Aerodynamic noise prediction and reduction of H-Darrieus vertical axis wind turbine. Aust. J. Mech. Eng. 2021, 21, 1093–1102. [Google Scholar] [CrossRef]
- Ahmad, M.; Shahzad, A.; Qadri, M.N.M. An overview of aerodynamic performance analysis of vertical axis wind turbines. Energy Environ. 2022, 34, 2815–2857. [Google Scholar] [CrossRef]
- Moon, H.; Jeong, J.; Park, S.; Ha, K.; Jeong, J.-H. Numerical and experimental validation of vortex generator effect on power performance improvement in MW-class wind turbine blade. Renew. Energy 2023, 212, 443–454. [Google Scholar] [CrossRef]
- Zhang, Q.; Bashir, M.; Miao, W.; Liu, Q.; Li, C.; Yue, M.; Wang, P. Aerodynamic analysis of a novel pitch control strategy and parameter combination for vertical axis wind turbines. Renew. Energy 2023, 216. [Google Scholar] [CrossRef]
- Chen, W.-H.; Wang, J.-S.; Chang, M.-H.; Hoang, A.T.; Lam, S.S.; Kwon, E.E.; Ashokkumar, V. Optimization of a vertical axis wind turbine with a deflector under unsteady wind conditions via Taguchi and neural network applications. Energy Convers. Manag. 2022, 254, 115209. [Google Scholar] [CrossRef]
- Sahebzadeh, S.; Rezaeiha, A.; Montazeri, H. Vertical-axis wind-turbine farm design: Impact of rotor setting and relative arrangement on aerodynamic performance of double rotor arrays. Energy Rep. 2022, 8, 5793–5819. [Google Scholar] [CrossRef]
- Ghiasi, P.; Najafi, G.; Ghobadian, B.; Jafari, A.; Mazlan, M. Analytical Study of the Impact of Solidity, Chord Length, Number of Blades, Aspect Ratio and Airfoil Type on H-Rotor Darrieus Wind Turbine Performance at Low Reynolds Number. Sustainability 2022, 14, 2623. [Google Scholar] [CrossRef]
- TOKUL, A.; Unal, K. Comparative performance analysis of NACA 2414 and NACA 6409 airfoils for horizontal axis small wind turbine. International Journal of Energy Studies 2023, 8, 879–898. [Google Scholar] [CrossRef]
- Alber, J.; Manolesos, M.; Weinzierl-Dlugosch, G.; Fischer, J.; Schönmeier, A.; Nayeri, C.N.; Paschereit, C.O.; Twele, J.; Fortmann, J.; Melani, P.F.; et al. Experimental investigation of mini Gurney flaps in combination with vortex generators for improved wind turbine blade performance. Wind. Energy Sci. 2022, 7, 943–965. [Google Scholar] [CrossRef]
- Özden, M.; Genç, M.S.; Koca, K. Passive Flow Control Application Using Single and Double Vortex Generator on S809 Wind Turbine Airfoil. Energies 2023, 16, 5339. [Google Scholar] [CrossRef]
- McLaren, K.W. A numerical and experimental study of unsteady loading of high solidity vertical axis wind turbines. 2011.
- Sheldahl, R.E.; Klimas, P.C. Aerodynamic characteristics of seven symmetrical airfoil sections through 180-degree angle of attack for use in aerodynamic analysis of vertical axis wind turbines. 1981, Sandia National Labs., Albuquerque, NM (USA).
- Sahebzadeh, S.; Rezaeiha, A.; Montazeri, H. Towards optimal layout design of vertical-axis wind-turbine farms: Double rotor arrangements. Energy Convers. Manag. 2020, 226, 113527. [Google Scholar] [CrossRef]
- Shyu, L.S. A Pilot Study of Vertical-Axis Turbine Wind Farm Layout Planning. Adv. Mater. Res. 2014, 953-954, 395–399. [Google Scholar] [CrossRef]
- Cazzaro, D.; Bedon, G.; Pisinger, D. Vertical Axis Wind Turbine Layout Optimization. Energies 2023, 16, 2697. [Google Scholar] [CrossRef]
- Karaboga, D. Artificial bee colony algorithm. scholarpedia 2010, 5, 6915. [Google Scholar] [CrossRef]
- IztokFister, I.F., Jr.; Yang, X.-S.; Brest, J. A comprehensive review of firefly algorithms. Swarm Evolut. Comput. 2013, 13, 34–46. [Google Scholar] [CrossRef]
- Saremi, S.; Mirjalili, S.; Lewis, A. Grasshopper Optimisation Algorithm: Theory and application. Adv. Eng. Softw. 2017, 105, 30–47. [Google Scholar] [CrossRef]
- Mirjalili, S.; Lewis, A. The whale optimization algorithm. Advances in engineering software 2016, 95, 51–67. [Google Scholar] [CrossRef]
- Castelli, M.R.; Englaro, A.; Benini, E. The Darrieus wind turbine: Proposal for a new performance prediction model based on CFD. Energy 2011, 36, 4919–4934. [Google Scholar] [CrossRef]
Figure 1.
Geometry of designed turbine with (a) isometric view and (b) closer view of vortex generators.
Figure 1.
Geometry of designed turbine with (a) isometric view and (b) closer view of vortex generators.
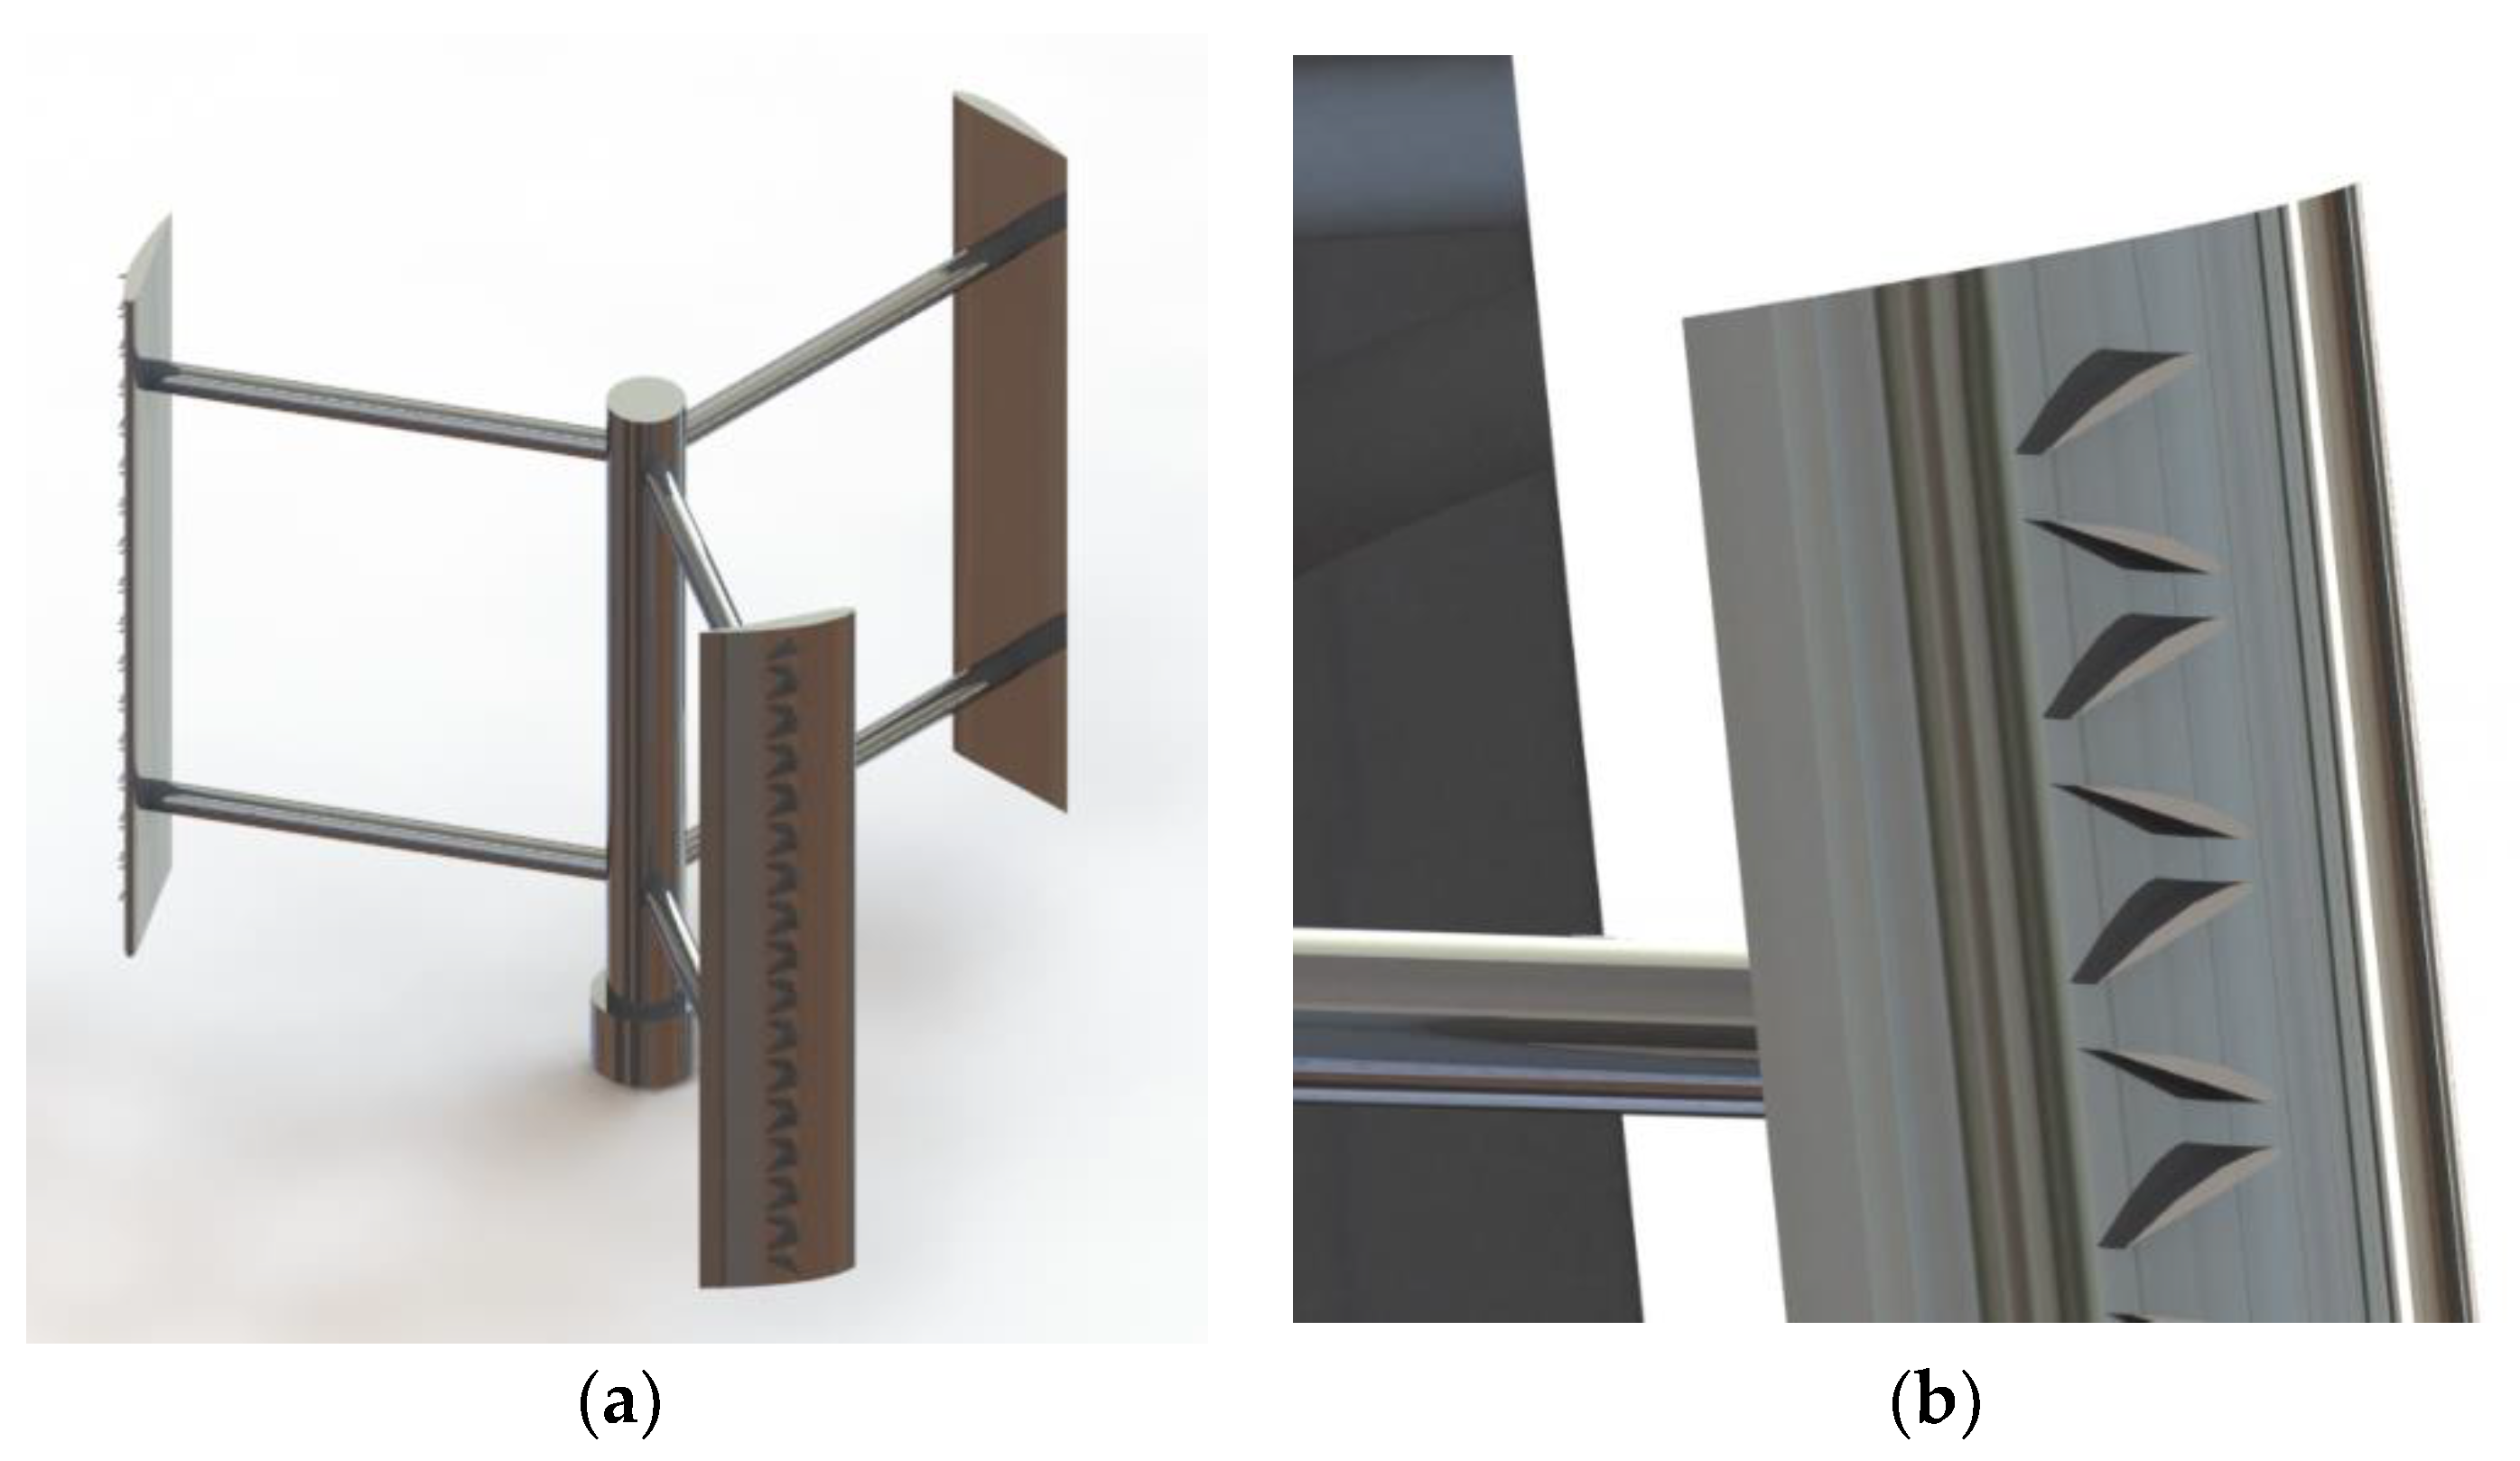
Figure 2.
Front views of VAWT with vortex generator.
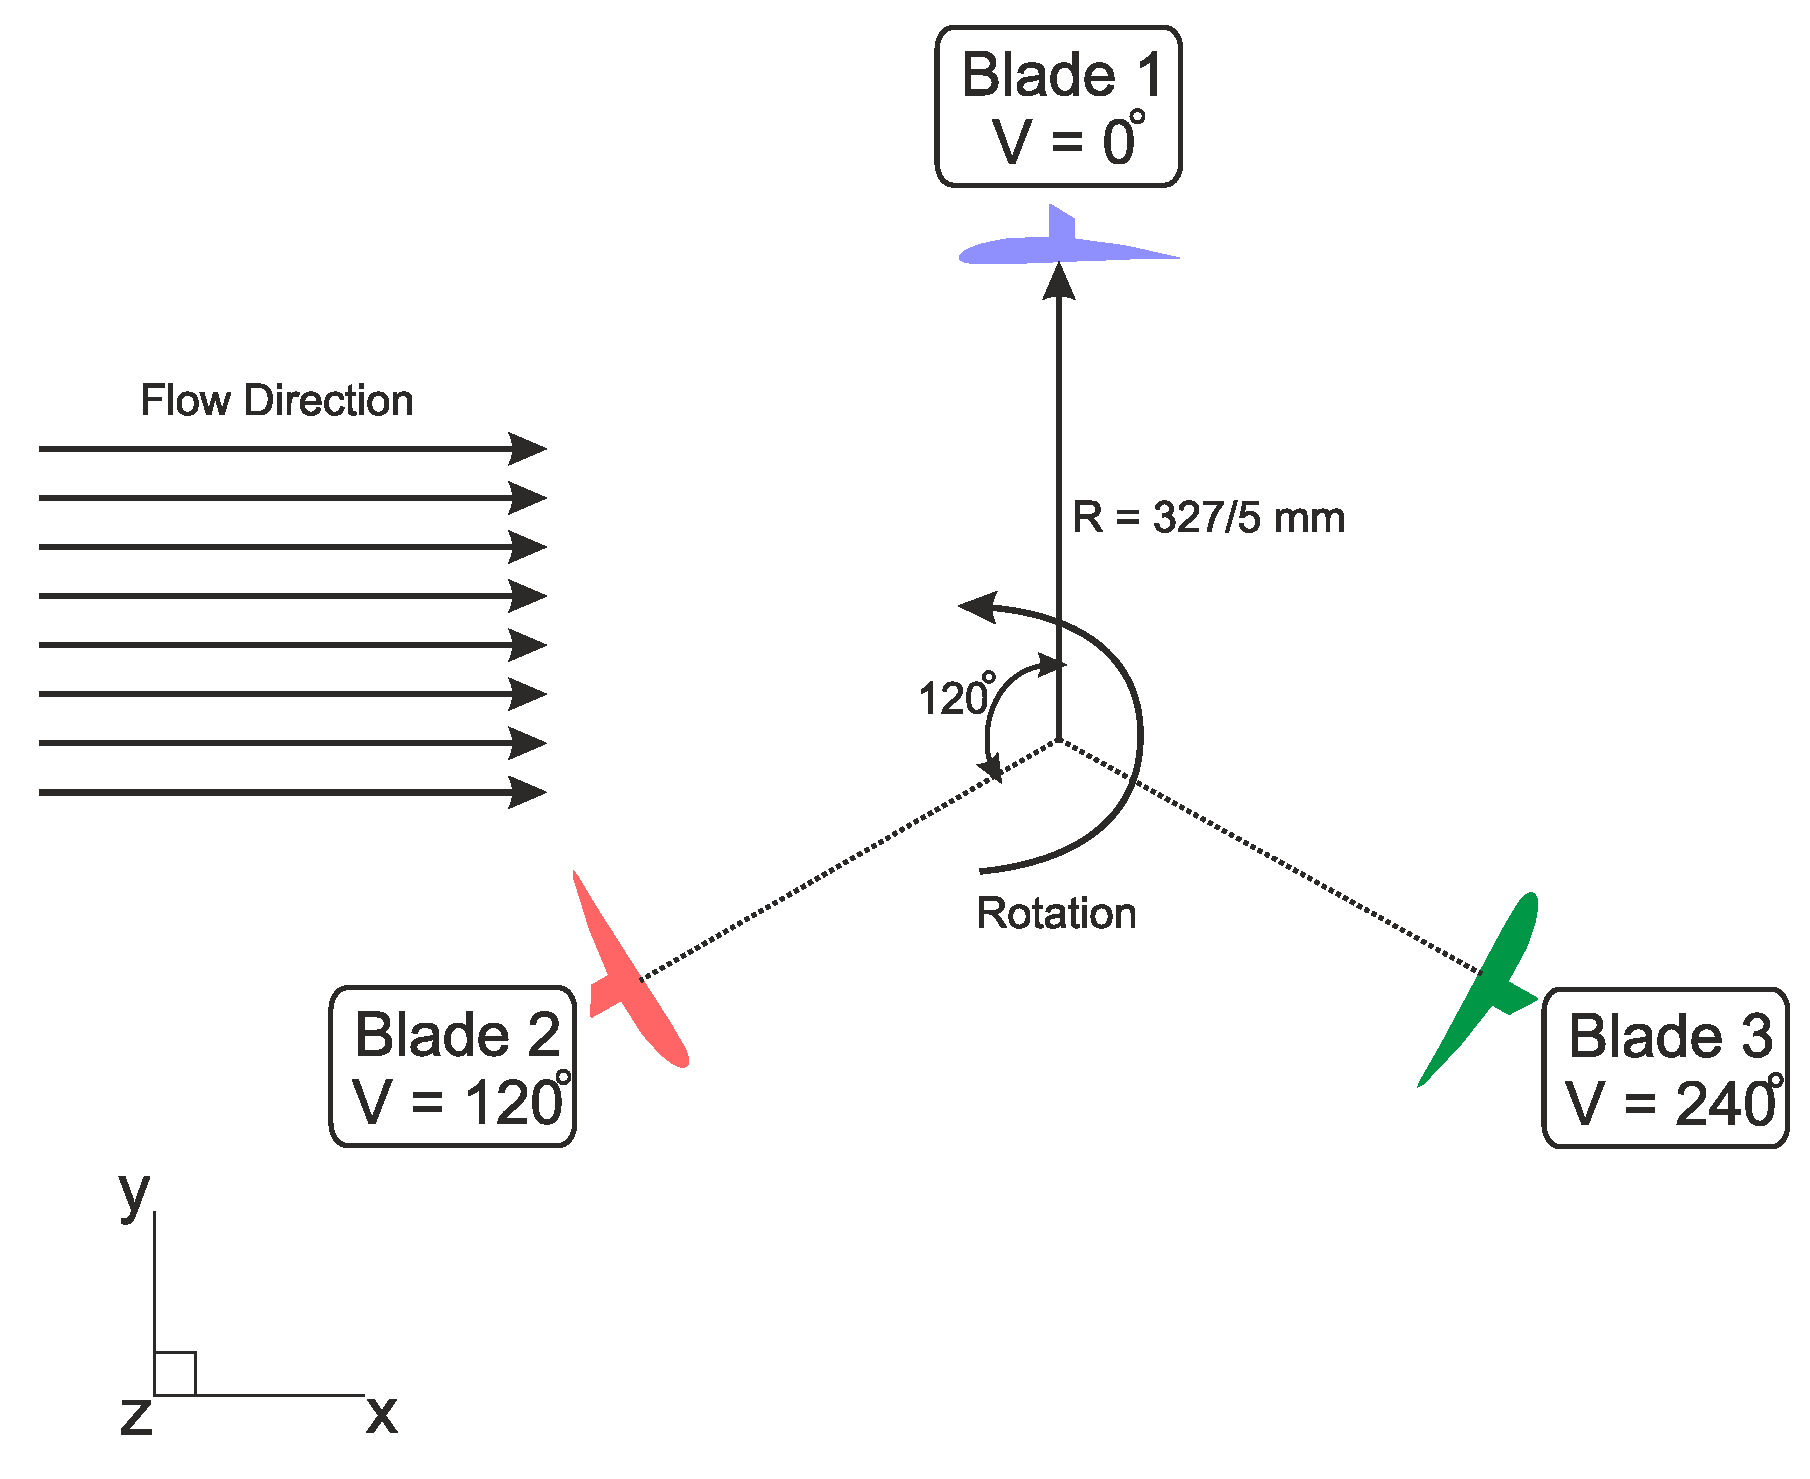
Figure 3.
First configuration with dimensions(a) and closer view(b).
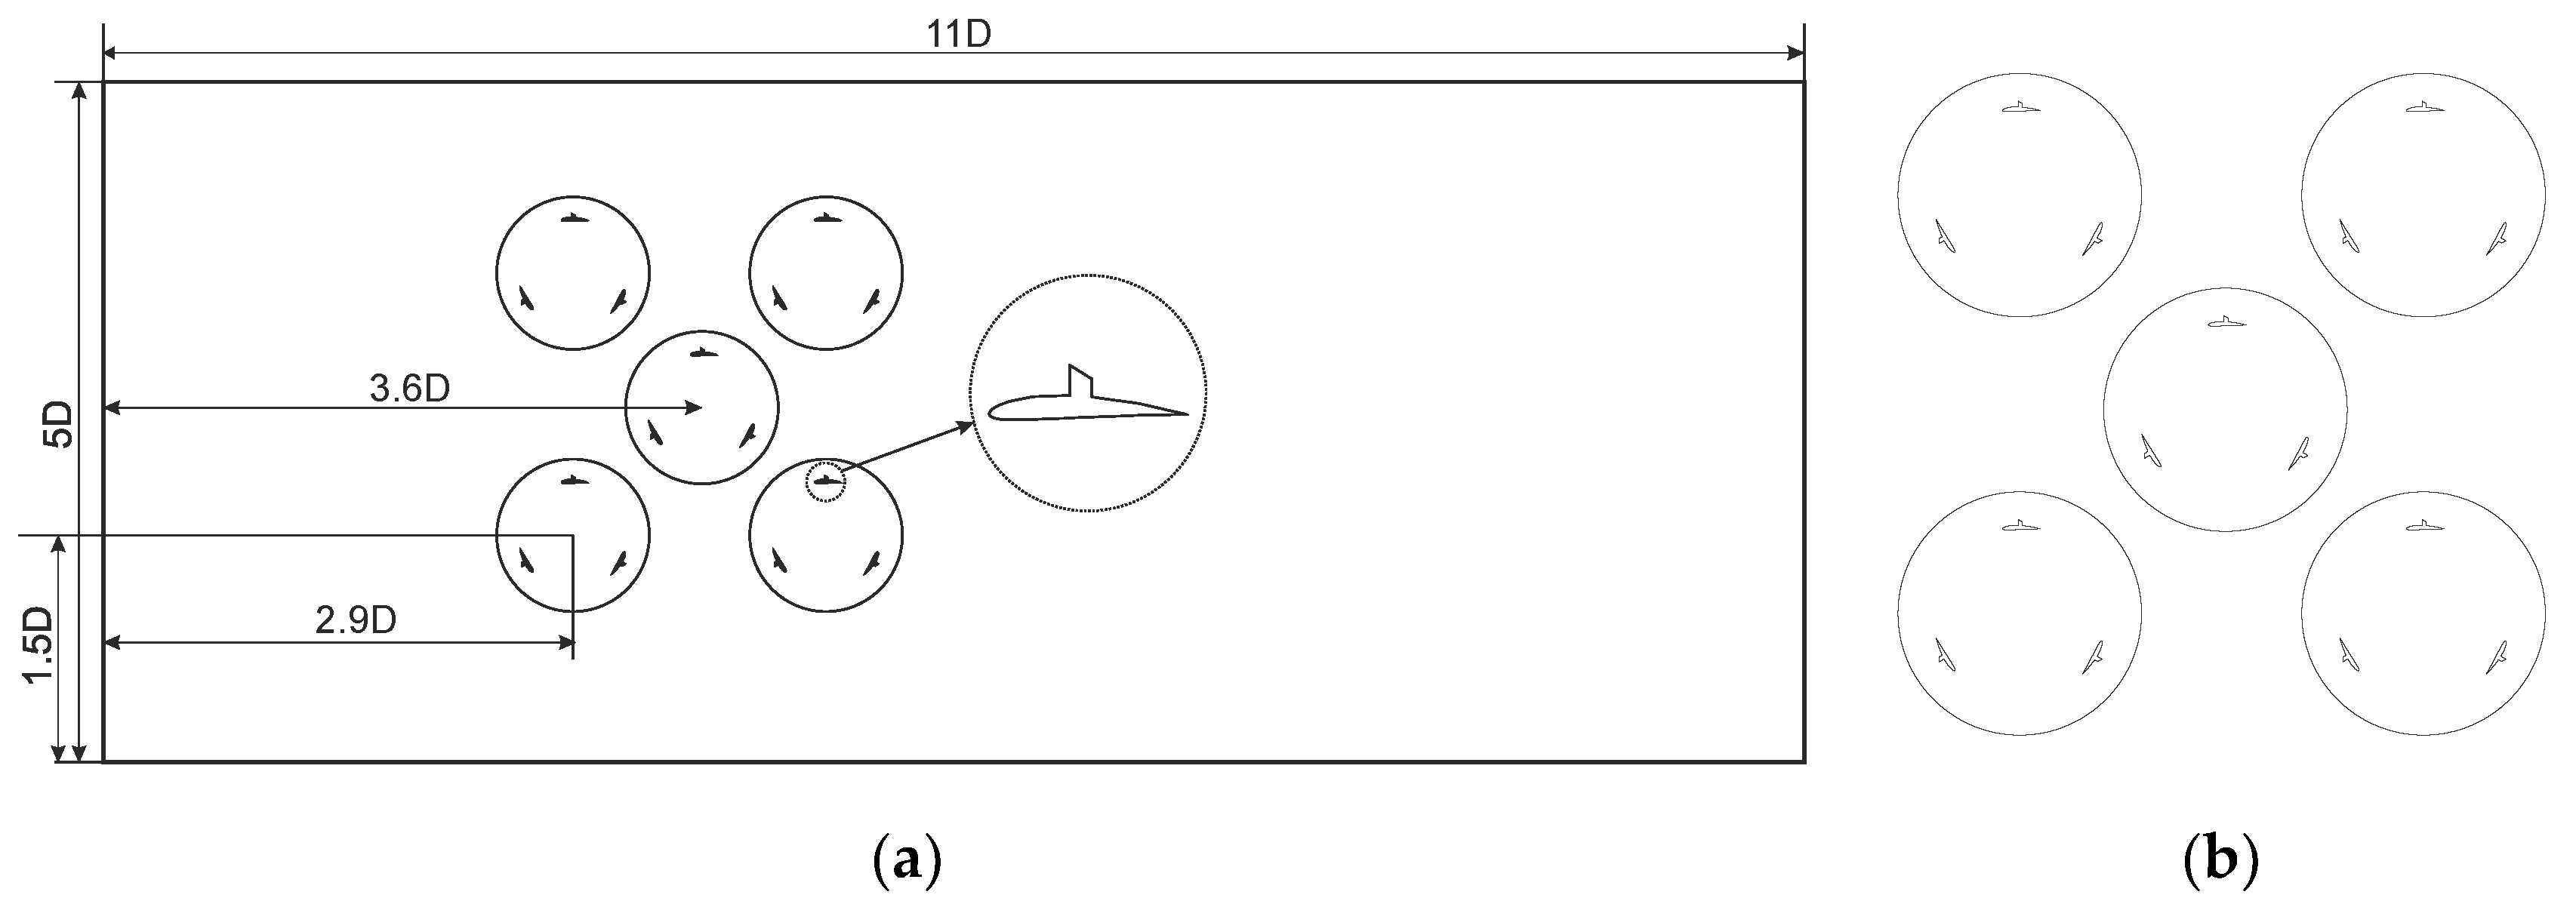
Figure 4.
Second configuration with dimensions(a) and closer view(b).
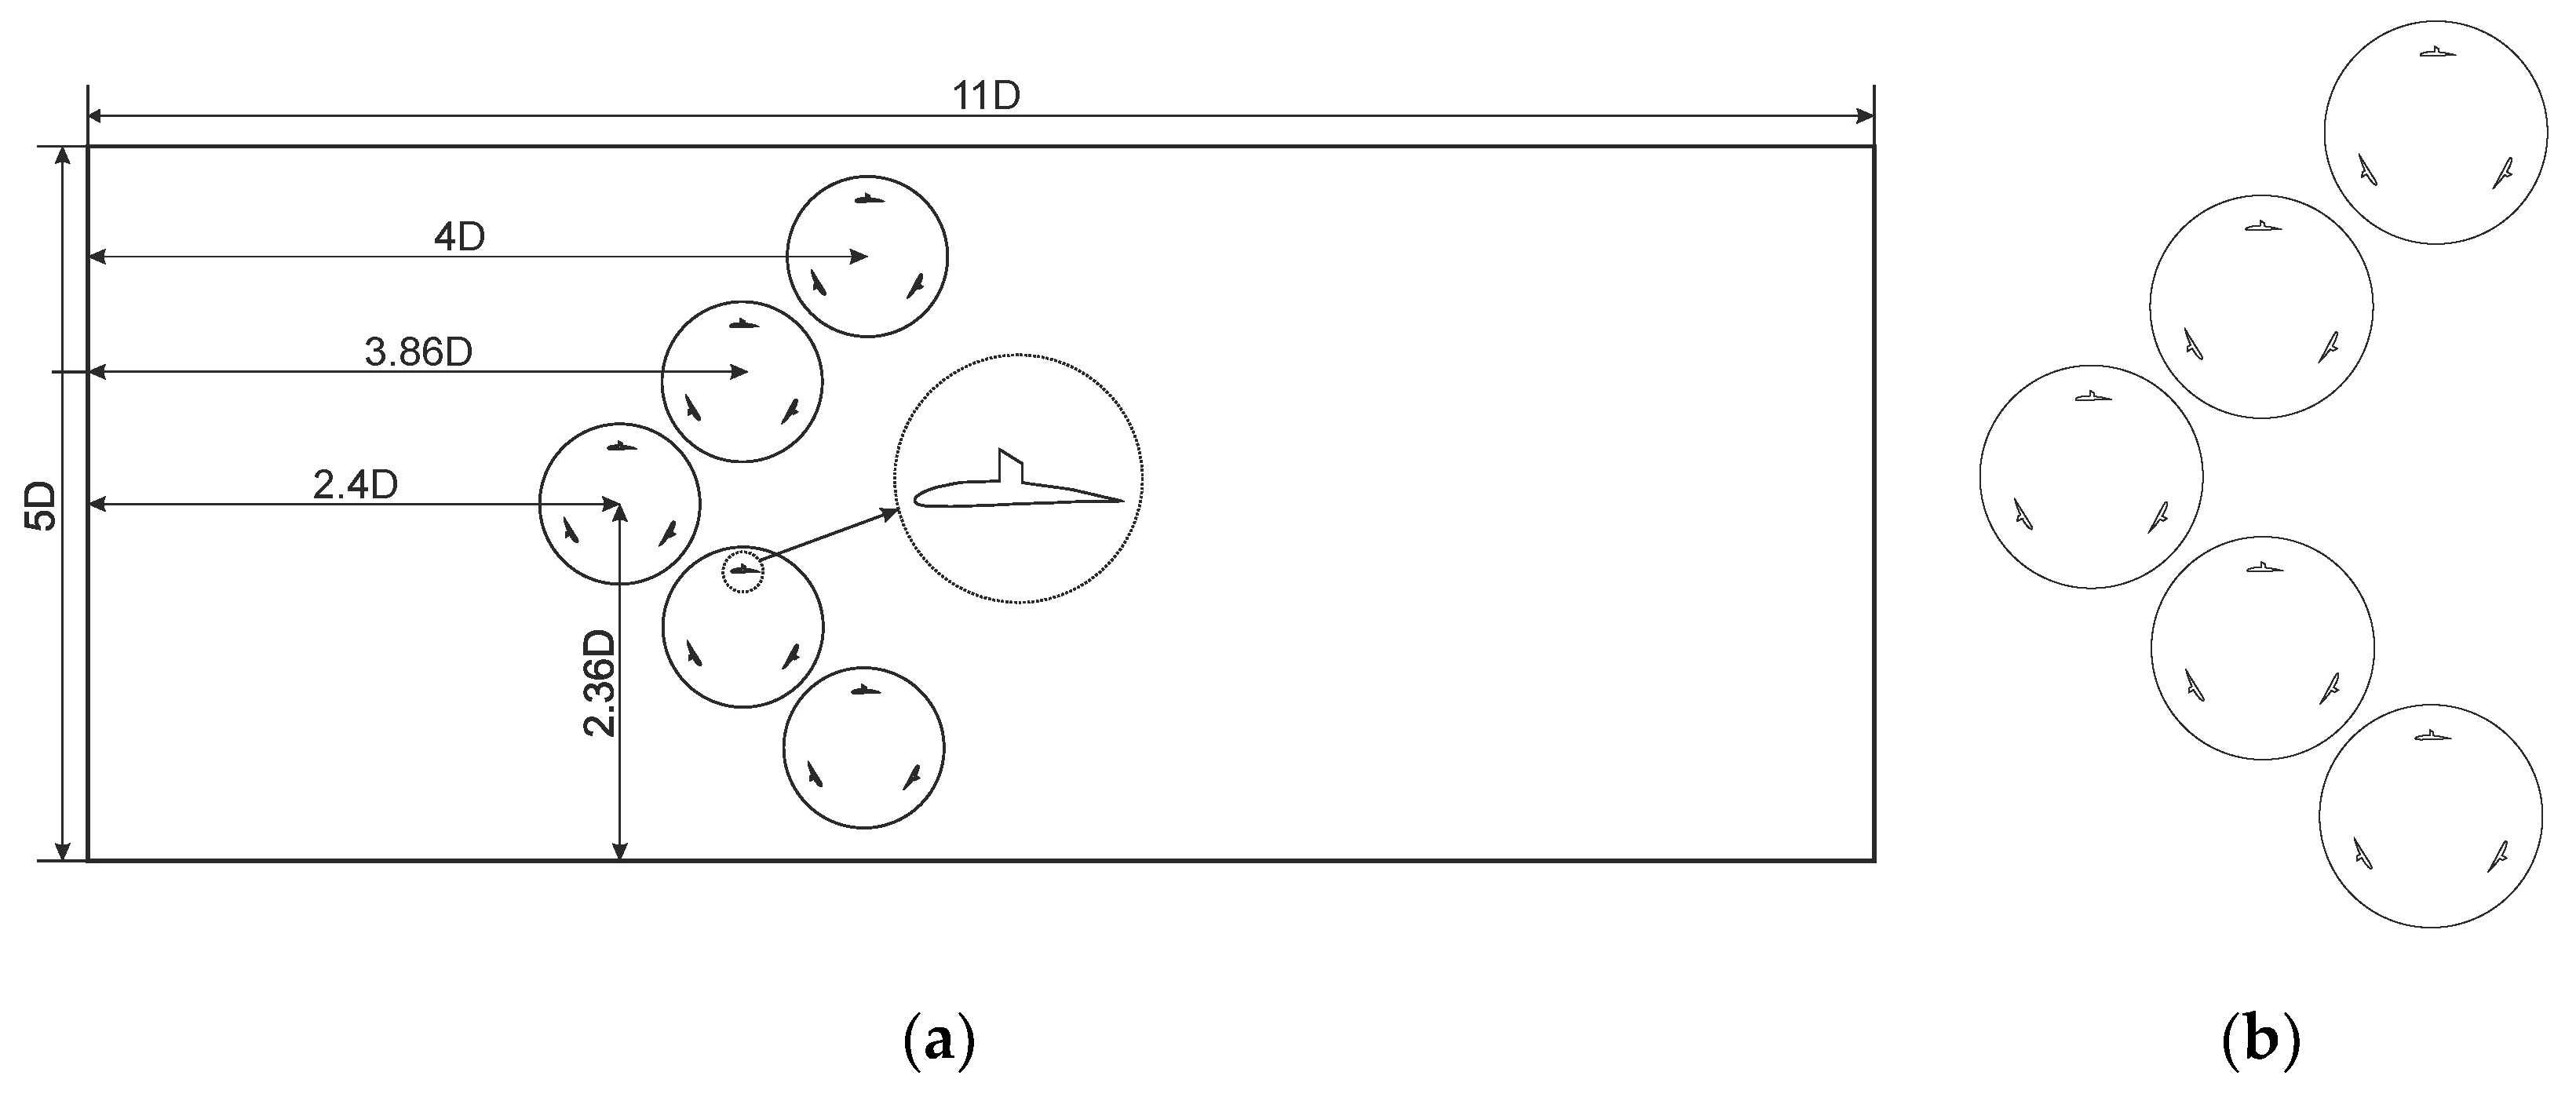
Figure 5.
Third configuration with dimensions(a) and closer view(b).
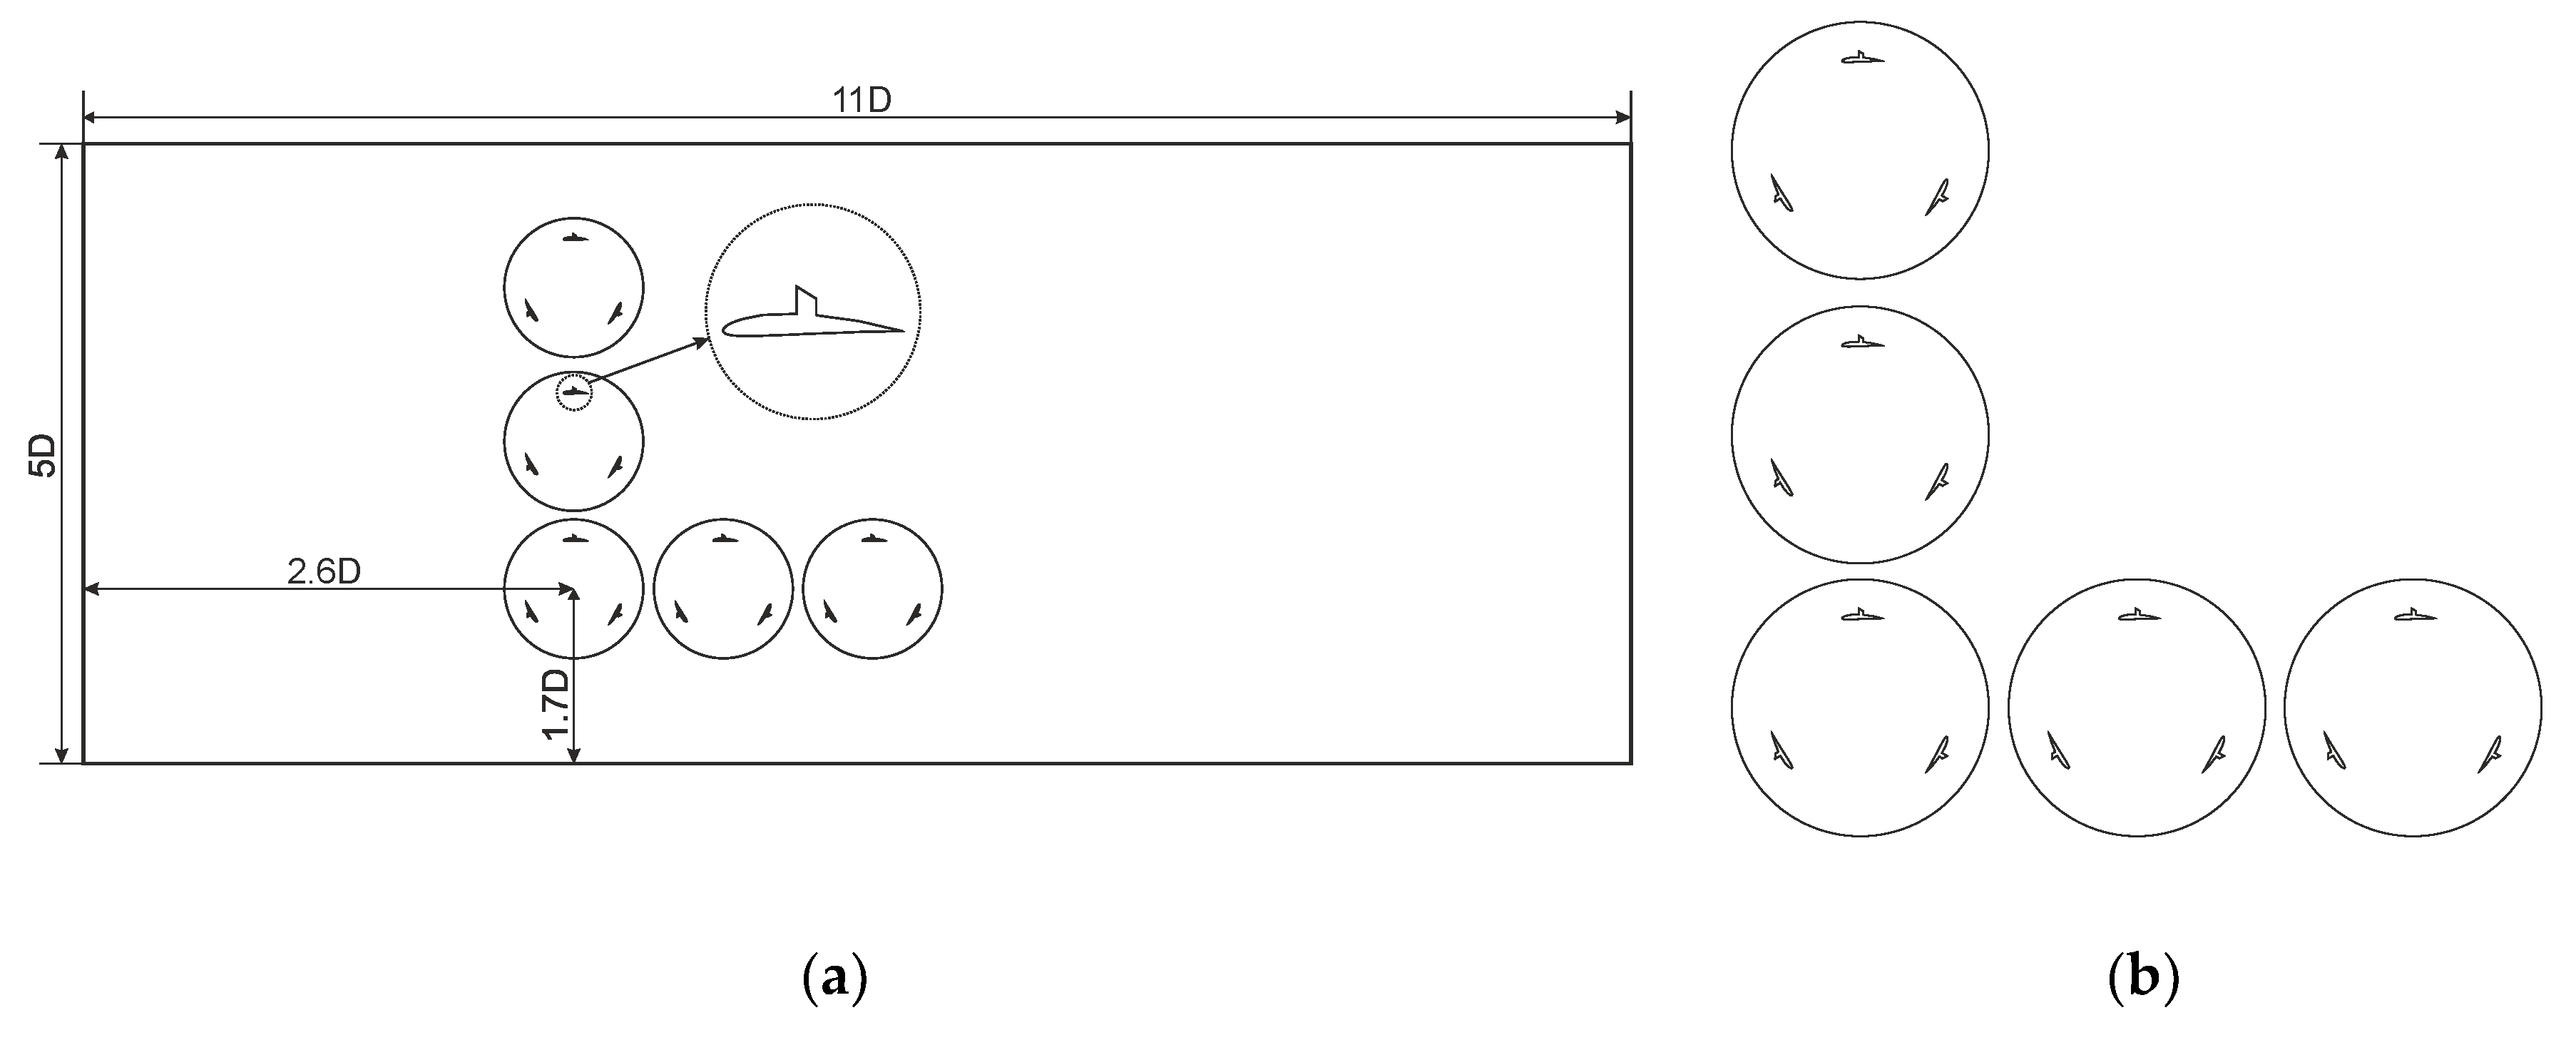
Figure 6.
Forth configuration with dimensions(a) and closer view(b).
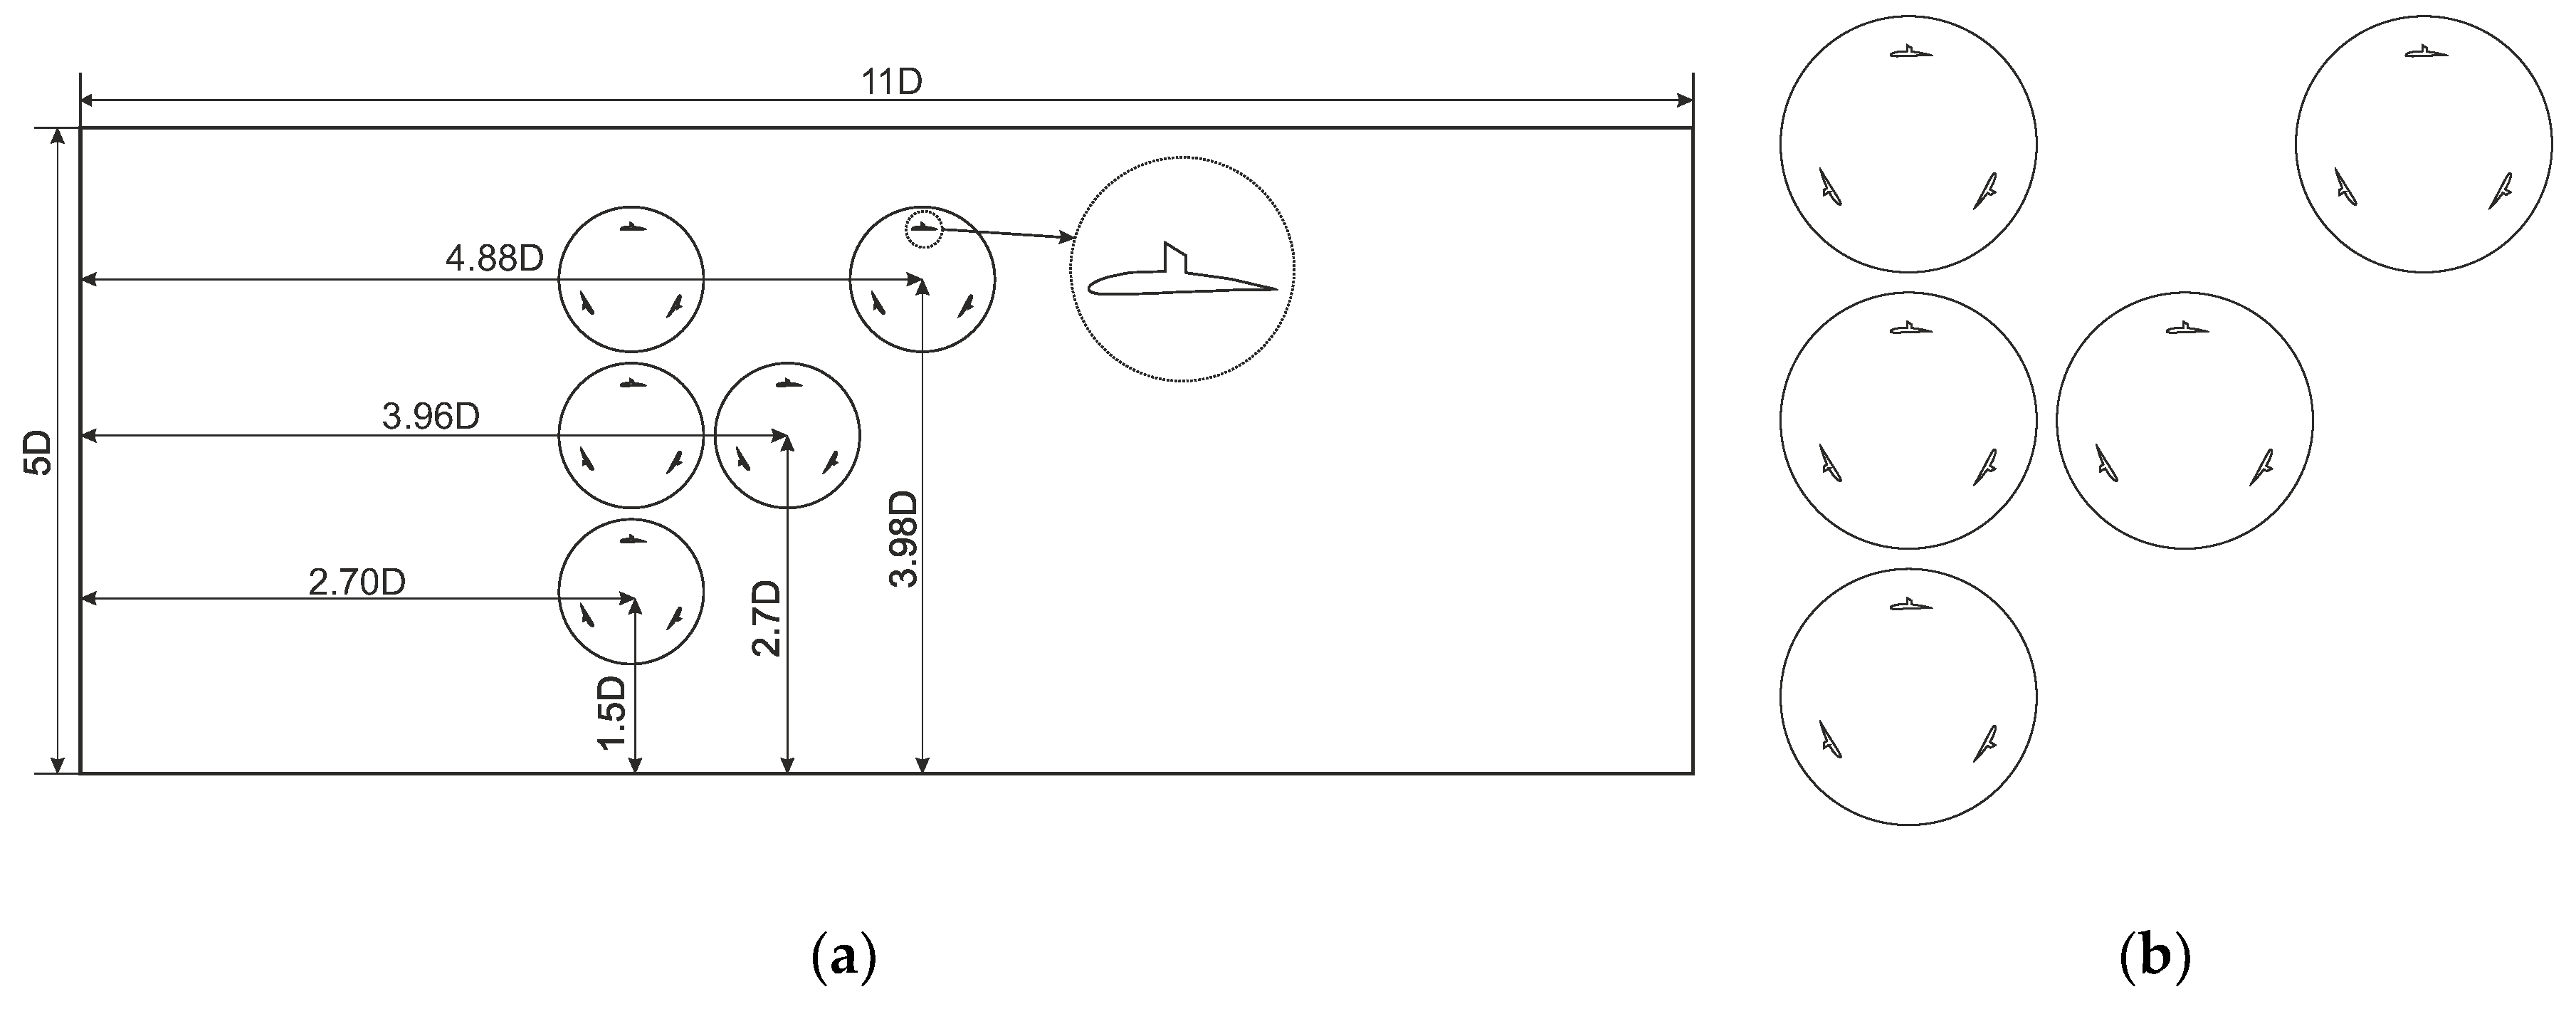
Figure 7.
Mesh quality of 5 VAWT configuration.
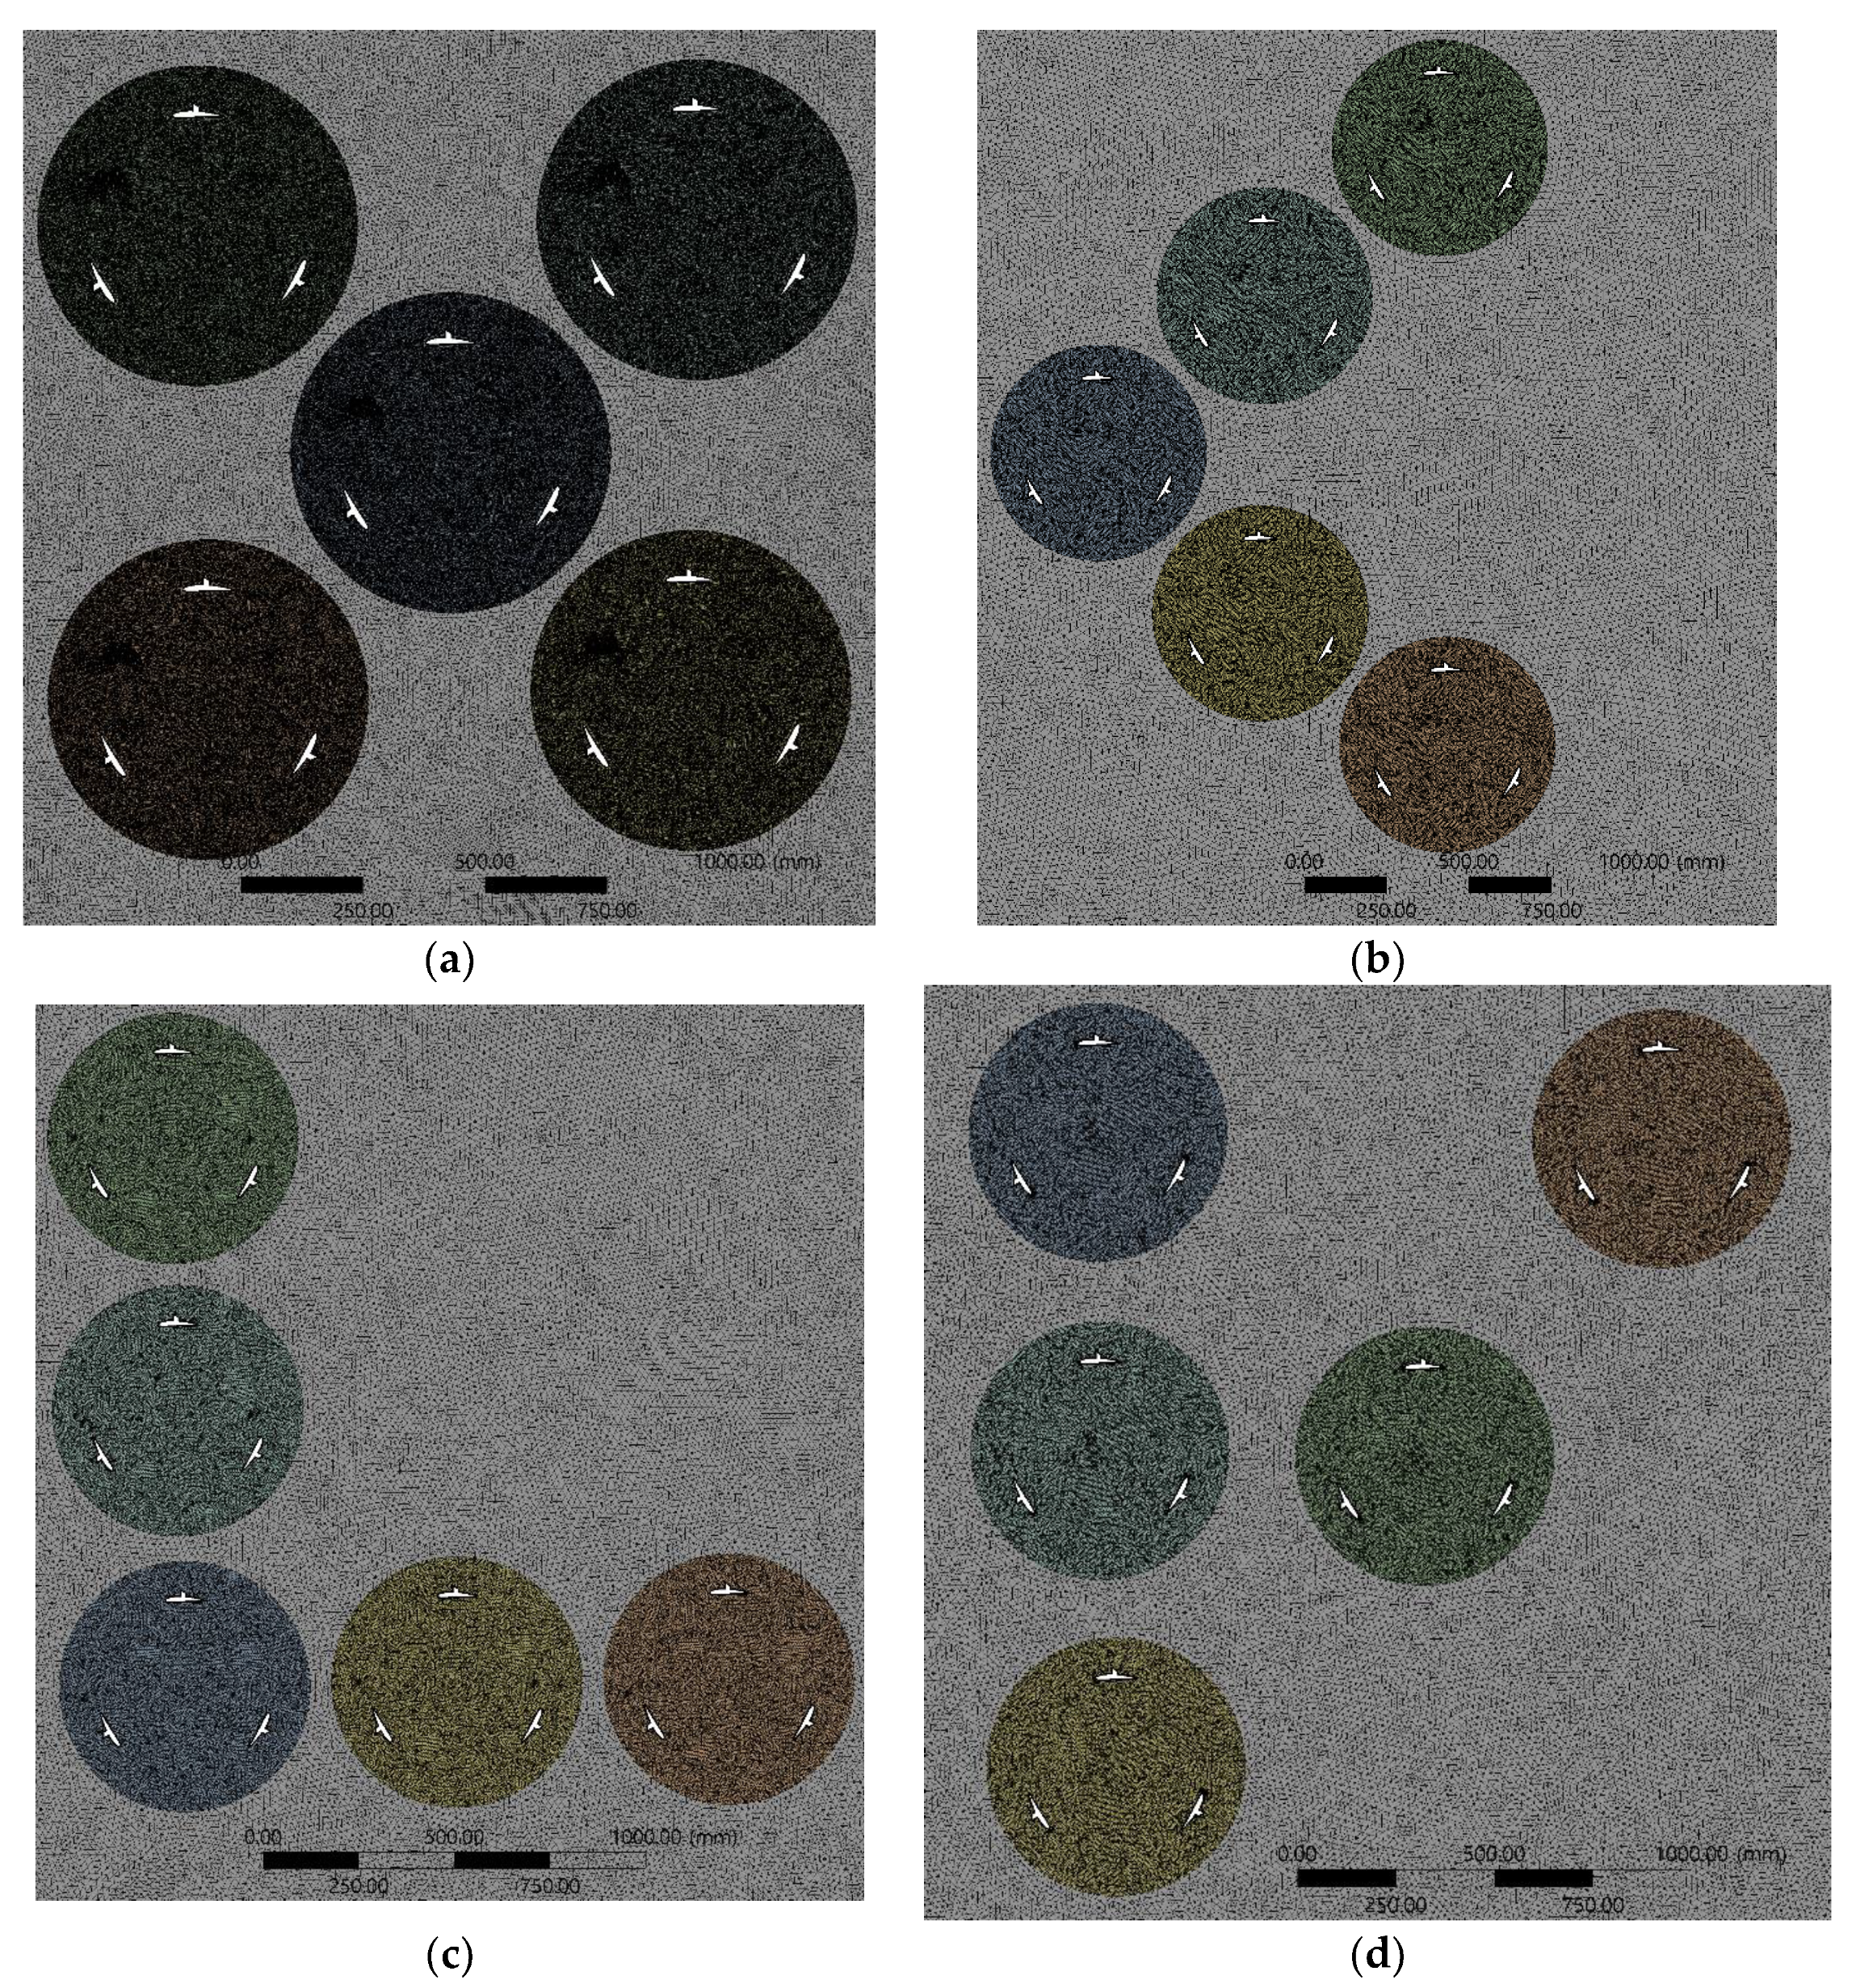
Figure 8.
CFD results relate to the first configuration, which includes (a) static pressure, (b) Eddy viscosity,(c) velocity, and (d) turbulence kinetic energy of turbines.
Figure 8.
CFD results relate to the first configuration, which includes (a) static pressure, (b) Eddy viscosity,(c) velocity, and (d) turbulence kinetic energy of turbines.
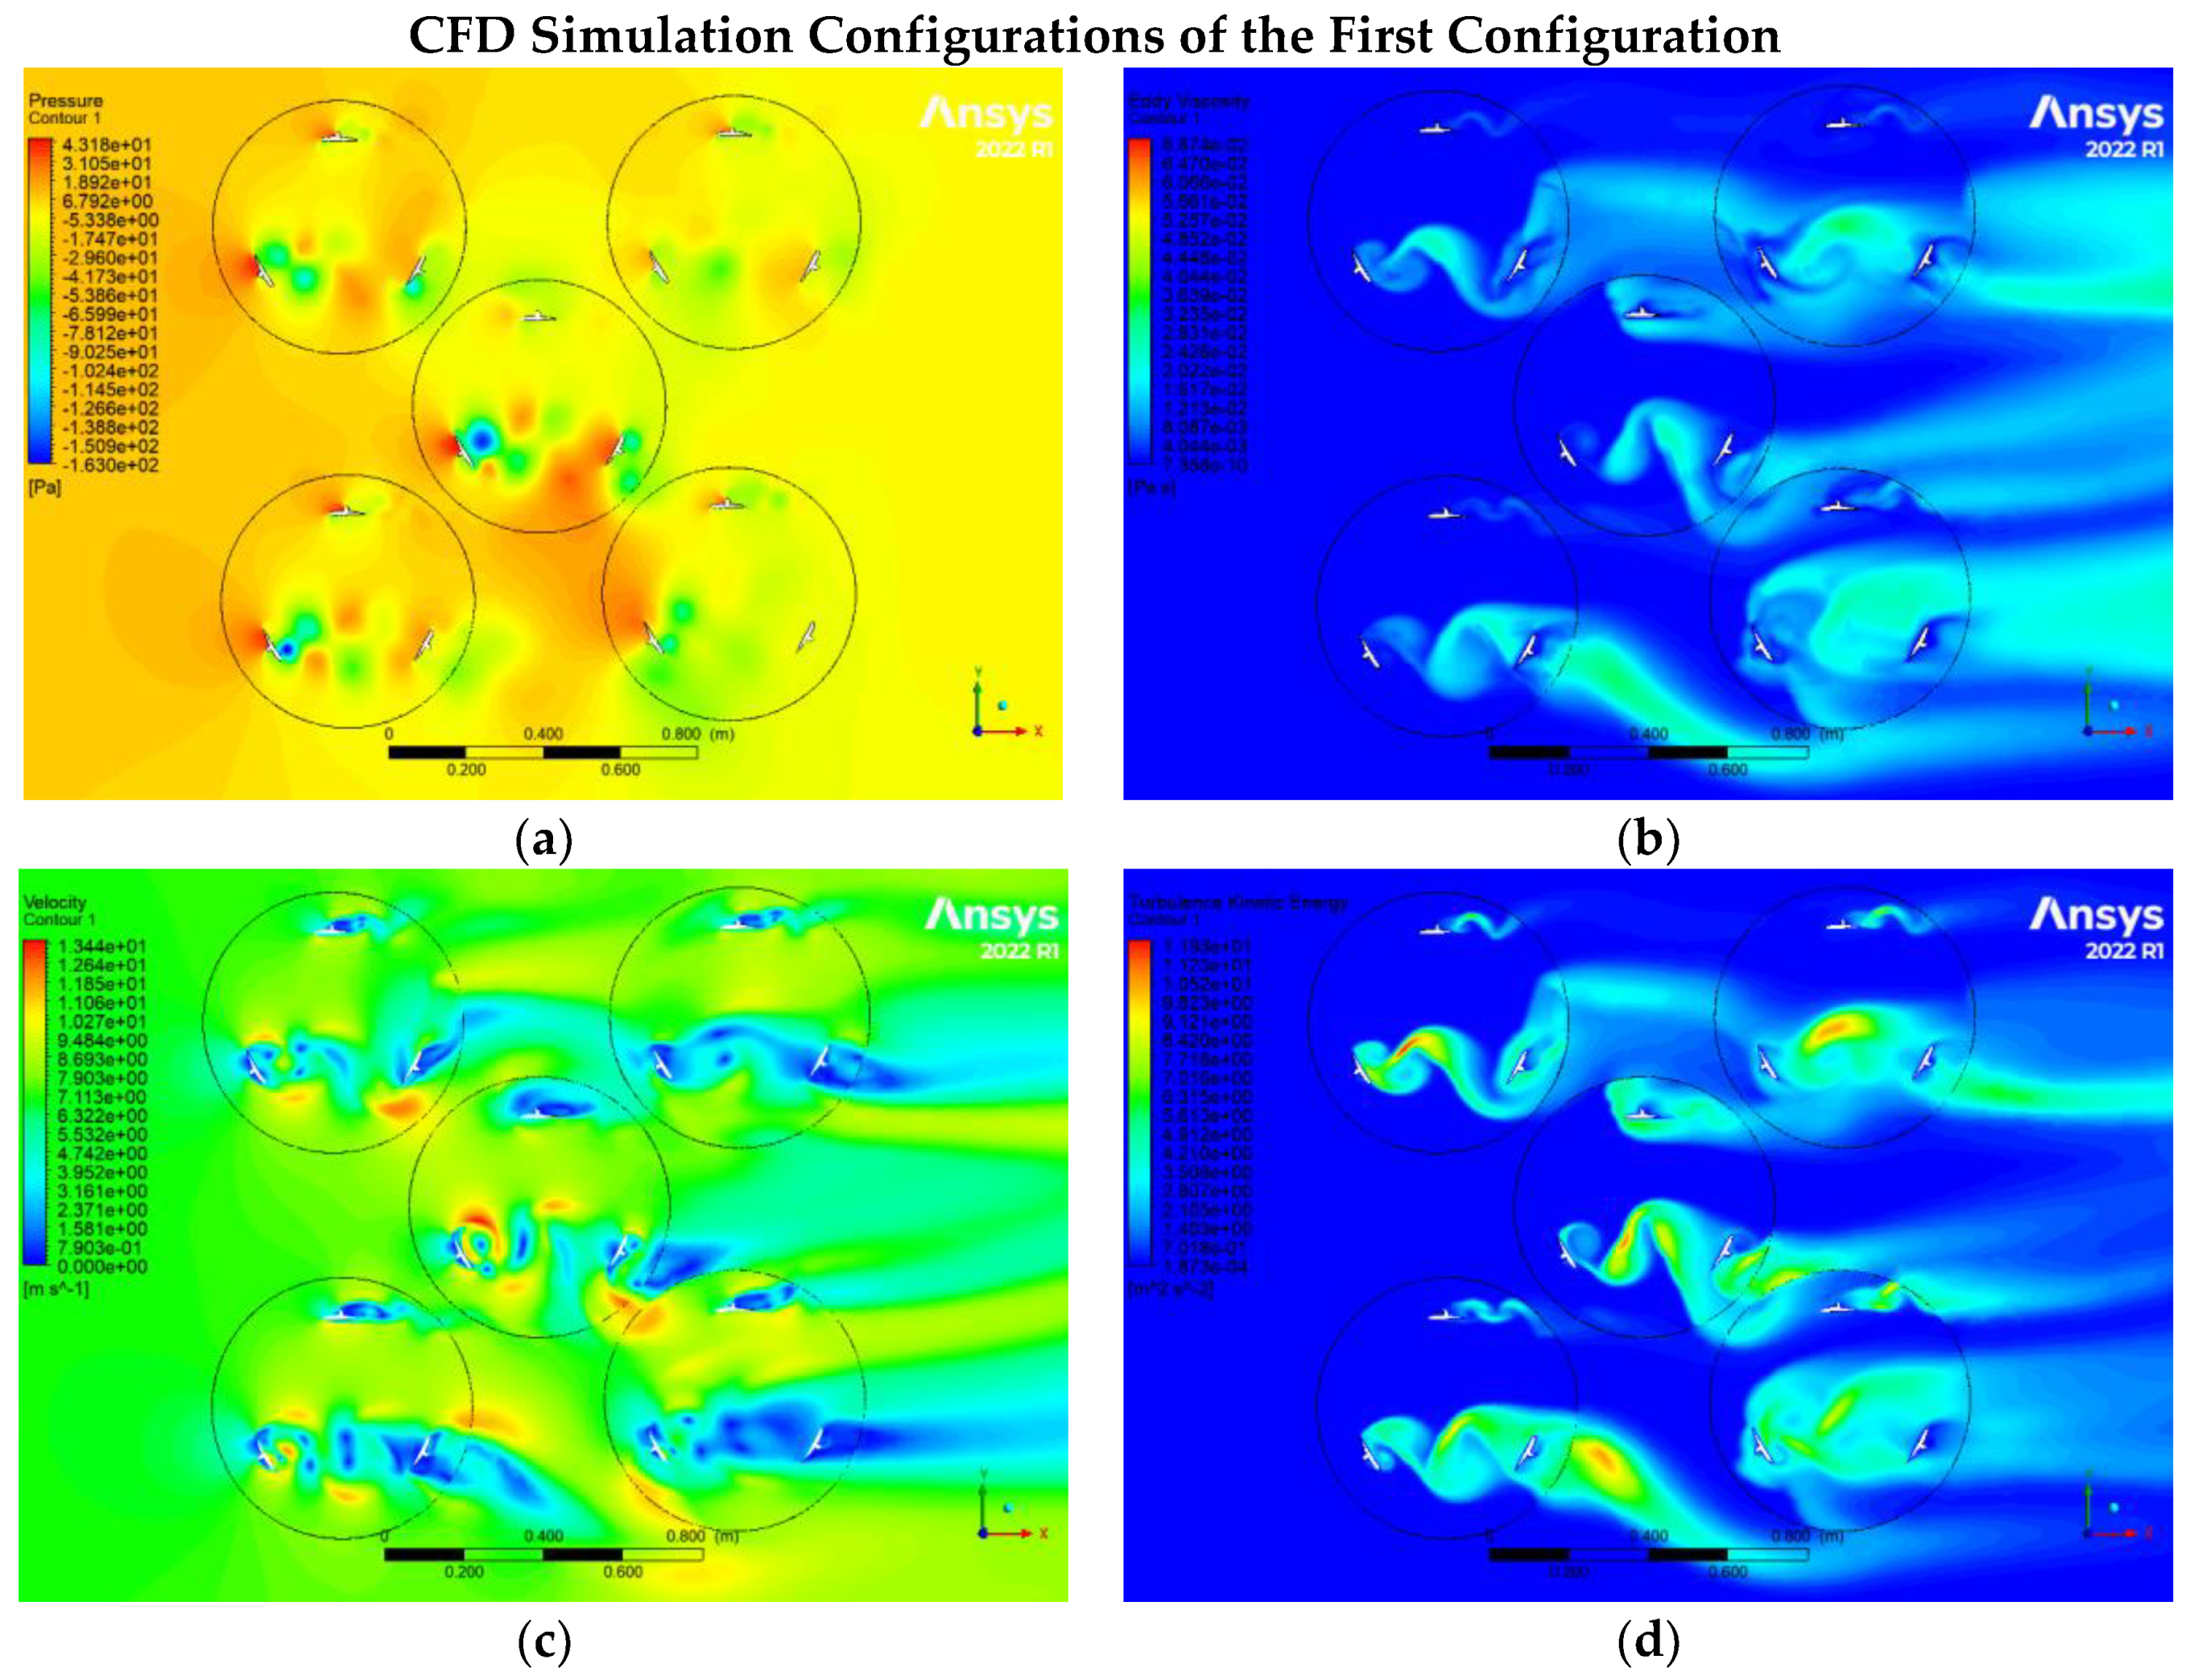
Figure 9.
CFD results relate to the second configuration, which includes (a) static pressure, (b) Eddy viscosity,(c) velocity, and (d) turbulence kinetic energy of turbines.
Figure 9.
CFD results relate to the second configuration, which includes (a) static pressure, (b) Eddy viscosity,(c) velocity, and (d) turbulence kinetic energy of turbines.
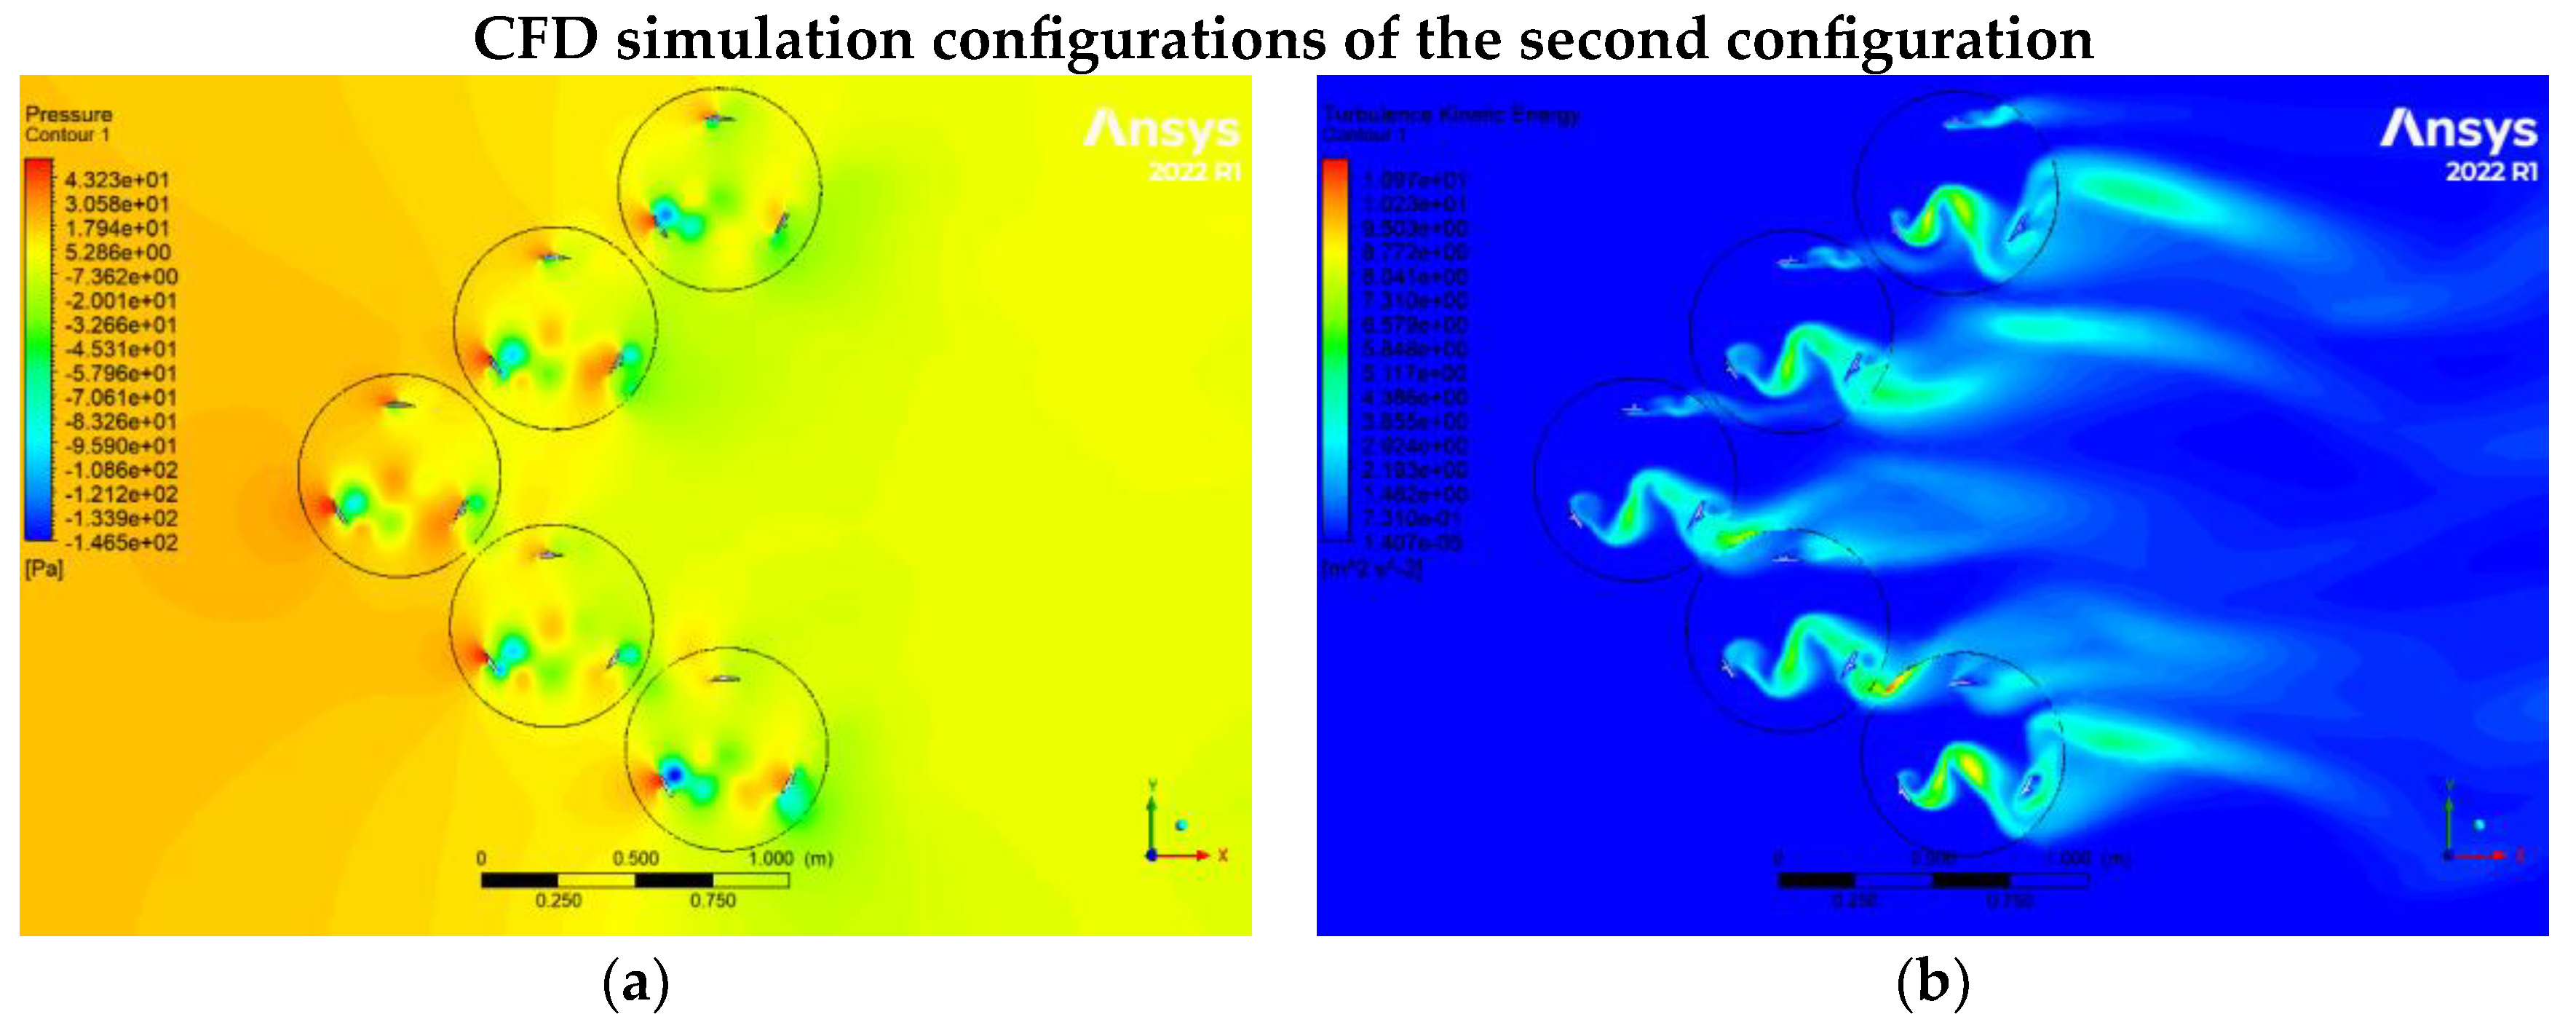
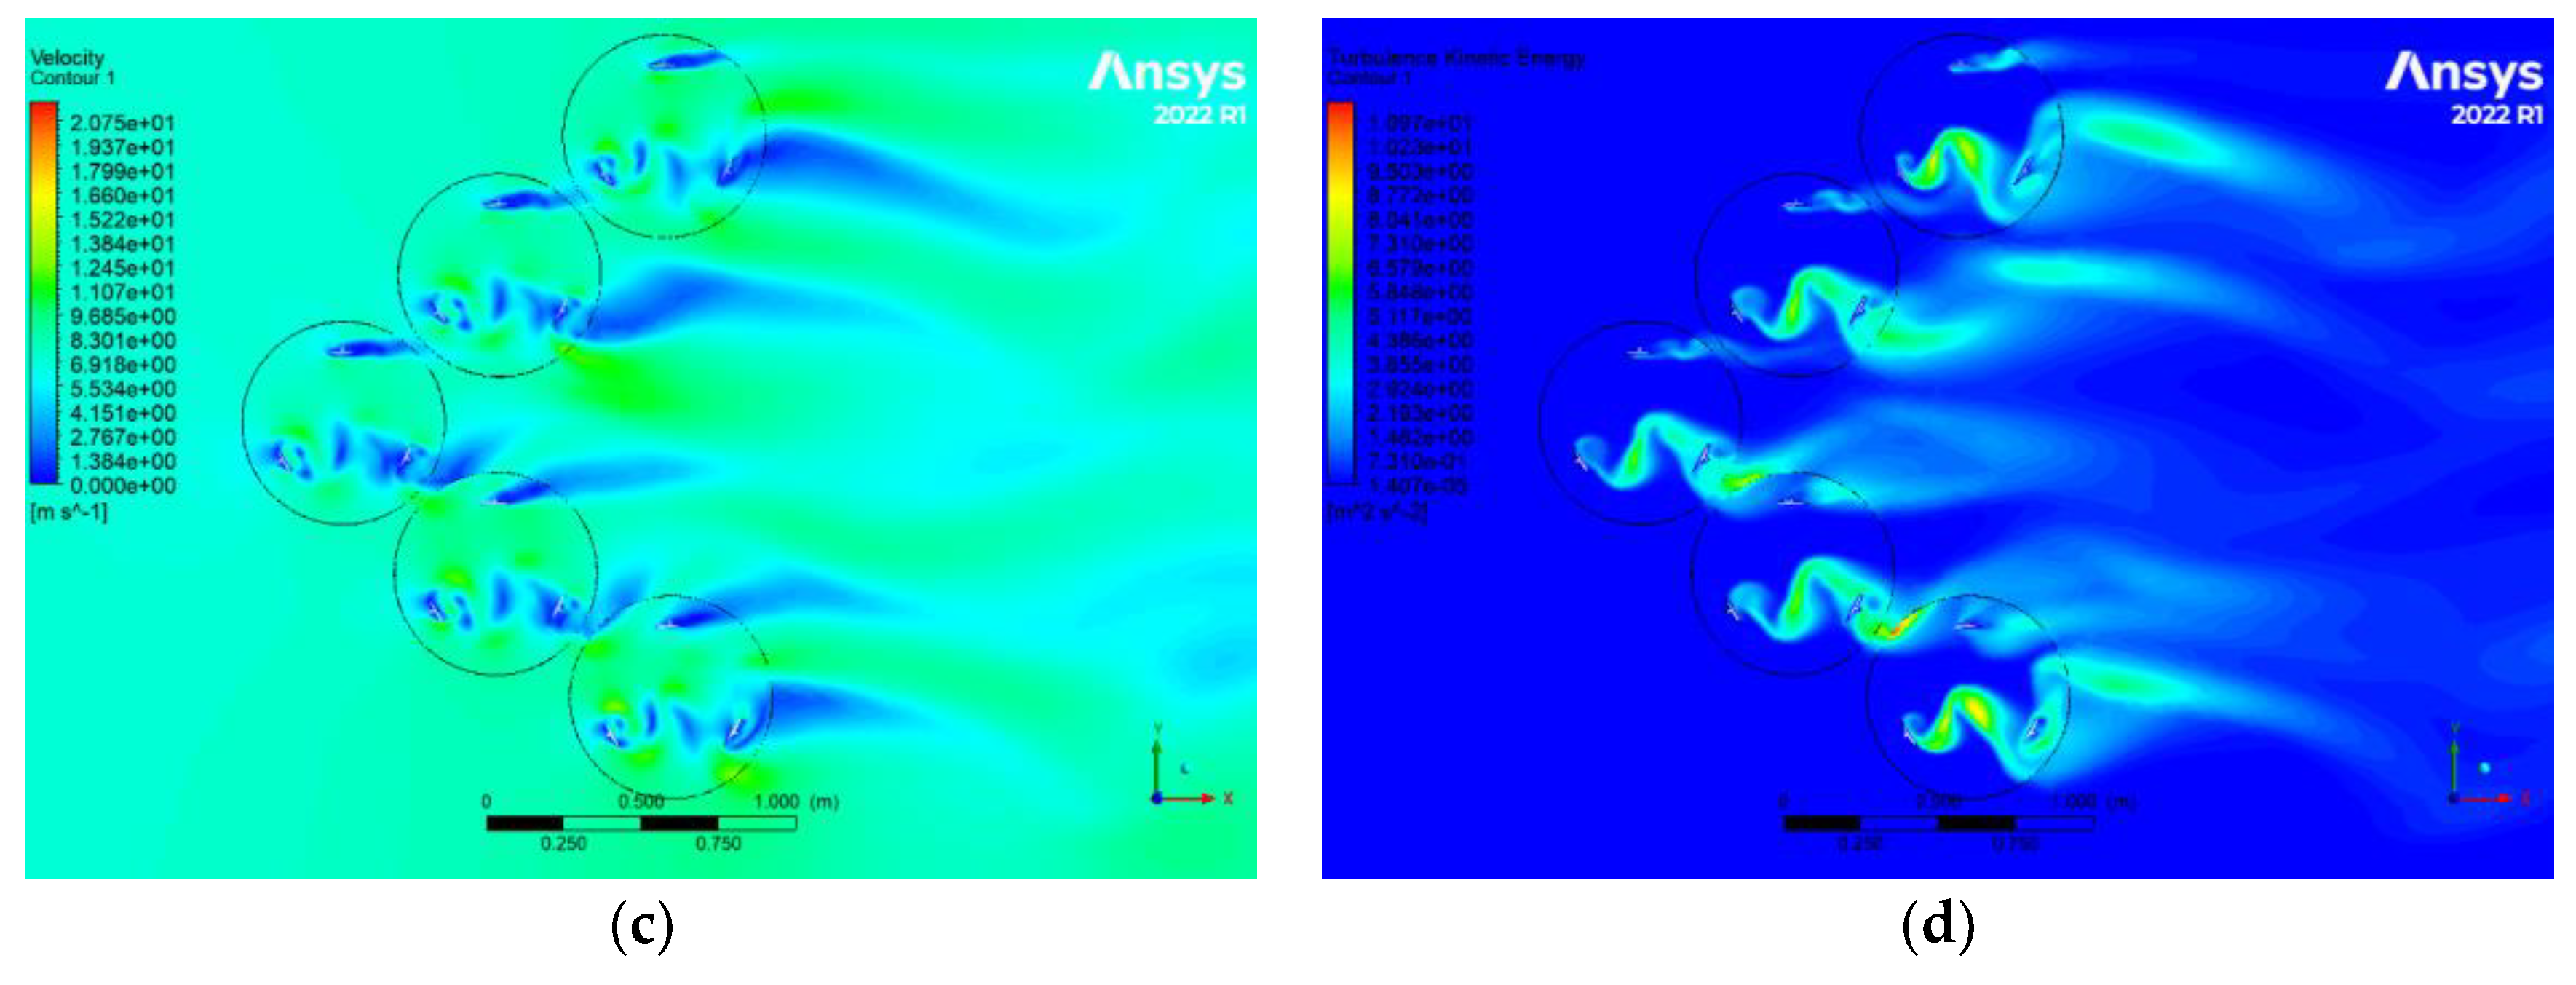
Figure 10.
CFD results relate to the third configuration, which includes (a) static pressure, (b) Eddy viscosity,(c) velocity, and (d) turbulence kinetic energy of turbines.
Figure 10.
CFD results relate to the third configuration, which includes (a) static pressure, (b) Eddy viscosity,(c) velocity, and (d) turbulence kinetic energy of turbines.
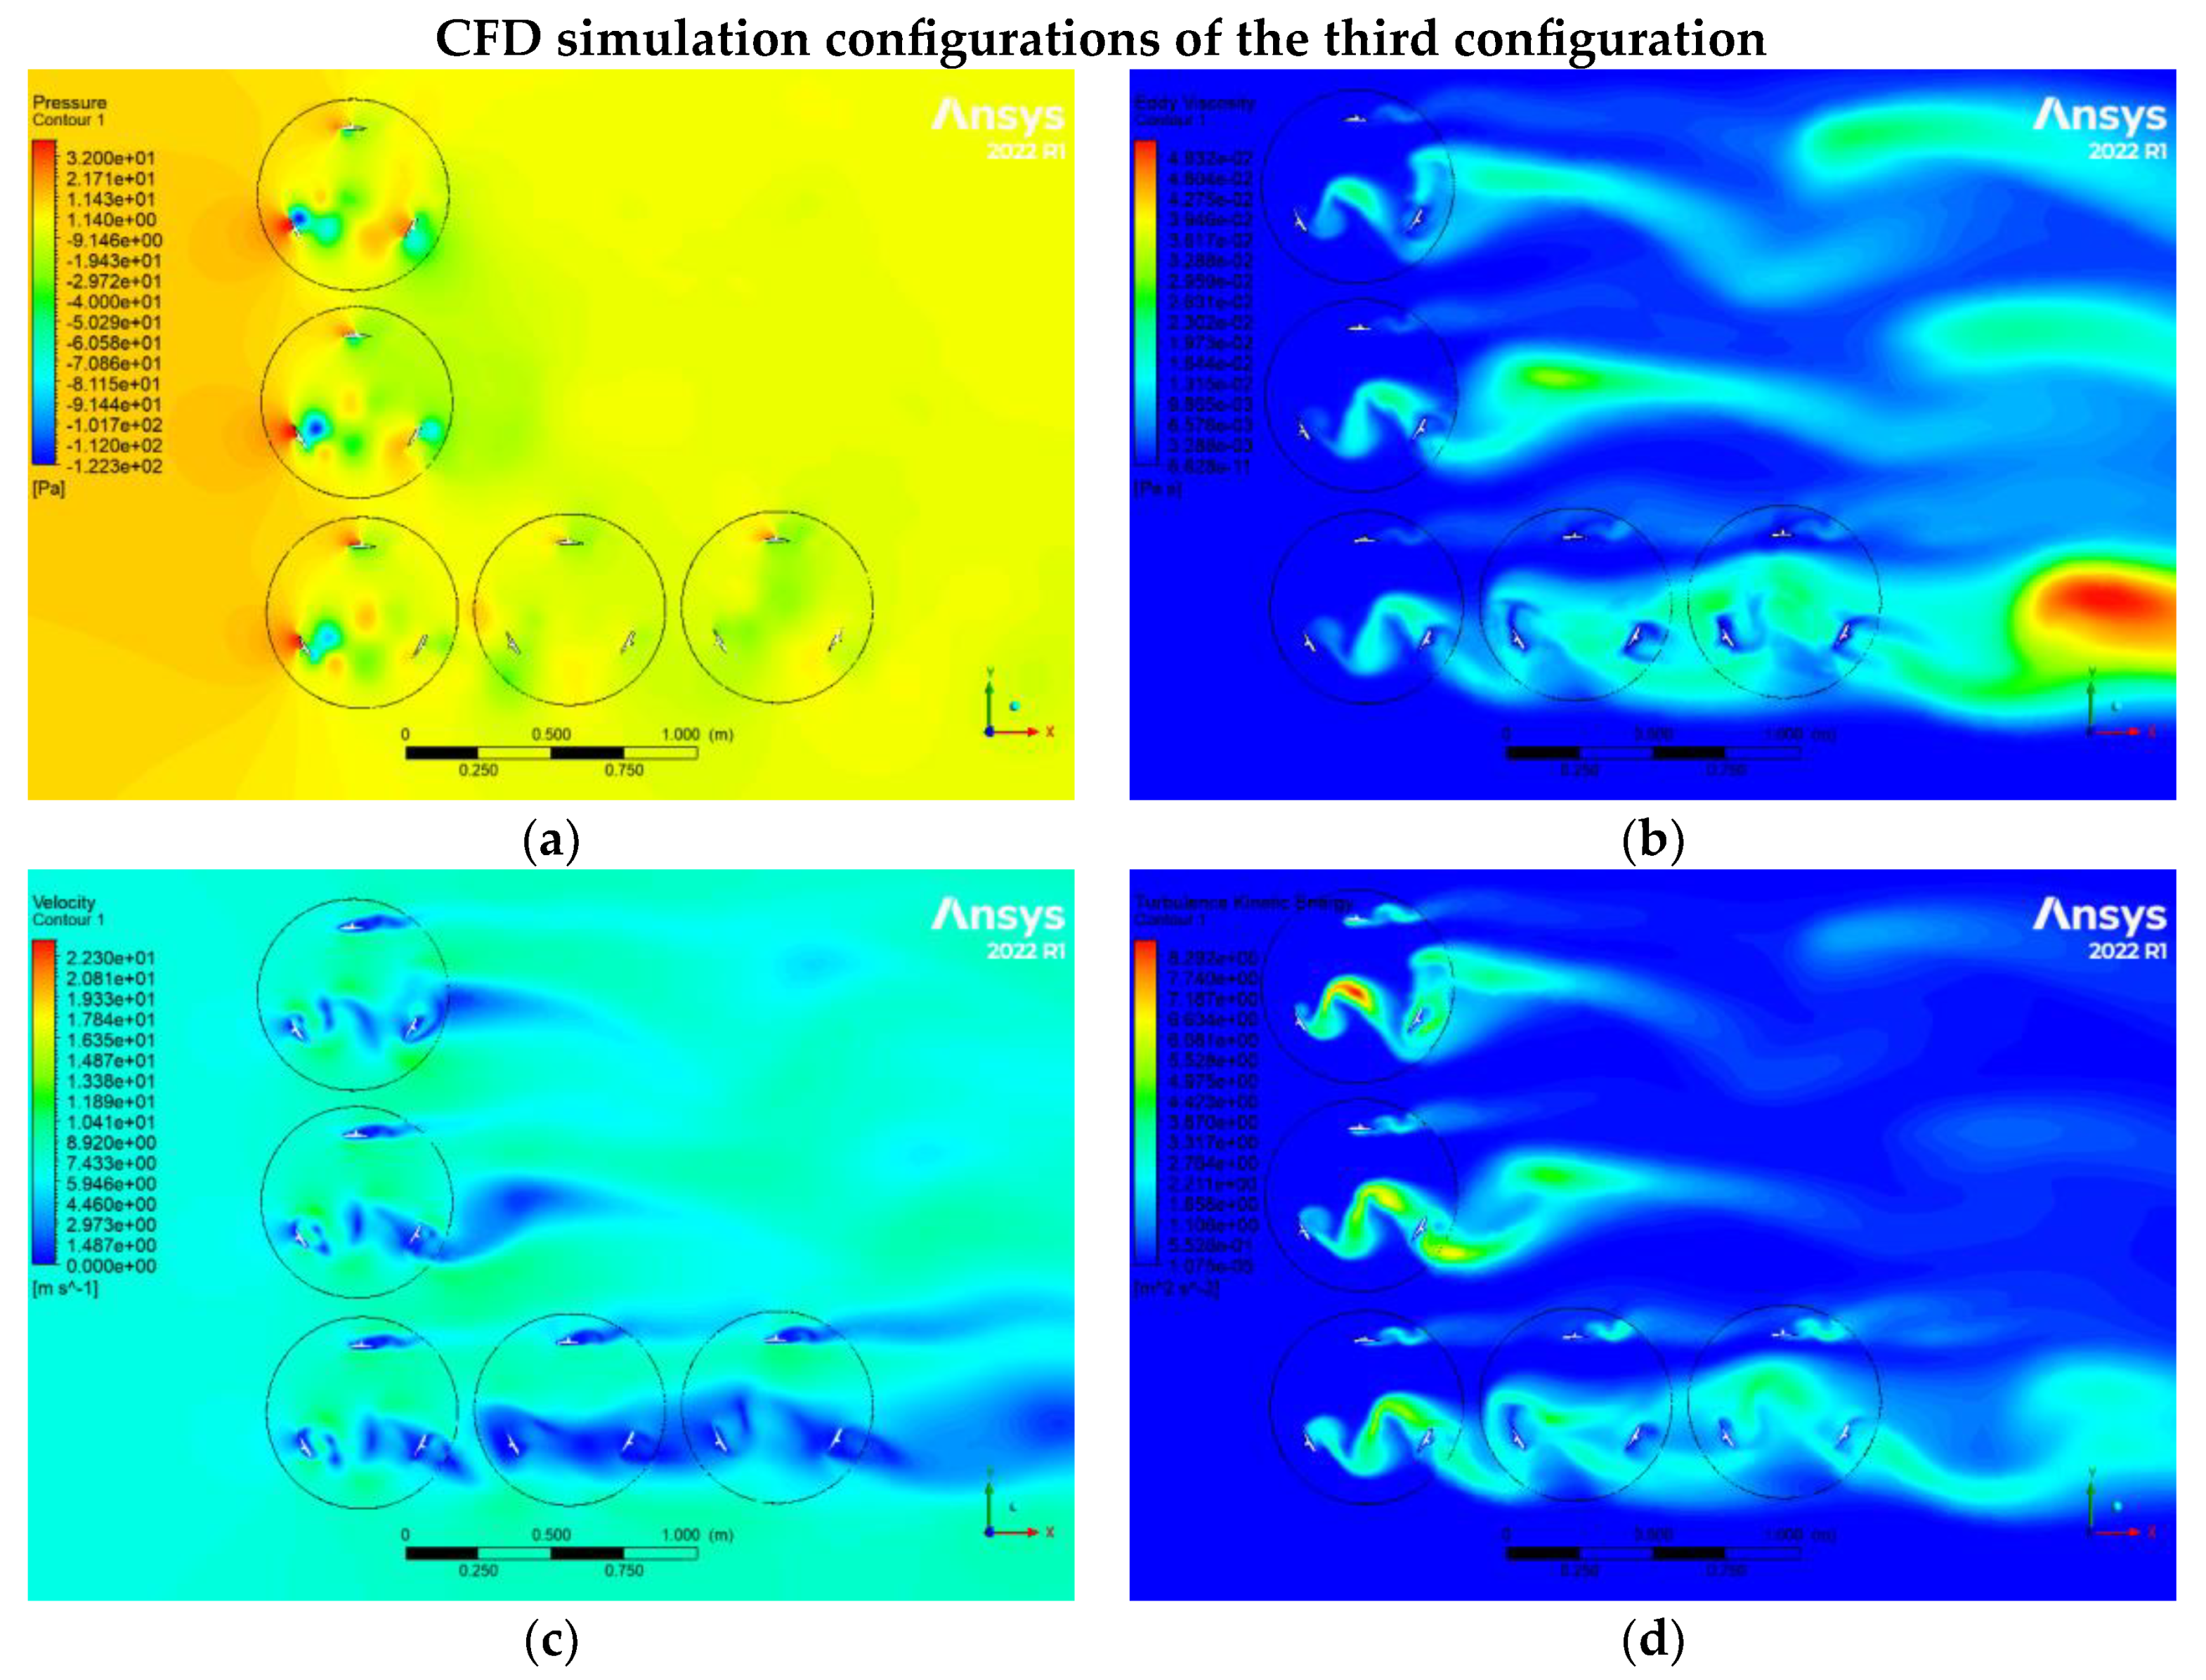
Figure 11.
CFD results relate to the fifth configuration, which includes (a) static pressure, (b) Eddy viscosity,(c) velocity, and (d) turbulence kinetic energy of turbines.
Figure 11.
CFD results relate to the fifth configuration, which includes (a) static pressure, (b) Eddy viscosity,(c) velocity, and (d) turbulence kinetic energy of turbines.
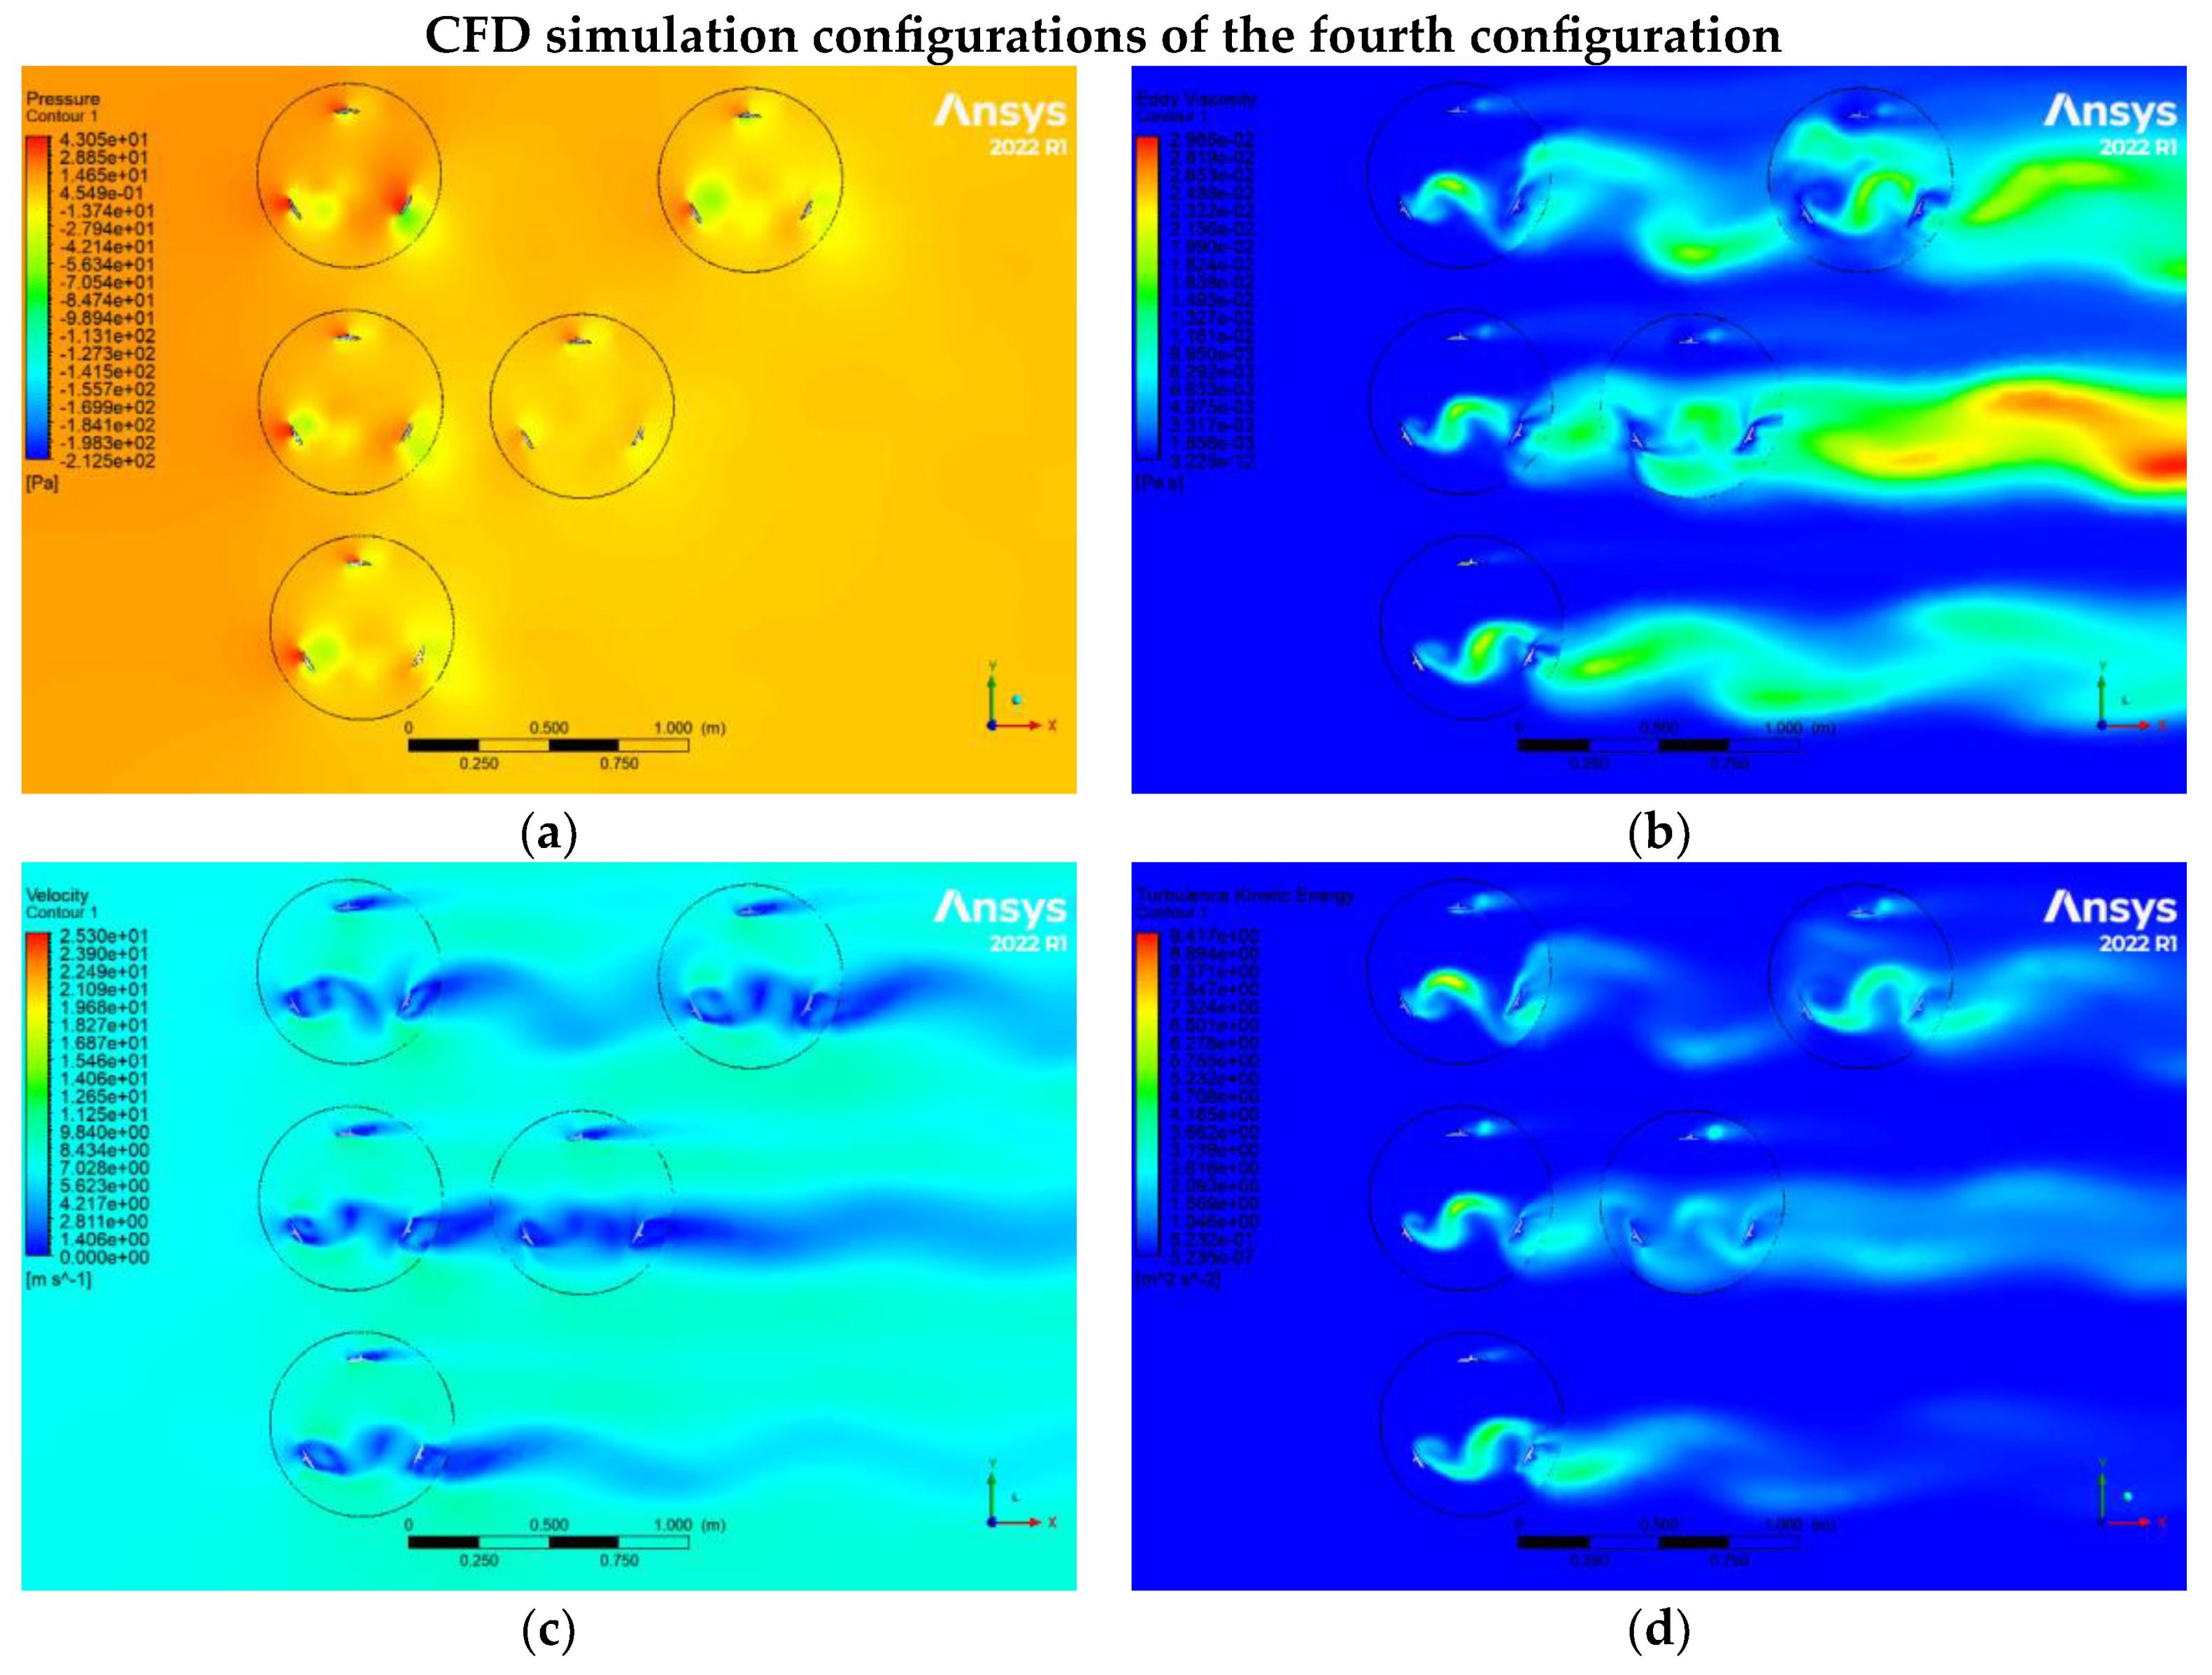
Figure 12.
Moment coefficients of VG-VAWTs for different directional angles (a) single blade and (b) whole turbine.
Figure 12.
Moment coefficients of VG-VAWTs for different directional angles (a) single blade and (b) whole turbine.
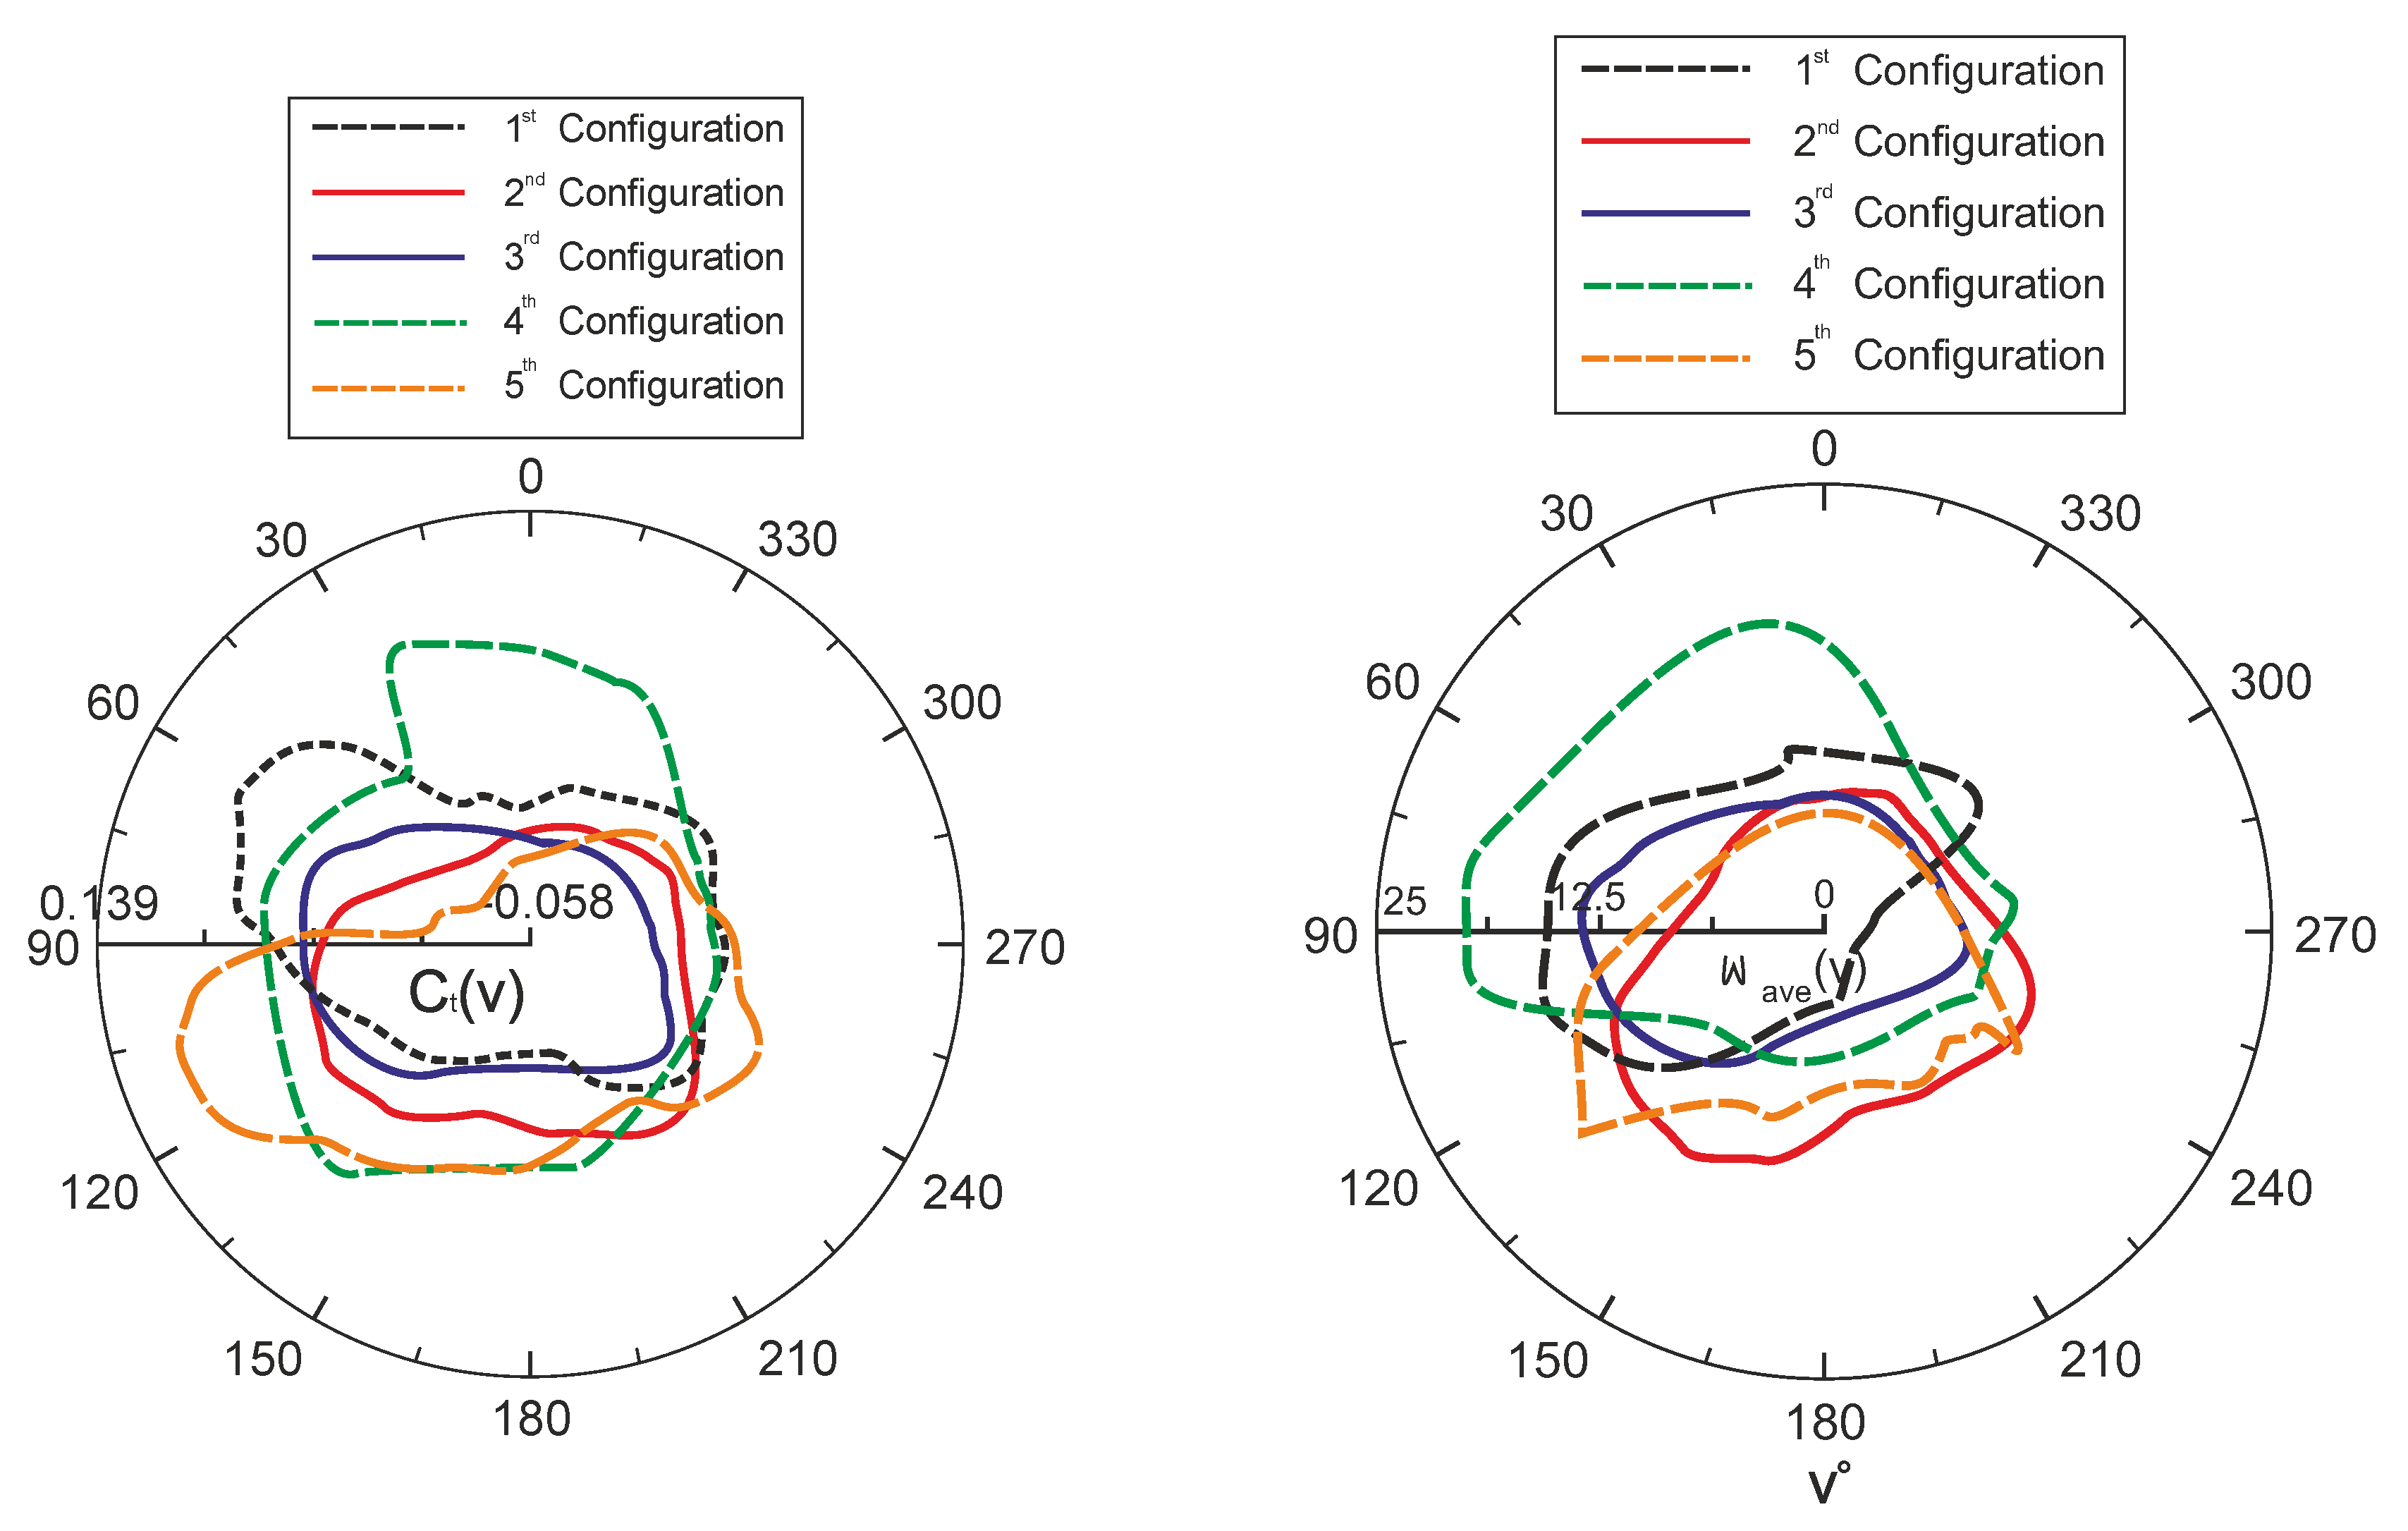
Figure 13.
Neural-fuzzy system for obtaining relations between CFD data.
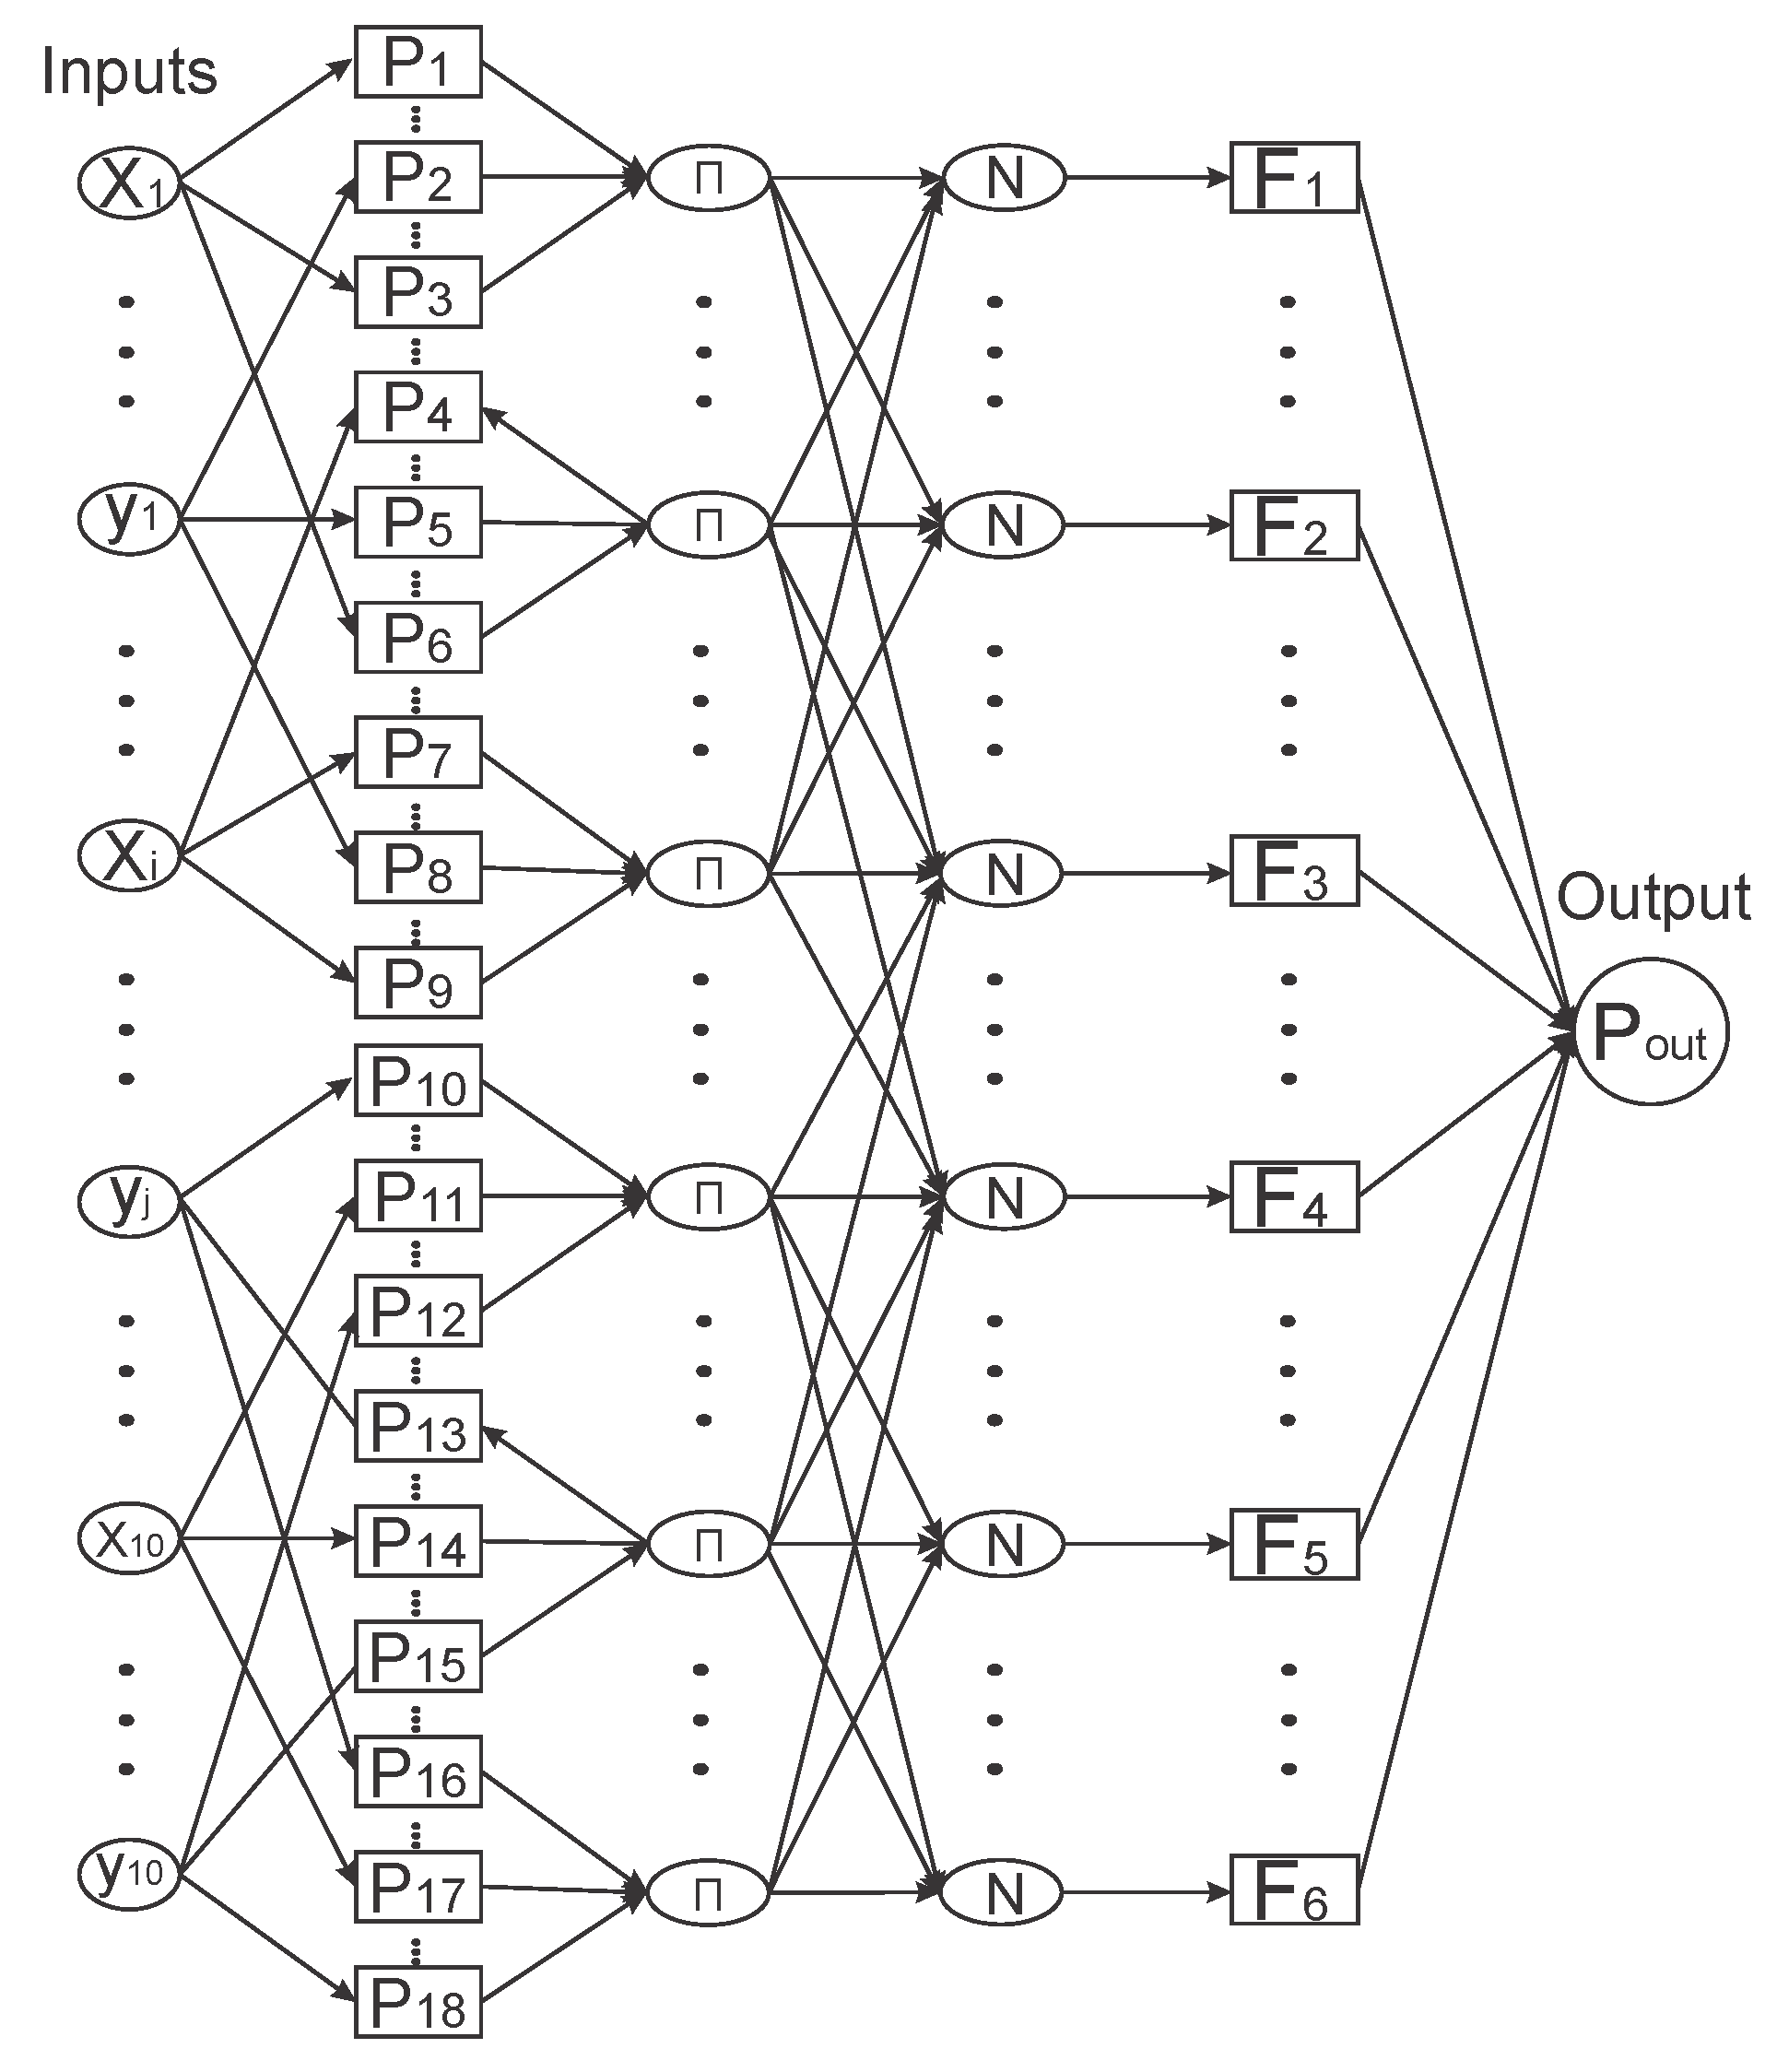
Figure 14.
Optimizing output power generation with the help of (a) WOA, (b) ABC, (c) GOA and (d) FA meta-heuristic optimizers.
Figure 14.
Optimizing output power generation with the help of (a) WOA, (b) ABC, (c) GOA and (d) FA meta-heuristic optimizers.
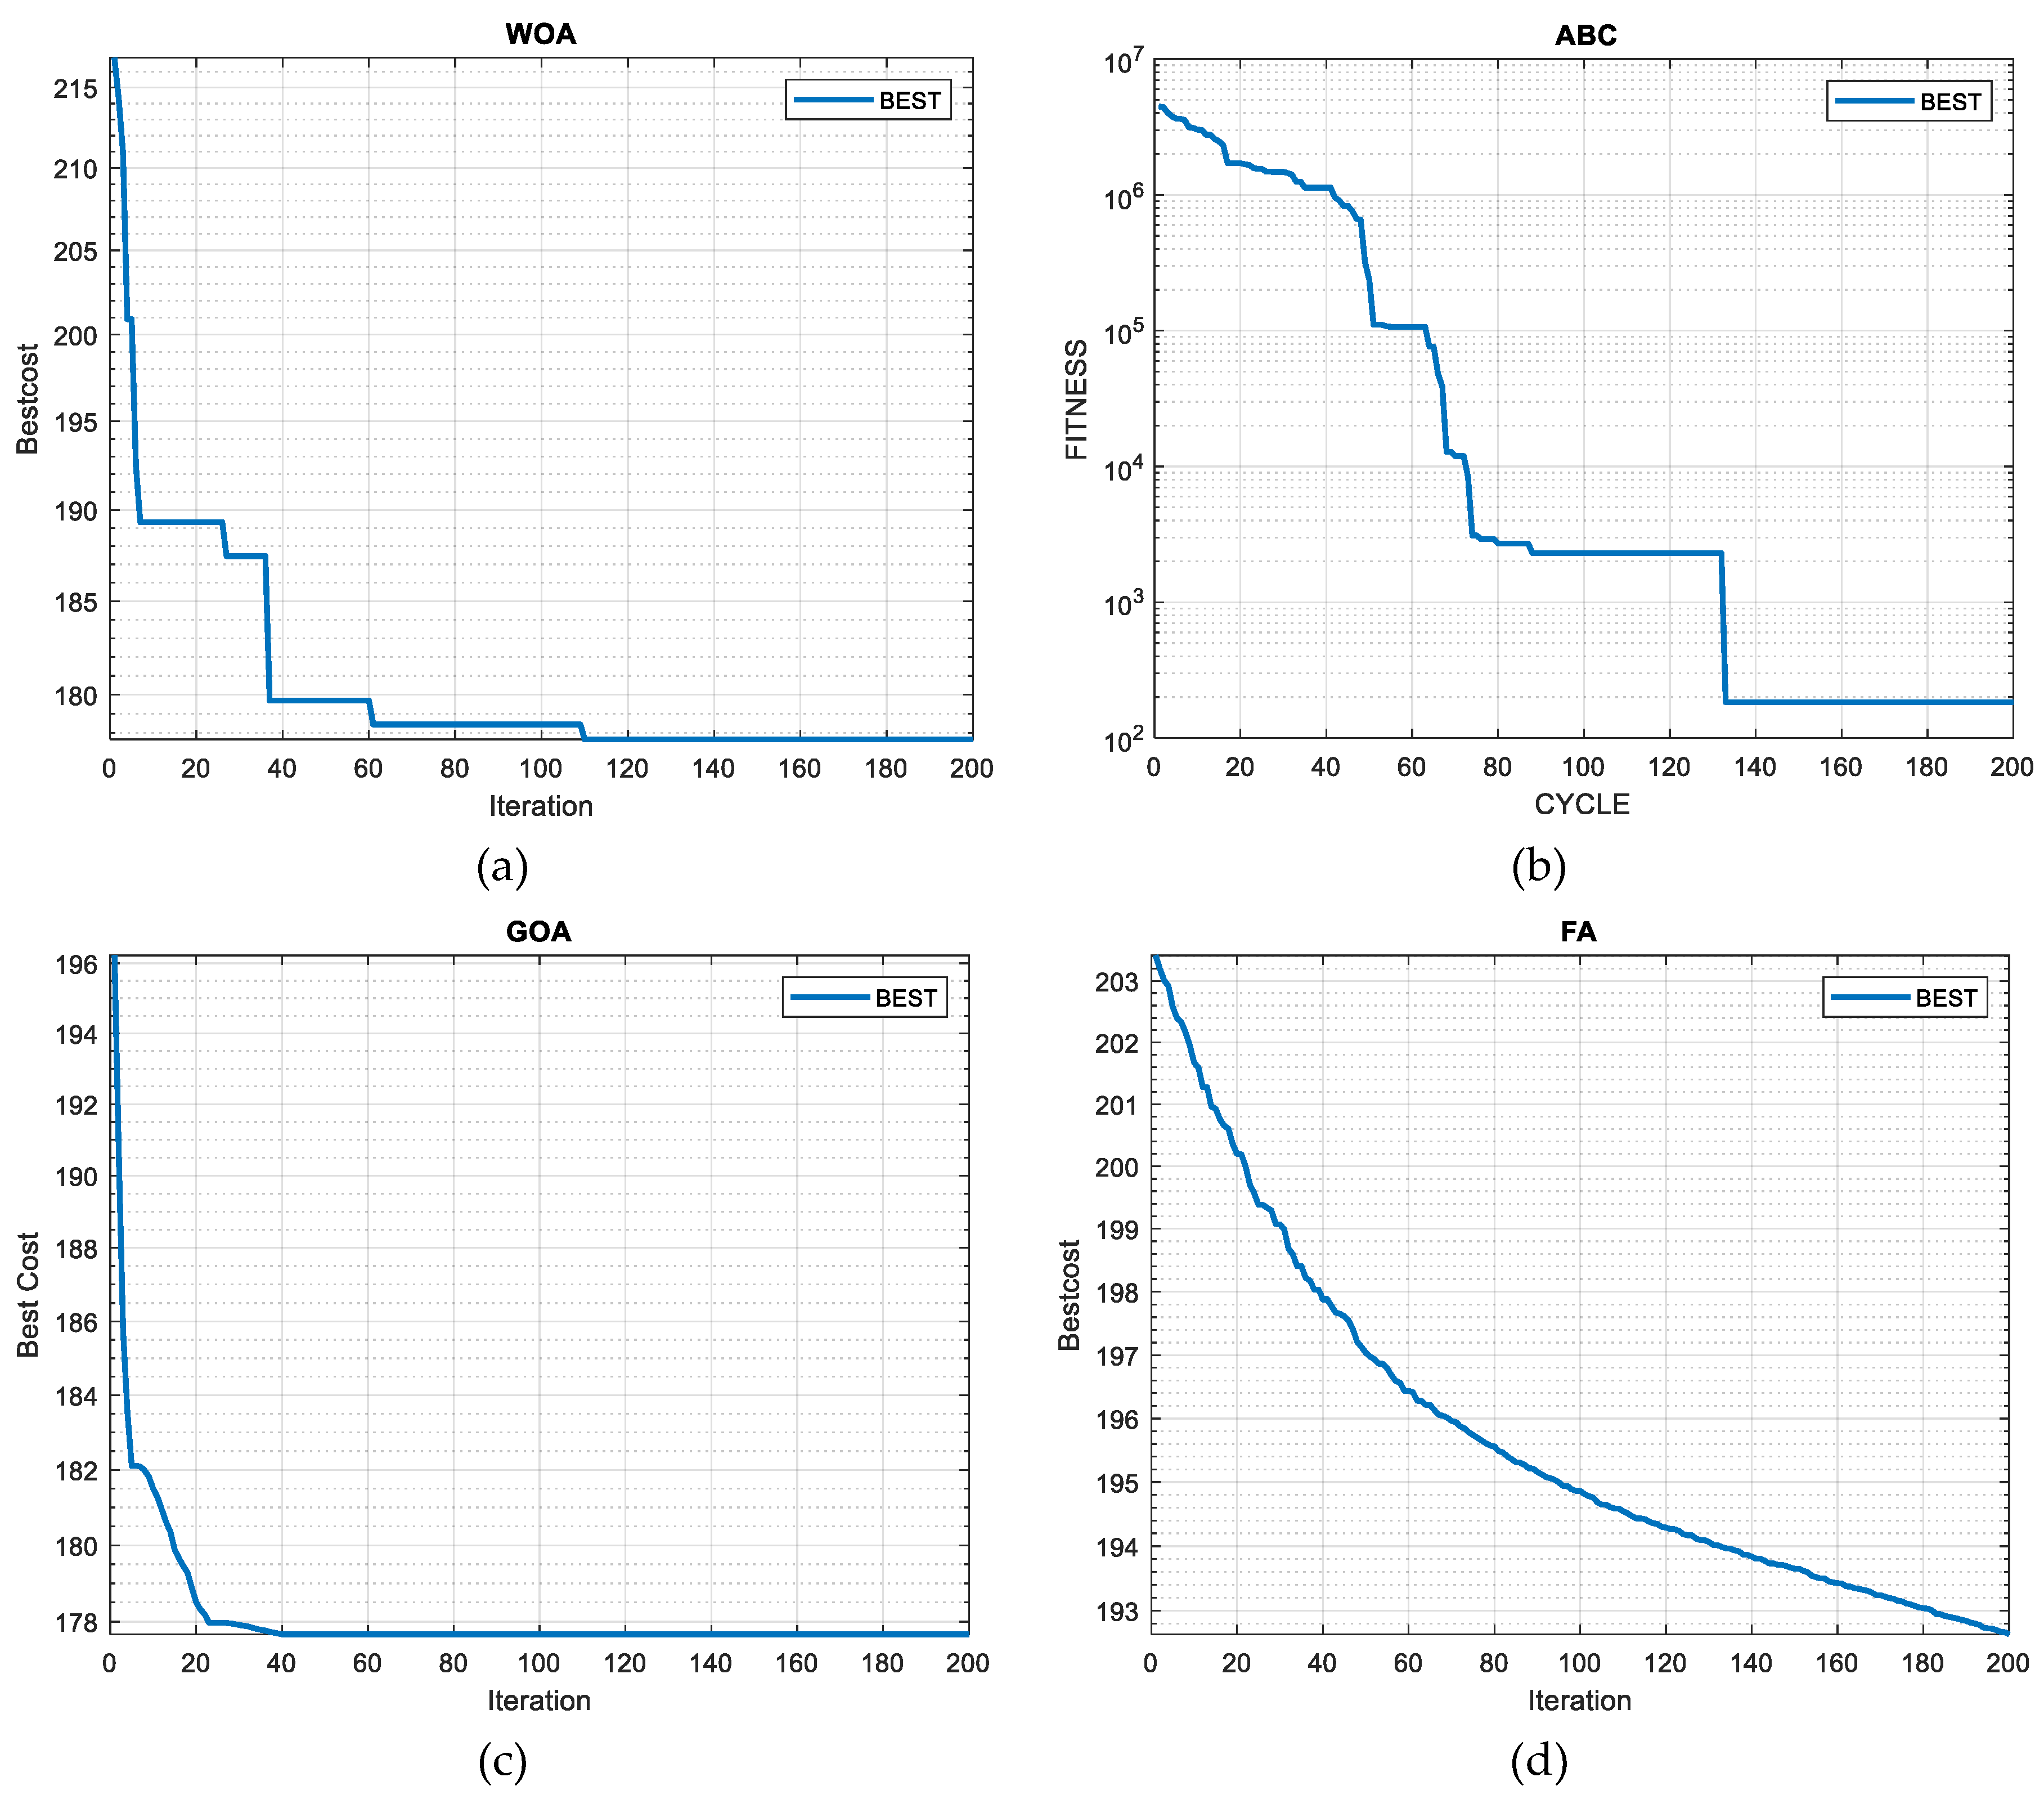
Figure 15.
Forth configuration with dimensions(a) and closer view(b).
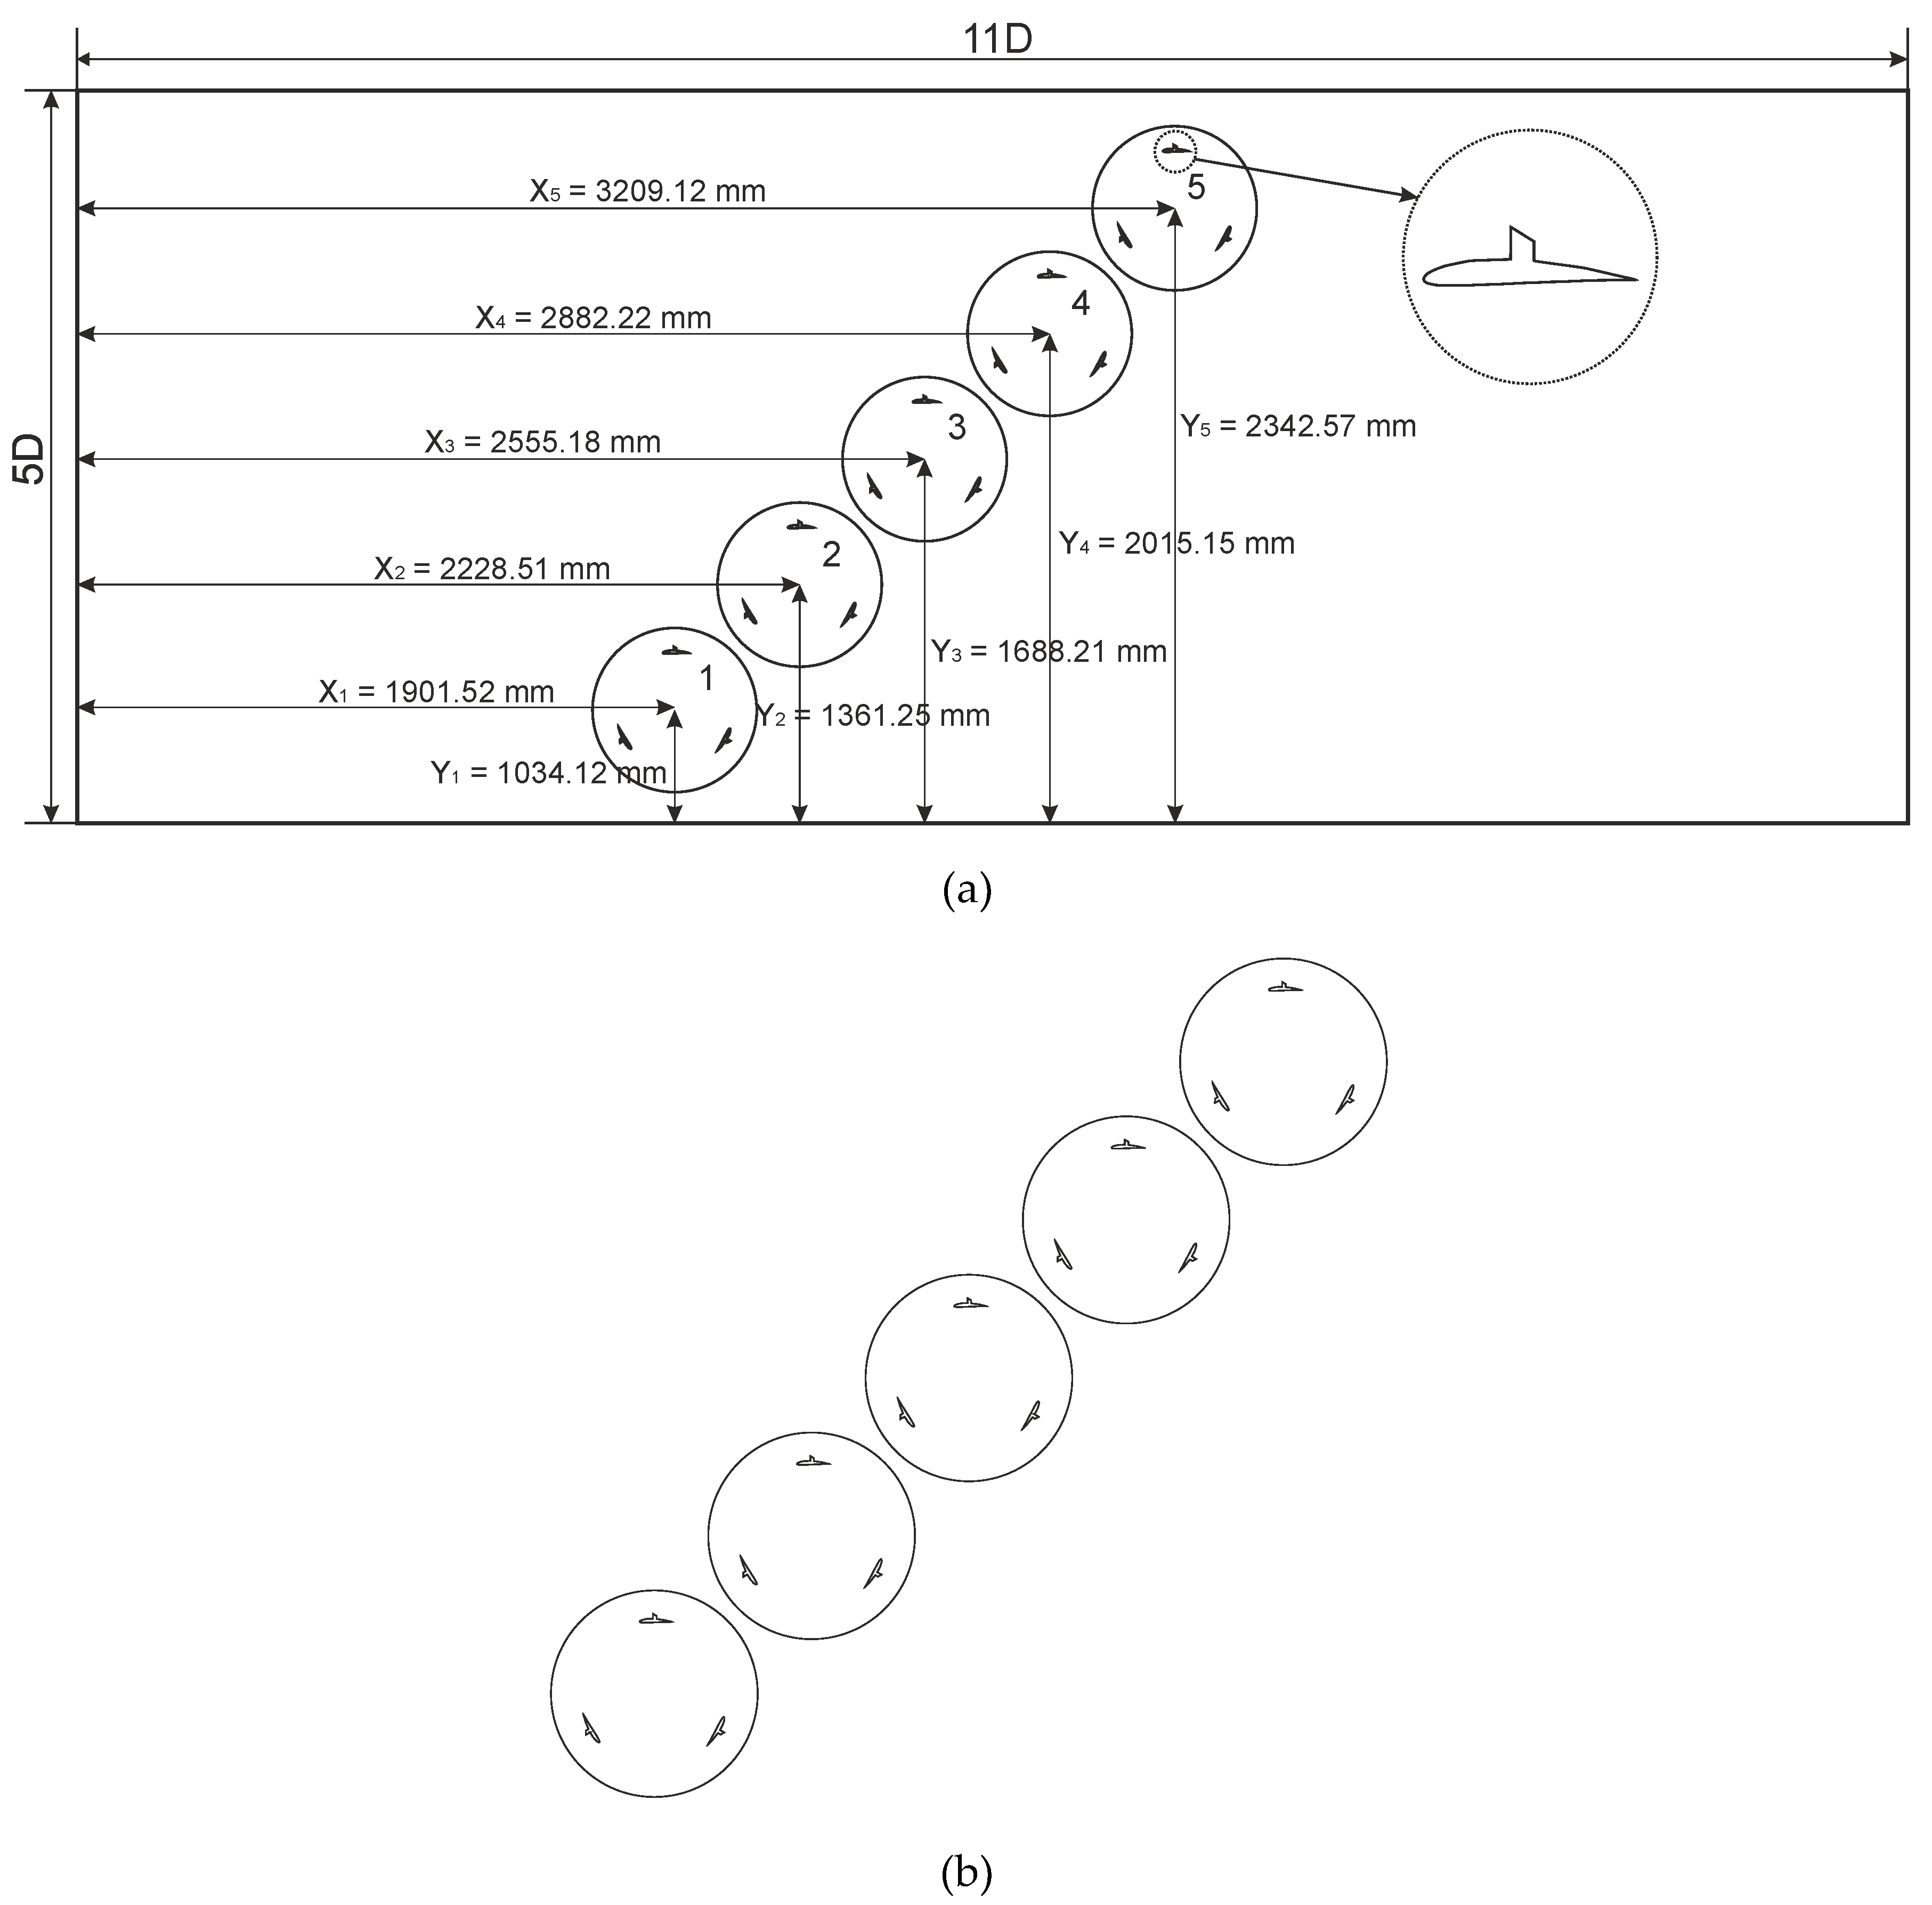
Figure 16.
oblique configuration meshing.
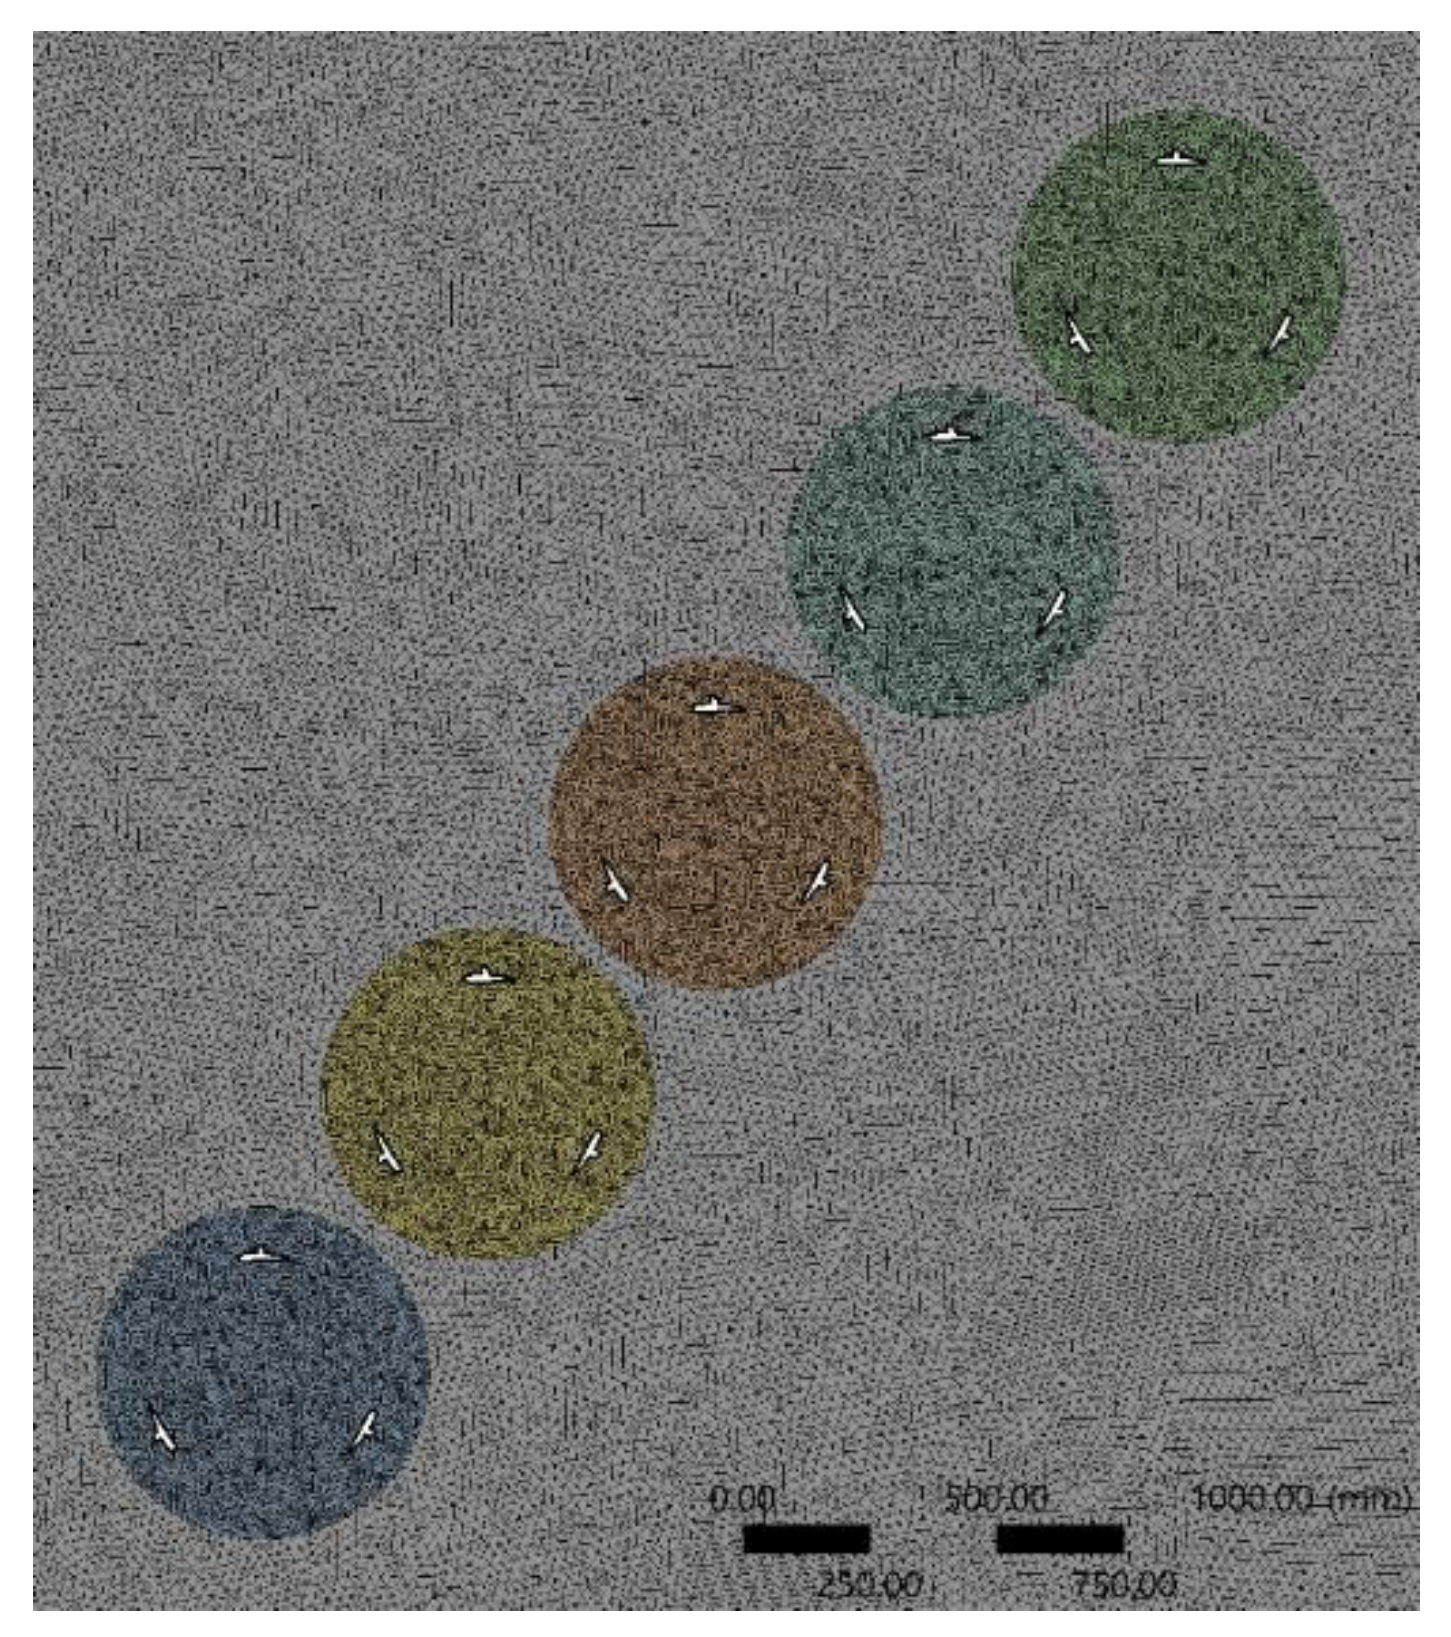
Figure 17.
CFD results relate to the fourth configuration, which includes (a) static pressure, (b) Eddy viscosity,(c) velocity, and (d) turbulence kinetic energy of turbines.
Figure 17.
CFD results relate to the fourth configuration, which includes (a) static pressure, (b) Eddy viscosity,(c) velocity, and (d) turbulence kinetic energy of turbines.
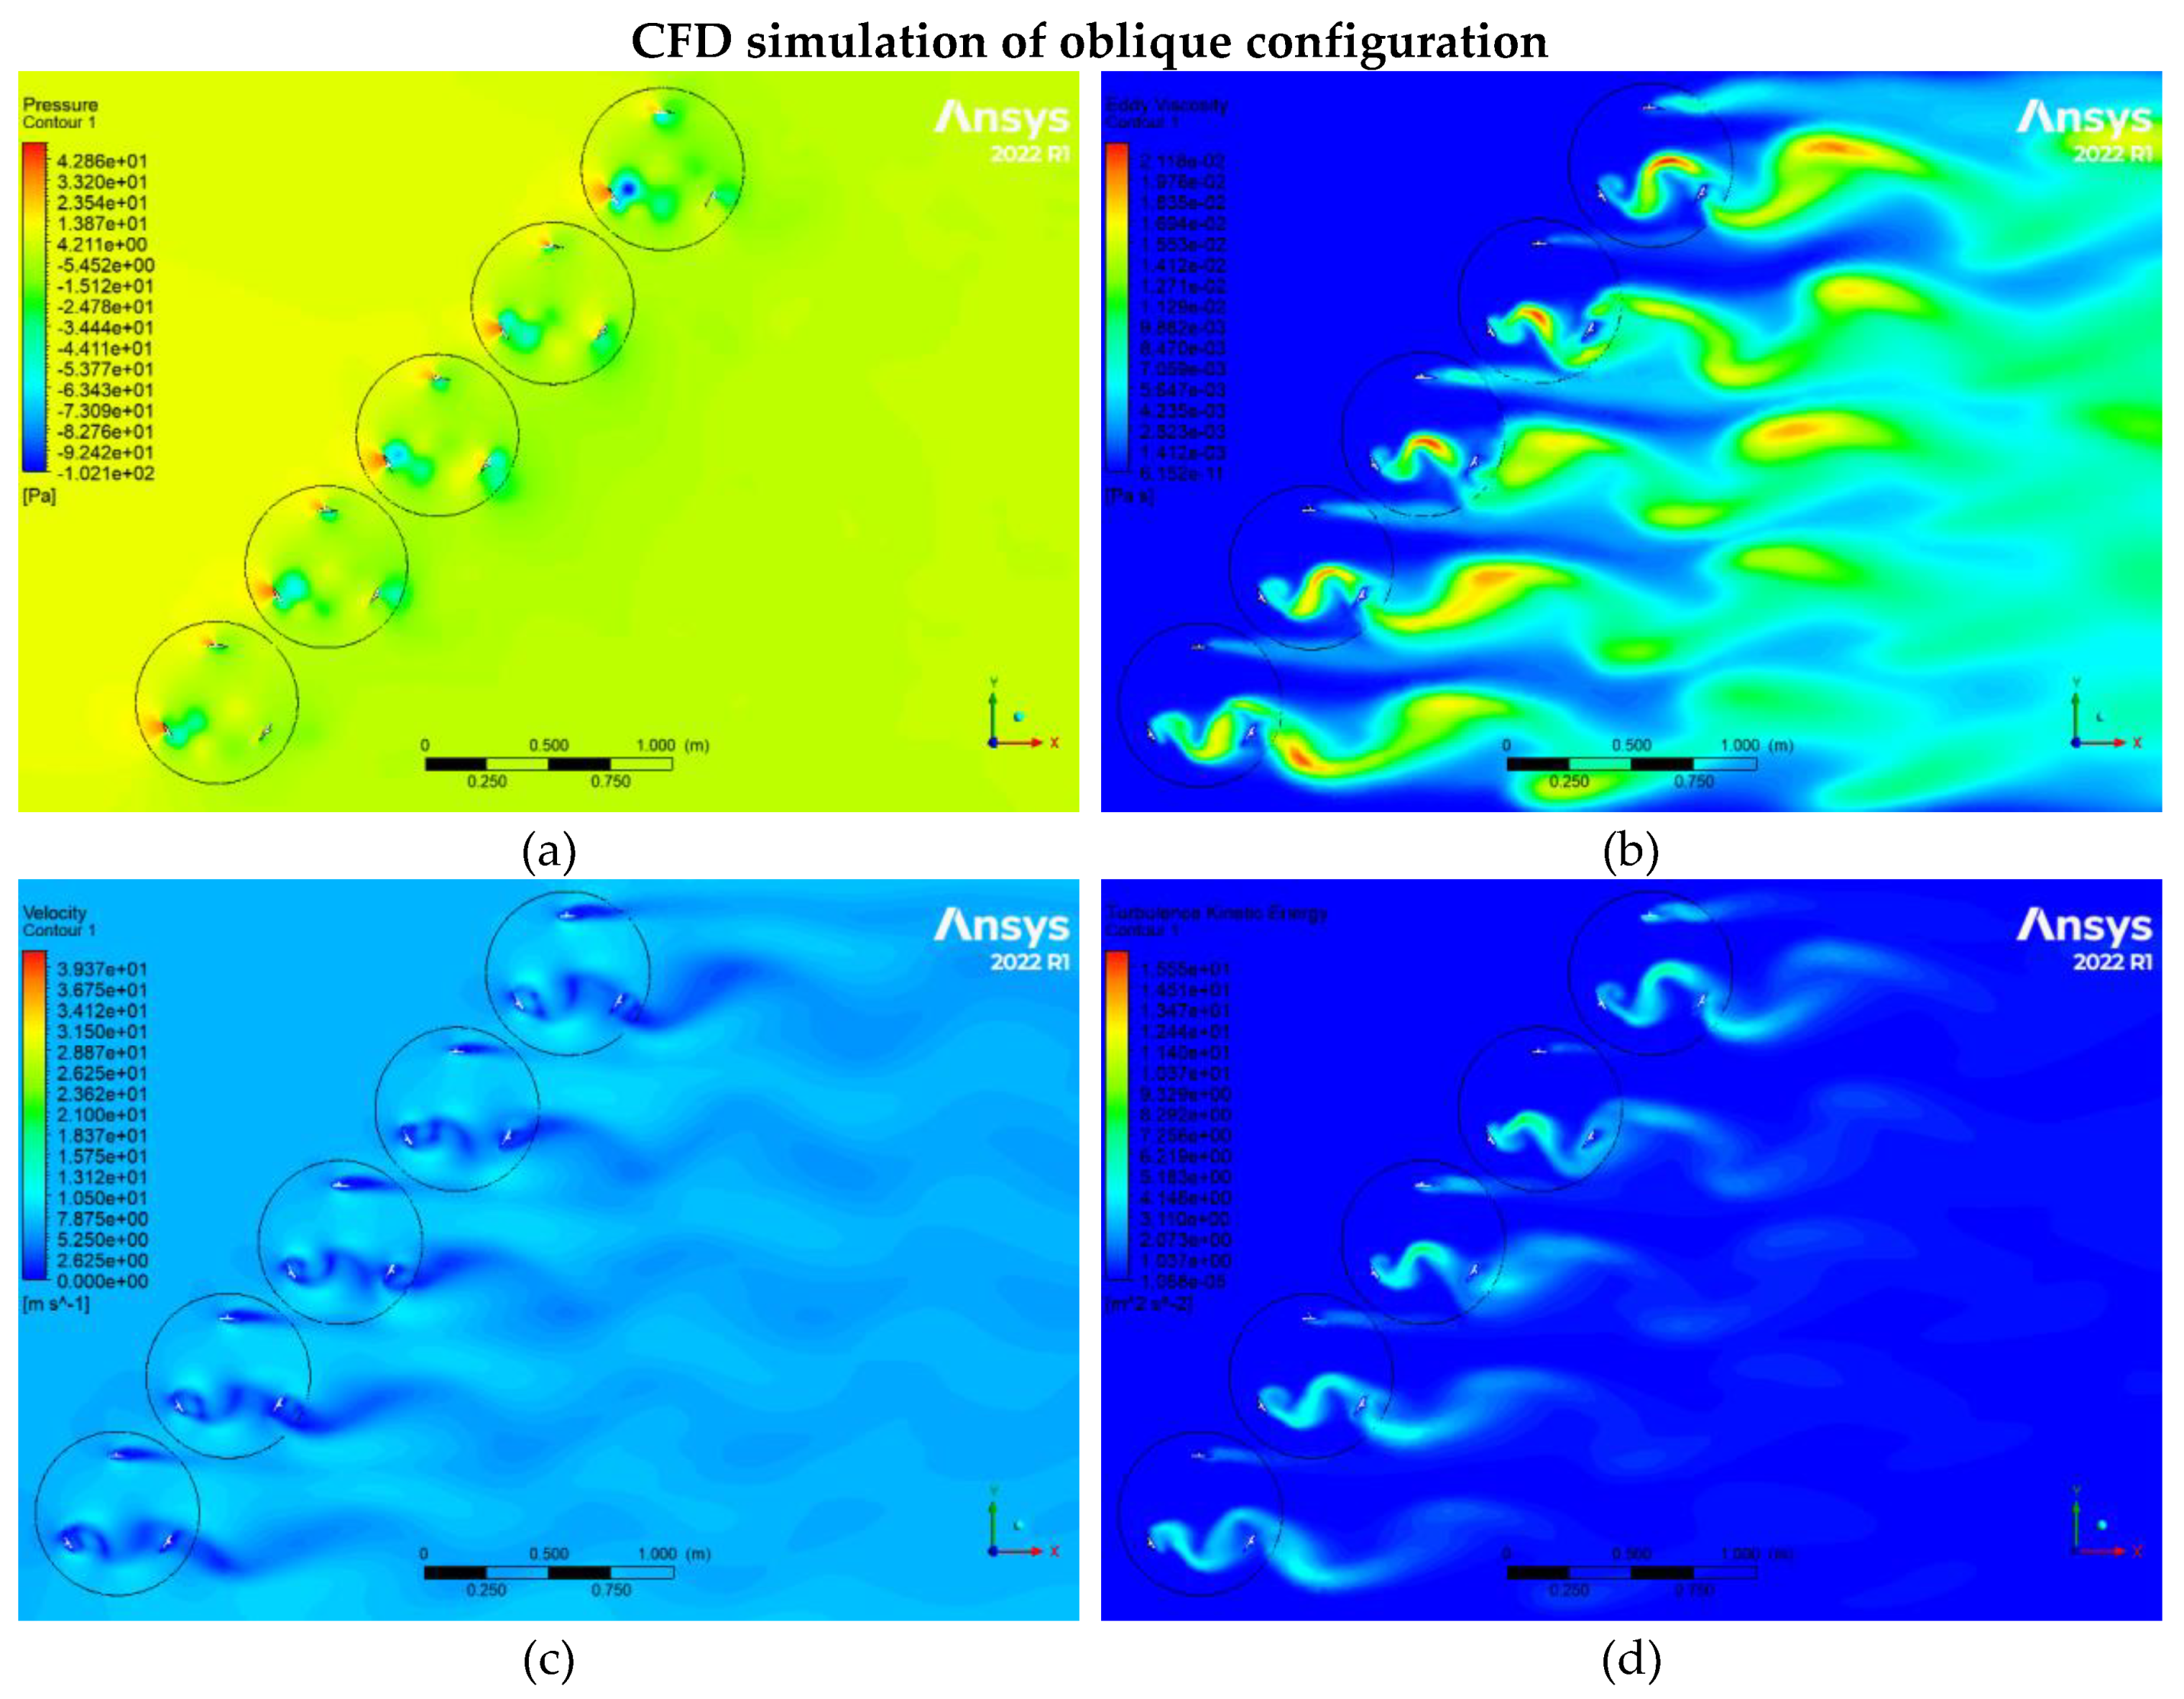
Figure 18.
(a) Moment coefficients and (b)Volume-weighted average of vorticity magnitude produced by each blade of VG-turbine at a wind speed of 7 m/s.
Figure 18.
(a) Moment coefficients and (b)Volume-weighted average of vorticity magnitude produced by each blade of VG-turbine at a wind speed of 7 m/s.
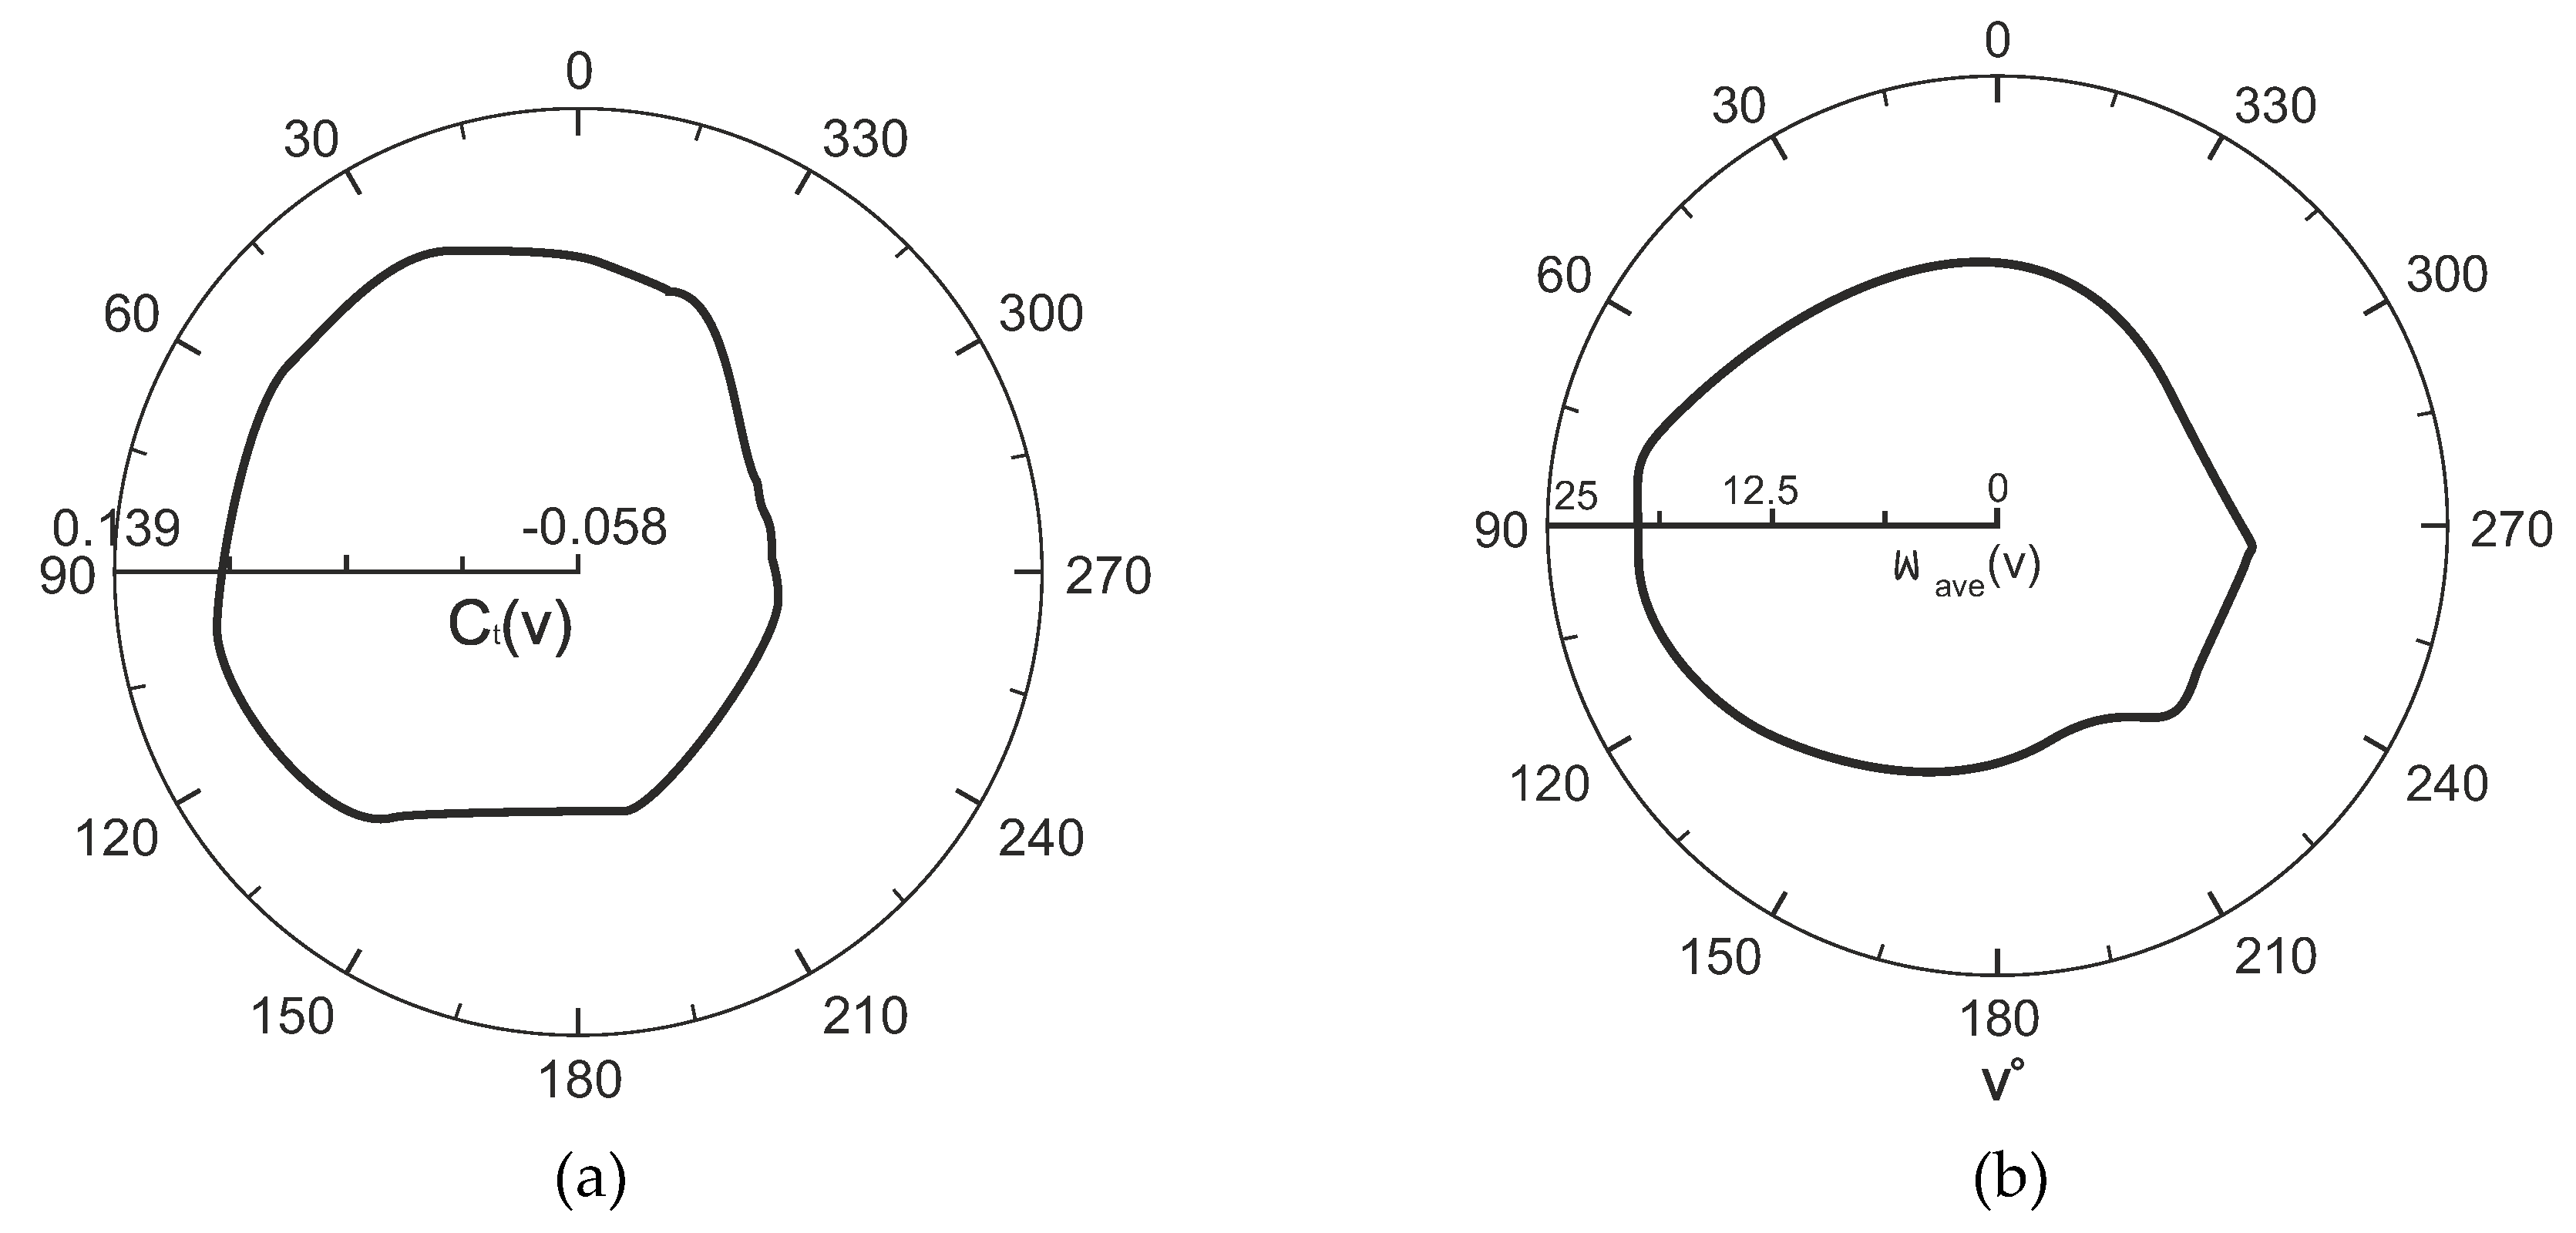
Figure 19.
Contrast in mean values for the overall power coefficient derived from experimental data [16] and the current three-dimensional outcomes.
Figure 19.
Contrast in mean values for the overall power coefficient derived from experimental data [16] and the current three-dimensional outcomes.
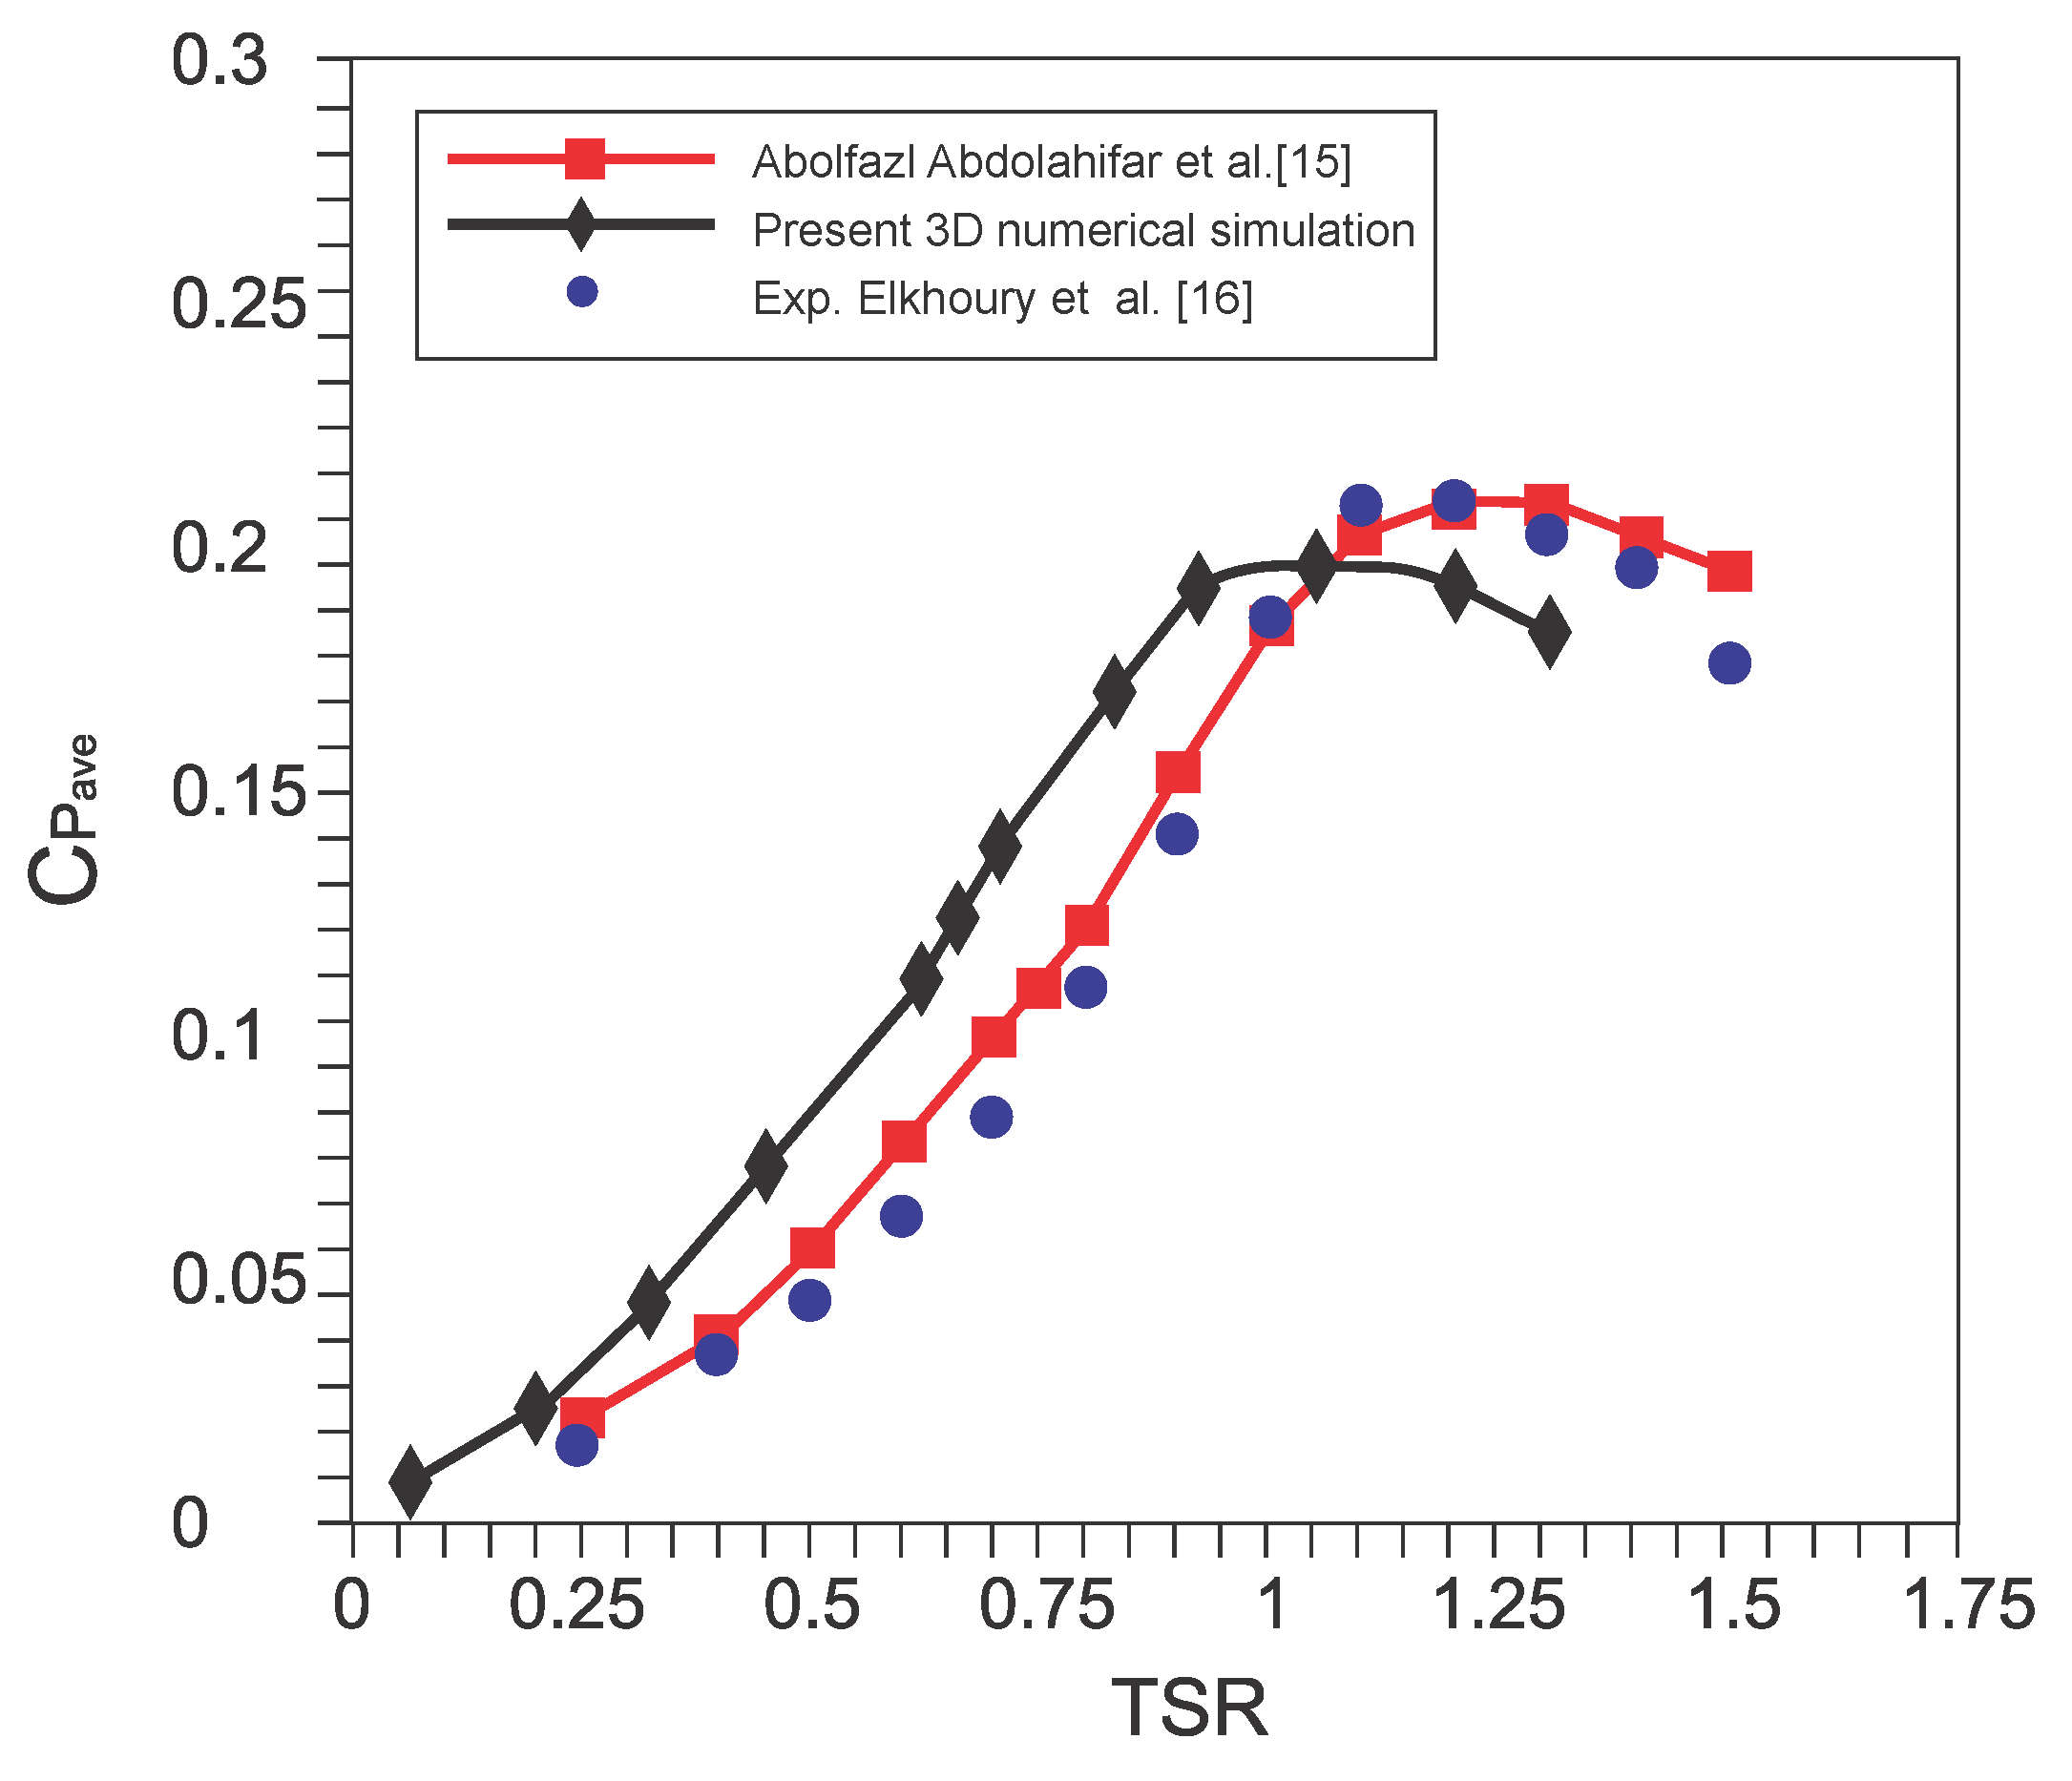
Figure 20.
(a) Difference between mean values of the total power coefficient from experimental data and contemporary three-dimensional results, as well as the relationship between solidity and Tip Speed Ratio (TSR).
Figure 20.
(a) Difference between mean values of the total power coefficient from experimental data and contemporary three-dimensional results, as well as the relationship between solidity and Tip Speed Ratio (TSR).
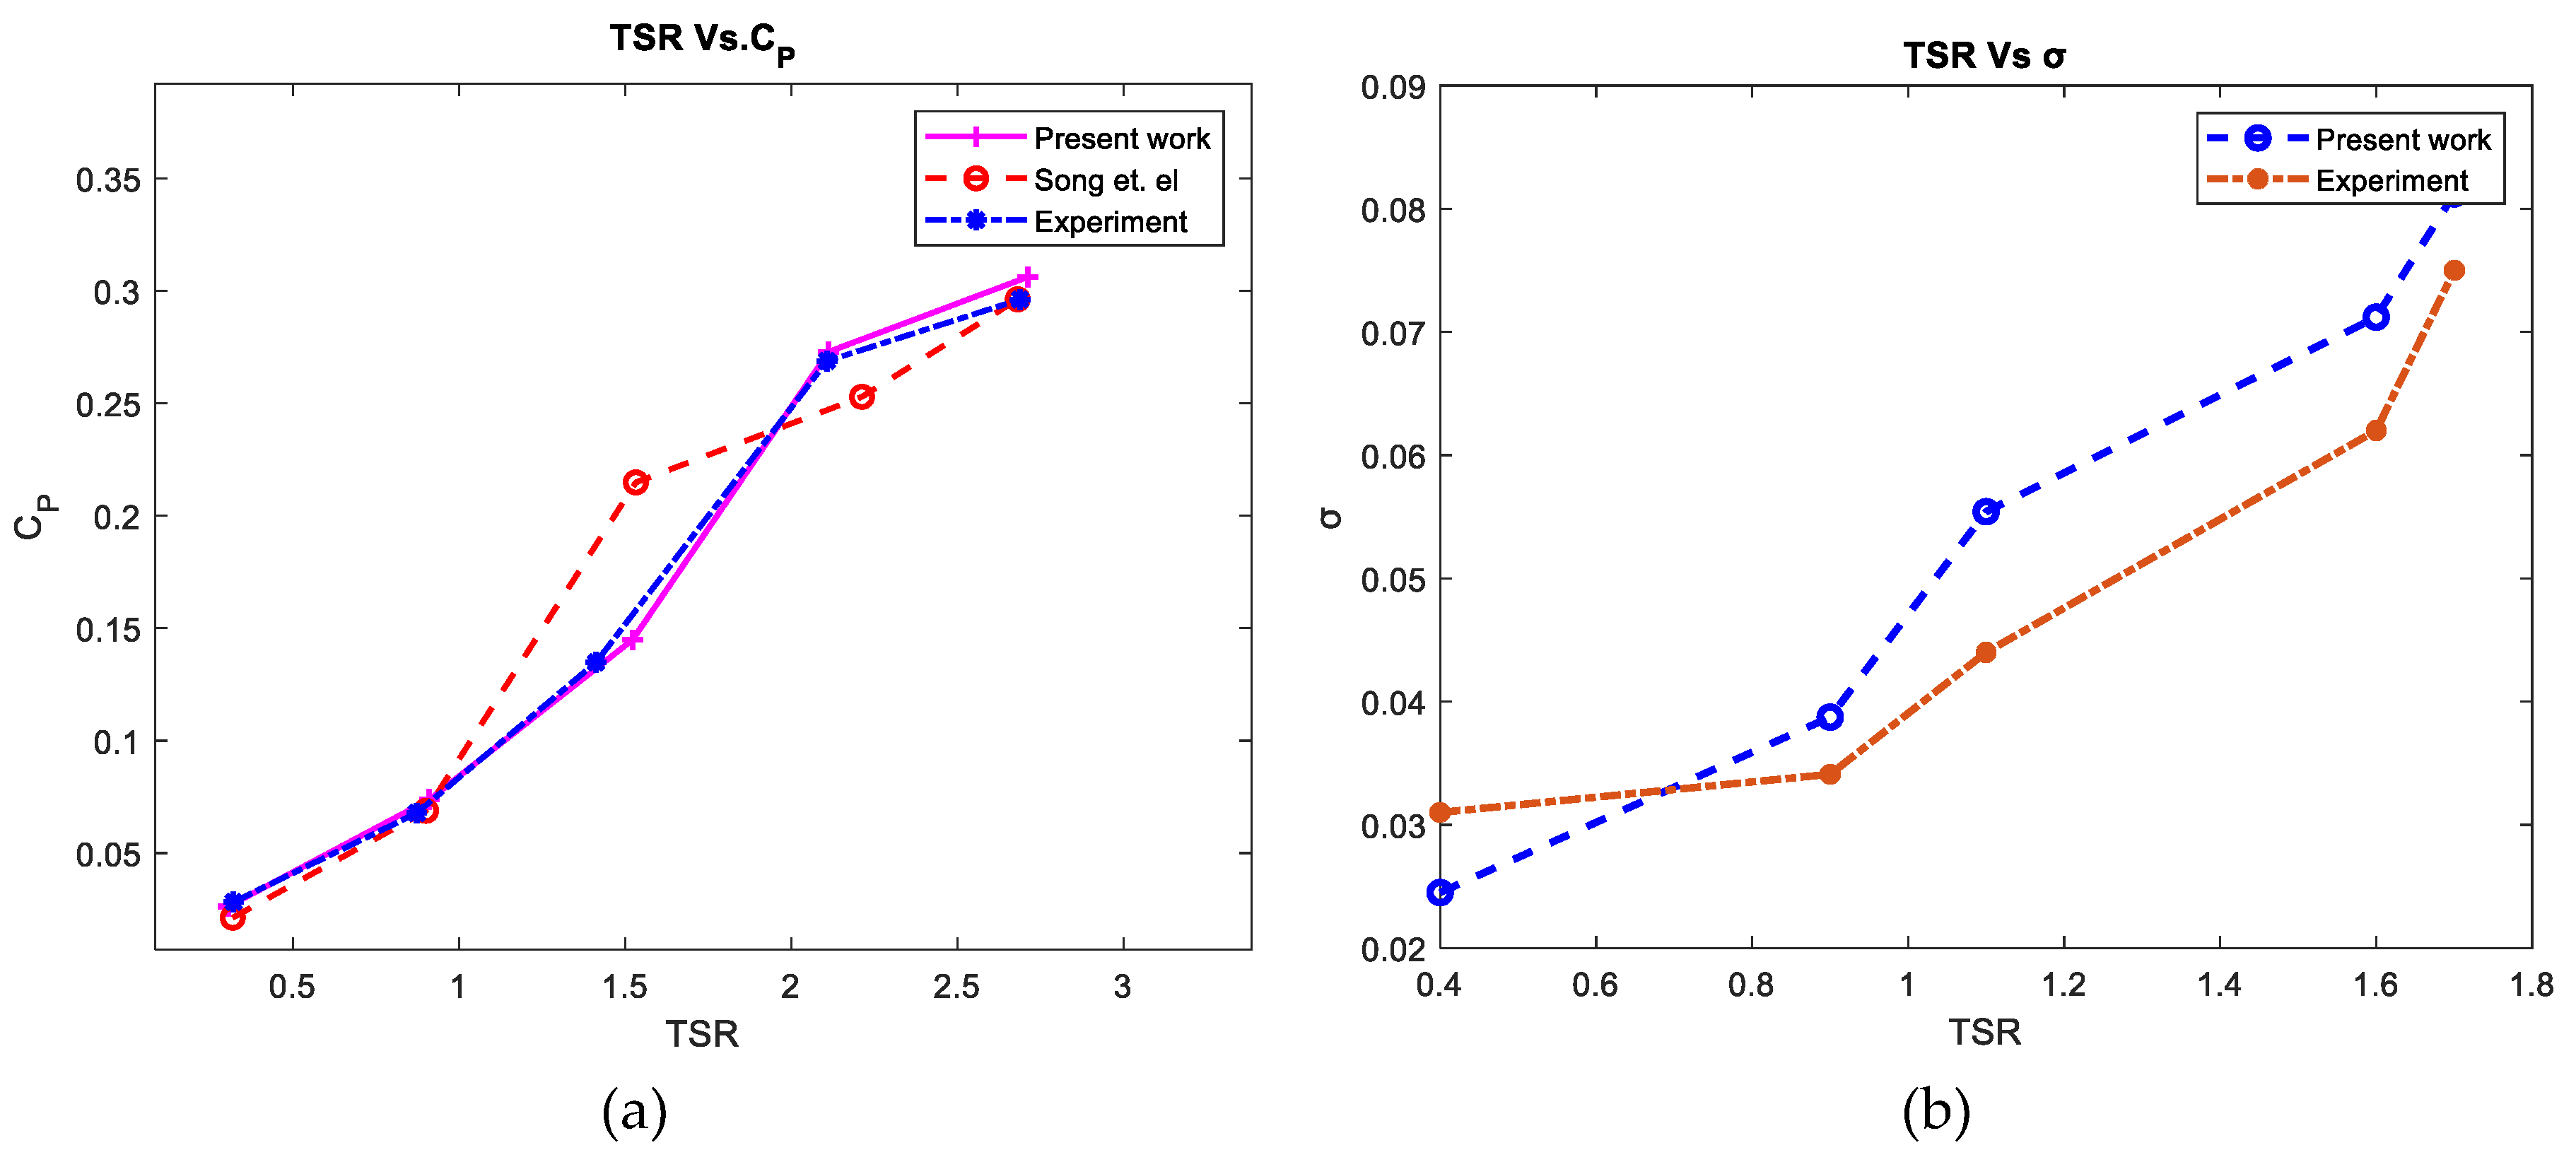

Table 1.
VAWT with vortex generator specifications.
| No. | Description | Value |
|---|---|---|
| 1 | Turbine Diameter D (mm) | 655 |
| 2 | Blade length (mm) | 106 |
| 3 | Twist angle [degree] | 60 |
| 4 | Number of turbine blades | 3 |
| 5 | Airfoil name | NACA 4412[13] |
Table 2.
geometry coordinates of each turbine in different configurations.
| Config. No. | |||||||||||
|---|---|---|---|---|---|---|---|---|---|---|---|
| 1 | 1894.32 | 1027.04 | 1894.32 | 1997.14 | 2403.71 | 1486.87 | 2881 | 1997.14 | 2881 | 1027.04 | 104 |
| 2 | 1562.1 | 1551 | 2053 | 1065 | 2053 | 2028 | 2621 | 2478 | 2621 | 665 | 146.8 |
| 3 | 1728.1 | 2585 | 1728.1 | 1874 | 1728.1 | 1152.2 | 2471 | 1152.2 | 3182 | 1152.2 | 109.2 |
| 4 | 2329 | 982 | 2624 | 1531 | 2921 | 2064 | 3688 | 2597 | 4132 | 3141 | 164.2 |
| 5 | 1767 | 2625 | 1767 | 1818 | 1767 | 1014 | 2596 | 1803 | 3198 | 2609 | 120.1 |
Table 3.
Results of optimized output power.
| Optimizers | Result | Enhancement percent |
|---|---|---|
| ABC | 184.1 | 11.98% |
| WOA | 181.6 | 10.46% |
| GOA | 179.4 | 9.11% |
| FA | 183.1 | 11.37% |
Table 4.
optimized distance from ABC optimizer.
| Optimizer | |||||||||||
|---|---|---|---|---|---|---|---|---|---|---|---|
| ABC | 1901.52 | 1034.12 | 2228.51 | 1361.25 | 2555.18 | 1688.21 | 2775.2 | 2882.22 | 3209.12 | 2342.57 | 184.1 |
Table 5.
output power result compares to Meta-heuristic optimizers and neural-fuzzy system.
| Meta-heuristic optimizers and neural-fuzzy result | Computational Fluid Dynamics result | Error (%) | |
|---|---|---|---|
| (watt/s) | 184.1 | 179.21 | 0.08582292 |
Disclaimer/Publisher’s Note: The statements, opinions and data contained in all publications are solely those of the individual author(s) and contributor(s) and not of MDPI and/or the editor(s). MDPI and/or the editor(s) disclaim responsibility for any injury to people or property resulting from any ideas, methods, instructions or products referred to in the content. |
© 2024 by the authors. Licensee MDPI, Basel, Switzerland. This article is an open access article distributed under the terms and conditions of the Creative Commons Attribution (CC BY) license (http://creativecommons.org/licenses/by/4.0/).
Copyright: This open access article is published under a Creative Commons CC BY 4.0 license, which permit the free download, distribution, and reuse, provided that the author and preprint are cited in any reuse.


