Preprint
Article

This version is not peer-reviewed.

Growth of Listeria monocytogenes in Goat’s Pasteurized Milk Cheese During Maturation: Its Prediction from a Milk Model Medium

A peer-reviewed article of this preprint also exists.

Submitted:

10 December 2025

Posted:

10 December 2025

You are already at the latest version

Abstract

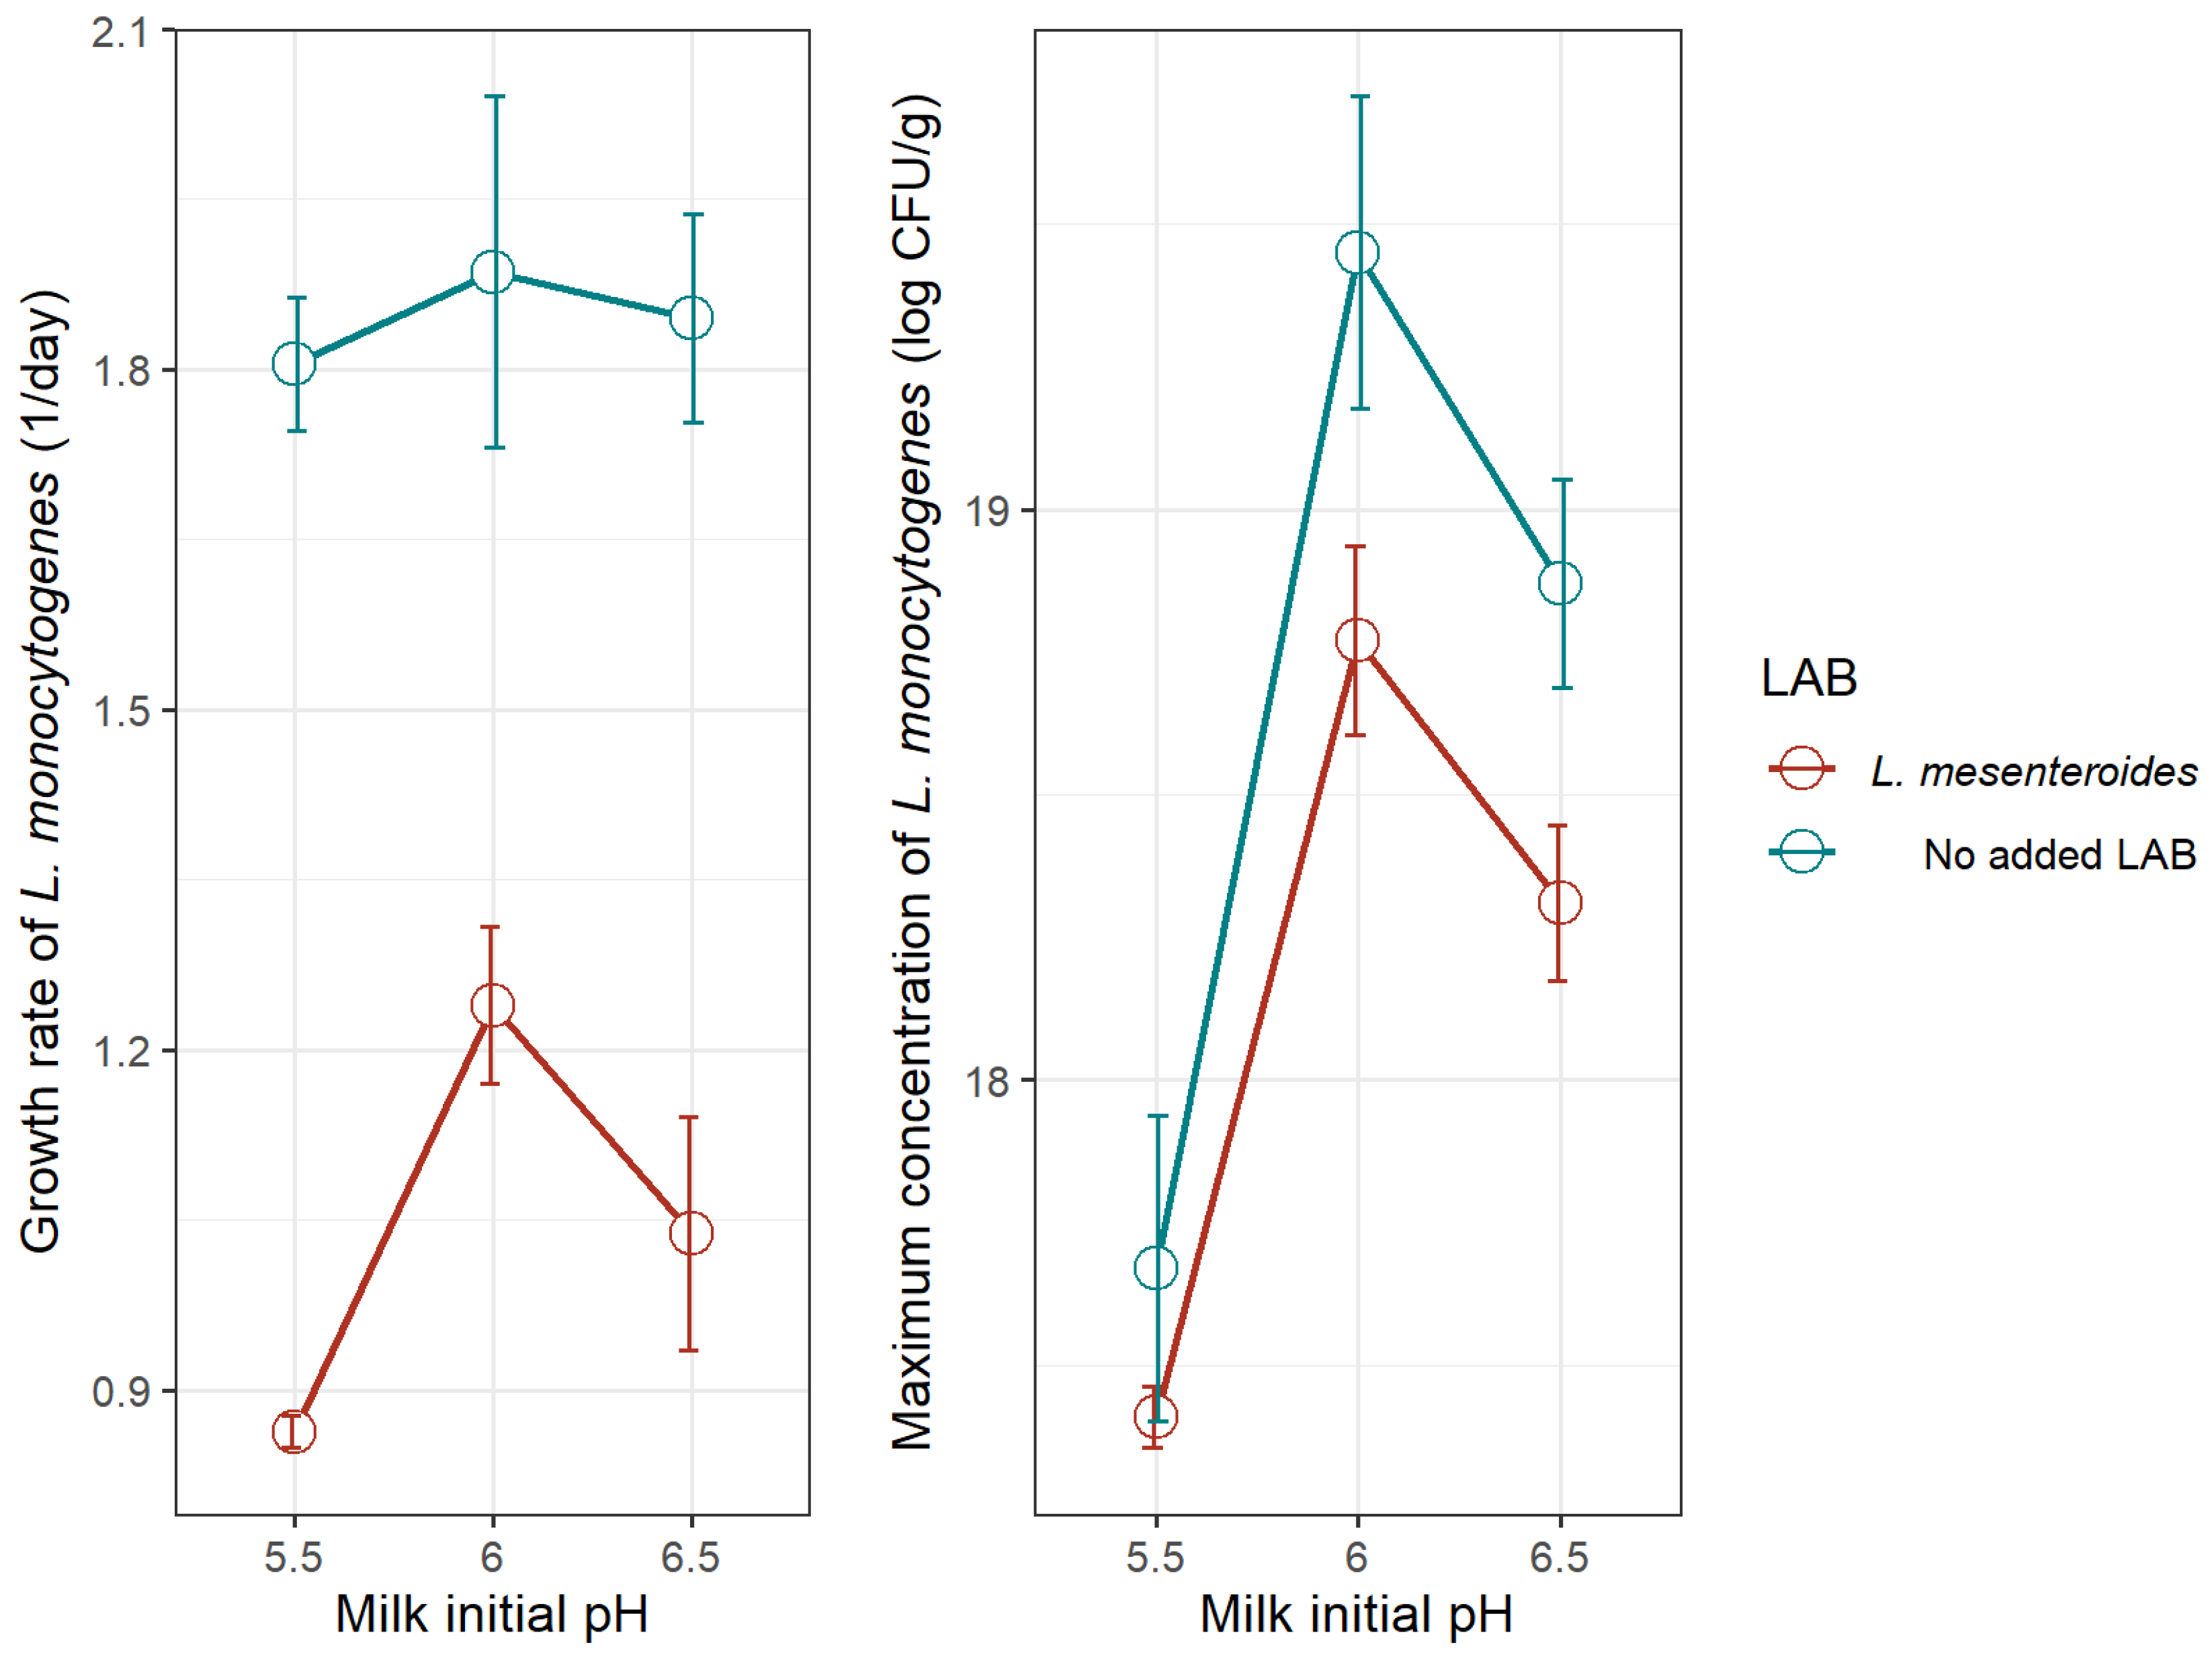
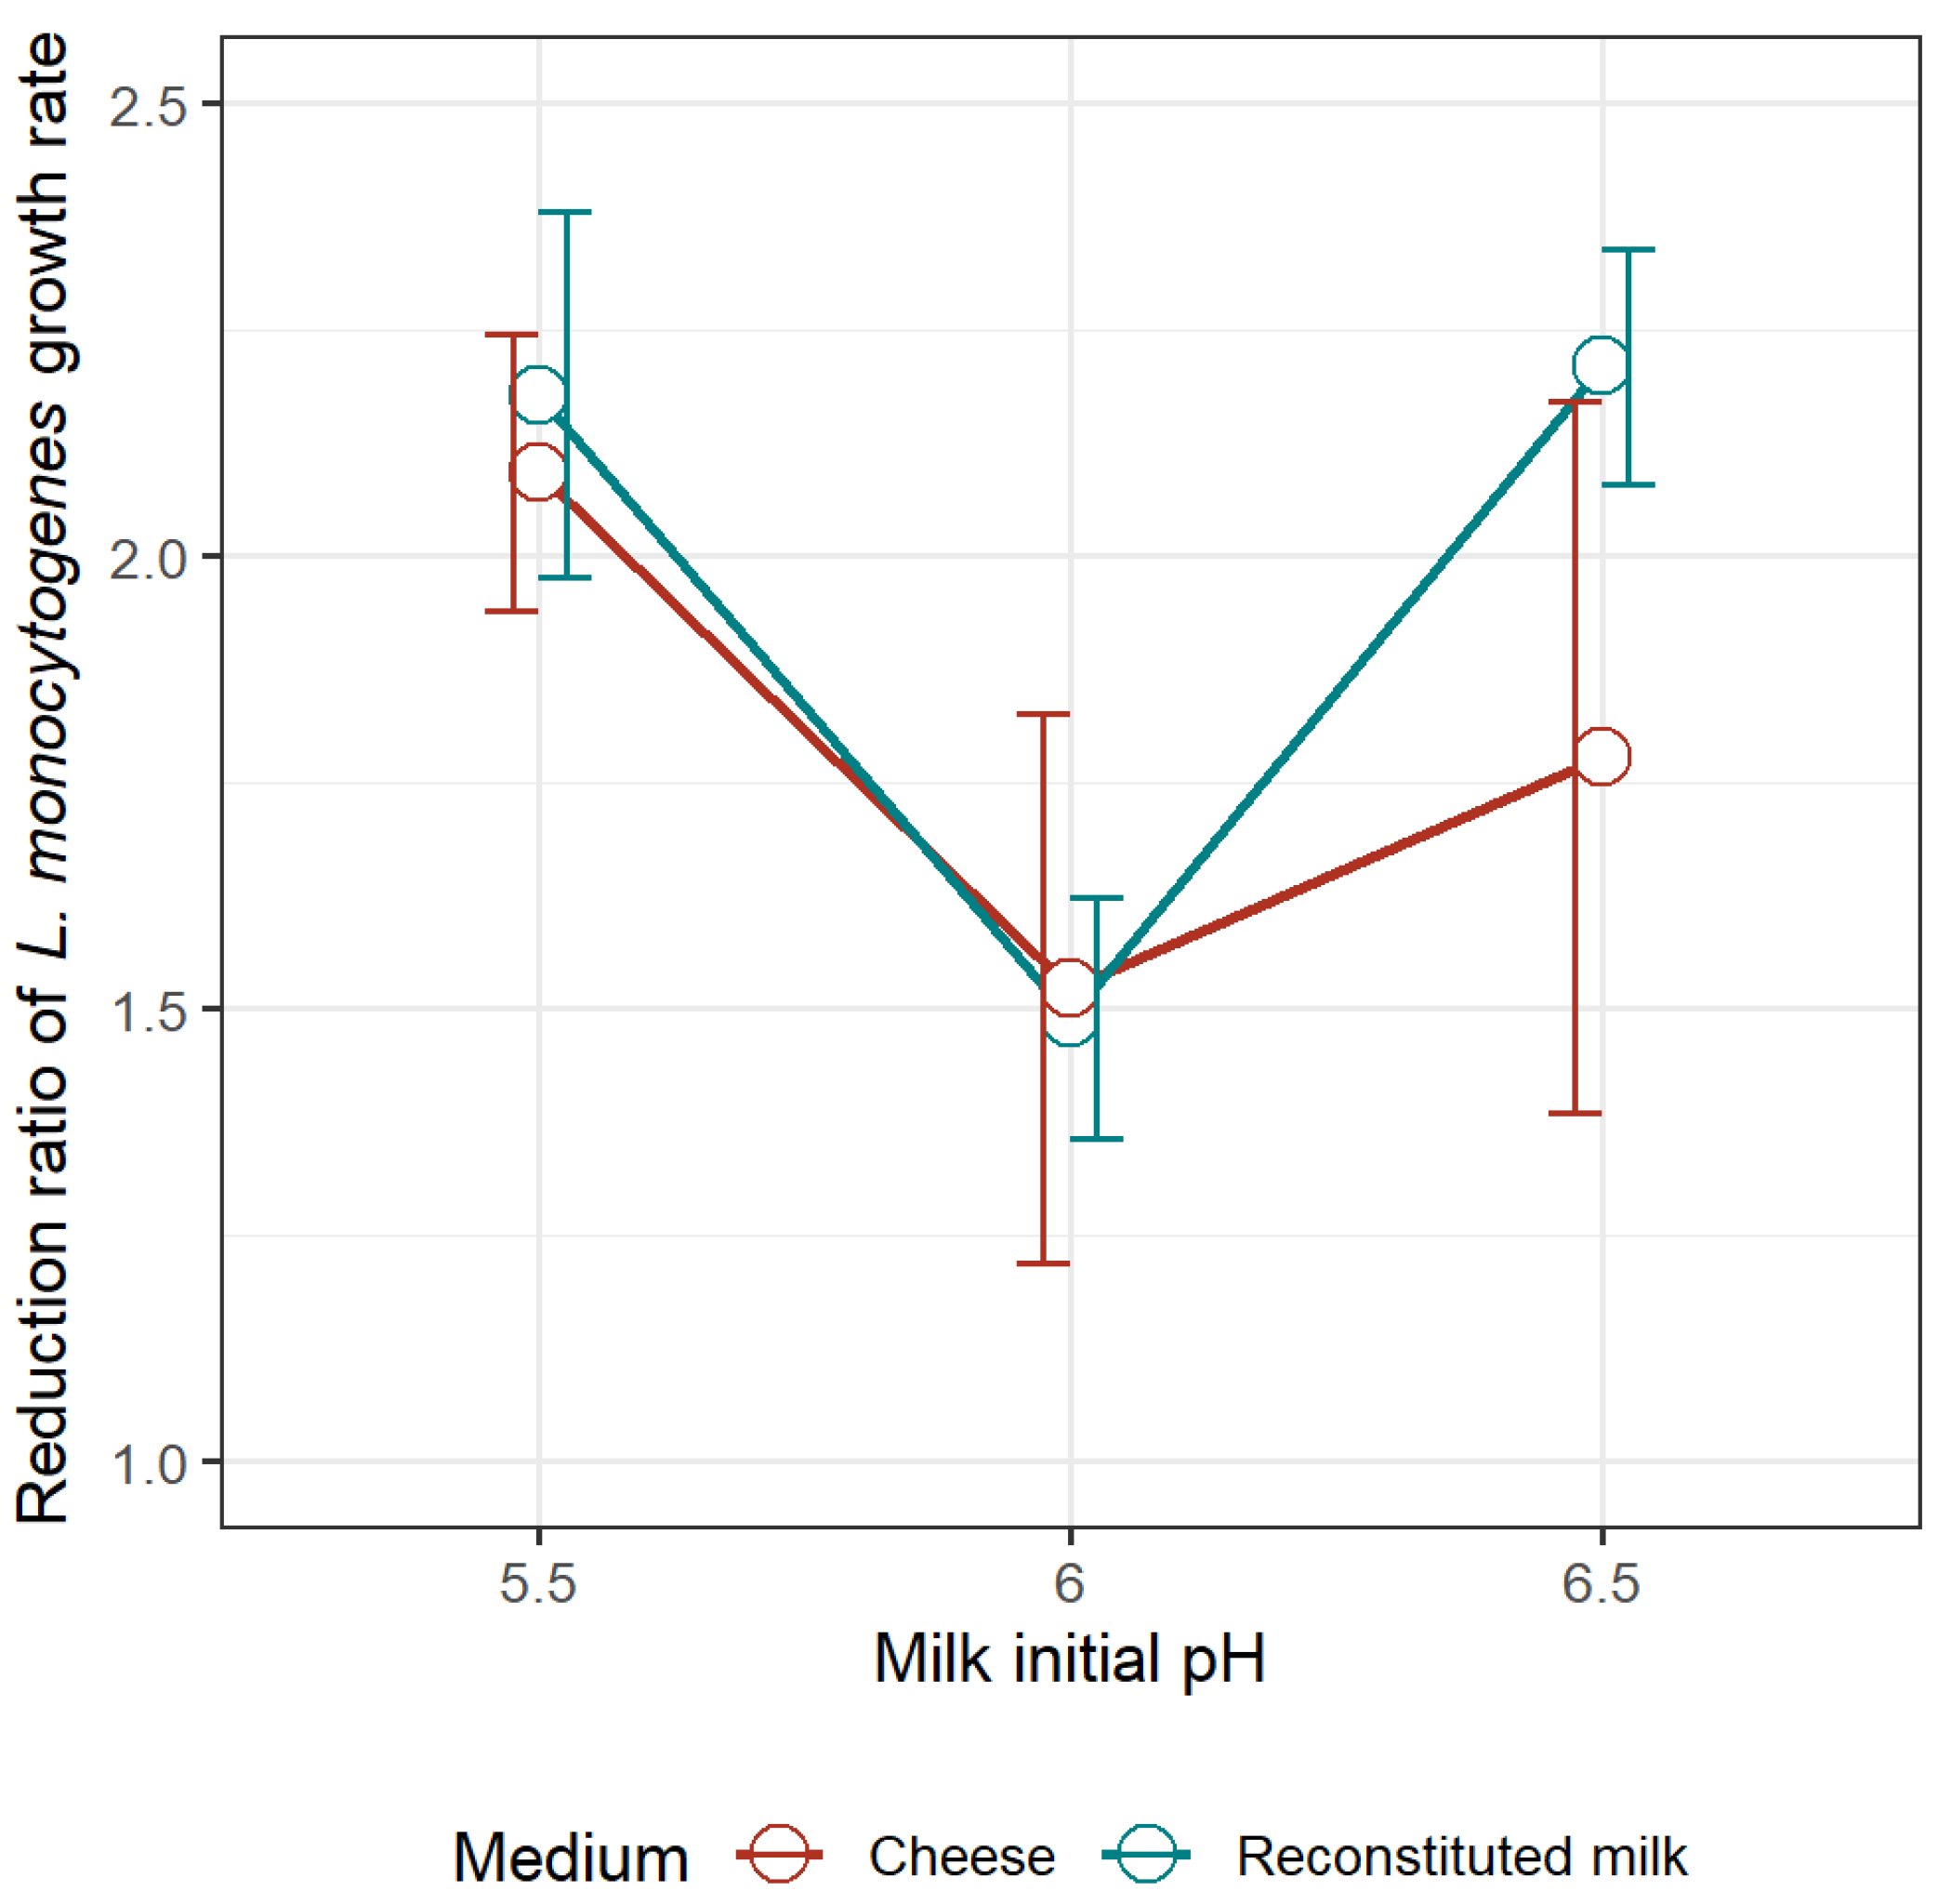
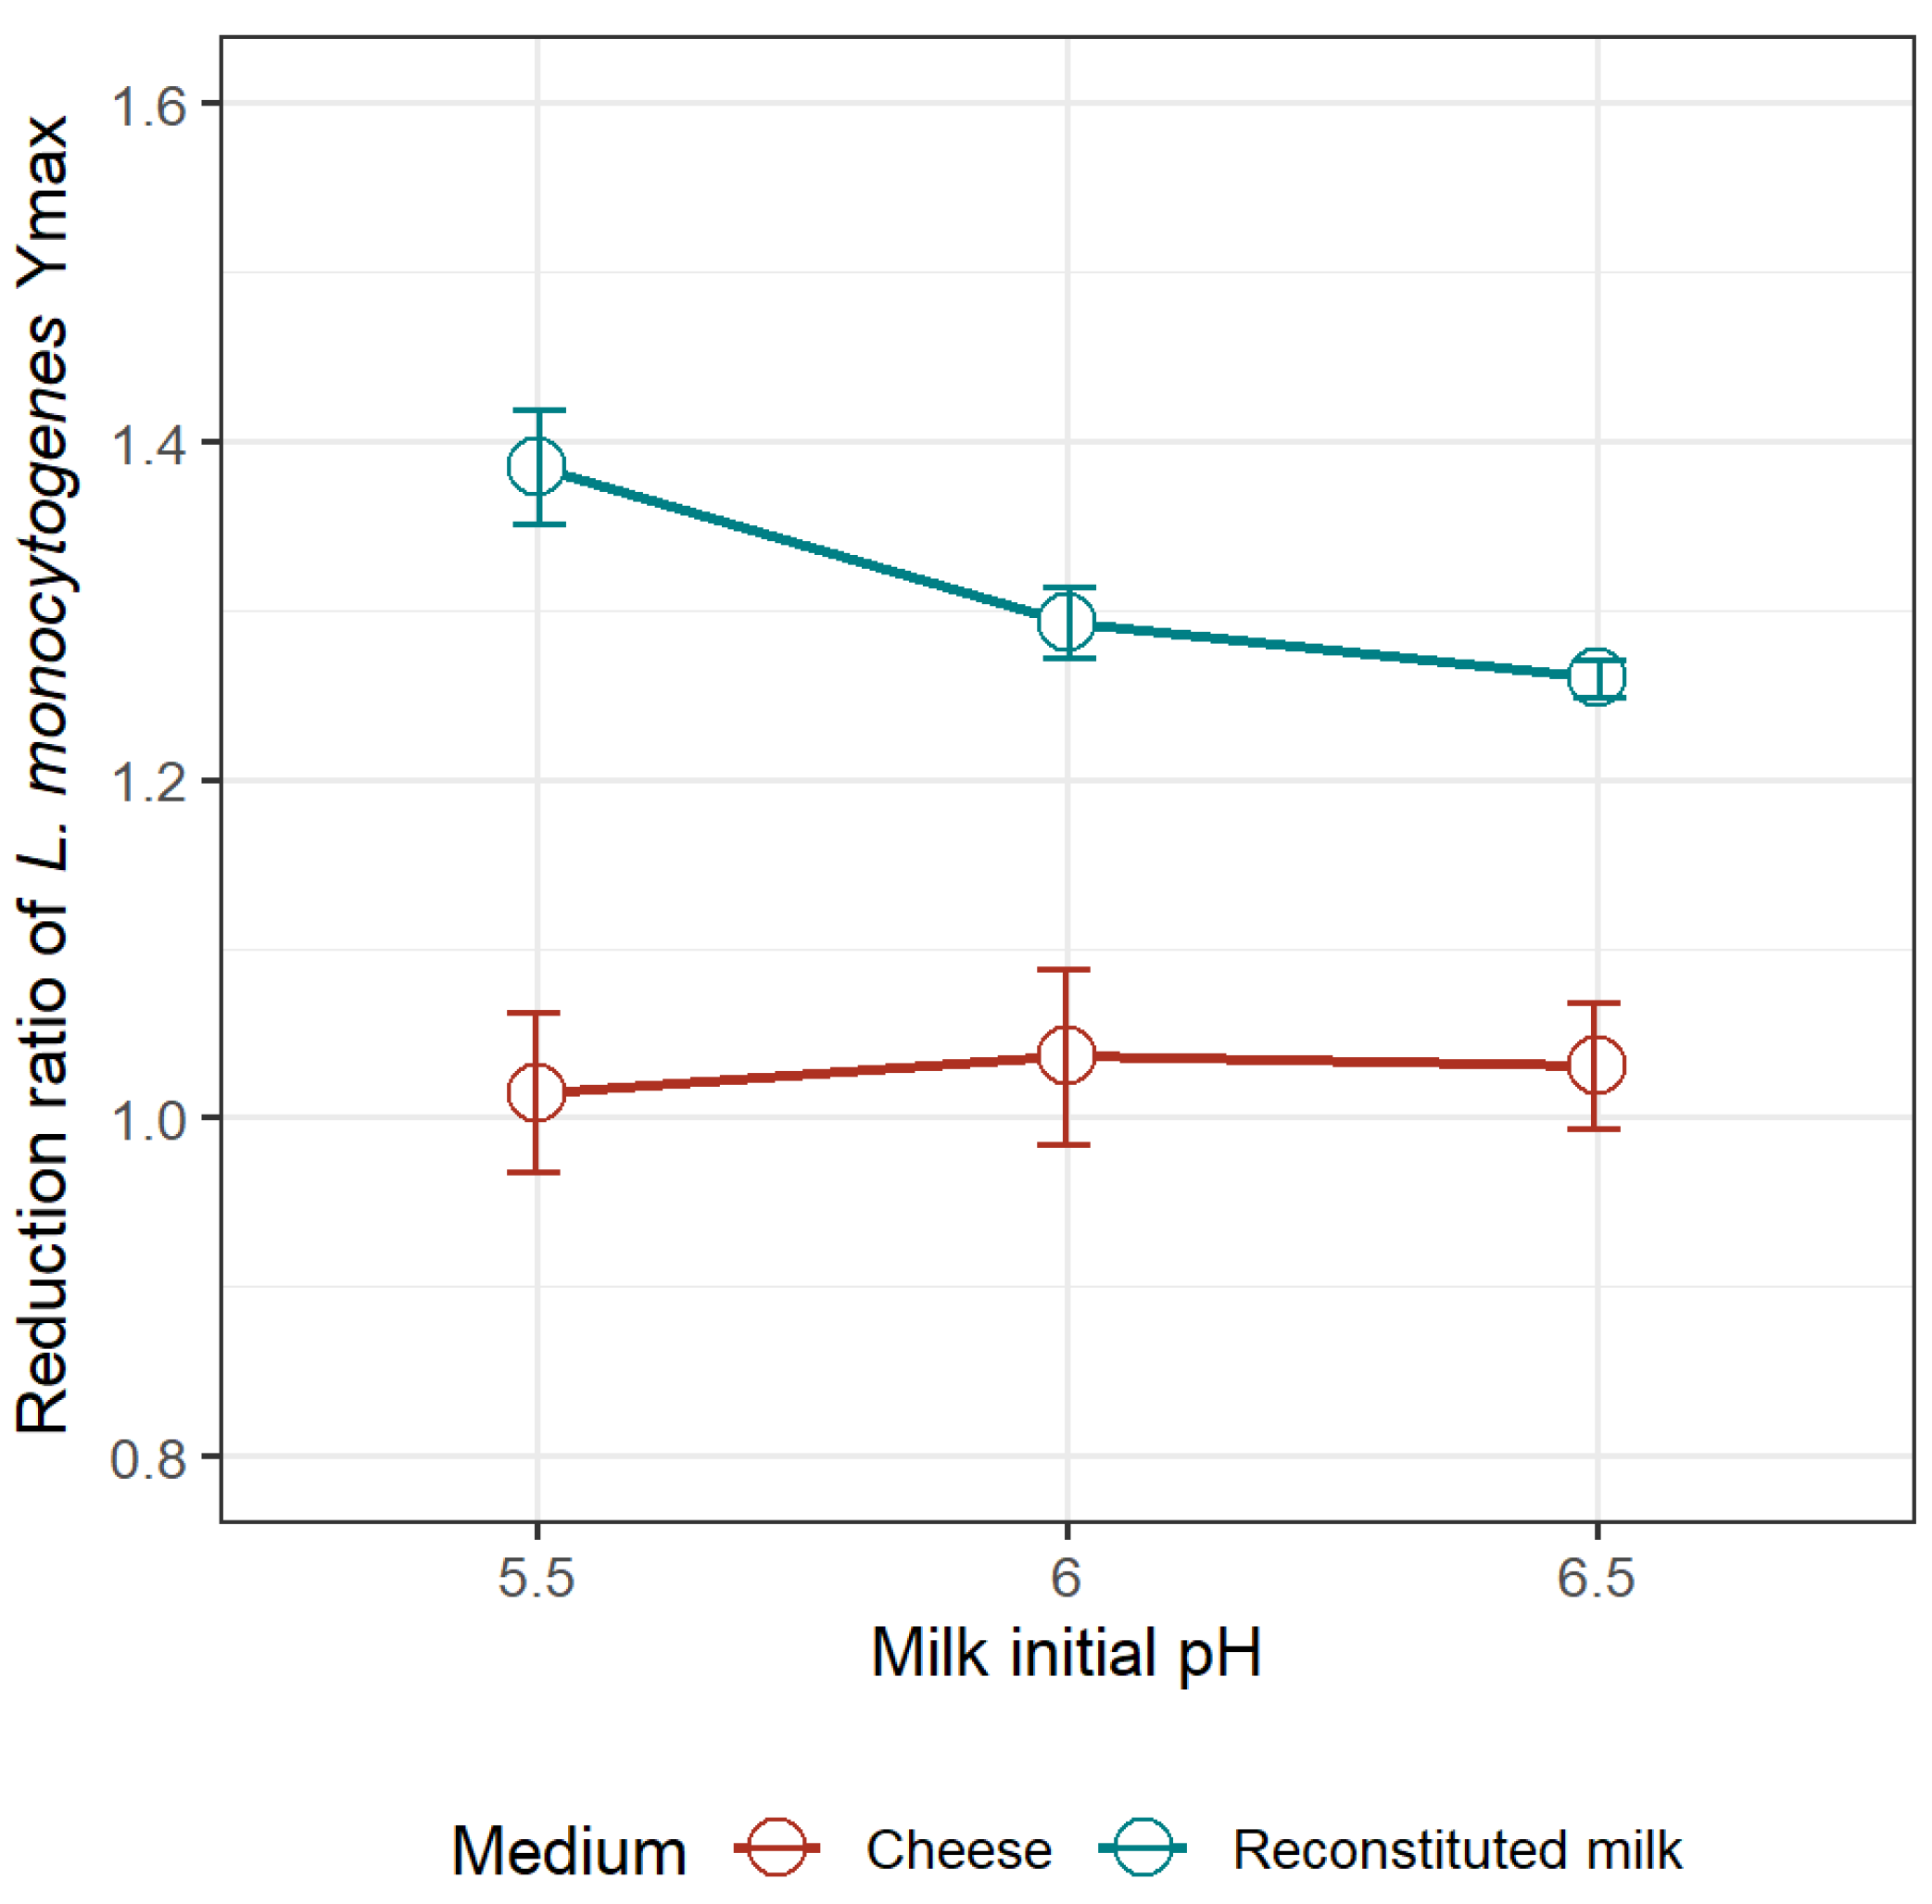
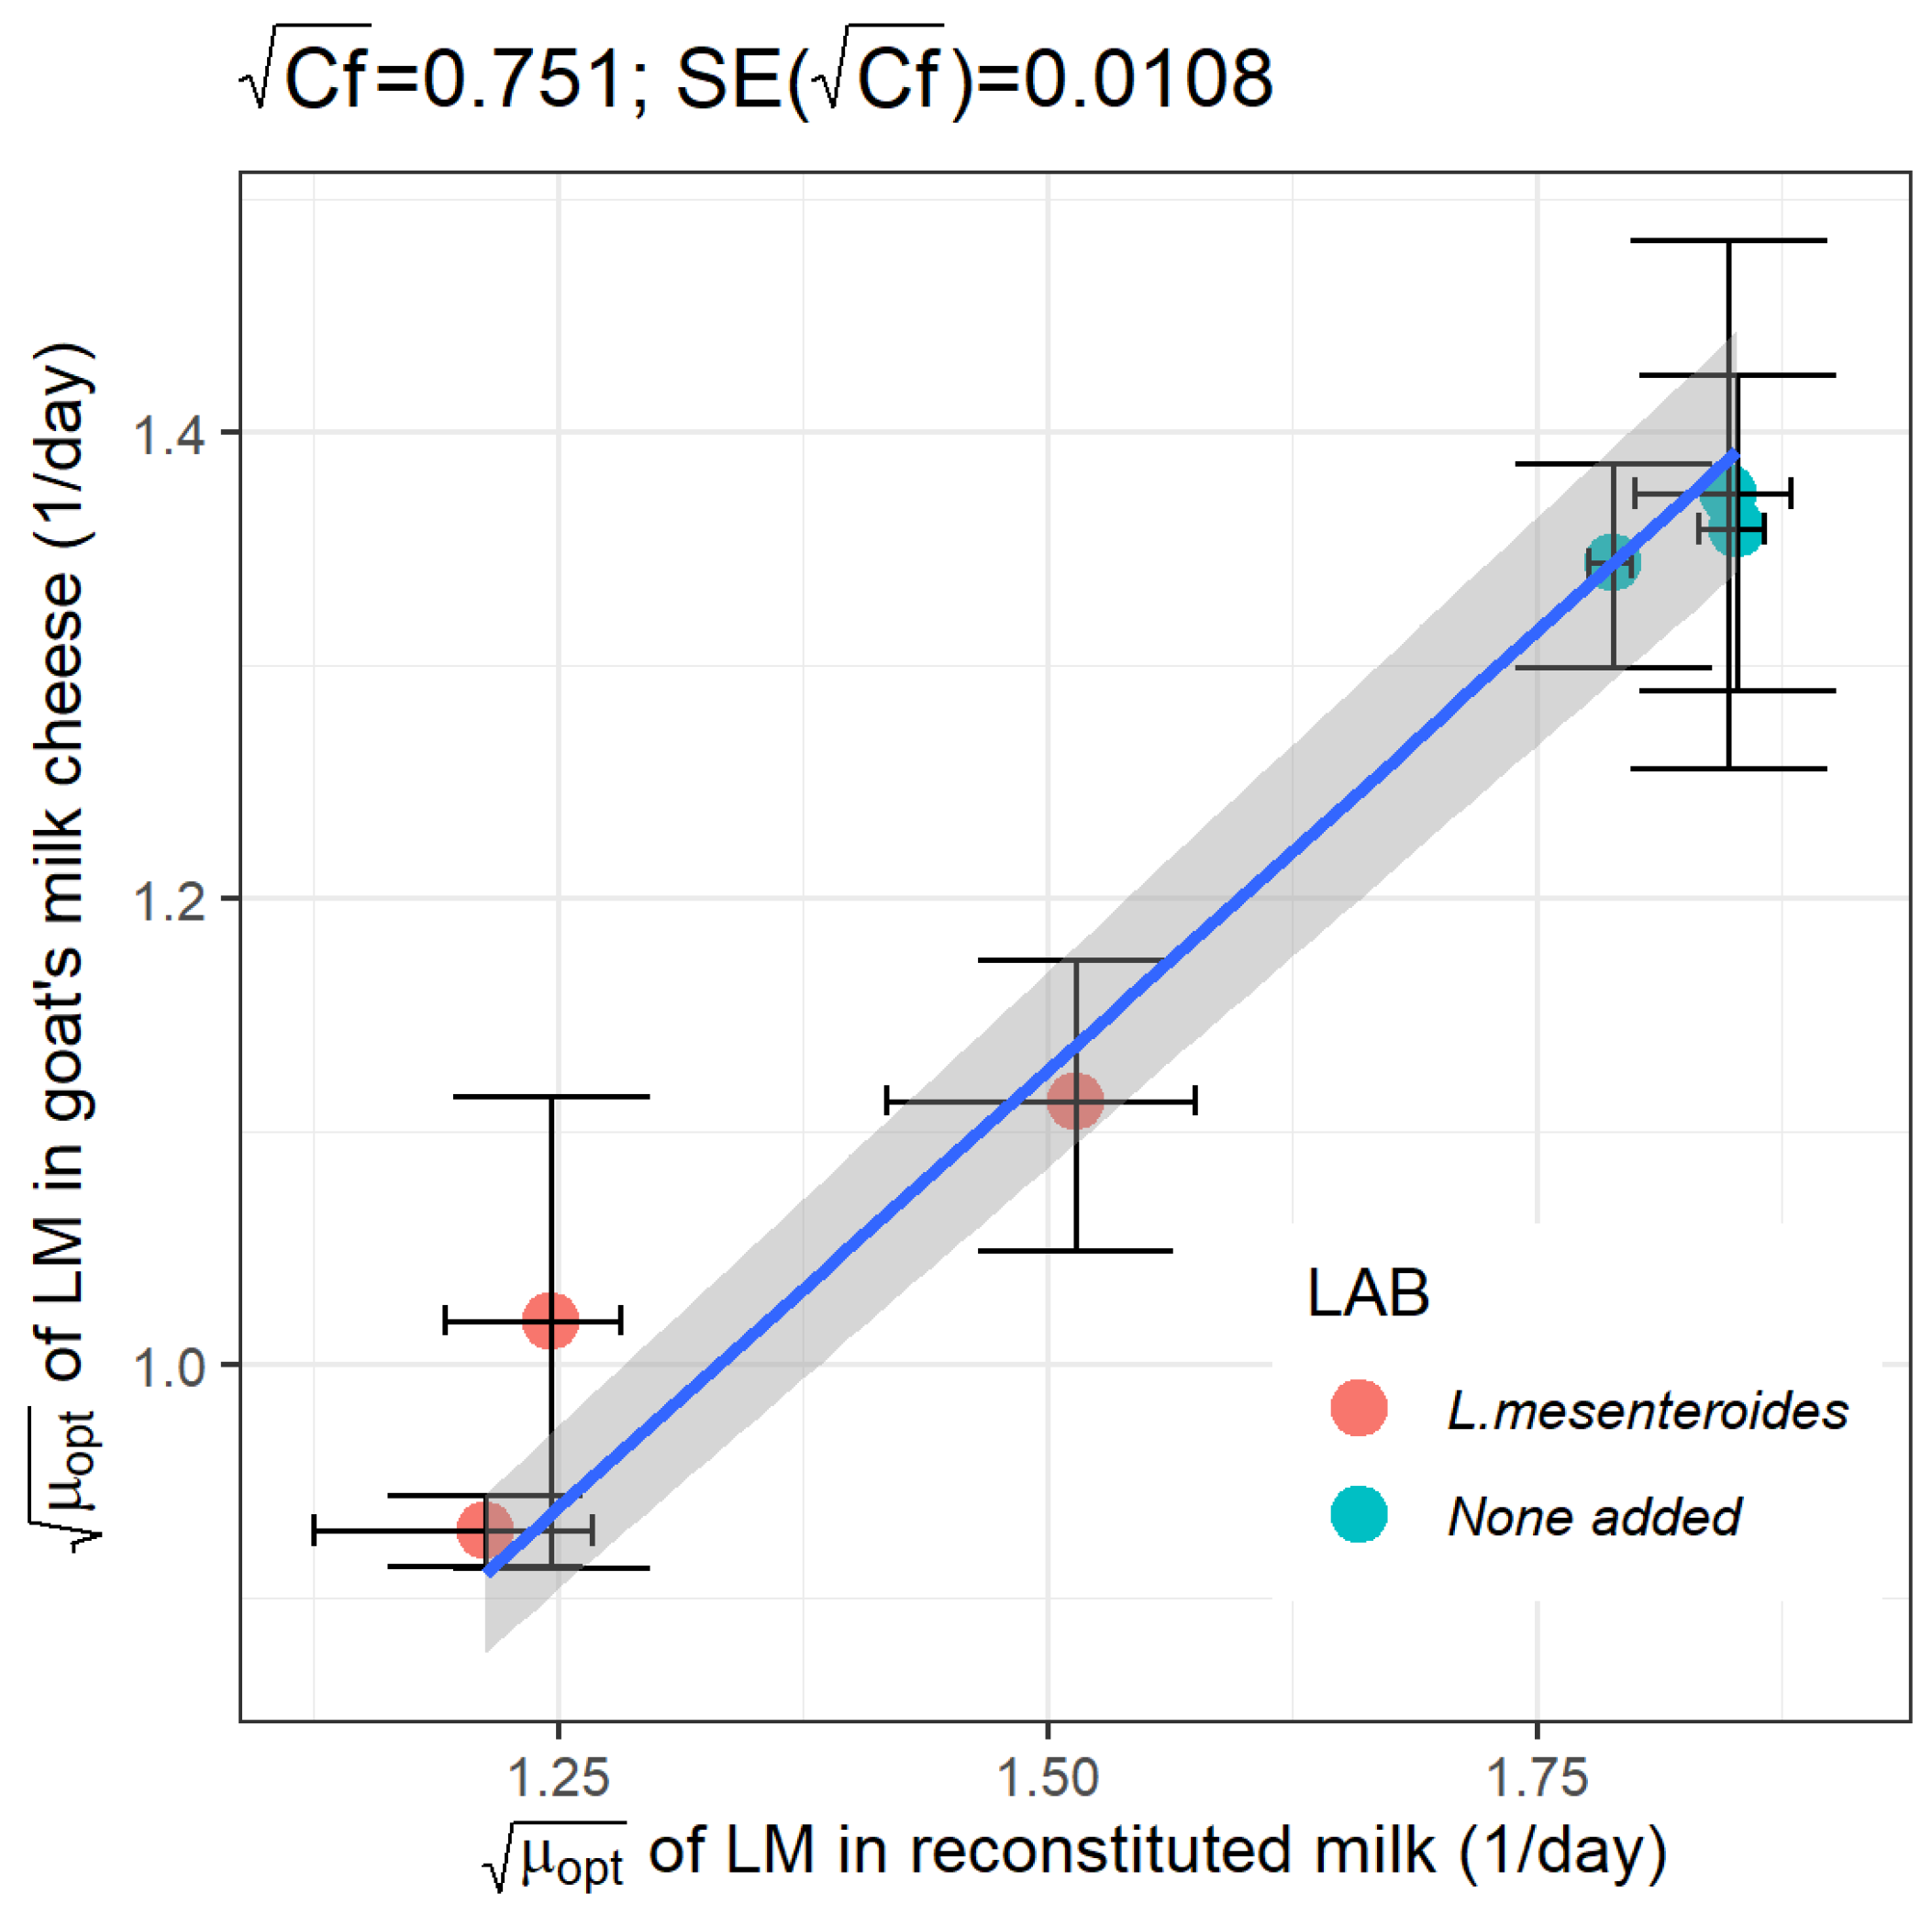
Previous research showed that a strain of Leuconostoc mesenteroides, isolated from goat’s raw milk cheese, was effective in slowing down the growth and reducing the maximum concentration of L. monocytogenes when evaluated in a milk model; and, furthermore, that the extent of inhibition was dependent on the milk initial pH. The objectives of this study were: (1) to determine whether the growth of L. monocytogenes in goat’s pasteurized milk cheese during maturation could be approximated from growth data obtained in the milk model medium, either in monoculture or in coculture with L. mesenteroides; and if so; (2) to model a milk-to-cheese conversion factor (Cf) for L. monocytogenes growth rate. Challenge tests were conducted by inoculating L. monocytogenes in monoculture and in coculture with L. mesenteroides in goat’s pasteurized milk adjusted at initial pH levels of 5.5, 6.0 and 6.5. The process of cheesemaking went on, and cheeses were ripened at 12 ºC during 12 days. Each experimental growth curve was adjusted to a pH-driven dynamic model where the microbial maximum growth rate is a function of pH. As observed in the milk model medium, in coculture with L. mesenteroides, the optimum growth rate (μopt) of L. monocytogenes in maturing cheese was affected by the initial pH of milk: the lowest rate of 0.863 ± 0.042 day-1 was obtained at the initial pH 5.5, in comparison to 1.239 ± 0.208 and 1.038 ± 0.308 day-1 at pH 6.0 and 6.5, respectively. Regardless of the milk initial pH, L. mesenteroides did not reduce the maximum load of L. monocytogenes in maturing cheeses, as it did in the milk medium. By contrary, at the milk initial pH of 5.5, 6.0, and 6.5, L. mesenteroides was able to decrease, on average, 2.2-fold, 1.5-fold and 1.9-fold the μopt of L. monocytogenes in both milk medium and cheese, without significant differences between matrices. Following such validation in goat’s cheese, the square-root of milk-to-cheese Cf for L. monocytogenes was estimated as 0.751 (SE=0.0108), and type of culture (monoculture, coculture) was not found to affect Cf (p=0.320). In conclusion, this work validated pre-acidification of milk as an efficient strategy that, when combined with the use of a protective culture, can synergically enhance the control of L. monocytogenes in cheese.

Keywords: 
;  ;  ;  ;  ;  

1. Introduction

Goat's milk cheese is among the most widely consumed dairy products worldwide and plays a key role in the Mediterranean diet [1,2]. However, a few microbiological hazards, such as Listeria monocytogenes, Salmonella spp., enterotoxigenic Escherichia coli and Staphylococcus aureus, can contaminate goat’s milk cheese; particularly if made with raw or unpasteurized milk [3]. The presence of L. monocytogenes in cheese is well-documented and may arise from multiple contamination sources throughout production and distribution. Contamination can occur through raw milk, inadequate pasteurization, or post-pasteurization events (i.e., cross-contamination scenarios during cheesemaking, ripening, or storage), as well as improper handling at retail or consumer level—often linked to poor hygiene practices, contaminated equipment, or the documented pathogen’s notable resistance to commonly used sanitizing agents [4,5,6]. The organism’s psychrotrophic nature, tolerance to acid and high salt conditions, and ability to form biofilms enable its persistence throughout cheese ripening, storage, and distribution, even at low initial contamination levels [7,8,9,10].
According to European Food Safety Authority (EFSA) Zoonoses Report [11], in 2022, the overall occurrence of L. monocytogenes in RTE milk products was 0.37%, with average prevalence rates of 0.87% in milk, 0.18% in pasteurized milk cheeses, and 1.3% in cheeses made from raw or low-heat-treated milk. L. monocytogenes is the etiological agent of human listeriosis, a foodborne disease that typically manifests as a self-limiting gastrointestinal infection in immunocompetent individuals [12,13]. However, in high risk populations collectively referred to as YOPI (young, old, pregnant and immuno-compromised), the infection may become a systemic invasive disease, leading to life-threatening complications such as septicemia, meningitis, and miscarriage [4,14]. The pathogen’s high-risk profile is largely attributed to its ability to cross critical physiological barriers, including the intestinal epithelium, the blood–brain barrier, and the fetoplacental barrier [12,15]. The disease’s high fatality rate (20–30%) and severe clinical sequelae further highlight the major public health concern posed by listeriosis [13,16].
Risk assessments have demonstrated that most listeriosis cases are associated with the consumption of high doses of L. monocytogenes, particularly when pathogen concentration does not meet the current criteria throughout shelf life (≤ 100 CFU/g) [17,18]. To mitigate this risk , a number of intervention strategies and control measures can be applied during processing, such as the incorporation of bacteriocinogenic lactic acid bacteria (LAB), quick acidification, surface treatments or coating containing antimicrobials, and rigorous sanitation practices [6,19,20,21,22,23].
The use of bacteriocin-producing LAB is considered one of the most efficient strategy for controlling L. monocytogenes in cheese because they provide a natural, dual-action approach: they compete for resources while also producing peptides that effectively inactivate the pathogen [24,25]. LAB include genera such as Lactobacillus, Lactococcus, Leuconostoc, Pediococcus, and some Streptococcus species [26]. These microorganisms are recognized by EFSA as bearing a Qualified Presumption of Safety (QPS) status, indicating their safe use in food production [27]. Their intentional application in dairy fermentation is widely recognised because: (i) they act as protective cultures that inhibit spoilage and pathogenic bacteria such as L. monocytogenes, through multiple mechanisms, including competition for nutrients, inhibition of pathogen adhesion, competitive exclusion, and production of antimicrobial compounds; and (ii) they enhance the sensory attributes of fermented foods through aroma and flavour development, as well as the synthesis of exopolysaccharides that improve texture [28,29,30,31]. As essential microorganisms in fermentation, LAB convert lactose into lactic acid, the primary antimicrobial compound which lowers pH and creates an inhospitable environment for pathogen growth, representing one of the main biopreservation mechanisms in fermented foods [32,33]. Beyond lactic acid, LAB synthesise bacteriocins, hydrogen peroxide, acetoin, carbon dioxide, and different low-molecular-weight metabolites (e.g., diacetyl, reuterin, reutericyclin, fatty acids), all of which enhance food safety and extend shelf life by inhibiting foodborne pathogens and spoilage organisms [29,33]. The anti-listerial activity of LAB may become even more effective when combined with additional processing hurdles, particularly acid stress, expressed as the local concentration of protons (H+) or pH, which imposes a major limitation on microbial growth and survival [9,34].
Previous work conducted in a milk model medium demonstrated that the pre-acidification of milk enhances the inhibitory effects of a strain of Leuconostoc mesenteroides against L. monocytogenes during fermentation, by significantly reducing both the pathogen’s growth rate and the maximum concentration [35]. Building upon the kinetic parameters observed in the milk model at different initial pH values, it became essential to validate whether comparable inhibitory effects could be reproduced in an actual cheese matrix during the ripening period.
Thus, this study aims to build on our previous work by determining if such biocontrol capacity of L. mesenteroides observed in the milk model can be validated in a dairy product of short maturation such as goat’s pasteurized milk cheeses. The objectives of this study were therefore: (1) to determine whether the growth of L. monocytogenes in goat’s pasteurized milk cheese during maturation could be estimated from growth data obtained in milk model medium, either in monoculture or in coculture with L. mesenteroides; and if so; (2) to model a milk-to-cheese conversion factor (Cf) for L. monocytogenes growth rate.

2. Materials and Methods

2.1. Bacterial Strains and Culture Preparation

Previous investigations by our research group demonstrated that a strain of Leuconostoc mesenteroides, previously isolated from artisanal goat’s raw milk cheeses, exhibits anti-listerial and acidifying activities, first observed in vitro [36,37], and later corroborated in challenge tests with L. monocytogenes in a milk model medium (i.e., heat-treated reconstituted milk) [35]. The strain was identified using 16S rRNA gene sequencing and selected as the bioprotective culture for the present study. Stock cultures were stored at −80 °C in Man, Rogosa and Sharpe (MRS) broth (Liofilchem, Roseto degli Abruzzi, Italy) supplemented with 25% glycerol as a cryoprotectant. A loop of the stock culture was initially inoculated into MRS broth and incubated at 30°C for 24 hours. Subsequently, two successive subcultures were prepared by inoculating 100 μL of the subculture into 10 mL of MRS broth and incubated under the same conditions. Finally, 500 μL of each subculture was inoculated into 200 mL of MRS broth and incubated at 30°C for 18 hours to achieve a final concentration of approximately 107 log CFU/mL. The L. monocytogenes strain ATCC 19111, obtained from the culture collection of the Polytechnic Institute of Bragança stock collection, was used. A loop of the stock culture, maintained on Brain Heart Infusion (BHI) agar (Liofilchem, Roseto degli Abruzzi, Italy) slants at 4°C, was inoculated into 10 mL of BHI broth and incubated overnight at 37 °C in an orbital shaker at 200 rpm to achieve an inoculum concentration of approximately 105 CFU/mL. Pre-activation was performed in 5 mL of BHI broth under same conditions. Cell concentrations were verified by measuring the optical density at 600 nm (OD₆₀₀) using a spectrophotometer (Peak Instruments Inc., Version 1701, Houston, TX, USA).

2.2. Manufacture of the Cheese Matrix: Bacterial Strains Inoculation in Milk

Laboratory-scale cheeses were manufactured using pasteurized goat’s milk (thermally treated at 65 ºC for 30 minutes), to eliminate native microflora and thereby avoid potential effects of microbial heterogeneity on the behavior of L. monocytogenes and L. mesenteroides [38]. After pasteurization, the pH of milk was adjusted to 5.5, 6.0 or 6.5 using 0.1M HCl or NaOH solutions. The subsequent milk inoculation was carried out according to the experimental design: a total of six challenge test treatments were produced, comprising three monoculture treatments of L. monocytogenes at three milk initial pH levels; and three coculture treatments of L. monocytogenes and L. mesenteroides at three milk initial pH levels. Challenge tests were conducted in duplicate in batches of one-litre milk. Accordingly, in every batch of the monoculture trials, L. monocytogenes was inoculated at a target concentration of 105 CFU/mL; and with L. mesenteroides at a target concentration of 107 CFU/mL, in the coculture trials. Using a water bath, each milk batch was maintained at 34 ± 1 ºC; and commercial rennet (0.75 mL/L milk) was then added to initiate coagulation. After 30 minutes, the curd was cut, drained, and transferred into 50 mL Falcon tubes, followed by centrifugation at 6000 rpm for 3.5 minutes at 20 °C. The whey was discarded, and the compacted curd was cut into model cheeses (~5 g each). Salting was the next stage and consisted of immersing cheeses in brine (7.5% NaCl w/v) at a cheese-to-brine ratio of approximately 90 g:1.5 L, for 10 minutes at 25 °C [39]. Finally, the cheeses were weighed (g) and stored at 12°C and 98% relative humidity in a climate-controlled chamber (Aralab, FitoClima 300 ECP 20, Portugal) for 12 days to allow fermentation and maturation.

2.3. Microbiological and Physicochemical Analyses

Microbiological and physicochemical analyses were performed throughout the ripening period, starting on day 0 (day of cheese elaboration) and ending on day 12. For microbiological analyses, serial dilutions were prepared by homogenising each cheese sample in 50 mL sterile Buffered Peptone Water (BPW) (Liofilchem, Roseto degli Abruzzi, Italy) for 60 seconds using a Bag Mixer 400 (Interscience, Saint Nom la Bretêche, France). Appropriate decimal dilutions were then prepared in sterile BPW for microbial enumeration. L. monocytogenes was enumerated by plating a 0.1 mL aliquots onto Listeria Palcam agar (Liofilchem, Roseto degli Abruzzi, Italy), added with Listeria Palcam supplement (Liofilchem, Roseto degli Abruzzi, Italy), following the standard ISO method [40]. Typical colonies were counted after incubation at 37 °C for 24 hours. For LAB enumeration, 1 mL aliquots of the dilutions were inoculated into MRS agar (Liofilchem, Roseto degli Abruzzi, Italy), overlaid with 10 mL of 1.2% bacteriological agar (Liofilchem, Roseto degli Abruzzi, Italy), according to ISO method [41]. Plates were incubated at 30 °C for 48 hours, and colonies with typical LAB morphology were counted.
Physicochemical analyses included measurements of pH and water activity (Aw), both performed in duplicate. The pH was determined using a FiveGo pH meter F2 coupled with a LE438 IP67 probe (Mettler-Toledo, Greifensee, Switzerland). Aw was determined using an Aqualab 4TE water activity meter (Decagon, San Francisco, CA, USA).

2.4. Modelling Approach

2.4.1. Modelling the Growth of L. monocytogenes in Goat’s Milk Cheese During Maturation, and as Affected by L. mesenteroides

A total of nine experimental growth curves were obtained: three of L. monocytogenes in monoculture, three of L. monocytogenes in coculture, and three of L. mesenteroides in coculture. The pH-driven dynamic model introduced in Loforte et al. [35] was chosen for modelling these data sets, as it was proven to outperform the microbial Jameson-effect model, and was validated using multiple growth parameters of L. monocytogenes in raw and heat-treated milk obtained from the literature [35].
Thus, each of the nine growth curves was adjusted to a pH-driven dynamic model of the form,
d Y d t = μ m a x 1 e x p ( Y ) e x p ( Y m a x )
μ m a x = μ o p t 1 10 p H m i n p H
where Y represents the counts of L. monocytogenes or L. mesenteroides in time (log CFU/g, base e) whereas Ymax their maximum population densities (log CFU/g). The maximum specific growth rate of L. monocytogenes or L. mesenteroides ( μ m a x in day-1) is set to depend on the matrix pH. The parameter μ o p t is the optimum growth rate of L. monocytogenes or L. mesenteroides in cheese; and p H m i n is the minimum pH for growth of L. monocytogenes or L. mesenteroides. p H m i n was set to 4.303 for L. monocytogenes, and to 4.000 for L. mesenteroides [35].
Model 1 include ordinary differential equations (ODE) that do not have an analytical solution but can be solved with numerical methods. Numerical optimisation consists of searching for the most suitable parameters of the dynamic models such that the residual sum of squares (RSS) of the errors is minimised. The 4th order Runge-Kutta method was adopted to solve ODE while the unknown kinetic parameters were estimated by least-square optimization, using the deSolve and FME packages implemented in the R software. The kinetic parameters of Equation 1 was estimated using the ‘nlme’ package.
The goodness of fit was assessed for each of the nine growth curves through the estimation of the mean absolute error (MAE) and root mean square error (RMSE), defined as,
M A E = Y o b s i Y f i t i n
      R M S E = Y o b s i Y f i t i 2 d f
in addition to the variance of the model residuals. Yfit i and Yobs i denote each of the i-th concentration of L. monocytogenes or L. mesenteroides fitted by the dynamic model and its corresponding observation, respectively. The degree of freedom (df) is calculated as ‘n - np’, where n is the number of observations of an experimental growth curve and np is the number of parameters of the fitted model.

2.4.2. Prediction of the Growth of L. monocytogenes in Goat’s Milk Cheese from a Milk Model Medium

As indicated earlier, previous research focused on determining the kinetic parameters of L. monocytogenes in monoculture and in coculture with selected LAB, including L. mesenteroides, in reconstituted milk growth medium. Such outcomes were employed in this study and brought together with the growth results in cheese, in order to determine whether the growth of L. monocytogenes in cheese during maturation could be approximated from data obtained in milk model. The kinetic parameters of L. monocytogenes in the milk model, which are reutilised in the present validation study are summarized in Table 1; and comprises estimates of μ o p t L M and Y m a x L M in in monoculture and coculture, at three different milk initial pH levels [35].
The prediction analysis from milk model to cheese was then developed in four steps:
A. The effect of the growth medium (goat’s milk cheese and milk) on the kinetic parameters growth rate and maximum concentration of L. monocytogenes was graphically assessed for both monoculture and coculture experiments. This allowed to compare the effect of the milk initial pH on the kinetic parameters in the two food matrices.
B. Reduction ratios (RR) of the optimum growth rate of L. monocytogenes due to the action of L. mesenteroides were calculated in the milk model ( R R μ o p t m i l k ) and in pasteurized goat’s milk cheese ( R R μ o p t c h e e s e ), as follows,
R R μ o p t m i l k = μ o p t   L M   m o n o c o c u l t u r e   i n   m i l k μ o p t   L M   c o c u l t u r e   i n   m i l k
R R μ o p t c h e e s e = μ o p t   L M   m o n o c o c u l t u r e   i n   c h e e s e μ o p t   L M   c o c u l t u r e   i n   c h e e s e  
Six R R μ o p t were obtained, considering that growth rates were obtained at three milk initial pH levels. Similarly, the six reduction ratios of the maximum concentration of L. monocytogenes due to the presence of L. mesenteroides were calculated as,
R R Y m a x m i l k = Y m a x   L M   m o n o c o c u l t u r e   i n   m i l k Y m a x   L M   c o c u l t u r e   i n   m i l k
R R Y m a x c h e e s e = Y m a x   L M   m o n o c o c u l t u r e   i n   c h e e s e Y m a x   L M   c o c u l t u r e   i n   c h e e s e
The effect of L. mesenteroides on the growth rate and the maximum concentration of L. monocytogenes was considered as significant if R R μ m i l k , R R μ c h e e s e and R R Y m a x m i l k , R R Y m a x c h e e s e , respectively, were significantly higher than 1.0. In order to perform such evaluation, standard errors of RR were estimated using the approximation of Stuart & Ord (1998) for the standard deviation of a ratio of two random variables of known standard deviations.
C. A linear model of the form,
μ o p t c h e e s e i c = C u l t u r e T y p e + C f . μ o p t m i l k i c + ε i c
was adjusted, where μ o p t c h e e s e i c is the square-root of the optimum growth rate of L. monocytogenes in cheese obtained at i-th milk initial pH (5.5, 6.0 or 6.5) and the c-th culture type (monoculture or in coculture with L. mesenteroides); μ o p t m i l k i c is the square-root of the optimum growth rate of L. monocytogenes in milk obtained at i-th milk initial pH and the c-th culture type; C f is the square-root of the conversion factor for growth rate from milk medium to cheese matrix; and ε i c the model’s residuals. A non-significant C u l t u r e T y p e covariate would mean that there is no effect of the type of culture, and that the linear model could be further simplified. A significant C f can be interpreted as evidence that growth data obtained in a milk model medium can be employed to predict the pathogen’s kinetics in goat’s milk cheese.
D. The final validation was carried out in a separate growth data set. We used, as comparator, growth data (microbial concentrations) of L. monocytogenes in cheese made of goat’s milk with adjusted milk pH of 6.0, inoculated with L. mesenteroides; and left to mature at 12 ºC. The growth prediction was worked out through Monte Carlo [42,43] simulation using as input parameters: (1) the estimated growth rate of L. monocytogenes in the milk model medium adjusted at pH 6.0 (milk initial pH) in coculture with L. mesenteroides; (2) the conversion factor modelled as a normal distribution with mean C f and its standard error; and (3) the cheese pH profile during maturation for solving the pH-driven dynamic model (Eq. 1). In this way, the experimental growth in an actual food matrix, cheese, was compared against the dynamic prediction obtained using data from milk medium.
All statistical analyses were carried out in the R software [44] using the packages ggplot2, matrixStats, deSolve and FME.

3. Results and Discussion

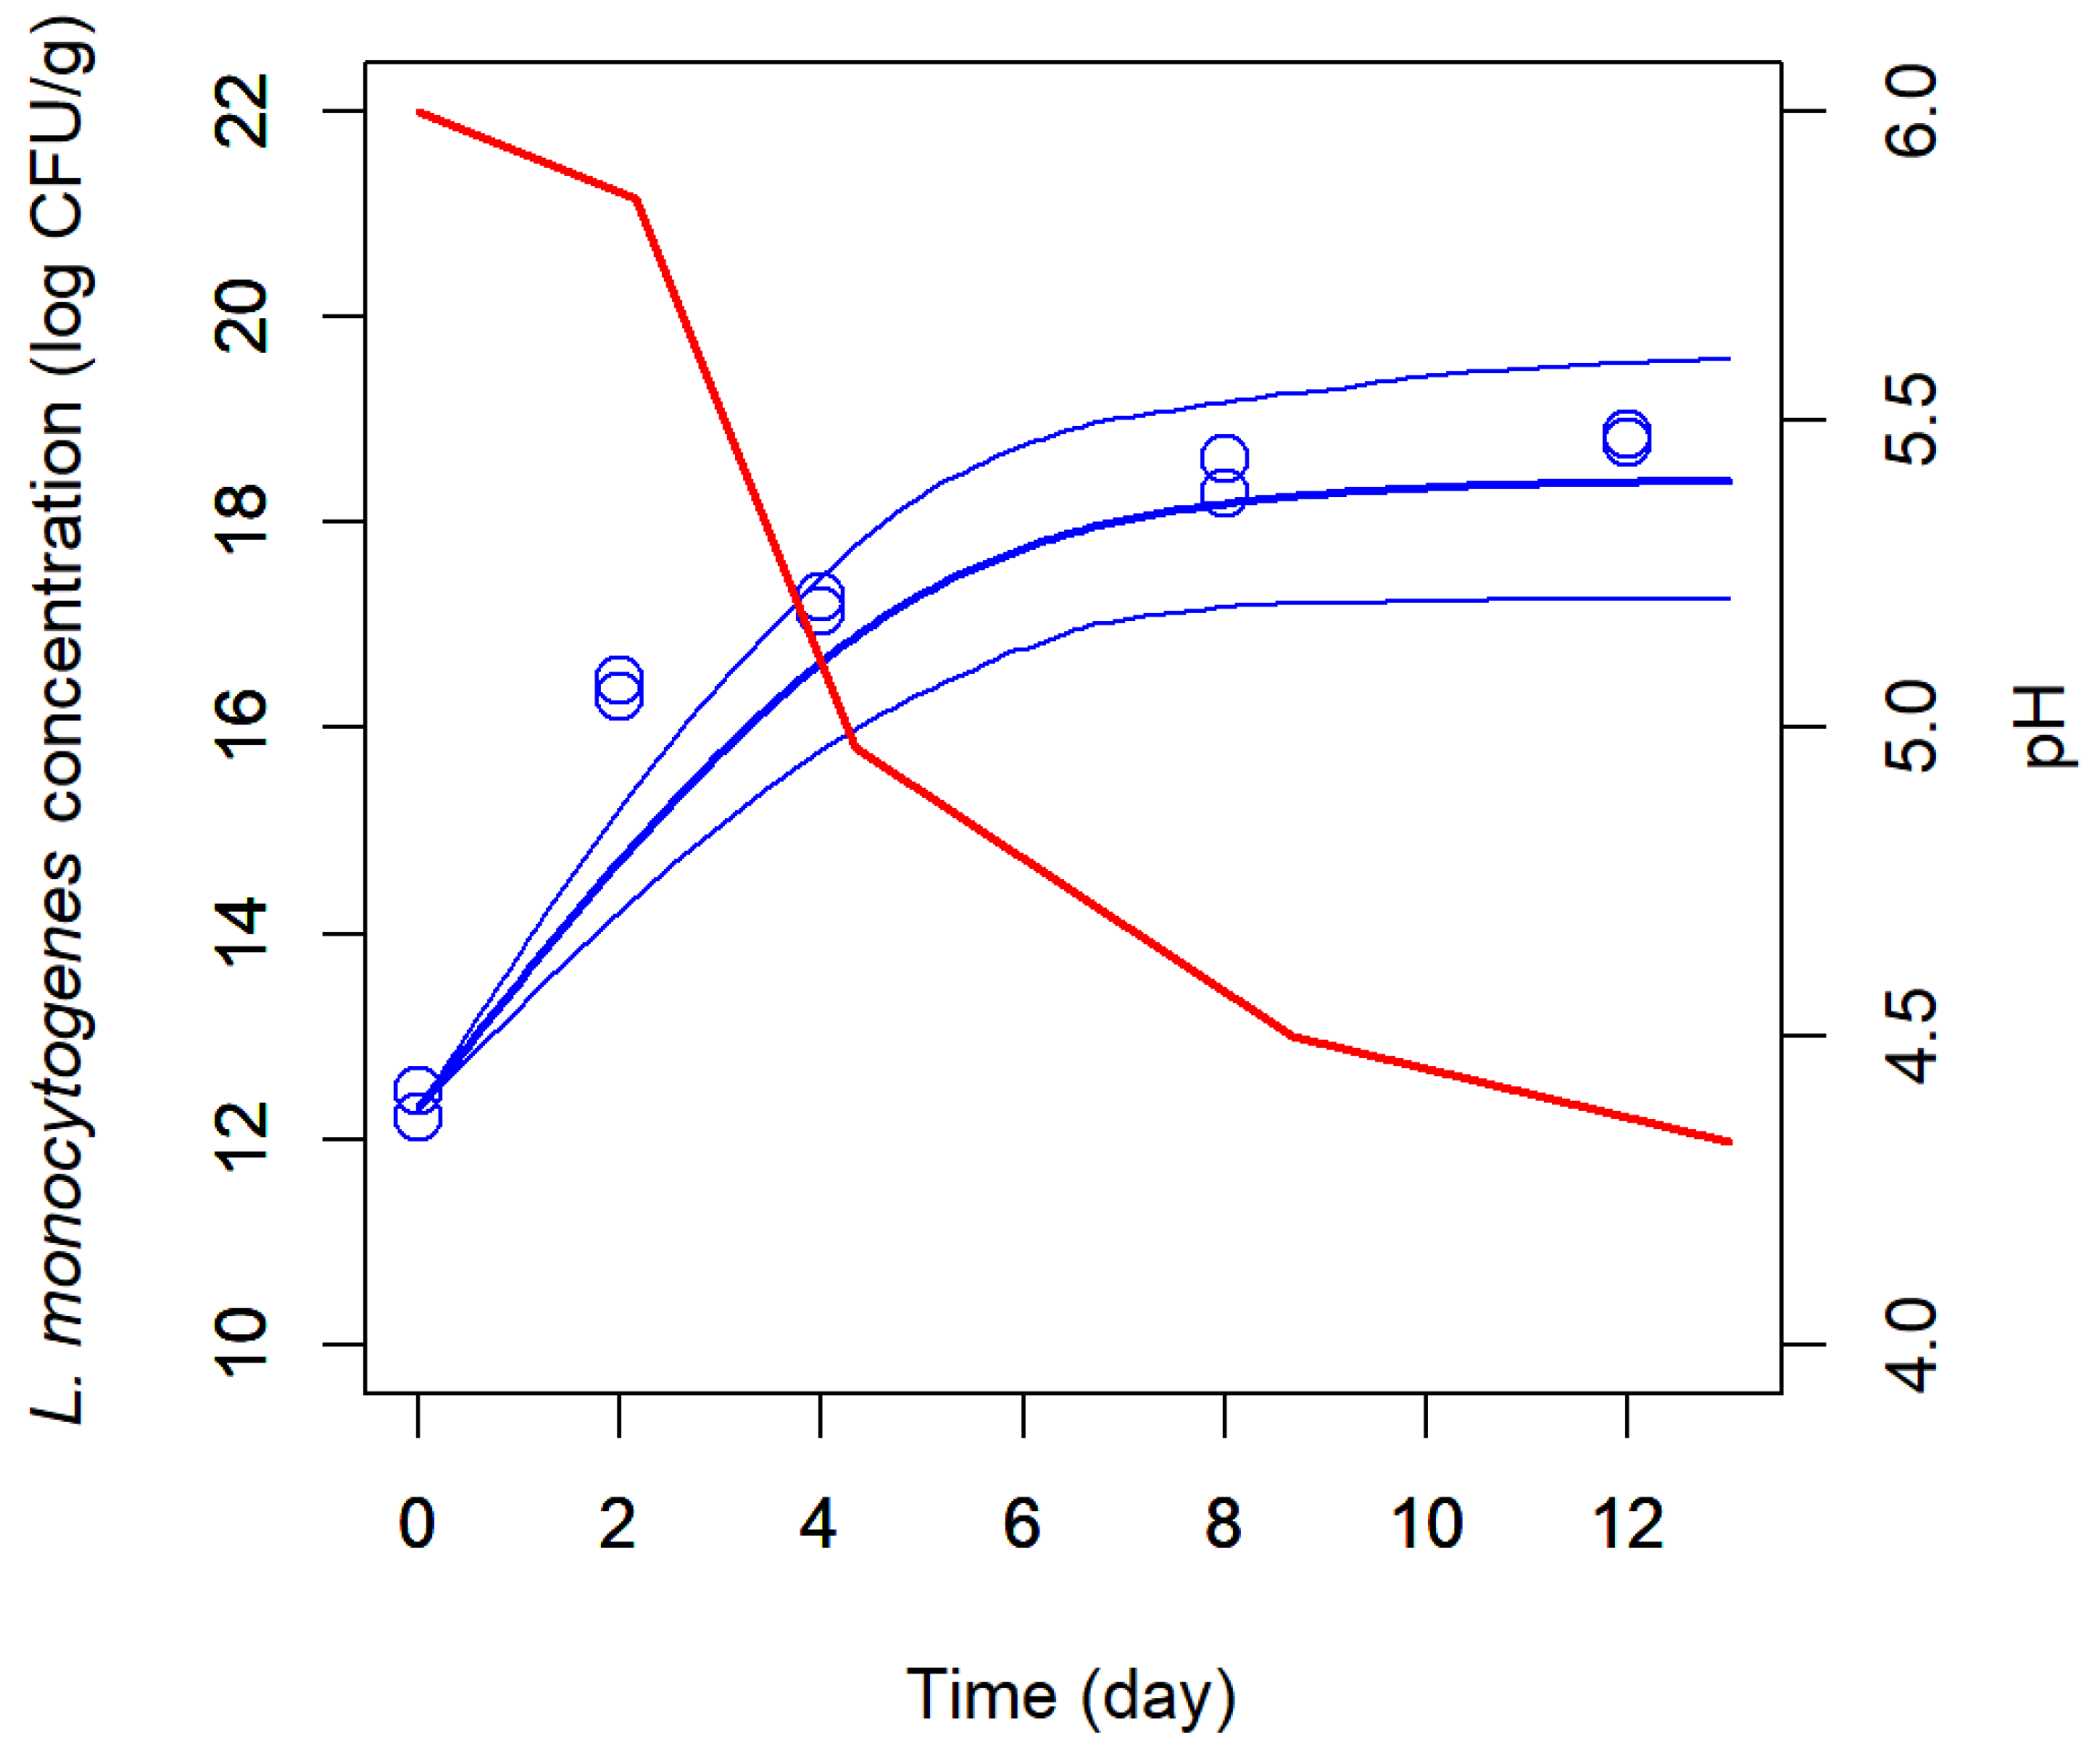
3.1. Listeria Monocytogenes Growth in Cheese During Ripening

The pH-driven dynamic model effectively described the growth of L. monocytogenes in goat’s milk cheese, in monoculture, during ripening, as suggested by the significant kinetic parameters at the three initial pH values (Table 2). The goodness-of-fit were comparable among the three curves, with RMSE values of 0.5658, 0.5806, and 0.3851 for milk initial pH of 5.5, 6.0 and 6.5, respectively. As summarised in Table 2 and Figure 1 (blue lines), μopt of L. monocytogenes in maturing cheese was barely affected by the milk initial pH, whereas the maximum population density (Ymax) was significantly moderated by the milk initial pH (Figure 1). Yet, interestingly, both μopt and Ymax followed the same pH-effect trend, reaching higher values at the milk initial pH of 6.0 (1.886 ± 0.465 day⁻¹ and 19.45 ± 0.821 log CFU/g, respectively), and lower values at the pH of 5.5 (1.805 ± 0.177 day⁻¹ and 17.67 ± 0.800 log CFU/g, respectively). The increases in L. monocytogenes maximum load capacity (Ymax) in cheese at initial pH 6.0 and 6.5 correspond to approximately 1.8 and 1.2 log CFU/g relative to pH 5.5, highlighting the key role of acidity in limiting pathogen proliferation.
The influence of pH on the growth of L. monocytogenes corroborates the cardinal pH model proposed by Rosso et al. [45], which postulates pH as a critical environmental parameter affecting microbial proliferation, whereby growth rates decline as pH move away from the organism’s optimal range. Most bacteria typically thrive near neutral pH ranges, whereas acidic environments restrict both microbial growth and community diversity [20]. L. monocytogenes can grow and survive across a broad pH range (4.4–9.6), with an optimum range between 6 and 8 [46]. However, under acid conditions (e.g., pH <5.5 ), the higher concentration of hydrogen ions (H⁺) reduces intracellular pH and impairs the pathogen’s ability to maintain cellular homeostasis due to the influx of protons and anions into the cytoplasm, which disrupts essential metabolic functions and can damage proteins, nucleic acids, and cell membranes [34,47,48,49].
The inhibitory effect of acidic environments on L. monocytogenes has been well documented by other authors. For instance, Martín et al. [50] observed that lower pH in BHI broth led to reduced pathogen counts, with the most pronounced growth restriction occurring at pH 4.5 — close to the lower pH limit for growth (~ pH 4.2) [51]. At such acidity levels, L. monocytogenes may remain viable but in a non-proliferative state [50]. Tirloni et al. [23], using a cardinal parameter model for L. monocytogenes growth in fresh Ricotta cheese, reported a ~ 23% reduction in the maximum specific growth rate (μₘₐₓ: from 0.197 h-1 to 0.151 h-1) as pH decreased from 6.61 to 5.49. Likewise, Kapetanakou et al. [52] reported that pH strongly influences L. monocytogenes survival in different cheeses types: higher pH cheeses [e.g., Mascarpone (6.45), Ricotta (6.64), Camembert (6.30), and Halloumi (6.60)] supported more pathogen growth compared to lower pH varieties [e.g., Cottage (5.03), Edam (5.58), and Gouda (5.53)], highlighting acidity as a natural hurdle. Supporting these findings, Leong et al. [53] observed more pronounced microbial growth in cheeses with higher pH (5.41-6.50) compared to those ranging from 4.29 to 5.40. Although in a food product different from cheese, soymilk, Ariahu et al. [54] demonstrated that higher initial pH (~6.8) values increased both the exponential growth rate and the maximum load capacity of L. monocytogenes. It is worthy to point out that in the previous examples, it was the pH of cheese – as a final product, which was demonstrated to effectively slow down the growth of L. monocytogenes during shelf life. In our study, it was the pH of milk – as raw material, which was changed in order to assess its effectiveness as a pre-fermentation intervention strategy to control this pathogen in cheesemaking.
The growth kinetics parameters of L. monocytogenes and L. mesenteroides in goat’s milk cheese from the coculture experiments at different milk initial pH values (5.5, 6.0 and 6.5) are presented in Table 3. Overall, for all the growth curves, the model estimated parameters with high precision, as implied by the highly significant p-values. The goodness-of-fit measures were comparable among all the growth curves, with RMSE values ranging between 0.0312 and 0.4335. It was found that, regardless of the milk initial pH (5.5, 6.0 and 6.5), L. mesenteroides was able to reach higher Ymax (20.49 ± 0.231; 22.00 ± 3.964; 21.57 ± 0.187 log CFU/g, respectively) than L. monocytogenes (17.41 ± 0.163; 18.77 ± 0.497; 18.31 ± 0.407 log CFU/g, respectively) by a factor of about 1.2 in the three cases. This phenomenon is very likely to obey to the Jameson-effect microbial competition [55,56], which is often a non-specific interaction between two microbial populations resulting from the depletion of a common nutrient or the accumulation of waste products, although it can also be caused by specific inhibitors or environmental changes, such as acidification, produced by the dominant species (i.e., L. mesenteroides) [57].
Figure 1 displays the coculture growth kinetic parameters of L. monocytogenes alongside the monoculture counterparts, for comparison. There, it is noticeable that the presence of L. mesenteroides affected the growth kinetics of L. monocytogenes in maturing cheese, consistently reducing both μopt and Ymax by comparison to the monoculture, regardless of the milk’s initial pH. Such reductions, due to LAB addition, can be regarded are clearly different, as implied by the non-superimposed standard error bars in Figure 1. Furthermore, the pH-effect patterns of L. monocytogenes μopt and Ymax, in coculture with L. mesenteroides (red lines), mimicked those of L. monocytogenes alone (blue lines). It was also noticeable, that unlike the monoculture L. monocytogenes μopt, when L. mesenteroides was added to milk, the pathogen’s μopt became significantly affected by the initial pH (notice the non-superimposed standard error bars). Thus, it can be said that the significantly lowest μopt value of L. monocytogenes in coculture was encountered at the milk initial pH of 5.5 (0.863 ± 0.042 day-1). Likewise, the pathogen’s lowest Ymax (17.41 ± 0.163 log CFU/g) was encountered that the initial pH of 5.5 when milk was added with the LAB culture. Once again, the fact that the highest L. monocytogenes μopt in cheese was observed at the midpoint milk pH of 6.0 is supported by the cardinal pH model theory [58,59].
This pattern showed in Figure 1 illustrates a clear interaction between acidity and microbial competition; whereby more acidic conditions enhance the inhibitory effect of L. mesenteroides on L. monocytogenes. This observation aligns with the systematic review and meta-analysis earlier conducted by Loforte et al. [60], which demonstrated that LAB’s antagonistic effects against L. monocytogenes are significantly strengthened in low pH environments (pH < 5.5). Intrinsic factors such as pH, organic acid concentration, and LAB metabolic activity act synergistically through multiple mechanisms, including acidification, competitive exclusion, and bacteriocin synthesis, creating an hostile environment that restricts both the survival and proliferation of L. monocytogenes [9,20,25]. The critical role of environmental pH is highlight by the pathogen’s minimum growth threshold, ranging from pH 4.34 to 5.93, which means foods matrices with lower pH values can effectively suppress its growth [61]. Moreover, acidic conditions favour acid-tolerant LAB, enhancing their ecological competitiveness while simultaneously constraining pathogenic microorganisms [62].
L. mesenteroides subsp. mesenteroides is among the main Leuconostoc species naturally present in milk and dairy matrices, where it plays a key technological role by producing gas (mainly CO2) and flavour compounds characteristic of fermented products [63,64]. Beyond its technological relevance, other authors [65,66,67,68] demonstrated that L. mesenteroides exhibits strong antagonistic activity against L. monocytogenes, mainly through the synthesis of bacteriocins such as leucocin K7 and mesentericin Y105. Experimental studies provide clear evidence for this inhibitory capacity: Wadhawan et al. [65] reported complete inhibition of L. monocytogenes 2203 growth by L. mesenteroides isolated from the surface microbiota of wooden cheese ripening boards. Similarly, Borges et al. [69] showed that L. mesenteroides subsp. mesenteroides SJRP55 reduced L. monocytogenes counts by 0.7 log CFU/mL in fermented cream after 28 days of storage when cocultured with Lactococcus spp., whereas Lactococcus alone did not suppress the pathogen. In another study, a bacteriocin-producing L. mesenteroides isolated from traditional Chinese tofu exhibited strong anti-listerial activity in milk [66]. The combined effects of acidification, nutrient competition, and bacteriocin production create a hostile environment that restricts L. monocytogenes survival and growth [9,25]. The intentional use of LAB strains with well-known antimicrobial activity represents a promising biopreservation strategy for fermented dairy products, including cheese [55]. Such an approach enhances food safety, extends shelf life, and meets the growing consumer demand for minimally processed and naturally preserved foods [70].

3.2. Prediction of the Growth of L. monocytogenes in Goat’s Pasteurized Milk Cheese from a Milk Model Medium

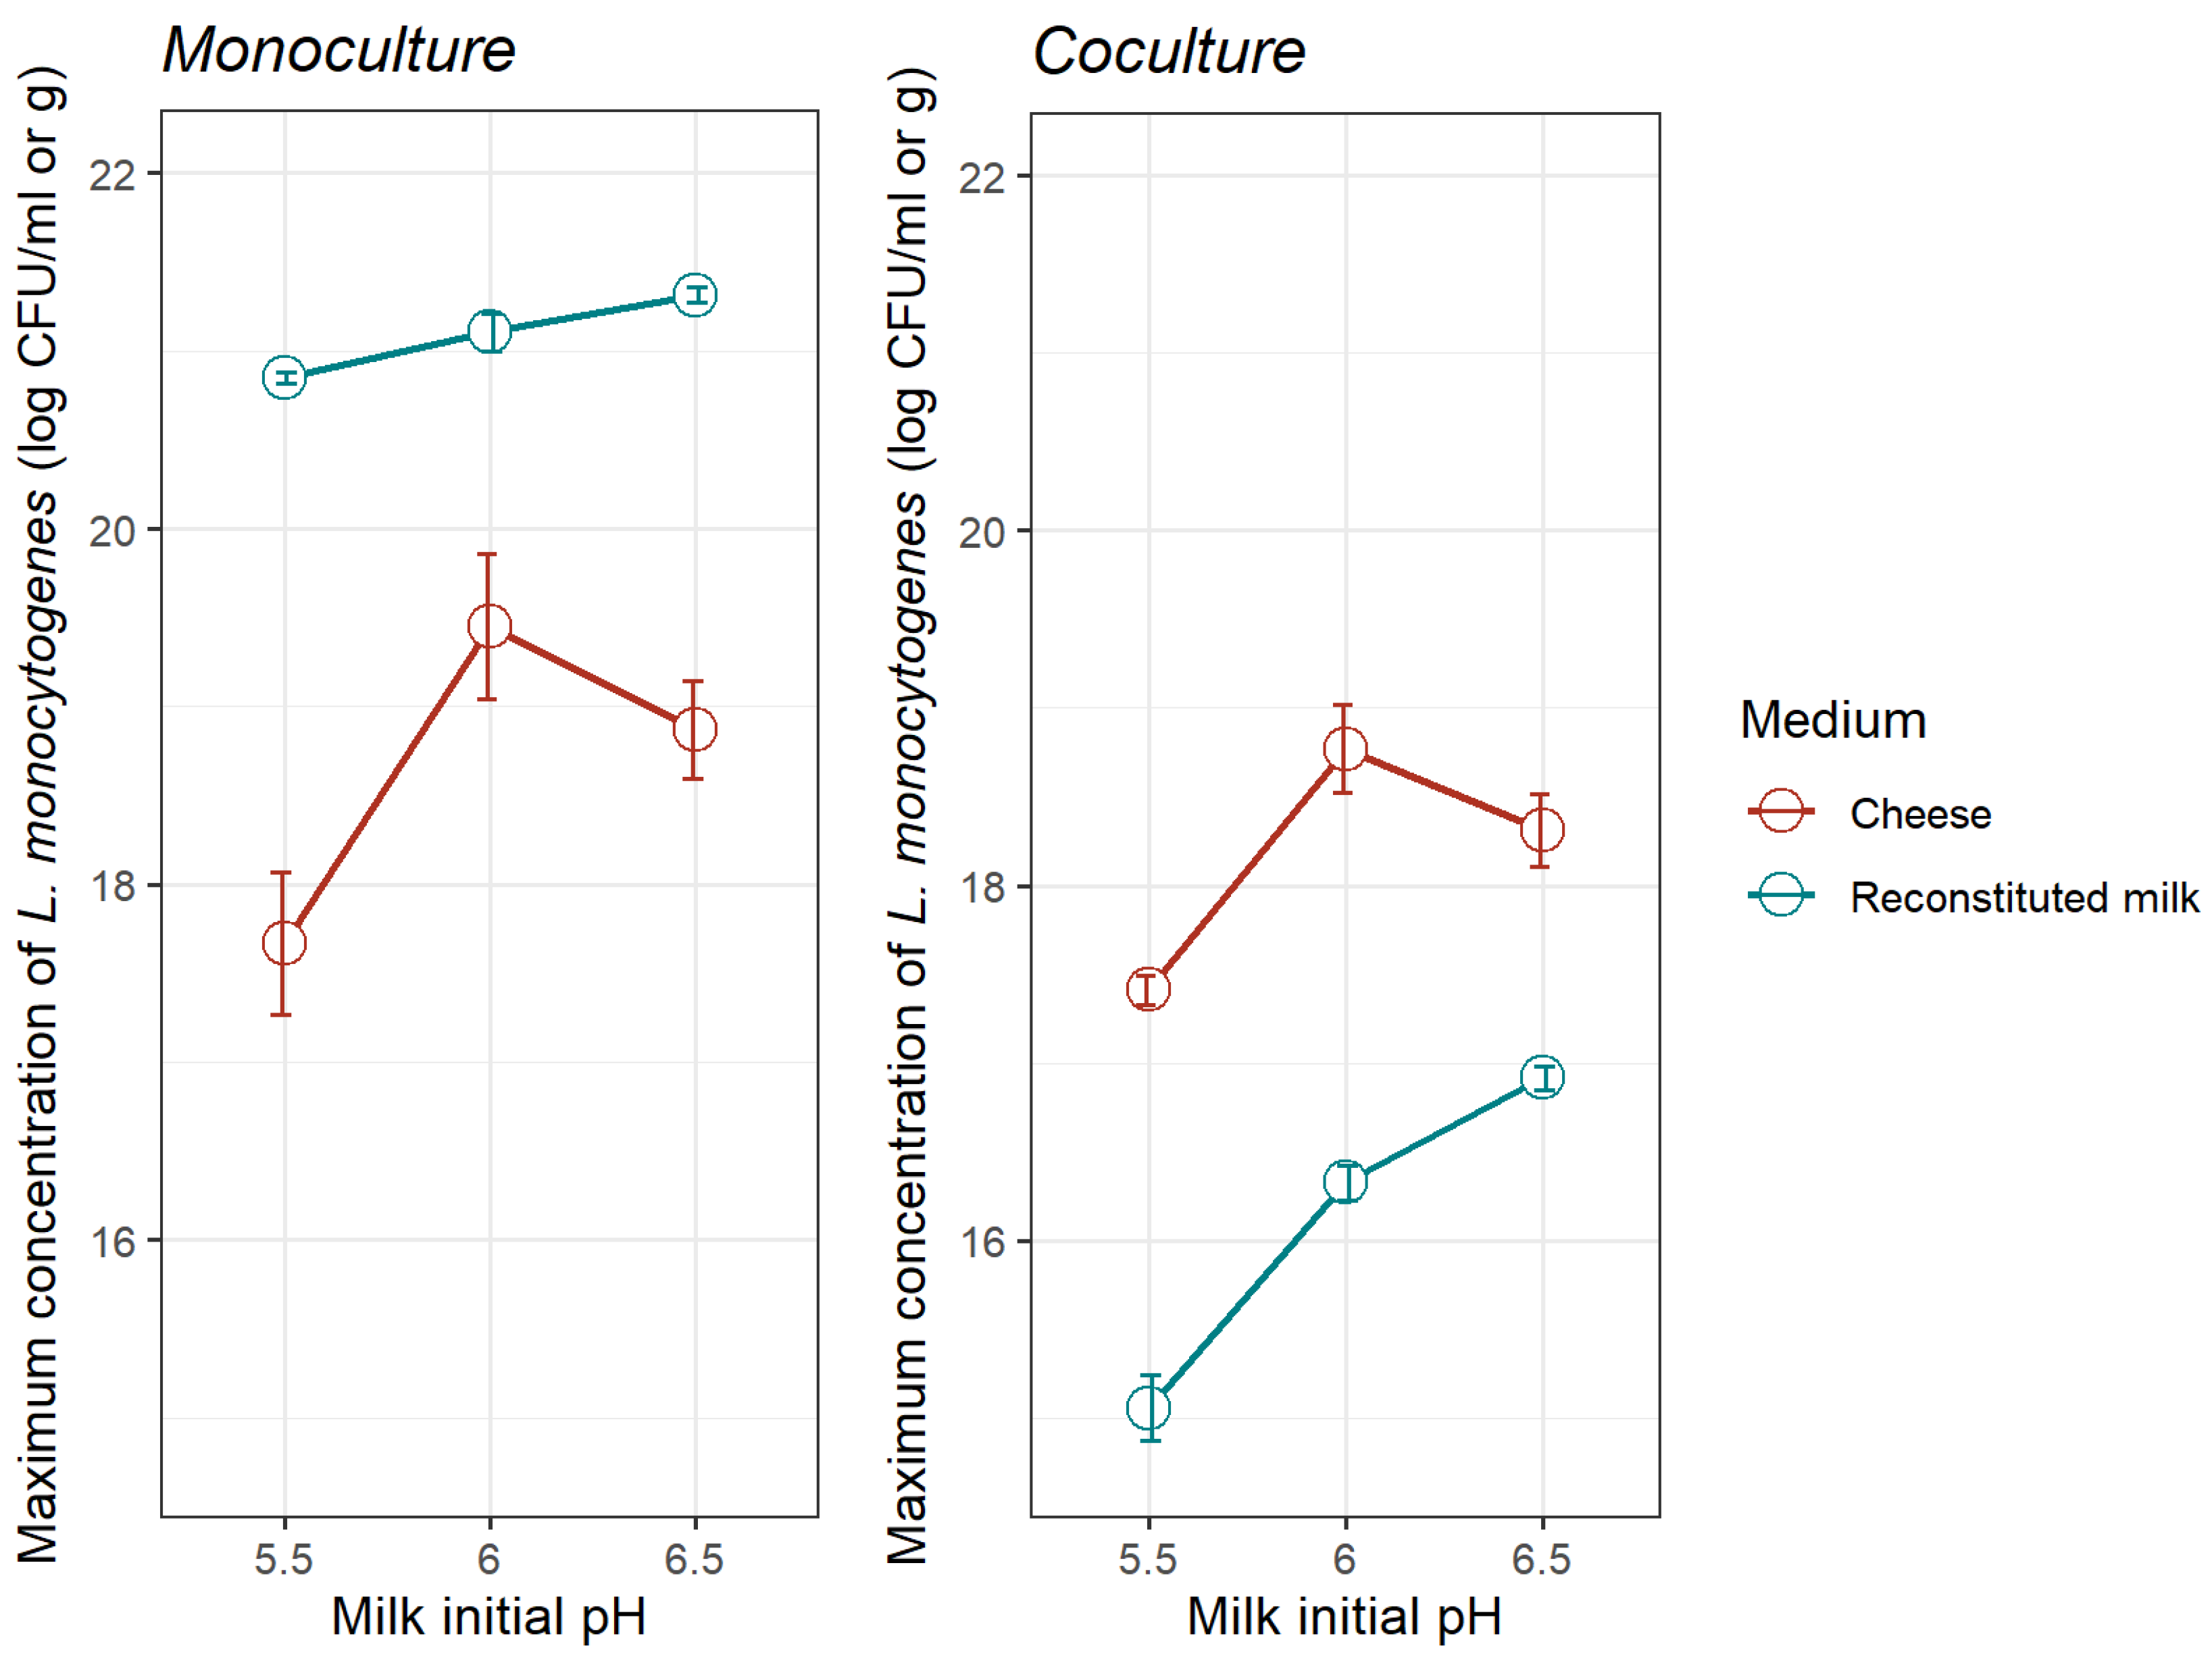
3.2.1. Comparison of L. monocytogenes Growth Kinetics in the Milk Model and Goat’s Pasteurized Milk Cheese in Monoculture and Coculture

The comparison of L. monocytogenes μopt in monoculture and coculture with L. mesenteroides in the milk model and goat’s pasteurized milk cheese at different milk initial pH values (5.5, 6.0, and 6.5) reveals clear matrix and pH dependent effects (Figure 2). In both matrices, milk and cheese, the monocultured L. monocytogenes consistently exhibited higher μopt (left panel) when compared to coculture (right), highlighting the inhibitory effect of L. mesenteroides, regardless of the milk initial pH level. As earlier discussed, L. monocytogenes growth is notably reduced at pH 5.5, reinforcing acidity as a stringent barrier to microbial proliferation in both matrices. Figure 2 also illustrates that the μopt estimates are systematically lower in cheese than in the milk model, reflecting the intrinsic structural constraints of the cheese matrix—namely reduced moisture, and limited nutrient diffusion, all of which restrict pathogen growth [71,72,73]. The solid nature of cheese imposes diffusion rate limitations that restrict bacterial proliferation [71]. Taken together, these observations demonstrate a synergistic effect whereby acidity, LAB-mediated competition, and cheese solid structure impose additional barriers to L. monocytogenes proliferation. These findings emphasize the importance of physicochemical factors in controlling pathogen behavior during cheeses maturation and highlight the strong bioprotective potential of L. mesenteroides under acidic conditions characteristic of fermented dairy systems.
The comparison of L. monocytogenes Ymax in the milk model and goat’s pasteurized milk cheese at initial pH values of 5.5, 6.0, and 6.5 reveals clear effects of matrix type and acidity (Figure 3). In both food media, monocultured L. monocytogenes reached significantly higher maximum populations at all tested milk initial pH levels than those obtained in coculture with L. mesenteroides. Acidic conditions, particularly at pH 5.5, restrict the pathogen’s final population density relative to higher pH values [23,74]. L. monocytogenes adapts to acid stress through several homeostasis mechanisms, including the F0F1-ATPase, the glutamic acid decarboxylase (GAD) system, and the arginine and agmatine deiminase, which increase cytoplasmic buffer capacity and help maintain intracellular pH [75,76,77,78]. Nevertheless, exposure to acidic conditions increases membrane permeability and disruption of cellular metabolism, ultimately reducing growth rates and population densities [79].
Unlike the μopt estimates, where the milk model systematically supported faster L. monocytogenes growth in comparison to cheese, regardless of the type of culture (Figure 2); the milk model supported higher Ymax of L. monocytogenes than cheese only in monoculture (Figure 3). When cocultured with L. monocytogenes, the pathogen’s reached higher carrying capacity in cheese than in the milk model, this can be explained by the fact that the inhibitory substances or antimicrobial metabolites produced by L. mesenteroides are of limited diffusion within the cheese solid matrix [71]. In monoculture, when there is no production of anti-listerial substances, L. monocytogenes population was able to reach a greater maximum carrying capacity in the liquid media (i.e., milk), as water availability is higher and nutrient diffusion less limiting [38]. Overall, these Ymax patterns highlight that the final pathogen load is determined by the combined influence of acidity, microbial competition, and the physical structure of medium.

3.2.2. Reduction Ratio of the Optimum Growth Rate of L. monocytogenes Due to the Presence of L. mesenteroides in the Milk Model and in Pasteurized Goat’s Milk Cheese

The RR assessment was carried out to determine whether the reductions in L. monocytogenes μopt and Ymax due to competition with L. mesenteroides are statistically different between the milk model and cheese. The reduction ratios (RR) of L. monocytogenes μopt in the milk model and goat’s pasteurized milk cheese at initial pH levels of 5.5, 6.0, and 6.5 consistently demonstrated the significant inhibitory effect exerted by L. mesenteroides; as implied by all the RR standard error bars laying well above the cut-off of 1.0 (no effect) (Figure 4). During milk fermentation or cheese maturation, L. mesenteroides was able to reduce by at least 1.5-fold the growth rate of L. monocytogenes. At the lowest evaluated milk initial pH of 5.5, the competition with the LAB reduced the growth rate of the pathogen in goat’s milk cheese by half (RR=2.10) (Figure 4).
Furthermore, the μopt RR patterns for the milk model and cheese did not differ significantly (overlapping standard error bars in Figure 4). This would suggest that the inhibitory capacity of L. mesenteroides on L. monocytogenes μopt could be only minimally influenced by the matrix-specific physicochemical differences. This reinforces the strong bioprotective potential of L. mesenteroides, whose antimicrobial activity, driven by organic acid production, competitive exclusion, and bacteriocin synthesis, limits pathogen proliferation in both liquid and solid dairy products [66,80]. Moreover, and very relevant from the viewpoint of predictive microbiology, the non-significant effect of matrix on the μopt RR establishes that the growth rates of L. monocytogenes obtained from a milk liquid model can be used to predict the pathogen’s development in a more complex solid matrix such as cheese.
An analogous RR assessment for Ymax is shown in Figure 4. Unlike the outcomes found for L. monocytogenes μopt, there is a significant difference between the milk model and cheese in the level of reduction in the maximum load of L. monocytogenes due to competition with L. mesenteroides (Figure 5). In the milk model, as the initial pH decreased, L. mesenteroides progressively reduced the pathogen’s maximum load. This is consistent with the fact that acidification limits the pathogen's carrying capacity [23].
However, whereas in milk the RR of Ymax was significantly higher than the cut-off value of 1.0, in cheese the mean RR was only marginally higher than 1.0, and, furthermore, the initial pH of milk was not demonstrated to moderate the level of reduction in the maximum load of L. monocytogenes due to competition. In other words, while L. mesenteroides exerts some inhibitory effect, it may not significantly reduce the final population density of L. monocytogenes during cheese maturation. This discrepancy likely reflects the distinct structural properties of the two matrices: liquid milk enables efficient diffusion of antimicrobial metabolites (e.g., lactic acid, bacteriocins) produced by L. mesenteroides, thereby enhancing inhibition, whereas the solid cheese matrix imposes diffusion limitations that restrict the spread and activity of these inhibitory compounds, ultimately diminishing their effect on the final pathogen load [9,71]. Although L. mesenteroides effectively suppressed L. monocytogenes growth rate in cheese, it did not reduce the pathogen’s maximum load capacity to the same extent as in milk.

3.2.3. Model Validation

Given the absence of a matrix effect, at least statistically, on the extent of reduction in the growth rate of L. monocytogenes by the LAB action, there was a theoretical basis to determine a conversion factor (Cf) for estimating the optimum growth rate of L. monocytogenes in goat’s milk cheese from the optimum growth rate in the milk model. This can be understood as the validation of a model obtained from broth in actual food.
According to Equation (8), a significant C f can be interpreted as evidence that growth data obtained in the milk liquid medium can be employed to predict the pathogen’s kinetics in goat’s milk cheese. The estimated value (√Cf = 0.751 ± 0.0108) indicates that the pathogen grows in cheese at approximately 56% (0.7512) of the rate observed in milk (Figure 6), a reduction likely driven by intrinsic matrix characteristics such as lower moisture content, higher salt content, and diffusion rate limitations [71]. In practical terms, the determination of Cf enables prediction of L. monocytogenes behavior in cheese based on milk data, reducing the number of experimental trials required in the cheese matrix. Moreover, the linear regression suggested that type of culture (monoculture and coculture) did not significantly influence the conversion factor (p = 0.320), supporting its applicability. However, the non-significance of this term must be cautiously interpreted, since only six data points were available for fitting this model, and in addition the data were heavily clustered by culture type (Figure 6).
The strong agreement between predicted and observed data is evidenced by a high coefficient of determination (R² = 0.9987), demonstrating a highly precise Cf estimate, which will positively impact on it predictive accuracy. For context, previous predictive microbiology studies have reported concordance rates of approximately 92% and 91.3% between model predictions and experimental data, values considered acceptable indicators of model reliability [71]. Overall, the conversion factor provides a practical and scientifically robust tool to predict L. monocytogenes growth kinetics in cheese from milk data.
The validation comparing the experimental growth data of L. monocytogenes in goat’s milk cheese at 12 ºC with the dynamic prediction, using the growth model in the milk model adjusted at pH 6.0, demonstrates strong agreement (Figure 7). The experimental growth data (blue markers) closely match the model’s predictions (bold blue line), with most data points falling within the 95 % prediction bands, which hints the model’s robustness and ability to predict dynamic growth kinetics in complex cheese matrices.
The two validations jointly demonstrate two premises: (1) that the growth rate of L. monocytogenes determined in the milk model can be used for predicting its growth in pasteurized cheese, if the conversion factor is used; and (2) that the pH-driven dynamic model proposed can represent well the pathogen’s kinetic changes in the milk model during fermentation, and in the cheese matrix during maturation.
Such progressive pH decline over time is an important variable to take into account because it is a key environmental constraint that limits L. monocytogenes proliferation [22,23,45,81]. Consistently, monitoring pH evolution and ensuring appropriate hygienic practices throughout cheesemaking and ripening are essential indicators of microbial safety [53,82]. Overall, this validation demonstrates that pH-driven dynamic models offer reliable and quantitative tools for predicting L. monocytogenes behavior in complex fermenting dairy matrices, supporting their application in microbial risk assessment and product safety optimization.

5. Conclusions

The present study assessed the growth kinetics of L. monocytogenes in goat’s pasteurized milk cheese, focusing on the inhibitory role of Leuconostoc mesenteroides across different milk initial pH conditions; in order to assess the validity of analogous growth parameters previously obtained using a milk model medium. A newly proposed pH-driven dynamic model accurately predicted L. monocytogenes growth dynamics in both monoculture and coculture conditions across pH ranges (5.5, 6.0, and 6.5) during cheese maturation. The findings clearly demonstrated that milk initial pH is a pivotal factor driving pathogen behavior, strongly modulating the extent of inhibition and the competitive advantage of LAB, with pH 5.5 showing the strongest suppression of L. monocytogenes growth rate in cheese. While L. mesenteroides notably reduced the growth rates of L. monocytogenes in both liquid and solid matrices; its impact on the pathogen’s maximum carrying capacity was by far more pronounced in milk, likely to arise from the better diffusion of the inhibitory compounds in liquid systems. Given the absence of a matrix effect on the competition-mediated reduction in L. monocytogenes growth rate, a milk-to-cheese conversion factor (√Cf =0.75) could be estimated and then validated; therefore, setting the ground to reliably extrapolate L. monocytogenes growth from a milk broth model to actual cheese. Overall, our findings support the use of L. mesenteroides as a natural protective culture along with the pre-acidification of pasteurized milk to synergistically enhance the microbiological safety of cheese. This work provides a practical and scientifically validated tool to streamline experimentation and strengthen risk assessment applications for dairy foods, reducing the need for laborious cheese inoculation experiments. From an industrial perspective, L. mesenteroides represents a promising functional adjunct culture for short-fermentation or short-maturation dairy products, such as goat’s pasteurized milk cheeses and fermented milks, thereby supporting growing demand for naturally processed, clean-label foods. Overall, this integrated approach combining bioprotective cultures, acidification, and predictive modelling provides a viable, natural strategy to enhance microbial safety in RTE dairy products, positioning L. mesenteroides as an effective adjunct culture to reduce listeriosis risk while adhering to low-additive processing trends.

Author Contributions

Conceptualization, U.G.-B and V.C.; methodology, V.C., and U.G.-B.; software, U.G.-B.; validation, Y.L., V.C. and U.G.-B.; formal analysis, V.C. and U.G.-B.; investigation, Y.L., M.Z., and U.G.-B.; resources, V.C. and U.G.-B.; data curation, Y.L. and U.G.-B; writing—original draft preparation, Y.L., and U.G.-B.; writing—review and editing, Y.L., A.M.d.A., V.C. and U.G.-B.; visualization, Y.L., V.C., and U.G.-B.; supervision, A.M.d.A., V.C. and U.G.-B.; project administration, V.C. and U.G.-B.; funding acquisition, Y.L., V.C. and U.G.-B. All authors have read and agreed to the published version of the manuscript.

Funding

This work was supported by national funds through FCT/MCTES (PIDDAC): CIMO UID/00690/2025 (10.54499/UID/00690/2025) and UID/PRR/00690/2025 (10.54499/UID/PRR/00690/2025); SusTEC, LA/P/0007/2020 (DOI: 10.54499/LA/P/0007/2020) and by the PAS-AGRO-PAS project (The Making of Fragile Agro-ecosystems Productive, Adaptive and Sustainable: Multifunctional Agro-pastoralism; PRIMA/0014/2022). Y.L. acknowledges the financial support provided by FCT through the Ph.D. grant PRT/BD/152089/2021 (https://doi.org/10.54499/PRT/BD/152089/2021; accessed on 3 October 2025). A. M. de Almeida acknowledges funding by national funds through FCT—Fundação para a Ciência e a Tecnologia, I.P., under the projects UID/04129/2025 of LEAF-Linking Landscape, Environment, Agriculture and Food, Research Unit and LA/P/0092/2020 of Associate Laboratory TERRA.

Data Availability Statement

Raw data from challenge tests can be shared if the request is properly justified and data ownership credits provided.

Conflicts of Interest

The authors declare no conflicts of interest.

References

  1. Kontodimos, I.; Chatzimanoli, E.; Kasapidou, E.; Basdagianni, Z.; Karatzia, M.-A.; Amanatidis, M.; Margaritis, N. Characterization of Bioactive Compounds and Element Content in Goat Milk and Cheese Products. Biol. Life Sci. Forum 2023, 26, 98. [CrossRef]
  2. Tilocca, B.; Soggiu, A.; Iavarone, F.; Greco, V.; Putignani, L.; Ristori, M.V.; Macari, G.; Spina, A.A.; Morittu, V.M.; Ceniti, C.; et al. The Functional Characteristics of Goat Cheese Microbiota from a One-Health Perspective. Int. J. Mol. Sci. 2022, 23, 14131. [CrossRef]
  3. Quigley, L.; O’Sullivan, O.; Stanton, C.; Beresford, T.P.; Ross, R.P.; Fitzgerald, G.F.; Cotter, P.D. The Complex Microbiota of Raw Milk. FEMS Microbiol. Rev. 2013, 37, 664–698. [CrossRef]
  4. Lomonaco, S.; Decastelli, L.; Nucera, D.; Gallina, S.; Manila Bianchi, D.; Civera, T. Listeria monocytogenes in Gorgonzola: Subtypes, Diversity and Persistence over Time. Int. J. Food Microbiol. 2009, 128, 516–520. [CrossRef]
  5. Martinez-Rios, V.; Gkogka, E.; Dalgaard, P. Predicting Growth of Listeria monocytogenes at Dynamic Conditions during Manufacturing, Ripening and Storage of Cheeses – Evaluation and Application of Models. Food Microbiol. 2020, 92, 103578. [CrossRef]
  6. Gonzales-Barron, U.; Cadavez, V.; Guillier, L.; Sanaa, M. A Critical Review of Risk Assessment Models for Listeria monocytogenes in Dairy Products. Foods 2023, 12, 4436. [CrossRef]
  7. Bashiry, M.; Javanmardi, F.; Taslikh, M.; Sheidaei, Z.; Sadeghi, E.; Abedi, A.-S.; Mirza Alizadeh, A.; Hashempour-Baltork, F.; Beikzadeh, S.; Riahi, S.M.; et al. Listeria monocytogenes in Dairy Products of the Middle East Region: A Systematic Review, Meta-Analysis, and Meta-Regression Study. Iran. J. Public Health 2022, 51, 292–305. [CrossRef]
  8. Morandi, S.; Silvetti, T.; Battelli, G.; Brasca, M. Can Lactic Acid Bacteria Be an Efficient Tool for Controlling Listeria monocytogenes Contamination on Cheese Surface? The Case of Gorgonzola Cheese. Food Control 2019, 96, 499–507. [CrossRef]
  9. Webb, L.; Ma, L.; Lu, X. Impact of Lactic Acid Bacteria on the Control of Listeria monocytogenes in Ready-to-Eat Foods. Food Qual. Saf. 2022, 6, fyac045. [CrossRef]
  10. Morgan, F.; Bonnin, V.; Mallereau, M.-P.; Perrin, G. Survival of Listeria monocytogenes during Manufacture, Ripening and Storage of Soft Lactic Cheese Made from Raw Goat Milk. Int. J. Food Microbiol. 2001, 64, 217–221. [CrossRef]
  11. European Food Safety Authority (EFSA); European Centre for Disease Prevention and Control (ECDC) The European Union One Health 2022 Zoonoses Report. EFSA J. 2023, 21, e8442. [CrossRef]
  12. Jordan, K.; Hunt, K.; Lourenco, A.; Pennone, V. Listeria monocytogenes in the Food Processing Environment. Curr. Clin. Microbiol. Rep. 2018, 5, 106–119. [CrossRef]
  13. Saraoui, T.; Leroi, F.; Chevalier, F.; Cappelier, J.-M.; Passerini, D.; Pilet, M.-F. Bioprotective Effect of Lactococcus piscium CNCM I-4031 Against Listeria monocytogenes Growth and Virulence. Front. Microbiol. 2018, 9, 1564. [CrossRef]
  14. Morandi, S.; Silvetti, T.; Vezzini, V.; Morozzo, E.; Brasca, M. How We Can Improve the Antimicrobial Performances of Lactic Acid Bacteria? A New Strategy to Control Listeria monocytogenes in Gorgonzola Cheese. Food Microbiol. 2020, 90. [CrossRef]
  15. Buchanan, R.L.; Gorris, L.G.M.; Hayman, M.M.; Jackson, T.C.; Whiting, R.C. A Review of Listeria monocytogenes: An Update on Outbreaks, Virulence, Dose-Response, Ecology, and Risk Assessments. Food Control 2017, 75, 1–13. [CrossRef]
  16. Liang, J.-J.; He, X.-Y.; Ye, H. Rhombencephalitis Caused by Listeria monocytogenes with Hydrocephalus and Intracranial Hemorrhage: A Case Report and Review of the Literature. WORLD J. Clin. CASES 2019, 7, 538–546. [CrossRef]
  17. Commission Regulation (EC) No 2073/2005 COMMISSION REGULATION (EC) No 2073/2005 of 15 November 2005 on Microbiological Criteria for Foodstuffs 2005.
  18. Organization, W.H. Risk Assessment of Listeria monocytogenes in Ready-to-Eat Foods: Technical Report; Microbiological Risk Assessment Series No. 5; World Health Organization: Geneva, 2004; ISBN 978-92-4-156262-1.
  19. Engstrom, S.K.; Cheng, C.; Seman, D.; Glass, K.A. Growth of Listeria monocytogenes in a Model High-Moisture Cheese on the Basis of pH, Moisture, and Acid Type. J. Food Prot. 2020, 83, 1335–1344. [CrossRef]
  20. Bansal, V.; Veena, N. Understanding the Role of pH in Cheese Manufacturing: General Aspects of Cheese Quality and Safety. J. Food Sci. Technol. 2024, 61, 16–26. [CrossRef]
  21. Ho, V.T.T.; Lo, R.; Bansal, N.; Turner, M.S. Characterisation of Lactococcus lactis Isolates from Herbs, Fruits and Vegetables for Use as Biopreservatives against Listeria monocytogenes in Cheese. Food Control 2018, 85, 472–483. [CrossRef]
  22. Le Marc, Y.; Huchet, V.; Bourgeois, C.M.; Guyonnet, J.P.; Mafart, P.; Thuault, D. Modelling the Growth Kinetics of Listeria as a Function of Temperature, pH and Organic Acid Concentration. Int. J. Food Microbiol. 2002, 73, 219–237. [CrossRef]
  23. Tirloni, E.; Stella, S.; Bernardi, C.; Dalgaard, P.; Rosshaug, P.S. Predicting Growth of Listeria monocytogenes in Fresh Ricotta. Food Microbiol. 2019, 78, 123–133. [CrossRef]
  24. Yap, P.-C.; MatRahim, N.-A.; AbuBakar, S.; Lee, H.Y. Antilisterial Potential of Lactic Acid Bacteria in Eliminating Listeria monocytogenes in Host and Ready-to-Eat Food Application. Microbiol. Res. 2021, 12, 234–257. [CrossRef]
  25. Martín, I.; Rodríguez, A.; Delgado, J.; Córdoba, J.J. Strategies for Biocontrol of Listeria monocytogenes Using Lactic Acid Bacteria and Their Metabolites in Ready-to-Eat Meat- and Dairy-Ripened Products. Foods 2022, 11, 542. [CrossRef]
  26. Pessione, E. Lactic Acid Bacteria Contribution to Gut Microbiota Complexity: Lights and Shadows. Front. Cell. Infect. Microbiol. 2012, 2, 86. [CrossRef]
  27. European Food Safety Authority (EFSA). Introduction of a Qualified Presumption of Safety (QPS) Approach for Assessment of Selected Microorganisms Referred to EFSA - Opinion of the Scientific Committee. EFSA J. 2007, 5, 587. [CrossRef]
  28. Kasra-Kermanshahi, R.; Mobarak-Qamsari, E. Inhibition Effect of Lactic Acid Bacteria against Food Born Pathogen, Listeria monocytogenes. Appl. Food Biotechnol. 2015, 2, 11–19. [CrossRef]
  29. Castellano, P.; Pérez Ibarreche, M.; Blanco Massani, M.; Fontana, C.; Vignolo, G.M. Strategies for Pathogen Biocontrol Using Lactic Acid Bacteria and Their Metabolites: A Focus on Meat Ecosystems and Industrial Environments. Microorganisms 2017, 5. [CrossRef]
  30. Jurášková, D.; Ribeiro, S.C.; Silva, C.C.G. Exopolysaccharides Produced by Lactic Acid Bacteria: From Biosynthesis to Health-Promoting Properties. Foods 2022, 11, 156. [CrossRef]
  31. Martín, I.; Rodríguez, A.; Alía, A.; Martínez-Blanco, M.; Lozano-Ojalvo, D.; Córdoba, J.J. Control of Listeria monocytogenes Growth and Virulence in a Traditional Soft Cheese Model System Based on Lactic Acid Bacteria and a Whey Protein Hydrolysate with Antimicrobial Activity. Int. J. Food Microbiol. 2022, 361. [CrossRef]
  32. Ahansaz, N.; Tarrah, A.; Pakroo, S.; Corich, V.; Giacomini, A. Lactic Acid Bacteria in Dairy Foods: Prime Sources of Antimicrobial Compounds. Fermentation 2023, 9, 964. [CrossRef]
  33. Egan, K.; Field, D.; Rea, M.C.; Ross, R.P.; Hill, C.; Cotter, P.D. Bacteriocins: Novel Solutions to Age Old Spore-Related Problems? Front. Microbiol. 2016, 7. [CrossRef]
  34. Lund, P.A.; De Biase, D.; Liran, O.; Scheler, O.; Mira, N.P.; Cetecioglu, Z.; Fernández, E.N.; Bover-Cid, S.; Hall, R.; Sauer, M.; et al. Understanding How Microorganisms Respond to Acid pH Is Central to Their Control and Successful Exploitation. Front. Microbiol. 2020, 11, 556140. [CrossRef]
  35. Loforte, Y.; Zanzan, M.; Cadavez, V.; Gonzales-Barron, U. Dynamic Modelling of Listeria monocytogenes Growth in a Milk Model Medium as Affected by pH and Selected Lactic Acid Bacteria Strains. Foods 2025, 14, 3999. [CrossRef]
  36. Silva, B.N.; Faria, A.S.; Cadavez, V.; Teixeira, J.A.; Gonzales-Barron, U. Technological Potential of Lactic Acid Bacteria Isolated from Portuguese Goat’s Raw Milk Cheeses. In Proceedings of the Foods 2021; MDPI, October 14 2021; p. 9.
  37. Silva, B.N.; Fernandes, N.; Carvalho, L.; Faria, A.S.; Teixeira, J.A.; Rodrigues, C.; Gonzales-Barron, U.; Cadavez, V. Lactic Acid Bacteria from Artisanal Raw Goat Milk Cheeses: Technological Properties and Antimicrobial Potential. Ital. J. Food Saf. 2023, 12, 11559. [CrossRef]
  38. Schvartzman, M.S.; Belessi, X.; Butler, F.; Skandamis, P.; Jordan, K. Comparison of Growth Limits of Listeria monocytogenes in Milk, Broth and Cheese: Comparison of Growth Limits of L. monocytogenes. J. Appl. Microbiol. 2010, no-no. [CrossRef]
  39. Silva, B.N.; Coelho-Fernandes, S.; Teixeira, J.A.; Cadavez, V.; Gonzales-Barron, U. Dynamic Modelling to Describe the Effect of Plant Extracts and Customised Starter Culture on Staphylococcus aureus Survival in Goat’s Raw Milk Soft Cheese. Foods 2023, 12, 2683. [CrossRef]
  40. ISO 11290-1:2017; ISO 11290-1: Microbiology of the Food Chain — Horizontal Method for the Detection and Enumeration of Listeria monocytogenes and of Listeria Spp. — Part 1: Detection Method. International Organization for Standardization (ISO): Geneva, Switzerland, 2017.
  41. ISO 15214:1998; ISO 15214: 4: Microbiology of Food and Animal Feeding Stuffs — Horizontal Method for the Emumeration of Mesophilic Lactic Acid Bacteria — Colony-Count Technique at 30 °C. International Organization for Standardization (ISO): Genève, Switzerland, 1998.
  42. Campagnollo, F.B.; Gonzales-Barron, U.; Pilão Cadavez, V.A.; Sant’Ana, A.S.; Schaffner, D.W. Quantitative Risk Assessment of Listeria monocytogenes in Traditional Minas Cheeses: The Cases of Artisanal Semi-Hard and Fresh Soft Cheeses. Food Control 2018, 92, 370–379. [CrossRef]
  43. Lau, S.; Trmcic, A.; Martin, N.H.; Wiedmann, M.; Murphy, S.I. Development of a Monte Carlo Simulation Model to Predict Pasteurized Fluid Milk Spoilage Due to Post-Pasteurization Contamination with Gram-Negative Bacteria. J. Dairy Sci. 2022, 105, 1978–1998. [CrossRef]
  44. R: The R Project for Statistical Computing Available online: https://www.r-project.org/ (accessed on 1 October 2025).
  45. Rosso, L.; Lobry, J.R.; Bajard, S.; Flandrois, J.P. Convenient Model To Describe the Combined Effects of Temperature and pH on Microbial Growth. Appl. Environ. Microbiol. 1995, 61, 610–616. [CrossRef]
  46. Listeria Available online: https://www.asae.gov.pt/seguranca-alimentar/riscos-biologicos/listeria-monocytogenes.aspx (accessed on 16 November 2025).
  47. Faezi-Ghasemi, M.; Kazemi, S. Effect of Sub-Lethal Environmental Stresses on the Cell Survival and Antibacterial Susceptibility of Listeria monocytogenes PTCC1297; Zahedan Journal of Research in Medical Sciences, 2013.
  48. Jin, Q.; Kirk, M.F. pH as a Primary Control in Environmental Microbiology: 1. Thermodynamic Perspective. Front. Environ. Sci. 2018, 6. [CrossRef]
  49. Wiktorczyk-Kapischke, N.; Skowron, K.; Grudlewska-Buda, K.; Wałecka-Zacharska, E.; Korkus, J.; Gospodarek-Komkowska, E. Adaptive Response of Listeria monocytogenes to the Stress Factors in the Food Processing Environment. Front. Microbiol. 2021, 12. [CrossRef]
  50. Martín, I.; Córdoba, J.J.; Rodríguez, A. Effect of Acidic Conditions on the Growth and Expression of Two Virulence Genes of Listeria monocytogenes Serotype 4b. Res. Microbiol. 2023, 174, 104042. [CrossRef]
  51. Bergis, H.; Bonanno, L.; Asséré, A.; Lombard, B. On Challenge Tests and Durability Studies for Assessing Shelf-Life of Ready-to-Eat Foods Related to Listeria monocytogenes. 2021.
  52. Kapetanakou, A.E.; Gkerekou, M.A.; Vitzilaiou, E.S.; Skandamis, P.N. Assessing the Capacity of Growth, Survival, and Acid Adaptive Response of Listeria monocytogenes during Storage of Various Cheeses and Subsequent Simulated Gastric Digestion. Int. J. Food Microbiol. 2017, 246, 50–63. [CrossRef]
  53. Leong, W.M.; Geier, R.; Engstrom, S.; Ingham, S.; Ingham, B.; Smukowski, M. Growth of Listeria monocytogenes, Salmonella spp., Escherichia Coli O157:H7, and Staphylococcus Aureus on Cheese during Extended Storage at 25 Degrees C. J. Food Prot. 2014, 77, 1275–1288. [CrossRef]
  54. Ariahu, C.C.; Igyor, M.A.; Umeh, E.U. Growth kinetics of Listeria monocytogenes in soymilk of varying initial pH and Sugar Concentrations. J. Food Qual. 2010, 33, 545–558. [CrossRef]
  55. Gonzales-Barron, U.; Campagnollo, F.B.; Schaffner, D.W.; Sant’Ana, A.S.; Cadavez, V.A.P. Behavior of Listeria monocytogenes in the Presence or Not of Intentionally-Added Lactic Acid Bacteria during Ripening of Artisanal Minas Semi-Hard Cheese. Food Microbiol. 2020, 91. [CrossRef]
  56. Cadavez, V.A.P.; Campagnollo, F.B.; Silva, R.A.; Duffner, C.M.; Schaffner, D.W.; Sant’Ana, A.S.; Gonzales-Barron, U. A Comparison of Dynamic Tertiary and Competition Models for Describing the Fate of Listeria monocytogenes in Minas Fresh Cheese during Refrigerated Storage. Food Microbiol. 2019, 79, 48–60. [CrossRef]
  57. Mejlholm, O.; Dalgaard, P. Modelling and Predicting the Simultaneous Growth of Listeria monocytogenes and Psychrotolerant Lactic Acid Bacteria in Processed Seafood and Mayonnaise-Based Seafood Salads. Food Microbiol. 2015, 46, 1–14. [CrossRef]
  58. Lambert, R.J.W. A New Model for the Effect of pH on Microbial Growth: An Extension of the Gamma Hypothesis. J. Appl. Microbiol. 2011, 110, 61–68. [CrossRef]
  59. Nunes Silva, B.; Cadavez, V.; Teixeira, J.A.; Ellouze, M.; Gonzales-Barron, U. Cardinal Parameter Meta-Regression Models Describing Listeria monocytogenes Growth in Broth. Food Res. Int. 2020, 136, 109476. [CrossRef]
  60. Loforte, Y.; Fernandes, N.; de Almeida, A.M.; Cadavez, V.; Gonzales-Barron, U. A Meta-Analysis on the In Vitro Antagonistic Effects of Lactic Acid Bacteria from Dairy Products on Foodborne Pathogens. Foods 2025, 14, 907. [CrossRef]
  61. Augustin, J.-C.; Czarnecka-Kwasiborski, A. Single-Cell Growth Probability of Listeria monocytogenes at Suboptimal Temperature, pH, and Water Activity. Front. Microbiol. 2012, 3. [CrossRef]
  62. Barbosa, J.; Borges, S.; Teixeira, P. Influence of Sub-Lethal Stresses on the Survival of Lactic Acid Bacteria after Spray-Drying in Orange Juice. Food Microbiol. 2015, 52, 77–83. [CrossRef]
  63. Coelho, M.C.; Malcata, F.X.; Silva, C.C.G. Lactic Acid Bacteria in Raw-Milk Cheeses: From Starter Cultures to Probiotic Functions. Foods 2022, 11, 2276. [CrossRef]
  64. Hemme, D.; Foucaud-Scheunemann, C. Leuconostoc, characteristics, use in dairy technology and prospects in functional foods. Int. Dairy J. 2004, 14, 467–494. [CrossRef]
  65. Wadhawan, K.; Steinberger, A.; Rankin, S.; Suen, G.; Czuprynski, C. Inhibition of Listeria monocytogenes by Broth Cultures of Surface Microbiota of Wooden Boards Used in Cheese Ripening. Appl. Sci. 2023, 13, 5872. [CrossRef]
  66. Chi, H. Identification and Characterization of a Bacteriocin-Like Substance, Produced by Leuconostoc mesenteroides as a Bio-Preservative Against Listeria monocytogenes. Int. J. Nutr. Food Sci. 2017, 6, 167. [CrossRef]
  67. Héchard, Y.; Dérijard, B.; Letellier, F.; Cenatiempo, Y. Characterization and Purification of Mesentericin Y105, an Anti-Listeria Bacteriocin from Leuconostoc mesenteroides. Microbiology 1992, 138, 2725–2731. [CrossRef]
  68. Shi, F.; Wang, Y.; Li, Y.; Wang, X. Mode of Action of Leucocin K7 Produced by Leuconostoc mesenteroides K7 against Listeria monocytogenes and Its Potential in Milk Preservation. Biotechnol. Lett. 2016, 38, 1551–1557. [CrossRef]
  69. Borges, D.O.; Matsuo, M.M.; Bogsan, C.S.B.; Silva, T.F. da; Casarotti, S.N.; Penna, A.L.B. Leuconostoc mesenteroides subsp. mesenteroides SJRP55 Reduces Listeria monocytogenes Growth and Impacts on Fatty Acids Profile and Conjugated Linoleic Acid Content in Fermented Cream. LWT 2019, 107, 264–271. [CrossRef]
  70. Silva, B.N.; Coelho-Fernandes, S.; Teixeira, J.A.; Cadavez, V.; Gonzales-Barron, U. Dynamic Modelling to Describe the Effect of Plant Extracts and Customised Starter Culture on Staphylococcus aureus Survival in Goat’s Raw Milk Soft Cheese. Foods 2023, 12, 2683. [CrossRef]
  71. Schvartzman, M.S.; Belessi, X.; Butler, F.; Skandamis, P.; Jordan, K. Comparison of Growth Limits of Listeria monocytogenes in Milk, Broth and Cheese: Comparison of Growth Limits of L. monocytogenes. J. Appl. Microbiol. 2010, no-no. [CrossRef]
  72. Schvartzman, M.S.; Belessi, C.; Butler, F.; Skandamis, P.N.; Jordan, K.N. Effect of pH and Water Activity on the Growth Limits of Listeria monocytogenes in a Cheese Matrix at Two Contamination Levels. J. Food Prot. 2011, 74, 1805–1813. [CrossRef]
  73. Nuñez, M.; Calzada, J.; Olmo, A. del. High Pressure Processing of Cheese: Lights, Shadows and Prospects. Int. Dairy J. 2020, 100, 104558. [CrossRef]
  74. Murphy, P.M.; Rea, M.C.; Harrington, O. Development of a Predictive Model for Growth of Listeria monocytogenes in a Skim Milk Medium and Validation Studies in a Range of Dairy Products. J. Appl. Bacteriol. 1996, 80, 557–564. [CrossRef]
  75. Lund, P.; Tramonti, A.; De Biase, D. Coping with Low pH: Molecular Strategies in Neutralophilic Bacteria. FEMS Microbiol. Rev. 2014, 38, 1091–1125. [CrossRef]
  76. Cotter, P.D.; Ryan, S.; Gahan, C.G.M.; Hill, C. Presence of GadD1 glutamate decarboxylase in selected Listeria monocytogenes strains is associated with an ability to grow at low pH. Appl. Environ. Microbiol. 2005, 71, 2832–2839. [CrossRef]
  77. Cotter, P.D.; O’reilly, K.; Hill, C. Role of the glutamate decarboxylase acid resistance system in the survival of Listeria monocytogenes LO28 in low pH foods. J. Food Prot. 2001, 64, 1362–1368. [CrossRef]
  78. Cotter, P.D.; Gahan, C.G.M.; Hill, C. Analysis of the role of the Listeria monocytogenes F0F1-ATPase operon in the acid tolerance response. Int. J. Food Microbiol. 2000, 60, 137–146. [CrossRef]
  79. Maloney, P.C. Microbes and Membrane Biology. FEMS Microbiol. Lett. 1990, 87, 91–102. [CrossRef]
  80. Scatassa, M.L.; Gaglio, R.; Cardamone, C.; Macaluso, G.; Arcuri, L.; Todaro, M.; Mancuso, I. Anti-Listeria Activity of Lactic Acid Bacteria in Two Traditional Sicilian Cheeses. Ital. J. Food Saf. 2017, 6, 6191. [CrossRef]
  81. Schvartzman, M.S.; Gonzalez-Barron, U.; Butler, F.; Jordan, K. Modeling the Growth of Listeria monocytogenes on the Surface of Smear- or Mold-Ripened Cheese. Front. Cell. Infect. Microbiol. 2014, 4. [CrossRef]
  82. Kongo, J.M. Lactic Acid Bacteria as Starter-Cultures for Cheese Processing: Past, Present and Future Developments. In Lactic Acid Bacteria - R & D for Food, Health and Livestock Purposes; IntechOpen, 2013 ISBN 978-953-51-0955-6.
Figure 1. Effect of L. mesenteroides on the optimum growth rate (left) and maximum concentration of L. monocytogenes (right) in cheeses elaborated with pasteurized goat’s milk adjusted at different pH, as estimated by the pH-driven dynamic model. Bars represent ± standard error of the parameter estimate.
Preprints 189102 g001
Figure 2. Comparison of the optimum growth rates of L. monocytogenes in reconstituted milk model medium and goat’s pasteurized milk cheese, obtained in monoculture (left) and in coculture with Leuconostoc mesenteroides (right). Bars represent ± standard error of the estimate.
Preprints 189102 g002
Figure 3. Comparison of the maximum concentration of L. monocytogenes in reconstituted milk model medium and goat’s pasteurized milk cheese, obtained in monoculture (left) and in coculture with Leuconostoc mesenteroides (right). Bars represent ± standard error of the estimate.
Preprints 189102 g003
Figure 4. Reduction ratio of the optimum growth rate of L. monocytogenes due to the presence of L. mesenteroides in reconstituted milk model medium and in goat’s pasteurized milk cheese, as affected by the initial pH of milk. Bars represent ± standard of the estimate.
Preprints 189102 g004
Figure 5. Reduction ratio of the maximum concentration of L. monocytogenes due to the presence of L. mesenteroides in reconstituted milk model medium and in goat’s pasteurized milk cheese, as affected by the initial pH of milk. Bars represent ± standard error of the estimate.
Preprints 189102 g005
Figure 6. First Validation: Determination of the conversion factor (Cf) for estimating the optimum growth rate of L. monocytogenes (LM) in goat’s milk cheese from the optimum growth rate in reconstituted milk model medium. Horizontal and vertical bars represent ± standard error of the optimum growth rate estimates. Mean and standard error of Cf are displayed on the top. The linear regression without intercept produced a residual standard error of 0.04263 on 5 degrees of freedom; and an adjusted R2 of 0.9987. Type of culture (no LAB added, coculture with L. mesenteroides) was non-significant at p = 0.32.
Preprints 189102 g006
Figure 7. Second Validation: Experimental growth data of L. monocytogenes in goat’s milk cheese at 12 ºC (blue markers) compared against the dynamic prediction (bold blue line), solved using growth data in the milk model medium adjusted at pH 6.0, a normal distribution about the milk-to-cheese conversion factor, and the actual cheese pH profile during maturation (red line). Thin blue lines represent the prediction bands at 95% obtained by Monte Carlo simulation.
Preprints 189102 g007
Table 1. Kinetic parameters (and standard errors) of Listeria monocytogenes (maximum microbial concentration, Ymax in log CFU/g (base e), and optimum growth rate, μopt in day-1) in a milk model medium (i.e., heat-treated reconstituted milk) adjusted to different initial pH levels, in monoculture and coculture with Leuconostoc mesenteroides, obtained from Loforte et al. [35].
Milk initial pH Parameters Monoculture Coculture
5.5 μopt 3.201 (0.060) 1.469 (0.205)
Ymax 20.85 (0.060) 15.05 (0.367)
6.0 μopt 3.416 (0.177) 2.293 (0.284)
Ymax 21.10 (0.212) 16.32 (0.204)
6.5 μopt 3.432 (0.073) 1.552 (0.132)
Ymax 21.31 (0.085) 16.91 (0.132)
Table 2. Monoculture kinetic parameters of Listeria monocytogenes (initial and maximum microbial concentration, Y0, Ymax in log CFU/g (base e), and optimum growth rate, μopt in day-1) in cheese produced with goat’s pasteurized milk adjusted to different initial pH levels, as estimated by the pH-driven dynamic model. Residuals (σ²), root mean square error (RMSE) and mean absolute error (MAE) are shown.
Initial pH of milk L. monocytogenes Fit quality
Parameters Mean (SE) Pr > |t|
5.5 Y0 13.07 (1.132) 0.055 σ²: 0.4268
μopt 1.805 (0.177) 0.040 RMSE: 0.5658
Ymax 17.67 (0.800) 0.106 MAE: 0.4002
6.0 Y0 12.72 (1.163) 0.048 σ²: 0.4495
μopt 1.886 (0.465) 0.002 RMSE: 0.5806
Ymax 19.45 (0.821) 0.027 MAE: 0.4109
6.5 Y0 12.73 (0.771) 0.038 σ²: 0.1976
μopt 1.845 (0.275) 0.024 RMSE: 0.3851
Ymax 18.87 (0.545) 0.018 MAE: 0.2724
Table 3. Coculture kinetic parameters of Listeria monocytogenes and Leuconostoc mesenteroides (initial and maximum microbial concentration, Y0, Ymax in log CFU/g (base e), and optimum growth rate, μopt in day-1) in cheese produced with goat’s pasteurized milk adjusted to different initial pH levels, as estimated by the pH-driven dynamic model. Residuals (σ²), root mean square error (RMSE) and mean absolute error (MAE) are shown.
Initial pH of milk L. monocytogenes L. mesenteroides
Parameters Mean (SE) Pr > |t| Mean (SE) Pr > |t|
5.5 Y0 13.08 (0.049) <0.001 16.88 (0.205) <0.001
μopt 0.863 (0.042) <0.001 0.646 (0.087) 0.005
Ymax 17.41 (0.163) <0.001 20.49 (0.231) <0.001
Fit quality
σ² 0.0012 0.0259
RMSE 0.0312 0.1468
MAE 0.0239 0.1280
6.0 Y0 12.45 (0.479) <0.001 15.91 (0.525) <0.001
μopt 1.239 (0.208) <0.001 0.713 (0.082) 0.030
Ymax 18.77 (0.497) <0.001 22.00 (3.964) 0.011
Fit quality
σ² 0.1390 0.1709
RMSE 0.3404 0.3780
MAE 0.2468 0.3446
6.5 Y0 12.56 (0.615) <0.001 15.54 (0.268) <0.001
μopt 1.038 (0.308) 0.043 1.009 (0.091) <0.001
Ymax 18.31 (0.407) <0.001 21.57 (0.187) <0.001
Fit quality
σ² 0.2256 0.0636
RMSE 0.4335 0.2336
MAE 0.3697 0.1780
Disclaimer/Publisher’s Note: The statements, opinions and data contained in all publications are solely those of the individual author(s) and contributor(s) and not of MDPI and/or the editor(s). MDPI and/or the editor(s) disclaim responsibility for any injury to people or property resulting from any ideas, methods, instructions or products referred to in the content.
Copyright: This open access article is published under a Creative Commons CC BY 4.0 license, which permit the free download, distribution, and reuse, provided that the author and preprint are cited in any reuse.
Prerpints.org logo

Preprints.org is a free preprint server supported by MDPI in Basel, Switzerland.

Subscribe

Disclaimer

Terms of Use

Privacy Policy

Privacy Settings

© 2026 MDPI (Basel, Switzerland) unless otherwise stated