
Submitted:
20 June 2023
Posted:
27 June 2023
You are already at the latest version
Abstract
The growth of two pairs of co-cultures (Escherichia coli/Geotrichum candidum, and Staphylococcus aureus/Geotrichum candidum) with a starter culture of lactic acid bacteria was studied in milk at temperatures related to artisanal cheesemaking ripening. For an inoculum of approximately 106 CFU/mL, LAB not only induced an early stationary phase of E. coli (two strains BR and PS2) and S. aureus (strains 2064 and 14733) but affected their death phase. G. candidum was found to be the subject of interactions with LAB within a given temperature range only partially. To develop a tertiary model for the growth curves of the populations, a one-step approach was used, combining two types of primary models (Huang and Gimenez and Dalgaard) with secondary square root models for growth rate and lag time. Furthermore, the reparametrized Gompertz-inspired function with the Bigelow secondary model was used to describe the death phase of the E. coli and S. aureus strains. The prediction ability of the growth of the H-GD tertiary model for co-cultures was cross-validated within the strains and data sets in milk and milk medium with 1 % NaCl.
Keywords:
pathogens in co-cultures
; Escherichia coli
; Staphylococcus aureus
; Geotrichum candidum
; Lactic Acid Bacteria
1. Introduction
A wide range of interactions among microbial populations belongs to actual and challenging subjects of quantitative food microbiology, especially when the research results have applicable predictive potential. Experiments referring to the fate of populations in the background of ongoing fermentation and ripening may provide a substantial view to several questions that usually appear in the practice of artisan cheese. For example, we may ask whether bacterial starters are more suitable and effective against contaminants than naturally present LAB populations with their diversity, actual activity, and acidification ability.
The idea of providing quantitative studies or proofs related to the role of microbial interactions in the microbiological quality and safety of artisanal raw milk products was inspired not only by the history of their production but also by the recent scientific outputs published [1,2,3,4,5]. According to Schoustra et al. [6], traditionally processed foods derived from raw milk may be safe, since adjustment of the doses of the LAB starters can serve as a means of controlling sanitary protection, maintaining bacterial diversity [7,8], and supporting the activity of inherited populations of LAB as well [9]. This is the case of artisanal lump cheese produced in Slovakian mountain areas and sent for processing for Bryndza cheese after a short 8 to 10 days of ripening [10].
Raw milk cheesemaking and ripening affect microbial activity in a variety of ways, resulting in synergistic actions that are bacteriostatic and/or bactericidal against most microbial pathogens [11,12]. Management of acidification by reaching the target values of pH 5.0-5.5 in time is one of the most important factors to ensure the overall quality and safety of the product. The content and activity of natural protection systems such as lactoperoxidase, lysozyme, and lactoferrin, well known for their antibacterial activity in milk, as well as the production of bacteriocins or bacteriocin-like substances, provide additional barriers to proliferation and persistence [13,14]. Furthermore, other aspects of desired effects include temperature, oxygen accessibility, redox potential, aw and osmotic pressure, and the concentration of ingredients throughout the entire process [6,7,14].
Except for L. monocytogenes, which is not the subject of this research, E. coli and S. aureus should be included as pathogenic bacteria considered a major safety issue for raw milk cheese. They are most often found in cheeses produced with raw milk and function as an indicator of hygiene deficiencies [14,15,16]. According to Desmarchelier & Fegan [17], raw milk can become contaminated with E. coli directly through animal faeces or indirectly through contaminated farm and dairy environments, equipment, and handling personnel. Although most E. coli are harmless commensals, some are known to be pathogenic bacteria, causing severe intestinal and extraintestinal diseases in humans. The presence of S. aureus in cheese is associated with post-secretory contamination and it is relevant as it may produce enterotoxins [4,7,13].
Cheese ecosystems may be associated with the presence of unique microbes, leading to unique microbial interactions that can develop remarkable unique sensory characteristics. In general, the microbiota of artisanal cheese consists of complex assemblages consisting of not only prokaryotic but also fungal populations. As an example, the presence of G. candidum has been linked to the microbial profile of several artisanal raw milk cheeses from various countries. This yeast has been found in the microbiota of Italian "Robiola di Roccaverano" [18], French "Pélardon" [19], "Saint-Nectaire" and "Reblochon" [20], Brazilian "Minas" [21,22], Spanish “Cabrales” [23] and “Armada” [24] and Slovakian “Bryndza” cheese [25,26,27,28,29]. Besides that, it is used as adjunct culture in the production of soft mould-ripened cheeses (e.g. Brie, Camembert), soft and semi-hard smear-ripened cheeses (e.g. Livarot, Tilsit) [30,31,32].
Data on the quality of raw milk cheeses and the prevalence of foodborne pathogens are well documented. However, there is less information in the literature on the in-depth knowledge of interactions between microbial populations [33,34]. On the one hand, physiological studies contribute to a better understanding of the behaviour of the microbiota, but studies in predictive microbiology go one step further by modelling and simulating microbial dynamics over time. Therefore, both can provide reproducible complex patterns that give insight into the effect of varying processing environmental conditions on the cheese microsystem [35,36,37]. As for most artisanal cheeses, ambient temperatures from 15 to 21 °C are applied during fermentation and the early phase of the ripening processes [4,38], we aimed at identifying microbial interactions between a starter culture of lactic acid bacteria, strains of E. coli, S. aureus and G. candidum in detail at a close temperature range, thus contributing to knowledge in artisanal raw milk cheese making. In addition, the other objectives are concerned with the predictive ability to assess and validate the proposed tertiary model for the growth of co-cultures in Slovakian lump cheese that is produced in mountain areas and sent for industrial processing to Bryndza cheese [10].
2. Material and Methods
2.1. Microorganisms and culture conditions
The commercial LAB culture DVS® Fresco® 1000NG (Christian Hansen, Hoersholm, Denmark) and isolate J of G. candidum [29] that comes from Slovakian traditional cheese “Bryndza” were used during all co-cultivation experiments. Mesophilic starter culture consisting of Lactococcus lactis subsp. lactis, L. lactis subsp. cremoris, and Streptococcus salivarius subsp. thermophilus was kept frozen at -45 °C. G. candidum was refrigerated at 5 °C on plate count skim milk agar slants (SMA; Merck, Darmstadt, Germany) and periodically sub-cultured in diluted SMA agar.
There were four different series of E. coli and S. aureus co-cultivations using 2 strains of each, BR, PS2 for E. coli and 2064, 14733 for S. aureus. The BR and PS2 strains of E. coli were isolated from a Slovakian traditional “Bryndza” cheese and laboratory-produced pasta-filata cheese from raw cows' milk, respectively. The S. aureus strains 2064 and 14733 were isolated from a Slovakian ewes’ lump cheese and milk vending machine biofilm, respectively. All bacterial cultures were maintained in Brain Hearth Infusion (BHI) broth (Sigma-Aldrich, St. Louis, Missouri, USA) at 5 ±0.5 °C before analysis.
2.2. Preparation of inoculum and experiments
Standard suspension of Fresco culture was prepared by inoculation of frozen culture into 100 mL of sterile milk and incubation at 30 ±0.5 °C for 5 h until the stationary phase was reached. Standard suspension of G. candidum isolate was prepared from 48 h old culture grown on vertical SMA agar at 30 ±0.5 °C and mixed with 10 mL of sterile saline solution. A standard suspension of E. coli and S. aureus strains was prepared from a 24 h-old culture grown in BHI broth at 37 °C. The above inoculation procedure was aimed to reach the initial concentration of Fresco at 106 CFU/mL, of G. candidum at approximately 102 CFU/mL and E. coli and S. aureus strains at approximately 103 CFU/mL.
All co-cultivation experiments were performed in 250 mL of pre-tempered ultra-high temperature treated milk with 1.5 g/L fat content (Rajo, Ltd., Bratislava, Slovak Republic) without or with 1 % NaCl (w/v). The incubation was performed in three parallel stages under static conditions at temperatures of 15, 18 and 21 ±0.5 °C, which represent artisanal cheese production [38].
The pH was measured using a WTW Inolab 720 pH-meter (Inolab, Weilheim, Germany) equipped with a SenTix 81 glass electrode (WTW GmbH, Weilheim, Germany) with the same time interval as samples for microbiological quantification. aw-values were estimated by the LabMaster-aw (Novasina, Lachen, Switzerland).
2.3. Quantification of microorganisms
The counts of LAB, G. candidum, S. aureus and E. coli were determined by the 10-fold dilution method in a saline-peptone solution. To achieve the best possible fit of the model to the curve, time intervals were predefined according to the incubation temperature.
Counts of cocci from Fresco culture were determined on M17 agar (Merck, Darmstadt, Germany) after 48 h incubation at 30 ±0.5 °C according to EN ISO 15214 [43]. G. candidum counts were determined on DRBC agar (Biokar Diagnostics, Beauvais, France) after 5 days of incubation at 25 ±0.5 °C according to EN ISO 21527-1 [44]. E. coli was counted on Chromocult Coliform agar (Merck, Darmstadt, Germany) after 24 h incubation at 37 ±0.5 °C according to National Standard Method F23 [45]. S. aureus was enumerated on Baird-Parker agar (Merck, Darmstadt, Germany) with incubation at 37 ±0.5 °C for 48 h according to EN ISO 6888-1 [46].
2.4. Mathematical models
2.4.1. Modelling the microbial interaction in co-cultures
The primary models of Huang [47] and Giménez and Dalgaard [48] combined with secondary square root models as applied for growth rate and lag time were used to describe competitive growth of the co-cultures series in milk for all isothermal growth curves. The suggested interaction H-GD model with competition coefficients describing the growth of LAB, G. candidum and behaviour of E. coli and S. aureus in inter-species competition were used in this study according to [37]. Thus, the system of the ordinary differential equations with the initial conditions applied for the growth phase and a mixed system of differential equations and nonlinear algebraic equation (G-B model) was used for survivors of S. aureus (Sa) and E. coli (Ec) in the death phase, denoted here as index P (P = Ec or Sa). The equations can be written as follows:
A H-GD model with the competition coefficients
Growth of LAB; tÎá0, tt ñ
Growth of P = Ec or Sa; tÎá0, tt ñ
Survival P = Ec or Sa; tÎá tt, tñ
where µmaxi=Lab,P,Gc are the maximum specific growth rates of the LAB, E. coli or S. aureus and G. candidum (Gc), respectively, tli are the lag times of microorganisms, α is the lag phase transition coefficient, taking a value of 4 [47]. Concentrations x, which include xi = log Ni, x0,i = log N0,i, xmax,i = log Nmax,i, xres,i = log Nres,i represent the real, initial, maximum and residual (or tail) cell density, Ni, N0,i Amax, i and Nres,i. ILP, IPL are the competition coefficients representing the effects of LAB (Fresco) on E. coli or S. aureus and E. coli or S. aureus on LAB (Fresco), respectively in the H-GD model type R. kmax,P is the maximum death rate of E. coli or S. aureus, tlsi=Ec, Sa is the survival curve shoulder, tt is the transitioning breakpoint time from stationary to survival phase for E. coli/S. aureus that is determined so that the time tl is equal to zero, kGc is the reduction coefficient for G. candidum growth rate.
As µmaxi and tli are a function of temperature, the following secondary square root models were used to incorporate the effect of temperature on growth parameters [49]:
where regression coefficient bT (h-1×°C-1) is the slope and depends on additional growth conditions and the microorganism involved, T (°C) is the temperature, and Tmin is its theoretical minimum for growth.
The square root relation between lag time (tl) and T was used in the H-GD models according to [50]:
where bl,I is the regression coefficient.
Next, for the declination phase of E. coli and S. aureus strains, the reparametrized Gompertz-inspired survival model together with the Bigelow secondary model was used for its versatility of fitting linear data and those that have shoulder and/or tailing effects [51]. The zi parameter was used to help in the theoretical description of the influence of temperature and other factors acting in this phase such as the pH drop and addition of NaCl.
The secondary Bigelow log-linear model was applied to express the dependence of the rate of decrease, kmax on temperature as follows:
where refit is kmaxi at a reference temperature (Tref) and z represents a temperature required for a 10-fold reduction of E. coli or S. aureus numbers.
2.4.2. Parameter determination and evaluation of model performance
The one-step kinetic data analysis method described by Huang [52] was applied for parameter optimization from the given isothermal growth curves of the co-culture microbial populations. To construct the tertiary H-GD model and minimize the global sum of squared errors (SSE), they were analysed concurrently using the H-GD models (Eqs. 1–3) and the secondary square root models (Eqs. 4–7).
In the beginning, the tertiary H-GD model had 19 parameters (Eqs. 1–7): three average maximum values of xmax, competition coefficients ILP, IPL and reduction coefficient kGc in the H-GD model type R and reduction coefficient kGc (Eqs. 1–3) and parameters bT, Tmin, bl from square-root models (Eqs. 4–6). The parameters Nres, kref, and z are derived from the reparametrized Gompertz-inspired survival model (Eq. 2a) as well as the Bigelow secondary model (7), respectively.
pH-GD is the vector of parameters of H-GD models for the simultaneous competitive growth of the co-culture series.
The prediction ability of the tertiary H-GD model was tested for a reduced number of parameters (pE): the average maximum density counts of microorganisms (xmax,Lab, xmax,P, xmax,G), the competition coefficients (ILP, IPL), the reduction coefficient kGc, the regression coefficient, bl,Gc, the maximum declination rates at a reference temperature Tref (kref,Ec, kref,Sa ) and z-values (zEc, zSa). Regression coefficients bl,Ec for the strain E. coli PS2 were also evaluated by using one-step kinetic data analysis. The remaining parameters in Eq. 8, which were previously optimized by nonlinear regression analysis for single cultures [37] or taken from the following scientific articles [41,42], were fixed as constants. This approach has the advantage that some parameters for co-culture growth prediction in milk could be estimated from the growth of individual species.
The goodness of fit of the tertiary H-GD model was evaluated with the global sum of squared errors (SSE), the root mean square error (RMSE) and the determination coefficient (R2) to evaluate its suitability to fit the whole set of observation points according to Eqs. 1-7.
where and correspond to the observed and predicted values, respectively, n is the total number of data points, pE is the number of estimated parameters and SST is the total sum of squared errors.
The prediction capability of the H-GD tertiary model was tested through the Bias (Bf) and Accuracy (Af) factors [53] on the data sets of different E. coli (BR and PS2) and S. aureus (2064 and 14733) strains within the temperature range of 15 to 21 °C for the cases without and with 1 % NaCl addition
The accuracy of the H-GD model was checked with the RMSE of prediction for each microorganism in the co-culture growth according to [54].
The tertiary model parameters were estimated using the commercial process-engineering software Athena Visual Workbench (Stewart & Associates Engineering Software, Madison, WI; www.athenavisual.com). SSE, RMSE, as well as bias (Bf) and accuracy (Af), were calculated using Microsoft Excel (Microsoft, Redmond, Washington, USA).
3. Results and Discussion
3.1. One-Step Analysis of Competitive Growth
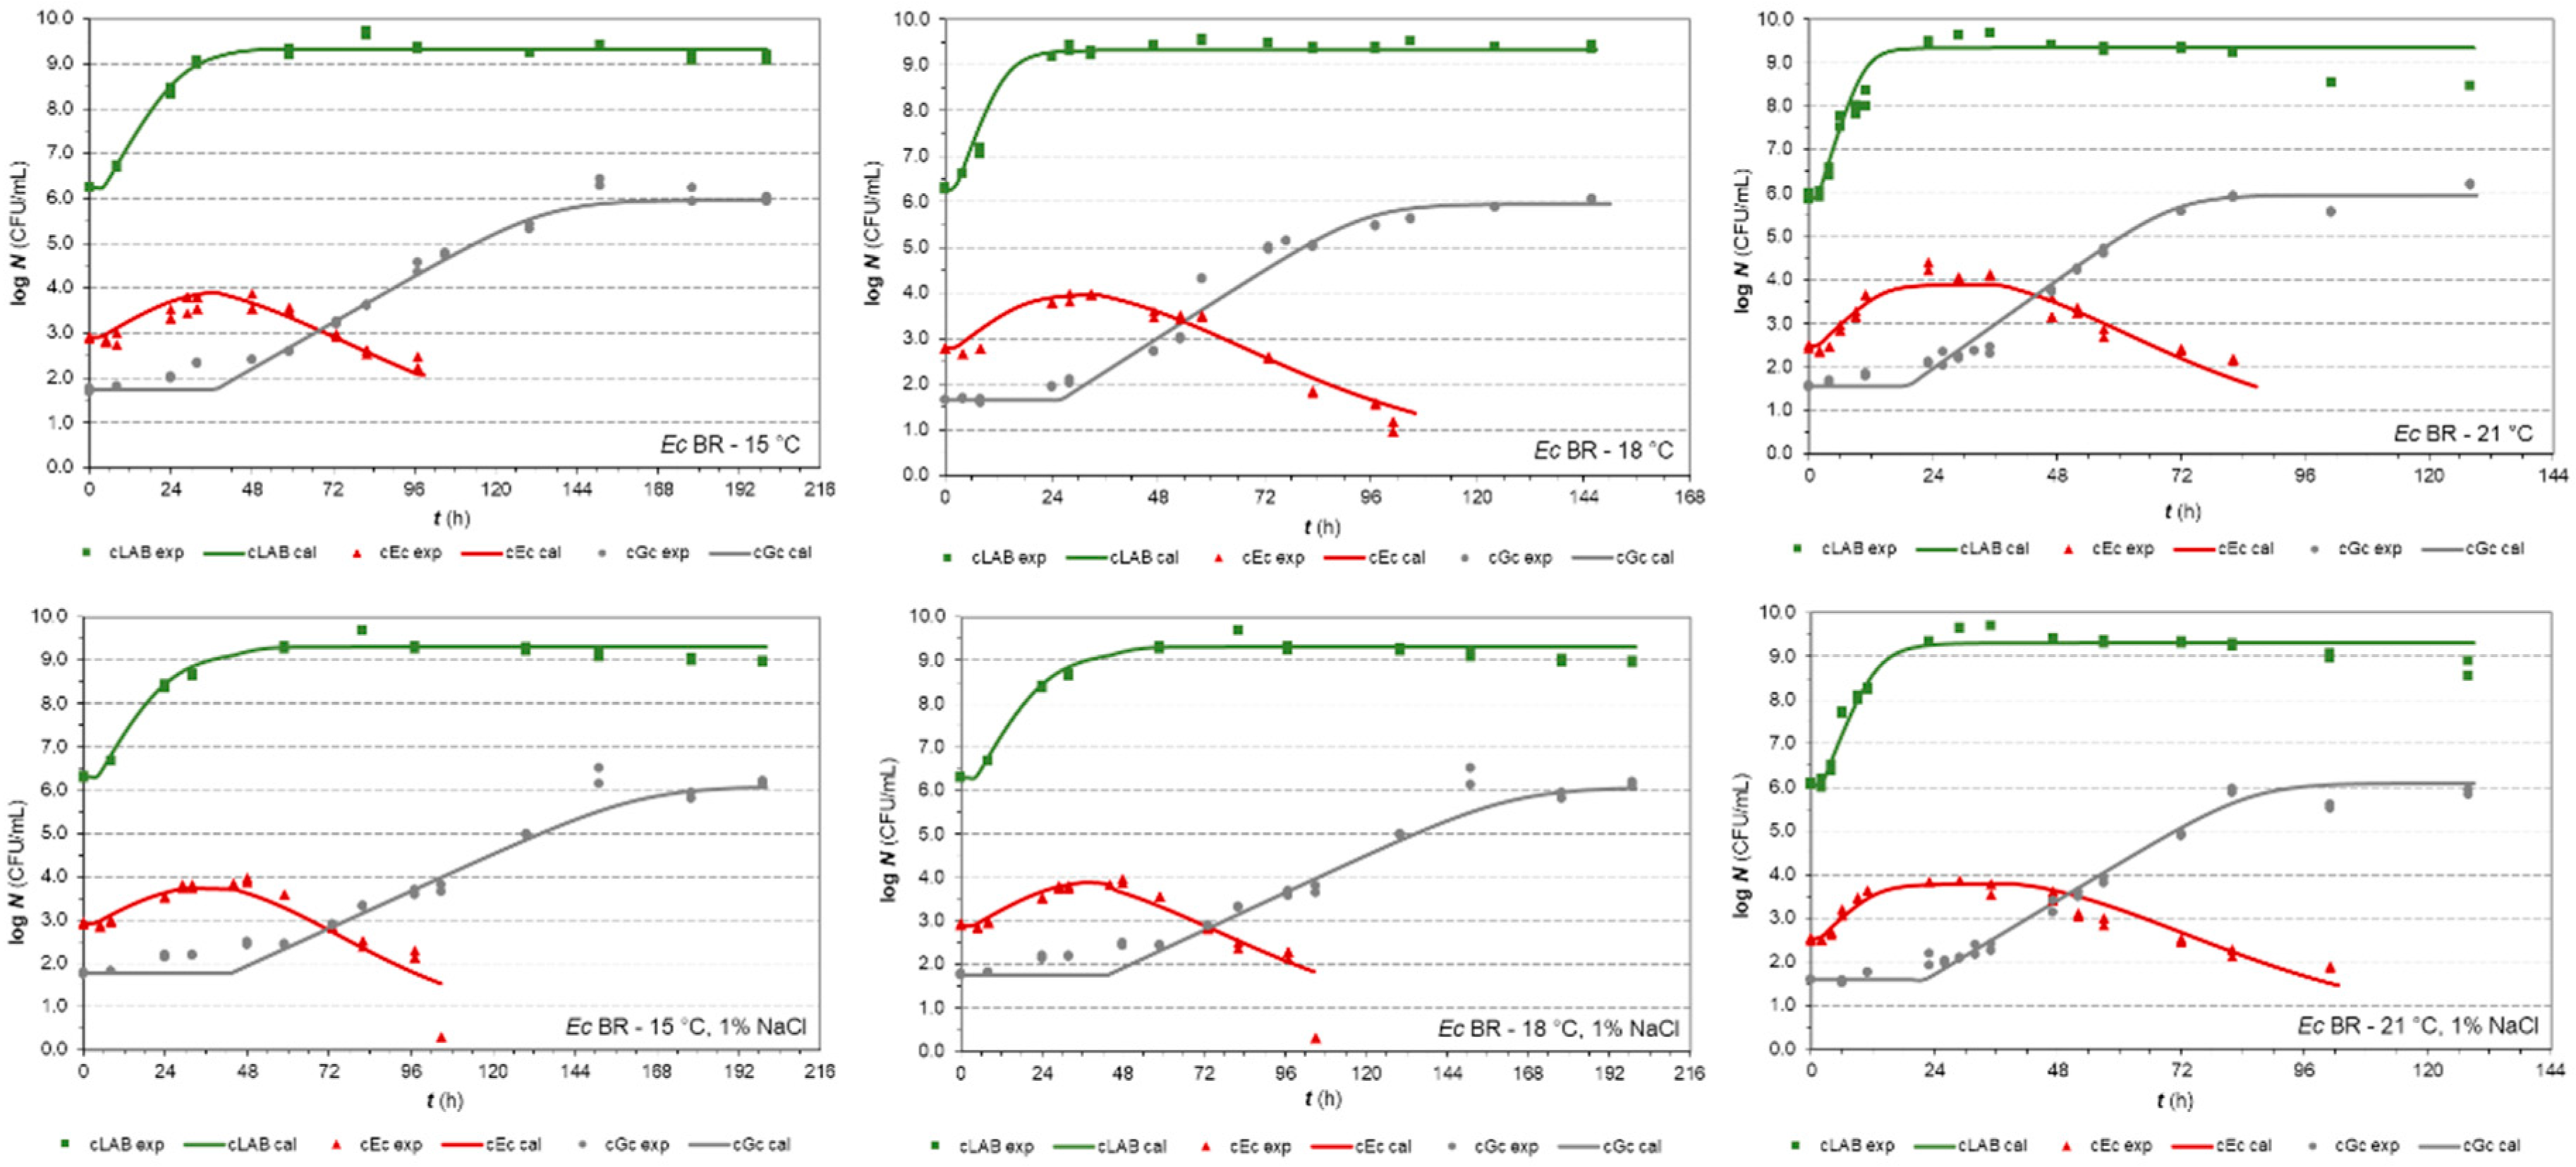
By combining co-culture primary growth models with secondary growth and survival models in one step, we were able to describe the growth patterns of three microbial populations. As presented in Figure 1a-1c and 1d-1f for E. coli BR in milk and milk with 1 % NaCl, respectively, the following similar characteristics can be recognised. First, LAB played a dominant role in co-cultures; grown at the highest rates that were influenced mostly by the temperature and only partly by 1% NaCl content. Dalcanton, et al. [55] and Medveďová et al. [56] reported a comparable trend regarding the influence of temperature and water activity on the behaviour of LAB. On average, they reached maximum population density (MPD) of 9.32 ±0.07 logs and a stable population increase (the difference between MPD and N0) of 3.2 ±0,3 log CFU/mL in all co-culture trials in the shortest time. These results aligned with our previous work [37] and those reported for the co-culture growth of Lactiplantibacillus plantarum with S. aureus by Rodríguez-Sánchez et al. [57].
While grown independently, LAB determined the responses of E. coli BR that increased the numbers in 1.23 ±0.32 log CFU/mL for a period in which LAB reached the early stationary phase. E. coli reached its stationary phase with a maximum population density (MPD) of 3.91 ±0.18 logs on average and prolonged its duration with increasing temperature in both cases of milk (without and with 1 % NaCl). Consistent with these results, Sreekumar and Hosono [58] reported final counts of E. coli 3544 less than 3 logs CFU/mL during co-cultivation with Lactobacillus acidophilus SBT2071 in semi-skimmed sheep’s milk. Referring to the increase in population, this was not the case for G. candidum. However, in milk, as well as at 1 % NaCl, its population reached the highest increase of 4.19 ±0.16 logs, for a longer period than other populations. Naturally, this period was determined by temperature. It can also be seen that the G. candidum lag phase was almost identical to the period that covers the LAB lag and exponential phases together.
The growth studies [41,59] demonstrated a similar pattern of growth responses during G. candidum and LAB Fresco co-culturing experiments. During the stationary phase, the yeast was able to grow exponentially and reach its stationary phase. This can be explained by both lactate consumption and ammonium production [60], which are related to an increase in pH and tolerance to lactic acid produced by LAB.
Figure 1.
1a-1c and 1d-1f. Co-culture growth of LAB Fresco, E. coli BR and G. candidum in milk at 15, 18 and 21 °C (without and with 1 % NaCl, respectively). The continuous lines represent the growth predicted values by the H-GD model and the dots represent the experimental values (® LAB, p Ec, □ Gc).
Similar responses were also found in co-culture trials, in which the previous strain of E. coli was replaced by the PS2 strain isolated from Slovakian artisanal steamed and stretched Slovakian cheese. Compared to BR strain, the only visually recognisable differences are referred to as a higher MPD and a population increase of 4.76 ±0.26 log and 1.91 ±0.33 log, respectively, as well as longer durations of stationary phases in general (Suppl. Figure 1 1g-1i and 1j-1l). Thus, naturally, the PS2 strain also grew at a negligible higher rate than the BR strain during the exponential phase.
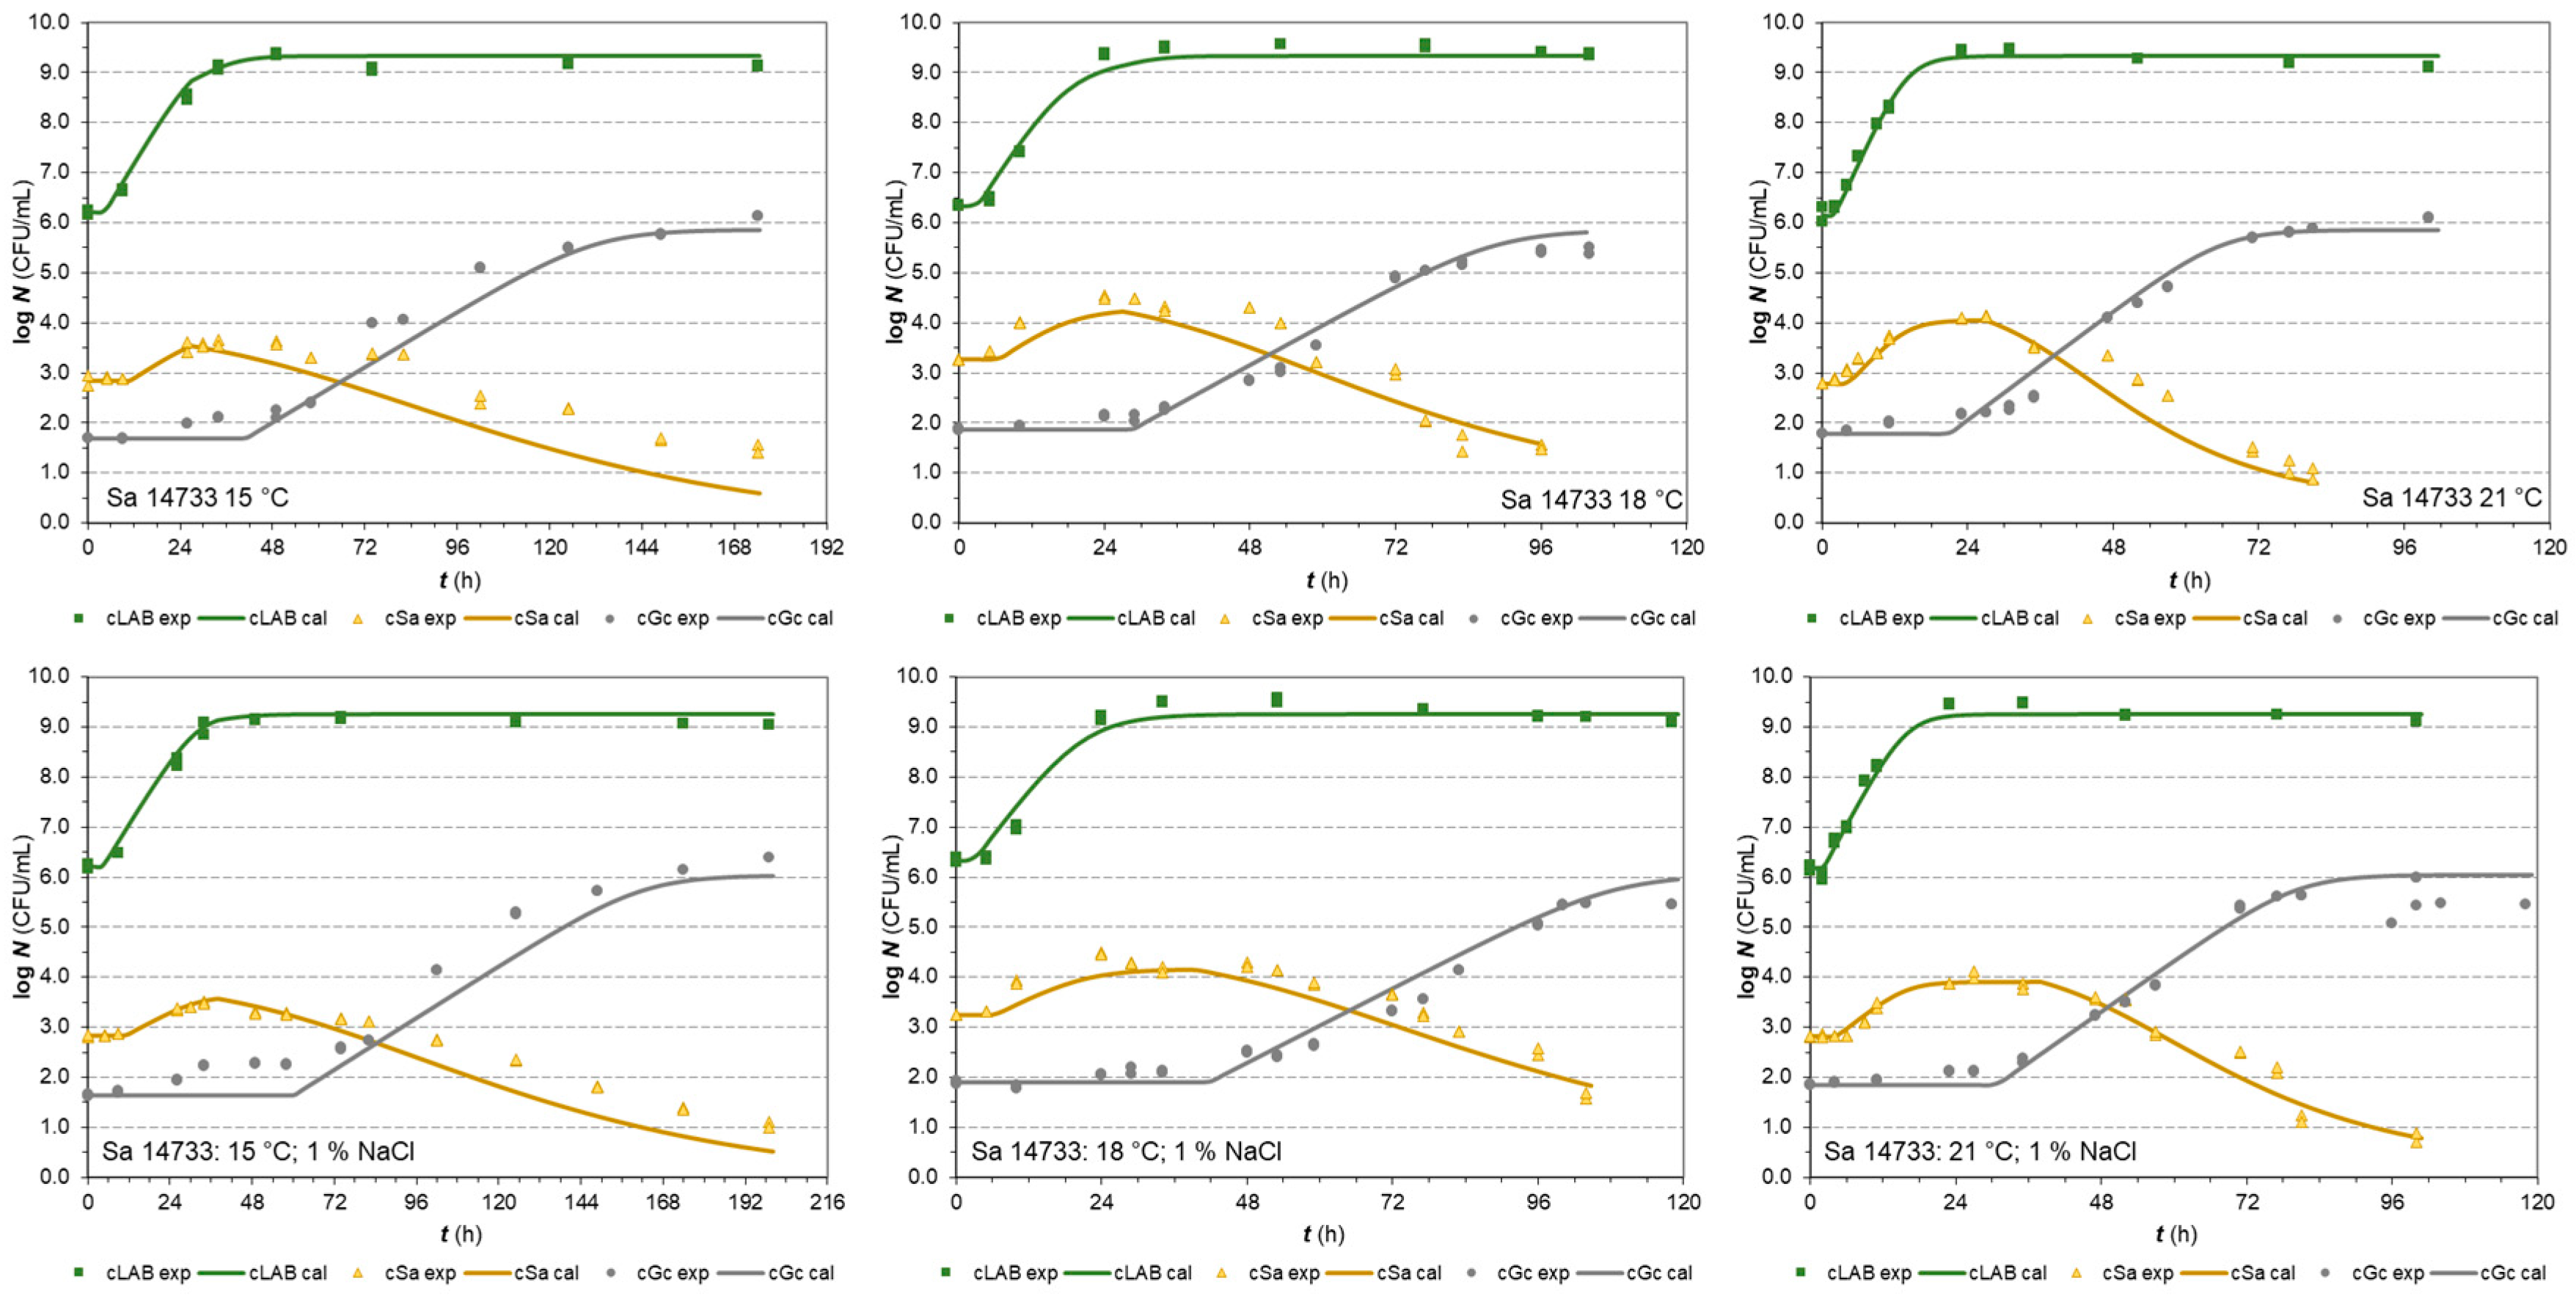
The S. aureus strain 14733 in the same type of co-cultures with LAB and G. candidum reached MPD and a population increase of 3.97 ±0.36 and 1.06 ±0.29 log, respectively (Figure 2a–c,d-f). Both mean values were close to the responses of the E. coli BR strain.
Figure 2.
2a-2c and 2d-2f. Co-culture growth of LAB Fresco, S. aureus 14733 and G. candidum in milk at 15, 18 and 21 °C (without and with 1 % NaCl, respectively). The continuous lines represent the growth predicted values by the H-GD model and the dots represent the experimental values (® LAB, p Sa, □ Gc).
The second S. aureus strain 2064 [61] was also used in the last series of co-cultures with LAB and G. candidum. The results of the tests (Suppl. Figure 2 2g-2j) indicated that this strain appeared to be sensitive to lactic acid or competition in general since it reached MPD in stationary phase less than 4 logs (3.38 ±0.40 log CFU/mL) and the increase in population less than 1 log (0.65 ±0.27 log CFU/mL).
The production of organic acids has a major impact on the quality of the final products during the cheesemaking process. Acidification is usually achieved by the production of lactic acid through the fermentation of lactose by LAB [57,62]. The pH changes in our study followed a sigmoidal behaviour throughout LAB growth but with a delay of approximately 6 to 10 h. This trend is consistent with those reported by Rodríguez-Sánchez et al. [57] when analysing the antimicrobial activity of the LABs against some potentially pathogenic bacteria used as indicators, including S. aureus. As LAB growth progressed to the exponential and stationary growth phase, a rapid and significant drop in pH (pH ≤ 5.3) was observed in the second phase.
The parameters estimated for the H-GD model are presented in Table 1 and Table 2 for both E. coli and S. aureus strains in co-cultures, respectively.

Table 1.
Parameters of H-GD model with 95 % highest posterior density interval (Bayesian estimation) for growth of E. coli (strains BR and PS2) in co-cultures with G. candidum and LAB in milk.
Table 1.
Parameters of H-GD model with 95 % highest posterior density interval (Bayesian estimation) for growth of E. coli (strains BR and PS2) in co-cultures with G. candidum and LAB in milk.
| Parameters | E. coli (strain BR) | E. coli (strain PS2) | ||
|---|---|---|---|---|
| In milk | 1 % NaCl in milk | In milk | 1 % NaCl in milk | |
| xmax,Lab | 9.34 ±0.04 | 9.32 ±0.03 | 9.36 ±0.04 | 9.33 ±0.04 |
| xmax,Ec | 4.17 ±0.16 | 3.95 ±0.10 | 5.14 ±0.17 | 5.14 ±0.10 |
| xmax,Gc | 5.96 ±0.08 | 6.09 ±0.10 | 5.72 ±0.08 | 6.04 ±0.17 |
| ILE | 1.158 ±0.093 | 1.254 ±0.100 | 0.957 ±0.059 | 0.951 ±0.054 |
| IEL | 0.526 ±0.045 | 0.536 ±0.049 | 0.588 ±0.042 | 0.513 ±0.035 |
| kGc | 0.850 ±0.038 | 0.710 ±0.025 | 0.931 ±0.048 | 0.749 ±0.046 |
| kref | 0.101 ±0.006 | 0.101 ±0.006 | 0.133 ±0.006 | 0.081 ±0.006 |
| xres,Ec | 0.4a | 0.42 ±0.16 | 1.20 ±0.29 | 0.5d |
| zEc | 30.67 ±5.68 | 32.25d | 6.38 ±0.70 | 28.21 ±5.76 |
| bλ,Gc | 0.0109 ±0.0003 | 0.0101 ±0.0003 | 0.0096 ±0.0002 | 0.0085 ±0.0002 |
| bT,Gcb | 0.0228b | 0.0228b | 0.0228a | 0.0228a |
| Tmin,Gcb | 0.00b | 0.00b | 0.00a | 0.00a |
| bλ,Labc | 0.0343c | 0.0343c | 0.0343b | 0.0343b |
| bT,Labc | 0.0384c | 0.0384c | 0.0384b | 0.0384b |
| Tmin,Lab | 1.11c | 1.11c | 1.11b | 1.11b |
| bλ,Ec | 0.0493c | 0.0493c | 0.0365 ±0.0045 | 0.0366 ±0.0044 |
| bT,Ec | 0.0421c | 0.0421c | 0.052c | 0.052c |
| Tmin,Ec | 4.16c | 4.16c | 4.80c | 4.80c |
Except for the facts described above, the data in Table 1 pointed out that the competition coefficients IEL (Eq. 2) in the H-GD model showed a similar growth reduction (< 60 %) for both strains of E. coli compared to their original capacity as individual species in milk [37]. On the other hand, the competitive effect of LAB on S. aureus strains was stronger and strain-dependent. The coefficients ISL in Table 2 were significantly lower and different for strains 2064 and 14733. Thus, they confirmed the higher sensitivity to non-specific inhibition caused by LAB that was found for strain 14733.
Table 2.
Parameters of H-GD model with 95 % highest posterior density interval (Bayesian estimation) for growth of S. aureus (strains 2064 and 14733) in co-cultures with G. candidum and LAB in milk.
Table 2.
Parameters of H-GD model with 95 % highest posterior density interval (Bayesian estimation) for growth of S. aureus (strains 2064 and 14733) in co-cultures with G. candidum and LAB in milk.
| Parameters | S. aureus (strain 2064) | S. aureus (strain 14733) | ||
|---|---|---|---|---|
| In milk | 1 % NaCl in milk | In milk | 1 % NaCl in milk | |
| xmax,Lab | 9.43 ±0.03 | 9.40 ±0.05 | 9.34 ±0.03 | 9.25 ±0.03 |
| xmax,Sa | 3.83 ±0.15 | 4.17 ±0.11 | 4.43 ±0.12 | 4.43 ±0.16 |
| xmax,Gc | 5.65 ±0.12 | 5.82 ±0.17 | 5.85 ±0.11 | 6.04 ±0.15 |
| ILS | 1.262 ±0.056 | 1.083 ±0.057 | 1.064 ±0.044 | 0.912 ±0.043 |
| ISL | 0.308 ±0.144 | 0.174 ±0.089 | 0.705 ±0.079 | 0.526 ±0.054 |
| cLS | - | - | - | - |
| cSL | - | - | - | - |
| kGc | 0.995 ±0.067 | 0.778 ±0.058 | 0.906 ±0.048 | 0.850 ±0.055 |
| kref | 0.133 ±0.022 | 0.102 ±0.007 | 0.107 ±0.007 | 0.094 ±0.006 |
| xres,Sa | 1.47 ±0.13 | 0.3c | 0.5c | 0.5c |
| zSa | 9.46 ±1.21 | 10.44 ±0.51 | 11.49 ±1.18 | 13.79 ±1.67 |
| bλ,Gc | 0.0092 ±0.0002 | 0.0086 ±0.0003 | 0.0104 ±0.0003 | 0.0086 ±0.0002 |
| bT,Gc | 0.0228 a | 0.0228 a | 0.0228 a | 0.0228 a |
| Tmin,Gc | 0.00a | 0.00a | 0.00a | 0.00a |
| bλ,Lab | 0.0343b | 0.0343b | 0.0384b | 0.0384b |
| bT,Lab | 0.0384b | 0.0384b | 1.11b | 1.11b |
| Tmin,Lab | 1.11b | 1.11b | 0.0302b | 0.0302b |
| bλ,Sa | 0.0302b | 0.0302b | 0.0409b | 0.0409b |
| bT,Sa | 0.0409b | 0.0409b | 5.02b | 5.02b |
| Tmin,Sa | 5.02b | 5.02b | ||
The results in Table 1, Table 2 and Table 3 showed that the tertiary H-GD model successfully described the competitive growth between species in milk at temperatures related to the ripening conditions of artisanal cheesemaking. The global RMSE values for all cases are lower than 0.33 log CFU/mL, which is well within the range of normal experimental error. A dominant level of inoculum (approx. 106 CFU/mL) of a starter culture favoured the growth of LAB in milk (the competition coefficient ILP is greater than one in almost all cases and was able not only to induce an early stationary state in E. coli (strains BR and PS2) and S. aureus (strains 2064 and 14733) for the cases without and with 1 % NaCl addition but also subsequently reduced their population. LAB growth of the LAB slightly suppressed the growth rate of G. candidum of its original ability as a single species in milk. The reduction coefficients of the growth rate of G. candidum kGc were within the region 0.710-0.995. Naturally, their values were lower for the cases with NaCl addition (Table 1, Table 2).
Table 3.
Goodness-of-fit indices and models comparison of H-GD model for the E. coli and S. aureus strains in co-culture with G. candidum and LAB Fresco in milk.
Table 3.
Goodness-of-fit indices and models comparison of H-GD model for the E. coli and S. aureus strains in co-culture with G. candidum and LAB Fresco in milk.
| Indices | E. coli BR | E. coli PS2 | S. aureus 2064 | S. aureus 14733 | ||||
| in milk | 1 % NaCl in milk | in milk | 1 % NaCl in milk | in milk | 1 % NaCl in milk | in milk | 1 % NaCl in milk | |
| SSE | 14.719 | 16.080 | 19.450 | 25.719 | 10.625 | 11.725 | 15.184 | 17.592 |
| R2 | 0.992 | 0.991 | 0.987 | 0.986 | 0.991 | 0.991 | 0.989 | 0.988 |
| pE | 10 | 10 | 11 | 11 | 10 | 10 | 10 | 10 |
| RMSE | 0.251 | 0.254 | 0.289 | 0.324 | 0.280 | 0.284 | 0.270 | 0.282 |
Number of data points: nEC BR (milk) = 244; nEC BR (milk+1 % NaCl) = 254; nEC PS2 (milk) = 244; nEC PS2 (milk+1 % NaCl) = 256; nSa 2064 (milk) = 146; nSa 2064 (milk + 1% NaCl) = 155; nSa 14733 (milk) = 218; n Sa 14733 (milk + 1 % NaCl) = 232.
3.2. Model validation
In fermentations, the most important populations consist of the LABs responsible for fermentation and some adjunct culture. In our case, they are represented by Fresco culture and G. candidum, respectively. Inviting intensive growth, they create or supply added value to the final characteristics of the fermented product. On the other hand, co-culture studies are usually aimed at the behaviour of microbial contaminants, while the fermentation and adjunct cultures are monitored in the background. Undesirable, pathogenic, or spoilage bacteria play different roles and, in this work, are represented by the strains of E. coli or S. aureus. To evaluate strain variability or validate the co-culture models, most of their points of view are considered in this section.
3.2.1. E. coli strains in co-cultures
First, within the variability evaluation, the RMSE values [54] between milk growth and milk with 1 % NaCl were evaluated for each E. coli strain. Although the PS2 strain showed the highest difference in milk numbers between 1 and 0 % (RMSE = 0.67 log CFU/mL), the RMSE for the BR strain was only 0.37 log CFU/mL, indicating that this strain was less sensitive to NaCl addition. In the evaluation of the differences between strains BR and PS2 in the same medium, they were lower in milk without salt addition (RMSE = 0.75 log CFU/mL) than in milk with 1 % NaCl (RMSE = 1.11 log CFU/mL). Therefore, these values are more about the different behaviour between E. coli strains, competitiveness, and sensitivity to NaCl than about variability. The lowest calculated RMSE values for LAB in all combinations ranged between 0.22 and 0.30 log CFU/mL. For G. candidum sensitive to NaCl, higher RMSE values of 0.49-0.69 log CFU/mL were found between co-culture growth in milk without NaCl and milk with the addition of 1 % NaCl.
The prediction capability of the H-GD model was also evaluated through the Bias (Bf) and Accuracy (Af) factors [53] for each microorganism in the E. coli co-cultures. For E. coli, the HG-D model data of strain BR were validated with the experimental data of strain PS2. The calculated Bf values for the growth of E. coli strains were within 0.993–1.387 and the Af values ranged from 1.283 to 1.704. With high probability, the prediction of E. coli growth was affected by the growth ability and sensitivity of the PS2 strain to the addition of NaCl.
LAB growth was accurately predicted for all co-culture cases and the calculated Bf values were within 0.996 to 1.003, while the Af values ranged from 1.026 to 1.035 showed that, on average, the predicted value was 2.6 to 3.5 % different (either smaller or greater) from the observed values. Accurate prediction of LAB growth also confirmed the fact that their growth was minimally affected by other co-culture populations such as G. candidum or E. coli as the values of the interaction coefficient ILE @ 1.0 indicated before (Table 1).
3.2.2. S. aureus strains in co-cultures
According to data in Table 2, the fast-growing strain 2064 of S. aureus compared with the numbers of strain 14733 showed a large difference in milk and milk with 1 % NaCl (RMSE = 0.66 and 0.91 log CFU/mL, respectively). On the other hand, the differences within the same strain but between different media (milk without NaCl vs. 1 % NaCl) were lower in the case of halotolerant S. aureus, 0.39 and 0.34 for the strains 2064 and 14733, respectively. Unlike E. coli, these RMSE values pointed out strain variability. The lowest calculated RMSE values for populations in the background were also calculated for LAB in all combinations and ranged between 0.19 and 0.30 log CFU/mL. For G. candidum the higher RMSE values of 0.51-0.63 log CFU/mL were calculated between their numbers in milk and milk with the addition of 1% NaCl, which also confirmed its sensitivity to NaCl.
Within the validation indices (Bf and Af), the fast-growing strain 2064 model data and the experimental data of strain 14733 were used. While the calculated Bf values for the growth of S. aureus strains were 1.184 and 1.284, the Af values were 1.371 and 1.500 in milk and 1 % NaCl in milk, respectively.
LAB growth was accurately predicted in all cases of co-culture with S. aureus since the calculated Bf values were within 0.980 to 1.016 and the Af values ranged from 1.023 to 1.035. Furthermore, the values of the interaction coefficient ILS varied between 0.91 and 1.26 (Table 2).
Referring to interpretation of the Bf when used for model performance evaluations involving pathogens, three categories were recommended by [64]. Bf in the range of 0.90 to 1.05 can be considered good; 0.70 to 0.90 or 1.06 to 1.15 can be considered acceptable and less than 0.70 or greater than 1.15 should be considered unacceptable. In almost all cases with two strains of each E. coli and S. aureus contaminant in our study, the values of the Bf factors were in the range of 0.90-1.05, which means that the H-GD model can be considered as suitable also for growth prediction in co-cultures with three different microbial populations.
4. Conclusions
The behaviour of microbial co-culture populations was successfully described with the H-GD model for the exponential growth phase in combination with secondary Ratkowsky and Bigelow models for declination phase. After the early stationary phase reached by LAB, S. aureus responded less competitively and more sensitively to the lactic acid produced by LAB than E. coli. However, the different behaviour of the E. coli strains found in this work may be associated more with different properties between strains (competitiveness and sensitivity to NaCl) than with only variability, in general. Internal but cross-validation provided acceptable values for the predictions applicable in cheesemaking practice. The LAB culture showed stable growth in all co-culture trials. Growth of G. candidum was negligibly reduced compared to the single growth of this yeast in milk, but growth appears not to be inhibited by the presence of LAB nor E. coli or S. aureus and reached its typical maximum density in a stationary growth phase.
References
- Licitra, G.; Caccamo, M.; Lortal, S. Artisanal Products Made With Raw Milk. In Raw Milk: Balance Between Hazards and Benefits; Nero, L.A., De Carvalho, A.F., Eds., Academic Press: London, UK, 2019; pp. 175–221. [Google Scholar] [CrossRef]
- Šipošová, P.; Lehotová, V.; Valík, Ľ.; Medveďová, A. Microbiological quality assessment of raw milk from a vending machine and of traditional Slovakian pasta filata cheeses. Journal of Food and Nutrition Research 2020, 59, 272–279. [Google Scholar]
- Lehotová, V.; Antálková, V.; Medveďová, A.; Valík, Ľ. Quantitative Microbiological Analysis of Artisanal Stretched Quantitative Microbiological Analysis of Artisanal Stretched. Applied Sciences 2021, 11, 2680. [Google Scholar] [CrossRef]
- Krebs de Souza, C.; Angioletti, B.L.; Hoffmann, T.G.; Bertoli, S.L.; Reiter, M.G. Promoting the appreciation and marketability of artisanal Kochkäse (traditional German cheese): A review. International Dairy Journal 2022, 126, 105244. [Google Scholar] [CrossRef]
- Bettera, L.; Levante, A.; Bancalari, E.; Bottari, B.; Gatti, M. Lactic acid bacteria in cow raw milk for cheese production: Which and how many? Frontiers in Microbiology 2023, 13, 1092224. [Google Scholar] [CrossRef]
- Schoustra, S.; van der Zon, C.; Groenenboom, A.; Moonga, H.B.; Shindano, J.; Smid, E.J.; Hazeleger, W. Microbiological safety of traditionally processed fermented foods based on raw milk, the case of Mabisi from Zambia. LWT - Food Science and Technology 2022, 113997. [Google Scholar] [CrossRef]
- Piqueras, J.; Chassard, C.; Callon, C.; Rifa, E.; Rifa, S.; Lebecque, A.D. Lactic Starter Dose Shapes S. aureus and STEC O26:H11 Growth, and Bacterial Community Patterns in Raw Milk Uncooked Pressed Cheeses. Microorganisms 2021, 9, 1081. [Google Scholar] [CrossRef] [PubMed]
- Medveďová, A.; Koňuchová, M.; Kvočiková, K.; Hatalová, I.; Valík, Ľ. Effect of Lactic Acid Bacteria Addition on the Microbiological Safety of Pasta-Filata Types of Cheeses. Frontiers in Microbiology 2020, 11, 612528. [Google Scholar] [CrossRef] [PubMed]
- Medveďová, A.; Valík, Ľ. Staphylococcus aureus: Characterisation and Quantitative Growth Description in Milk and Artisanal Raw Milk Cheese Production. In Structure and Function of Food Engineering, Ayman Amer Eissa (Ed.); InTech: Rijeka, 2012; pp. 71–102. [Google Scholar]
- Palo, V.; Kaláb, M. Slovak sheep cheeses. Milchwissenshaft 1984, 39, 518–521. [Google Scholar]
- Owusu-Kwarteng, J.; Akabanda, F.; Agyei, D.; Jespersen, L. Microbial Safety of Milk Production and Fermented Dairy Products in Africa. Microorganisms 2020, 8, 752. [Google Scholar] [CrossRef]
- Parente, E.; Zotta, T.; Ricciardi, A. A review of methods for the inference and experimental confirmation of microbial association networks in cheese. International Journal of Food Microbiology 2022, 368, 109618. [Google Scholar] [CrossRef]
- Costanzo, N.; Ceniti, C.; Santoro, A.; Clausi, M.T.; Casalinuovo, F. Foodborne Pathogen Assessment in Raw Milk Cheeses. International Journal of Food Science 2020, 2020, 3616713. [Google Scholar] [CrossRef] [PubMed]
- Possas, A.; Bonilla-Luque, O.M.; Valero, A. From Cheese-Making to Consumption: Exploring the Microbial Safety of Cheeses through Predictive Microbiology Models. Foods 2021, 10, 355. [Google Scholar] [CrossRef] [PubMed]
- Gonzales-Barron, U.; Gonçalves-Tenório, A.; Rodrigues, V.; Cadavez, V. Foodborne pathogens in raw milk and cheese of sheep and goat origin: a meta-analysis approach. Current Opinion in Food Science 2017, 18, 7–13. [Google Scholar] [CrossRef]
- Metz, M.; Sheehan, J.; Feng, P.C.H. Use of indicator bacteria for monitoring sanitary quality of raw milk cheeses – A literature review. Food Microbiology 2020, 85, 103283. [Google Scholar] [CrossRef] [PubMed]
- Desmarchelier, P.; Fegan, N. Pathogens in Milk: Escherichia coli. In Encyclopedia of Dairy Sciences, 2nd ed.; Fuquay, J.W., Ed.; Elsevier: Amsterdam, 2011; pp. 60–66. [Google Scholar]
- Biolcati, F.; Andrighetto Ch Bottero, M.T.; Dalmasso, A. Microbial characterization of an artisanal production of Robiola di Roccaverano cheese. Journal of Dairy Science 2020, 103, 4056–4067. [Google Scholar] [CrossRef]
- Penland, M.; Falentin, H.; Parayre, S.; Pawtowski, A.; Maillard, M.-B.; Thierry, A.; Mounier, J.; Coton, M.; Deutsch, S.-M. Linking Pélardon artisanal goat cheese microbial communities to aroma compounds during cheese-making and ripening. International Journal of Food Microbiology 2021, 345, 109130. [Google Scholar] [CrossRef]
- Marcellino, S.N.; Benson, D.R. The good, the bad, and the ugly: tales of mold-ripened cheese. In Cheese and Microbes, 1st ed.; Donnelly, C.W., Ed., ASM Press: Washington, DC, USA, 2014; pp. 95–132. [Google Scholar]
- de Souza, T.P.; Evangelista, S.R.; Passamani, F.R.F.; Bertechini, R.; de Abreu, L.R.; Batistade, L.R. Mycobiota of Minas artisanal cheese: Safety and quality. International Dairy Journal 2021, 120, 105085. [Google Scholar] [CrossRef]
- Sant'Anna, F.M.; Wetzels, S.U.; Cicco, S.H.S.; Figueiredo, R.C.H.; Sales, G.A.; Figueiredo NCh Nunes, C.A.; Schmitz-Esser, S.; Mann, E.; Wagner, M.; Souza, M.R. Microbial shifts in Minas artisanal cheeses from the Serra do Salitre region of Minas Gerais, Brazil throughout ripening time. Food Microbiology 2019, 82, 349–362. [Google Scholar] [CrossRef]
- Roig-Sagués, A.X.; Molina, A.P.; Hernández-Herrero, M.M. Histamine and tyramine-forming microorganisms in Spanish traditional cheeses. European Food Research and Technology 2002, 215, 96–100. [Google Scholar] [CrossRef]
- Sacristán, N.; Mayo, B.; Fernández, E.; Fresno, J.M.; Tornadijo, M.E.; Castro, J.M. Molecular study of Geotrichum strains isolated from Armada cheese. Food Microbiology 2013, 36, 481–487. [Google Scholar] [CrossRef]
- Pangallo, D.; Šaková, N.; Koreňová, J.; Puškárová, A.; Kraková, L.; Valík, Ľ.; Kuchta, T. Microbial diversity and dynamics during the production of May bryndza cheese. International Journal of Food Microbiology 2014, 170, 38–43. [Google Scholar] [CrossRef] [PubMed]
- Šaková, N.; Sádecká, J.; Lejková, J.; Puškárová, A.; Koreňová, J.; Kolek, E.; Valík, Ľ.; Kuchta, T.; Pangallo, D. Characterization of May bryndza cheese from various regions in Slovakia based on microbiological, molecular and principal volatile odorants examination. Journal of Food and Nutrition Research 2015, 54, 239–251. [Google Scholar]
- Kačániová, M.; Kunová, S.; Štefániková, J.; Felšöciová, S.; Godočíková, L.; Horská, E.; Nagyová, Ľ.; Haščík, P.; Terentjeva, M. Microbiota of the traditional Slovak sheep cheese “Bryndza”. Journal of Microbiology, Biotechnology and Food Sciences 2019, 9, 482–486. [Google Scholar] [CrossRef]
- Sádecká, J.; Čaplová, Z.; Tomáška, M.; Šoltys, K.; Kopuncová, M.; Budiš, J.; Drončovský, M.; Kolek, E.; Koreňová, J.; Kuchta, T. Microorganisms and volatile aroma-active compounds in bryndza cheese produced and marketed in Slovakia. Journal of Food and Nutrition Research 2019, 58, 382–392. [Google Scholar]
- Koňuchová, M.; Valík, Ľ. Modelling the Radial Growth of Geotrichum candidum: Effects of Temperature and Water Activity. Microorganisms 2021, 9, 532. [Google Scholar] [CrossRef] [PubMed]
- Boutrou, R.; Guéguen, M. Interests in Geotrichum candidum for cheese technology. International Journal of Food Microbiology 2005, 102, 1–20. [Google Scholar] [CrossRef]
- Fröhlich-Wyder, M.T.; Arias-Roth, E.; Jakob, E. Cheese yeasts. Yeast 2019, 36, 129–141. [Google Scholar] [CrossRef]
- Eliskases-Lechner, F.; Guéguen, M.; Panoff, J.M. Geotrichum candidum. In Encyclopedia of Dairy Sciences, 3rd ed.; Mcsweeney, P.L.H., McNamara, J.P., Eds.; Elsevier: Amsterdam, 2022; Volume 4, pp. 561–569. [Google Scholar]
- Mayo, B.; Rodríguez, J.; Vázquez, L.; Flórez, A.B. Microbial Interactions within the Cheese Ecosystem and Their Application to Improve Quality and Safety. Foods 2021, 10, 602. [Google Scholar] [CrossRef]
- Fusco, V.; Chieffi, D.; De Angelis, M. Fresh pasta filata cheeses: Composition, role, and evolution of the microbiota in their quality and safety. Journal of Dairy Science 2022, 105, 9347–9366. [Google Scholar] [CrossRef]
- Valík, Ľ.; Ačai, P.; Medveďová; A. Application of competitive models in predicting the simultaneous growth of Staphylococcus aureus and lactic acid bacteria in milk. Food Control 2018, 87, 145–152. [Google Scholar] [CrossRef]
- Lobacz, A.; Kowalik, J.; Zulewska, J. Determination of the survival kinetics of Salmonella spp. on the surface of ripened raw milk cheese during storage at different temperatures. International Journal of Food Science and Technology 2020, 55, 610–618. [Google Scholar]
- Ačai, P.; Valík, Ľ.; Medveďová, A. One- and Two-Step Kinetic Data Analysis Applied for Single and Co-Culture Growth of Staphylococcus aureus, Escherichia coli, and Lactic Acid Bacteria in Milk. Applied Sciences 2021, 11, 8673. [Google Scholar] [CrossRef]
- Valík, Ľ.; Görner, F.; Sonneveld, C. Fermentácia (kysnutie) ovčieho hrudkového syra v podmienkach salašnej výroby (Fermentation of ewe's lump cheese under conditions of artisan production). Chov oviec a kôz (Breeding of sheep and goats) 2004, 24, 23–24. [Google Scholar]
- Ačai, P.; Valík, Ľ.; Medveďová, A.; Rosskopf, F. Modelling and predicting the simultaneous growth of Escherichia coli and lactic acid bacteria in milk. Food Science and Technology International 2016, 22, 475–484. [Google Scholar] [CrossRef]
- Ačai, P.; Medveďová, A.; Mančušková, T.; Valík, Ľ. Growth prediction of two bacterial populations in co-culture with lactic acid bacteria. Food Science Technology International 2019, 25, 692–700. [Google Scholar] [CrossRef]
- Šipošová, P.; Koňuchová, M.; Valík, Ľ.; Medveďová, A. Growth dynamics of lactic acid bacteria and dairy microscopic fungus Geotrichum candidum during their co-cultivation in milk. Food Science Technology International 2020, 27, 572–582. [Google Scholar] [CrossRef]
- Medveďová, A.; Kočiš-Kovaľ, M.; Valík, Ľ. Effect of salt and temperature on the growth of Escherichia coli PSII. Acta Alimentaria 2021, 50, 180–188. [Google Scholar]
- EN ISO 15214. Microbiology of Food and Animal Feeding Stuffs. Horizontal Method for the Enumeration of Mesophilic Lactic Acid Bacteria. Colony-Count Technique at 30 °C. International Organization of Standardization (ISO): Geneva, Switzerland, 2005.
- EN ISO 21527-1. Microbiology of food and animal feeding stuffs - Horizontal method for the enumeration of yeasts and moulds - Part 1: Colony count technique in products with water activity greater than 0.95. International Organization of Standardization (ISO): Geneva, Switzerland, 2008.
- National Standard Method F23. Enumeration of Enterobacteriaceae by the Colony Count Technique, Standards Unit, Evaluations and Standards Laboratory, Health Protection Agency, 2005, p. 23. (n.d.).
- EN ISO 6888-1. Microbiology of Food and Animal Feeding Stuffs. Horizontal Method for the Enumeration of Coagulase-Positive Staphylococci (Staphylococcus aureus and Other Species). Part 1: Technique Using Baird-Parker Agar Medium. International Organization of Standardization (ISO): Geneva, Switzerland, 2001.
- Huang, L. Optimization of a new mathematical model for bacterial growth. Food Control 2013, 32, 283–288. [Google Scholar] [CrossRef]
- Giménez, B.; Dalgaard, P. Modelling and predicting the simultaneous growth of Listeria monocytogenes and spoilage micro-organisms in cold-smoked salmon. Journal of Applied Microbiology 2004, 96, 96–109. [Google Scholar] [CrossRef]
- Ratkowsky, D.A.; Olley, J.; McMeekin, T.A.; Ball, A. Relationship Between Temperature and Growth Rate of Bacterial Cultures. Journal of Bacteriology 1982, 149, 1–5. [Google Scholar] [CrossRef]
- Buchanan, R.L. Predictive food microbiology. Trends in Food Sciences and Technology 1993, 4, 6–11. [Google Scholar] [CrossRef]
- Zwietering, M.H.; Jongenburger, I.; Rombouts, F.M.; Van't Riet, K. Modeling of the bacterial growth curve. Applied and Environmental Microbiology 1990, 56, 1875–1881. [Google Scholar] [CrossRef] [PubMed]
- Huang, L. Mathematical modeling and validation of growth of Salmonella Enteritidis and background microorganisms in potato salad - One-step kinetic analysis and model development. Food Control 2016, 68, 69–76. [Google Scholar] [CrossRef]
- Baranyi, J.; Pin, C.; Ross, T. Validating and comparing predictive models. International Journal of Food Microbiology 1999, 48, 159–166. [Google Scholar] [CrossRef] [PubMed]
- Huang, L.; Hwang, C.; Liu, Y.; Renye, J.; Jia, Z. Growth competition between lactic acid bacteria and Listeria monocytogenes during simultaneous fermentation and drying of meat sausages - A mathematical modeling. Food Research International 2022, 158, 111553. [Google Scholar] [CrossRef] [PubMed]
- Dalcanton, F.; Carrasco, E.; Pérez-Rodríguez, F.; Posada-Izquierdo, G.D.; Falcão de Aragão, G.M.; García-Gimeno, R.M. Modeling the Combined Effects of Temperature, pH, and Sodium Chloride and Sodium Lactate Concentrations on the Growth Rate of Lactobacillus plantarum ATCC 8014. Journal of Food Quality 2018, 1–10. [Google Scholar] [CrossRef]
- Medveďová, A.; Šipošová, P.; Mančušková, T.; Valík, Ľ. The effect of salt and temperature on the growth of Fresco culture. Fermentation 2019, 5, 3390. [Google Scholar] [CrossRef]
- Rodríguez-Sánchez, S.; Ramos, I.M.; Rodríguez-Pérez, M.; Poveda, J.M.; Seseña, S.; Palop, M.L. Lactic acid bacteria as biocontrol agents to reduce Staphylococcus aureus growth, enterotoxin production and virulence gene expression. LWT 2022, 170, 114025. [Google Scholar] [CrossRef]
- Sreekumar, O.; Hosono, A. Immediate effect of Lactobacillus acidophilus on the intestinal flora and fecal enzymes of rats and the in vitro inhibition of Escherichia coli in coculture. Journal of Dairy Science 2000, 83, 931–939. [Google Scholar] [CrossRef]
- Medveďová, A.; Liptáková, D.; Hudecová, A.; Valík, Ľ. Quantification of the growth competition of lactic acid bacteria: a case of co-culture with Geotrichum candidum and Staphylococcus aureus. Acta Chimica Slovaca 2008, 1, 192–201. [Google Scholar]
- Aldarf, M.; Fourcade, F.; Amrane, A.; Prigent, Y. Diffusion of lactate and ammonium in relation to growth of Geotrichum candidum at the surface of solid media. Biotechnology and Bioengineering 2004, 87. [Google Scholar] [CrossRef]
- Medveďová, A.; Havlíková, A.; Lehotová, V.; Valík, Ľ. Staphylococcus aureus 2064 growth as affected by temperature and reduced water activity. Italian Journal of Food Safety 2019, 8, 188–193. [Google Scholar] [CrossRef] [PubMed]
- Canon, F.; Nidelet, T.; Guédon, E.; Thierry, A.; Gagnaire, V. Understanding the Mechanisms of Positive Microbial Interactions That Benefit Lactic Acid Bacteria Co-cultures. Frontiers in Microbiology 2020, 11, 2088. [Google Scholar] [CrossRef] [PubMed]
- Šipošová, P.; Koňuchová, M.; Valík, Ľ.; Trebichavská, M.; Medveďová, A. Quantitative Characterization of Geotrichum candidum Growth in Milk. Applied Sciences 2021, 11, 4619. [Google Scholar] [CrossRef]
- Ross, T. Indices for performance evaluation of predictive models in food microbiology. Journal of Applied Microbiology 1996, 81, 501–508. [Google Scholar] [CrossRef]
Disclaimer/Publisher’s Note: The statements, opinions and data contained in all publications are solely those of the individual author(s) and contributor(s) and not of MDPI and/or the editor(s). MDPI and/or the editor(s) disclaim responsibility for any injury to people or property resulting from any ideas, methods, instructions or products referred to in the content. |
© 2023 by the authors. Licensee MDPI, Basel, Switzerland. This article is an open access article distributed under the terms and conditions of the Creative Commons Attribution (CC BY) license (http://creativecommons.org/licenses/by/4.0/).
Copyright: This open access article is published under a Creative Commons CC BY 4.0 license, which permit the free download, distribution, and reuse, provided that the author and preprint are cited in any reuse.


