
Submitted:
09 December 2025
Posted:
10 December 2025
You are already at the latest version
Abstract
The advance and delay of the rainy season is among the most frequently cited effects of climate change by Ecuadorian farmers. However, its assessment is not feasible using the conventional indicators recommended by the standardized indices of the Expert Team on Climate Change Detection and Indices (ETCCDI). This study aims to analyze such advances and delays through harmonic analysis in Tungurahua, a predominantly agricultural province in the Tropical Central Andes, where in-situ data are scarce. Daily in-situ data from five meteorological stations were used, including precipitation, maximum, and minimum temperature records spanning 39 to 68 years. The study involved an analysis of the region’s climatology, climate change indices, and harmonic analysis using Cross Wavelet Transform (XWT) and Wavelet Coherence Transform (WCT) to identify seasonal patterns and their variability (advance or delay) by comparing historical and recent time series, and Kriggin for regionalization. The year 2000 was used as a breakpoint for comparing past and present trends. Results show a generalized increase in both minimum and maximum temperatures. In the case of extreme rainfall events, no significant changes were detected. Harmonic analysis was found to be sensitive to missing data. Furthermore, the observed advances and delays in seasonality were not statistically significant and appeared to be more closely related to the geographic location of the stations than to temporal shifts.
Keywords:
seasonal shifts
; wavelet coherence
; agricultural risk
; ETCCDI indices
; mountain climatology
1. Introduction
In many regions around the world, climate change is significantly altering seasonal patterns, directly affecting the timing and duration of rainy and dry periods. These changes not only impact local ecosystems and biodiversity but also have profound implications for agriculture, a critical pillar of developing economies [1]. Previous research, such as that conducted by Cordero et al. (2019) in Central and South America, has demonstrated that variability in the rainy season is a decisive factor influencing agricultural productivity and food security, primarily due to the resulting droughts and floods [2]. At the global level, studies such as Wang et al. (2019) in China have documented a decline in precipitation and shifts in seasonal patterns attributable to climate change [3].
Serrano et al. (2016) identify two general characteristics of anthropogenic climate change in Tropical Andes: a global increase in temperature and a rise in the frequency and intensity of extreme weather events [4]. Also Tropical Andes is considered highly vulnerable to the effects of climate change and its interactions with the El Niño-Southern Oscillation (ENSO), commonly known as El Niño and La Niña events. Intensification of El Niño episodes in Ecuadorian coastal and central Andes region, with recurrence intervals of 2, 4, and 7 years, has led to increased precipitation, causing significant human and material losses. On the other hand, La Niña events result in extreme droughts, negatively impacting the socioeconomic landscape [5]. This climatic variability poses serious challenges to the agricultural sector, primarily due to increased hydrological stress. Furthermore, anthropogenic activities such as deforestation, water pollution, and land-use change exacerbate the impacts of climate change [6]. These challenges are particularly acute in rural areas that lack adequate infrastructure, technology, and investment for climate adaptation [7,8].
In the province of Tungurahua, according to [7], while both maximum and minimum temperatures have increased, they have not yet reached thresholds that cause significant physiological stress in plants and animals. However, projections indicate that by 2070, temperature increases may exceed 2°C. Regarding precipitation, certain areas have shown no statistically significant increase in extreme rainfall events, such as floods and droughts.
Nonetheless, local perceptions present a contrasting narrative. As discussed in the article residents report that rainfall no longer occurs at expected times, leading to droughts, water stress in crops, and insect outbreaks. Conversely, when the rainy season arrives earlier than anticipated, fungal infestations tend to emerge [9].
Therefore, Anthropogenic climate change is expected to further compromise the sustainability of agricultural systems [10], threatening their long-term productivity, food supply, and the food security of future generations [11]. Therefore, urgent action is needed to mitigate its consequences and ensure that agricultural production adapts to climate-compatible practices. This growing threat demands adaptive solutions that go beyond current techniques used in agricultural production systems. It requires policy reforms, regulatory adjustments, and the implementation of all available market-based instruments [12,13].
Within this context, the present study focuses on the application of harmonic analysis, an advanced statistical methodology, to determine whether it can accurately identify changes in the timing of the rainy and dry seasons in Tungurahua. This method not only aims to improve the understanding of shifts in precipitation patterns but also could support the development of strategies to mitigate adverse impacts on agriculture and water resource management.
The main objective of this research is to evaluate the usefulness of harmonic analysis in detecting advances or delays in seasonal cycles, as well as to enhance the understanding of the climate in this agricultural zone, thereby enabling local planners and farmers to make more accurate and adaptive decisions.
To achieve this goal, the study first presents a climatological analysis of the region, along with climate change indices to identify potential trends between past and present climates, and their regionalization using Kriging interpolation. Finally, harmonic analysis is applied using the Continuous Wavelet Transform (CWT) to detect seasonality patterns, while Wavelet Coherence Transform (WCT) and cross-correlation are used to identify potential advances or delays in seasonal behavior between past and present climatic conditions.
2. Study Area and Methods
The province of Tungurahua covers an area of 3,386 km² and has a population of 563,532 inhabitants, of which 39.97% reside in rural areas where more than half of the local economy relies on agricultural activities [14,15]. It is located in a mountainous region of the Tropical Andes, in the central part of Ecuador. Although the prevailing climate is predominantly arid and temperate, the province encompasses a diversity of unique microclimates. On average, the mean annual temperature remains around 14 °C; however, at higher elevations—such as the Carihuairazo and Chimborazo mountains—colder conditions prevail, with snow present for most of the year [8,16], although Carihuairazo is practically thawed [8].
2.1. Meteorological Data
In general, in-situ meteorological data in Ecuador are scarce and discontinuous. For this study, meteorological data were obtained from six weather stations located within the province of Tungurahua (Figure 1). Details of the stations are provided in Table 1. All data were supplied by the National Institute of Meteorology and Hydrology (INAMHI).
2.2. Quality Control
In the case of precipitation, identifying outliers is particularly challenging because these often correspond to extreme rainfall events, which are precisely the focus of this study. Additionally, periods with missing data were detected, as illustrated in Figure 2. Quality control was performed through Plotly package in RStudio. Highly discontinuous periods, marked with red circles in Figure 2, were removed. Rainfall outliers were also identified, defined as values exceeding the threshold of more than 10 standard deviations (σ) [17,18]. Furthermore, a statistical analysis was carried out for each station, identifying maximum, minimum values, quartiles (Q1, Q2, Q3), and percentiles (90, 99) [19,20]. Despite this processing, the time series available for each station were poorly homogeneous and contained numerous missing data points (Figure 3).
2.3. Climate Change Analysis
The ClimDex package in R was used to calculate climate change indices recommended by the Expert Team on Climate Change Detection and Indices (ETCCDI) of the Intergovernmental Panel on Climate Change [15]. This tool allows the assessment of how climate change affects precipitation and temperature patterns. The main indices related to changes in precipitation and temperature, for tropical areas [21] including their definitions and corresponding equations, are presented in Table 2.
2.4. Comparison Between Present and Past
It is important to note that climate change is a gradual and sustained process over time [15]; therefore, there is no distinct point that separates past from present climate conditions. Using the R ClimDex package, the evolution of climate change indices (PRCPTOT, R95p, SDII, TXx, TNx) was analyzed over time to identify, the effects of climate change in the study area. For this purpose, comparable time periods with the fewest possible missing data were selected.
2.5. Normalization and Gap-Filling
Based on the requirements for harmonic analysis of the series, the data were normalized and gap-filled [22,23]. Normalization was performed by dividing the precipitation data by the maximum recorded value in each series, while missing values were replaced with zero, as it represents the mode of the distribution [6,17].
2.6. Monthly Aggregation of Data
To achieve a more precise seasonal analysis, daily precipitation data were aggregated into monthly totals. This procedure enabled the harmonic analysis to be reproduced using monthly aggregated values. Figure 4 present the time series on a monthly basis for the stations, providing a clear view of seasonal trends and variations.
2.7. Wavelet Harmonic Analysis
The methodology applied in this study employs harmonic analysis of time series through the use of wavelets, a mathematical tool that has enabled new applications in various scientific fields, including those related to the study of natural phenomena [24]. The interaction between time and frequency allows the extraction of valuable information from precipitation data and other relevant indicators, highlighting their significant concentration in both domains [25]. Computational analysis, data preparation, simulations, and visualization of results were performed using the Wavelet Toolbox in MATLAB [26].
2.7.1. Bivariate Wavelet Transform: Cross-Wavelet Transform (XWT) and Wavelet Coherence (WTC)
Coherence and correlation between two wave functions, commonly used in wavelet analysis, share notable similarities with conventional correlation coefficients; however, they differ in that they are defined within the time–frequency space. These relationships are visualized using a scalogram, which employs a color map to represent the coherence between two sinusoidal signals, offering a graphical depiction of the relationship between the signals over time and across frequency scales [25]. In the scalogram, the horizontal axis represents the temporal domain, while the vertical axis indicates the periods (or frequencies). This graphical representation facilitates the interpretation of how the frequencies common to both signals vary over time.
These frequencies are validated for events of interest, allowing the delineation of contours that reflect a statistical significance level of 5% [27]. The process of establishing this significance involves generating a background spectrum using white or red noise, against which the actual wavelet coherence spectrum is compared. This procedure enables the distinction between statistically significant coherences and those that may arise from random signals [28].
The Cross Wavelet Transform (XWT) has a meaning similar to that of correlation between signals, and it is sensitive not only to the common frequencies in the data but also to the magnitude of the variables under study (in this case, precipitation intensity). In this manner, the XWT and the WCT are complementary techniques that enable the analysis of the interaction and joint dynamics of the signals, integrating their results to obtain a deeper understanding of their temporal and frequency-domain relationships ([27].
Both the XWT and the WCT provide information on phase, which is essential for estimating leads or lags in precipitation events. This estimation is performed through the analysis of the arrows in the plots, which indicate the direction and magnitude of the phase relationship between the compared signals. When the arrows point to the right, the signals are said to be in phase, whereas arrows pointing to the left indicate that they are in anti-phase. Intermediate orientations reflect the relative synchronization of events within the time–frequency spectrum, offering a powerful tool for understanding the dynamics of the phenomena under study [28].
3. Results
3.1. Meteorological Description of the Stations
After performing the quality control in daily data and considering the non-parametric nature of precipitation, the maximum rainfall values recorded at each station are as follows: Baños (198.9 mm in May 1976, 160.4 mm in November 1982, 156.5 mm in August 1989, and 187 mm in March 2001). For Patate, the maximum values were 260 mm in September 1930 and 199.8 mm in January 1981.
An analysis of the climatology of the studied stations indicates that the rainiest area corresponds to Baños, which exhibits maximum daily precipitation values of up to 955.1 mm, being the lowest-altitude station. In contrast, the highest-elevation station in each record shows the lowest precipitation values, with a maximum of 320.20 mm per day. Table 3 presents the minimum, maximum, and quartile values, including the 90th and 99th percentiles.
The minimum values correspond to the precision limits of the rain gauges in the INAMHI network. Likewise, it should be noted that the rainiest stations are those located farther to the west, apparently due to the influence of Amazonian climatology, which contains higher moisture levels. The data from Calamaca station were excluded due to the limited amount of available information.
3.2. Climate Change Indices Analysis
To identify the effects of climate change, the precipitation-related indices listed in Table 2 were analyzed, and the results are presented in Table 4. For the calculation of each index, a least-squares interpolation was performed using a linear function (solid line in Figure 5, Figure 6, Figure 7, Figure 8 and Figure 9). Each index exhibits either a positive slope—indicating an increase—or a negative slope—indicating a decrease. To determine whether this increase or decrease is statistically significant, the p-value is used; a value below 0.05 indicates a confidence level above 95%, in which case the result is marked with **. When the p-value is less than or equal to 0.1, the result is marked with *, corresponding to a 90% confidence level. Likewise, in the following figures the moving average is shown with a dashed line.
As can be observed, the precipitation indices are not statistically significant, whereas the temperature indices are. These results support the conclusion that climate change is occurring in the study area, evidenced by a sustained increase in both maximum and minimum temperatures. However, no statistically significant change is detected for precipitation indices.
In Figure 5, Figure 6, Figure 7, Figure 8 and Figure 9, in order to assess potential changes in precipitation patterns, past and present precipitation values are compared. The year 2000 was empirically selected as the dividing point. This choice was not straightforward, as it was necessary to identify a common reference point for all stations and indices while also balancing the amount of data available before and after that year.
The PRCPTOT index shown in Figure 5 measures the total annual accumulated precipitation. Although it does not exhibit strong statistical significance, an increase in precipitation after the year 2000 can be observed in the Pedro Fermín and Querochaca stations, as well as a rise in extreme precipitation events. For the Baños and Patate stations, no relevant change is evident between the periods before and after 2000. In the case of the Calamaca station, the absence of data prevents the analysis of this index. At the Píllaro station, a decrease in total precipitation is observed after the year 2000.
In Figure 6, the R95p index indicates a significant increase in the occurrence of extreme rainfall events, with the exception of the Píllaro station. For the Pedro Fermín and Querochaca stations, a marked increase after the year 2000 is evident, consistent with the previously noted rise in extreme precipitation.
Figure 7 presents the results for the SDII index, which reflects the amount of rainfall precipitated per wet day. For the Pedro Fermín and Querochaca stations, the year 2000—indicated by the vertical red line—coincides with a change in the behavior of the SDII. This change may reflect variations in precipitation patterns driven by regional or global climatic factors such as El Niño, La Niña, or broader climate change trends [17]. For the remaining stations, the index exhibits a negative slope, indicating a decrease in daily precipitation intensity after the year 2000.
The temperature indices exhibit markedly different patterns, showing a consistent increase across all stations (Figure 8), despite the large number of missing data points. The Baños, Patate, and Píllaro stations display significant and steady warming trends, with clear positive slopes that reflect a continuous rise in temperature after the year 2000. In contrast, although the Pedro Fermín and Querochaca stations also show an upward trend, it does not reach statistical significance, possibly due to the high interannual variability observed at these locations (Table 4).
The TNx index, shown in Figure 9, measures the maximum monthly values of daily minimum temperature. All stations exhibit an increasing trend, with the exception of the Pedro Fermín station, where the moving average changes during the most recent years.
3.3. Past and Present Seasonal Analysis
To determine the climatology of the area, seasonality was analyzed using monthly accumulated precipitation, which allowed the identification of precipitation influences from both the Andes (characterized by a bimodal rainfall pattern) and the Amazon region (characterized by a unimodal pattern). Once the inflection point was established, the seasonal patterns before and after the year 2000 were examined (Figure 10).
Figure 10 presents the general behavior of monthly accumulated precipitation before and after the year 2000. The Baños station shows a unimodal pattern typical of the Amazon region (despite being located at 1820 m a.s.l.), with the highest values of monthly accumulated precipitation occurring in June, July, and August. This is associated with the northward displacement of the Intertropical Convergence Zone (ITCZ). At the Patate station, located at 2442 m a.s.l., the precipitation pattern reflects an Amazonian influence in June and July, and an Andean influence from February to May.
Despite the proximity between the Patate and Píllaro stations, the Píllaro station (2781 m a.s.l.) exhibits a bimodal pattern characteristic of the Andean region, with a dry season occurring in June, July, and August in the period prior to the year 2000. Likewise, although the Pedro Fermín and Querochaca stations are relatively close to one another, both show a bimodal pattern, with Pedro Fermín presenting higher precipitation values before the year 2000, particularly in September. For the Querochaca station, the most notable changes after 2000 occur in July, September, and December. The remaining behavior was very similar both before and after the year 2000.
To analyze the rainfall patterns more effectively for the periods before and after 2000, the monthly accumulated values were examined, as presented in Table 5. The table also indicates the number of years used for the comparison in each period.
The analysis of the precipitation data in Table 6 reveals that, overall, there has been an increase in both maximum precipitation and the frequency of extreme events in most stations after the year 2000. The Baños and Querochaca stations show the most notable increases in maximum precipitation and in the percentile values, indicating greater variability and more frequent extreme events. In contrast, stations such as Patate exhibit a decrease in both minimum and maximum precipitation, suggesting a reduction in variability. For a clearer understanding of precipitation behavior before and after 2000, Figure 11 provides a visual comparison.
3.4. Harmonic Analysis
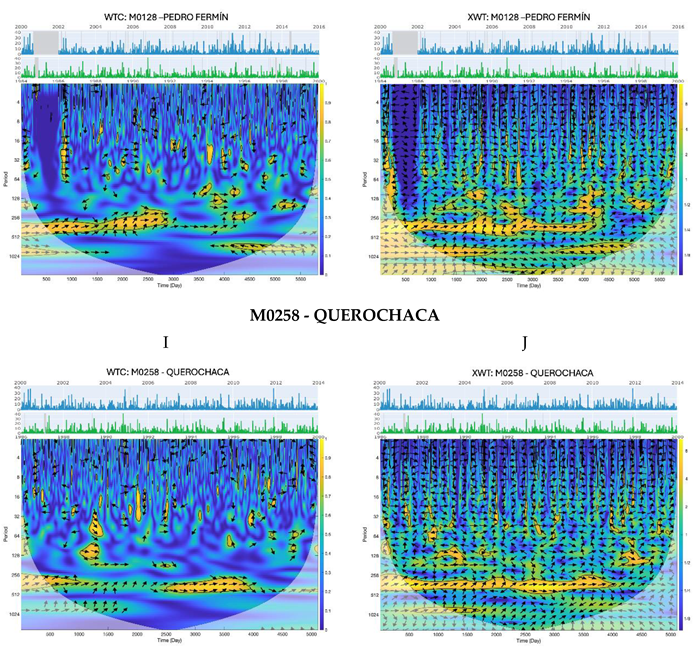
The following section presents the harmonic analysis of the monthly precipitation data for each station, comparing the periods before and after the year 2000. In the figures, the horizontal axis represents the years, while the vertical axis indicates the wavelet scale periods for both Wavelet Coherence (WTC) and Cross-Wavelet Transform (XWT). The color scale ranges from blue to yellow, where yellow denotes high coherence or correlation values, and blue denotes low values. The black contour line indicates statistical significance at the 95% confidence level, relative to two completely random signals. In all figures, the x-variable corresponds to the series before the year 2000, and the y-variable to the series after; therefore, arrows pointing to the left (θ = 0) indicate an in-phase seasonal behavior, meaning there are no advances or delays in the rainy season compared with the past.
Arrows pointing upward (0 < θ < π) indicate an advance of the rainy season, whereas arrows pointing downward (π < θ < 2π) indicate a delay. Arrows pointing to the right (θ = π) denote an out-of-phase relationship.
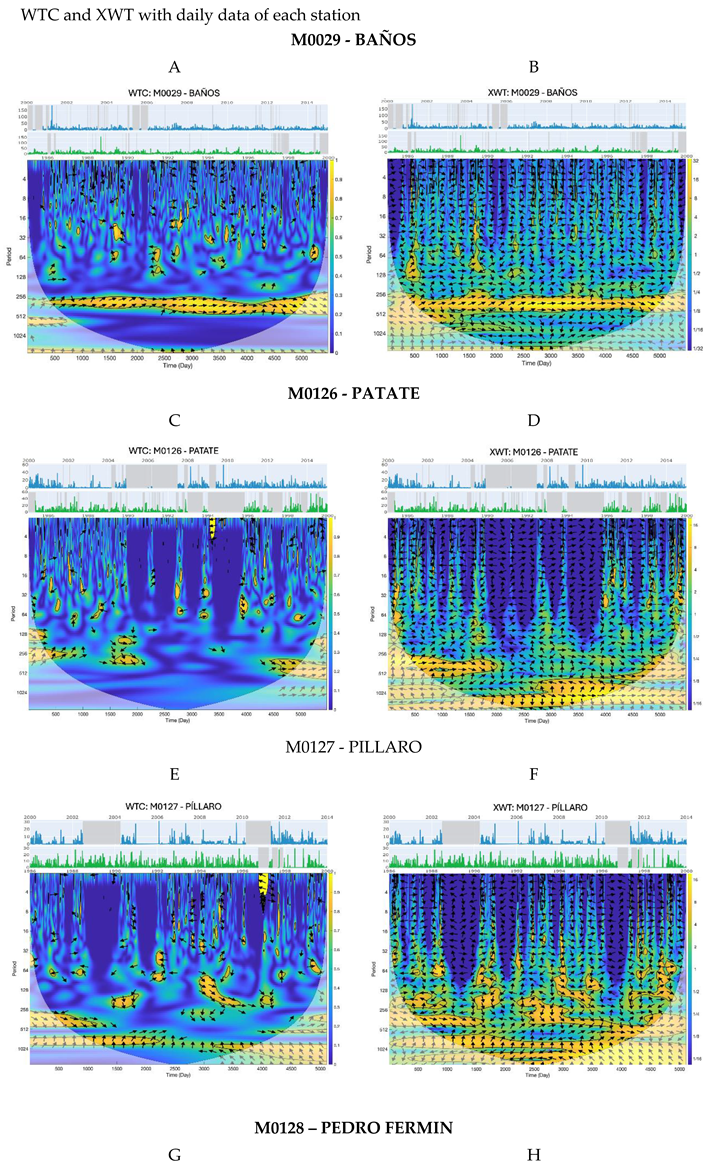
The wavelet analysis conducted using daily data is presented in Annex 1 and is consistent with the results shown in the monthly-scale analysis.
Figure 12.
Wavelet Coherence (WTC, left) and Cross-Wavelet Transform (XWT, right) for the Baños station. The upper panels show the selected time series: 15 years before and 15 years after the year 2000 (grey segments in the time series represent periods with missing data and should therefore not be interpreted).
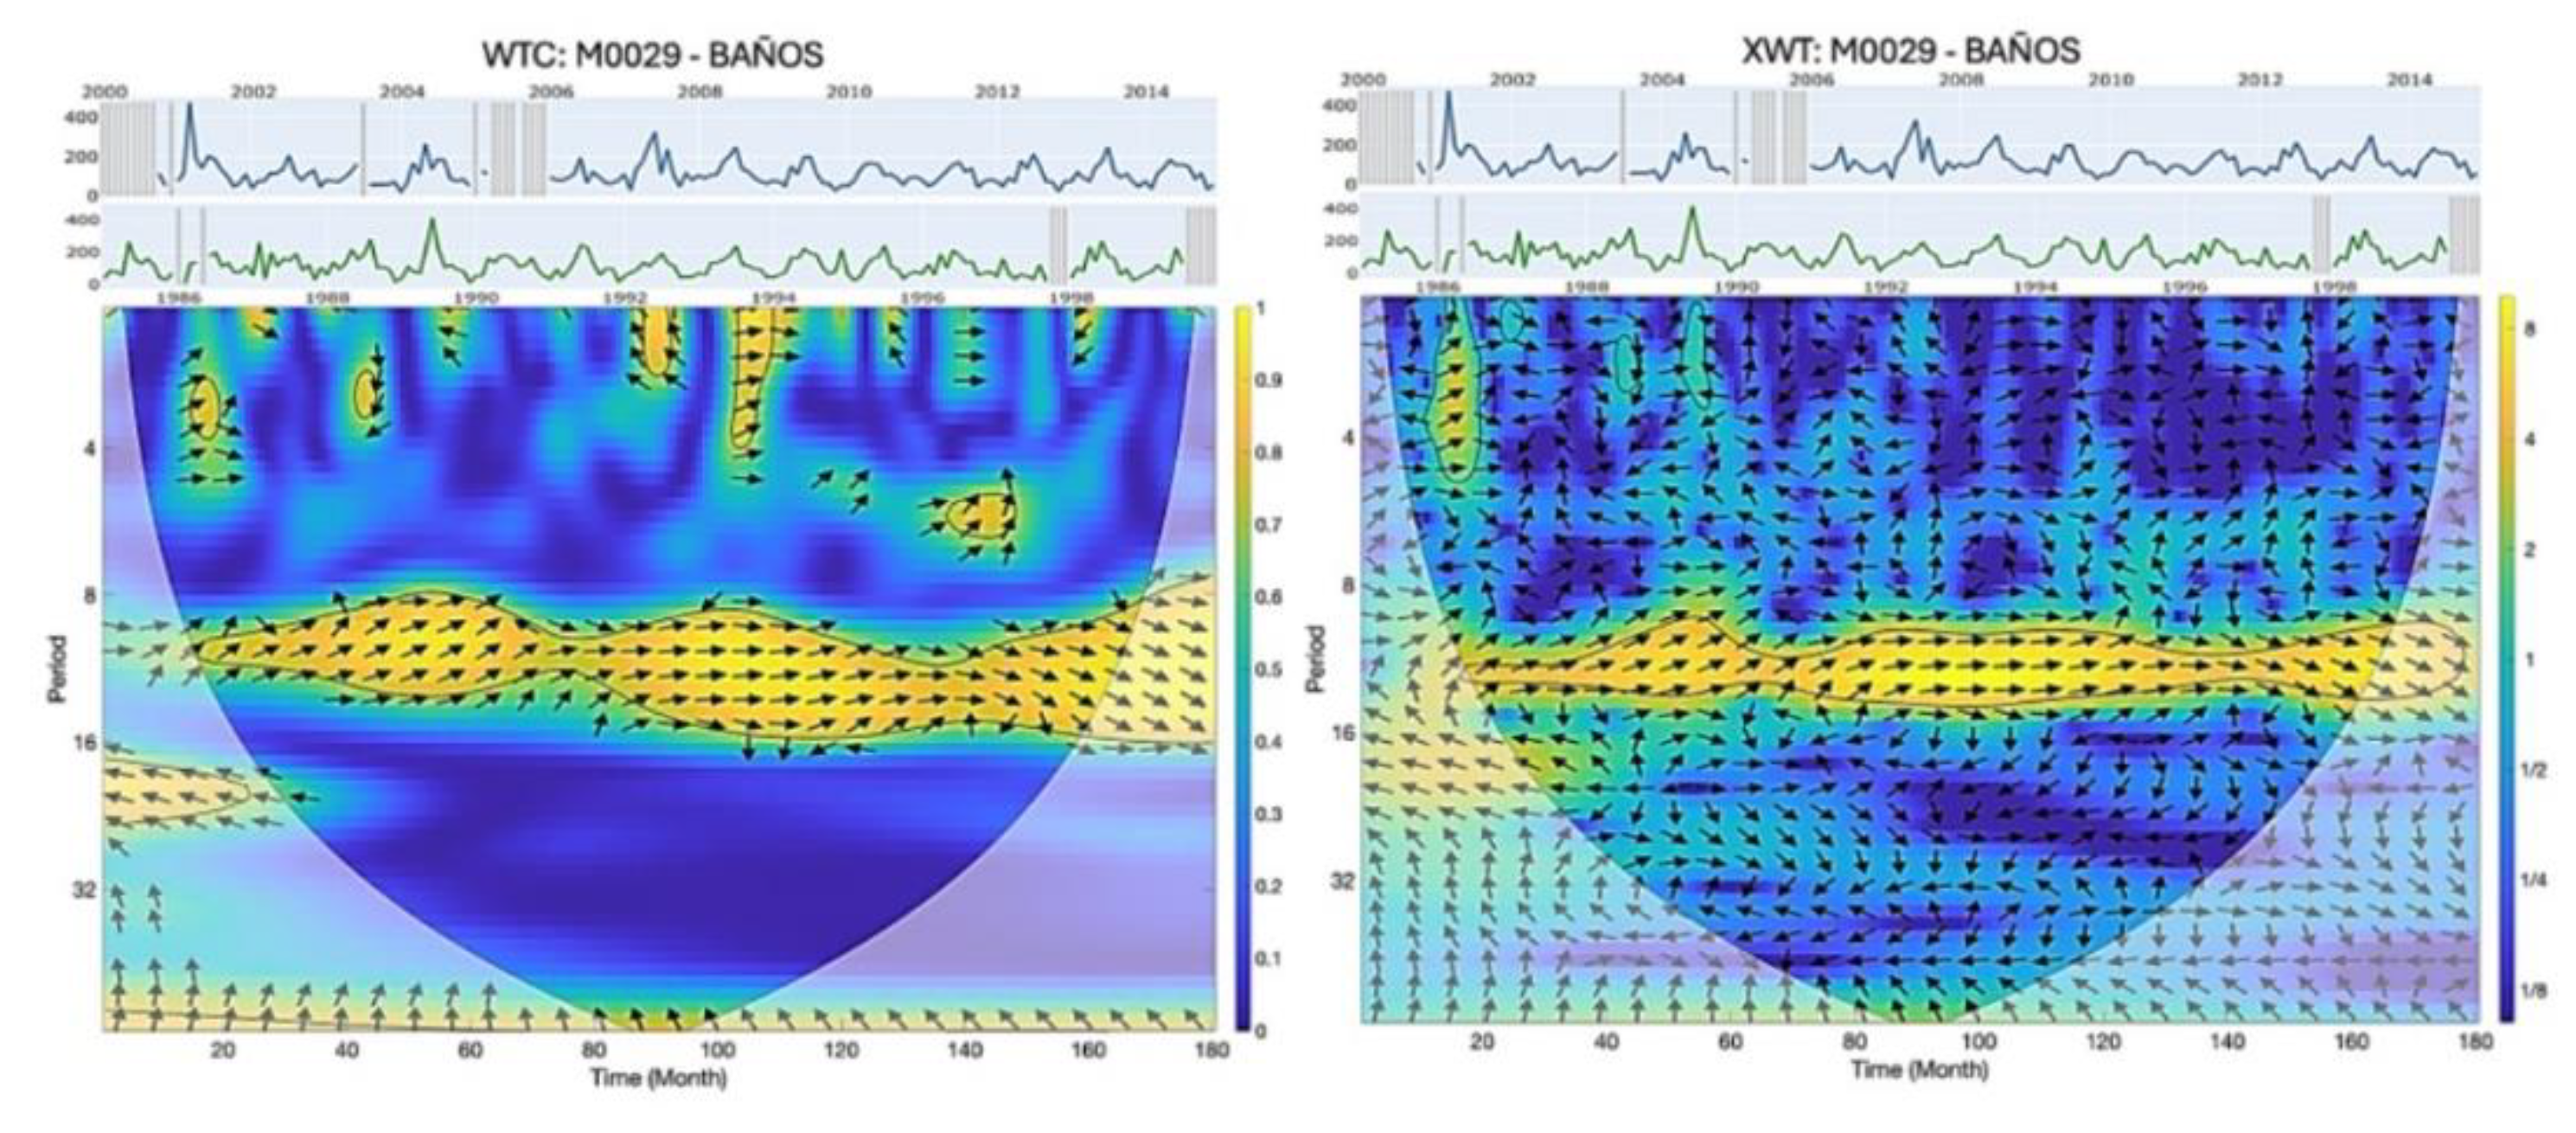
In the case of Baños, significant areas of high coherence are observed near the 12-month period, confirming the strong unimodal seasonality of the series. The black arrows indicate the relative phase between the two series: arrows pointing to the right denote in-phase synchronization, whereas arrows pointing to the left denote anti-phase behavior. In this case, the arrows predominantly point to the right within regions of high coherence, indicating synchronized behavior across most of the series. However, slight advances in the rainy season are observed during the first four years (left side of the plot), and slight delays occur in the most recent years (right side), for both WTC and XWT.
In the WTC analysis (left panel), additional periodicities near 3 and 6 months are identified, although they do not persist over time. In contrast, the XWT plot (right panel), which is more sensitive to high-intensity rainfall events, displays a pronounced yellow region near the year 2001, reflecting the influence of elevated rainfall intensities.
In Figure 13, the high sensitivity of wavelet analysis to missing data becomes evident. The areas lacking coherence and correlation are attributable to data gaps rather than to climatic causes. It is important to note that a major limitation of this study is the absence of continuous time series.
It should also be mentioned that Patate is a station where, despite exhibiting the typical Amazonian seasonal pattern, the total accumulated rainfall is more similar to that of the Andean region. This indicates that the station is located in a transitional zone, which could justify the presence of the three identified periodicities.
Figure 14.
A) Wavelet Coherence (WTC) and B) Cross-Wavelet Transform (XWT) for the Pillaro station. The upper panels show the selected time series: 14 years before and 14 years after the year 2000 (grey segments in the time series represent periods with missing data).
Figure 14.
A) Wavelet Coherence (WTC) and B) Cross-Wavelet Transform (XWT) for the Pillaro station. The upper panels show the selected time series: 14 years before and 14 years after the year 2000 (grey segments in the time series represent periods with missing data).
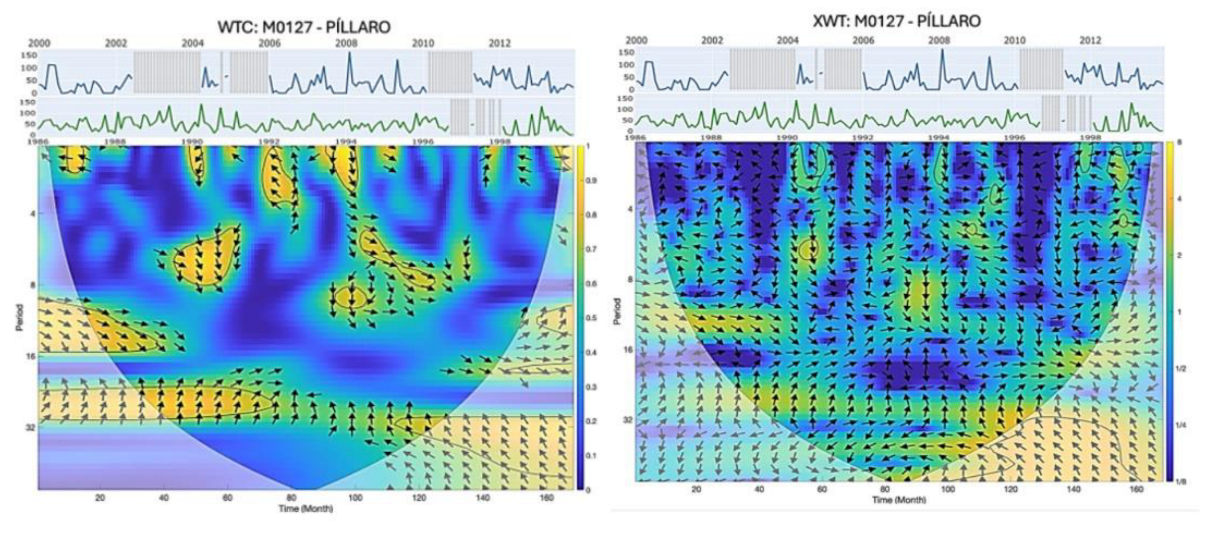
A similar situation is observed at the Pillaro station; however, in this case the coherence around the 6- and 3-month periods is stronger, reflecting the bimodal rainfall pattern characteristic of the Andean region. Likewise, the advances and delays are consistent, indicating that the seasonal signals are not synchronized.
At Pedro Fermín (Figure 15), significant common periodicities at 12, 6, and 3 months are also evident. However, in this case there are areas of high coherence, particularly at the 12-month period, with arrows predominantly pointing to the right, indicating a synchronized relationship during these intervals. This station showed the most pronounced advances in the onset of the rainy season, as indicated by the arrows pointing upward.
Figure 15.
A) Wavelet Coherence (WTC) and B) Cross-Wavelet Transform (XWT) for the Pedro Fermín station. The upper panels show the selected time series: 16 years before and 16 years after the year 2000 (grey segments in the time series represent periods with missing data).
Figure 15.
A) Wavelet Coherence (WTC) and B) Cross-Wavelet Transform (XWT) for the Pedro Fermín station. The upper panels show the selected time series: 16 years before and 16 years after the year 2000 (grey segments in the time series represent periods with missing data).
Figure 16.
A) Wavelet Coherence (WTC) and B) Cross-Wavelet Transform (XWT) for the Querochaca station. The upper panels show the selected time series before and after the year 2000 (grey segments in the time series represent periods with missing data).
Figure 16.
A) Wavelet Coherence (WTC) and B) Cross-Wavelet Transform (XWT) for the Querochaca station. The upper panels show the selected time series before and after the year 2000 (grey segments in the time series represent periods with missing data).
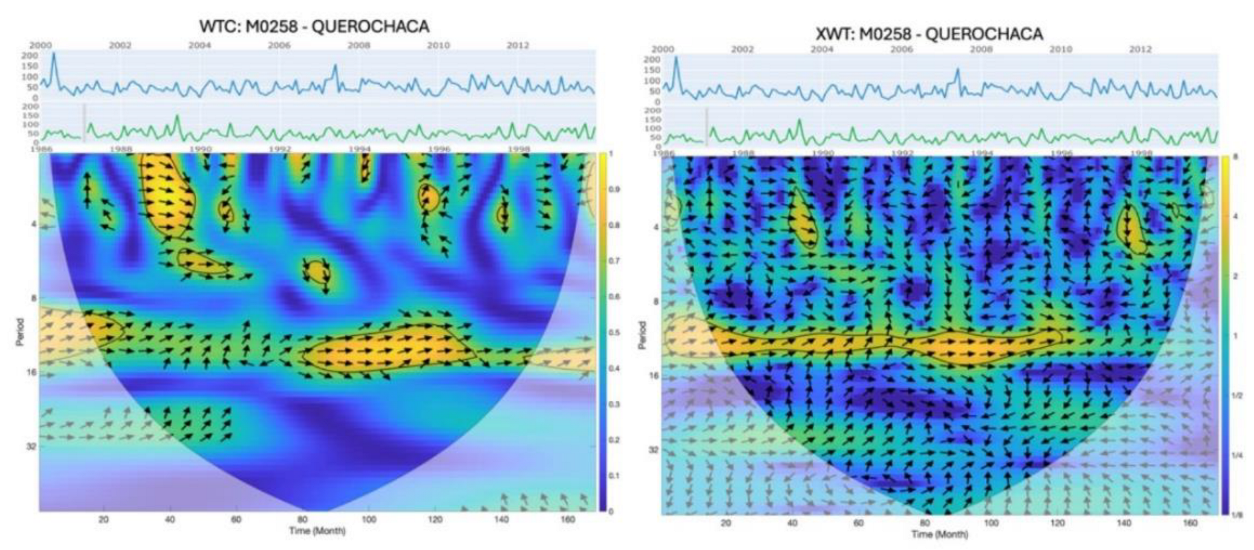
The Querochaca time series are the most complete in this study. In this case, the common periodicities around 12, 6, and 3 months—typical of Andean stations—are more clearly evident. Likewise, the arrows oriented mostly to the right indicate that the series are synchronized at these periods; however, slight advances and delays in seasonality are still observed.
4. Discussion
The findings of this study provide clear evidence of the presence of climate change in the region, primarily reflected in the consistent and statistically significant increase in both maximum and minimum temperatures across the stations. However, this climatic signal is not mirrored in extreme rainfall behavior, for which no statistically significant trends were detected. Nonetheless, the harmonic analysis reveals both advances and delays in the onset of the rainy season, indicating modifications in seasonal timing even in the absence of a detectable intensification in extreme precipitation.
When comparing the present results with methodologies used globally to detect shifts in rainy-season onset and cessation, a clear contrast emerges between locally calibrated threshold-based definitions and more advanced regional or frequency-domain approaches. Threshold methods—commonly used in Africa and tropical regions—provide intuitive and agriculturally relevant indicators but are highly sensitive to arbitrary cutoff values and to data gaps [30,31]. More recent frameworks, such as the flexible driest-period method, demonstrate that part of the apparent shifts in rainy-season timing may arise from methodological choices rather than true climatic changes, especially in transitional climates [32]. Regional-scale approaches based on multivariate analysis, such as PCA, reduce noise and yield robust signals of onset and cessation but require dense and continuous datasets, which remain a limitation in our study area [33]. Large-scale gridded diagnostics, such as the RADS dataset, offer globally consistent seasonality metrics; however, they smooth local features and inherit biases from gridded precipitation products [34]. Within this landscape of methodologies, harmonic and wavelet-based analyses—as applied in the present study—offer a complementary advantage by directly examining changes in phase and periodicity of the annual rainfall cycle, which helps detect advances and delays even under high data variability.
The results therefore highlight the usefulness of harmonic analysis for identifying shifts in seasonal timing, although the method is highly sensitive to missing data. Farmers’ perceptions in the study area are consistent with the identified advances and delays; however, these shifts occur throughout the time series and, based on the methodology applied here, cannot be attributed directly to climate change.
One of the main limitations of this study is the lack of sufficiently complete time series, as data gaps substantially affect harmonic analysis. Data-infilling techniques were not employed because they tend to introduce artificial or persistent relationships that can bias frequency-domain results. Finally, the inflection point estimated around the year 2000 is not uniform across all stations, suggesting that the determination of climatic shifts should be revisited using more advanced mathematical techniques such as windowing or bootstrapping [22].
5. Conclusions
This study demonstrates that harmonic analysis is a valuable approach for detecting advances and delays in the timing of rainy and dry seasons, particularly in regions characterized by complex transitional climatology. Stations with more complete and continuous datasets, such as Baños (Amazonian influence) and Querochaca (Andean region), exhibit well-defined seasonal cycles in which shifts in timing are present but relatively modest. In contrast, intermediate stations like Pedro Fermín display more pronounced advances and delays, likely reflecting their position within a transitional zone between Amazonian and Andean rainfall regimes. This transitional location enhances sensitivity to variations in moisture transport—from the Amazon during the wet season, or from the onset of the Amazonian dry season—which can influence both the advancement and delay of the Andean rainy season.
The findings also complement global evidence showing that shifts in rainy-season timing depend strongly on the methodology used to define onset and cessation, as well as on data continuity. While harmonic analysis provides additional insight by capturing phase changes in the annual rainfall cycle, the presence of substantial data gaps remains a key limitation and highlights the need for more robust and continuous long-term precipitation records.
Future research should focus on identifying station-specific inflection points using advanced statistical frameworks—such as windowing, bootstrapping, or flexible climatological-year approaches—to improve the detection of genuine climatic changes rather than methodological artifacts. Nonetheless, the present results suggest that the year 2000 may represent a potential transition in the regional climate system, as shifts in both precipitation patterns and increasing temperature trends become more evident from that period onward.
Appendix A
WTC and XWT with daily data of each station
References
- Ortiz Tirado, P.X.; Serrano Vincenti, M.S.F. Crisis Climática en los Andes. Una Panorámica en Torno a sus Impactos, Adaptaciones y Respuestas. In Colapso climático en la región Andina: Dimensiones ecosistémicas, socioeconómicas y sociopolíticas; Editorial Universitaria Abya-Yala, 2024; pp. 15–56. ISBN 978-9978-10-995-3. [Google Scholar]
- Cordero, R.; Feron, S.; Damiani, A.; Llanillo, P.; Carrasco, J.; Jorquera, J.; Sepúlveda Araya, E.; Carrera, J. Cambio Climático - Respuestas a Las Preguntas Claves; (in Spanish). 2019; ISBN 978-956-401-251-3. [Google Scholar]
- Wang, M.; Zhang, Z.; Hu, T.; Liu, X. A Practical Single-Channel Algorithm for Land Surface Temperature Retrieval: Application to Landsat Series Data. Journal of Geophysical Research: Atmospheres 2019, 124, 299–316. [Google Scholar] [CrossRef]
- Serrano Vincenti, S.; Ruiz, J.C.; Bersosa, F. Heavy rainfall and temperature proyections in a climate change scenario over Quito, Ecuador. La Granja 2016, 25, 16. [Google Scholar] [CrossRef]
- Toulkeridis, T.; Tamayo, E.; Simón-Baile, D.; Merizalde-Mora, M.J.; Reyes -Yunga, D.F.; Viera-Torres, M.; Heredia, M. Climate Change According to Ecuadorian Academics-Perceptions versus Facts. Granja 2020, 31, 21–49. [Google Scholar] [CrossRef]
- Montenegro, M.; Campozano, L.; Urdiales-Flores, D.; Maisincho, L.; Serrano-Vincenti, S.; Borbor-Cordova, M.J. Assessment of the Impact of Higher Temperatures Due to Climate Change on the Mortality Risk Indexes in Ecuador Until 2070. Front Earth Sci (Lausanne) 2022, 9. [Google Scholar] [CrossRef]
- Serrano-Vincenti, S.; Guamán-Pozo, J.; Chuqui, J.; Tufiño, R.; Franco-Crespo, C. Measuring the Effects of Climate Change on Traditional Crops in Tropical Highlands, Ecuador. Front Sustain Food Syst 2025, 9. [Google Scholar] [CrossRef]
- Hidalgo, D.; Domínguez, C.G.; Villacís, M.T.; Ruíz, J.C.; Maisincho, L.; Cáceres, B.E.; Crespo-Pérez, V.; Condom, T.; Piedra, D. Carihuairazo glacier retreat and its perception in the cunucyacu community; retroceso del glaciar del Carihuairazo y sus implicaciones en la comunidad de Cunucyacu. Granja 2024, 39, 94–116. [Google Scholar] [CrossRef]
- Mariana, Luna Cadena; Pacheco, K.A. Community-Based Adaptation to Climate Change in Ventanas Subtropical Zone: Validating Climate Projections with In-Situ Data. In Proceedings of the Smart Technologies, Systems and Applications; Narváez Fabián, R., Villa, M.N., Eds.; Springer Nature Switzerland: Cham, 2026; pp. 310–324. [Google Scholar]
- Luna Cadena, M.; Yánez González, L.; Serrano Vincenti, S. Urban Agriculture for Climate Resilience and Sustainability in Quito: A MESMIS-Based Evaluation. In Proceedings of the Proceedings of the 20th International Multidisciplinary Congress on Science and Technology, CIT 2025, Quito, Ecuador, August 2025; pp. 1–12. [Google Scholar]
- García-Parra, M.A.; De La Barrera, F.; Leguizamón, N.Z.P.; Colmenares-Cruz, R.A.; Cancimance, A.; Soler-Fonseca, D. THE SUSTAINABLE DEVELOPMENT GOALS IN AMERICA: OVERVIEW. Granja 2022, 36. [Google Scholar] [CrossRef]
- Antunez, U.G.Q.; Monterroso Rivas, A.I.; Calderon, F.; Adán Guillermo, R.G. Aptitude of coffee (Coffea arabica L.) And cacao (Theobroma cacao l.) Crops considering climate change; Aptitud de los cultivos de café (Coffea arabica L.) Y cacao (Theobroma cacao L.) Considerando escenarios de cambio climático. Granja 2022, 36. [Google Scholar] [CrossRef]
- Arias-Muñoz, P.; Chamorro-Benavides, E.L.; Patiño-Yar, S.A.; Jácome-Aguirre, G.; Rosales, O. Efectos del cambio de uso de suelo y cambio climático en la distribución potencial de la caña de azúcar en el valle del Chota, Ecuador; Effects of change in land use and climate change on the potential distribution of sugarcane at valle del Chota, Ecuador. Granja 2025, 42, 88–103. [Google Scholar] [CrossRef]
- INEC Tungurahua Perfil Demográfico. Censo Ecuador. 2024.
- IPCC Climate Change 2021: The Physical Science Basis. Contribution of Working Group I to the Sixth Assessment Report of the Intergovernmental Panel on Climate Change 2023.
- Gobierno Provincial de Tungurahua Agenda Tungurahua 2019 - 2021. 2021.
- Serrano-Vincenti, S.; Condom, T.; Campozano, L.; Escobar, L.A.; Walpersdorf, A.; Carchipulla-Morales, D.; Villacís, M. Harmonic Analysis of the Relationship between GNSS Precipitable Water Vapor and Heavy Rainfall over the Northwest Equatorial Coast, Andes, and Amazon Regions. 2022, 13, 1809. [Google Scholar] [CrossRef]
- Lanzante, J.R. Resistant, Robust and Non-Parametric Techniques for the Analysis of Climate Data: Theory and Examples, Including Applications to Historical Radiosonde Station Data. International Journal of Climatology 1996, 16, 1197–1226. [Google Scholar] [CrossRef]
- Ocaña, F. Técnicas Estadísticas En Nutrición y Salud: Tratamiento Estadístico de Outliers y Datos Faltantes 2017.
- Chuqui González, J.A. Proyección de Los Índices de Cambio Climático En La Provincia de Tungurahua, al Año 2070 2022.
- Serrano, S.; Reisancho, A.; Lizano, R.; A.M.S.-I., M.J.B.-C. Ecciones Aprendidas al Enfrentar Los Efectos de Eventos Hidrometeorológicos Extremos En Los Sistemas Agrícolas y Servicios Ecosistémicos En. 2016, 24, 69–82. [Google Scholar] [CrossRef]
- Lina, M.; Goulard, B. Daubechies Wavelet — An Overview 1999.
- Da Silva, E.A.B.; Sampson, D.G. Successive Approximation Wavelet Vector Quantization for Image and Video Coding. In Advances in Imaging and Electron Physics; Academic Press, 1996; Vol. 97, pp. 191–255. [Google Scholar]
- Mallat, S. A Wavelet Tour of Signal Processing; Elsevier: Amsterdam, The Netherlands, 1999; ISBN 9780080520834. [Google Scholar]
- Vilani, M.T.; Reis, N.M. da S.; Pinto Junior, O.B.; Novais, J.W.Z. Coerência Wavelets Em Variável Temperatura Do Ar Em Área Do Bioma Pantaneiro e Área de Alta Densidade Construtiva. Ensaios e Ciência: Ciências Biológicas, Agrárias e da Saúde 2018, 22, 5–11. [Google Scholar] [CrossRef]
- MathWorks Wavelet Toolbox 2024.
- Sun, Y.; Greaves, D.A.; Orgs, G.; Hamilton, A.F. de C.; Day, S.; Ward, J.A. Using Wearable Sensors to Measure Interpersonal Synchrony in Actors and Audience Members During a Live Theatre Performance. Proc ACM Interact Mob Wearable Ubiquitous Technol 2023, 7, 1–29. [Google Scholar] [CrossRef]
- Grinsted, A.; Moore, J.C.; Jevrejeva, S. Application of the Cross Wavelet Transform and Wavelet Coherence to Geophysical Time Series. Nonlinear Process Geophys 2004, 11, 561–566. [Google Scholar] [CrossRef]
- Sun, Y.; Greaves, D.A.; Orgs, G.; de C. Hamilton, A.F.; Day, S.; Ward, J.A. Using Wearable Sensors to Measure Interpersonal Synchrony in Actors and Audience Members During a Live Theatre Performance. Proc ACM Interact Mob Wearable Ubiquitous Technol 2023, 7, 1–29. [Google Scholar] [CrossRef]
- Atiah, W.A.; Muthoni, F.K.; Kotu, B.; Kizito, F.; Amekudzi, L.K. Trends of Rainfall Onset, Cessation, and Length of Growing Season in Northern Ghana: Comparing the Rain Gauge, Satellite, and Farmer’s Perceptions. Atmosphere (Basel) 2021, 12, 1674. [Google Scholar] [CrossRef]
- Omay, P.O.; Muthama, N.J.; Oludhe, C.; Kinama, J.M.; Artan, G.; Atheru, Z. Changes and Variability in Rainfall Onset, Cessation, and Length of Rainy Season in the IGAD Region of Eastern Africa. Theor Appl Climatol 2023, 152, 1–23. [Google Scholar] [CrossRef]
- Ferijal, T.; Batelaan, O.; Shanafield, M.; Alfahmi, F. Determination of Rainy Season Onset and Cessation Based on a Flexible Driest Period. Theor Appl Climatol 2022, 148, 91–104. [Google Scholar] [CrossRef]
- Moron, V.; Robertson, A.W.; Boer, R. Regional-Scale Rainy Season Onset Detection: A New Approach Based on Multivariate Analysis. J Clim 2013, 26, 8329–8349. [Google Scholar] [CrossRef]
- Bombardi, R.J.; Kinter, J.L.; Frauenfeld, O.W. A Global Gridded Dataset of the Characteristics of the Rainy and Dry Seasons. Bull Am Meteorol Soc 2019, 100, 1315–1328. [Google Scholar] [CrossRef]
Figure 1.
Location of the meteorological stations in Tungurahua Province; the violet outline indicates the boundary of the province.
Figure 1.
Location of the meteorological stations in Tungurahua Province; the violet outline indicates the boundary of the province.
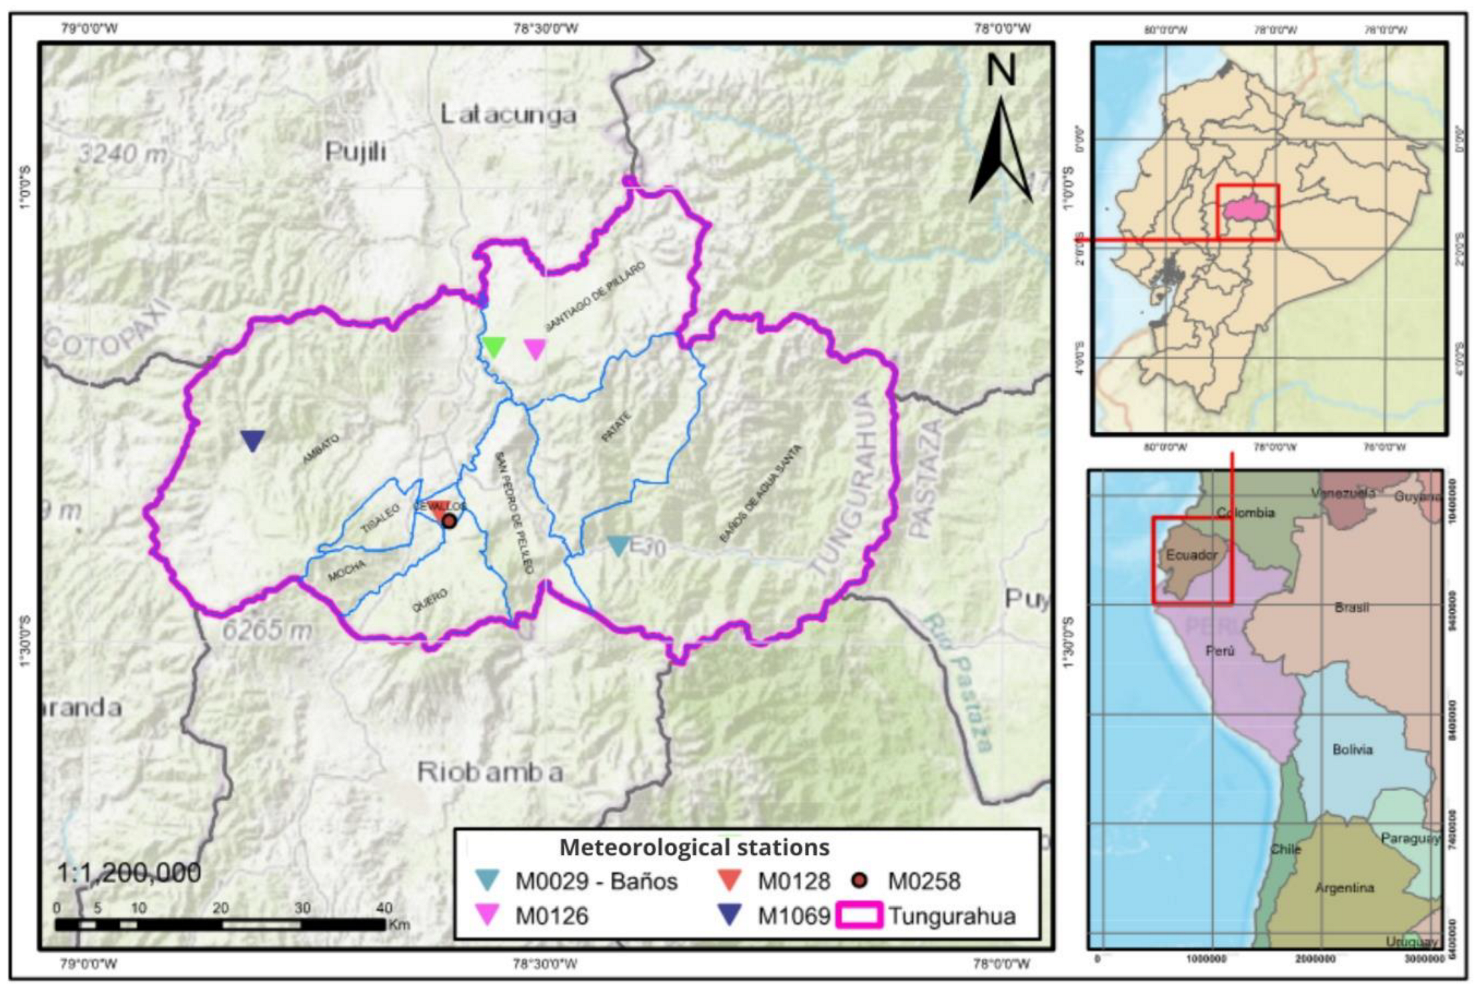
Figure 2.
Daily precipitation time series from the six stations included in the study [15].
Figure 2.
Daily precipitation time series from the six stations included in the study [15].
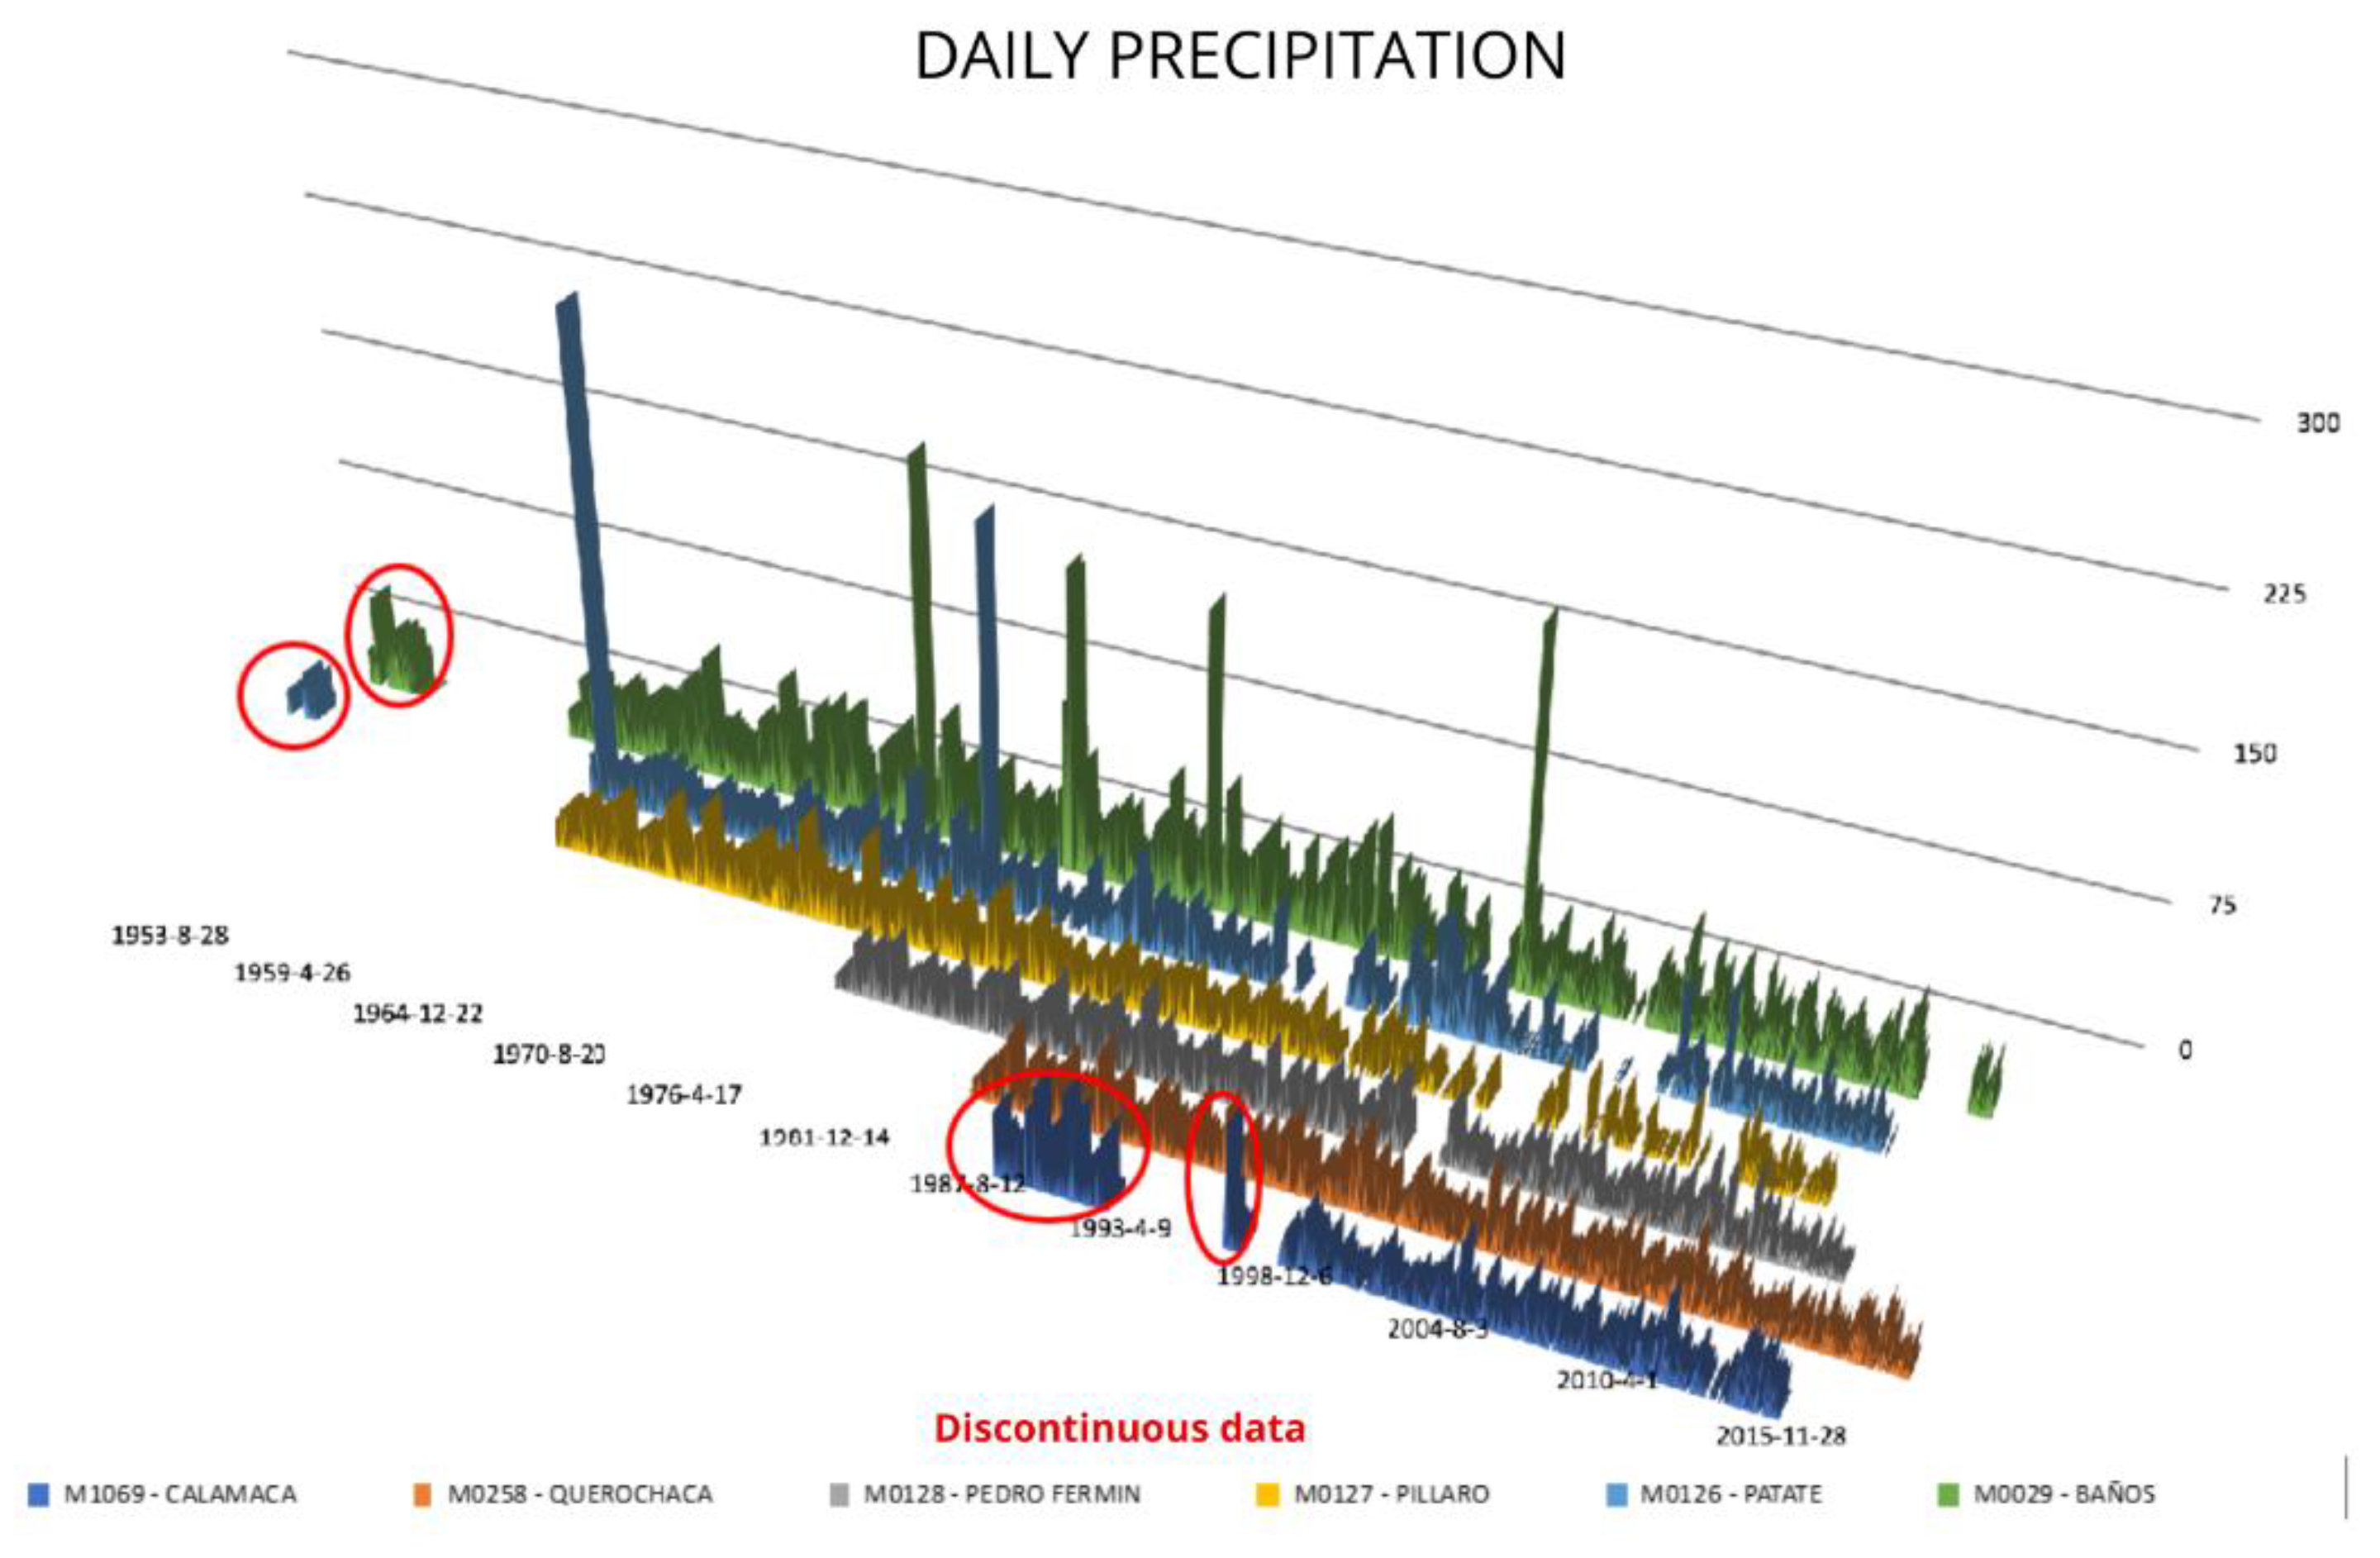
Figure 3.
Daily precipitation series from the six stations included in the study after quality control. The grey-shaded areas indicate periods with missing data.
Figure 3.
Daily precipitation series from the six stations included in the study after quality control. The grey-shaded areas indicate periods with missing data.
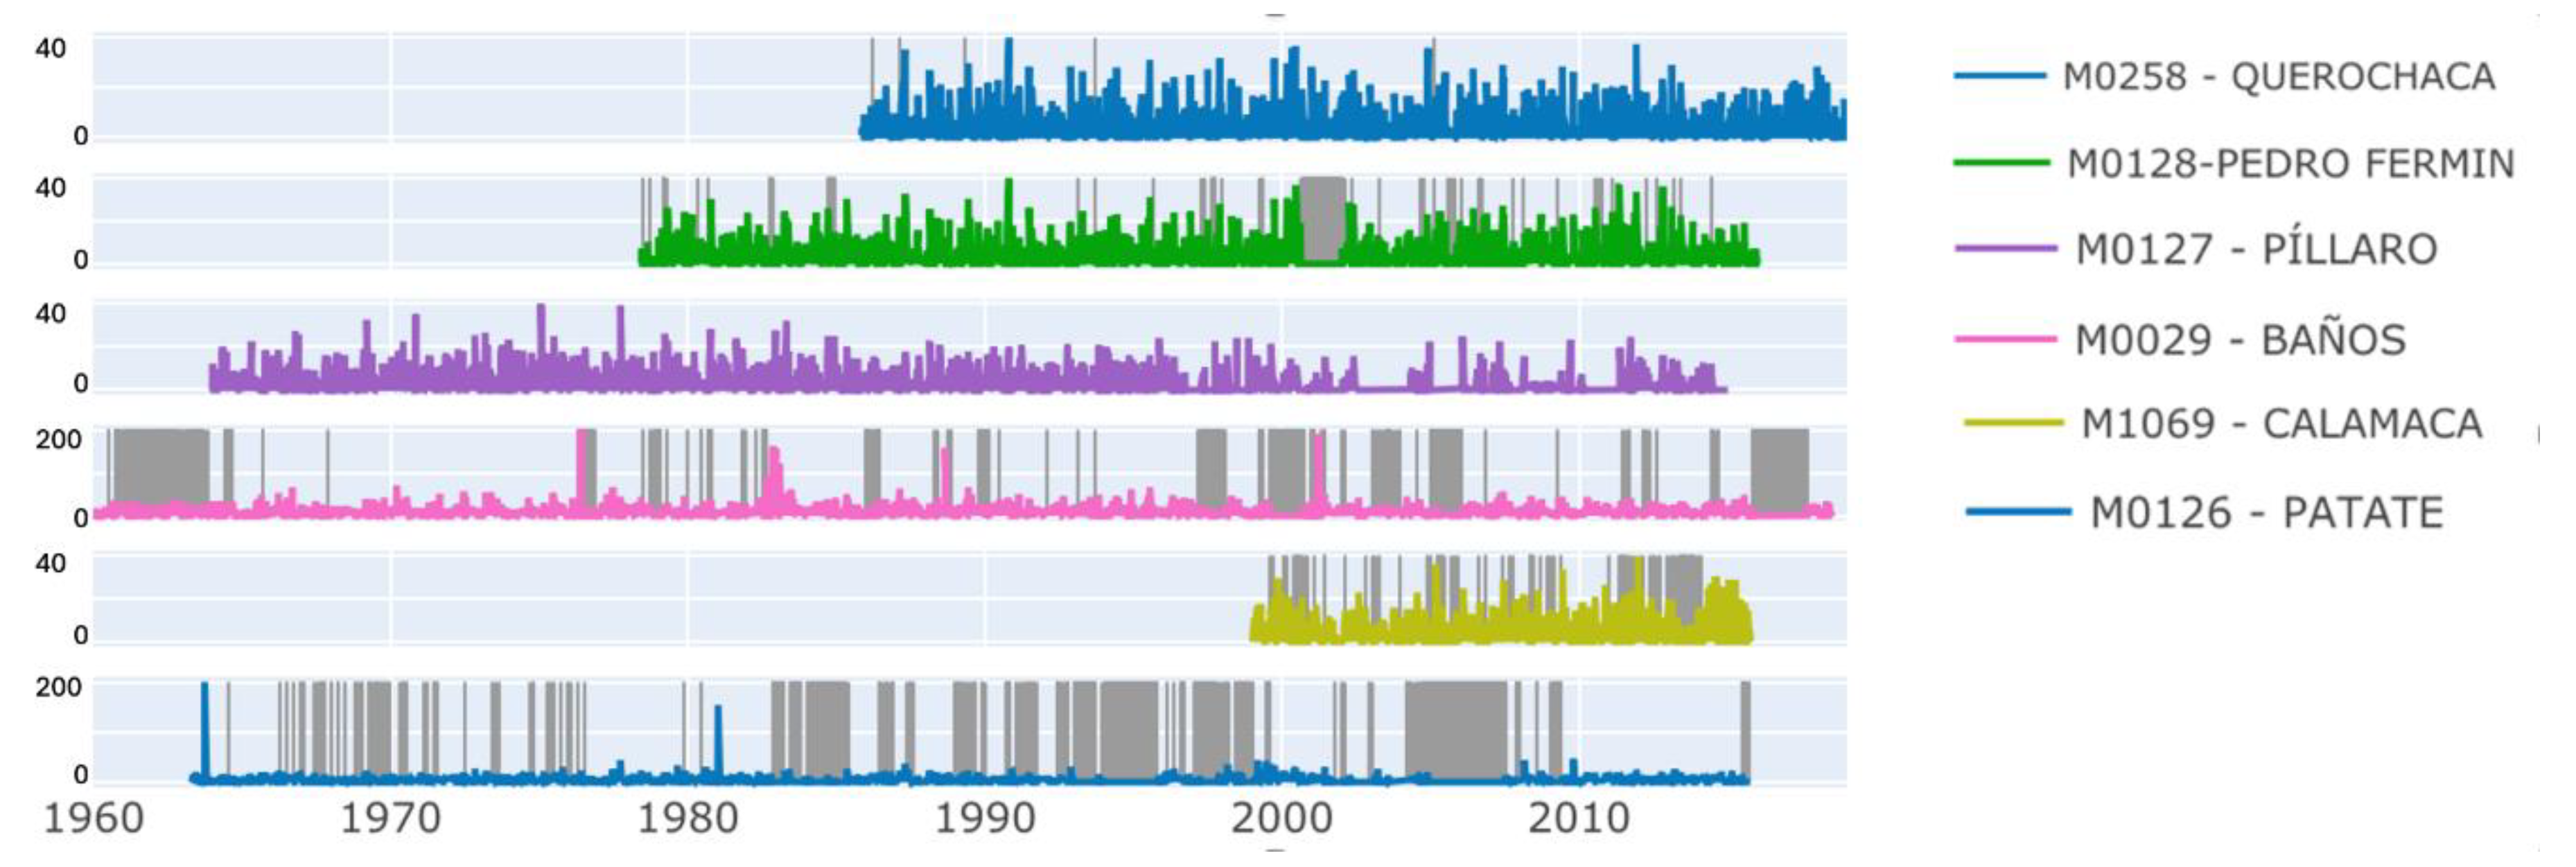
Figure 4.
Monthly accumulated time series. The grey-shaded areas indicate periods with missing data.
Figure 4.
Monthly accumulated time series. The grey-shaded areas indicate periods with missing data.
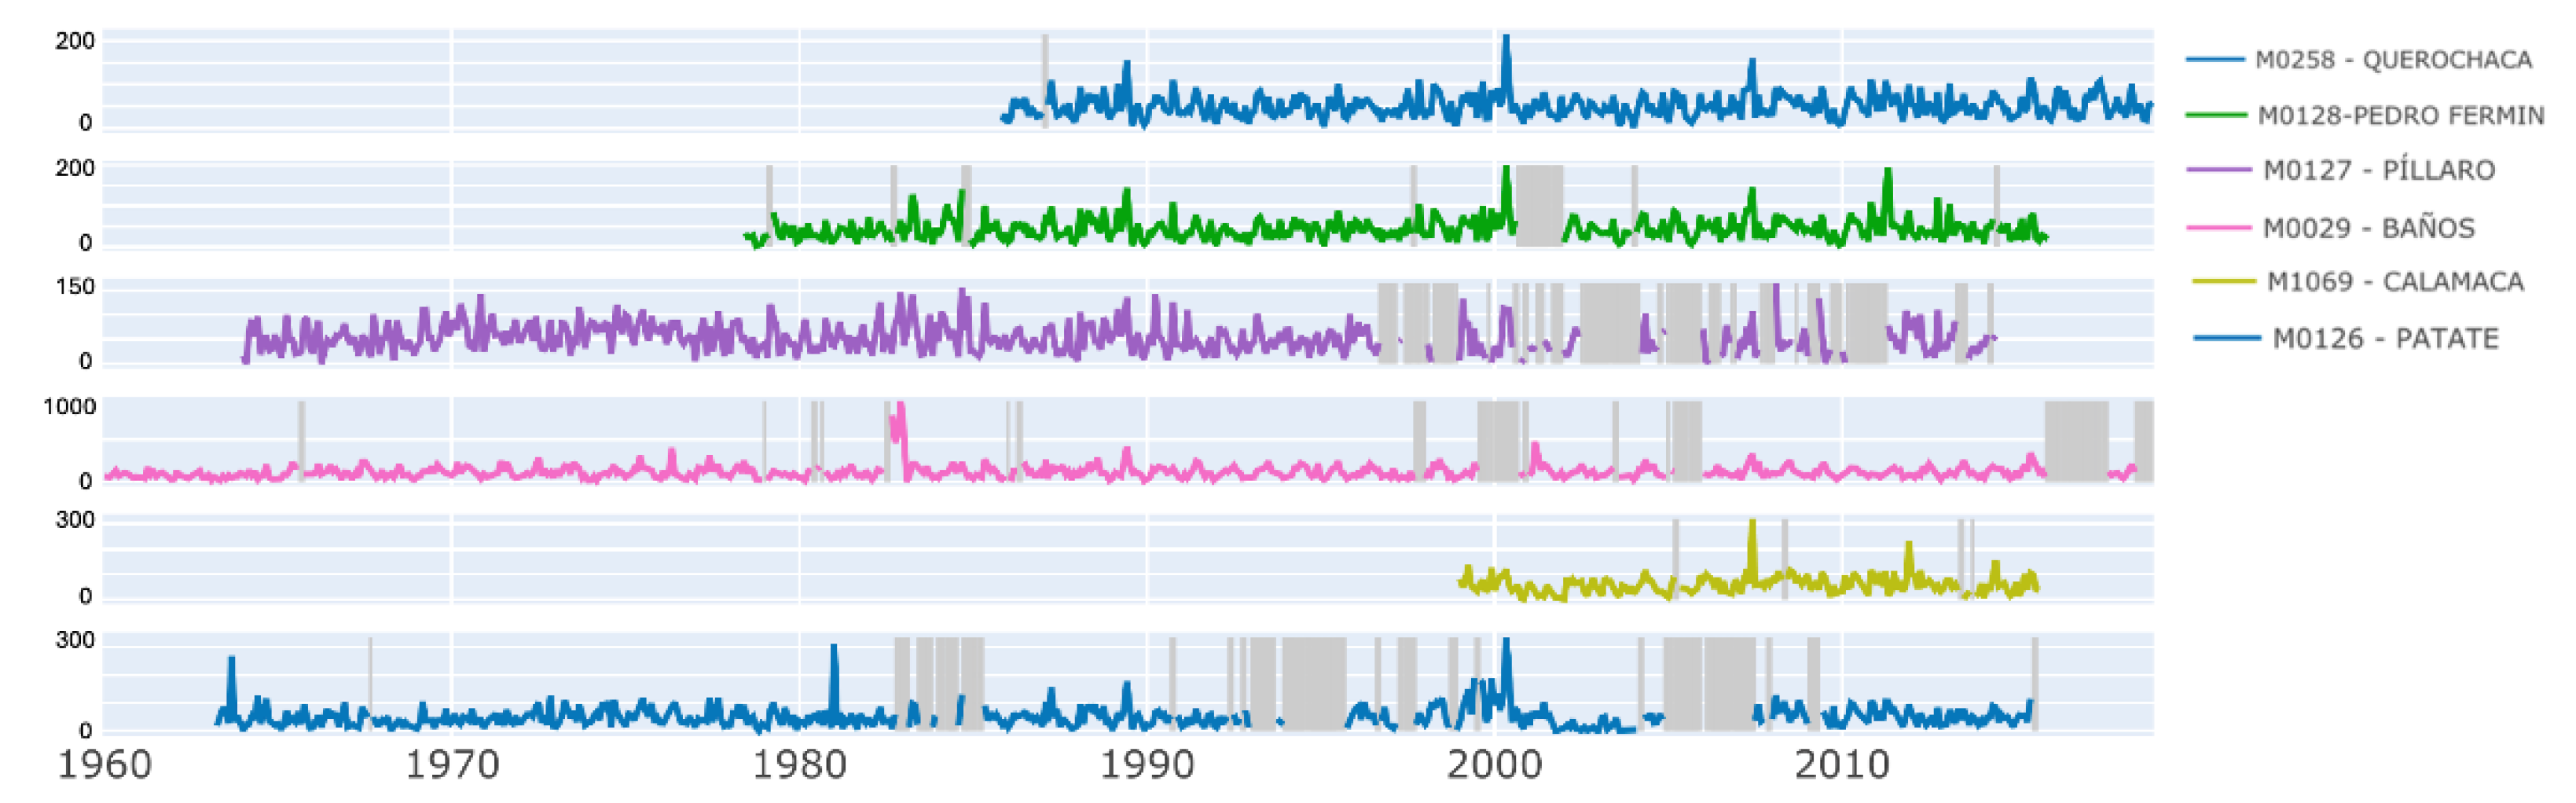
Figure 5.
Result of the accumulated rainfall index PRCPTOT. The red line represents the comparison period before and after the year 2000.
Figure 5.
Result of the accumulated rainfall index PRCPTOT. The red line represents the comparison period before and after the year 2000.
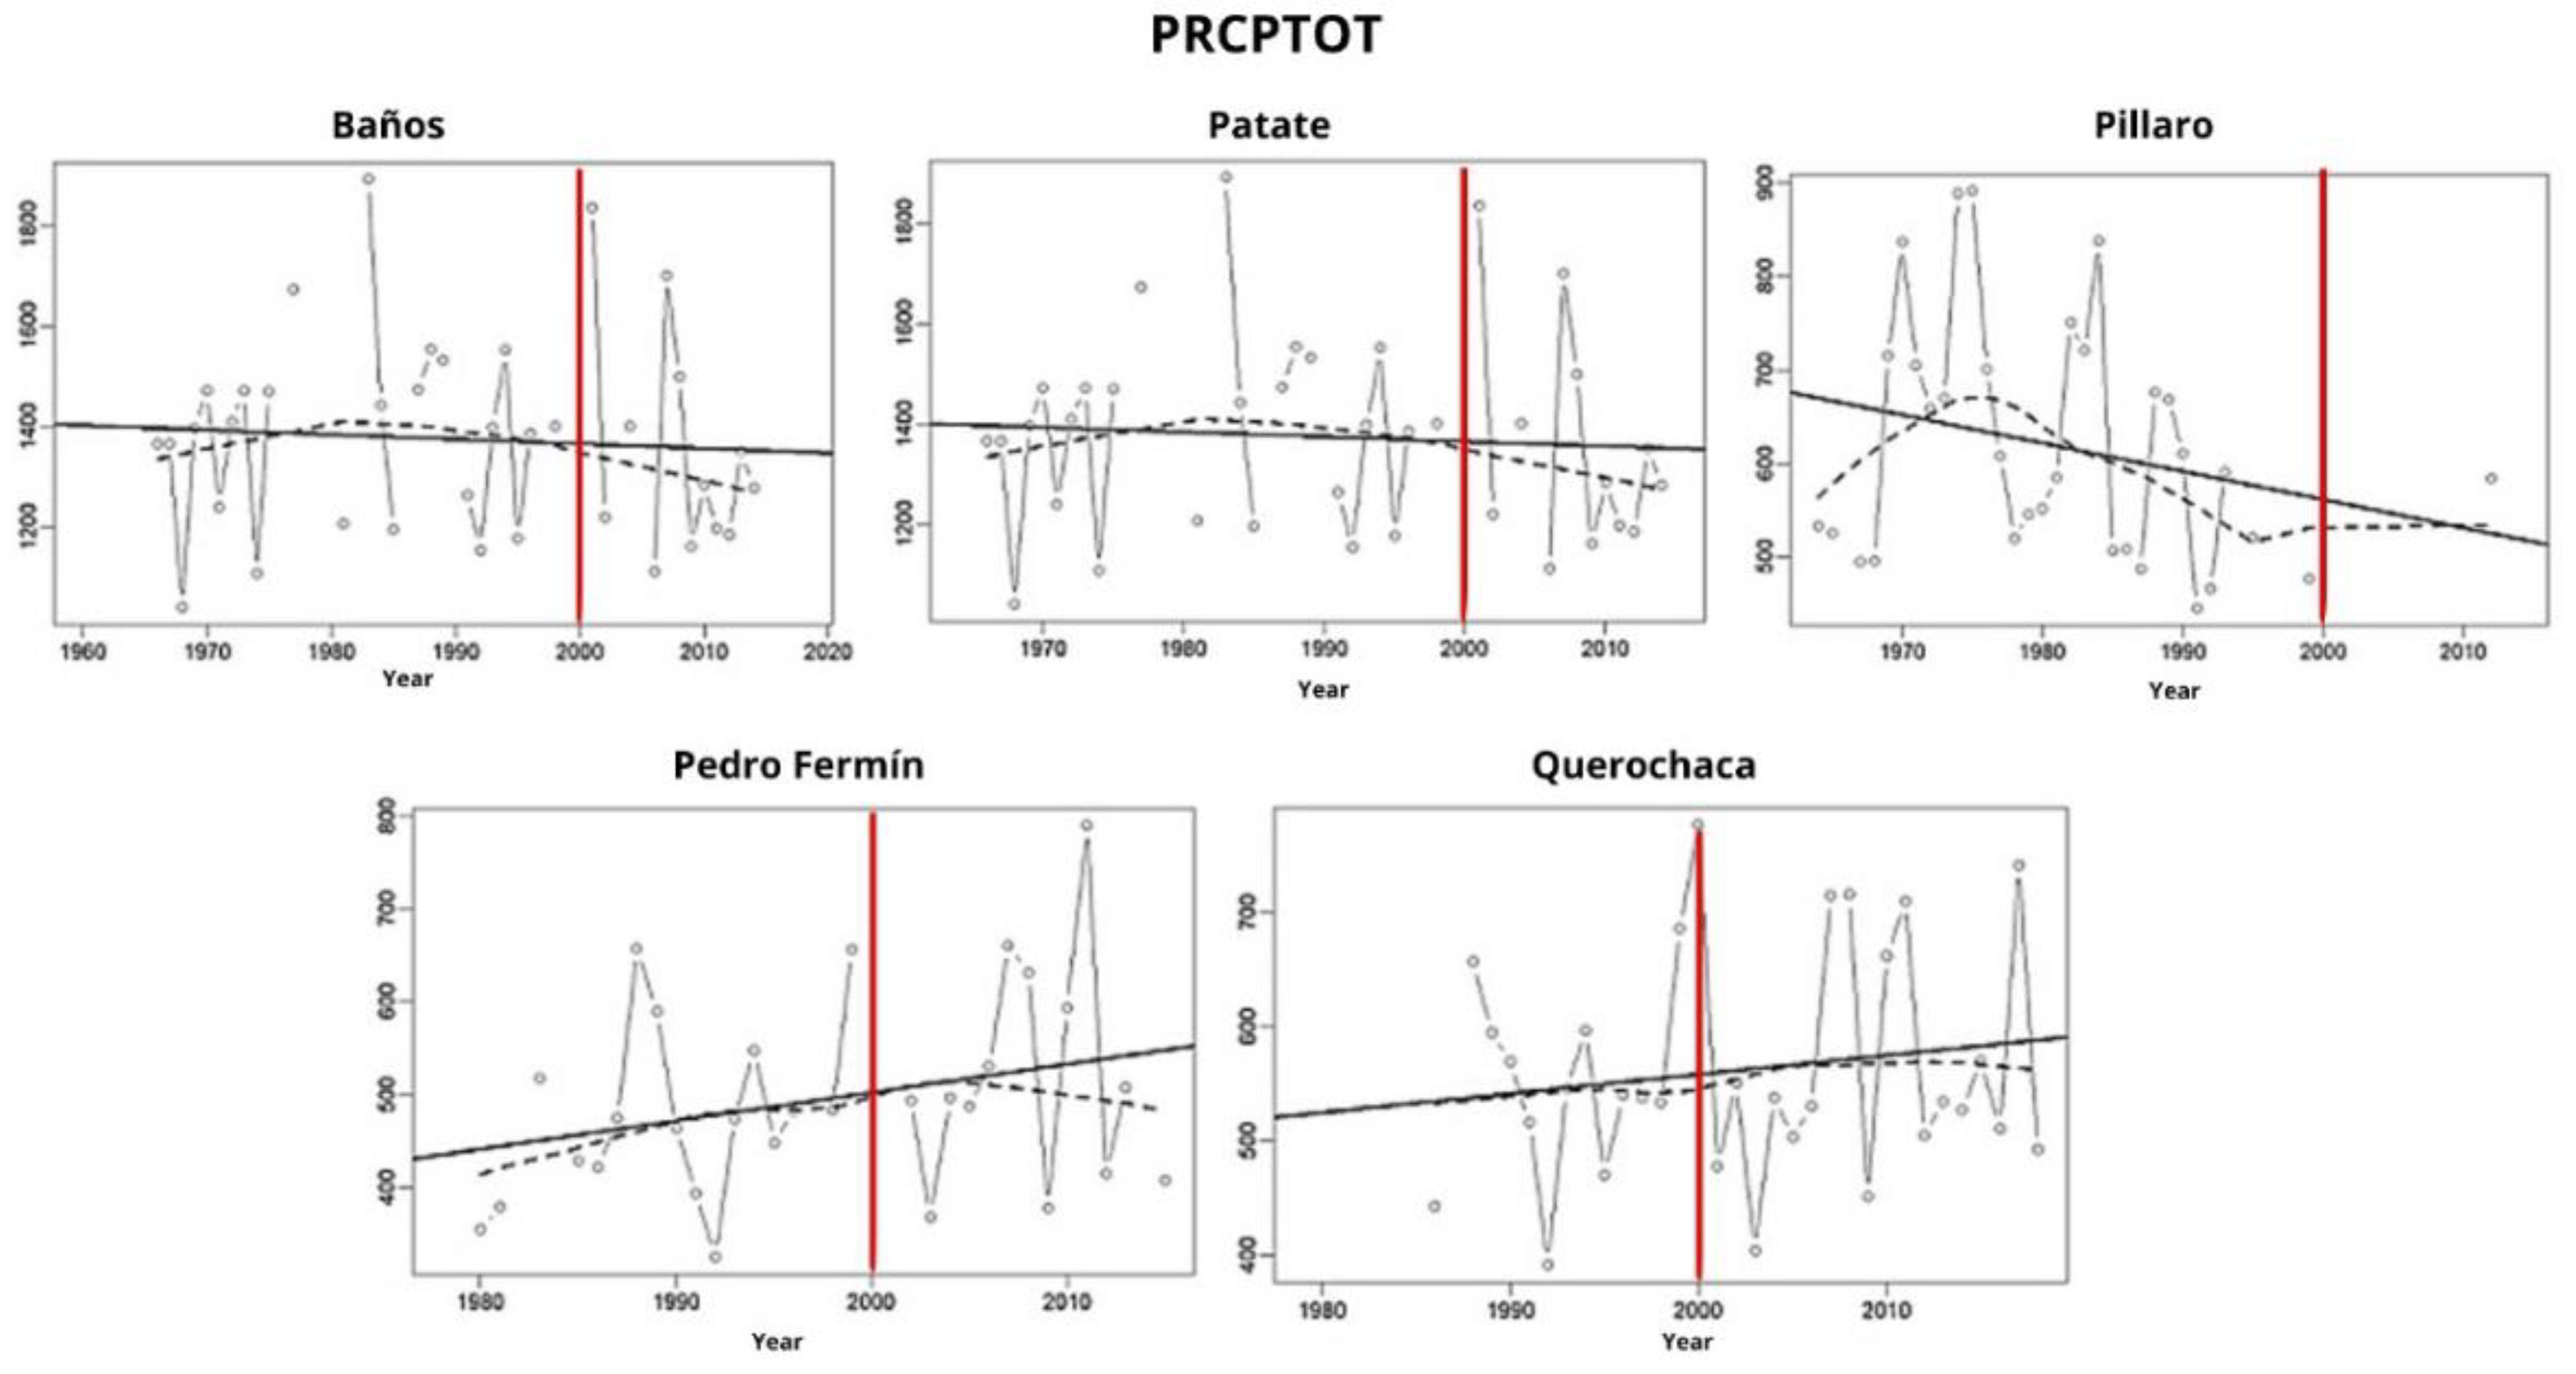
Figure 6.
Result of the R95p index (Very wet days). The red line represents the comparison period before and after the year 2000.
Figure 6.
Result of the R95p index (Very wet days). The red line represents the comparison period before and after the year 2000.
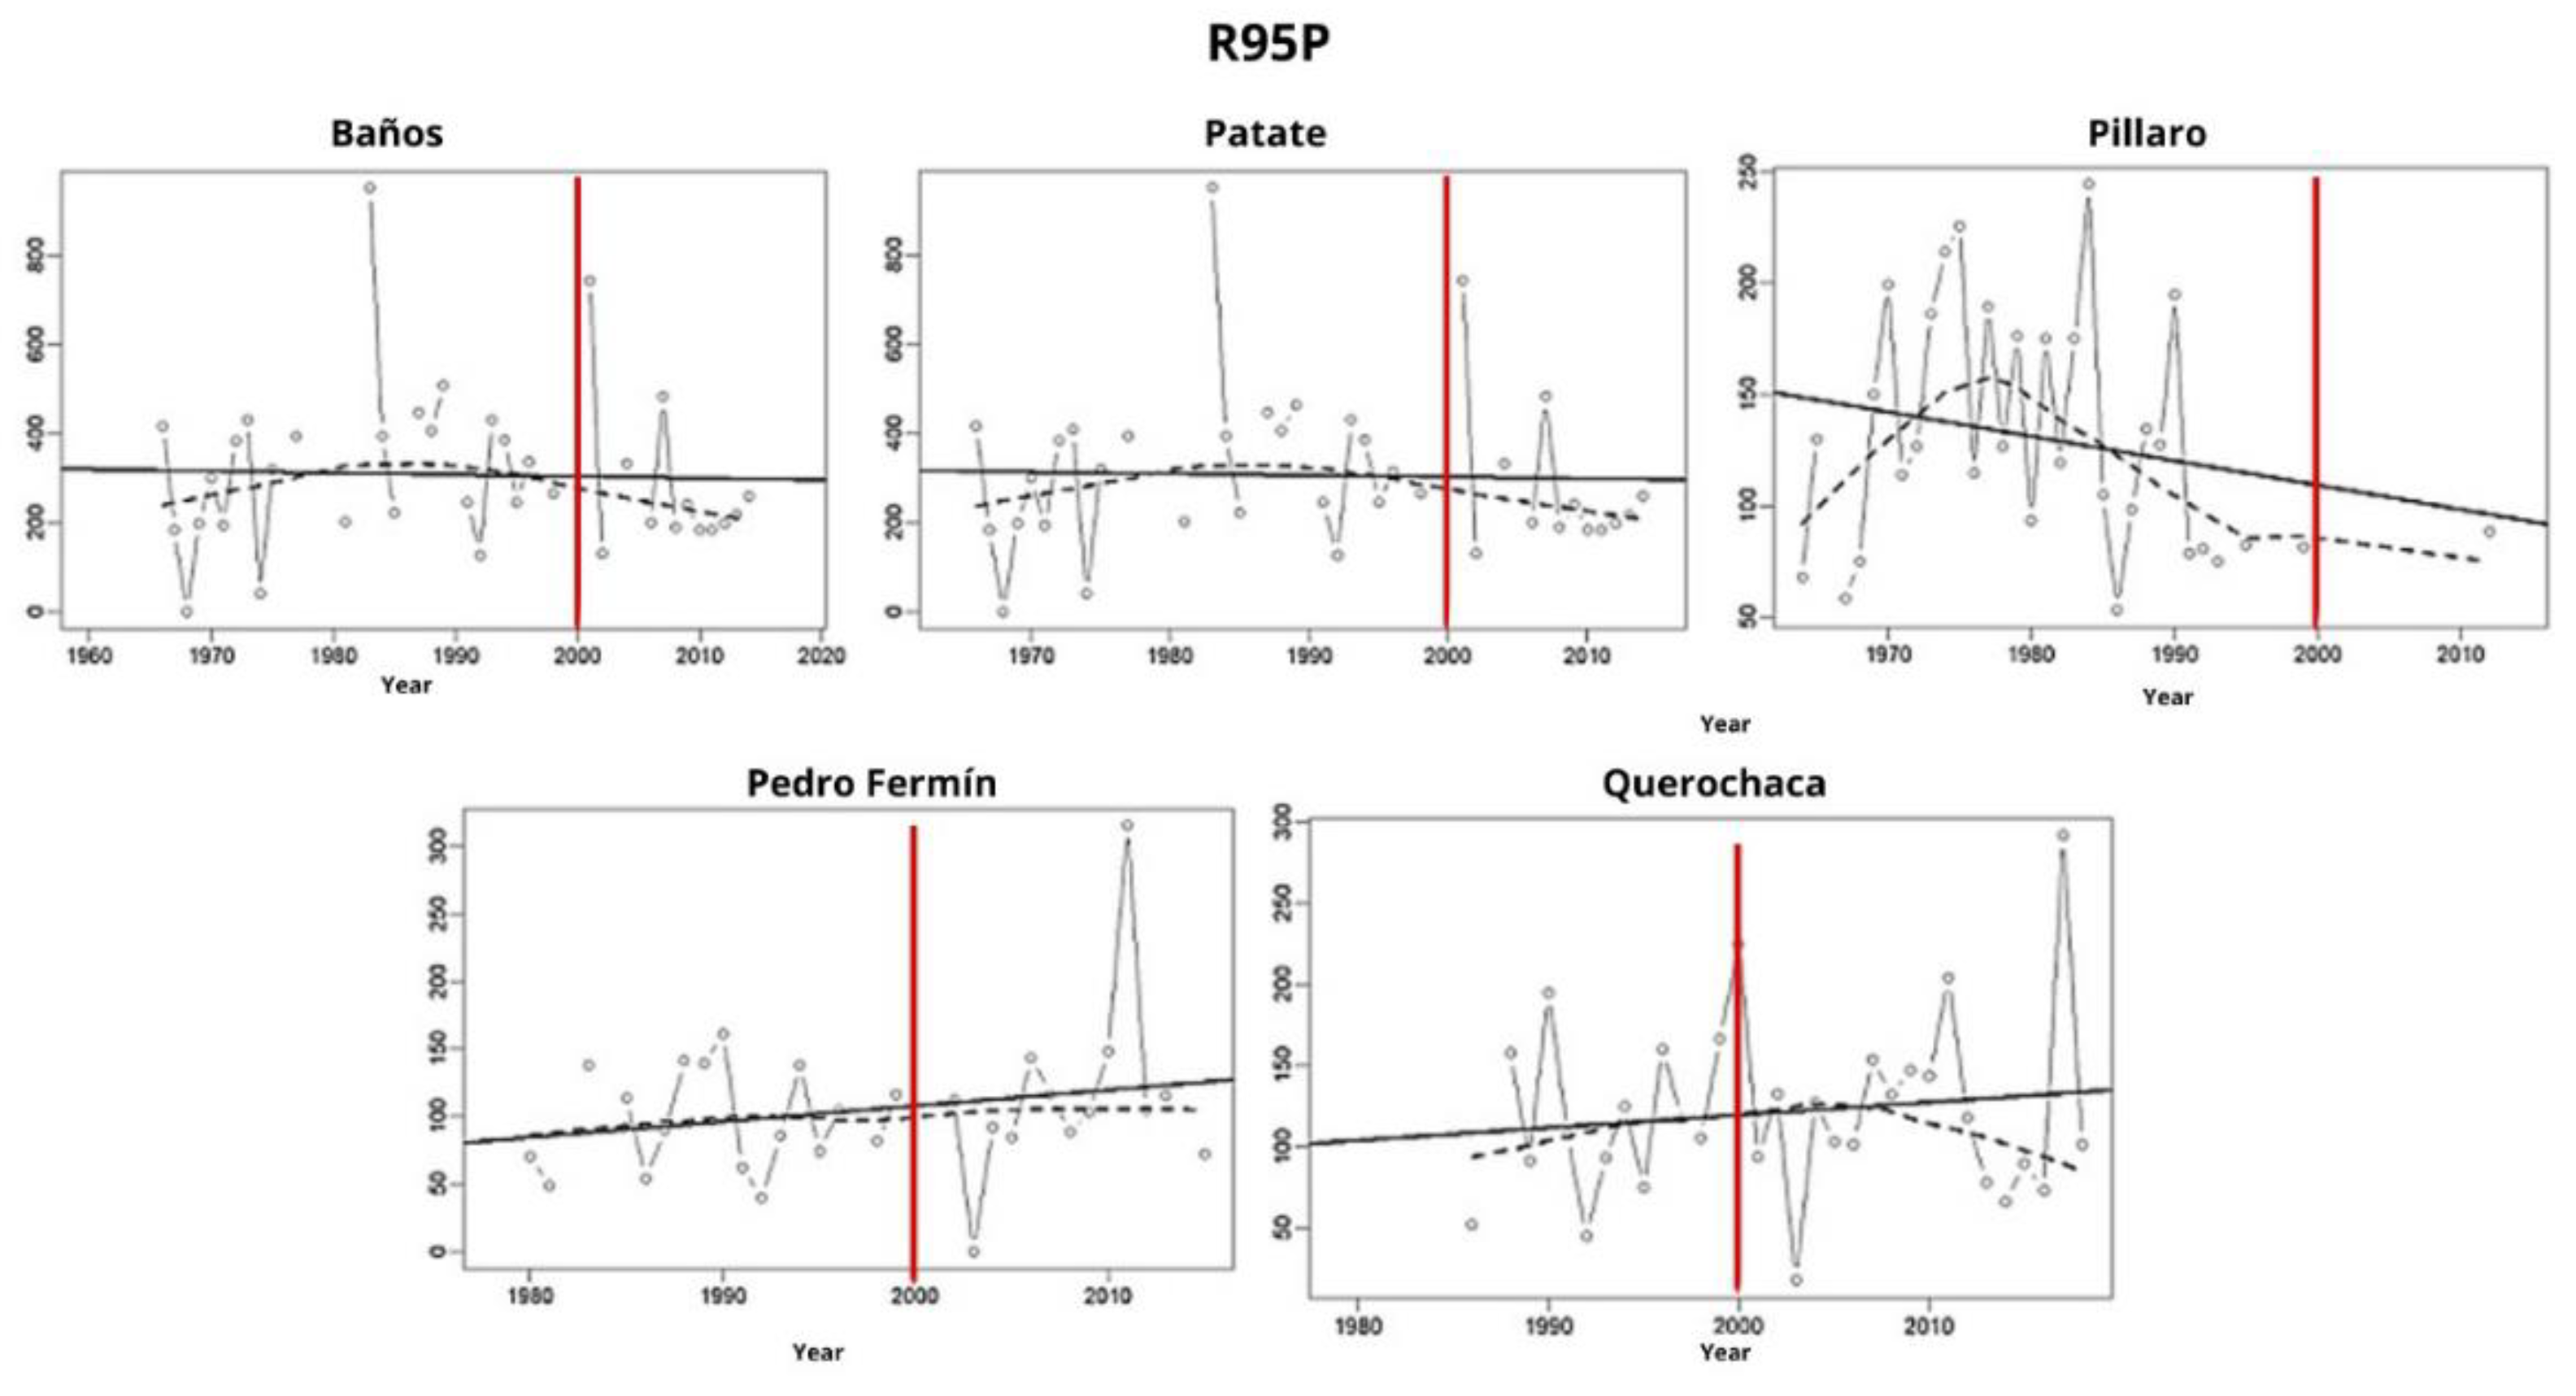
Figure 7.
SDII (Simple Daily Intensity Index). The red line represents the comparison period before and after the year 2000.
Figure 7.
SDII (Simple Daily Intensity Index). The red line represents the comparison period before and after the year 2000.
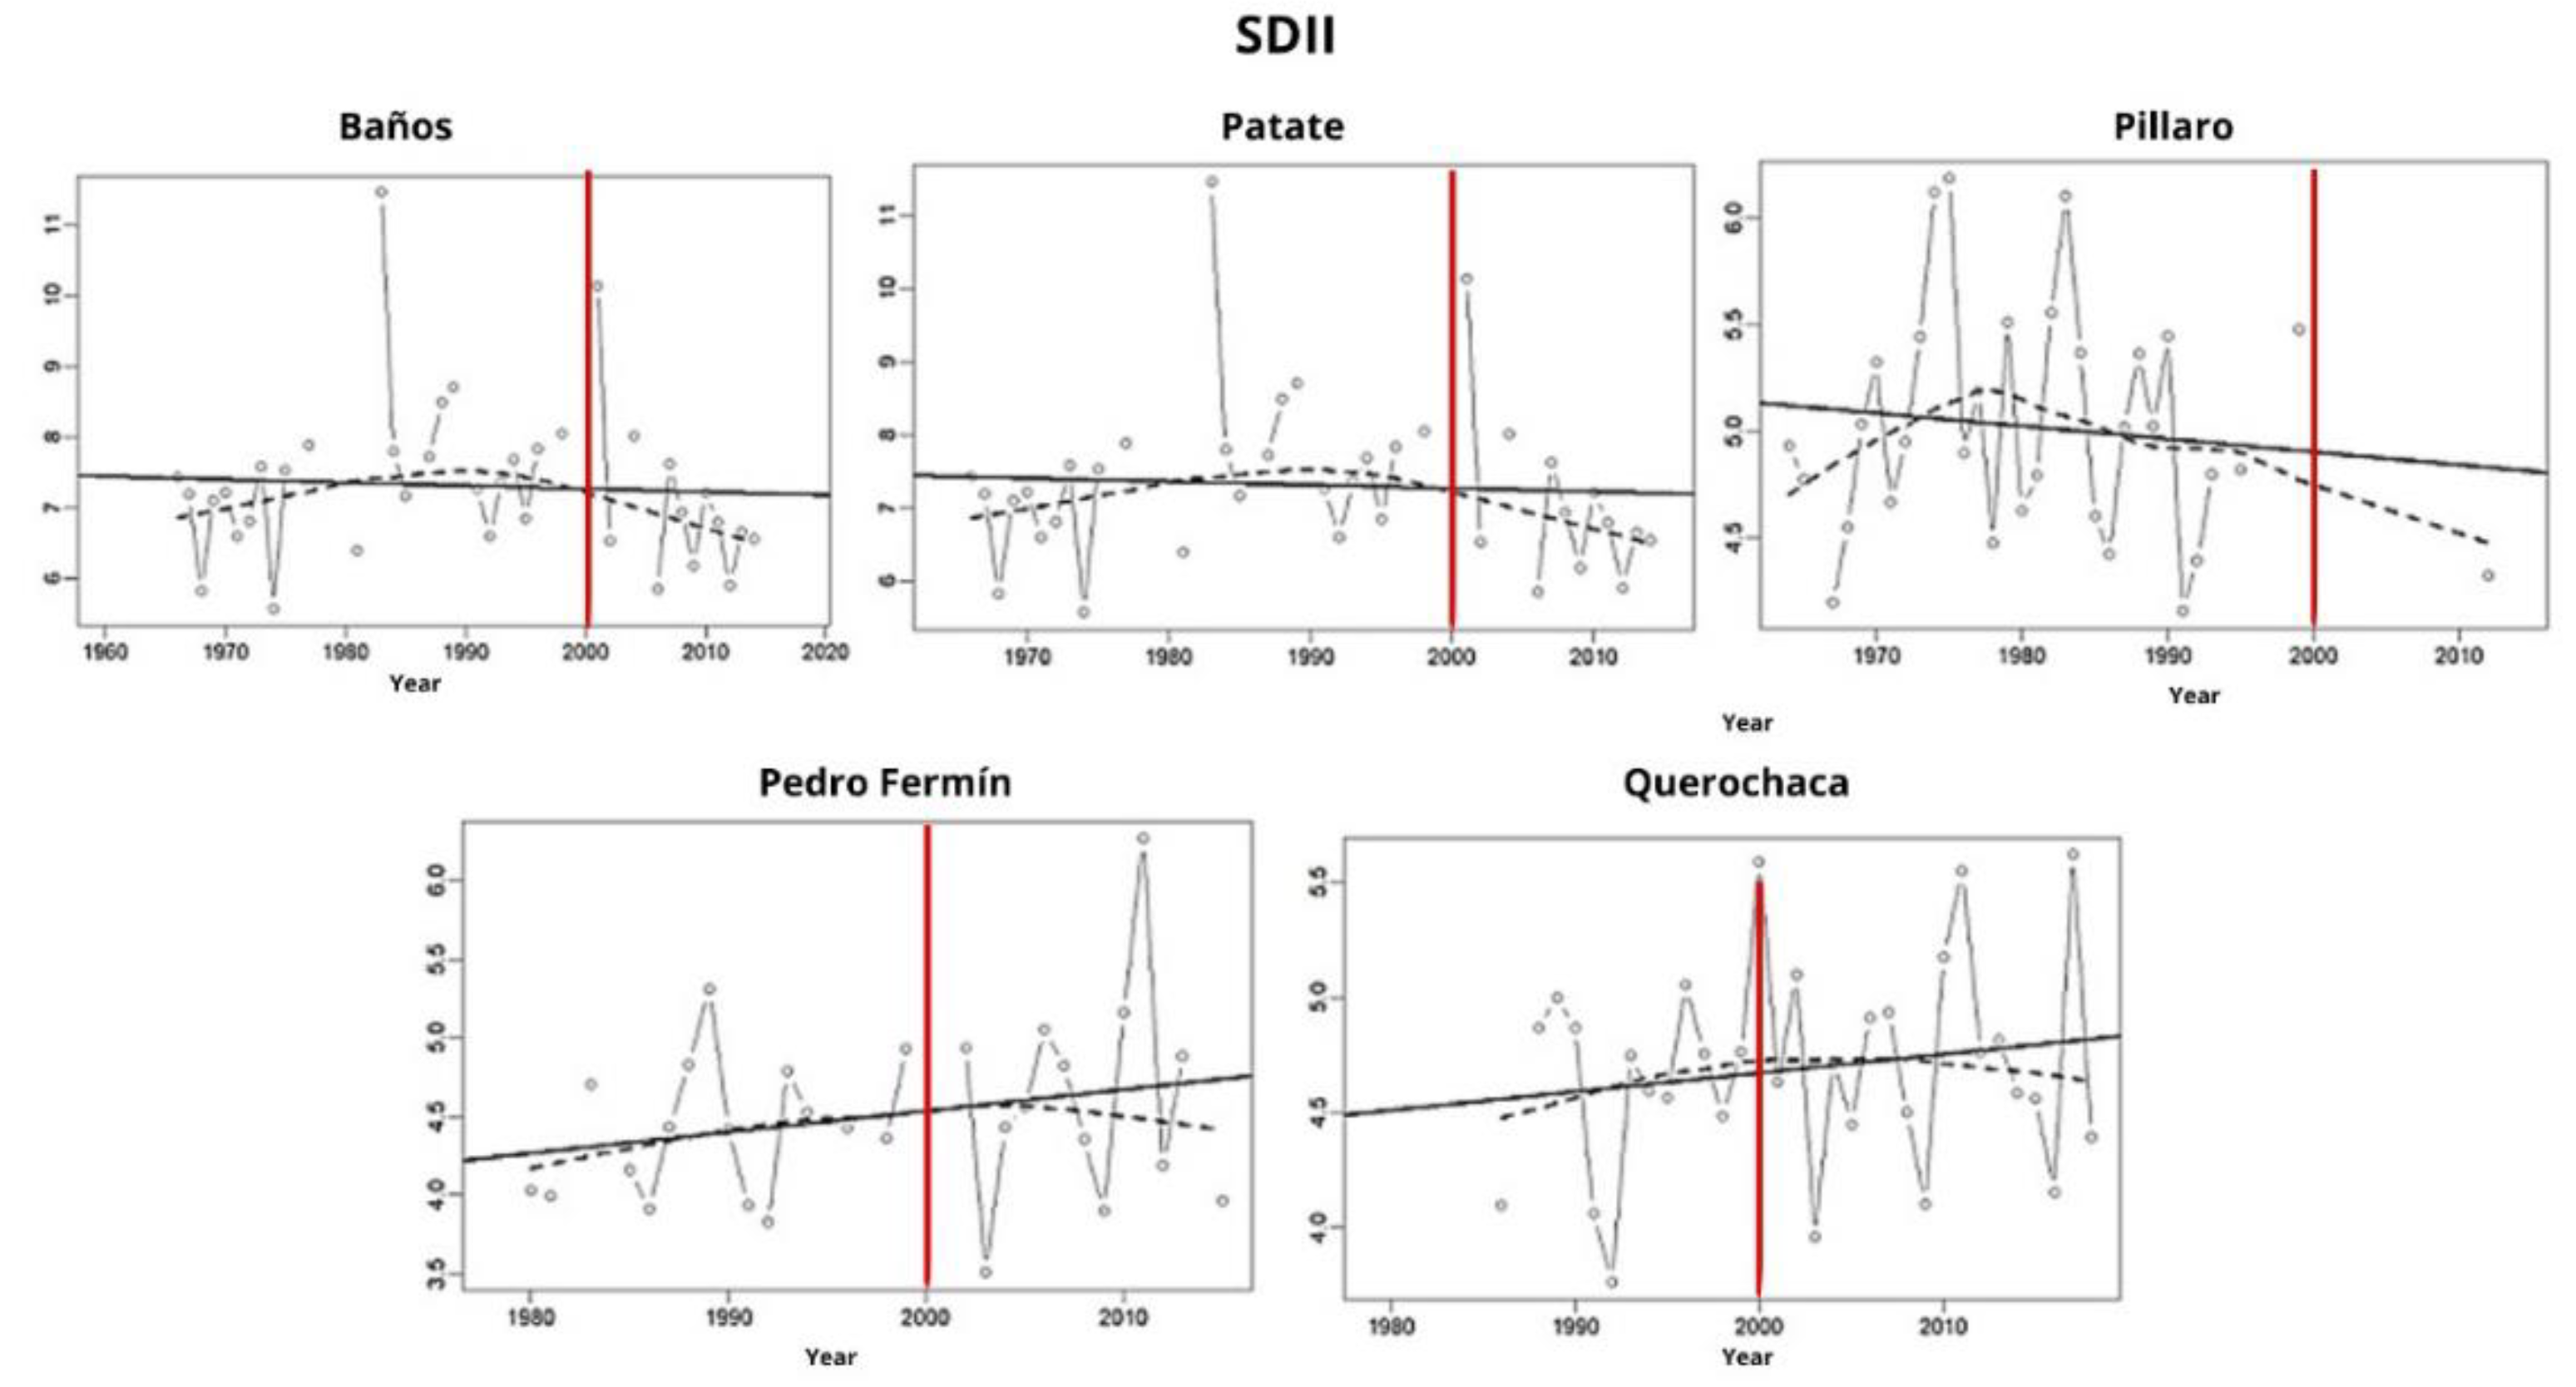
Figure 8.
Analysis of TXx (Maximum values of daily maximum temperature). The red line represents the comparison period before and after the year 2000.
Figure 8.
Analysis of TXx (Maximum values of daily maximum temperature). The red line represents the comparison period before and after the year 2000.
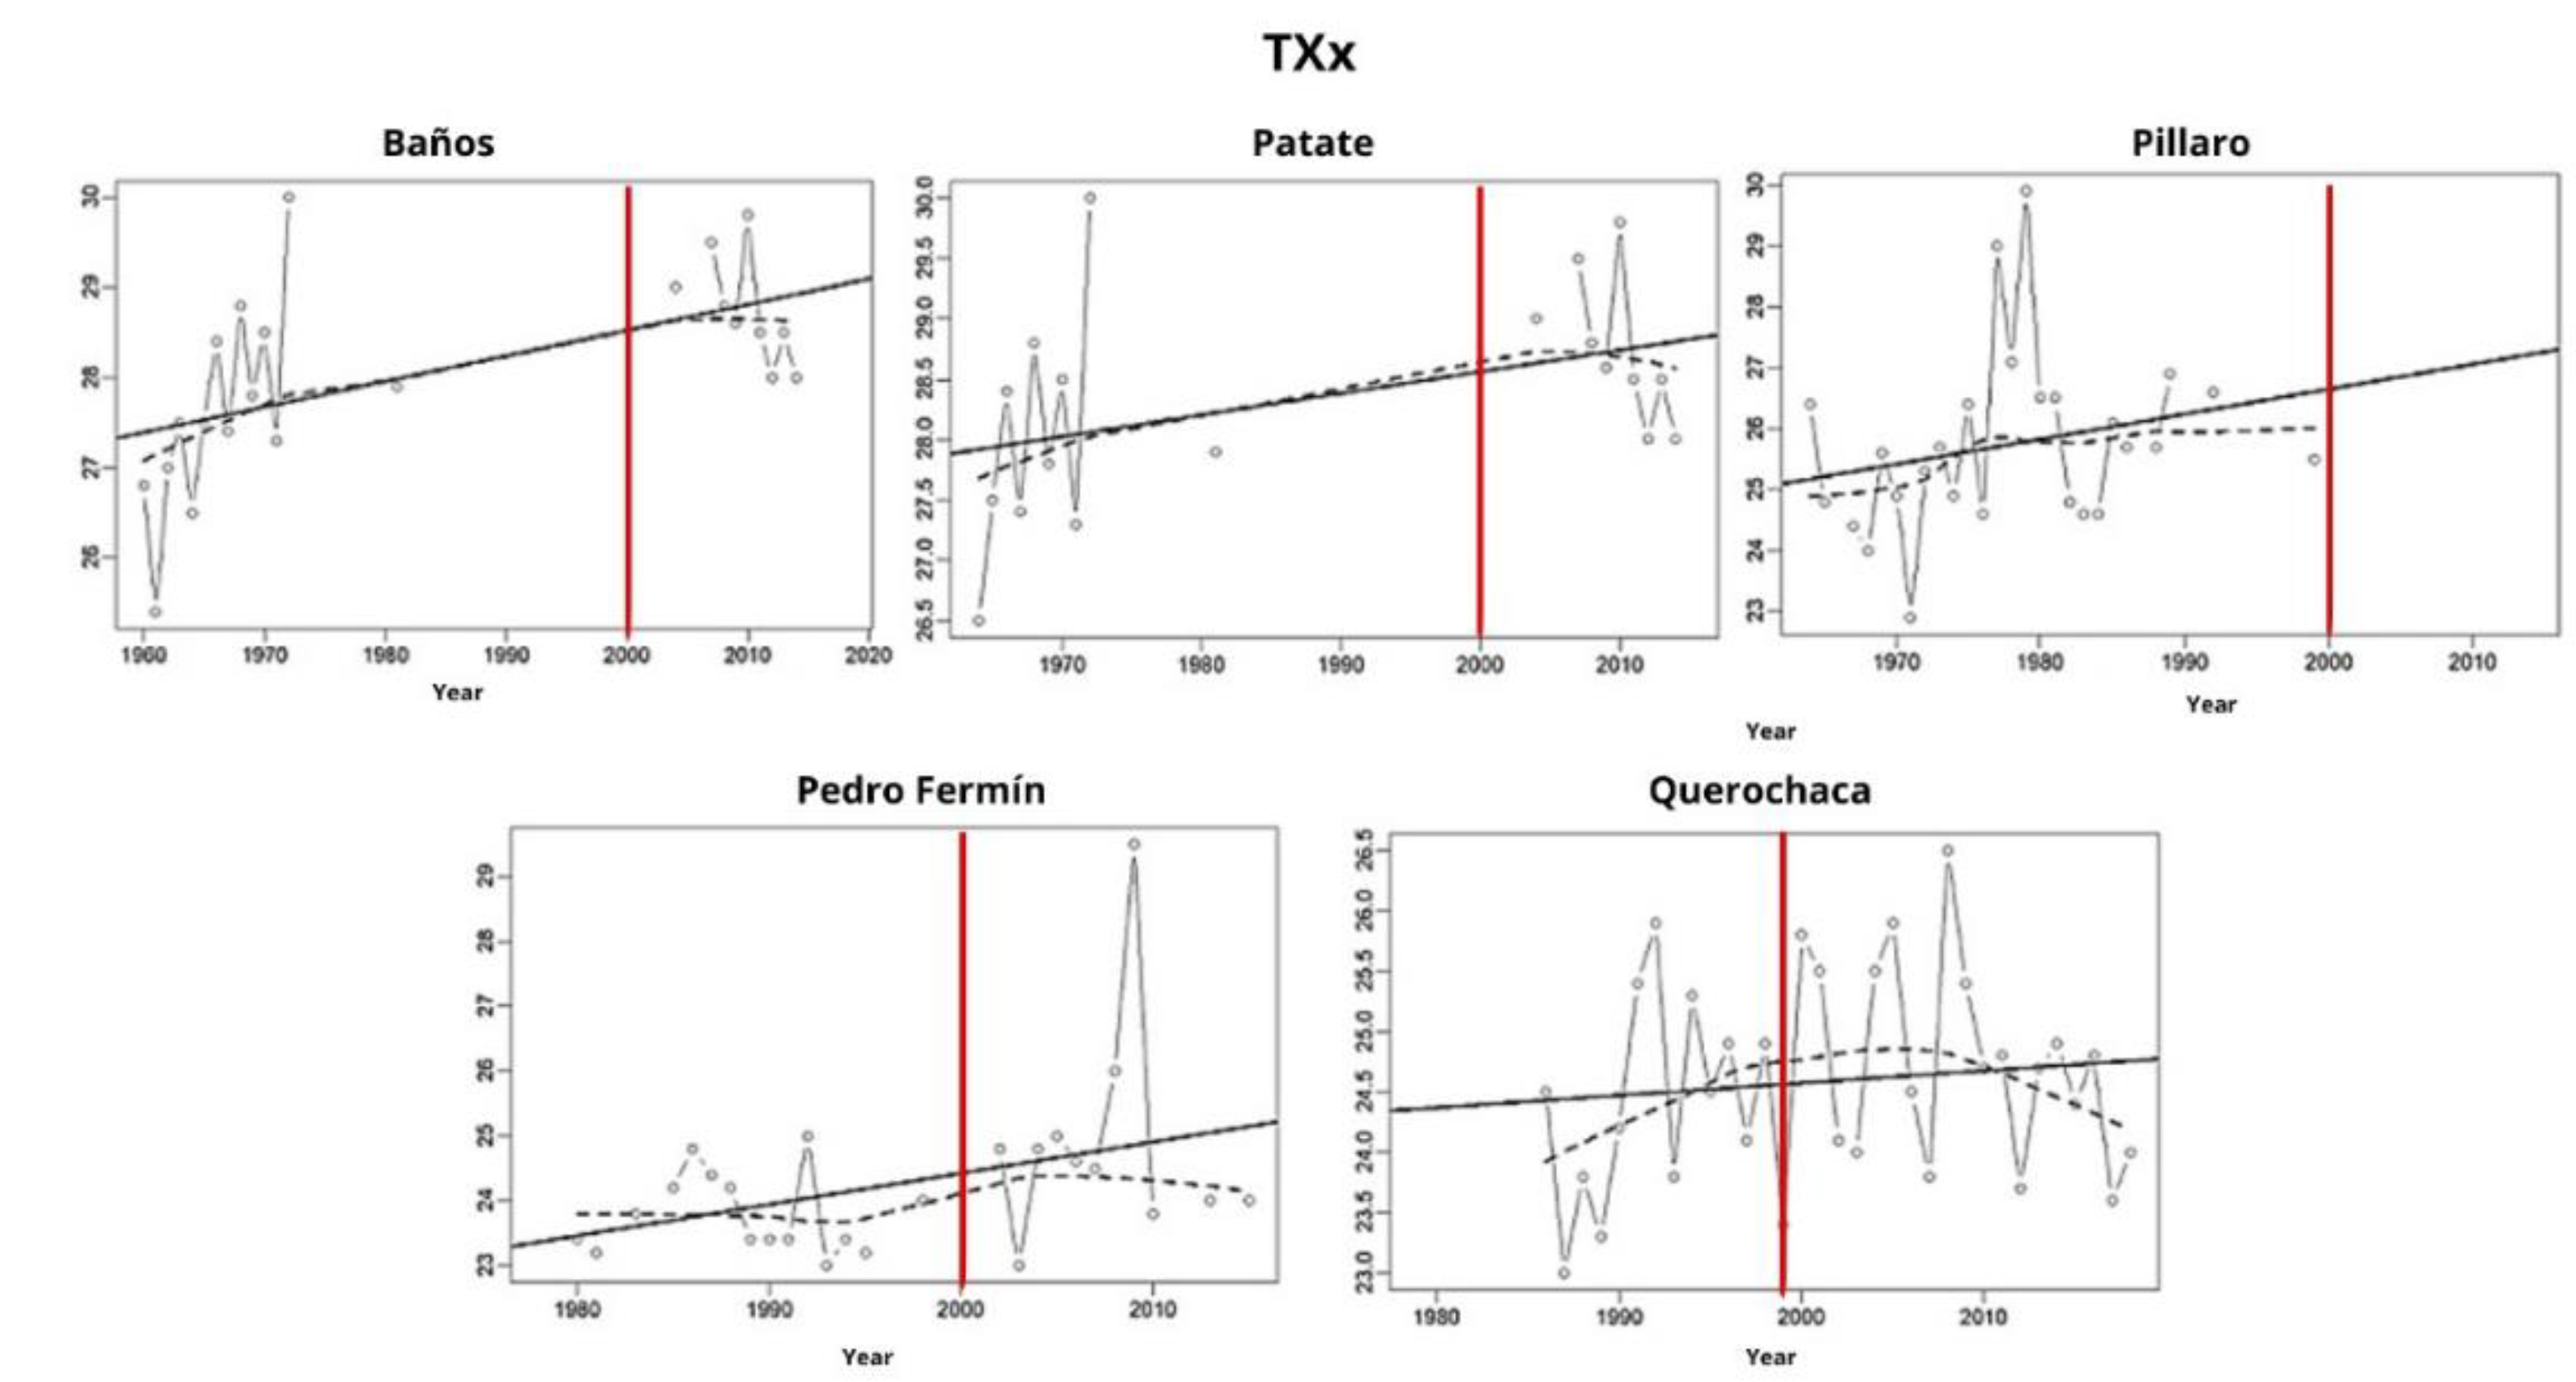
Figure 9.
Result of the TNx index (Maximum values of daily minimum temperature). The red line represents the comparison period before and after the year 2000.
Figure 9.
Result of the TNx index (Maximum values of daily minimum temperature). The red line represents the comparison period before and after the year 2000.
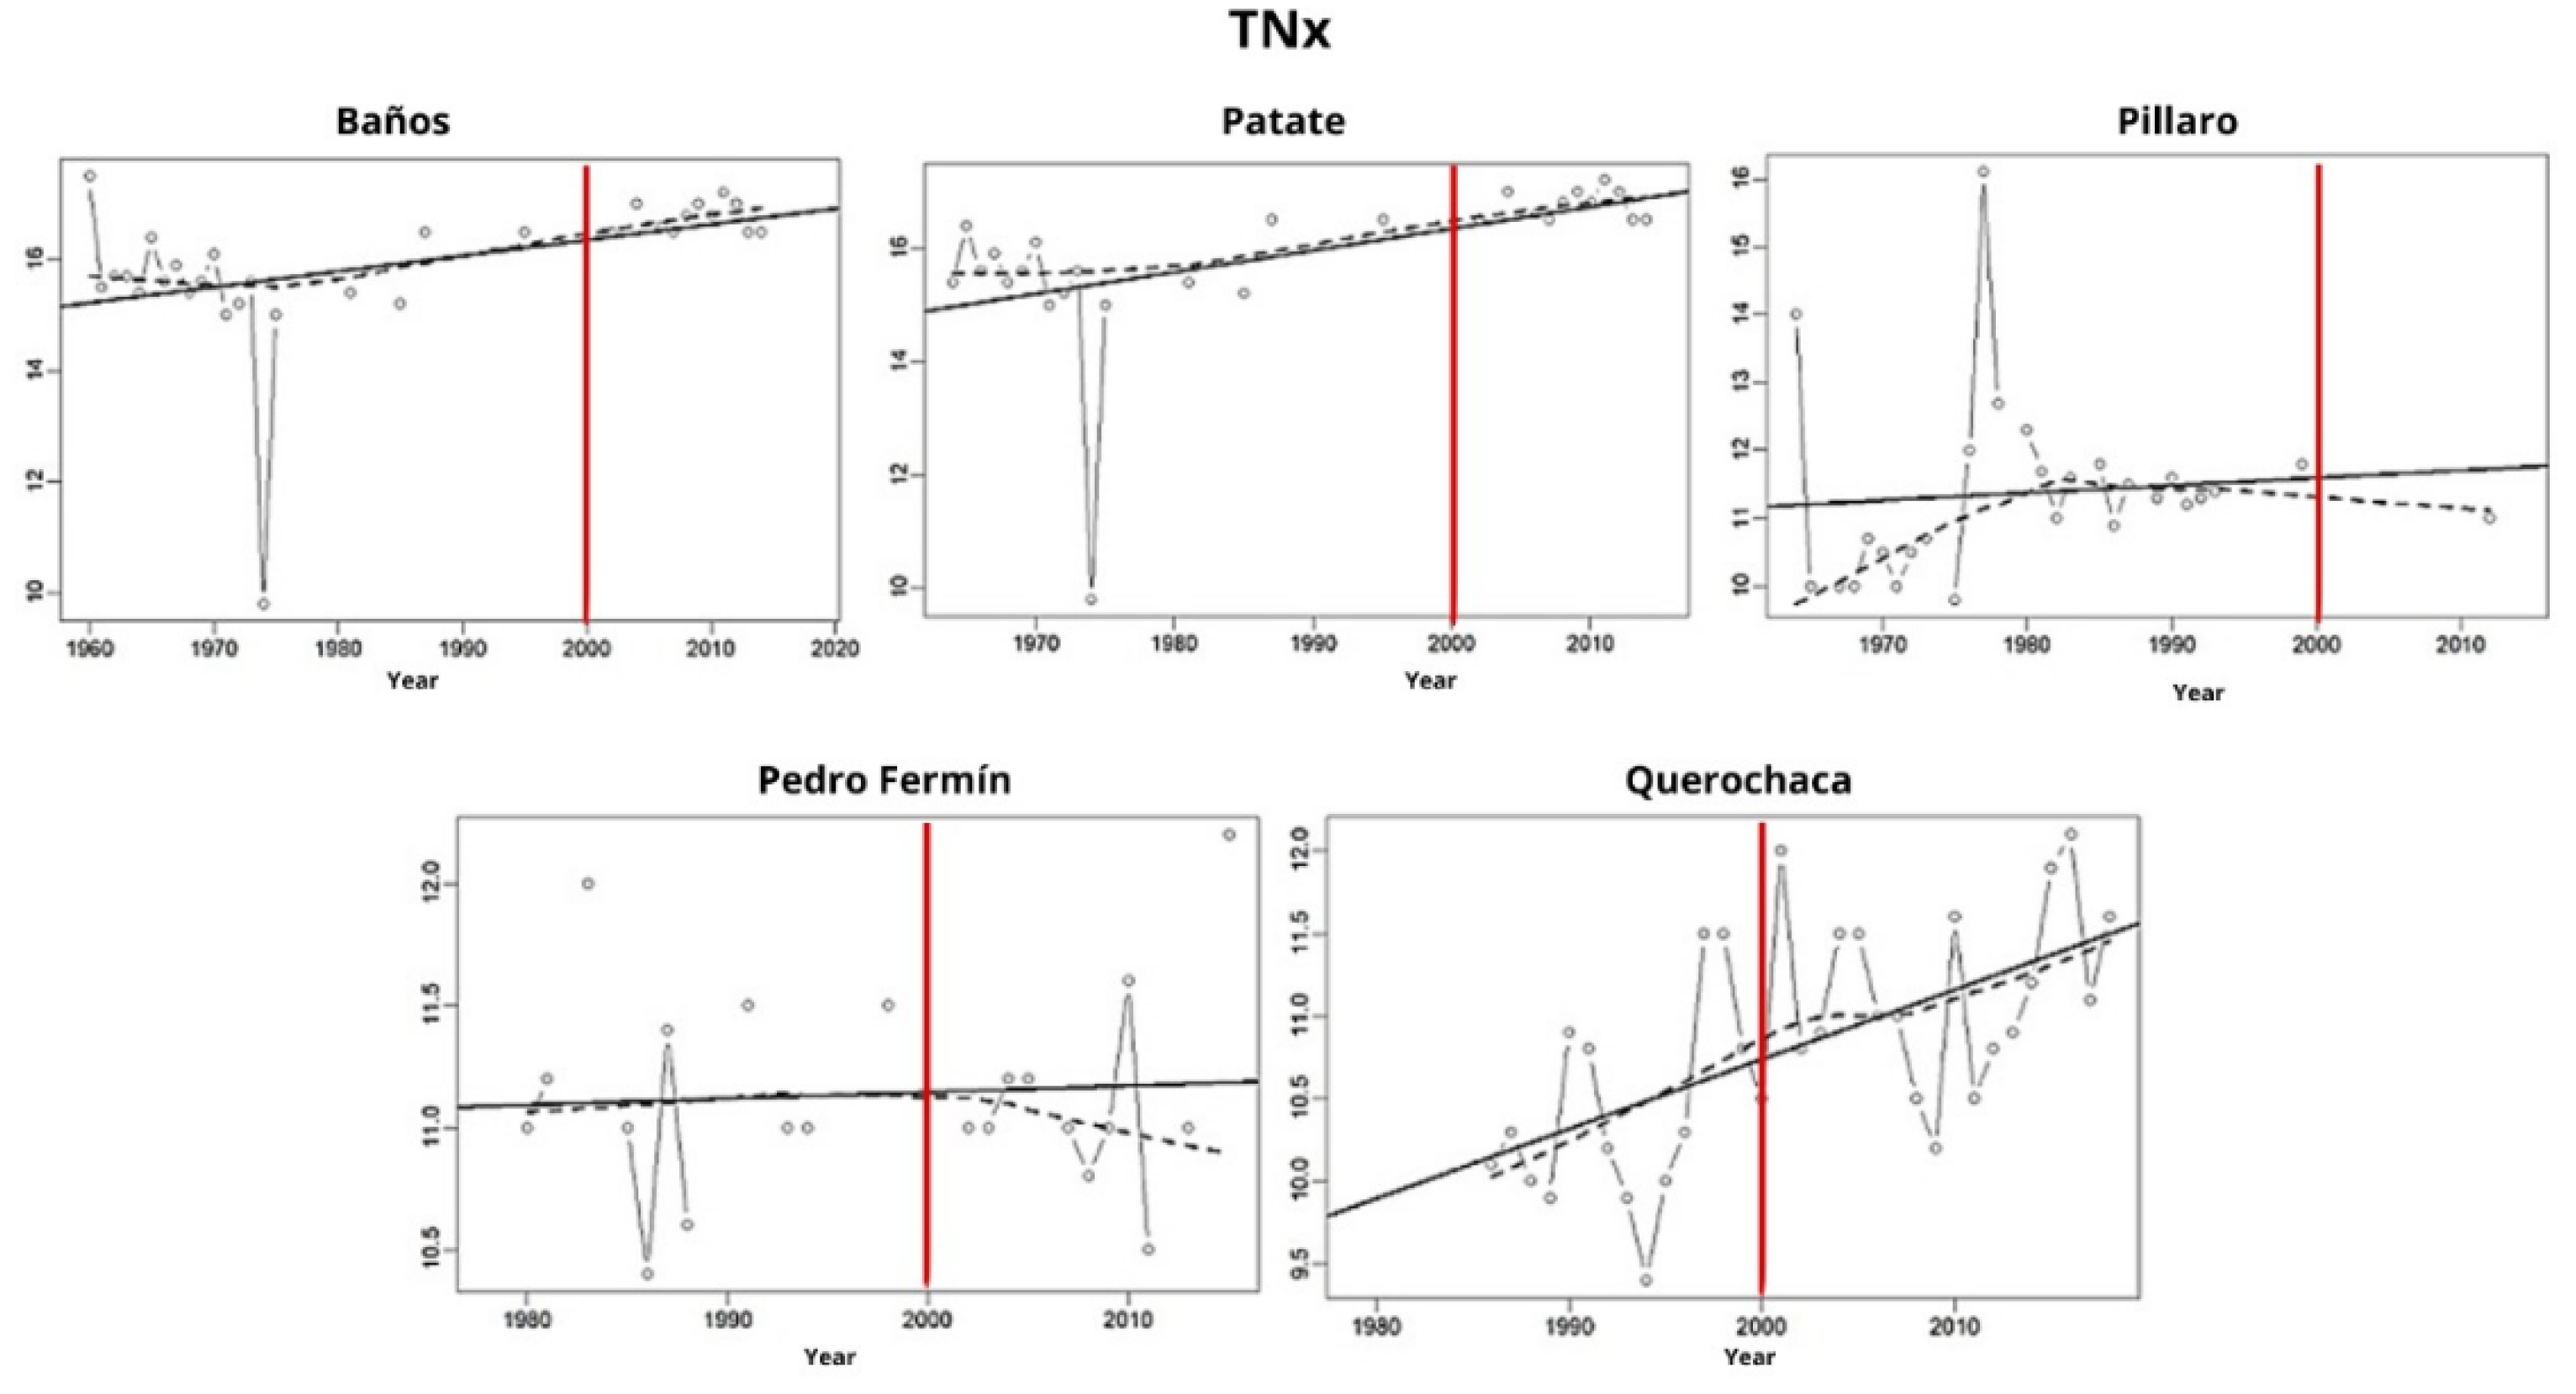
Figure 10.
Seasonality of monthly accumulated rainfall. Stations marked with * exhibit a unimodal pattern characteristic of the Amazon region, while stations marked with ** display a bimodal pattern characteristic of the Andean highlands.
Figure 10.
Seasonality of monthly accumulated rainfall. Stations marked with * exhibit a unimodal pattern characteristic of the Amazon region, while stations marked with ** display a bimodal pattern characteristic of the Andean highlands.
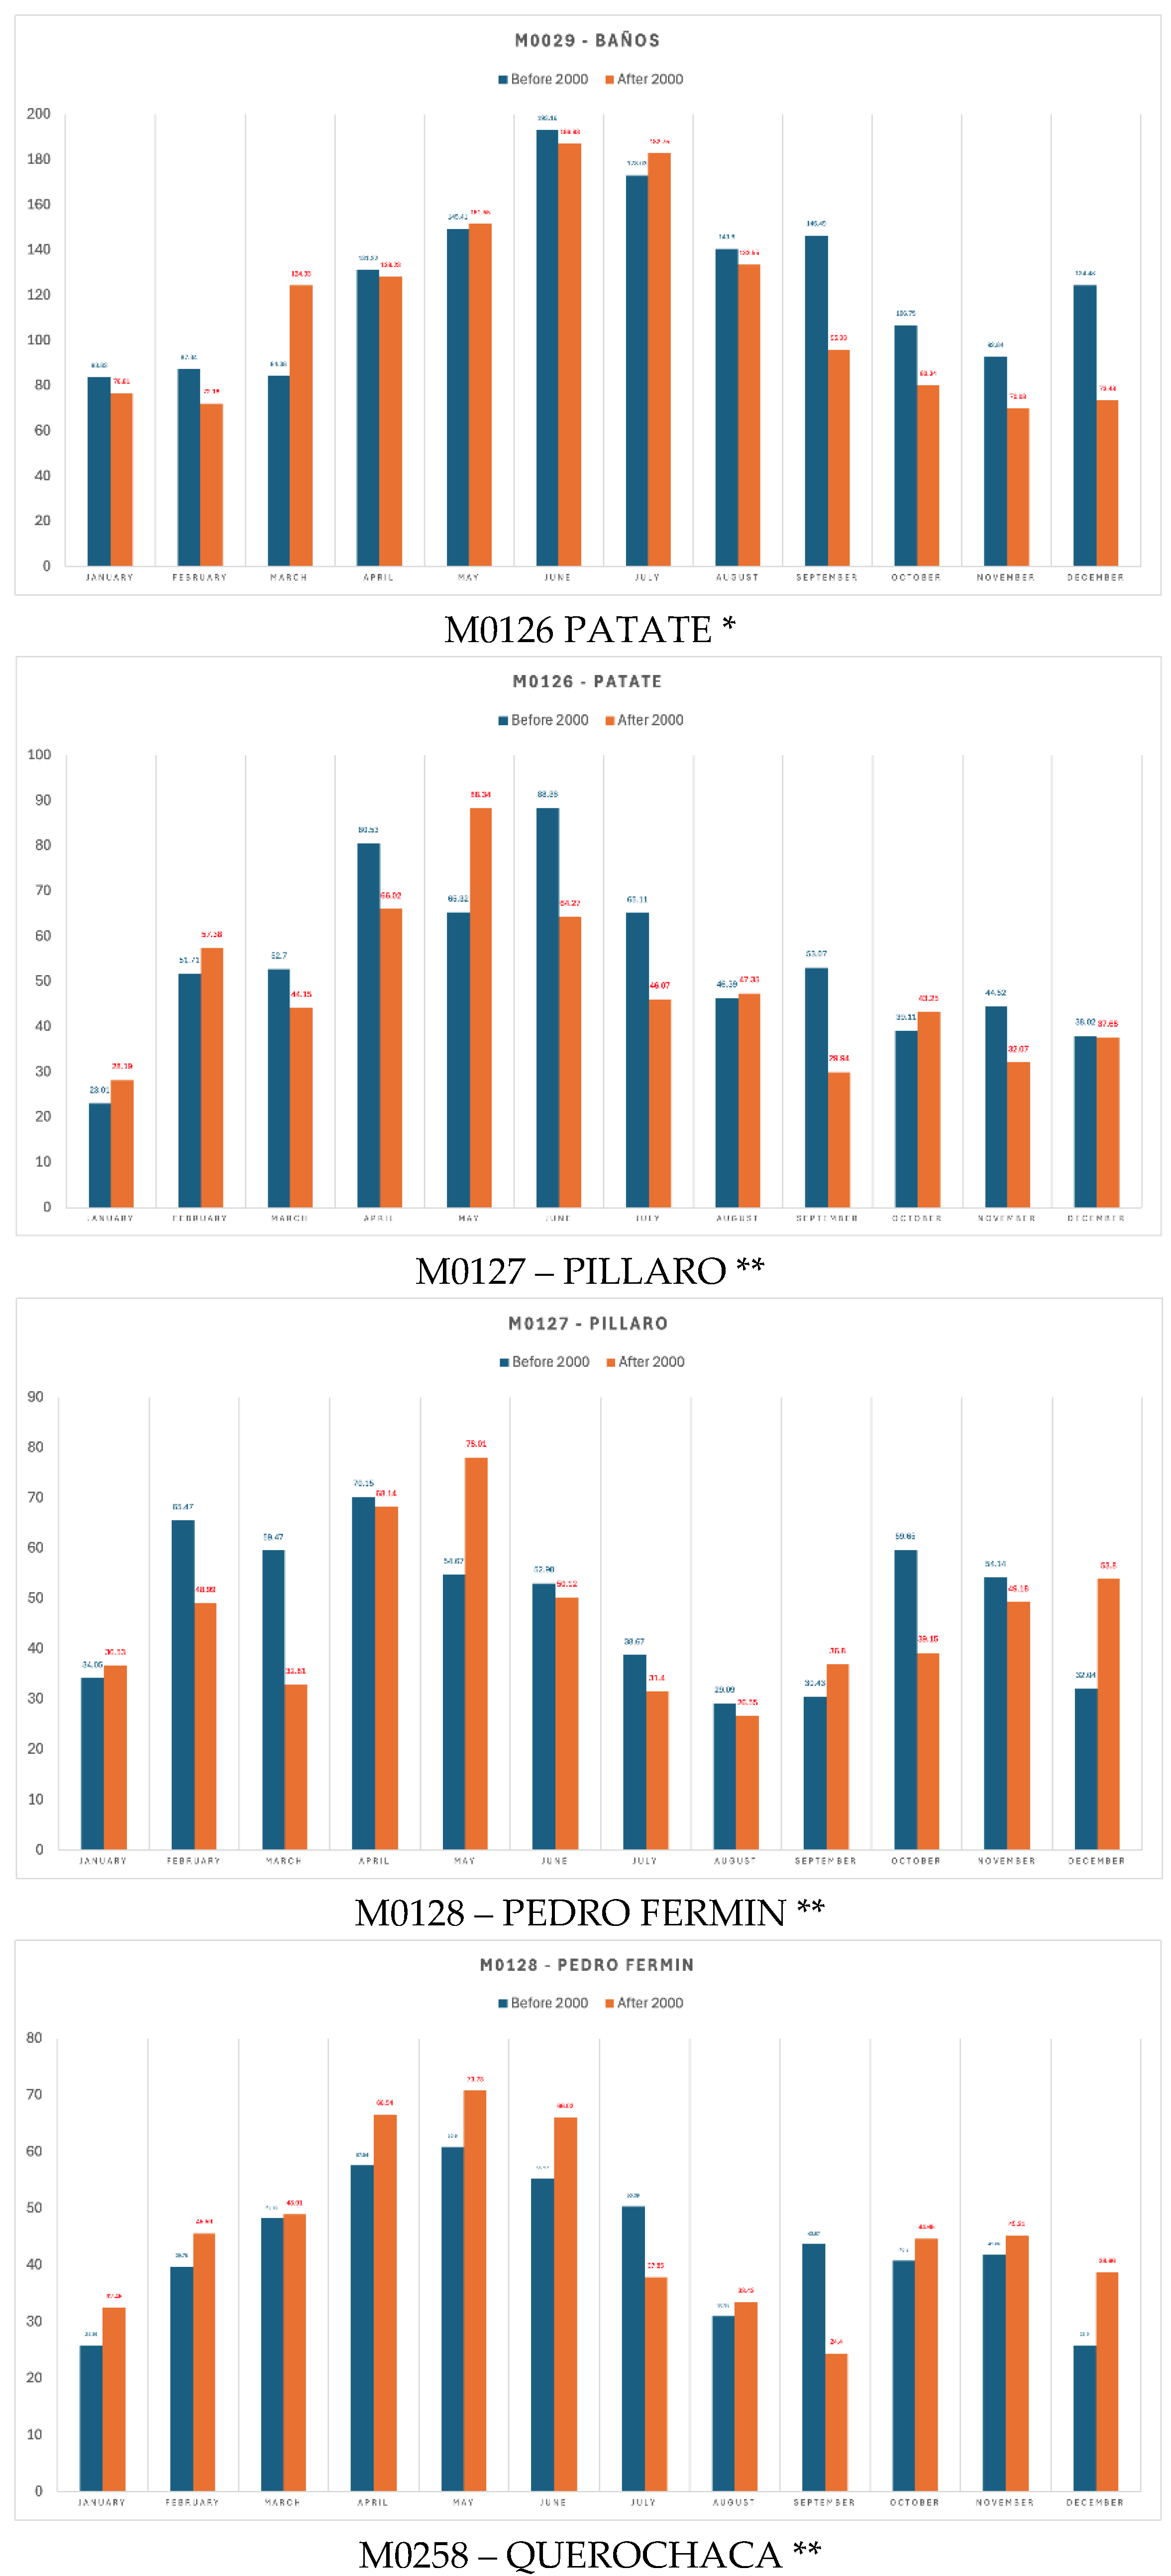
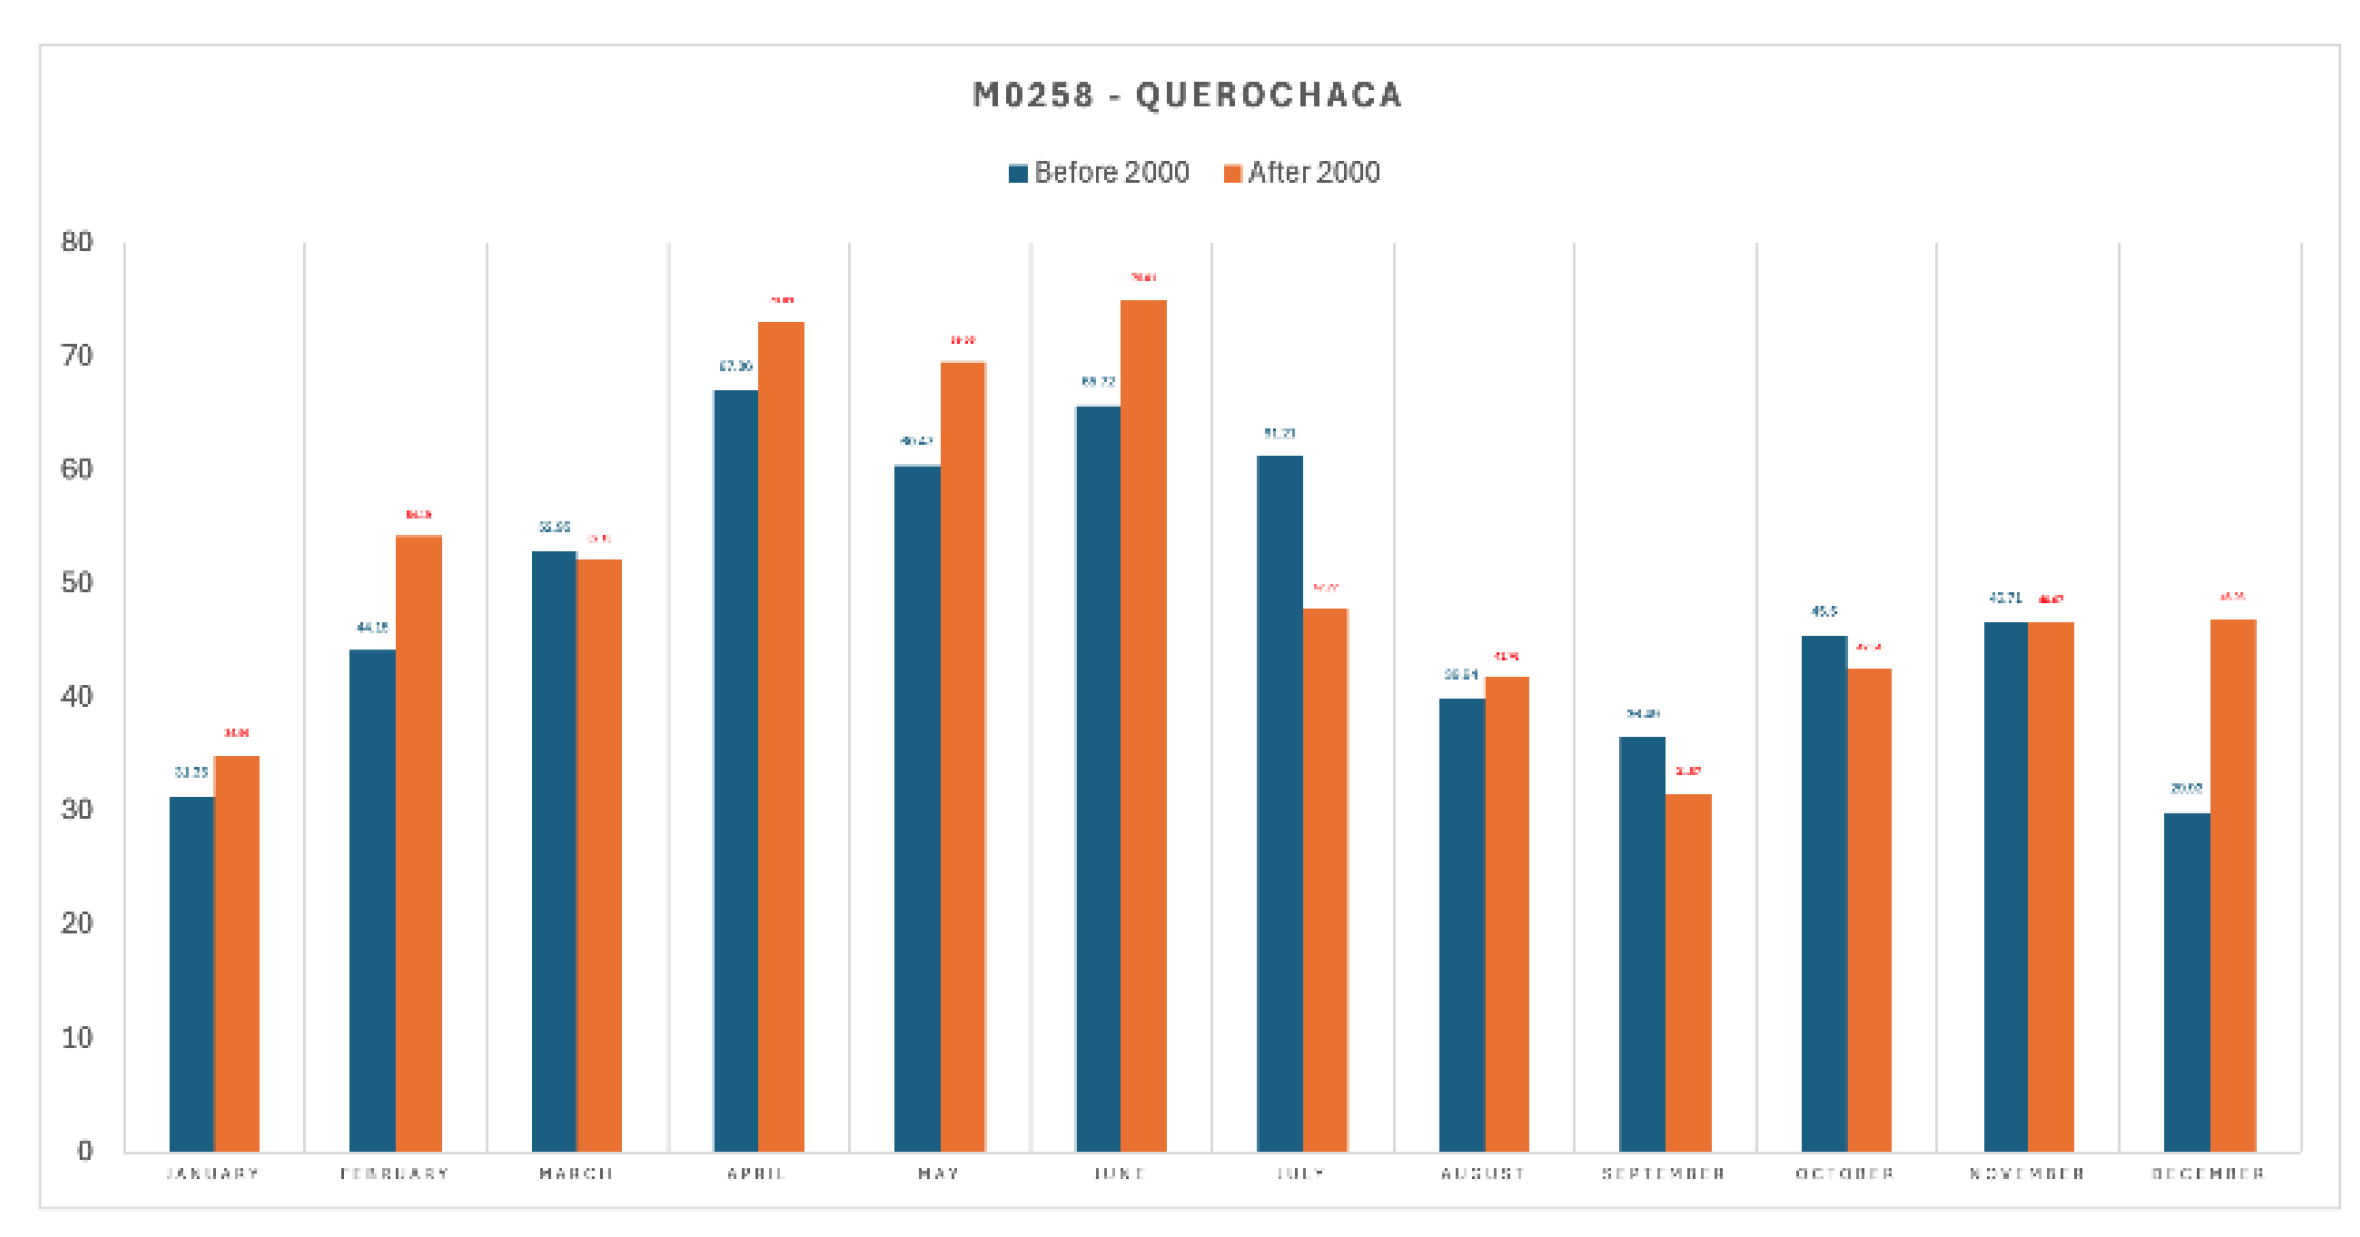
Figure 11.
Seasonality of monthly accumulated rainfall for each station.
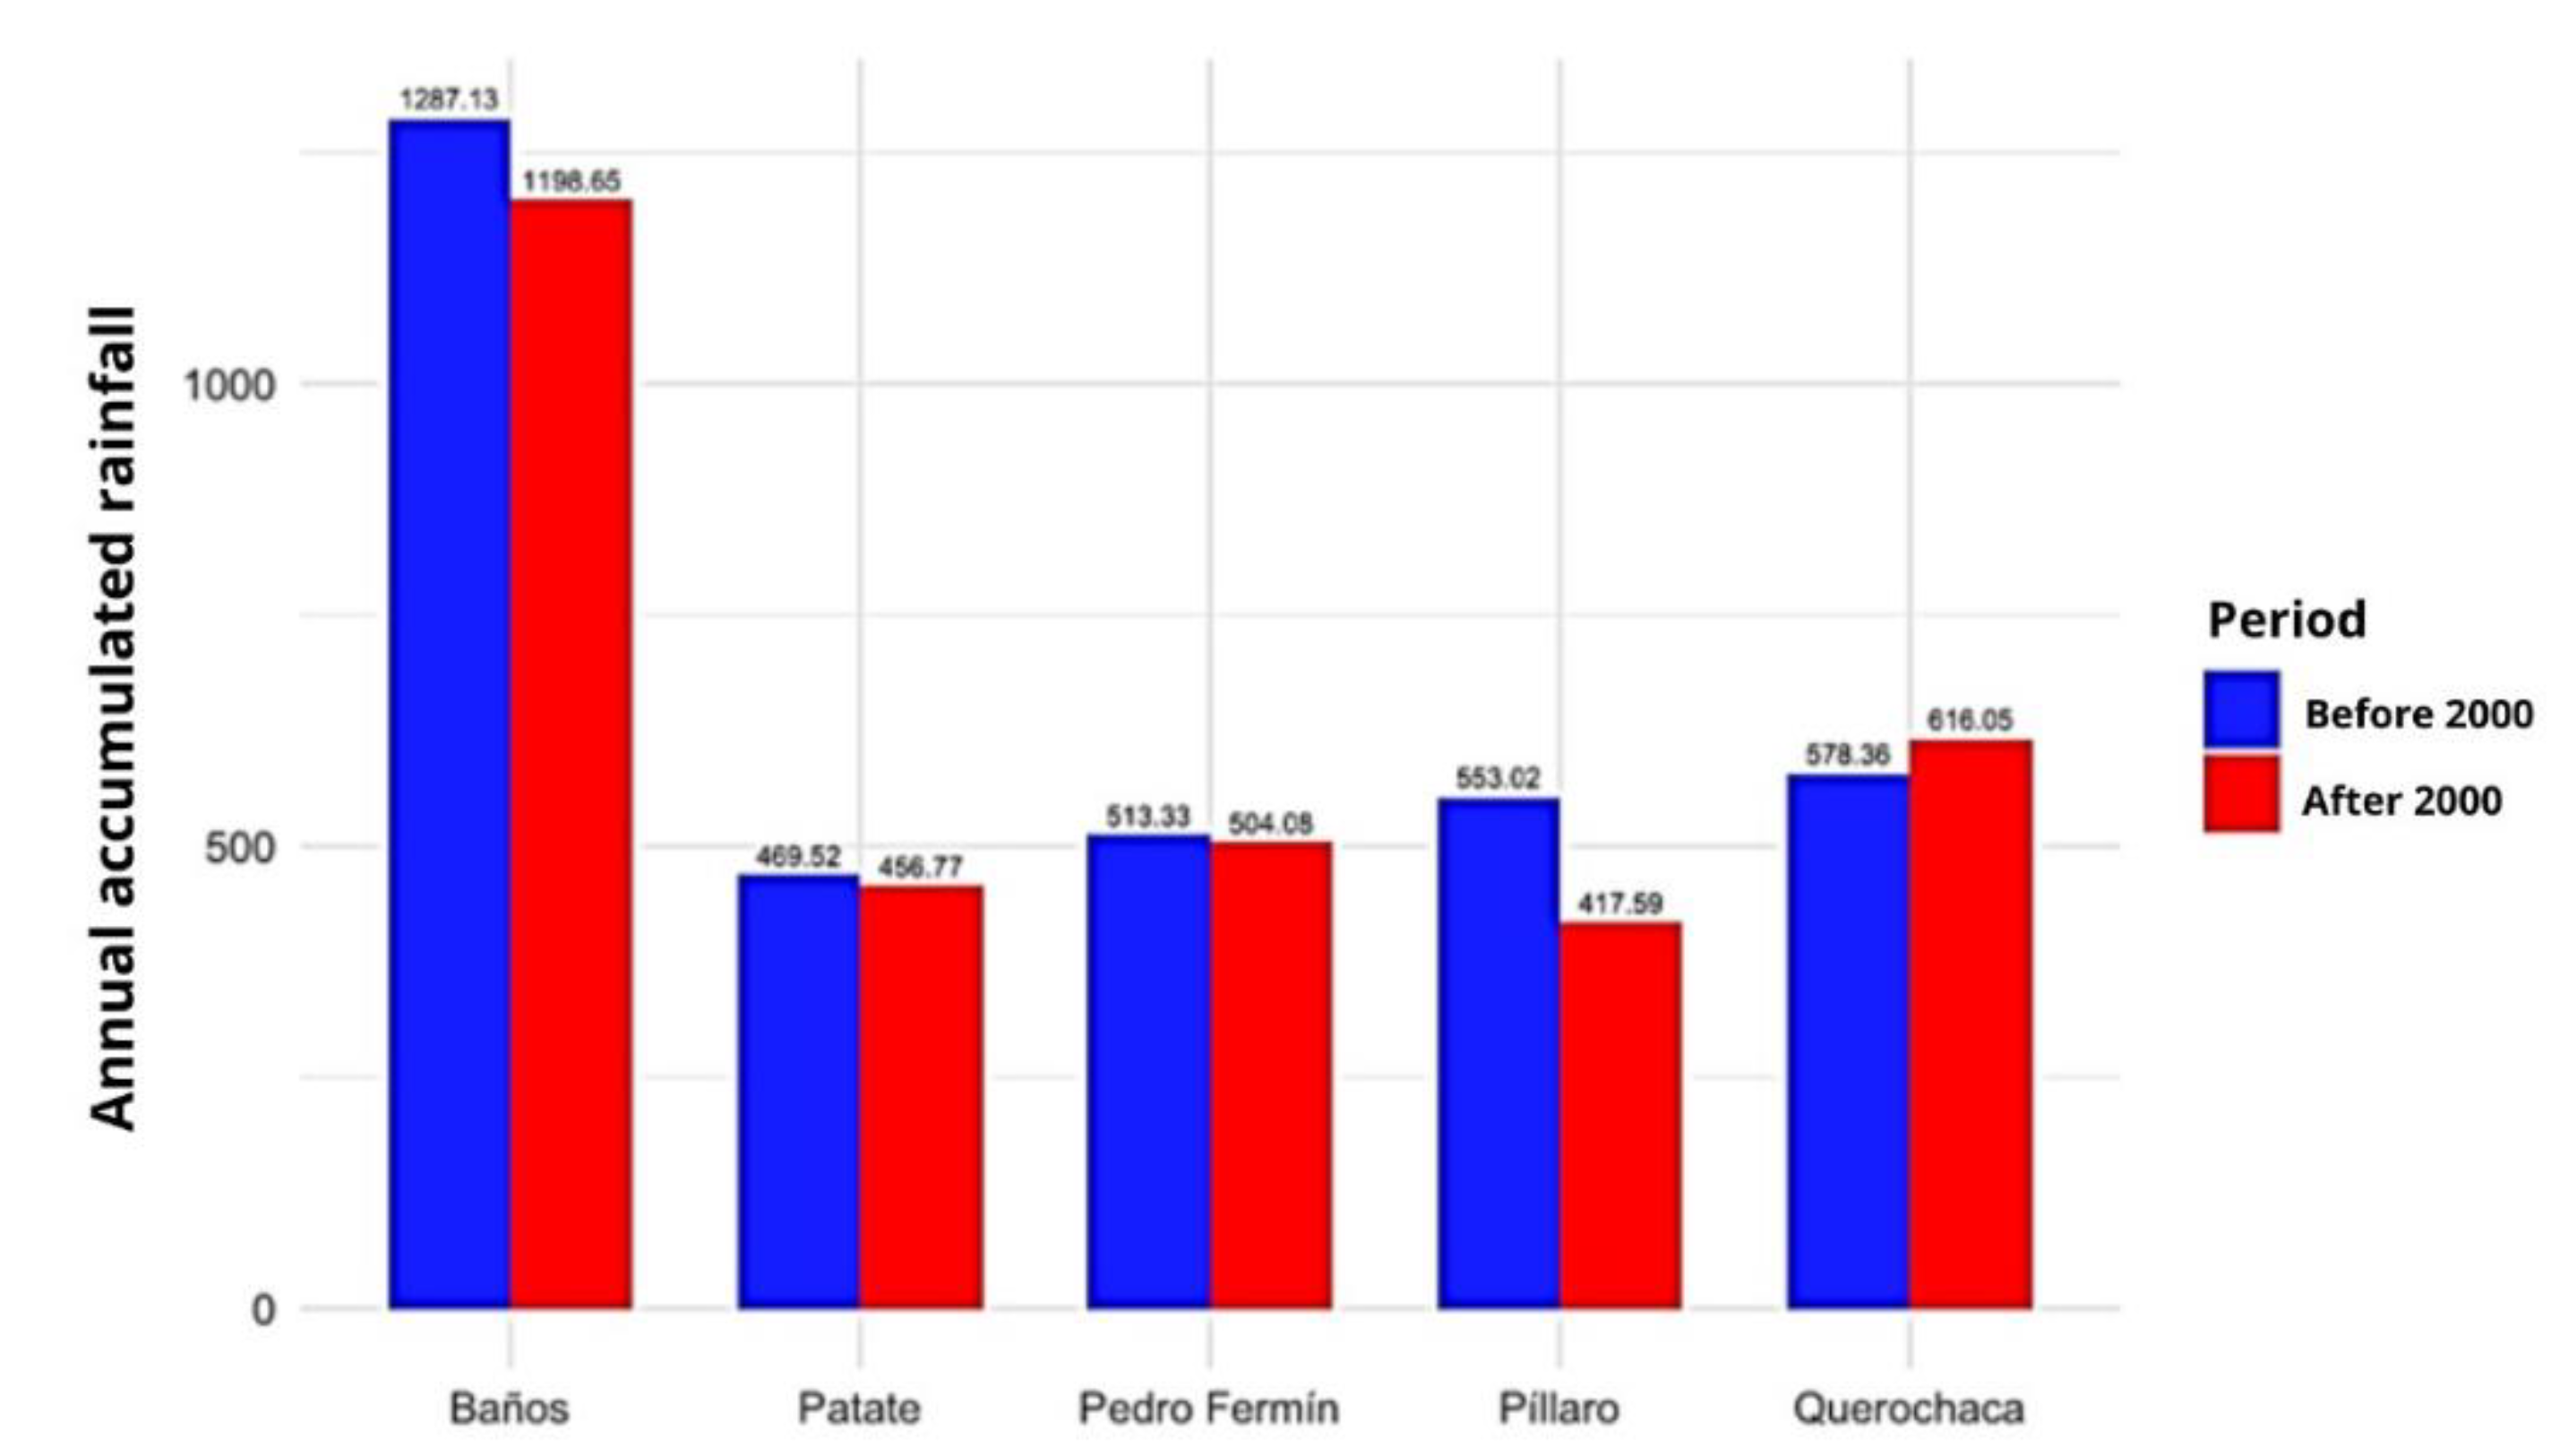
Figure 13.
A) Wavelet Coherence (WTC) and B) Cross-Wavelet Transform (XWT) for the Patate station. The upper panels show the selected time series: 15 years before and 15 years after the year 2000 (grey segments in the time series represent periods with missing data).
Figure 13.
A) Wavelet Coherence (WTC) and B) Cross-Wavelet Transform (XWT) for the Patate station. The upper panels show the selected time series: 15 years before and 15 years after the year 2000 (grey segments in the time series represent periods with missing data).
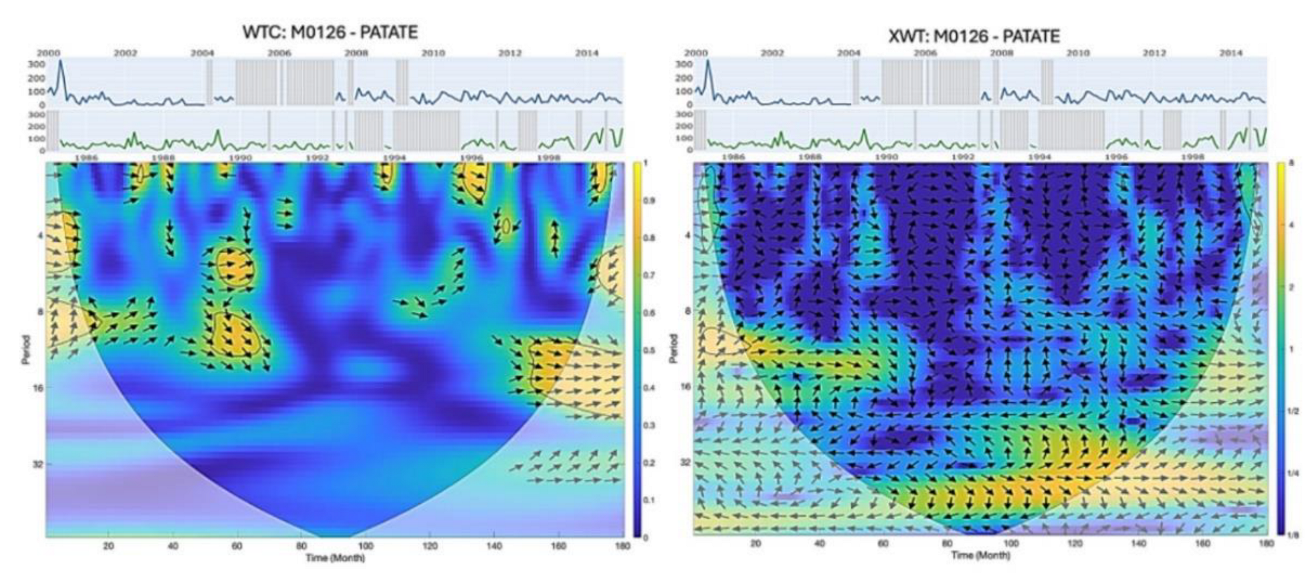

Table 1.
Description of the in-situ data used in this study.
| Code | Station | Latitude | Longitude | Altitude m.a.s.l |
Temporal range |
From | To |
|---|---|---|---|---|---|---|---|
| M0029 | Baños | -1.260 | -78.405 | 1820 | 68 | 1950 | 2018 |
| M0126 | Patate | -1.300 | -78.500 | 2442 | 50 | 1948 | 2015 |
| M0127 | Pillaro | -1.169 | -78.553 | 2781 | 50 | 1964 | 2014 |
| M0128 | Pedro Fermín | -1.352 | -78.615 | 2897 | 37 | 1978 | 2015 |
| M0258 | Querochaca | -1.367 | -78.606 | 2863 | 39 | 1979 | 2018 |
| M1069 | Calamaca | -1.281 | -78.821 | 3417 | 27 | 1988 | 2015 |
Table 2.
ETCCDI Indices used in this study[15].
Table 2.
ETCCDI Indices used in this study[15].
| Index | Unit | Name | Definition | Equation |
|---|---|---|---|---|
| PRCPTOT | mm/year | Total precipitation. Annual total precipitation on wet days (days with ≥1 mm of rainfall). | <!-- MathType@Translator@5@5@MathML2 (no namespace).tdl@MathML 2.0 (no namespace)@ --><!-- MathType@Translator@5@5@MathML2 (no namespace).tdl@MathML 2.0 (no namespace)@ --> is daily precipitation and N is the total number of wet days in the period of interest. |
|
| SDII | mm/day | Simple daily intensity index. Average daily precipitation on wet days. | <!-- MathType@Translator@5@5@MathML2 (no namespace).tdl@MathML 2.0 (no namespace)@ --> | |
| R95p | mm | Very wet days. Annual total precipitation (in millimeters) exceeding the 95th percentile. | <!-- MathType@Translator@5@5@MathML2 (no namespace).tdl@MathML 2.0 (no namespace)@ -->) <!-- MathType@Translator@5@5@MathML2 (no namespace).tdl@MathML 2.0 (no namespace)@ --> is daily precipitation and M is the number of days exceeding the 95th percentile. |
|
| TXx | ºC |
Monthly maximum value of daily maximum temperature. | <!-- MathType@Translator@5@5@MathML2 (no namespace).tdl@MathML 2.0 (no namespace)@ --><!-- MathType@Translator@5@5@MathML2 (no namespace).tdl@MathML 2.0 (no namespace)@ --> be the daily maximum temperature in month k, and period j. | |
| TNx | ºC |
Monthly maximum value of daily minimum temperature. | <!-- MathType@Translator@5@5@MathML2 (no namespace).tdl@MathML 2.0 (no namespace)@ --><!-- MathType@Translator@5@5@MathML2 (no namespace).tdl@MathML 2.0 (no namespace)@ --> be the daily minimun temperature in month k, and period j. |
Table 3.
Main statistical descriptors of daily precipitation for each station.
| Baños | Patate | Píllaro | Pedro Fermín |
Querochaca | |
|---|---|---|---|---|---|
| Min mm | 0.1 | 0.1 | 0.1 | 0.1 | 0.1 |
| Max mm | 198.9 | 260 | 49.9 | 42.2 | 41.7 |
| Q1 mm | 1.1 | 0.7 | 0.6 | 1 | 0.5 |
| Q2 mm | 3.1 | 2.2 | 1.7 | 2 | 1.3 |
| Q3 mm | 7.5 | 5.4 | 4.2 | 4.4 | 3.5 |
| P90 mm | 14 | 10.3 | 8.7 | 8.6 | 7.4 |
| P99 mm | 37.5 | 26.8 | 21.2 | 22.90 | 20.9 |
Table 4.
Climate indices for precipitation recommended by the ETCCDI, applied to in situ data.
| Station | Baños | Patate | Píllaro | Pedro Fermín |
Querochaca |
|---|---|---|---|---|---|
|
(SDII) [mm/day/year] p-value |
-0.005 0.719 |
-0.005 0.719 |
-0.006 0.504 |
0.013 0.175 |
0.008 0.352 |
|
(PRCPTOT) [mm/year] p-value |
-0.916 0.675 |
-0.916 0.675 |
-3.012 0.152 |
3.038 0.114 |
1.681 0.38 |
|
(R95p) [[mm/day/year] p-value |
-0.402 0.839 |
-0.366 0.852 |
-1.099 0.215 |
1.182 0.222 |
0.788 0.464 |
|
(TXx) [°C/year] p-value |
0.028** 0.004 |
0.018* 0.067 |
0.041 0.227 |
0.048* 0.049 |
0.018* 0.067 |
|
(TNx) [°C/year] p-value |
0.028** 0.019 |
0.038** 0.006 |
0.011 0.639 |
0.003 0.764 |
0.042**0 |
Table 5.
Statistical summary of the stations based on monthly precipitation before (in black) and after 2000 (in red).
Table 5.
Statistical summary of the stations based on monthly precipitation before (in black) and after 2000 (in red).
| Variable |
Baños 15 years |
Patate 15 years |
Píllaro 14 years |
Pedro Fermín 16 years |
Querochaca 14 years |
| Min [mm] | 3.10 21.1 |
2.60 1.10 |
2 1.60 |
3.60 4.60 |
3.20 1.5 |
| Max [mm] | 414..20 474.9 |
191.60 336 |
142.70 164.50 |
144.70 199.50 |
154.80 215.60 |
| Q1 [mm] | 63.02 72 |
24.9 19.85 |
27.87 23.17 |
24.80 26.36 |
31.40 33.50 |
| Q2 [mm] | 105.30 100.9 |
43.80 40.85 |
43.80 35.80 |
37.90 37.40 |
44.60 44.50 |
| Q3 [mm] | 153.72 138.82 |
66.30 64.25 |
64.57 57.27 |
58.10 60.77 |
62.30 70.35 |
| P90 [mm] | 199.45 187.27 |
93.72 94.66 |
82.43 100.30 |
75.32 80.07 |
82.30 83.64 |
| P99 [mm] | 272.69 290.35 |
185.616 176.44 |
133.71 136.74 |
113.06 158.34 |
110.51 127.24 |
|
Precipitación Anual acumulada [mm] |
1287.13 1198.65 |
469.52 456.77 |
553.02 417.59 |
513.33 504.08 |
578.36 616.05 |
Disclaimer/Publisher’s Note: The statements, opinions and data contained in all publications are solely those of the individual author(s) and contributor(s) and not of MDPI and/or the editor(s). MDPI and/or the editor(s) disclaim responsibility for any injury to people or property resulting from any ideas, methods, instructions or products referred to in the content. |
© 2025 by the authors. Licensee MDPI, Basel, Switzerland. This article is an open access article distributed under the terms and conditions of the Creative Commons Attribution (CC BY) license (http://creativecommons.org/licenses/by/4.0/).
Copyright: This open access article is published under a Creative Commons CC BY 4.0 license, which permit the free download, distribution, and reuse, provided that the author and preprint are cited in any reuse.


