Submitted:
16 April 2025
Posted:
16 April 2025
You are already at the latest version
Abstract
This study investigates the variability of precipitation across Ethiopia by analyzing monthly and annual rainfall data from five stations representing the north, east, west, south, and central regions over a 31-year period (1987–2017). The research applies the Standardized Precipitation Index (SPI) and continuous wavelet analysis to examine spatiotemporal rainfall variability and the influence of major ocean-atmosphere circulation patterns, including Niño-4, North Atlantic Oscillation (NAO), Southern Oscillation Index (SOI), and Mediterranean Oscillation Index (MOI). The SPI values indicate year-to-year variability ranging from 3.2 (extremely wet) to -2 (severe drought). Wavelet analysis reveals short- and long-term rainfall periodicities of 2–3, 3–5, and 6–10 years, which correspond to similar cycles in oceanic indices (2–3, 3–5, 6–10, and 8–13 years). Results highlight significant teleconnections between oceanic fluctuations and rainfall anomalies in different parts of Ethiopia. For instance, the northern region experienced a wet event (2.5 SPI) around 2001, influenced by Niño-4 (1992–2003); the southern region faced severe drought (-2 SPI) in 2014/2015, linked to NAO (2009–2016); and the western region was affected by SOI during 1992–2005, with droughts in 1994/1995 and 2003. The findings emphasize the role of oceanic anomalies in driving regional precipitation variability, providing valuable insights for water resource management and climate adaptation strategies. This study also bridges gaps in previous research by employing wavelet analysis to uncover time-frequency dynamics, particularly for SOI and MOI, offering a deeper understanding of precipitation teleconnections in Ethiopia.
Keywords:
Precipitation variability
; Oceanic indices
; Wavelet analysis
; Teleconnection
; Periodicity
; Ethiopia
Introduction
Hydroclimates, particularly precipitation, are crucial to the overall climate system and have far-reaching effects on ecosystems, land productivity, agriculture, and human health. These climatic variables are strongly influenced by large-scale ocean-atmospheric circulations such as the El Niño-Southern Oscillation (ENSO), the North Atlantic Oscillation (NAO), and the Southern Oscillation Index (SOI), which have been shown to impact rainfall patterns globally. Precipitation variability is particularly important in developing countries, like Ethiopia, where the economy is largely dependent on rain-fed agriculture (Singhrattna, 2012). Variability in rainfall can lead to issues like droughts and floods, threatening food security and the overall sustainability of water resources (Abegaz & Mekoya, 2020).
Several studies have explored the link between oceanic circulation patterns and precipitation variability in Ethiopia. Notably, research by (Abtew et al., 2009) and (Korecha & Barnston, 2007) demonstrated that the ENSO has a significant impact on Ethiopian rainfall, especially during extreme phases such as El Niño and La Niña events. ENSO has been widely studied for the past three decades, with SST anomalies in the tropical Pacific used as key predictors of Ethiopian rainfall. The National Meteorology Agency (NMA) has also explored the connection between ENSO indices and the hydrology of the Blue Nile River Basin. Extreme dry and wet years are very likely to correspond with ENSO events. The great Ethiopian famine of 1888-1892 corresponds to one of the strongest El Nin˜o years. The Indian Ocean Dipole (IOD) had also traditionally been viewed as an artifact of the ENSO system although increasingly the evidence is revealing that it is separate and distinct phenomenon. The influence of the IOD is not just confined to the tropical region, but reaching far to the whole globe (Yamagata, 2002). The evidence indicates Indian Ocean SST anomalies have a significant impact on regional atmospheric circulation and rainfall anomalies that extend into East and southern Africa (Marchant et al., 2007).
Other studies have highlighted the influence of atmospheric patterns like the Pacific-North American (PNA) pattern on seasonal rainfall in Ethiopia, especially in the western and northern regions (Diro et al., 2008). (Gissila et al., 2004) identified the influence of the North Atlantic Oscillation (NAO) on Ethiopian rainfall, with positive phases contributing to increased rainfall in the highlands, while negative phases tend to reduce precipitation across much of the country. (Shanko & Camberlin, 1998) emphasized the complex interaction between regional and global climate drivers, highlighting the importance of the NAO and the Pacific Decadal Oscillation (PDO) in modulating long-term variability in Ethiopian precipitation.
While these studies have provided valuable insights into the impact of large-scale atmospheric patterns on rainfall variability, they have mainly focused on individual oceanic oscillations and relied on linear correlation methods. Moreover, the lack of advanced analysis techniques, such as wavelet analysis, has left a gap in understanding the time-frequency features of these climatic drivers and their interactions with precipitation, particularly in Ethiopia.
A better understanding of the spatially and temporally organized links between precipitation variability and large-scale ocean-atmosphere oscillations would be immensely beneficial. Anticipating regional predispositions to rainfall variability during particular phases of ocean-atmosphere systems could significantly improve preparedness for extreme weather events (Rathinasamy et al., 2019). Teleconnection refers to the phenomenon where weather or climate patterns in one part of the world influence weather in another, distant region through large-scale atmospheric systems that link different places, even if they are far apart. It is indispensable to study the spatiotemporal characteristics of large-scale climatic factors with the precipitation variability for effective management and allocation of water resources (Das et al., 2020).
In the context of Ethiopia, studies have explored the relationship between large-scale climate anomalies like ENSO and precipitation variability. (Segele et al., 2009) analyzed the seasonal to inter-annual variability of Ethiopian precipitation and its association with large-scale atmospheric circulation patterns and global SST anomalies. Their study found that Ethiopian precipitation variability is driven by the combined effects of local and regional atmospheric mechanisms and global SST anomalies. Similarly, (Molla et al., 2019) examined the impact of ENSO on precipitation over the Upper Blue Nile Basin using Pearson correlation analysis.
This study aims to explore the effects of large-scale ocean-atmospheric circulation patterns, such as Niño-4, NAO, SOI, and MOI, on precipitation variability across different sectors of Ethiopia. By using wavelet analysis, which provides a detailed understanding of time-frequency relationships between multiple time-series, this research will bridge the gap left by earlier studies that primarily employed simpler regression and correlation methods. This study will examine how ENSO, NAO, SOI, and MOI interact with precipitation variability in Ethiopia, offering new insights into their impact on local wet and dry events. The results will assist Ethiopia’s water resources management agencies in better preparing for and mitigating the effects of droughts and floods, contributing to improved resource management and climate adaptation strategies
Furthermore, little research has been conducted on the SOI and MOI, which are significant climate anomalies influencing precipitation variability in Ethiopia. By addressing the time-frequency features of these climatic indices and their interrelationships with precipitation, this study will offer a novel contribution to the field. The research will also investigate local wet and dry events by calculating the Standard Precipitation Index (SPI) and explore the periodicity of dominant oceanic indices affecting precipitation across different sectors of Ethiopia.
Data Source and Method of Analysis
Description of Study Area
Ethiopia is located between latitudes 3.3°N and 15°N, and longitudes 33°E and 48°E, covering an approximate area of 1.02 million square kilometers (Korecha & Barnston, 2007). This study focuses on various regions within Ethiopia, including the eastern, western, northern, southern, and central parts, as depicted in Figure 1.
The country's natural landscape is characterized by high plateaus and mountain ranges, with elevations ranging from approximately 4,500 meters above sea level in the northern and central regions to about 100 meters below sea level in the northeastern lowlands. This diverse topography contributes to significant climatic variations across Ethiopia, influencing different rainfall patterns as described by the National Meteorology Service Agency.
The northwestern regions predominantly experience a single rainy season, known as Kiremt, which extends from June to September (Tsidu, 2012). This season is influenced by the movement of the Intertropical Convergence Zone (ITCZ), the South Atlantic anticyclone, and the moist southwesterly monsoon flow originating from the Southern Hemisphere. The timing and spatial distribution of rainfall during Kiremt are closely linked to ITCZ oscillations and the strength of the southern hemispheric anticyclones (Segele & Lamb, 2005).
In contrast, the eastern regions of Ethiopia exhibit a bimodal rainfall pattern, consisting of a primary rainy season in summer and a secondary, shorter rainy season during the spring months (Belg: February-May). These rainfall patterns are primarily driven by moist easterly winds from the northwestern Indian Ocean, influenced by high-pressure systems over the Arabian Sea. Similarly, the southern regions follow a bimodal rainfall distribution, with peak rainfall occurring in both spring and autumn (October-December). This seasonal pattern aligns with that observed in equatorial East Africa and is attributed to the north-south migration of the ITCZ.
Figure 1.
The study area.

Data Source
Precipitation Data
The primary dataset used in this study consists of daily precipitation data collected from rain gauges at selected stations across Ethiopia for the period 1987–2017, provided by the Ethiopian National Meteorology Agency (NMA). These stations represent various climatic rainfall zones across the country, including the northern, southern, eastern, western, and central regions. Monthly and annual rainfall data were derived from the daily station records. Missing data in the time series were filled using interpolation techniques based on neighboring years' data and supplemented with gridded rainfall data.
The gridded rainfall data, also provided by the NMA, were constructed using a combination of rain gauge records and satellite observations. Specifically, the Tropical Rainfall Measuring Mission (TRMM) and the Climate Hazards Group InfraRed Precipitation with Station data (CHIRPS) were utilized. These satellite products were essential for addressing the sparse and uneven distribution of weather stations in Ethiopia. The selection of stations was based on data availability and their representation of different climate zones.
Climate Index Data
The following climate indices were analyzed in this study:
North Atlantic Oscillation (NAO): Represents atmospheric oscillations in sea-level pressure over the North Atlantic Ocean. It is calculated as the normalized pressure difference between the Azores and a station in Iceland (50°–20°N, 60°–30°W).
Niño 4 Index: Indicates the strength and sign of the El Niño-Southern Oscillation (ENSO) by measuring sea surface temperature (SST) anomalies in the Niño 4 region (5°N–5°S, 160°E–150°W).
Mediterranean Oscillation Index (MOI): Reflects atmospheric pressure oscillations between the western (e.g., Gibraltar) and eastern (e.g., Israel) Mediterranean regions. This teleconnection pattern significantly influences precipitation in surrounding regions, including parts of Africa. All climate index datasets were obtained from the NOAA Physical Sciences Laboratory website (http://www.esrl.noaa.gov/psd/data/climateindices)) and cover the period from January 1987 to December 2017.
Southern Oscillation Index (SOI): Measures atmospheric pressure anomalies between Tahiti (east-central Pacific) and Darwin, Australia (west Pacific). The negative (positive) SOI phase corresponds to El Niño (La Niña) conditions. The SOI is another ENSO index, which measures the difference in sea-level atmospheric pressure anomalies between Tahiti and Darwin, Australia(Trenberth, 1984). The negative phase of the SOI occurs when below-normal atmospheric pressure at Tahiti (east-central Pacific) and above-normal pressure at Darwin (west Pacific) are observed. The negative (positive) SOI generally coincide with positive (negative) SST anomalies in the east-central Pacific, associated with an El Nio or La Nina.
All climate index datasets were obtained from the NOAA Physical Sciences Laboratory website (http://www.esrl.noaa.gov/psd/data/climateindices)) and cover the period from January 1987 to December 2017. The details of dataset type, source, time period, and spatial coverage are presented in Table 1 (see Table 1 for reference).
Method of Analysis
Standardized Precipitation Ratio (Ip)
To identify the alternating dry and wet periods of the country in this study the standardized pre- capitation ratio was first performed on the annual scale. Then, analytical and spectral tools (continuous wavelet Transform analysis) were used to identify the variability modes and determine the origin of this variability.
The standardized precipitation ratio (Ip) was used to determine wet and dry periods and their alternations consistent with positive (wet) and negative (dry) values(Jemai et al., 2017). It’s a dimensionless parameter, based on the ratio of the precipitation difference from the mean to standard deviation (Equation (1). It is defined as follows:
Where Ip: standardized precipitation ratio, yi: rainfall for a given study year,: average rainfall during a given study period, σ: standard deviation of rainfall for the same period
Wavelet Transform
Various methods have been introduced for signal processing and time series analysis. Most of these methods are mathematical transforms that convert vectors or functions from one space to another. Some of the transformations (e.g. Fourier transforms) are only appropriate for the analysis of stationary time series exhibiting a uniform oscillation pattern over time. These transformations are not robust enough for the analysis of non-stationary time series, since they cannot identify all frequencies within the time series(Olkkonen, 2011; Percival & Walden, 2000).
Wavelet Transform is a powerful tool used for time-frequency analysis, allowing the decomposition of signals into components that vary in both time and frequency domains. This method is particularly useful for identifying localized variations in power and understanding the temporal evolution of different frequency components. The current study employs the Continuous Wavelet Transform (CWT) to analyze the variation of power across multiple timescales.
Previous studies, such as (Sarker & Sarker, 2022) have demonstrated the effectiveness of wavelet-based approaches in studying the spectral properties of complex systems, including the dynamics of water hammer waves. Similarly, (Sarker et al., 2023) highlighted the utility of time-frequency analysis in examining morphodynamic properties and their temporal evolution. These works provide valuable insights into the practical applications of Wavelet Transform in analyzing both natural and engineered systems, reinforcing its suitability for the current analysis.
Wavelet analysis is a common method for analyzing the power of local variation within a time series by decomposing a time series into time versus frequency space and hence it describes the variability of precipitation in terms of pattern and representing the contribution of each pe- riod/scale for the overall. The wavelet transforms breaking up a signal into scaled versions of a wavelet function; where the size of the wavelet (the window) varies with frequency. The wavelet transform are often used to analyze time series that contain non-stationary power at many various frequencies. Localization during a signal analysis by decomposing or transforming a one- dimensional time Series into a diffuse two-dimensional time-frequency image, at an equivalent time. Then, it is Possible to get information on both the amplitude of any periodic signals within the series, and how this amplitude varies with time. Continuous wavelet transform was chosen because it is widely used complex wavelet having good time-frequency localization than other real wavelets (Addison, 2017).
The theory behind wavelet transform is relatively similar to that of Fourier transforms, but offers much greater flexibility allowing a highly accurate capture of all frequencies present in a given time series ((Percival & Walden, 2000; Sang, 2013). Continuous wavelet transform (CWT) is recognized as one of the robust tools for the investigation of processes with high temporal variability ((Labat, 2005). It is appropriate in particular for examining non-stationary processes, like climate variables.
In this study, it is performed on gauge precipitation data and ocean indices to examine their oscillation. The CWT of the signal x(t) generating a wavelet spectrum is expressed as Equation (3.3) (Grossmann and Morlet, 1984).
Every wavelet length is finite and ever precisely localized in time. The mother wavelet includes two parameters: scaling s and temporal location τ
With ψs,τ (t): Wavelet daughter; s: scale parameter ; τ : time-localization parameter. and ψ and ψ ∗ represent the wavelet function and complex conjugate, respectively. With τ = 0 and s = 1 denotes the basic or mother wavelet. The flexibility in the wavelet transform comes due to the variations in the scale, which enable to capture the long and short frequency in the time series. Parameterization of scale and wavelet daughters admits the finding of various frequencies that compose signal. The actual computation of the wavelet transform described(Santos et al., 2016). Finally we used mat lab and origin software to analysis the data.
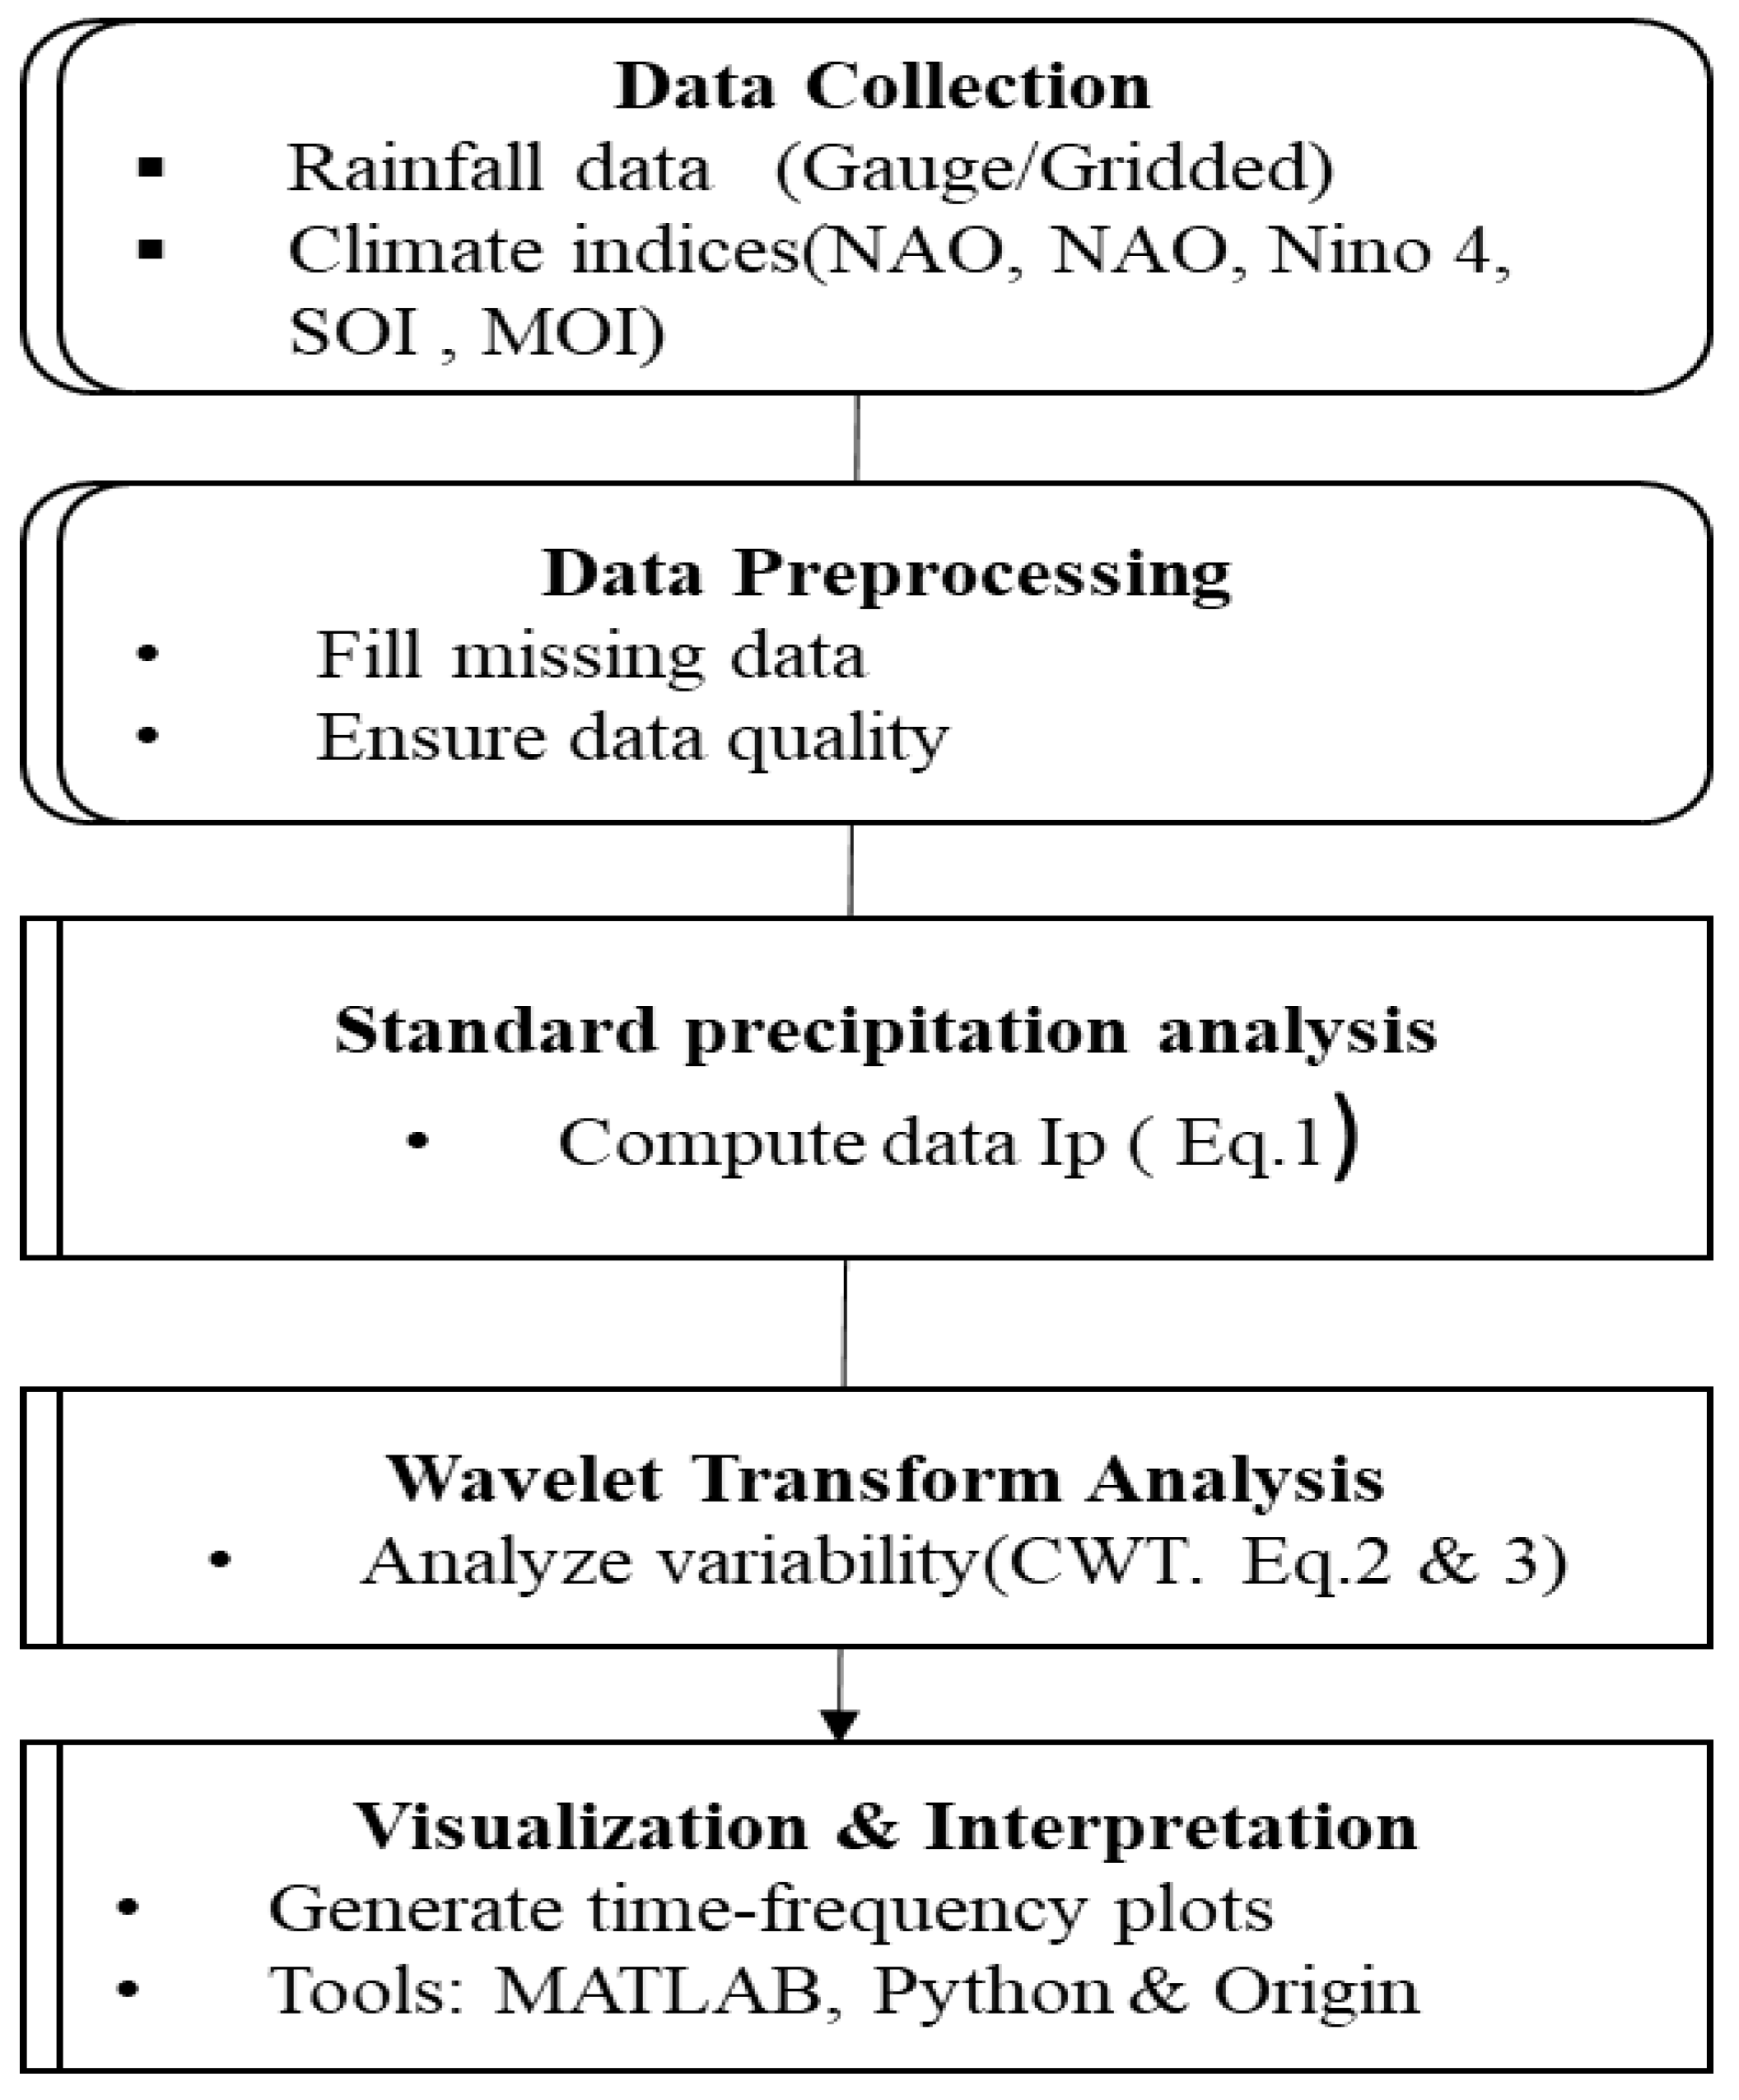
Figure 2.
Flowchart illustrating the methodology used in the study, highlighting the sequential steps from data collection and preprocessing to analysis and interpretation of results using wavelet transforms and other techniques.
Figure 2.
Flowchart illustrating the methodology used in the study, highlighting the sequential steps from data collection and preprocessing to analysis and interpretation of results using wavelet transforms and other techniques.
Result and Discussion
Standardized Precipitation Ratio (Ip)
Precipitation is the result of several atmospheric systems (such as topography and ITCZ) that behave at various scales and periodicity. Further, the irregularity and seasonality exhibited by rainfall, can be assessed by means of the climatic index is crucial. Standardized precipitation ratio(Ip) developed by (McKee et al., 1993) is used to classify the wet and dry rainfall anomalies. Based on the irregularity of precipitation distribution, standardized precipitation was calculated to separate wet and dry periods over 31 years of the study area. For this investigation, we used standardized precipitation ratio equation (1) mentioned in the method of data analysis. The calculated rainfall irregularity (standardized precipitation ratio) was calculated to indicate the estimated year to year variation of inter annual rainfall expressed in terms of standardized precipitation ratio. Negative standardized rainfall indicates dry (below normal rainfall) period and positive anomalies indicate wet (above normal rainfall) period.
Figure 3a) depicts the Ip for the northern part of the country, where positive standardized precipitation values indicate wet periods and negative values represent dry periods. The northern region experienced a generally dry period from 1987 to 1997, with a peak negative value of -1.25 in 1990, followed by wet periods from 1998 to 2001, peaking at 2.76 in 2001. From 2002 to 2017, more dry periods were observed, with only a few slightly humid years. The standard precipitation ratio for this location shows a pattern consistent with observations by (Ayalew et al., 2012; Wolde-Georgis, 1997) who also reported positive standardized anomalies in the northern region during 1999–2001.
Figure 3b) illustrates the standard precipitation ratio for the eastern part of the country. In this region, a predominantly dry period was observed from 1987 to 1991, except for 1987. This was followed by generally wet periods from 1992 to 1998, with a maximum value of 2.1 in 1996. The final period, from 1999 to 2017, indicates more dry periods compared to wet periods, with a maximum positive peak value of 2.1 in 2010 and a maximum negative peak value of -1.5 in 2015.
Figure 3.
Standardized precipitation ratio for a) northern b) eastern regions of Ethiopia.
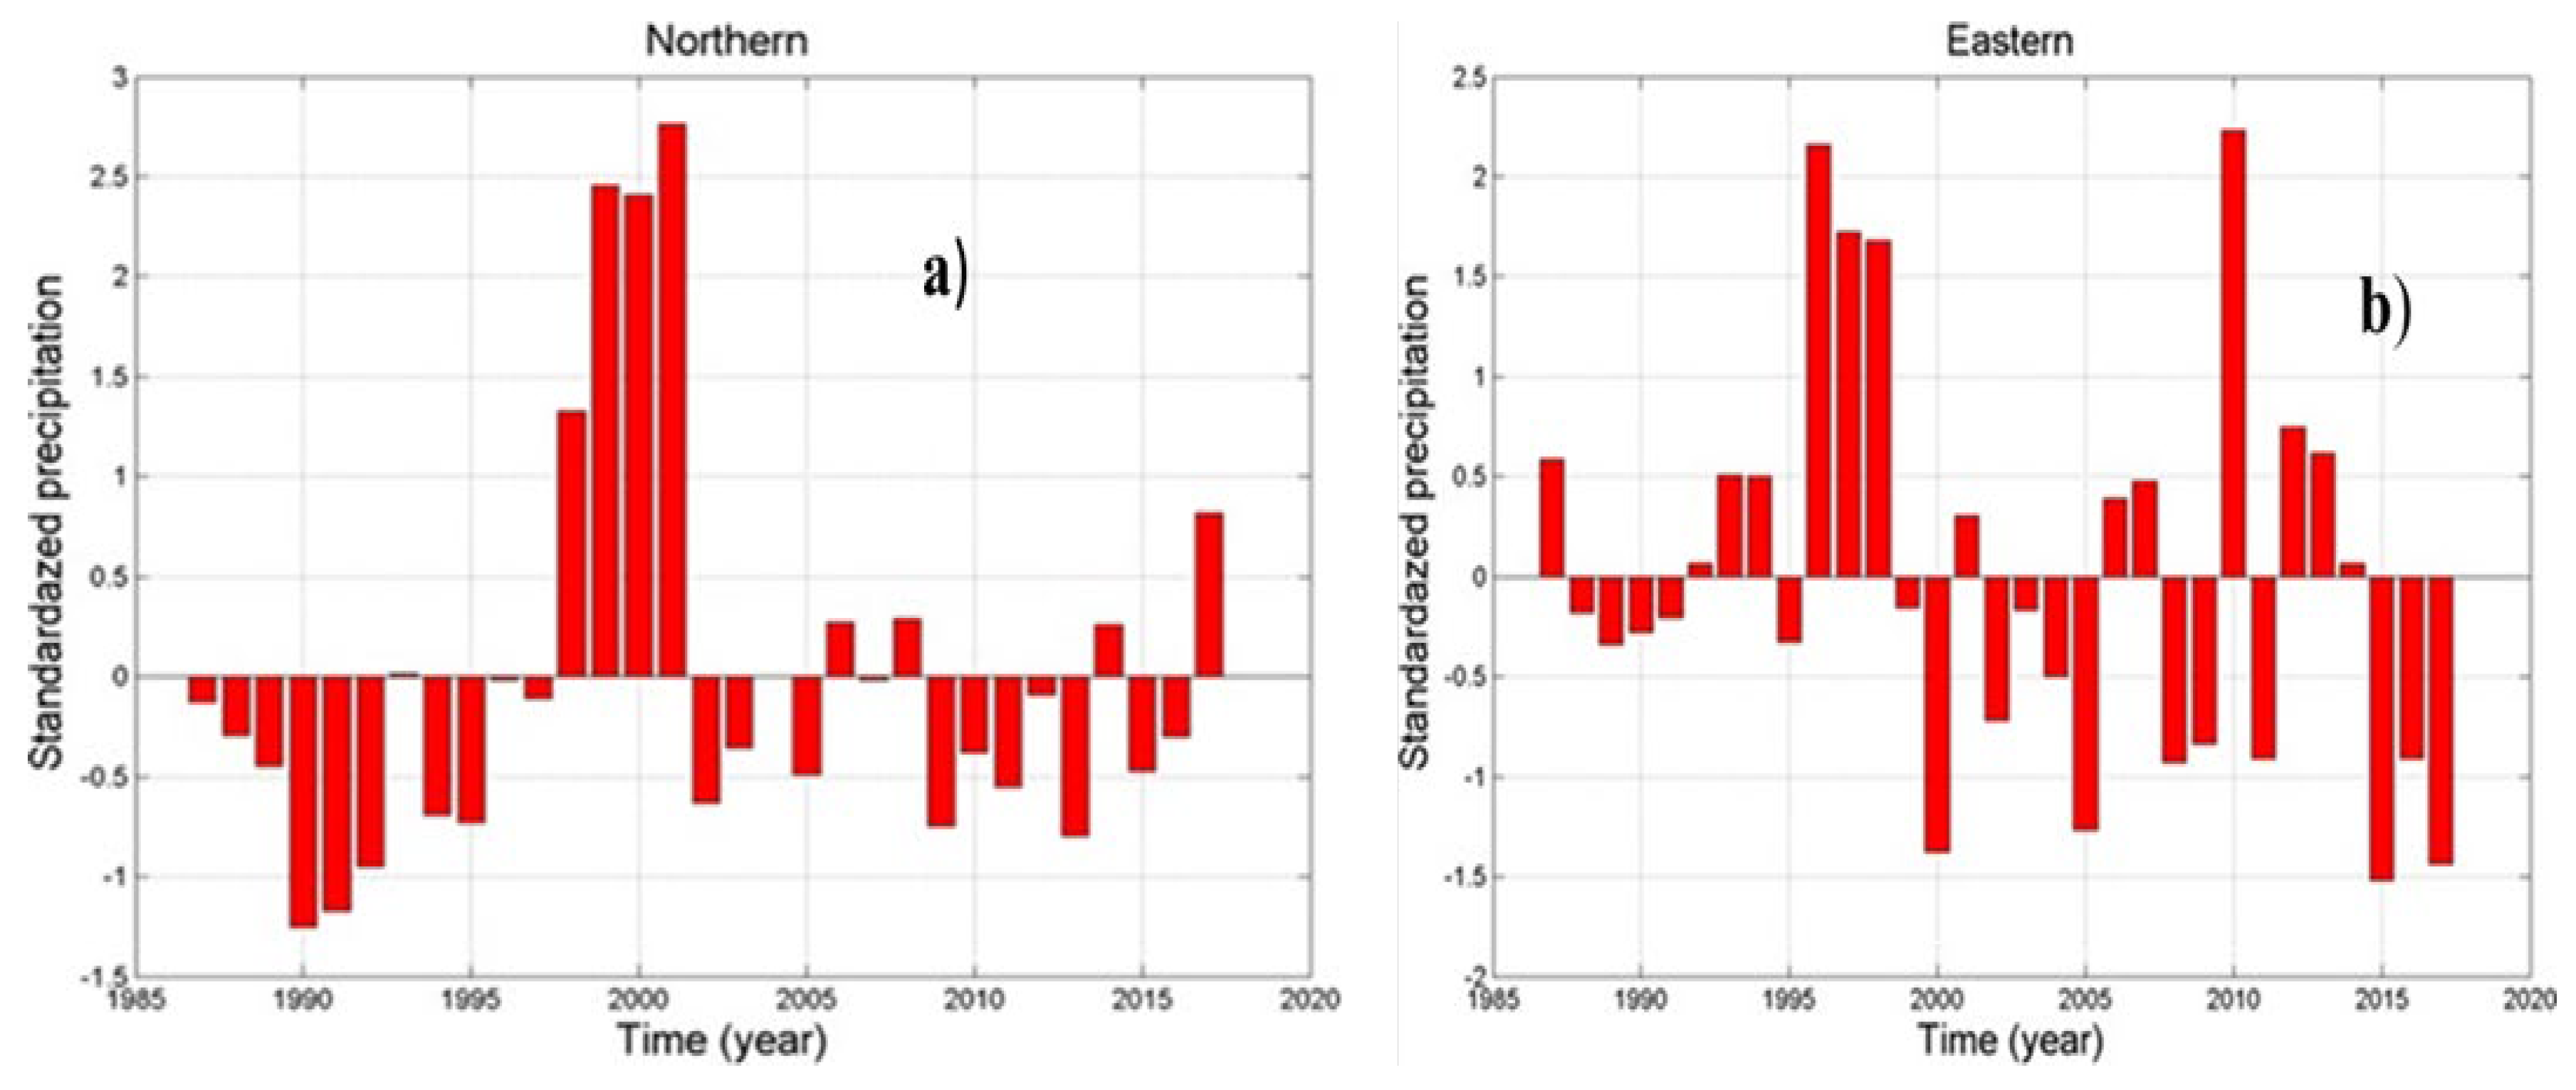
Figure 4a illustrates the standard precipitation ratio for the western parts of the country. From 1987 to 1996, alternating slightly dry and wet periods were observed. Wet periods were prominent between 1997 and 2001, with the highest positive peak value of 2.1 recorded in 1997. From 2002 to 2012, the region experienced a predominantly dry period, interspersed with occasional humid years. The driest year during this period was 2003, with a negative peak value of -1.8. From 2013 to 2017, the region experienced a predominantly wet period, interrupted by a few dry years
Figure 4.
Standardized precipitation ratio for a) western b) southern regions of Ethiopia.
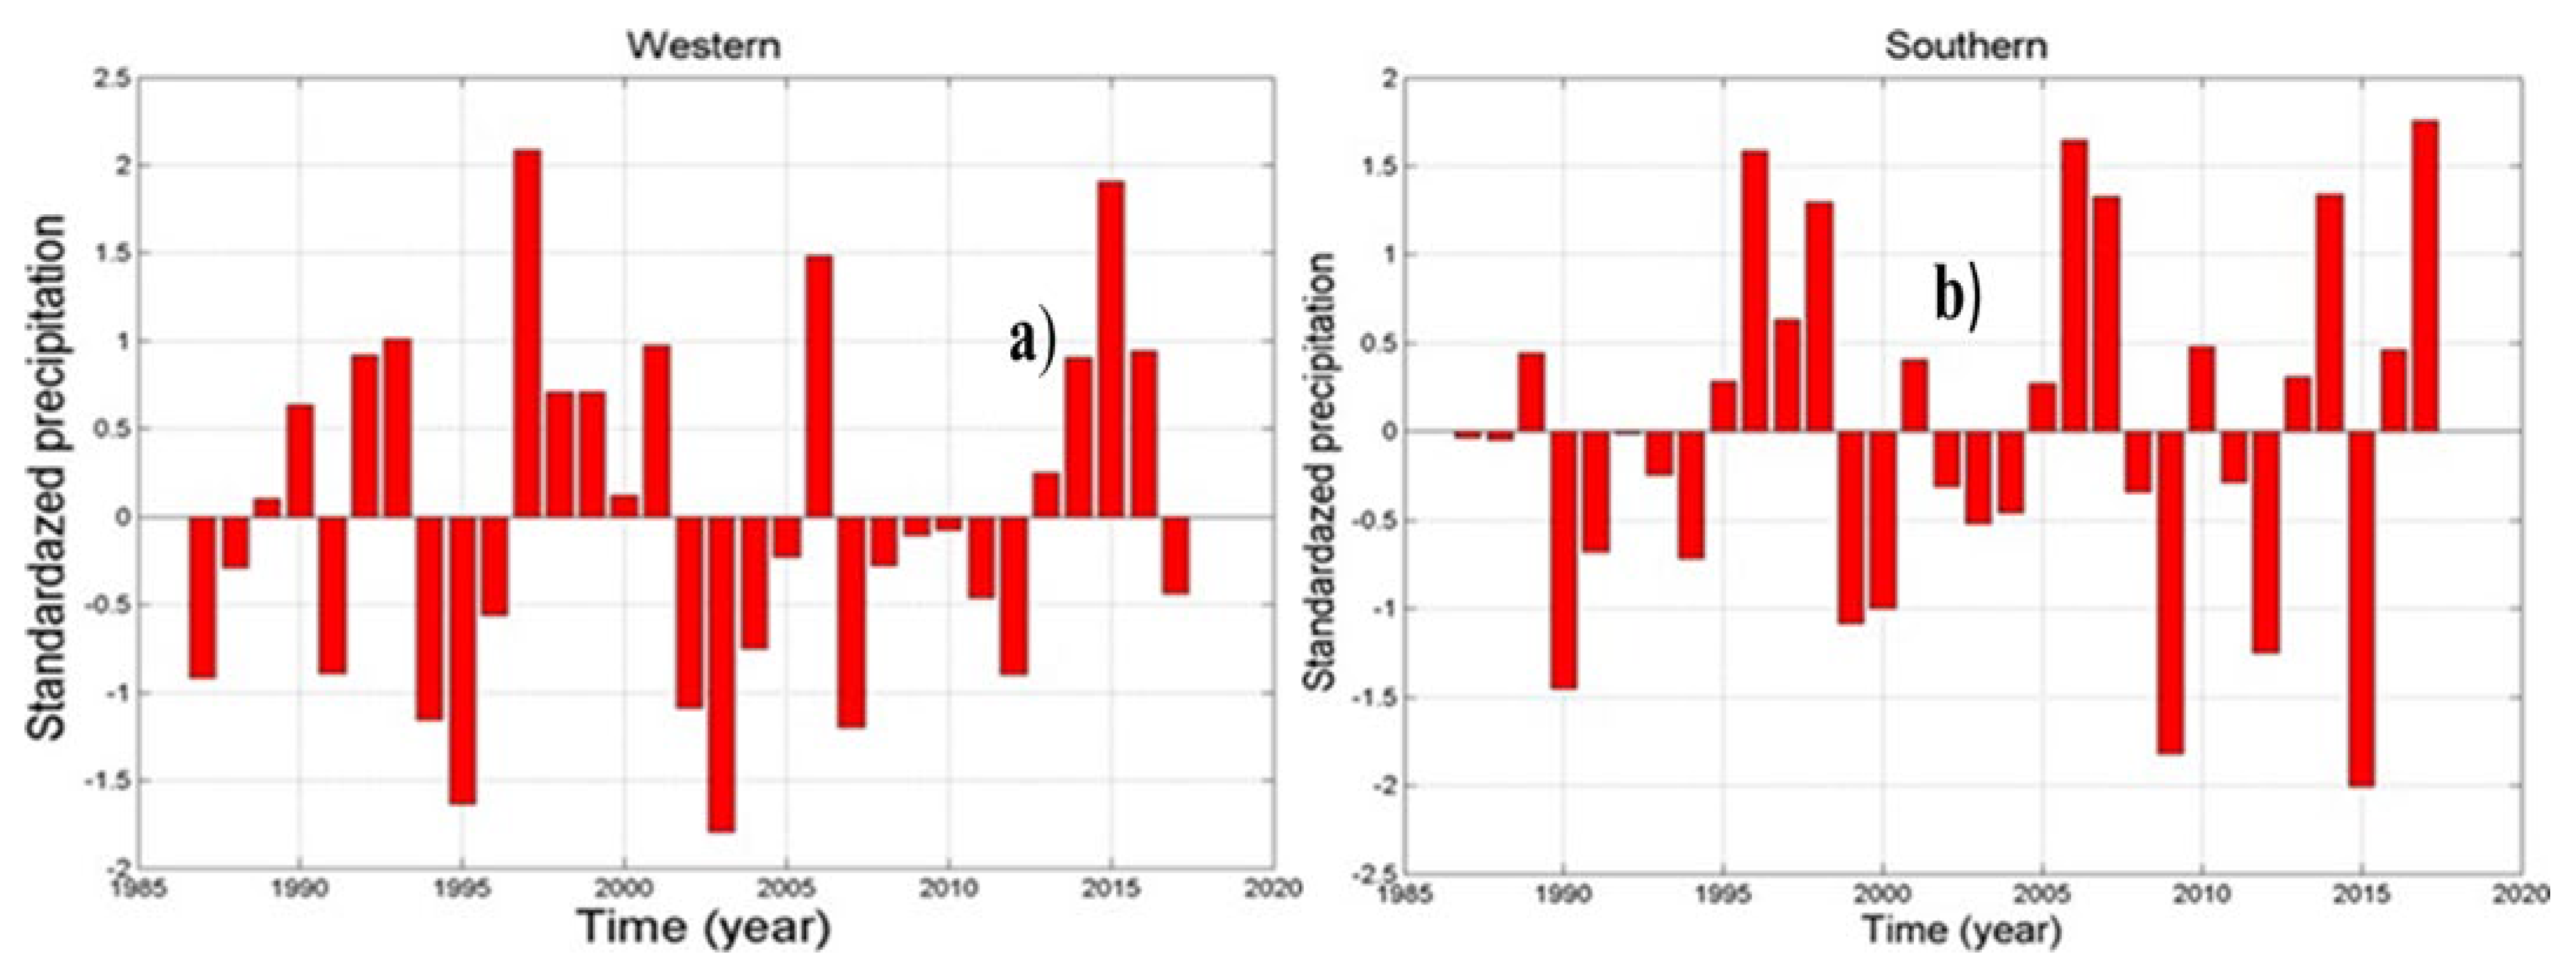
Figure 4b presents the standard precipitation ratio (Ip) for the southern parts of the country. From 1987 to 1994, the region experienced predominantly dry years, with only a few wet periods. Between 1995 and 1998, positive Ip values indicate wet periods, followed by a dry period from 1999 to 2005. The period from 2005 to 2017 was characterized by an increase in both wet years and the frequency of dry years compared to the earlier study periods. During this time, a notable negative peak value of -2 was recorded in 2015, while a positive peak value of 1.75 was observed at the end of the study period.
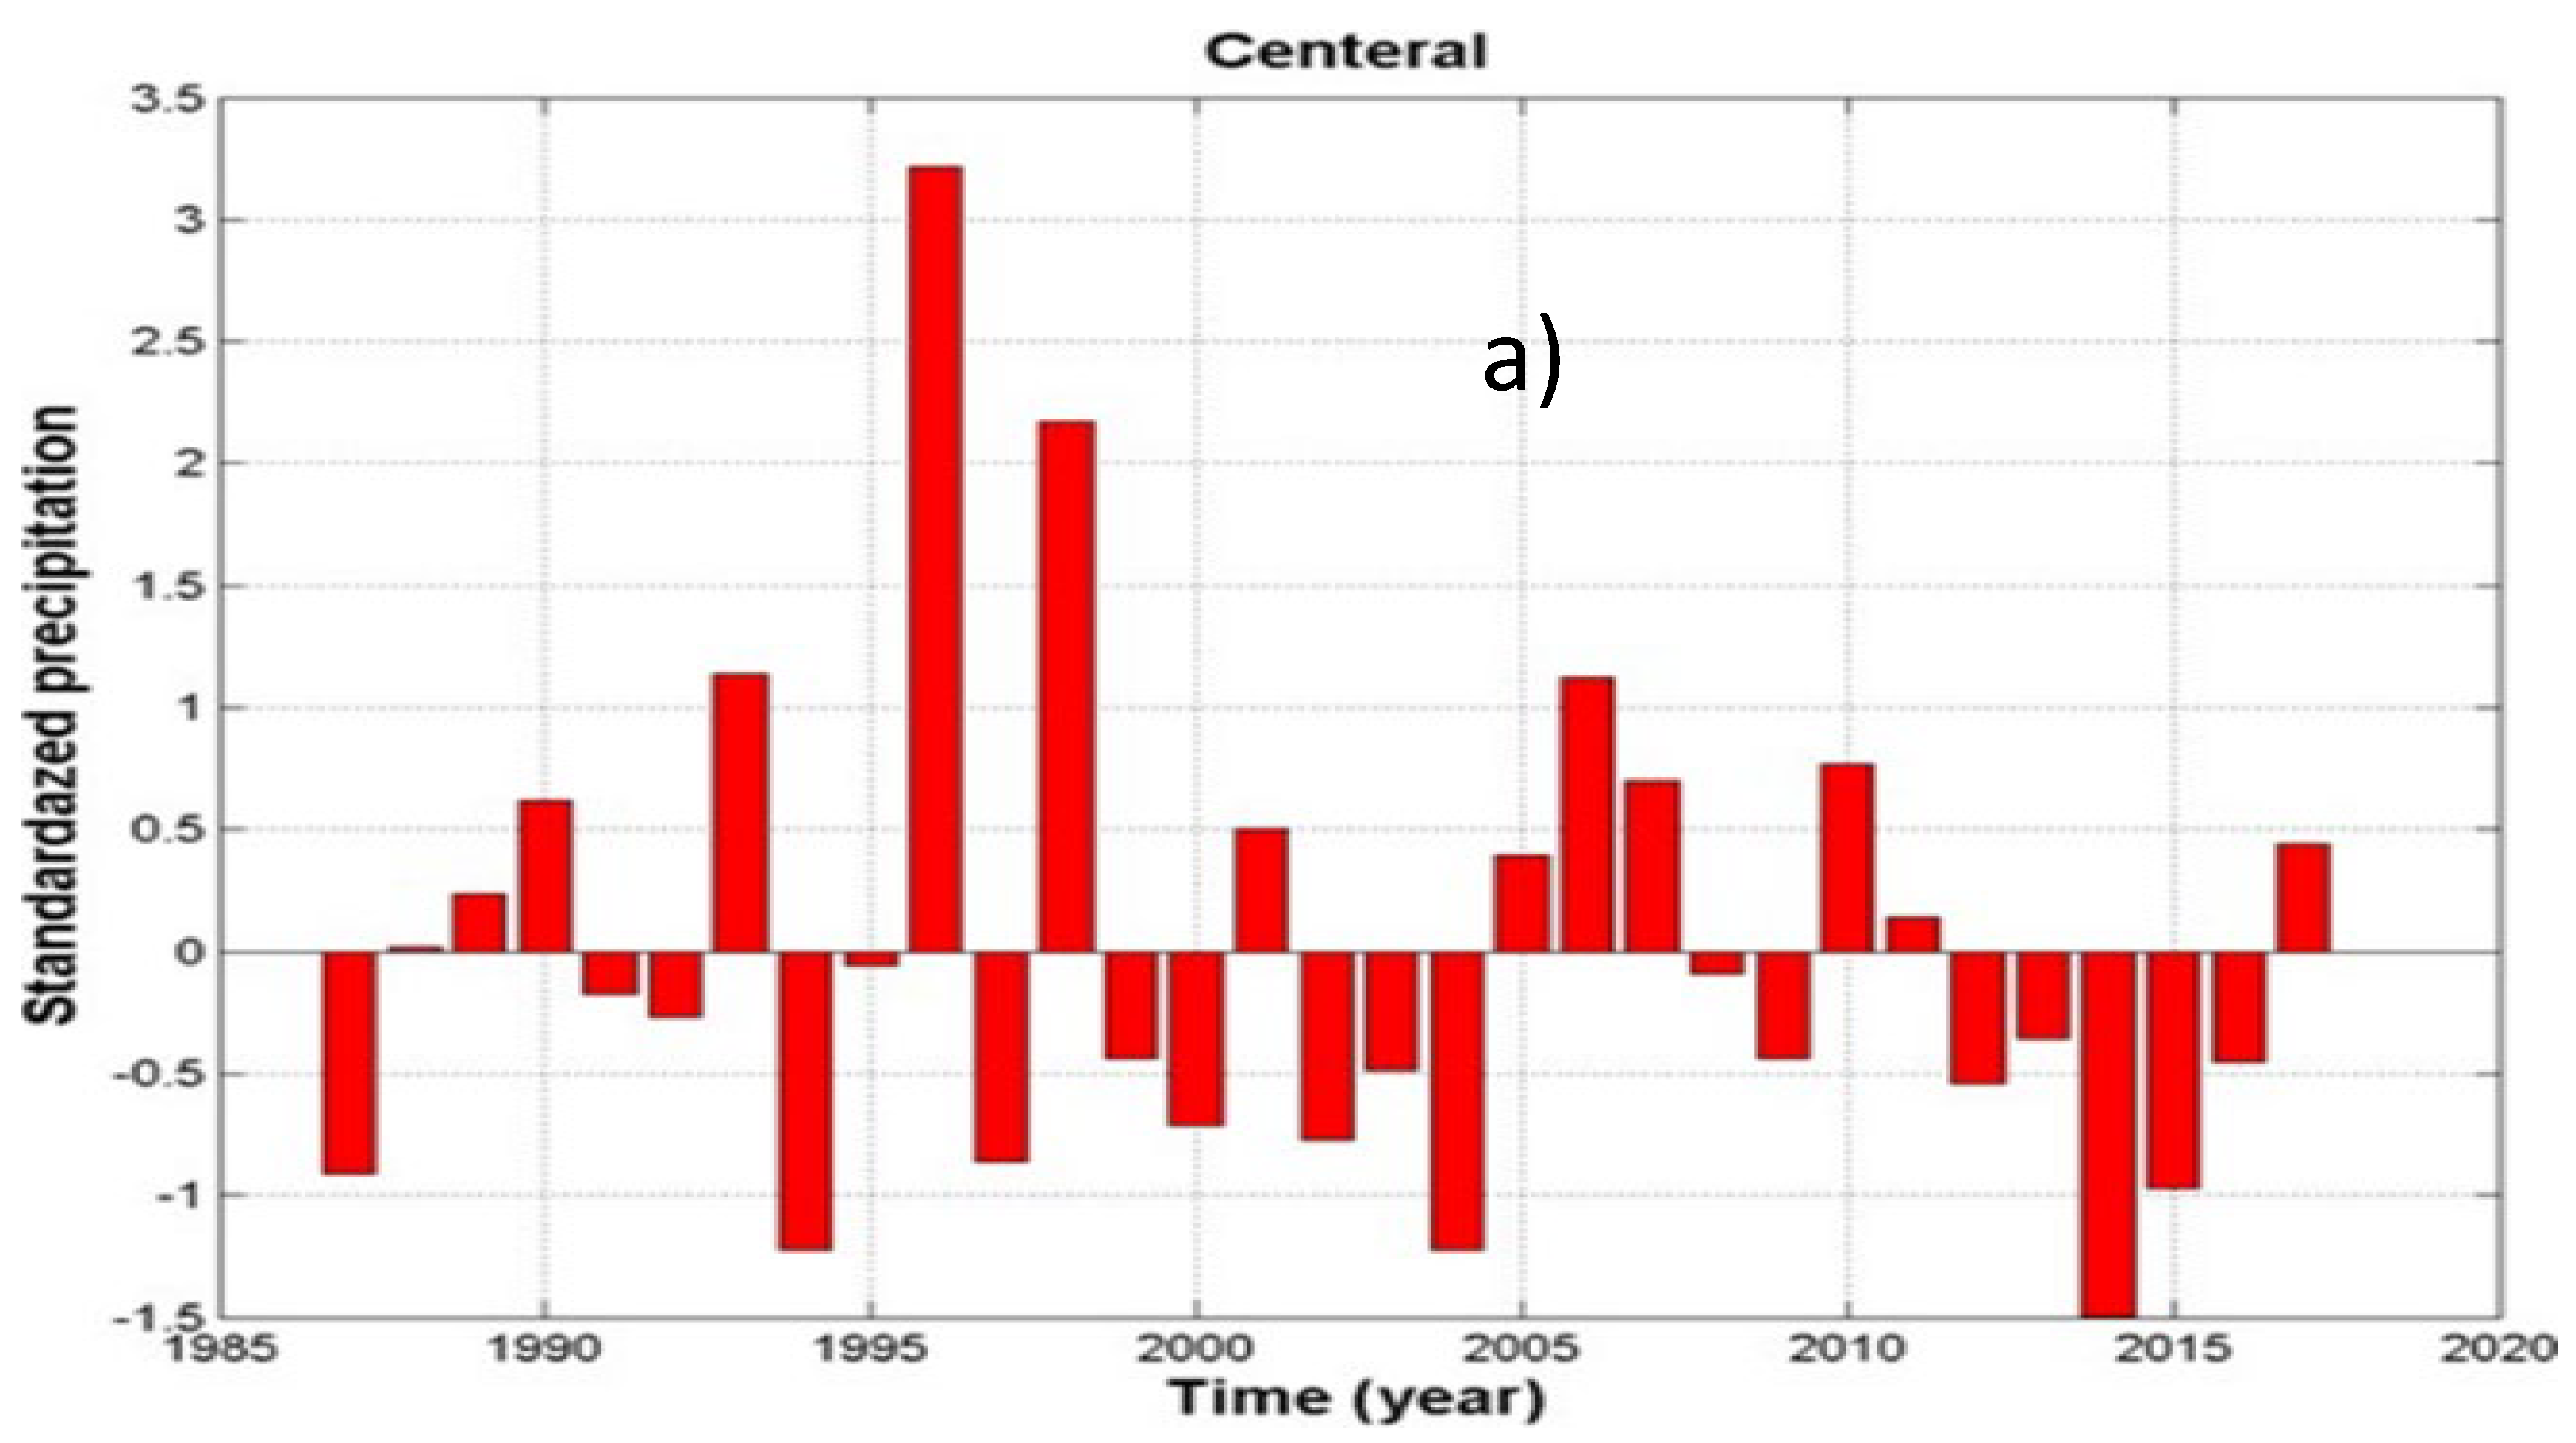
As shown in Figure 5a, the temporal variability of the standard precipitation ratio (Ip) reveals distinct patterns across four periods. The first period, spanning 1987–1993, exhibited predominantly wet conditions, with more wet periods than dry periods. The second period, from 1994 to 2004, was characterized by generally dry conditions, interrupted by a slightly wet year in 1996, which recorded a maximum Ip value of 3.2. The third period, from 2005 to 2011, was marked by predominantly wet conditions, except for 2008 and 2009. Finally, the fourth period, from 2012 to 2017, was a generally dry period, with the most pronounced negative peak value of -1.5 observed in 2014.
The occurrence of extreme positive and negative peak values during these periods indicates episodes of heavy rainfall and drought, respectively, highlighting the impact of extreme climatic events on rainfall variability and water availability in the study area.
Figure 1.
Standardized precipitation ratio for a) central regions of Ethiopia.
Mode of Rainfall Variability
To investigate precipitation variability and identify oscillation modes, the wavelet transform technique was applied to 31 years (1987–2018) of annual precipitation data across five selected regions of Ethiopia: Northern, Eastern, Southern, Western, and Central. The analysis, presented in Figure 6, Figure 7 and Figure 8, reveals several dominant frequency modes and power spectra on an annual scale. These findings emphasize significant oscillation periods and their temporal evolution, offering insights into region-specific and temporal rainfall variability. The wavelet transform effectively captures key trends and oscillatory behaviors, providing a detailed understanding of precipitation dynamics across the study regions.
Figure 6a illustrates the wavelet analysis of periodicity in a year versus the time series of rainfall for the northern part of Ethiopia, revealing two dominant oscillations or periodicities. The first is a periodicity of 6 –10 years, corresponding to a frequency range of 0.1– 0.17 cycles per year, with a power of 55.4 W. This oscillation prevailed for 11 years, spanning from 1992 to 2003. The second is a 20-year periodicity, corresponding to a frequency of 0.05 cycles per year, lasting from 1992 to 2005. These findings indicate that the northern region is characterized by the dominance of a long-term oscillation of 6 –10 years during 1992–2003 and a 20-year periodicity from 1992 to 2005.
Figure 6.
Wavelet analysis of precipitation time series of a) northern b) eastern part of the Ethiopia.
Figure 6.
Wavelet analysis of precipitation time series of a) northern b) eastern part of the Ethiopia.
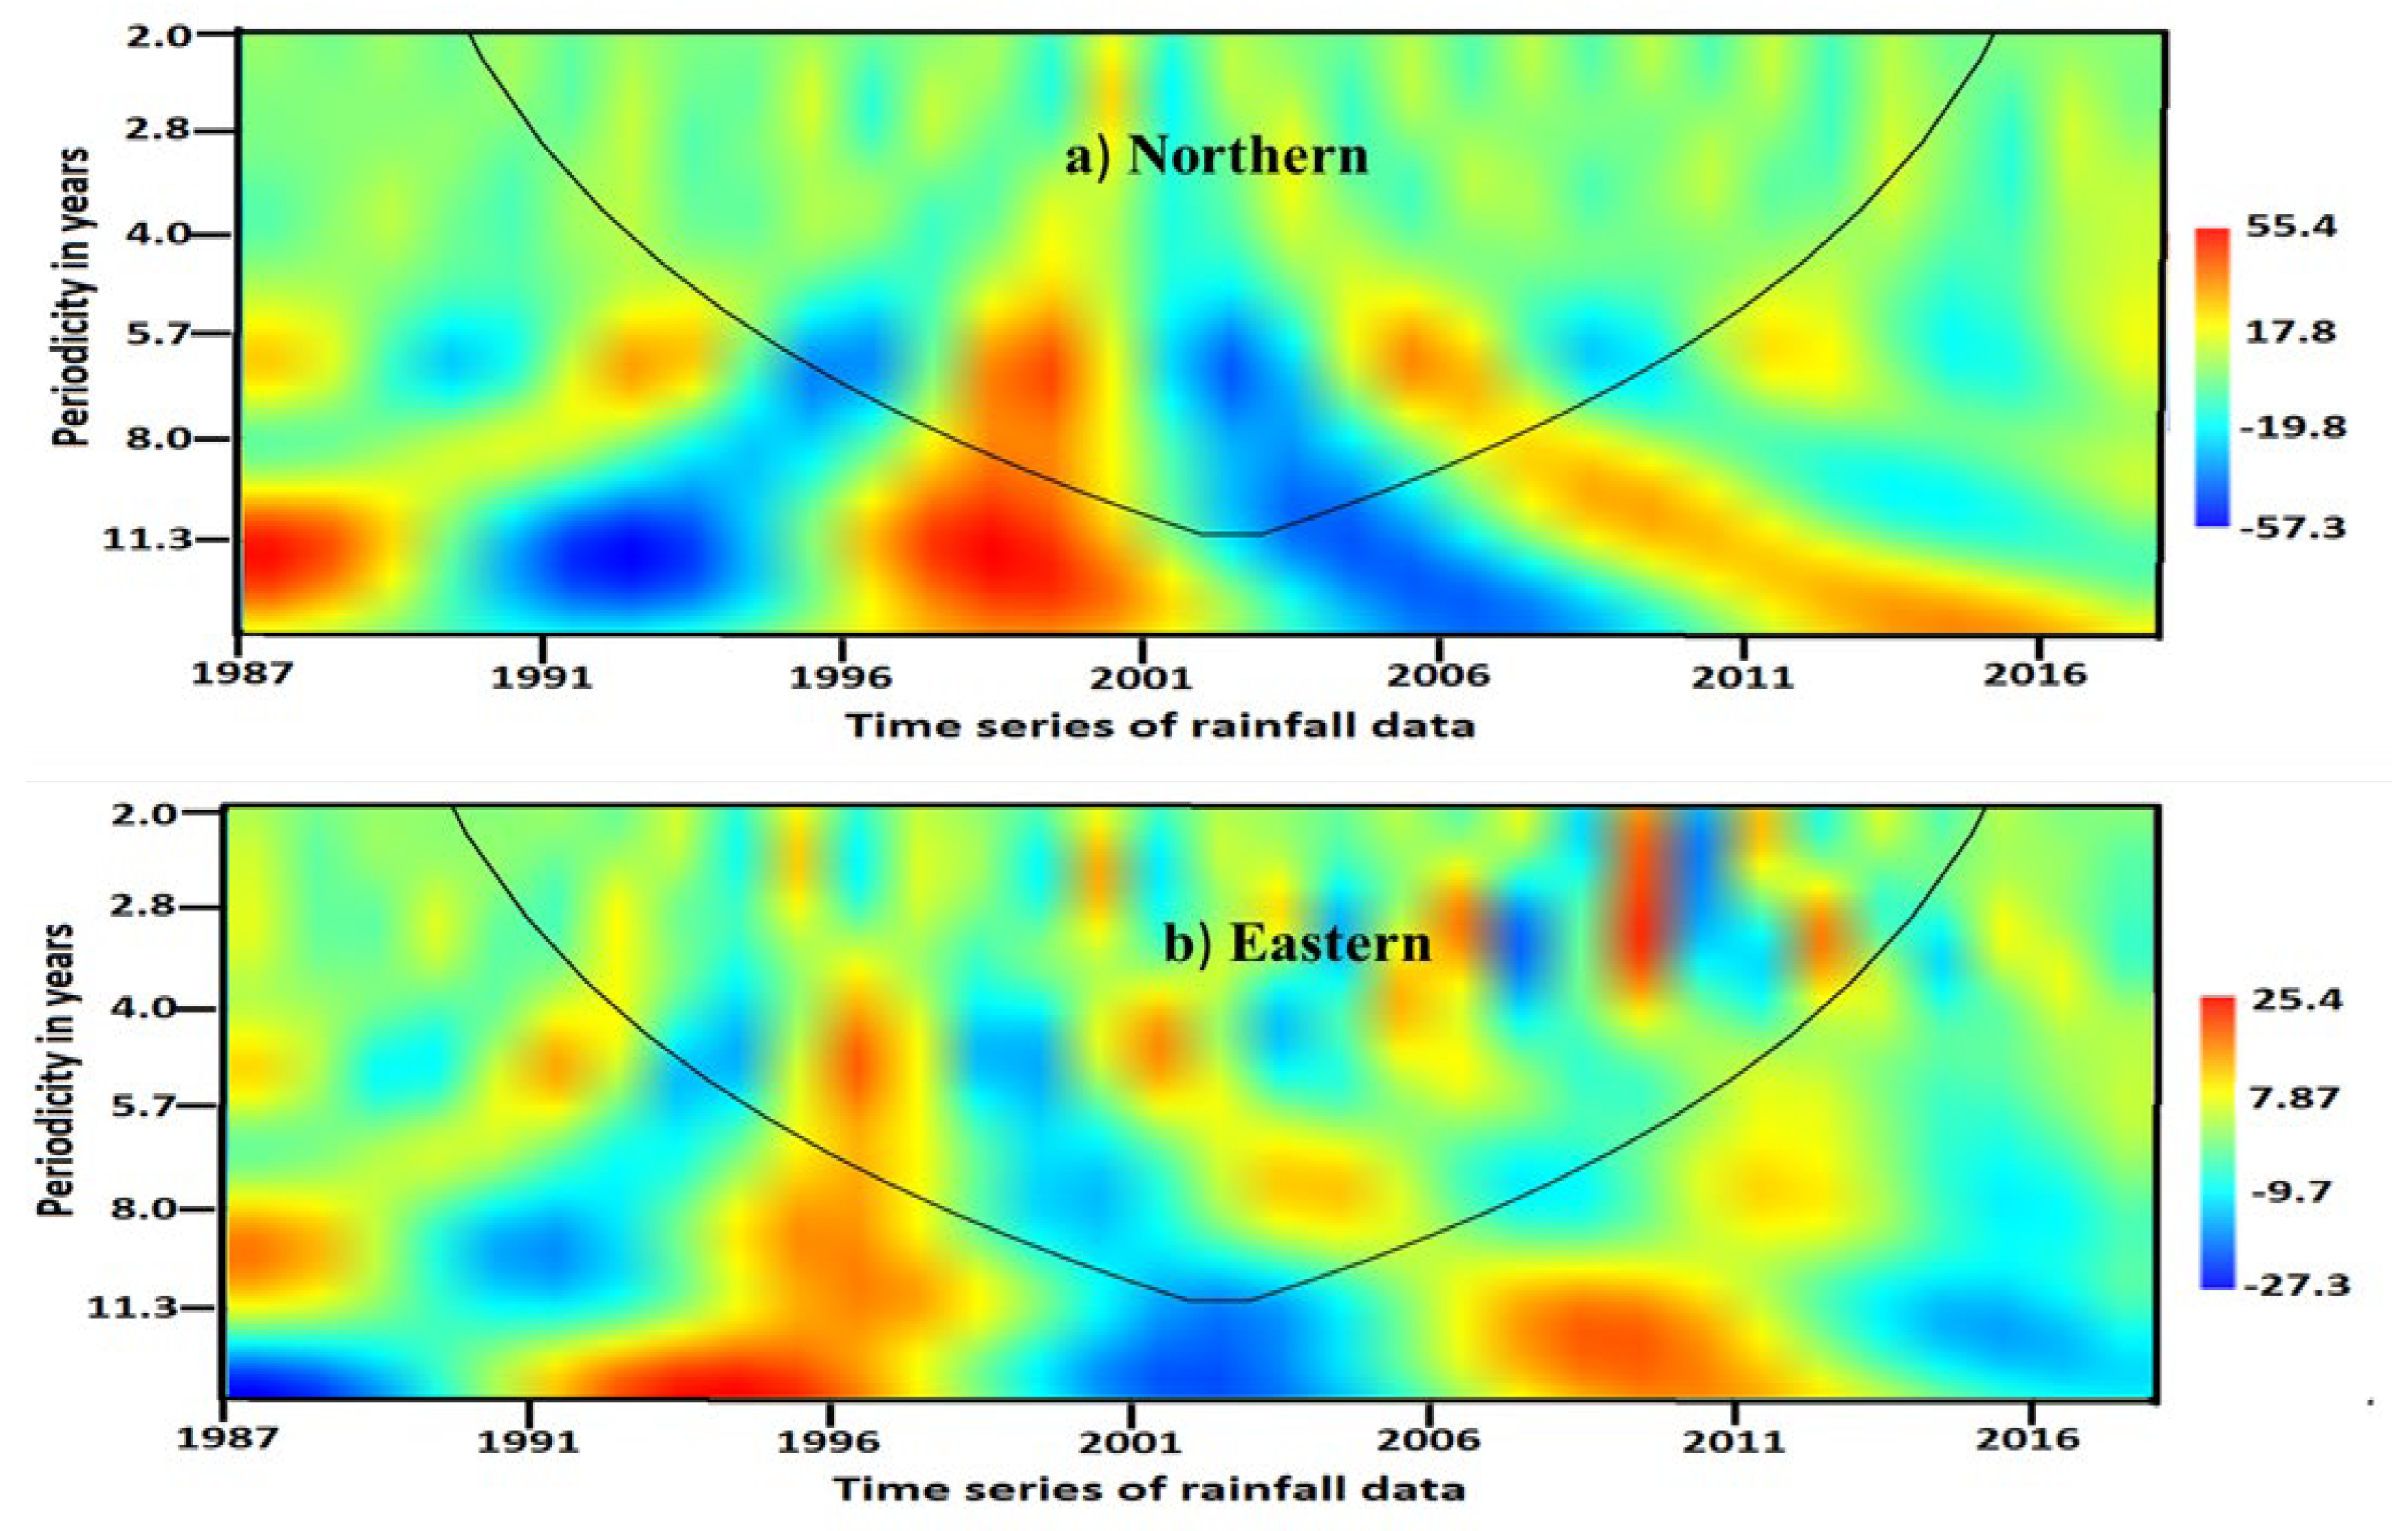
Figure 6b describes a wavelet analysis of the periodicity in year and time series of rainfall in the eastern part of Ethiopia. From this graph, we observe three dominant oscillations, or periodicities. The first strong oscillation or periodicity of 2-4 years (frequency of 0.25-0.45 with power of 25.4 w) prevailed for 4 years from 2008–2012. The second oscillation or periodicity of 5–6.5 years (in terms of frequency 0.15–0.2 with a power of 7.87 w) lasts from 1995–2000, and the third period periodicity of 10–20 years (frequency of 0.05–0.1 is continued from 1992–2010. So the eastern part of the country dominates the long-term oscillation of 2–4, 5–6.5, and 10–20 years.
Figure 7a presents the wavelet analysis of periodicity in years versus the time series of rainfall for the western part of Ethiopia, revealing three dominant oscillations or periodicities. The first is a strong periodicity of 3–5 years, corresponding to a frequency range of 0.2–0.3 cycles per year, with a maximum power of 39 W. This oscillation dominates for 13 years, spanning from 1992 to 2005. The second is a moderate periodicity of 8 years, corresponding to a frequency of 0.12 cycles per year, with a power of13.9, lasting from 1995 to 2000. The third is a weak periodicity of 27 years, corresponding to a frequency of 0.037 cycles per year, occurring briefly from 1992 to 1993. These findings indicate that the long-term oscillation of 3–5 years is the most significant, prevailing for 13 years (1992–2005) and strongly influencing rainfall patterns in the region.
Figure 7.
Wavelet analysis of precipitation time series of a) western b) southern part of the Ethiopia.
Figure 7.
Wavelet analysis of precipitation time series of a) western b) southern part of the Ethiopia.
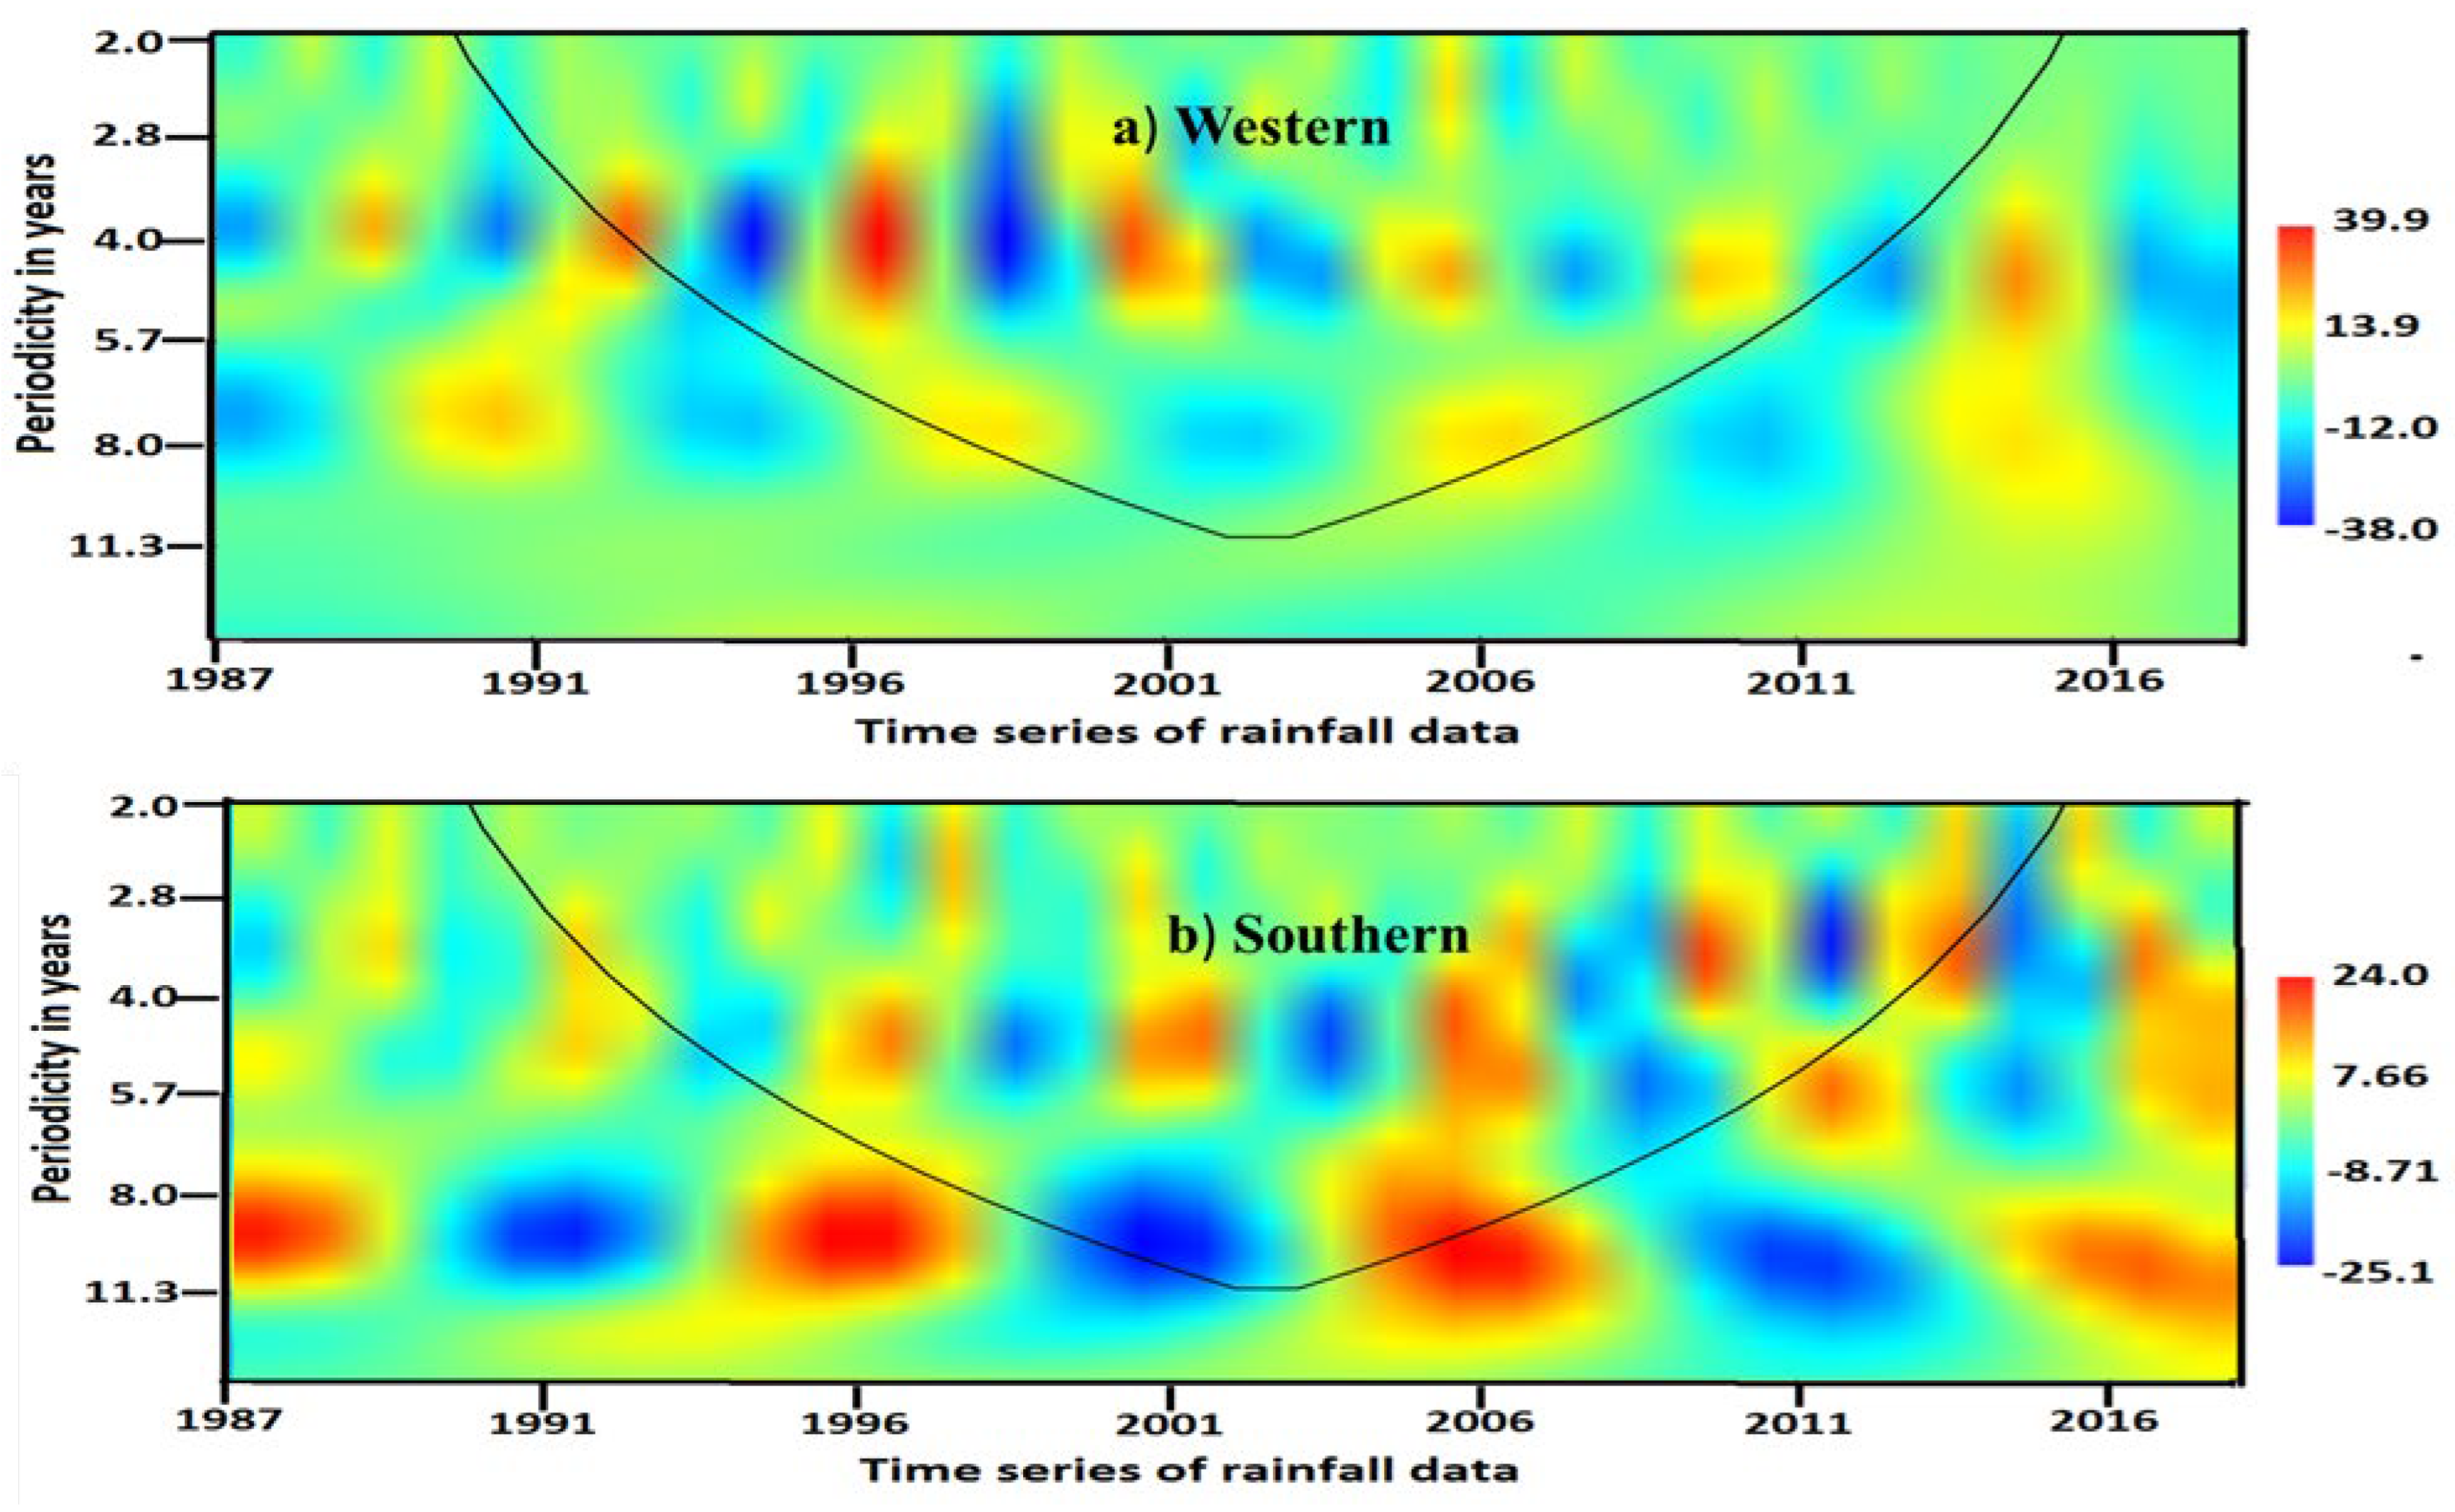
Figure 7b presents the wavelet analysis of periodicity in years versus the time series of rainfall for the southern part of Ethiopia, identifying two dominant oscillations or periodicities. The first is a strong periodicity of 2.5–4 years, corresponding to a frequency range of 0.25–0.4 cycles per year, with a power of 24 W. This oscillation prevailed for 7 years, spanning from 2009 to 2016. The second is a 10-year periodicity, corresponding to a frequency of 0.1 cycles per year, with a power of 7.66 W, lasting from 1995 to 2009. These findings suggest that the southern region is characterized by the dominance of a short-term oscillation of 2.5–4 years during 2009–2016 and a long-term 10-year periodicity from 1995 to 2009.
Figure 8.
Wavelet analysis of precipitation time series of a) central part of the Ethiopia.
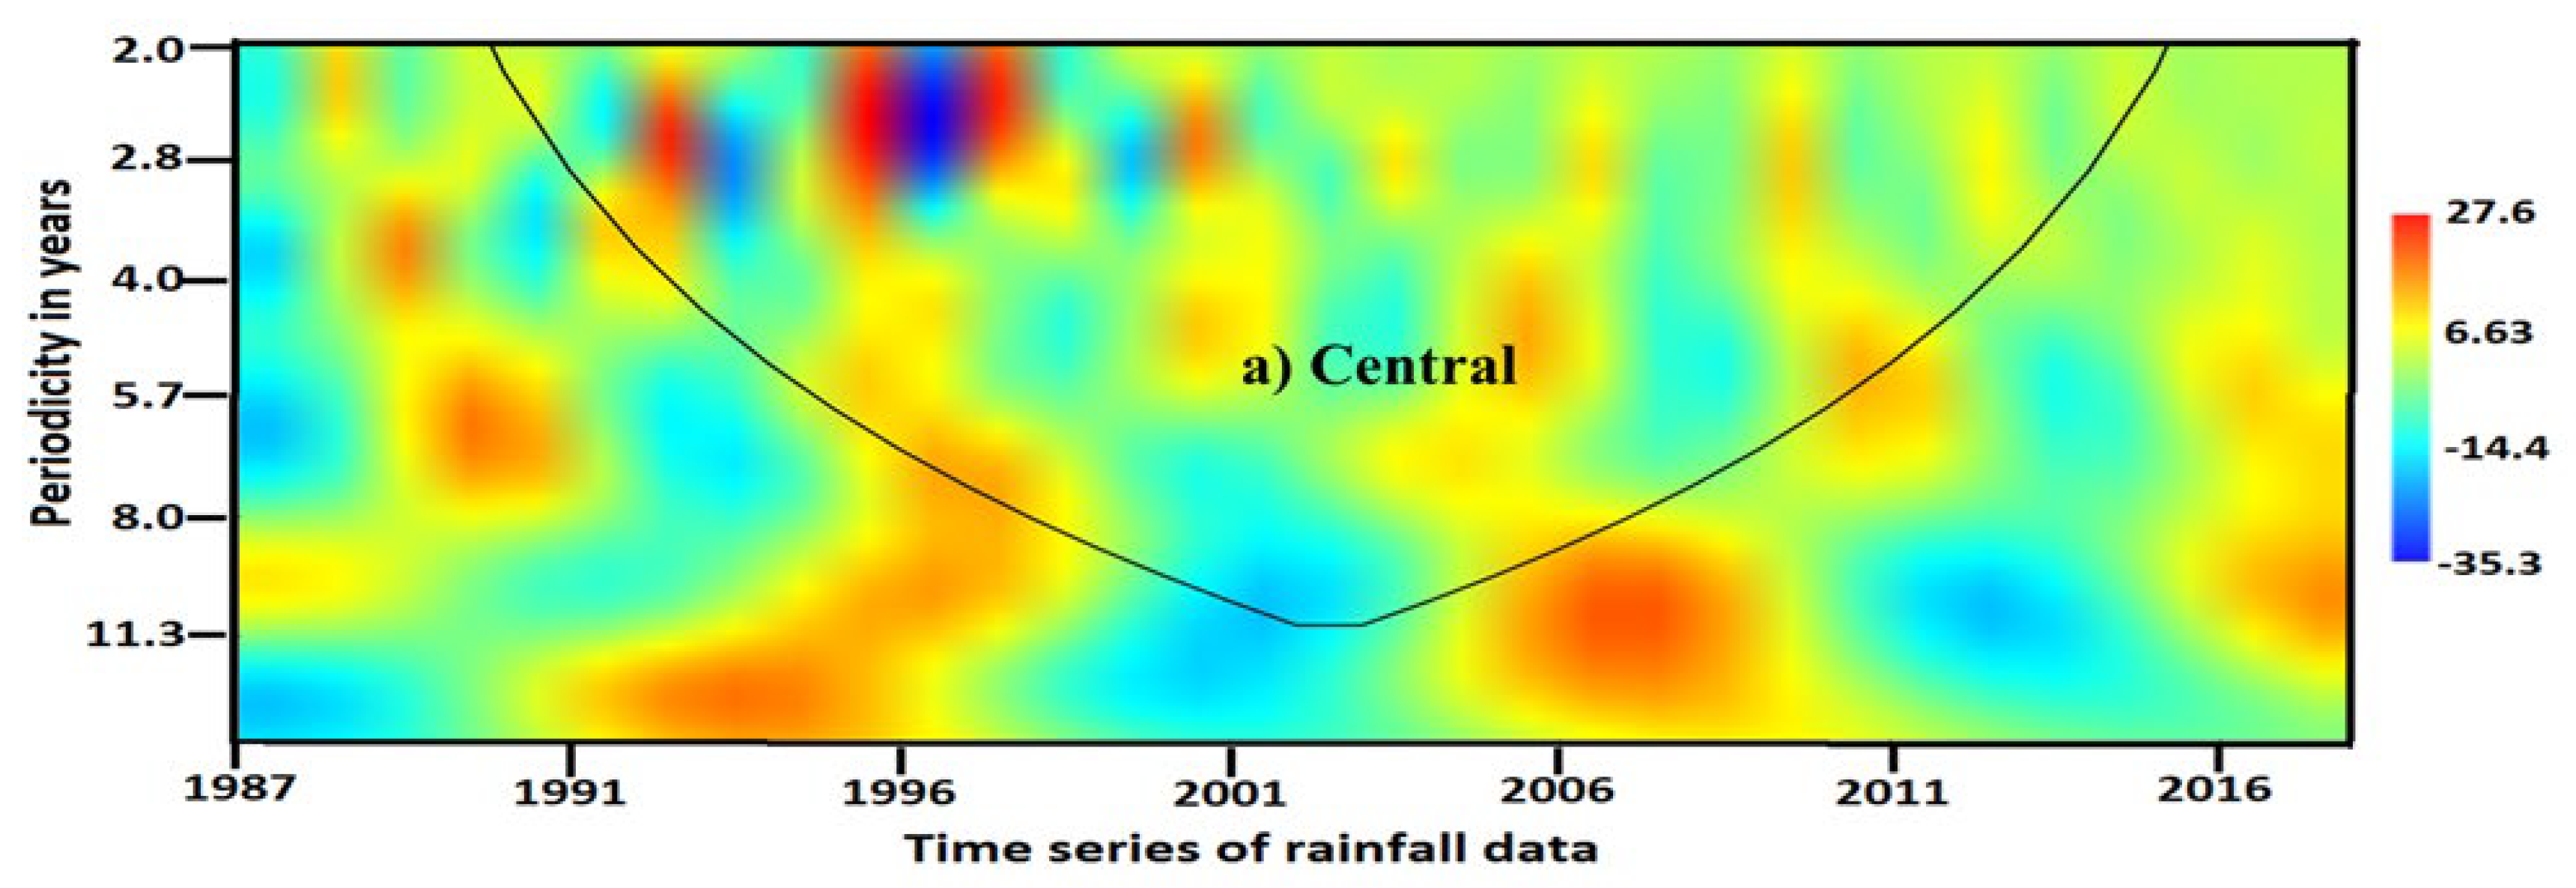
Figure 8a presents the wavelet analysis of periodicity in years versus the time series of rainfall for the central part of Ethiopia, highlighting two dominant oscillations or periodicities. The first is a strong oscillation with a periodicity of 2–3 years, corresponding to a frequency range of 0.35–0.45 cycles per year, and a maximum power of 27.6 W. This oscillation prevailed for 8 years, spanning from 1992 to 2000. The second is a 10-year periodicity, corresponding to a frequency of approximately 0.1 cycles per year, with a power of 6.63 W, lasting from 2002 to 2010. These findings indicate that the central part of Ethiopia is characterized by a dominant short-term oscillation of 2–3 years from 1992 to 2000, followed by a long-term 10-year periodicity from 2002 to 2010
Modes of Oceanic Induced Oscillations
To identify the modes of variability associated with different oceanic indices, the Continuous Wavelet Transform (CWT) was applied. Figure 9 and Figure 10 present contour plots illustrating the periodicities of oceanic indices such as Nino-4, North Atlantic Oscillation (NAO), Mediterranean Oscillation Index (MOI), and Southern Oscillation Index (SOI).
Figure 9a depicts the wavelet analysis of the periodicity in years versus time series for the Nino-4 index. The analysis reveals a dominant oscillation of 8–13 years (corresponding to a frequency range of 0.067–0.125 cycles per year) with a maximum power of 1.36 W, prevailing for 20 years from 1992 to 2012. This Nino-4 oscillation clearly aligns with the periodicities observed in rainfall data for the northern, eastern, and central regions of Ethiopia.
In the northern region, the long-term rainfall oscillation of 6–10 years (1992–2003) coincides with the Nino-4 oscillation (1992–2012), showing a strong negative correlation (r = -0.84). During this period, the standardized precipitation ratio indicated predominantly wet conditions. For the eastern region, the 10–20-year rainfall periodicity (1992–2010) overlaps with the Nino-4 oscillation, albeit with a weak positive correlation (r = 0.05). In the central region, the 10-year rainfall periodicity (2002–2010) coincides with the Nino-4 oscillation, exhibiting a moderate negative correlation (r = -0.5).
These findings suggest a significant teleconnection between the Nino-4 index and rainfall variability in Ethiopia, particularly influencing the northern (1992–2003) and central (2002–2010) regions. Previous studies (Viste & Sorteberg, 2013; Wolde-Georgis, 1997) support these observations, reporting drought events during 1987, 1991, 1994, and 2009 across many parts of Ethiopia, which correspond to variations in the Nino-4 index.
Figure 9b presents the wavelet analysis of the periodicity in years versus-time series for the North Atlantic Oscillation (NAO) index. The analysis reveals two distinct oscillations, or periodicities. The first oscillation, lasting 2–3 years, corresponds to a frequency range of 0.3–0.5 cycles per year with a power of 1.55 W and occurred between 2007 and 2012. The second oscillation, spanning 10–12 years, corresponds to a frequency range of 0.083–0.1 cycles per year, and was observed during two time periods: 1987–1997 and 2007–2015.
Figure 9.
Wavelet analysis of periodicity in year’s verses time series of the a) Nino-4 index value b) NAO index value.
Figure 9.
Wavelet analysis of periodicity in year’s verses time series of the a) Nino-4 index value b) NAO index value.
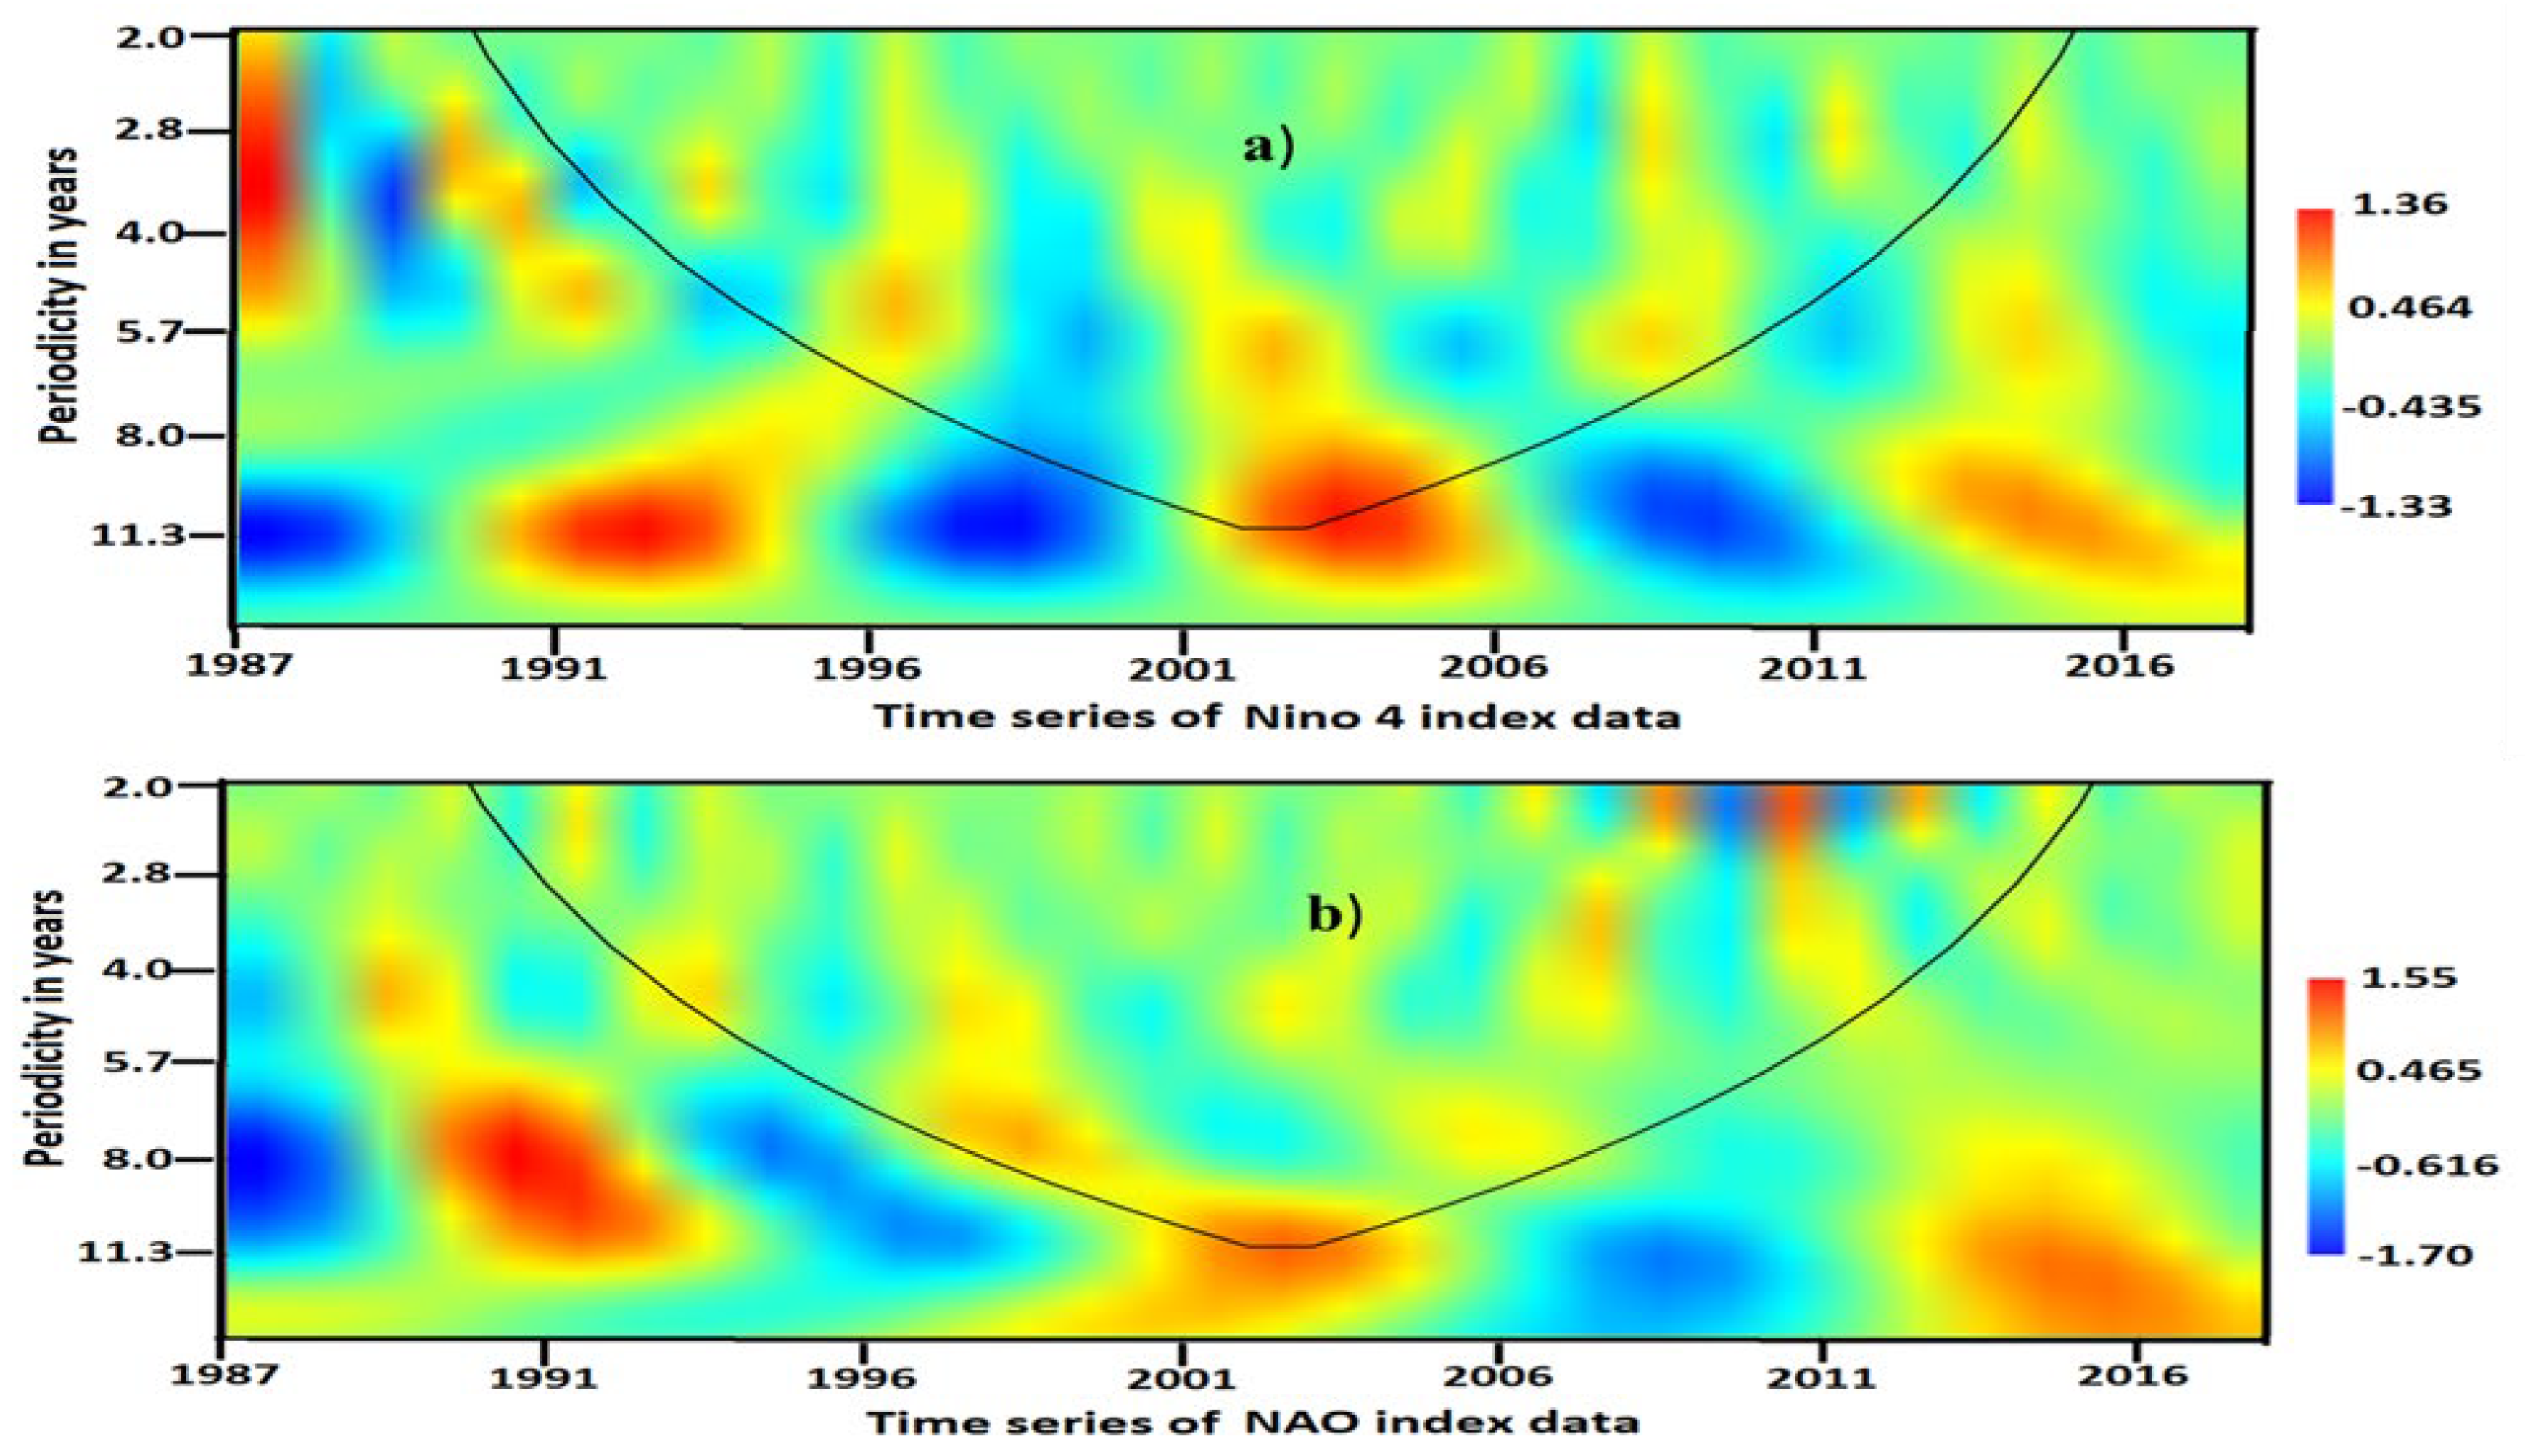
Among these oscillations, the 2–3-year NAO oscillation coincides with rainfall periodicities in the southern part of Ethiopia. Specifically, the short-term rainfall oscillation of 2.5–4 years (2009–2016) aligns with the NAO oscillation from 2007–2012, showing a weak negative correlation (r = -0.15). During this time, the standardized precipitation ratio indicated alternating wet and dry periods.
These findings suggest that rainfall variability in the southern part of Ethiopia is influenced by the NAO index during the 2007–2012 period. This conclusion aligns with previous studies by (Viste & Sorteberg, 2013; Wolde-Georgis, 1997) reported that 1987, 1991, 1994, and 2009 were drought years in Ethiopia including 1987, 1991, 1994, and 2009, corresponding to variations in the NAO index.
Figure 10 a presents the wavelet analysis of the periodicity in years versus-time series for the Mediterranean Oscillation Index (MOI). The analysis reveals a dominant oscillation with a period of 6–10 years, corresponding to a frequency range of 0.1–0.15 cycles per year and a power of 0.923 W, occurring from 1995 to 2005. This 6–10-year MOI oscillation aligns with rainfall periodicities observed in the northern, eastern, and southern parts of Ethiopia. Specifically, in the northern part of Ethiopia, the long-term oscillation of 6–10 years from 1992 to 2003 coincides with the MOI oscillation from 1995 to 2005, showing a moderate positive correlation of 0.53. During this period, the rainfall in the northern part exhibited wet conditions. In the eastern part, a 5–6.5-year oscillation observed from 1995 to 2000 correlates negatively with the MOI oscillation (correlation coefficient of -0.75), with wet conditions observed in the region. For the southern part, the 10-year periodicity from 1995 to 2009 correlates weakly with the MOI oscillation (correlation coefficient of -0.12). These results suggest that the teleconnection of the MOI significantly affects rainfall variability in the northern (1992–2003) and eastern (1995–2000) parts of Ethiopia.
Figure 10.
Wavelet analysis of periodicity in year’s verses time series of the a) Nino-4 index value b) NAO index value.
Figure 10.
Wavelet analysis of periodicity in year’s verses time series of the a) Nino-4 index value b) NAO index value.
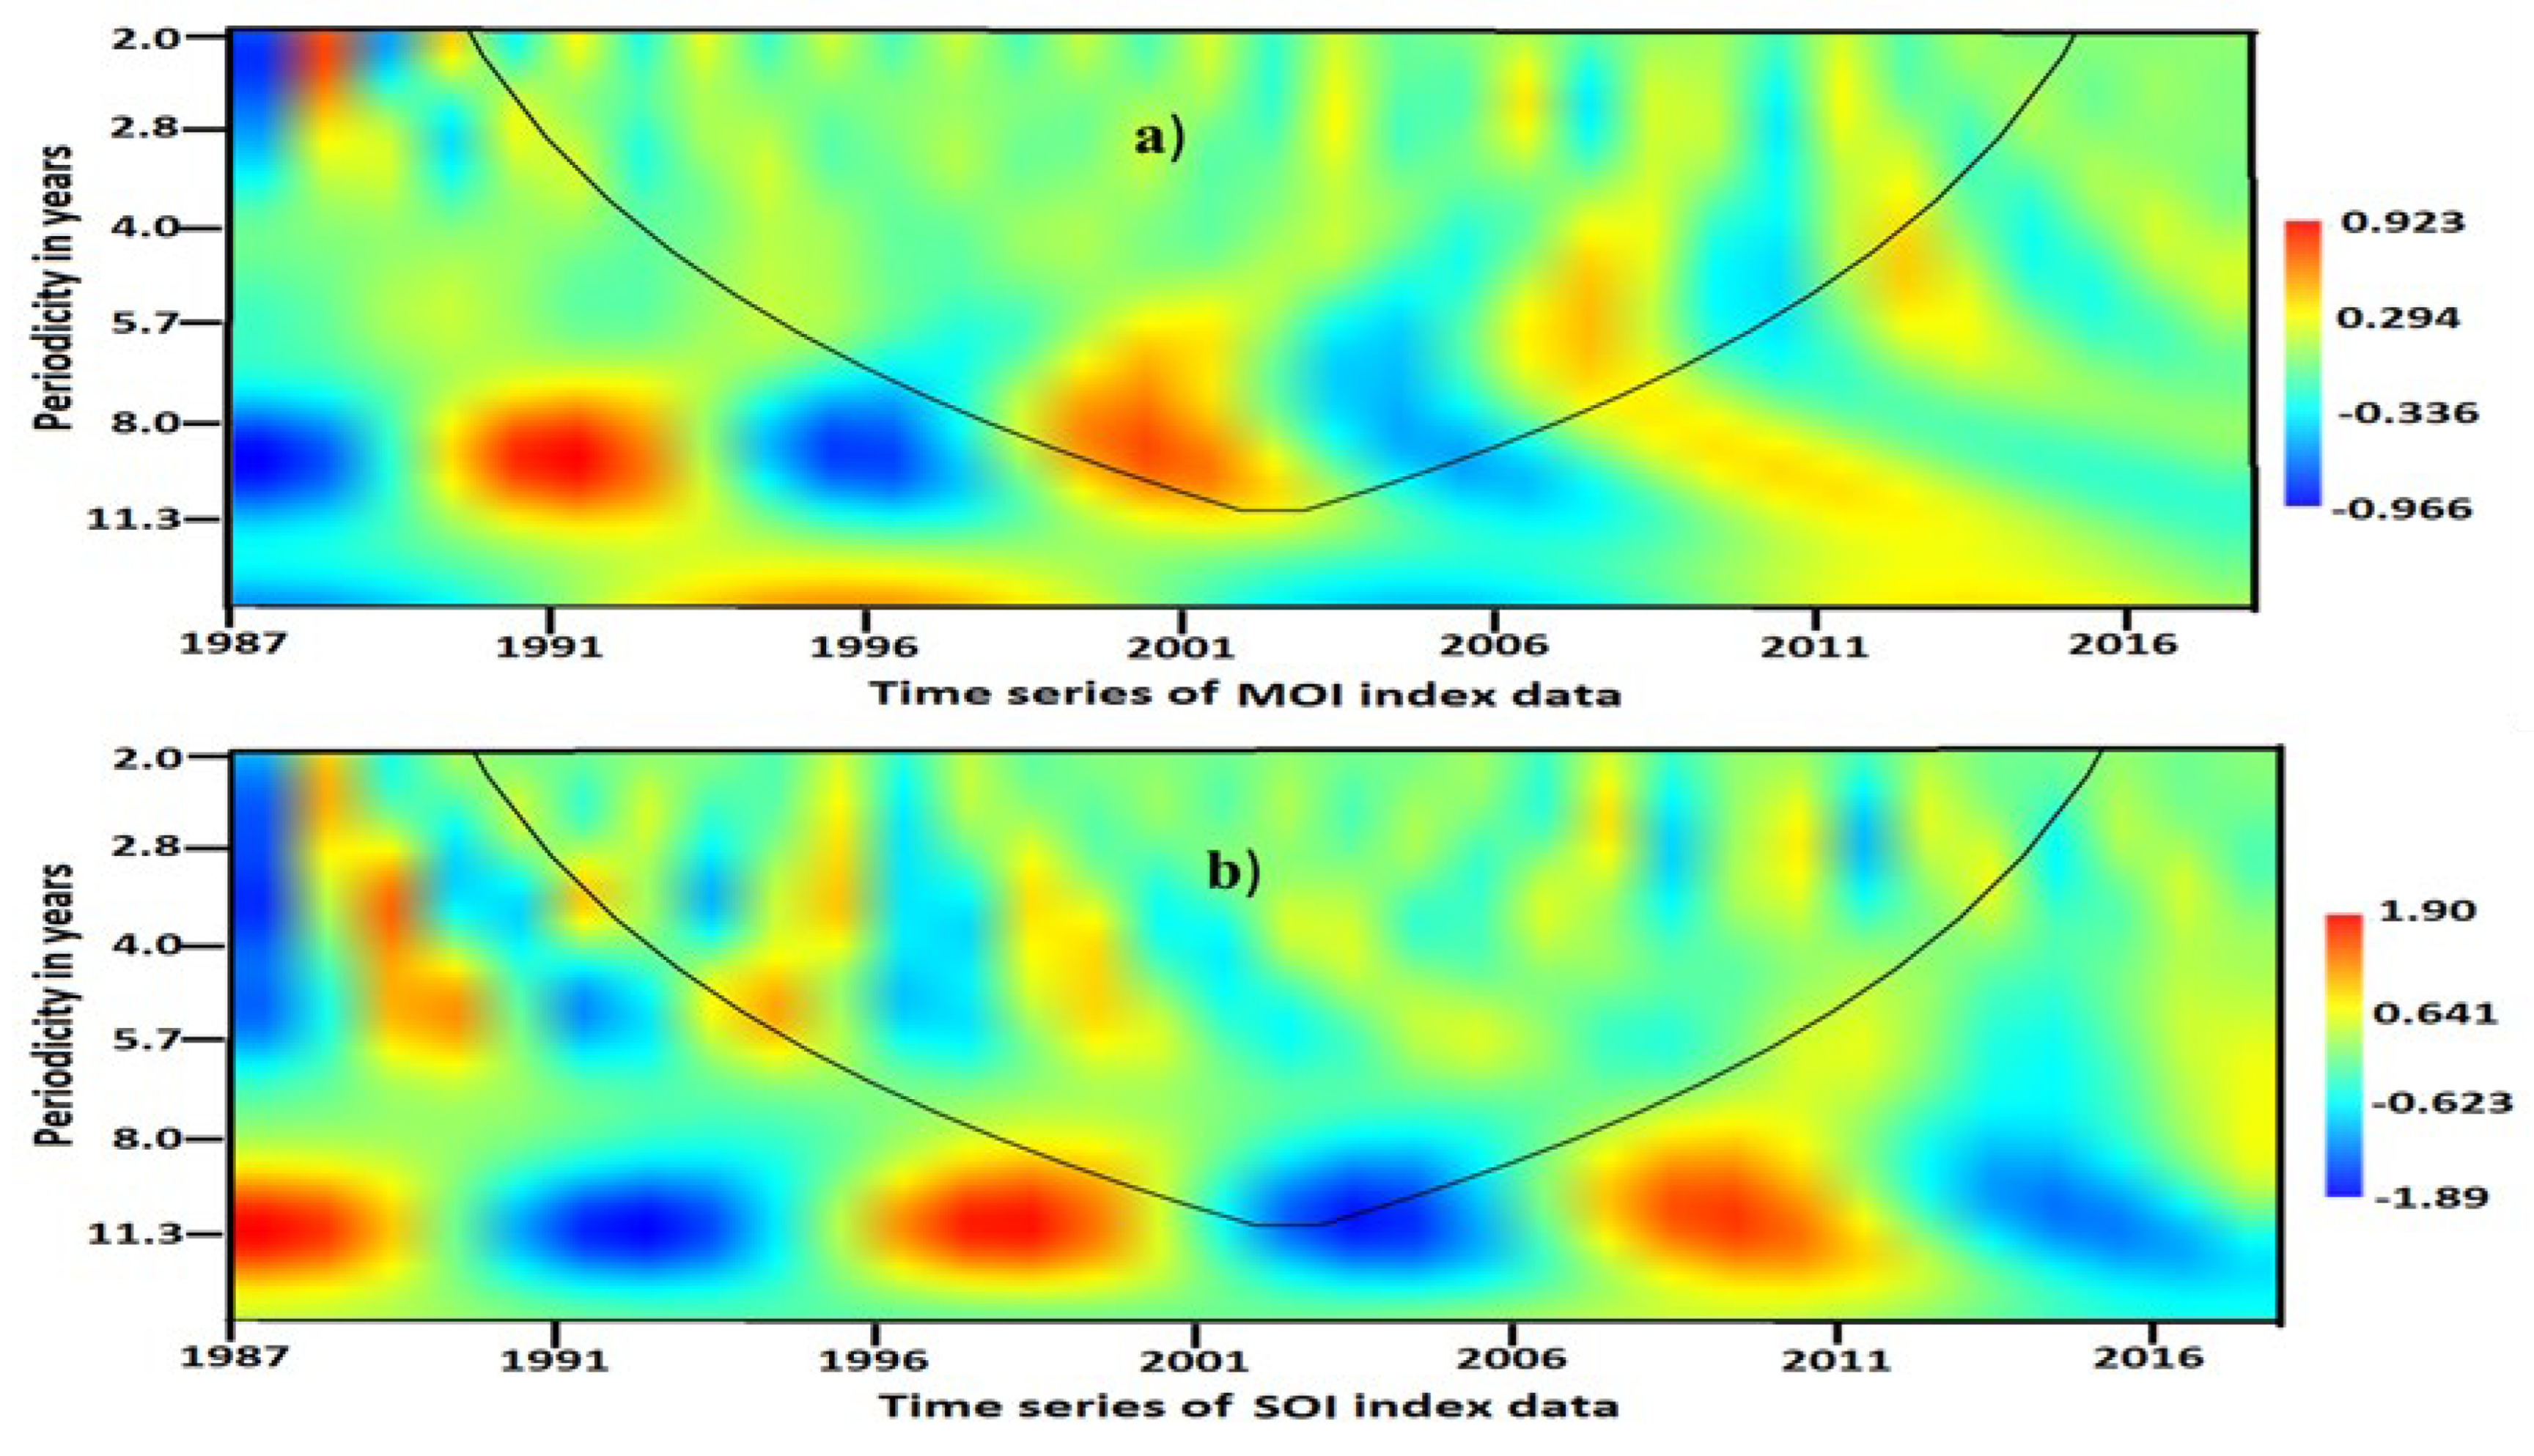
Figure 10b shows the wavelet analysis of the periodicity in a year-versus-time series for the Southern Oscillation Index (SOI). The analysis identifies two dominant oscillations: a 3–5-year oscillation (frequency of 0.2–0.3 cycles per year, power of 0.15 W) that prevailed from 1995 to 2000, and an 11-year oscillation (frequency of 0.09 cycles per year, power of 1.9 W) from 1995 to 2012. The 3–5-year SOI oscillation coincides with rainfall periodicities in the western part of Ethiopia, where a dominant 3–5-year oscillation from 1992 to 2005 correlates negatively with the SOI (correlation coefficient of -0.4) during the 1995–2000 period. This period was marked by wet conditions in the western part, indicating that the SOI influenced rainfall variability in the region. Thus, we conclude that the Southern Oscillation Index significantly impacted the western part of Ethiopia during 1992–2005.
Implications of the Study for Environmental Protection and Climate Change
This study provides valuable insights into the spatiotemporal variability of precipitation in Ethiopia, emphasizing the influence of large-scale atmospheric circulation patterns (e.g., Nino-4, NAO, SOI, and MOI) on rainfall distribution. These findings are critical for sustainable water resource management, particularly in regions vulnerable to floods and droughts. Understanding the periodicity and variability of rainfall enables more effective planning of hydraulic infrastructure, such as dams and reservoirs, to ensure resilience to climate variability while safeguarding environmental integrity. Studies like (Gao et al., 2022) support such approaches, highlighting the importance of sustainable hydrological planning to balance environmental and human needs. Furthermore, strategically expanding hydrological monitoring networks, as suggested by (Singhal et al., 2024), can improve early warning systems and enhance the accuracy of rainfall forecasting.
The relationship between oceanic indices and rainfall variability also has broader implications for climate adaptation and policy development. Incorporating these findings into national climate models can help design adaptive strategies to address droughts and floods, particularly for agriculture and disaster risk reduction. Additionally, the use of wavelet analysis in this study provides a methodological framework for examining precipitation variability in other regions, contributing to global climate science. As (Abed-Elmdoust et al., 2016) illustrate, understanding the interaction between precipitation patterns and hydrological systems is essential for mitigating the impacts of climate change. Overall, this research supports evidence-based decision-making for environmental protection, sustainable resource management, and climate resilience in Ethiopia and beyond.
Limitations and Future Outlook
While this study offers valuable insights into the spatial and temporal variability of rainfall over Ethiopia and its link to major oceanic indices, some limitations remain. The reliance on a limited number of meteorological stations may not fully capture microclimatic variations, and the accuracy of satellite datasets in sparsely monitored areas could affect the results. The focus on a few oceanic indices excludes other potential climate drivers like the Indian Ocean Dipole (IOD) and local land-atmosphere interactions. Additionally, interpolation methods may introduce uncertainty, and the socio-economic implications of rainfall variability were not fully explored. Future research should incorporate additional climate drivers, expand data coverage, apply advanced modeling techniques, and assess socio-economic impacts to support more effective climate adaptation and resource management strategies.
Conclusion
This study provides a comprehensive analysis of rainfall variability in Ethiopia, highlighting distinct regional patterns and important connections with key oceanic indices. Our analysis, covering the period from 1987 to 2017, reveals significant year-to-year fluctuations in rainfall, with the Inter-annual Precipitation Index (Ip) ranging from 3.2 (indicating wet conditions) to -2 (indicating dry conditions). This variability underscores the presence of both wet and dry periods during the study timeframe. Through wavelet analysis, we identified specific periodicities in rainfall across various regions: Northern Ethiopia shows notable 6-10 year and 20-year oscillations, while Eastern Ethiopia demonstrates a combination of short-term and long-term cycles. Western Ethiopia exhibits cycles of 3-5 years and 13 years; Southern Ethiopia reveals strong 2.5-4 year and 10-year oscillations; and Central Ethiopia is characterized by 2-3 year and 10-year periodicities. Additionally, our findings underscore the significant influence of major oceanic indices on precipitation patterns throughout Ethiopia. Specifically, the Nino-4 region impacts rainfall in Northern and Central Ethiopia, the North Atlantic Oscillation significantly affects Southern Ethiopia, the Mediterranean Oscillation Index is relevant for Northern and Eastern Ethiopia, and the Southern Oscillation Index plays a crucial role in Western Ethiopia. Understanding these teleconnections is essential for accurately predicting future rainfall patterns and developing effective drought mitigation strategies. Furthermore, we emphasize the need for additional research to explore the socio-economic implications of these patterns and to investigate the influence of other potential climate drivers.
Data Availability
The climate indices data, including Niño-4, NAO, SOI, and MOI, were obtained from the NOAA Physical Sciences Laboratory (PSL) and are publicly available at http://www.esrl.noaa.gov/psd/data/climateindices. Precipitation data were collected from rain gauges at selected meteorological stations across Ethiopia for the period 1987–2017. These data are not publicly available due to the data-sharing policies of the Ethiopian National Meteorology Agency (NMA) but can be accessed upon reasonable request from NMA.
Acknowledgments
We acknowledge the NOAA Physical Sciences Laboratory (PSL) for providing the climate indices data (Niño-4, NAO, SOI, and MOI), which are publicly available at http://www.esrl.noaa.gov/psd/data/climateindices. We also express our gratitude to the Ethiopian National Meteorology Agency (NMA) for supplying the precipitation data used in this study. Their contributions were essential for the completion of this research.
Grant support details
The present research did not receive any financial support.
Conflicts of Interest
The authors declare that there is not any conflict of interests regarding the publication of this manuscript. In addition, the ethical issues, including plagiarism, informed consent, misconduct, data fabrication and/ or falsification, double publication and/or submission, and redundancy has been completely observed by the authors.
References
- Abed-Elmdoust, A.; Miri, M. A.; Singh, A. Reorganization of river networks under changing spatiotemporal precipitation patterns: An optimal channel network approach. Water Resources Research 2016, 52(11), 8845–8860. [Google Scholar] [CrossRef]
- Abegaz, W. B.; Mekoya, A. Rainfall variability and trends over Central Ethiopia. Rema 2020, 10(39.58), 2054. [Google Scholar] [CrossRef]
- Abtew, W.; Melesse, A. M.; Dessalegne, T. El Niño southern oscillation link to the Blue Nile River basin hydrology. Hydrological Processes: An International Journal 2009, 23(26), 3653–3660. [Google Scholar] [CrossRef]
- Addison, P. S. The illustrated wavelet transform handbook: introductory theory and applications in science, engineering, medicine and finance; CRC press, 2017. [Google Scholar]
- Ayalew, D.; Tesfaye, K.; Mamo, G.; Yitaferu, B.; Bayu, W. Variability of rainfall and its current trend in Amhara region, Ethiopia. African Journal of Agricultural Research 2012, 7(10), 1475–1486. [Google Scholar]
- Das, J.; Jha, S.; Goyal, M. K. On the relationship of climatic and monsoon teleconnections with monthly precipitation over meteorologically homogenous regions in India: Wavelet & global coherence approaches. Atmospheric research 2020, 238, 104889. [Google Scholar]
- Diro, G. T.; Black, E.; Grimes, D. Seasonal forecasting of Ethiopian spring rains. Meteorological Applications: A journal of forecasting, practical applications, training techniques and modelling 2008, 15(1), 73–83. [Google Scholar] [CrossRef]
- Gao, Y.; Sarker, S.; Sarker, T.; Leta, O. T. Analyzing the critical locations in response of constructed and planned dams on the Mekong River Basin for environmental integrity. Environmental Research Communications 2022, 4(10), 101001. [Google Scholar] [CrossRef]
- Gissila, T.; Black, E.; Grimes, D.; Slingo, J. Seasonal forecasting of the Ethiopian summer rains. International Journal of Climatology: A Journal of the Royal Meteorological Society 2004, 24(11), 1345–1358. [Google Scholar] [CrossRef]
- Jemai, S.; Ellouze, M.; Abida, H. Variability of precipitation in arid climates using the wavelet approach: case study of watershed of Gabes in South-East Tunisia. Atmosphere 2017, 8(9), 178. [Google Scholar] [CrossRef]
- Korecha, D.; Barnston, A. G. Predictability of june–september rainfall in Ethiopia. Monthly weather review 2007, 135(2), 628–650. [Google Scholar] [CrossRef]
- Labat, D. Recent advances in wavelet analyses: Part 1. A review of concepts. Journal of Hydrology 2005, 314(1-4), 275–288. [Google Scholar] [CrossRef]
- Marchant, R.; Mumbi, C.; Behera, S.; Yamagata, T. The Indian Ocean dipole–the unsung driver of climatic variability in East Africa. African Journal of Ecology 2007, 45(1), 4–16. [Google Scholar] [CrossRef]
- McKee, T. B.; Doesken, N. J.; Kleist, J. The relationship of drought frequency and duration to time scales. In Proceedings of the 8th Conference on Applied Climatology; 1993. [Google Scholar]
- Molla, F.; Kebede, A.; Raju, U. J. P. The impact of the El-Niño southern oscillation precipitation and the surface temperature over the Upper Blue Nile Region. J. Sci. Res. Rep 2019, 21(5), 1–15. [Google Scholar] [CrossRef]
- Olkkonen, H. Discrete wavelet transforms: biomedical applications; BoD–Books on Demand, 2011. [Google Scholar]
- Percival, D. B.; Walden, A. T. Wavelet methods for time series analysis; Cambridge university press, 2000; Vol. 4. [Google Scholar]
- Rathinasamy, M.; Agarwal, A.; Sivakumar, B.; Marwan, N.; Kurths, J. Wavelet analysis of precipitation extremes over India and teleconnections to climate indices. Stochastic Environmental Research and Risk Assessment 2019, 33, 2053–2069. [Google Scholar] [CrossRef]
- Sang, Y.-F. A review on the applications of wavelet transform in hydrology time series analysis. Atmospheric research 2013, 122, 8–15. [Google Scholar] [CrossRef]
- Santos, C. A.; Silva, R. M.; Akrami, S. A. Rainfall analysis in Klang River basin using continuous wavelet transform. Journal of Urban and Environmental Engineering 2016, 10(1), 3–10. [Google Scholar] [CrossRef]
- Sarker, S.; Sarker, T. Spectral properties of water hammer wave. Applied Mechanics 2022, 3(3), 799–814. [Google Scholar] [CrossRef]
- Sarker, S.; Sarker, T.; Leta, O. T.; Raihan, S. U.; Khan, I.; Ahmed, N. Understanding the planform complexity and morphodynamic properties of Brahmaputra river in Bangladesh: Protection and exploitation of riparian areas. Water 2023, 15(7), 1384. [Google Scholar] [CrossRef]
- Segele, Z. T.; Lamb, P. J. Characterization and variability of Kiremt rainy season over Ethiopia. Meteorology and Atmospheric Physics 2005, 89(1), 153–180. [Google Scholar] [CrossRef]
- Segele, Z. T.; Lamb, P. J.; Leslie, L. M. Seasonal-to-interannual variability of Ethiopia/horn of Africa monsoon. Part I: associations of wavelet-filtered large-scale atmospheric circulation and global sea surface temperature. Journal of Climate 2009, 22(12), 3396–3421. [Google Scholar] [CrossRef]
- Shanko, D.; Camberlin, P. The effects of the Southwest Indian Ocean tropical cyclones on Ethiopian drought. International Journal of Climatology: A Journal of the Royal Meteorological Society 1998, 18(12), 1373–1388. [Google Scholar] [CrossRef]
- Singhal, A.; Jaseem, M.; Divya; Sarker, S.; Prajapati, P.; Singh, A.; Jha, S. K. Identifying potential locations of hydrologic monitoring stations based on topographical and hydrological information. Water Resources Management 2024, 38(1), 369–384. [Google Scholar] [CrossRef]
- Singhrattna, N. Hydrologic forecasting based on statistical and physical approaches for the Upper Chao Phraya River Basin, Thailand; AIT, 2012. [Google Scholar]
- Trenberth, K. E. Signal versus noise in the Southern Oscillation. Monthly weather review 1984, 112(2), 326–332. [Google Scholar] [CrossRef]
- Tsidu, G. M. High-resolution monthly rainfall database for Ethiopia: Homogenization, reconstruction, and gridding. Journal of Climate 2012, 25(24), 8422–8443. [Google Scholar] [CrossRef]
- Viste, E. M.; Sorteberg, A. The effect of moisture transport variability on Ethiopian summer precipitation. Moisture Transport and Precipitation in Ethiopia 2013. [Google Scholar] [CrossRef]
- Wolde-Georgis, T. El Nino and drought early warning in Ethiopia. Internet Journal of African Studies 1997. [Google Scholar]
- Yamagata, T. The Indian Ocean dipole: A physical entity. CLIVAR exchanges 2002, 24, 15-18, 20-22. [Google Scholar]

Table 1.
Description of datasets and their details in the study.
| Dataset | Type | Source | Time Period | Spatial Coverage | Details |
|---|---|---|---|---|---|
| Rain Gauge Data | Daily Precipitation | Ethiopian National Meteorology Agency | 1987-2017 | Selected stations across Ethiopia | Missing data filled using interpolation and gridded data. |
| Gridded Rainfall Data | Gridded Precipitation | Ethiopian National Meteorology Agency | 1987-2017 | Entire Ethiopia | Constructed using rain gauge and satellite observations (TRMM, CHIRPS). |
| NAO Index | Atmospheric Oscillation Index | NOAA | 1987-2017 | North Atlantic Ocean (50°-20°N, 60°-30°W) | Normalized pressure difference between Azores and Iceland stations. |
| Niño4 Index | SST Anomalies | NOAA | 1987-2017 | Pacific Ocean (5°N-5°S, 160°E-150°W) | Measures ENSO strength. Monthly SST data used. |
| SOI Index | Atmospheric Pressure Anomalies | NOAA | 1987-2017 | East-Central Pacific (Tahiti) and West Pacific (Darwin, Australia) | Measures El Niño and La Niña phases. |
| MOI Index | Atmospheric Pressure Oscillation Index | NOAA | 1987-2017 | Western and Eastern Mediterranean | Measures pressure oscillation between Gibraltar and Israel. |
Disclaimer/Publisher’s Note: The statements, opinions and data contained in all publications are solely those of the individual author(s) and contributor(s) and not of MDPI and/or the editor(s). MDPI and/or the editor(s) disclaim responsibility for any injury to people or property resulting from any ideas, methods, instructions or products referred to in the content. |
© 2025 by the authors. Licensee MDPI, Basel, Switzerland. This article is an open access article distributed under the terms and conditions of the Creative Commons Attribution (CC BY) license (http://creativecommons.org/licenses/by/4.0/).
Copyright: This open access article is published under a Creative Commons CC BY 4.0 license, which permit the free download, distribution, and reuse, provided that the author and preprint are cited in any reuse.


