
Submitted:
09 December 2025
Posted:
10 December 2025
You are already at the latest version
Abstract
There is a growing demand for plant-derived antioxidants to replace synthetic ones in skincare applications. Phytochemicals are characterized by certain limitations, including poor bioavailability and chemical instability, which affect their industrial exploitation. Tomato peel extract has been used as a source of lycopene, which is renowned for its an-tioxidant properties. To improve the bioavailability of extracted lycopene, polymeric (Poly-lactic-co-glycolic acid) nano-carriers were synthesized by comparing two non-ionic surfactants, Polyvinyl alcohol and Tween 20. The impact of surfactants has been studied by evaluating: i) colloidal stability determined by Dynamic Light Scattering; ii) lycopene retention and bioactivity over time, as measured by spectrophotometric assays; iii) biolog-ical interactions on 2D and 3D culture keratinocytes and melanocytes cells. It was found that both surfactants enable the formation of stable lycopene-loaded nanoparticles sus-pensions; however, greater colloidal stability was exhibited by nanoparticles prepared with Tween 20. PVA, on the other hand, provided greater nanoparticles stability in terms of loaded lycopene retention and antioxidant activity. Tween 20 surfactant improves in-ternalization of lycopene-loaded nanoparticles in human skin spheroids. It was demon-strated that both surfactants provided excellent intracellular antioxidant activity of lyco-pene. This was observed in keratinocytes, melanocytes, adherent cells and spheroids, suggesting interesting skincare applications.
Keywords:
lycopene
; PLGA nanoparticles
; non-ionic surfactants
; human skin spheroids
1. Introduction
Significant advancements have been made over the past few decades in enhancing the bioavailability of bioactive ingredients for the food, cosmetics and pharmaceutical industries [1,2]. Lycopene (Lyc) is one of the most widely commercialised carotenoids thanks to its high antioxidant capacity among natural, plant-derived active compounds (e.g. vitamins, anthocyanins and phenolic compounds) [3,4]. Lycopene is also recognised for its potential anti-inflammatory properties, antidiabetic, antithrombotic, and antimicrobial effects, as well as for its protective effects on the cardiovascular system, its ability to mitigate oxidative damage and prevent cancer [5,6]. It is the pigment responsible for the red colouring of foods such as tomatoes, watermelons, papayas, pink grapefruits and guavas. Tomatoes represent the most significant source of Lyc, and the processing industry produces tomato pulp as its primary solid waste, comprising skins and seeds. This accounts for approximately 4% of the weight of processed tomatoes, and millions of tonnes of agricultural waste are produced each year. As Lyc is predominantly present in the skin of the fruit, tomato peel (TP) has the potential to serve as an alternative, cost-effective source of carotenoids [7].
Methods of Lyc extraction include organic solvent extraction (conventional, such as liquid-liquid, Soxhlet, microwave and ultrasound-assisted extraction), and green techniques (alternative). In the food, cosmetic and pharmaceutical industries, an environmentally friendly carotenoid extraction process with minimal loss of bioactivity is desirable. Supercritical CO₂ (SC-CO2) extraction is a more environmentally friendly alternative to organic solvent extraction and is already used in the food industry to produce solvent-free extracts [3,8].
However, due to the high degree of unsaturation exhibited by Lyc, a highly significant propensity for chemical degradation and cis-trans isomerisation is exhibited under conditions of extreme temperature and pH value, exposure to oxygen, and to light. This chemical instability is the primary cause of the observed fading of the compound's colour and the resultant loss of its bioactivity and bioavailability [9,10].
The exploitation of Lyc biological properties is also impeded by its hydrophobic nature and insolubility in aqueous solvents, as well as in many other solvents, which affect its efficient delivery. These limitations considerably restrict its commercial applications [11,12]. Additionally, the high degree of lipophilicity could impact its permeation through the stratum corneum (the outermost layer of the epidermis) in dermatology applications. This phenomenon can be attributed to the substance's propensity to interact with the components of stratum corneum, resulting in its prolonged retention within this initial layer [13,14,15]. To improve the delivery of Lyc to the deeper layers of the skin, several formulation strategies have been suggested, including the use of surfactants, permeation enhancers, cyclodextrin complexes, and various nanoscale delivery systems [9,10,12].
Delivery systems such as nanoemulsions, liposomes, niosomes, nanogels, polymeric and inorganic nanoparticles improve the stability, permeability, and targeted delivery of bioactive compounds and plants extracts [16,17,18,19]. The utilisation of biopolymeric and lipid-based nanostructures as effective nanocarriers has been demonstrated to be a promising strategy for protecting Lyc throughout the digestive system, for its incorporation into functional foods or nutraceutical products [9,10]. To enhance the delivery of Lyc to the deeper layers of the skin, vesicular nanocarriers such as liposomes and more deformable variants, including transfersomes, ethosomes and niosomes, and nanoemulsions have been proposed [14,15,20,21].
It is recognised that Lyc is more efficient in preventing oxidative damage than β-carotene when applied in skincare formulations providing beneficial results in terms of photodamage protection indicating a high potential for use as a antiaging cosmetic ingredient [22,23,24]. Lycopene-rich products, including tomato extract obtained using SC-CO₂, have demonstrated protective effects against UVB/UVA irradiation, anti-inflammatory and anti-apoptosis responses on different cells lines, fibroblasts and keratinocytes [21,25]. Previous studies have also reported anti-tyrosinase and anti-melanogenesis properties, which support the great potential of these natural extracts in the fields of skincare and dermatology [25].
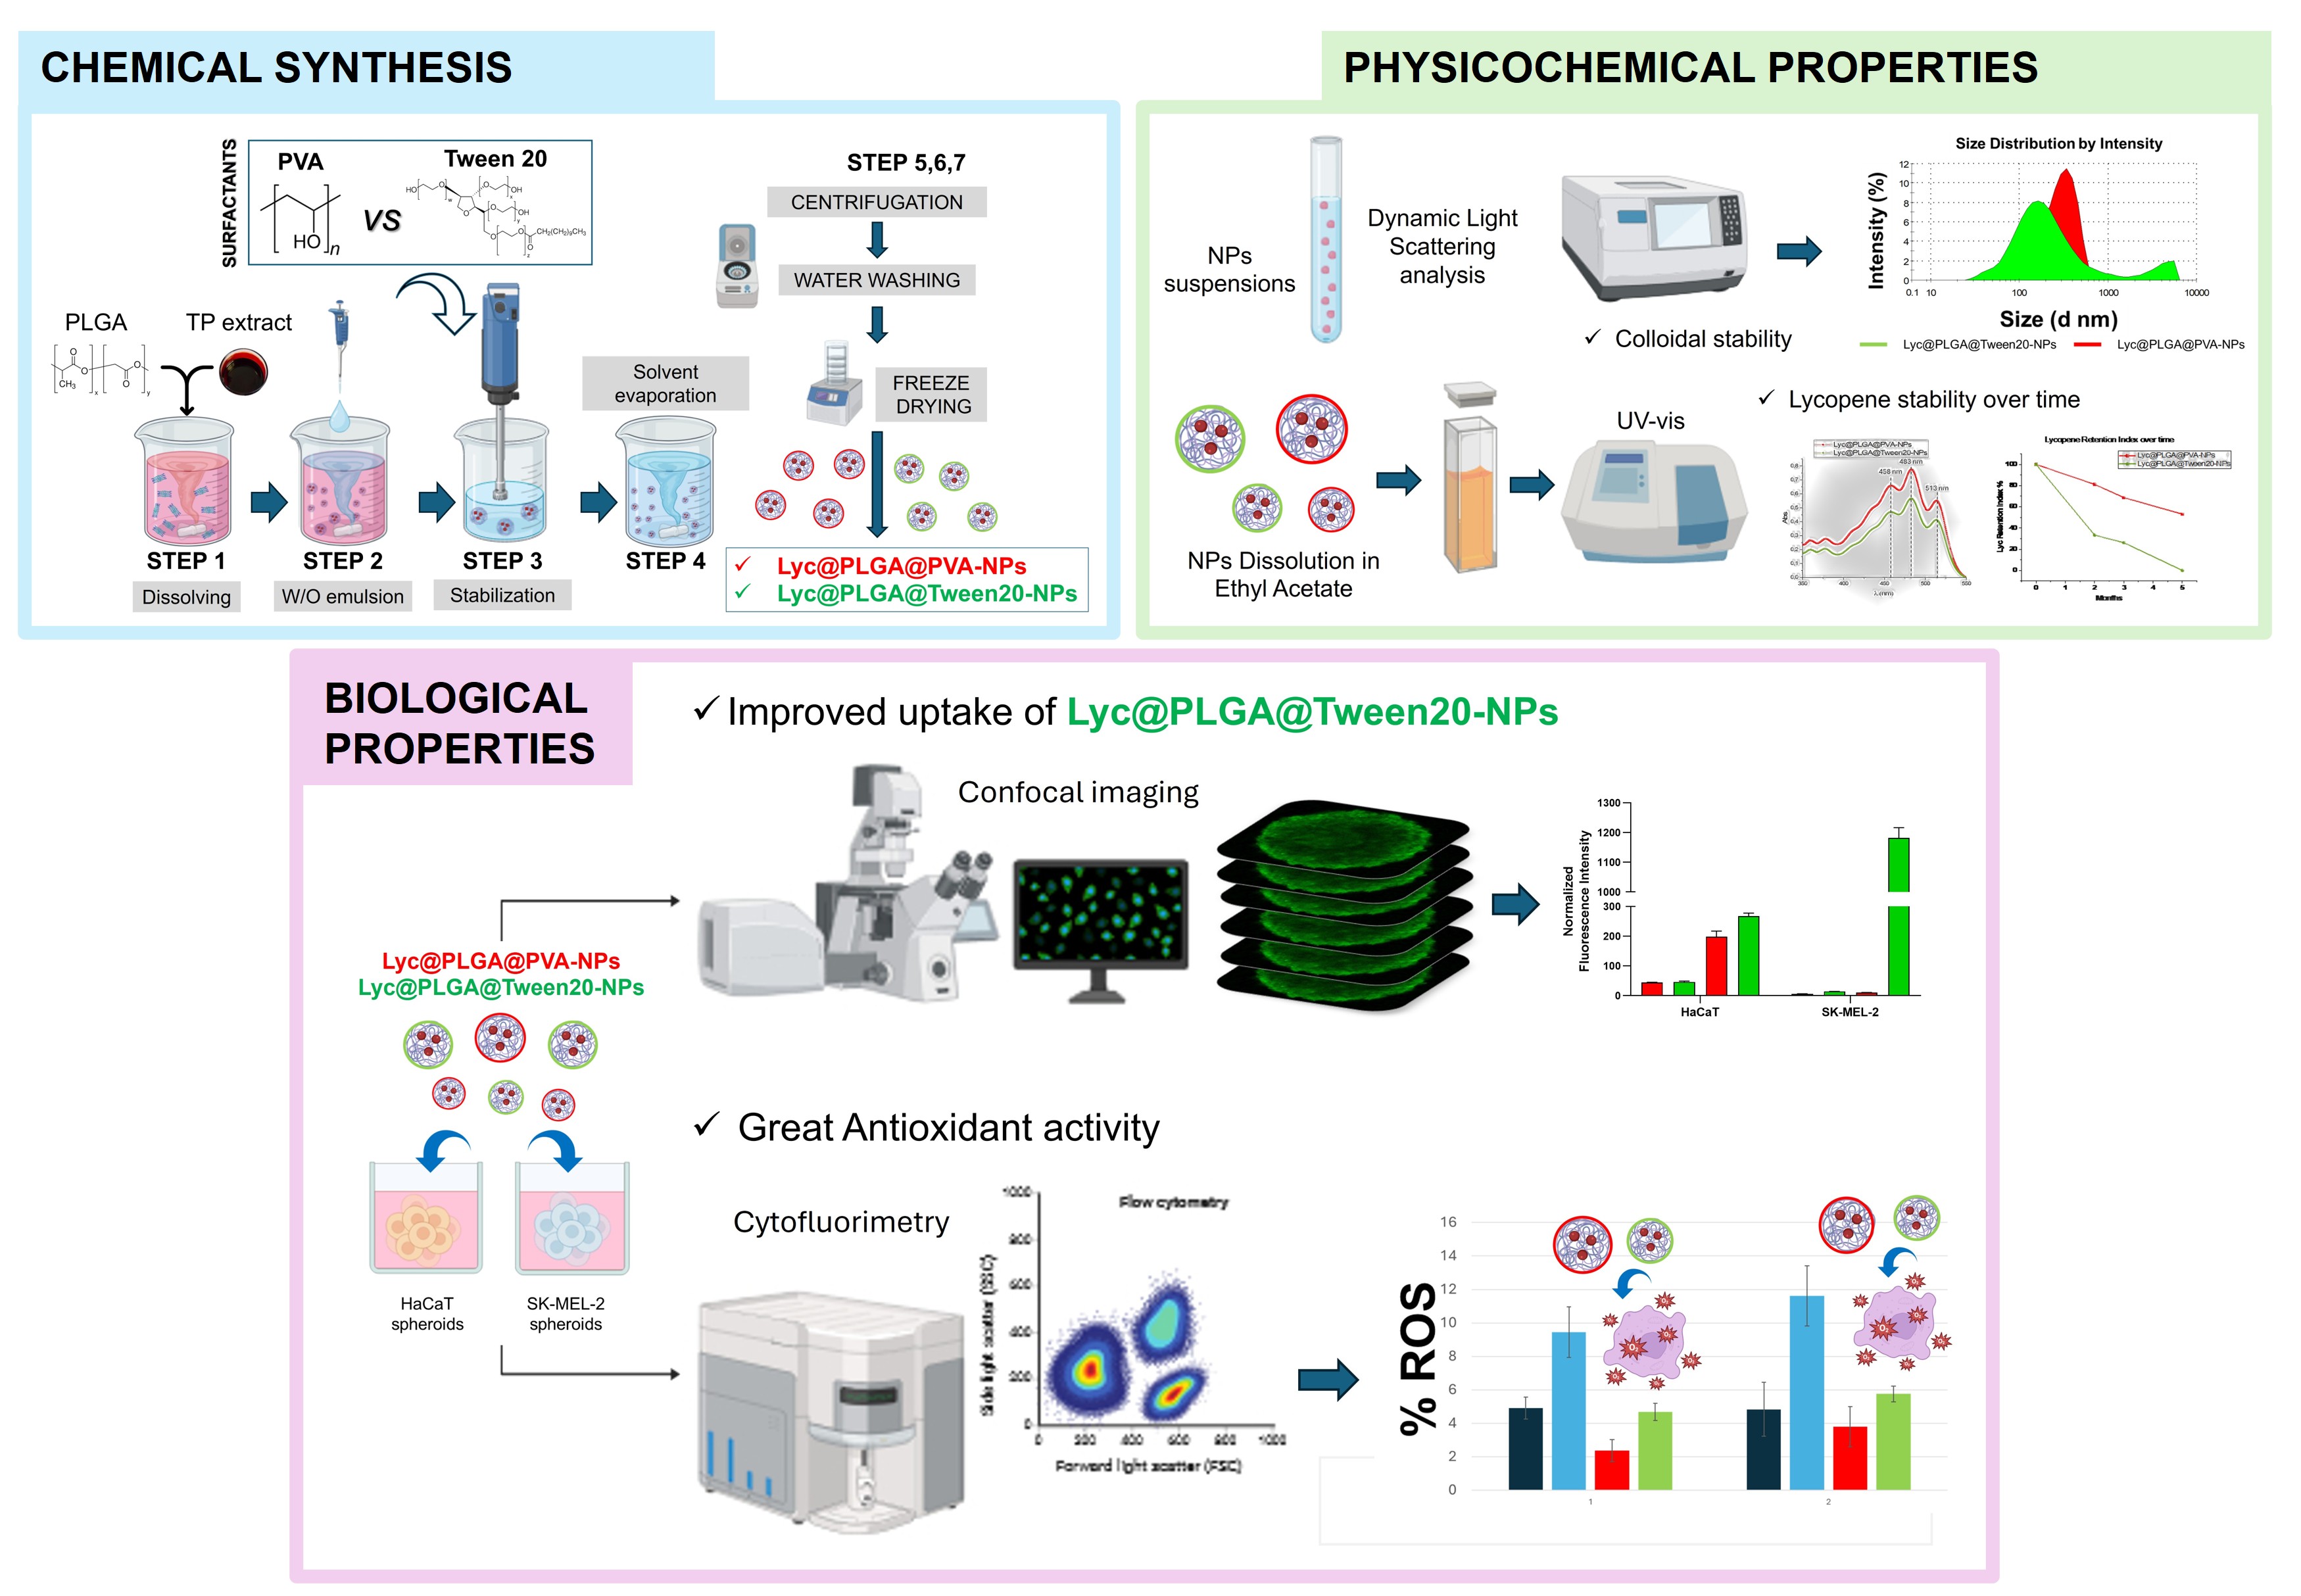
The aim of this study is to nano-encapsulate Lyc, starting from TP extract in the oil form and obtained with SC-CO₂ (provided by Licofarma s.r.l., Galatina, Lecce, Italy). Poly-lactic-co-glycolic acid (PLGA), a copolymer that has been approved by the U.S. Food and Drug Administration, has been selected for the synthesis of Lyc-loaded nanoparticles. The physicochemical properties of these nanoparticles have been tuned using two different surfactants, Polyvinyl alcohol (PVA) and Tween 20, in the colloid’s stabilisation phase. SC-CO₂ TP extract has been compared to Lyc standard analysing UV and HPLC spectra. Produced nanoparticles were characterize by electron microscopy, spectrophotometer, FT-IR and Dynamic Light Scattering to study their morphology, Lyc retention and colloidal stability over time. Antioxidant capacity of TP extract and Lyc-loaded PLGA nanoparticles (PLGA-NPs) have been assessed with DPPH inhibition test. Biological interactions have been studied in spontaneously immortalized human keratinocyte cell line, HaCaT, and melanoma cell line, SK-MEL-2. 2D and 3D cells cultures have been treated to verify the surfactant impact on cells viability, uptake and intracellular antioxidant activity.
Stable nanosuspensions have been produced providing a better colloidal stability with Tween 20 and a higher Lyc stability over time with PVA. Cellular assays demonstrated that the internalisation of PLGA-NPs in HaCaT and SK-MEL-2 spheroids was particularly affected by surfactant, rather than the antioxidant activity that is high in any case, thus contributing to the Lyc exploitation in skincare applications.
2. Materials and Methods
2.1. Materials
Tomato peel extract in the oil form, obtained with SC-CO₂, has been kindly provided by the cosmetics farmer Licofarma s.r.l. (Galatina, Lecce, Italy). Lycopene >=98%(HPLC) from tomato, PLGA, RESOMER RG 501, Polyvinyl alcohol (PVA) Mw 31,000-50,000, 98-99% hydrolyzed, Tween 20, 2,2-Diphenyl-1-picrylhydrazyl (DPPH), 2′,7′-diclorofluorescein diacetate, (DCFDA, ≥97% HPLC, powder, cell-permeable non-fluorescent probe) and Thiazolyl Blue Tetrazolium Bromide (MTT) were purchased from Merk Life Science S.r.l. (Italy). DAPI was purchased from Thermo Scientific, (Rockford, USA). Dulbecco’s Modified Eagle Medium (DMEM) (4,5 mg/L glucose) was purchased from Biowest (Nuaillé, France).
2.2. High-Performance Liquid Chromatography Analysis of Lyc in the TP Extract
For high-performance liquid chromatography (HPLC) analysis, an Agilent 1100 HPLC system consisting of a solvent tray, a vacuum degasser G1322A, a binary pump G1312A, an autosampler G1329A, a thermostatted column compartment G1316, and a diode array UV-Vis detector G1315B was used. The system was controlled by the Chemstation software (Agilent).
Chromatographic separations were performed in isocratic mode at 30°C using a Thermo Scientific Accucore C18 reversed phase column (2.6 μm, 10 cm × 2.1 mm). The detection wavelength was 472 nm. The mobile phase consisted of methanol and acetonitrile (50/50 v/v) at a flow rate of 0.3 mL/min.
2.3. Preparation of Lyc-Loaded PLGA Nanoparticles
Lyc-loaded PLGA nanoparticles (Lyc@PLGA-NPs) were prepared modifying the emulsification-solvent diffusion method described in literature [26,27]. Briefly, 100 mg of PLGA (RESOMER RG 501) was dissolved in 8 mL of Ethyl acetate and solubilized for 2 hours under agitation. Then, 12.5 mg of TP extract (measured density of 0.8 g/mL) were dissolved in 2 mL of PLGA solution to obtain a polymer (mg)/extract (mg) ratio of 2/1. This organic phase was mixed with 0.5 mL of filtered deionized water (0.45 µm filter) at 3.000 rpm for 30 min at RT. Afterwards, this first water-in-oil (w/o) emulsion was poured drop by drop using a syringe with a thin needle, into 10 mL of a 0.5 % (w/v) surfactant solution, which was homogenized at 8000 rpm for 3 min, using an Ultra-Turrax blender model IKA T25 (IKA Werke, Staufen, Germany), in an ice bath. Two emulsifiers were used to compare different colloids stabilization action, in detail: PVA (Mw 31,000-50,000, 98-99% hydrolyzed) obtaining Lyc@PLGA@PVA-NPs and Tween 20 obtaining Lyc@PLGA@Tween20-NPs. The resulting water-in-oil-in-water (w/o/w) emulsions were stirred overnight on a magnetic stirring plate at 500 rpm to remove the organic solvent through evaporation. The produced nanoparticles were centrifuged at 15,000 rpm for 15 min at 4°C and washed (with deionized water) three times to remove emulsifiers. The suspension was finally suspended in filtered deionized water, freeze-dried and stored at 4°C for the subsequent characterizations and biological studies.
2.4. Characterization of Lyc-Loaded PLGA Nanoparticles
2.4.1. Scanning Electron Microscopy
Morphological characterization of PLGA NPs has been performed by scanning electron microscopy, under a FESEM (MERLIN, Carl Zeiss GmbH) operating at an accelerating voltage of 20 kV. A sample solution drop (10 μL) was placed on a standard TEM carbon-coated Cu grid and dried at room temperature.
2.4.2. Dynamic Light Scattering Analysis
Lyc@PLGA-NPs colloidal stability and size distribution were investigated by average hydrodynamic diameter, polydispersity index and ζ-potential measurements through Dynamic Light Scattering (DLS). Samples were analysed with a Nano ZS90 (Malvern Instruments, UK) instrument. The ζ-potential analysis was carried out by Laser Doppler Velocimetry (LDV). Measurements were performed at 25 °C, in filtered distilled water (0.45 μm), at a concentration of 0.05mg/mL, setting the refractive index of PLGA (1.33). The ζ-potential values are reported as the mean of 5 measurements; each of them was derived from 20 different runs to establish measurement repeatability. Particle size distribution data are reported as the mean of 3 measurements (each of them derived from 12 different runs) to warrant repeatability. Lyc@PLGA@PVA-NPs and Lyc@PLGA@Tween20-NPs were analyzed after synthesis and after 25 days of storage in aqueous solution at °4C.
2.4.3. UV–vis Assay
Lycopene content in TP extract and PLGA-NPs was determined by UV-vis spectrophotometry, scanning from 350-550 nm by a Jasco V-530 spectrophotometer. The samples were prepared in ethyl acetate. TP extract has been dissolved in the solvent at the concentration of 0.3 mg/mL. The Lyc loaded into PLGA-NPs was extracted under NPs dissolution by vortexing 2 mg of each sample in 1 mL of ethyl acetate, for 3min and sonicating in an ice bath for 30 min. The resulting solutions were then centrifuged at 15,000 rpm for 10 minutes at 4 °C before UV-Vis analysis. The quantification has been made referring to a standard curve using Lyc standard from tomato (Merk Life Science S.r.l.) at known concentration in the range 1.5-25 µg/mL in ethyl acetate; measurements of Abs values at λmax 485nm were chosen and the line fitting has been made through Origin software (version 93E).
2.4.4. Fourier-Transform Infrared Spectroscopy
The vibrational features of the samples were analysed by FT-IR spectroscopy. The direct analysis on Lyc@PLGA@PVA-NPs and Lyc@PLGA@Tween20-NPs was performed comparing PLGA (as blank control) and Lyc@PLGA-NPs in their freeze-dried form, whereas the TP extract was measured as a solution in ethyl acetate. A small aliquot of each sample was deposited onto the ATR element of an FT-IR spectrometer (Perkin-Elmer Spectrum One); the TP extract was allowed to evaporate completely prior to acquisition, while the freeze-dried nanoparticle powders were analysed directly. The analysis on Lyc released by PLGA-NPs was performed following NPs dissolution as described in the previous section 2.4.3. For each measurement, 64 scans were collected in the spectral range 4000–600 cm⁻¹. All spectra were recorded under identical instrumental conditions to enable qualitative comparison.
2.5. Determination of Free Radical Scavenging Activity
Free Radical Scavenging Activity has been determined by quantifying the inhibition of DPPH reagent. TP extract was dissolved in ethyl acetate at a concentration of 6 mg/mL and then diluted in the working solutions to analyze DPPH inhibition to achieve the selected quantities of 0.25-0.5-1-2 mg. The scavenging activity of Lyc loaded into PLGA-NPs was determined following NPs dissolution as described in the previous section 2.4.3. Briefly, 0.5 mL of the produced samples (TP extract and Lyc solution released by PLGA-NPs) was added to 2.5 ml of 0.1 mM DPPH-methanolic solution and vigorously shaken in the dark at room temperature. The absorbance of samples at 515 nm was measured after 30 min. Ascorbic acid and methanol were used as positive and negative controls, respectively. The scavenging activity was calculated using Equation 1:
2.6. Stability of Lyc-Loaded PLGA NPs
For the storage stability study, the powders of Lyc@PLGA@PVA-NPs and Lyc@PLGA@Tween20-NPs were kept at 4°C for 5 months and analyze for any change on Lyc content and percent residual scavenging activity. Lyc content has been quantified at each time intervals (0-2-3-5 months) using the procedure just described in 2.4.3 section. The retention index percentage has been calculated using the following Equation 2:
where C1 represents the LYC content after storage (2-3-5 months), and C0 is the LYC content before storage, at time 0 (after freeze-drying).
The retentional antioxidant was calculated using the following Equation 3:
where D1 is the DPPH radical scavenging activity of the sample at different intervals of storage (2-3-5 months), and D0 is the DPPH radical scavenging activity of the sample before storage, at time 0 (after freeze-drying). Sample preparation and scavenging activity were performed as described in section 2.5.
2.7. In Vitro Biological Studies of Lyc-Loaded PLGA NPs
2.7.1. Cell Culture and Spheroids Formation
HaCaT and SK-MEL-2 cell lines were maintained in Dulbecco’s modified Eagle’s medium (DMEM) supplemented with fetal bovine serum (FBS) (10%), penicillin (100 U·mL−1 culture medium), streptomycin (100 mg·mL−1 culture medium), and glutamine (5%). Cells were grown in a humidified incubator at 37°C, 5% CO2, and 95% relative humidity.
For the spheroid’s formation, HaCaT and SK-MEL-2, were trypsinizedand seeded into each well of an ultra-low attachment U-shaped 96-well plate (Corning Costar 7007) in 80 μl complete medium with these cell density, respectively, 12 × 104 cells/well and 8 × 10⁴ cells/well. The U-plates were centrifuged at 3000 rpm for 20 minutes at 4°C and then the plates were transferred in the humidified incubator for at least 24 h to allow the spheroids formation and growth. The morphological characteristics of the spheroids, including their diameter and shape, were determined by microscopic optical analysis using an inverted microscope EVOS XL Cell Imaging System microscope (Thermo Fisher, Waltham, MA, USA).
2.7.2. Cell Viability Test by MTT Assay
Cells were added to 24-well culture plates at 1 mL per well, and incubated at 37°C, 5% CO2, and 95% relative humidity for 24, 48 and 72 hours with Lyc@PLGA@PVA-NPs and Lyc@PLGA@Tween20-NPs (50-100-200 µg/ml). The control was a complete culture medium. After the incubation period, cultures were removed from the incubator, and MTT solution (5 mg/ml) was aseptically added. Cultures were returned to the incubator and incubated for 3 hours. After the cultures were removed from the incubator, and the resulting MTT formazan crystals were dissolved in DMSO. The plates were ready within 15 min after adding DMSO. After the incubation time, pipetting up and down was required to completely dissolve the MTT formazan crystals. Absorbance at a wavelength of 570 nm was measured using Microplate Reader CLARIOstar PLUS. Calculate the percentage of cell viability using the Equation 4:
where Abs (t) is the absorbance of treated cells and Abs (nt) is the absorbance of not treated cells. Results were expressed as mean ± SD of three separate experiments.
Spheroid viability upon incubation with Lyc@PLGA@PVA-NPs and Lyc@PLGA@Tween20-NPs was measured by MTT assay, as described by Bresciani et al., 2019 [28]. Briefly, on the third day, spheroids covered by 80 μl of medium were incubated with NPs suspensions at different concentrations (50, 100 and 200 µg/ml). After 24 hours of incubation the medium was removed, the spheroids were washed with PBS and 100 μl of 5 mg/ml MTT solution was added to each well. After 3 h of incubation, the MTT solution was removed, the insoluble formazan crystals were dissolved with 100 μl of dimethyl sulfoxide and the absorbance at 570 nm was measured in Microplate Reader CLARIOstar PLUS. Cell viability percentage was calculated using Equation 4. Results were expressed as mean ± SD of 3 separate experiments, in which 4 spheroids were used for each condition.
2.7.3. Cellular Uptake of Lyc-Loaded PLGA Nanoparticles by Confocal Imaging
HaCaT (12 × 104) and SK-MEL-2 (8 × 10⁴) spheroids were seeded as explained above and treated with nanoparticles suspension the concentration of 100 µg/ml. After rinsing with phosphate buffered saline (PBS) twice, spheroids were fixed with PFA 4% for 20 minutes at RT, followed by three washes with PBS, then stained with DAPI for 1 hour. The stained spheroids were stored in PBS at 4°C until imaging. The spheroids were imaged as z stacks with a Zeiss LSM700 confocal microscope (Zeiss, Germany) equipped with a Zeiss Axio Observer Z1 inverted microscope using a 10X and 20X objective with a 1.46 numerical aperture for imaging using the same settings between the repeats. Laser beams with 405 nm and 488 nm excitation wavelengths were used for DAPI and FITC for lycopene imaging, respectively. Spheroid volume was calculated using ImageJ v1.51n software with the 3D Object Counter v2.0 plugin. The threshold for background and object voxels was manually adjusted for each image in order to capture the whole volume of each spheroid [29,30].
2.7.4. Intracellular Reactive Oxygen Species Measurement by DCFDA Assay
A total of 3× 10⁵ HaCaT cells and 2 × 10⁵ SK-MEL-2 cells were seeded into 6-well culture plates with 2 mL of media per well and incubated for 72 hours in order to reach a final confluence of 80%. Both cell lines were first treated for 24 hours at 37°C with the PLGA-NPs suspensions and, simultaneously, with H2O2 to induce exogenous stress (1 mM). Twenty-four hours later, the cells were exposed to a 10 µM DCFDA solution for 30 minutes. After that period cells were collected, washed twice with PBS, and subjected to centrifugation at 1200 × g for 5 min at room temperature. Subsequently, the cell pellet was resuspended in PBS supplemented with 1% FBS and the cells were analysed. Results were expressed as mean ± SD of 3 separate experiments.
Three-day-old 3D spheroids of HaCaT (12×104 cells/well) and SK-MEL-2 (8×10⁴ cells/well) were selected for reactive oxygen species (ROS) analysis. These spheroids were exposed for 24 hours at 37°C to PLGA-NPs suspensions supplemented with 1 mM H2O2. After the incubation period, all spheroids were rinsed with 10 mL of PBS and were collected in a 15 mL tube. After centrifugation (5 min, 400 g), spheroids were incubated for 30 minutes with DCFDA solution (10 µM), washed twice with PBS, and subjected to centrifugation at 1200 × g for 5 min at room temperature. Subsequently, the cell pellet was resuspended in PBS supplemented with 1% FBS and the cells were analysed. Results were expressed as mean ± SD of 3 separate experiments, in which 12 spheroids were used for each condition.
Flow cytometry was performed on a flow cytometer (BD Biosciences, San Jose, CA, USA) equipped with FlowJo software.
3. Results
3.1. Characterization of TP Extract
TP extract (Licofarma s.r.l.) and Lyc standard, both in ethyl acetate, have been analysed by HPLC. As illustrated in Figure 1, the chromatogram of TP extract shows a peak at retention time (Rt) of 9.91 min, in line with the peak at Rt 9.94 min of Lyc standard.
This comparison has also been made with UV-vis. As we can observe in Figure 2, the absorption spectrum of Lyc has been found in the extract solubilized in the same solvent.
Lycopene from TP extract obatained with SC-CO2 (Licofarma s.r.l.) showed three absorbance peaks (λ max) at 457, 482, and 513 nm, consistent with those obtained for the Lyc standard from tomato (Merk Life Science S.r.l.) (460nm, 485 nm, and 516nm).
Bioactivity in terms of free radical scavenging activity has been determined by DPPH inhibition test, testing TP extract solubilized in ethyl acetate. As demonstrated in Figure S1, the antioxidant activity increases linearly with increasing amount of dissolved extract. At 2 mg, a percentage of 96 is achieved, which is equivalent to the activity observed for the same amount of ascorbic acid, which was utilised as positive control.
3.2. Charaterization of Lyc@PLGA-NPs
3.2.1. Influence of Surfactants on NPs Physicochemical Properties
DLS analysis has been used to study the surfactant influence on particle size, zeta potential and colloidal stability. In Table 1 were reported ζ-potential, average hydrodynamic diameter (Z-average) and Polydispersity Index (PdI) of Lyc@PLGA@PVA-NPs and Lyc@PLGA@Tween20-NPs diluted aqueous suspensions.
1 ζ-potential values are reported as the mean (±standard deviation) of 5 measurements; each of them derived from 20 different runs;.2 Z-average (±standard deviation) is the average hydrodynamic diameter is the of 3 Distribution Size measurements, each one consists of 12 runs; 3 Polydispersity Index (PdI) is reported as the mean (±standard deviation) of 3 Distribution Size measurements, each one consists of 12 runs.
The ζ-potential values ≥ |20 mV| and PDI ≤ 0.5 indicated stable colloidal suspensions for both the used surfactant. The utilization of Tween 20 produced particles with a more negative charge and a lower average hydrodynamic size compared to PVA. The improved size distribution due to Tween 20 is evident in the intensity plot shown in Figure S2. No difference was measured between the PDIs, indicating that both suspensions have good homogeneity. A higher negative charge is also found in particles produced with Tween 20 when empty particles are produced under the same conditions without the addition of the extract, as resumed in Table S1. However, PLGA@Tween20-NPs |ζ-potential| is lower than |ζ-potential| of Lyc@PLGA@Tween20-NPs (≅ -30 vs ≅ -44 mV). No differences in terms of average size and polydispersity have been registered for empty NPs. Furthermore, the colloidal stability is maintained for 25 days in an aqueous suspension, as indicated by the unaltered DLS parameters reported in Table S2.
3.2.2. Influence of Surfactants on Lyc Encapsulation and Stability
The qualitative verification of Lyc encapsulation was obtained through FT-IR analysis conducted on Lyc@PLGA-NPs, blank PLGA and the TP extract. In Figure 4, organised into four single-spectrum panels (A–D), the vibrational profiles are presented separately in order to clearly highlight the spectral regions associated with Lyc. Panels A and B show the spectra of freeze-dried NPs, Lyc@PLGA@PVA-NPs (red line) and Lyc@PLGA@Tween20-NPs (green line), respectively, whereas panels C and D report the FT-IR spectra of PLGA (black line) and the TP extract analysed in ethyl acetate (blue line). In panels A and B, the blue dashed rectangles mark the aliphatic C–H stretching region (3000–2800 cm⁻¹), associated with (C-H) groups typical of carotenoids and clearly visible in the TP extract (panel D). The red arrows indicate the conjugated C=C stretching vibrations (1600–1500 cm⁻¹), which represent the fundamental signature of the polyene chain of Lyc. The blue arrows highlight the region between 850–750 cm⁻¹, where Lyc exhibits characteristic out-of-plane C–H bending and torsional vibrations of the polyene backbone—features that are not observed in blank PLGA. These Lyc-associated bands appear in both nanoparticle formulations but are absent in the blank PLGA (panel C), which display only the typical polymer-related vibrations, including the strong ester C=O stretching band at 1750 cm⁻¹ and the C–O–C stretching region between 1300–1100 cm⁻¹.
The integrity of Lyc after release from the nanoparticles was further evaluated by analysing the spectra of the formulations dissolved in ethyl acetate, as shown in Figure S4. The spectra of the dissolved NPs exhibited the full set of Lyc-associated features, including the aliphatic C–H stretching (3000–2800 cm⁻¹), the conjugated C=C stretching modes (1600–1500 cm⁻¹) and, notably, the characteristic band at 960 cm⁻¹, attributed to the out-of-plane =C–H bending of all-trans Lyc (see Figure S4).
FT-IR spectra features have also been verified by UV-vis analysis. In figure S5, UV-vis spectra of Lyc solution following NPs dissolution at time 0 are reported. By comparing these spectra with those shown in Figure 2, we can confirm that the molecule has not been modified after being encapsulated and released from the produced nanoparticles. The UV-vis calibration curve (λ max 485 nm) has been used for the quantification of encapsulated Lyc following dissolution of the same quantity of NPs. The Lyc@PLGA@PVA-NPs have been loaded 3.2 ±0.29 µg/mg NP and Lyc@PLGA@Tween20-NPs 2.1 ±0.36 µg/mg NPs. These data are obtained as average of 3 independent synthesis batches. PVA stabilization protocol results in a higher load of Lyc from the feeding TP extract.
The UV-vis quantification assay has been used also to measure the Lyc retention index over time from NPs powder (at 4°C). As we can observe in the plot of the Figure 5 A, PVA emulsifier provided a higher stability in terms of Lyc retention than Tween 20.
The Lyc@PLGA@PVA-NPs particles lose 40% of the encapsulated Lyc after 5 months of storage; on the other hand, the Lyc@PLGA@Tween20-NPs lose all their content due to greater degradation of the compound during storage.
The loaded Lyc stability into PLGA@PVA-NPs has also been confirmed by DPPH assay measuring the antioxidant activity retention percentage. In the plot of Figure 5B, we can observe a low loss of antioxidant activity after 5 months of storage for PVA-NPs. For what concern the Lyc@PLGA@Tween20-NPs, scavenging activity has been maintained after 2 months of storage despite the loss of ≅ 80% of Lyc retention. After three months of storage, the retained Lyc into the Tween20-NPs was inactive under the investigated conditions.
3.3. Influence of Surfactants on Lyc@PLGA-NPs Interaction with HaCaT and SK-MEL-2 Spheroids
3.3.1. Cells Viability and Uptake of Lyc@PLGA-NPs
MTT data, reported in figure S6, indicated a low reduction in cells viability of HaCaT adherent cells after treatment with Lyc@PLGA@Tween20-NPs at 200 µg/mL, that does not change over time (Figure S6 A). SK-MEL-2 adherent cells viability has been affected by both NPs, with a linear decrease of percentages increasing Lyc@PLGA@Tween20-NPs concentrations over time (Figure S6 B). For what concern Lyc@PLGA@PVA-NPs, the toxic effect revealed at 200 µg/mL after 48h of treatment, does not persist after 72 hours, suggesting a slowdown in cell proliferation (Figure S6 B). MTT data on HaCaT and SK-MEL-2 spheroids have shown that both the produced NPs do not affect cells viability after treatment of 24h at 100-200 µg/mL (Figure S6 C-D). These NPs concentrations have been selected for the subsequent biological assays.
The normalized fluorescence intensities by confocal microscopy analysis of treated spheroids are reported in Figure 6. Fluorescence intensity was referred to Lyc excitation at 488 nm. Normalisation was performed with respect to the volume of the spheroid that was analysed. In Figure 6 A-D, representative images of HaCaT and SK-MEL-2 spheroids after 24 h of treatment are reported.
HaCaT spheroids showed an increase in Lyc@PLGA-NPs internalization over time. As a function of time, there is a marked increase in normalized intensity, with a 4.5-fold rise observed for Lyc@PLGA@PVA-NPs and with a ≅6-fold rise for Lyc@PLGA@Tween 20-NPs, from 3 to 24 hours of treatment. The significant difference between Lyc@PLGA@PVA-NPs and Lyc@PLGA@Tween 20-NPs at 24 hours indicated an impact of surfactant on NPs uptake in HaCaT spheroids.
SK-MEL-2 spheroids showed very low internalization for both investigated NPs after 3 h of incubation. Instead, a clear difference between the two surfactants has been observed after 24h of incubation. Lyc@PLGA@PVA-NPs internalization remained at the low value that had been recorded at 3h, instead of Lyc@PLGA@Tween 20-NPs internalization considerably increased from 14.3 ± 0.26 to 1182 ± 34.4.
The gallery images reported in Figure S7 show the penetration of NPs across spheroids after 24h of incubation. Concerning HaCaT spheroids, we observe that Lyc@PLGA@Tween 20-NPs were internalized more than Lyc@PLGA@PVA-NPs, as measured by fluorescence quantitative analysis. Clearly, there is a greater accumulation of all particles along the periphery of the spheroid on the top, compared to a more homogeneous distribution on the bottom. Greater uniformity is observed for Lyc@PLGA@Tween 20-NPs penetration.
3.3.2. Antioxidant Activity of Lyc@PLGA-NPs
ROS production percentages measured with DCFDA assay are reported in Figure 7. HaCaT and SK-MEL-2 adherent cells and spheroids have been treated with 200µg/mL of Lyc@PLGA@PVA-NPs and Lyc@PLGA@Tween 20-NPs and H2O2 (1mM) for 24h. Representative flow cytometric spectra of intracellular ROS analysis are reported in Figure S8. Negative control is defined as the condition that has not been subjected to any treatment, whilst positive control is defined as the condition that has been subjected to treatment with H2O2.
The ROS inhibition effect of Lyc-loaded NPs is evident for both investigated samples, in 2D as well as in spheroids. Lycopene delivered by PLGA-NPs restores ROS levels to those of the control condition, despite the oxidative stimulus of hydrogen peroxide. This effect has been detected both in 2D and spheroids. In SK-MEL-2 adherent cells has been detected a significative ROS reduction respect not treated condition, following Lyc@PLGA@PVA-NPs and Lyc@PLGA@Twen 20-NPs incubation (Figure 7A). This ROS reduction respect not treated condition has been found also in HaCaT and SK-MEL-2 spheroids (Figure 7B).
4. Discussion
The TP extract, obtained with SC-CO₂, has been kindly provided by Licofarma s.r.l. (Galatina, Lecce, Italy) in the oil form. Lycopene isomers have been assessed in food or extracts by many analytical methods, such as UV−vis spectrophotometry and HPLC [11]. Solubilization of Lyc is quite difficult due to its high hydrophobic index. Here, we solubilized both commercial and TP extract in ethyl acetate, taking advantage of its high solubility in this solvent (145.3 mg/mL), which is also used to synthesize PLGA nanoparticles. The chromatographic profile of TP extract corresponds to that of the standard in the same solvent (ethyl acetate) and HPLC conditions. The compounds are separated by their Rt which for the all-trans-lycopene standard and its isomers are in the range 8-20min, using C18 and C30 columns [11]. The major compound identified in the extract was Lyc at Rt 9.91 min, consistent with the identified peak of commercial Lyc (see Figure 1).
UV–Vis spectrophotometry has been employed for simple and rapid detection of Lyc in TP extract comparing with the commercial standard. The UV-vis spectrum of Lyc samples in organic solvents reported different maximum absorption wavelengths depending on the different solubilization [11]. Scanning the region 350-550 nm, three maximum absorbance bands have been revealed at λmax 457, 482 and 513 nm [21,31], similar to those obtained for the tomato Lyc standard (λmax 460, 485 and516 nm), see Figure 2. The measured Abs at λmax 485 nm has been chosen for the quantification experiments on Lyc@PLGA-NPs.
Having verified the presence of Lyc in the initial extract and determined the optimal conditions for its characterization and quantification, we proceeded to focus on its efficient encapsulation.
PLGA is a copolymer approved by the U.S. Food and Drug Administration and is currently used in a broad range of biomedical applications thanks to its biocompatibility, biodegradability and capacity to preserve loaded drugs degradation [32].
Lyc@PLGA-NPs have been fabricated through the double emulsion method using ethyl acetate as the organic solvent and a polymer/TP extract ratio of 2/1. The effects of polymer concentration, the type of organic solvent used, temperature and the injection and agitation rates of the organic and aqueous phases were widely studied [33]. However, surfactants play a key role in the stabilization phase of polymeric NPs emulsion formation, in their size and finally in biological interactions [34,35,36].
We have compared two non-ionic and biocompatible surfactants: Tween 20 and PVA. Tween 20 is the commercial name for polysorbate 20, a type of emulsifier used in food and pharmaceutical fields, as well as cosmetics, particularly in products for the skin, hair and nails. PVA offers interesting versatility for a variety of industrial applications, including controlled drug delivery systems, tissue adhesion barriers, transdermal patches, and tissue engineering [37]. The deposition of non-ionic surfactants at the interface of emulsified w/o droplets affected their size so the final colloidal stability and PdI. The average hydrodynamic diameter (see Table 1) and the size distribution by intensity (see Figure S2) suggest that the Tween 20 has a greater stabilising effect. The smaller Z-average (Table 1) of the Lyc@PLGA@Tween20-NPs means there is less aggregation of nanoparticles in solution than with PVA. Under SEM observation, the actual sizes of Lyc@PLGA@PVA-NPs and Lyc@PLGA@Tween20-NPs are very similar (see Figure 3 and S3). The colloidal stability has also been confirmed by ζ-potential measurements. There is also a substantial difference between the two surfactants for this parameter. Nanoparticles acquire a surface charge of ≅ -44 mV with Tween 20, compared to ≅ -30 mV with PVA (Table 1). Both NPs maintained this negative charge after 25 days in suspension (Table S2), suggesting a stabilization effect of carriers in liquid media over time. The more negative ζ-potential value of Lyc@PLGA@Tween20-NPs confirmed their improved distribution in size, since this parameter is recognised as an indicator of colloidal stability. When the surface charge of NPs is homogeneous (i.e. either positive or negative), the Van der Waals and electrostatic forces are known to oppose each other leading to the formation of a stable suspension, without flocculation or precipitation [38]. PLGA nanoparticles are typically negatively charged due to the carboxyl groups on the polymer surface, with a ζ-potential often around −20 mV as confirmed by our measurements (see table S1). As both PVA and Tween 20 are non-ionic, the interpretation of the ζ-potential in order to predict the stability of our colloidal nanosuspensions is linked to the resulting surfactants steric effect [37]. Furthermore, considering the DLS parameters values for empty NPs, we can deduce that the adsorption of these hydrophilic emulsifiers on Lyc@PLGA-NPs reduced their hydrophobicity and decreased the interfacial tension between Lyc and PLGA, leading to relatively homogeneous and stable nanosuspensions. Our data suggested that Tween 20 ‘s emulsification capability is superior to that of PVA, concerning Lyc loaded NPs. This result is not in accordance with previous reports [39,40], suggesting that the interaction with the loaded compound could also play a crucial role. A previous study on Lyc-loaded polysaccharide NPs showed that PVA concentration significantly impacts colloidal stability and molecule loading [41]. The high hydrophilic-lipophilic balance and low critical micelle concentration of polysorbates give Tween 20, when used, high surface activity even at low concentrations (the protocol provided for 0.5% w/v of both surfactants). Instead, PVA stabilises emulsions by forming an interconnected network with the polymer at the interface (through hydrogen bonds formation), resulting in a fraction of PVA remaining associated with the NPs [37,42]. This feature can be observed by comparing the morphological structure of synthesized NPs. Thin ridges have been primarily observed on the surface of Lyc@PLGA@PVA-NPs (see Figure 3), suggesting the presence of an emulsifier.
Materials choice, including emulsifiers, has impacts on particle size, zeta potential, surface morphology features, and also on drug loading [37,43]. Lycopene loading has been verified through FT-IR analysis on freeze-dried NPs and on Lyc solution after NPs dissolution. The FT-IR analysis offered a qualitative indication of Lyc encapsulation within the PLGA nanoparticles. As shown in Figure 4, the spectra of the loaded formulations were dominated by the characteristic bands of the polymer matrix, and FT-IR therefore could not provide quantitative information on Lyc content. Although the overall spectral profile of both Lyc@PLGA-NPs resembles that of blank PLGA due to the predominance of the polymer matrix, marked differences emerge in the highlighted regions, confirming the contribution of the encapsulated Lyc [44,45,46]. The attenuation and partial overlap of these signals can be attributed to matrix effects and to the solid-state nature of the formulations, a behaviour commonly observed for carotenoids embedded in polymeric carriers [47,48]. Despite these intrinsic limitations, the subtle yet reproducible spectral differences detected in the relevant regions of Figure 4 were sufficient to qualitatively confirm encapsulation. The analysis performed after NPs dissolution (Figure S4) further reinforced these observations. Under homogeneous solvent conditions, the vibrational profile of the released Lyc matched that of the TP extract, suggesting that the encapsulation and release processes did not cause detectable alterations to the characteristic polyene structure. The persistence of the characteristic band at 960 cm⁻¹, confirms that the polyene chain remained intact, and that the carotenoid preserved its structural configuration throughout the formulation and release processes [46,49]. Although qualitative, this agreement supports the conclusion that the molecule maintains its structural integrity throughout the process. Overall, FT-IR offered qualitative confirmation of Lyc encapsulation and complemented the quantitative loading values obtained through UV–vis analysis.
UV-vis analysis has been used to quantified loaded Lyc; the calculated value of µg Lyc/mg NPs indicates a higher compound content for Lyc@PLGA@PVA-NPs. Larger particles commonly have a higher drug loading capacity; moreover PVA has been widely demonstrated to be highly efficient in synthesising carriers for the effective loading of different drugs [37,50].
In addition, emulsifiers, such as polysorbate and PVA, are also known to confer stability to NPs during storage in an aqueous medium and/or after freeze-drying. Colloidal stability has been discussed relating to DLS parameters. In view of the unstable nature of the compound, a series of tests was also carried out to assess the stability of the particles over time, evaluating the retention and antioxidant activity of Lyc after storage. The protective effect of PLGA on Lyc has previously been demonstrated in a simulated gastrointestinal tract system [51]. Emulsifiers could also play a key role in retaining and stabilising Lyc [52]. Retention index and scavenging activity percentages suggested a better capacity to protect Lyc toward degradation for Lyc@PLGA@PVA-NPs respect to Lyc@PLGA@Tween20 NPs, in accordance with known strong interaction of PVA with NPs surface [37]. There is a linear tendency between both measured indexes and storage time for Lyc@PLGA@PVA-NPs. Concerning the Lyc@PLGA@Tween20-NPs, the scavenging activity remained after two months of storage, despite a considerable loss of Lyc. This is probably due to isomers forming as a result of Lyc degradation; these isomers nevertheless remain bioactive [5,9]. Our results confirmed the strategic role of nanoparticles, comparing with microencapsulation and electrospinning techniques which provide Lyc retention rate of 30-50% after ≅30 days of storage at room temperature and ≅40% after 14 days at 4°C [8,53]. The delayed degradation that has been observed, especially for Lyc@PLGA@PVA-NPs, is comparable to that found for other nanocarriers [20,52,54] .
To facilitate an optimal analysis of the bioactivity exhibited by the samples, as well as any discrepancies that may be observed between the two surfactants, the nanoparticles used for biological testing were no older than one month.
The biological interactions of NPs are contingent on their size and surface phenomena. Consequently, the cellular uptake and bioactivity of delivery systems are also dependent on the surfactants used [35,36]. Their hydrophilic nature promotes interaction with cells, ligands and proteins, which may lead to benefits as well as potential toxic effects that need to be investigated [37].
First, we studied cell availability through MTT tests treating HaCaT and SKMEL-2, 2D and 3D cultures, with different concentrations of Lyc@PLGA@PVA-NPs and Lyc@PLGA@Tween20 NPs. MTT data (see Figure S6) suggested that 100 µg/mL and 200 µg/mL of Lyc@PLGA@-NPs could safely be used to treat cells for 24 hours.
The skin is a complex organ composed of multiple layers. The most superficial layer is the epidermis, which represents the main physical and chemical barrier to permeation by bioactive agents and NPs. Keratinocytes are the most abundant cell type in the epidermis, accounting for 90% of cells. They are responsible for producing keratin, the organ's major physical barrier [55]. It has been established that NPs are able to penetrate the skin via the same pathways that have been described for other substances. However, it is important to note that the ability of NPs to penetrate varies according to their size, composition, and colloidal stability [55]. For example, negatively charged NPs cross the epidermis more easily than those with a positive charge [56]. Polymeric NPs can cross the epidermis by penetrating the stratum corneum, accumulating on the upper surface, and penetrating the hair follicle (where melanocytes are located) [55]. We decided to investigate the uptake and penetration of Lyc@PLGA-NPs across spheroids of HaCaT and SKMEL-2 cells, in order to ascertain the impact of the employed surfactants. Cellular uptake of Lyc@PLGA@PVA-NPs and Lyc@PLGA@Tween20-NPs have been studied through confocal microscopic analysis exploiting the emitted fluorescence of Lyc. In line with the more negative ζ-potential of Lyc@PLGA@Tween20 NPs, their internalization after 24 h of treatment is higher than the other NPs. This difference is even greater when SKMEL-2 cells are compared to HaCaT cells. A comparatively low proportion of Lyc@PLGA@PVA-NPs are internalised in SKMEL-2 cells in comparison to Lyc@PLGA@Tween20-NPs (see figure 6). Thus, Tween 20 promotes the NPs uptake by melanocytes, providing a potential exploitation of this surfactant for anticancer drugs delivery, considering also the detected moderate toxic effect (see figure S6). It has been demonstrated through in vitro studies that the chemical composition of nanocarriers, in conjunction with the presence of emulsifiers, exerts a significant influence on cell uptake and penetration [13,57]. However, the distinguishing feature of our study is the in vitro assay on cells spheroids with confocal analysis, which exploits the intrinsic fluorescence of loaded compound. Furthermore, it can be deduced from the observation of the Z-stacks in Figure S7, that the NPs are capable of homogeneous penetration across HaCaT and SK-MEL-2 spheroids.
Despite the divergent internalisation of the produced NPs by the surfactant employed, Lyc loaded exhibited remarkable antioxidant activity, as evidenced by its capacity to inhibit intracellular ROS production following treatment with PLGA-NPs. As illustrated in Figure 7, both Lyc@PLGA@PVA-NPs and Lyc@PLGA@Tween20-NPs were found to restore the ROS levels to those of the non-treated cells, thereby avoiding the oxidative stimulus of H2O2 treatment. This outcome is in accordance with the findings of previous studies on Lyc-loaded carriers [58].
5. Conclusions
In recent years, particular attention has been paid to the use of carriers to effectively release antioxidants in dermatology application, where they act as protective and anti-ageing agents. We have synthesised PLGA-NPs comparing PVA and Tween 20 as surfactants for colloids stabilization and efficient Lyc loading. Colloidal stability is affected by surfactant, as demonstrated by the better DLS parameters of Lyc@PLGA@Tween20-NPs suspensions with respect to Lyc@PLGA@PVA-NPs. The stability of loaded Lyc retention and scavenging capacity over time was enhanced by Lyc@PLGA@PVA-NPs, suggesting a protective effect from PVA. The concentrations and treatment times were selected based on the stability and cytotoxicity studies to investigate Lyc@PLGA-NPs effect on cells uptake and bioactivity. Cells uptake has been studied on HaCaT and SK-MEL-2 spheroids by directly measuring the fluorescence of encapsulated Lyc with confocal imaging. This study emphasised the pivotal role of Tween 20 in facilitating the internalisation of NPs by human melanocytes, thereby underscoring its potential for further applications. Despite the effect on cells uptake that has been detected, the bioactivity of Lyc is enhanced by delivery via all Lyc@PLGA-NPs. The substantial antioxidant capacity of Lyc@PLGA@PVA-NPs and Lyc@PLGA@Tween20-NPs in HaCaT and SK-MEL-2 spheroids could offer significant potential for applications in cosmetics and dermatology.
Supplementary Materials
The following supporting information can be downloaded at Preprints.org, Figure S1. Scavenging activity percentage by DPPH inhibition assay versus TP extract mg; Figure S2. Size distribution plot as Intensity (%) of diluted Lyc@PLGA-NPs suspensions; Table S1. DLS parameters measured on empty PLGA-NPs suspensions; Table S2. DLS parameters measured on Lyc@PLGA-NPs suspensions after 25 days; Figure S3. Representative SEM images of Lyc@PLGA@PVA-NPs and Lyc@PLGA@Tween20-NPs; Figure S4. FT-IR of Lyc solution after Lyc@PLGA-NPs dissolution; Figure S5. UV-vis spectra of Lyc solution after Lyc@PLGA-NPs dissolution; Figure S6. Cells viability data on HaCaT and SK-MEL-2 2D and Spheroids; Figure S7. Confocal microscopy gallery images.; Figure S8. Representative flow cytometric spectra of intracellular ROS analysis.
Author Contributions
Conceptualization, F.B., V.V. and G.C. (last author); methodology, F.B., V.V. ; validation, F.B., C.B.; formal analysis, F.B., V.V., C.B and M.O.; investigation, F.B., V.V., C.B., M.O., C.N., G.E. D.B.; resources, C.N., G.E. D.B., G.C., L.V. and G.C. (last author); writing—original draft preparation, F.B., C.B. and M.O; writing—review and editing, V.V., G.C.,.M.S.S.; visualization, F.B., C.B., M.O.; supervision, F.B., V.V., L.V.; project administration, G.C. (last author); funding acquisition, G.C. (last author). All authors have read and agreed to the published version of the manuscript.
Funding
This research was funded by MINISTERO DELLO SVILUPPO ECONOMICO-Italy, Direzione generale per gli incentivi alle imprese, DECRETO MINISTERIALE 31/12/2021, ACCORDI PER L’INNOVAZIONE, DECRETO DIRETTORIALE 18/03/2022, Project “ANASTASIA-Applicazione delle NAnotecnologie per l’incremento Sostenibile della sTAbilità di prodotti del Settore cosmetica e Analitico”, CUP: B89J23001360005.
Informed Consent Statement
“Not applicable.”.
Data Availability Statement
All experimental data were provided in the manuscript or supplementary material.
Acknowledgments
We thank the cosmetics farmer Licofarma s.r.l. (Galatina, Lecce, Italy) for providing the tomato peel extract.
Conflicts of Interest
The authors declare no conflicts of interest.
Abbreviations
The following abbreviations are used in this manuscript:
| Lyc | Lycopene |
| PLGA | Poly-lactic-co-glycolic acid |
| PLGA-NPs | PLGA nanoparticles |
| PVA | Polyvinyl alcohol |
| Lyc@PLGA-NPs | Lycopene loaded PLGA nanoparticles |
| Lyc@PLGA@PVA-NPs | Lycopene loaded PLGA nanoparticles with PVA |
| Lyc@PLGA@Tween20-NPs | Lycopene loaded PLGA nanoparticles with Tween20 |
| SC-CO2 | Supercritical CO₂ |
| TP | Tomato peel |
References
- Rodríguez-Mena, A.; Ochoa-Martínez, L.A.; González-Herrera, S.M.; Rutiaga-Quiñones, O.M.; González-Laredo, R.F.; Olmedilla-Alonso, B. Natural Pigments of Plant Origin: Classification, Extraction and Application in Foods. Food Chemistry 2023, 398, 133908. [Google Scholar] [CrossRef]
- Brudzyńska, P.; Sionkowska, A.; Grisel, M. Plant-Derived Colorants for Food, Cosmetic and Textile Industries: A Review. Materials 2021, 14, 3484. [Google Scholar] [CrossRef] [PubMed]
- Popescu, M.; Iancu, P.; Plesu, V.; Bildea, C.S. Carotenoids Recovery Enhancement by Supercritical CO2 Extraction from Tomato Using Seed Oils as Modifiers. Processes 2022, 10, 2656. [Google Scholar] [CrossRef]
- Introduction to Biotech Entrepreneurship: From Idea to Business: A European Perspective; Matei, F., Zirra, D., Eds.; Springer International Publishing: Cham, 2019; ISBN 978-3-030-22140-9. [Google Scholar]
- Caseiro, M.; Ascenso, A.; Costa, A.; Creagh-Flynn, J.; Johnson, M.; Simões, S. Lycopene in Human Health. LWT 2020, 127, 109323. [Google Scholar] [CrossRef]
- Ali, M.Y.; Sina, A.A.I.; Khandker, S.S.; Neesa, L.; Tanvir, E.M.; Kabir, A.; Khalil, M.I.; Gan, S.H. Nutritional Composition and Bioactive Compounds in Tomatoes and Their Impact on Human Health and Disease: A Review. Foods 2020, 10, 45. [Google Scholar] [CrossRef]
- Squillace, P.; Adani, F.; Scaglia, B. Supercritical CO2 Extraction of Tomato Pomace: Evaluation of the Solubility of Lycopene in Tomato Oil as Limiting Factor of the Process Performance. Food Chemistry 2020, 315, 126224. [Google Scholar] [CrossRef] [PubMed]
- Mihalcea, L.; Crăciunescu, O.; Gheonea (Dima), I.; Prelipcean, A.-M.; Enachi, E.; Barbu, V.; Bahrim, G.E.; Râpeanu, G.; Oancea, A.; Stănciuc, N. Supercritical CO2 Extraction and Microencapsulation of Lycopene-Enriched Oleoresins from Tomato Peels: Evidence on Antiproliferative and Cytocompatibility Activities. Antioxidants 2021, 10, 222. [Google Scholar] [CrossRef] [PubMed]
- Falsafi, S.R.; Rostamabadi, H.; Babazadeh, A.; Tarhan, Ö.; Rashidinejad, A.; Boostani, S.; Khoshnoudi-Nia, S.; Akbari-Alavijeh, S.; Shaddel, R.; Jafari, S.M. Lycopene Nanodelivery Systems; Recent Advances. Trends in Food Science & Technology 2022, 119, 378–399. [Google Scholar] [CrossRef]
- Carvalho, G.C.; De Camargo, B.A.F.; De Araújo, J.T.C.; Chorilli, M. Lycopene: From Tomato to Its Nutraceutical Use and Its Association with Nanotechnology. Trends in Food Science & Technology 2021, 118, 447–458. [Google Scholar] [CrossRef]
- Amorim, A.D.G.N.; Vasconcelos, A.G.; Souza, J.; Oliveira, A.; Gullón, B.; De Souza De Almeida Leite, J.R.; Pintado, M. Bio-Availability, Anticancer Potential, and Chemical Data of Lycopene: An Overview and Technological Prospecting. Antioxidants 2022, 11, 360. [Google Scholar] [CrossRef]
- Guerra, A.S.; Hoyos, C.G.; Molina-Ramírez, C.; Velásquez-Cock, J.; Vélez, L.; Gañán, P.; Eceiza, A.; Goff, H.D.; Zuluaga, R. Extraction and Preservation of Lycopene: A Review of the Advancements Offered by the Value Chain of Nanotechnology. Trends in Food Science & Technology 2021, 116, 1120–1140. [Google Scholar] [CrossRef]
- Ascenso, A.; Pinho, S.; Eleutério, C.; Praça, F.G.; Bentley, M.V.L.B.; Oliveira, H.; Santos, C.; Silva, O.; Simões, S. Lycopene from Tomatoes: Vesicular Nanocarrier Formulations for Dermal Delivery. J. Agric. Food Chem. 2013, 61, 7284–7293. [Google Scholar] [CrossRef] [PubMed]
- Butnariu, M.V.; Giuchici, C.V. The Use of Some Nanoemulsions Based on Aqueous Propolis and Lycopene Extract in the Skin’s Protective Mechanisms against UVA Radiation. J Nanobiotechnol 2011, 9, 3. [Google Scholar] [CrossRef]
- Lopes, L.B.; VanDeWall, H.; Li, H.T.; Venugopal, V.; Li, H.K.; Naydin, S.; Hosmer, J.; Levendusky, M.; Zheng, H.; Bentley, M.V.L.B.; et al. Topical Delivery of Lycopene Using Microemulsions: Enhanced Skin Penetration and Tissue Antioxidant Activity. Journal of Pharmaceutical Sciences 2010, 99, 1346–1357. [Google Scholar] [CrossRef]
- Baldassarre, F.; Vergaro, V.; De Castro, F.; Biondo, F.; Suranna, G.P.; Papadia, P.; Fanizzi, F.P.; Rongai, D.; Ciccarella, G. Enhanced Bioactivity of Pomegranate Peel Extract Following Controlled Release from CaCO3 Nanocrystals. Bioinorganic Chemistry and Applications 2022, 2022, 6341298. [Google Scholar] [CrossRef]
- Kyriakoudi, A.; Spanidi, E.; Mourtzinos, I.; Gardikis, K. Innovative Delivery Systems Loaded with Plant Bioactive Ingredients: Formulation Approaches and Applications. Plants 2021, 10, 1238. [Google Scholar] [CrossRef]
- Baldassarre, F.; Schiavi, D.; Ciarroni, S.; Tagliavento, V.; De Stradis, A.; Vergaro, V.; Suranna, G.P.; Balestra, G.M.; Ciccarella, G. Thymol-Nanoparticles as Effective Biocides against the Quarantine Pathogen Xylella Fastidiosa. Nanomaterials 2023, 13, 1285. [Google Scholar] [CrossRef] [PubMed]
- Baldassarre, F.; Schiavi, D.; Di Lorenzo, V.; Biondo, F.; Vergaro, V.; Colangelo, G.; Balestra, G.M.; Ciccarella, G. Cellulose Nanocrystal-Based Emulsion of Thyme Essential Oil: Preparation and Characterisation as Sustainable Crop Protection Tool. Molecules 2023, 28, 7884. [Google Scholar] [CrossRef] [PubMed]
- Okonogi, S.; Riangjanapatee, P. Physicochemical Characterization of Lycopene-Loaded Nanostructured Lipid Carrier Formulations for Topical Administration. International Journal of Pharmaceutics 2015, 478, 726–735. [Google Scholar] [CrossRef]
- Kanpipit, N.; Mattariganont, S.; Janphuang, P.; Rongsak, J.; Daduang, S.; Chulikhit, Y.; Thapphasaraphong, S. Comparative Study of Lycopene-Loaded Niosomes Prepared by Microfluidic and Thin-Film Hydration Techniques for UVB Protection and Anti-Hyperpigmentation Activity. IJMS 2024, 25, 11717. [Google Scholar] [CrossRef]
- Ribaya-Mercado, J.D.; Garmyn, M.; Gilchrest, B.A.; Russell, R.M. Skin Lycopene Is Destroyed Preferentially over β-Carotene during Ultraviolet Irradiation in Humans. The Journal of Nutrition 1995, 125, 1854–1859. [Google Scholar] [CrossRef] [PubMed]
- Calniquer, G.; Khanin, M.; Ovadia, H.; Linnewiel-Hermoni, K.; Stepensky, D.; Trachtenberg, A.; Sedlov, T.; Braverman, O.; Levy, J.; Sharoni, Y. Combined Effects of Carotenoids and Polyphenols in Balancing the Response of Skin Cells to UV Irradiation. Molecules 2021, 26, 1931. [Google Scholar] [CrossRef] [PubMed]
- Fazekas, Z.; Gao, D.; Saladi, R.N.; Lu, Y.; Lebwohl, M.; Wei, H. Protective Effects of Lycopene Against Ultraviolet B-Induced Photodamage. Nutrition and Cancer 2003, 47, 181–187. [Google Scholar] [CrossRef]
- Jamaleddine, A.; Urrutigoïty, M.; Bouajila, J.; Merah, O.; Evon, P.; De Caro, P. Ecodesigned Formulations with Tomato Pomace Extracts. Cosmetics 2022, 10, 7. [Google Scholar] [CrossRef]
- Nkabinde, L.A.; Shoba-Zikhali, L.N.N.; Semete-Makokotlela, B.; Kalombo, L.; Swai, H.; Grobler, A.; Hamman, J.H. Poly (D,L-Lactide-Co-Glycolide) Nanoparticles: Uptake by Epithelial Cells and Cytotoxicity. Express Polym. Lett. 2014, 8, 197–206. [Google Scholar] [CrossRef]
- Stevanović, M.; Radulović, A.; Jordović, B.; Uskoković, D. Poly(DL-Lactide-co-Glycolide) Nanospheres for the Sustained Release of Folic Acid. Journal of Biomedical Nanotechnology 2008, 4, 349–358. [Google Scholar] [CrossRef]
- Bresciani, G.; Hofland, L.J.; Dogan, F.; Giamas, G.; Gagliano, T.; Zatelli, M.C. Evaluation of Spheroid 3D Culture Methods to Study a Pancreatic Neuroendocrine Neoplasm Cell Line. Front. Endocrinol. 2019, 10, 682. [Google Scholar] [CrossRef]
- Bolte, S.; Cordelières, F.P. A Guided Tour into Subcellular Colocalization Analysis in Light Microscopy. Journal of Microscopy 2006, 224, 213–232. [Google Scholar] [CrossRef]
- Joutsen, J.; Da Silva, A.J.; Luoto, J.C.; Budzynski, M.A.; Nylund, A.S.; De Thonel, A.; Concordet, J.-P.; Mezger, V.; Sabéran-Djoneidi, D.; Henriksson, E.; et al. Heat Shock Factor 2 Protects against Proteotoxicity by Maintaining Cell-Cell Adhesion. Cell Reports 2020, 30, 583–597.e6. [Google Scholar] [CrossRef]
- Dos Santos, R.C.; Ombredane, A.S.; Souza, J.M.T.; Vasconcelos, A.G.; Plácido, A.; Amorim, A.D.G.N.; Barbosa, E.A.; Lima, F.C.D.A.; Ropke, C.D.; Alves, M.M.M.; et al. Lycopene-Rich Extract from Red Guava ( Psidium Guajava L.) Displays Cytotoxic Effect against Human Breast Adenocarcinoma Cell Line MCF-7 via an Apoptotic-like Pathway. Food Research International 2018, 105, 184–196. [Google Scholar] [CrossRef] [PubMed]
- Lu, Y.; Cheng, D.; Niu, B.; Wang, X.; Wu, X.; Wang, A. Properties of Poly (Lactic-Co-Glycolic Acid) and Progress of Poly (Lactic-Co-Glycolic Acid)-Based Biodegradable Materials in Biomedical Research. Pharmaceuticals 2023, 16, 454. [Google Scholar] [CrossRef] [PubMed]
- Huang, W.; Zhang, C. Tuning the Size of Poly(Lactic-co-glycolic Acid) (PLGA) Nanoparticles Fabricated by Nanoprecipitation. Biotechnology Journal 2018, 13, 1700203. [Google Scholar] [CrossRef]
- Phan, H.T.; Haes, A.J. What Does Nanoparticle Stability Mean? J. Phys. Chem. C 2019, 123, 16495–16507. [Google Scholar] [CrossRef]
- Kulkarni, S.A.; Feng, S.-S. Effects of Particle Size and Surface Modification on Cellular Uptake and Biodistribution of Polymeric Nanoparticles for Drug Delivery. Pharm Res 2013, 30, 2512–2522. [Google Scholar] [CrossRef]
- Salatin, S.; Maleki Dizaj, S.; Yari Khosroushahi, A. Effect of the Surface Modification, Size, and Shape on Cellular Uptake of Nanoparticles. Cell Biology International 2015, 39, 881–890. [Google Scholar] [CrossRef]
- Cortés, H.; Hernández-Parra, H.; Bernal-Chávez, S.A.; Prado-Audelo, M.L.D.; Caballero-Florán, I.H.; Borbolla-Jiménez, F.V.; González-Torres, M.; Magaña, J.J.; Leyva-Gómez, G. Non-Ionic Surfactants for Stabilization of Polymeric Nanoparticles for Biomedical Uses. Materials 2021, 14, 3197. [Google Scholar] [CrossRef]
- Trefalt, G.; Ruiz-Cabello, F.J.M.; Borkovec, M. Interaction Forces, Heteroaggregation, and Deposition Involving Charged Colloidal Particles. J. Phys. Chem. B 2014, 118, 6346–6355. [Google Scholar] [CrossRef]
- Geng, J.; Li, K.; Qin, W.; Ma, L.; Gurzadyan, G.G.; Tang, B.Z.; Liu, B. Eccentric Loading of Fluorogen with Aggregation-Induced Emission in PLGA Matrix Increases Nanoparticle Fluorescence Quantum Yield for Targeted Cellular Imaging. Small 2013, 9, 2012–2019. [Google Scholar] [CrossRef]
- Wang, R.; Zou, L.; Yi, Z.; Zhang, Z.; Zhao, M.; Shi, S. PLGA Nanoparticles Loaded with Curcumin Produced Luminescence for Cell Bioimaging. International Journal of Pharmaceutics 2023, 639, 122944. [Google Scholar] [CrossRef] [PubMed]
- De Andrades, E.O.; Da Costa, J.M.A.R.; De Lima Neto, F.E.M.; De Araujo, A.R.; De Oliveira Silva Ribeiro, F.; Vasconcelos, A.G.; De Jesus Oliveira, A.C.; Sobrinho, J.L.S.; De Almeida, M.P.; Carvalho, A.P.; et al. Acetylated Cashew Gum and Fucan for Incorporation of Lycopene Rich Extract from Red Guava (Psidium Guajava L.) in Nanostructured Systems: Antioxidant and Antitumor Capacity. International Journal of Biological Macromolecules 2021, 191, 1026–1037. [Google Scholar] [CrossRef] [PubMed]
- Sharma, N.; Madan, P.; Lin, S. Effect of Process and Formulation Variables on the Preparation of Parenteral Paclitaxel-Loaded Biodegradable Polymeric Nanoparticles: A Co-Surfactant Study. Asian Journal of Pharmaceutical Sciences 2016, 11, 404–416. [Google Scholar] [CrossRef]
- Beg, S.; Rahman, M.; Kohli, K. Quality-by-Design Approach as a Systematic Tool for the Development of Nanopharmaceutical Products. Drug Discovery Today 2019, 24, 717–725. [Google Scholar] [CrossRef] [PubMed]
- Li, Y.; Su, J.; Liu, S.; Li, S.; Liu, S.; Zhang, H.; Ding, Z.; Wang, Z.; Liu, M.; Zhao, Y. Improved Stability and Biocompatibility of Lycopene Liposomes with Sodium Caseinate and PEG Coating. International Journal of Biological Macromolecules 2025, 311, 143685. [Google Scholar] [CrossRef] [PubMed]
- Akhoond Zardini, A.; Mohebbi, M.; Farhoosh, R.; Bolurian, S. Production and Characterization of Nanostructured Lipid Carriers and Solid Lipid Nanoparticles Containing Lycopene for Food Fortification. J Food Sci Technol 2018, 55, 287–298. [Google Scholar] [CrossRef] [PubMed]
- De Nardo, T.; Shiroma-Kian, C.; Halim, Y.; Francis, D.; Rodriguez-Saona, L.E. Rapid and Simultaneous Determination of Lycopene and β-Carotene Contents in Tomato Juice by Infrared Spectroscopy. J. Agric. Food Chem. 2009, 57, 1105–1112. [Google Scholar] [CrossRef]
- Rehman, A.; Tong, Q.; Jafari, S.M.; Assadpour, E.; Shehzad, Q.; Aadil, R.M.; Iqbal, M.W.; Rashed, M.M.A.; Mushtaq, B.S.; Ashraf, W. Carotenoid-Loaded Nanocarriers: A Comprehensive Review. Advances in Colloid and Interface Science 2020, 275, 102048. [Google Scholar] [CrossRef]
- Arshad, M.T.; Maqsood, S.; Ikram, A.; Khan, A.A.; Raza, A.; Ahmad, A.; Gnedeka, K.T. Encapsulation Techniques of Carotenoids and Their Multifunctional Applications in Food and Health: An Overview. Food Science & Nutrition 2025, 13, e70310. [Google Scholar] [CrossRef]
- Hamed, D.; Keddari, S.; Boufadi, M.Y.; Bessad, L. Lycopene Purification with DMSO Anti-Solvent: Optimization Using Box-Behnken’s Experimental Design and Evaluation of the Synergic Effect between Lycopene and Ammi Visnaga. L Essential Oil. Chem. Pap. 2022, 76, 6335–6347. [Google Scholar] [CrossRef]
- Sukmawati, A.; Utami, W.; Yuliani, R.; Da’i, M.; Nafarin, A. Effect of Tween 80 on Nanoparticle Preparation of Modified Chitosan for Targeted Delivery of Combination Doxorubicin and Curcumin Analogue. IOP Conf. Ser.: Mater. Sci. Eng. 2018, 311, 012024. [Google Scholar] [CrossRef]
- Misir, J.; Kassama, L. Nanoencapsulation of Lycopene by PLGA: Effect on Physicochemical Properties and Extended-Release Kinetics in a Simulated GIT System. LWT 2025, 225, 117747. [Google Scholar] [CrossRef]
- Makou, N.B.; Javadi, A.; Anarjan, N.; Torbati, M. Simultaneous Extraction and Nanoemulsification of Lycopene from Tomato Waste: Optimization and Stability Studies of Lycopene Nanoemulsions in Selected Food System. Food Measure 2024, 18, 9671–9683. [Google Scholar] [CrossRef]
- İnanç Horuz, T.; Belibağlı, K.B. Nanoencapsulation by Electrospinning to Improve Stability and Water Solubility of Carotenoids Extracted from Tomato Peels. Food Chemistry 2018, 268, 86–93. [Google Scholar] [CrossRef]
- Wang, Y.; Lv, J.; Li, C.; Xu, Y.; Jin, F.; Wang, F. Walnut Protein Isolate-Epigallocatechin Gallate Nanoparticles: A Functional Carrier Enhanced Stability and Antioxidant Activity of Lycopene. Food Research International 2024, 189, 114536. [Google Scholar] [CrossRef]
- Salvioni, L.; Morelli, L.; Ochoa, E.; Labra, M.; Fiandra, L.; Palugan, L.; Prosperi, D.; Colombo, M. The Emerging Role of Nanotechnology in Skincare. Advances in Colloid and Interface Science 2021, 293, 102437. [Google Scholar] [CrossRef]
- Lee, O.; Jeong, S.H.; Shin, W.U.; Lee, G.; Oh, C.; Son, S.W. Influence of Surface Charge of Gold Nanorods on Skin Penetration. Skin Research and Technology 2013, 19. [Google Scholar] [CrossRef]
- Baldassarre, F.; Allegretti, C.; Tessaro, D.; Carata, E.; Citti, C.; Vergaro, V.; Nobile, C.; Cannazza, G.; D’Arrigo, P.; Mele, A.; et al. Biocatalytic Synthesis of Phospholipids and Their Application as Coating Agents for CaCO3 Nano–Crystals: Characterization and Intracellular Localization Analysis. ChemistrySelect 2016, 1, 6507–6514. [Google Scholar] [CrossRef]
- Zhang, D.; Jiang, Y.; Xiang, M.; Wu, F.; Sun, M.; Du, X.; Chen, L. Biocompatible Polyelectrolyte Complex Nanoparticles for Lycopene Encapsulation Attenuate Oxidative Stress-Induced Cell Damage. Front. Nutr. 2022, 9, 902208. [Google Scholar] [CrossRef] [PubMed]
Figure 1.
HPLC chromatograms (λ = 472 nm) of Lyc standard and TP extract in ethyl acetate.
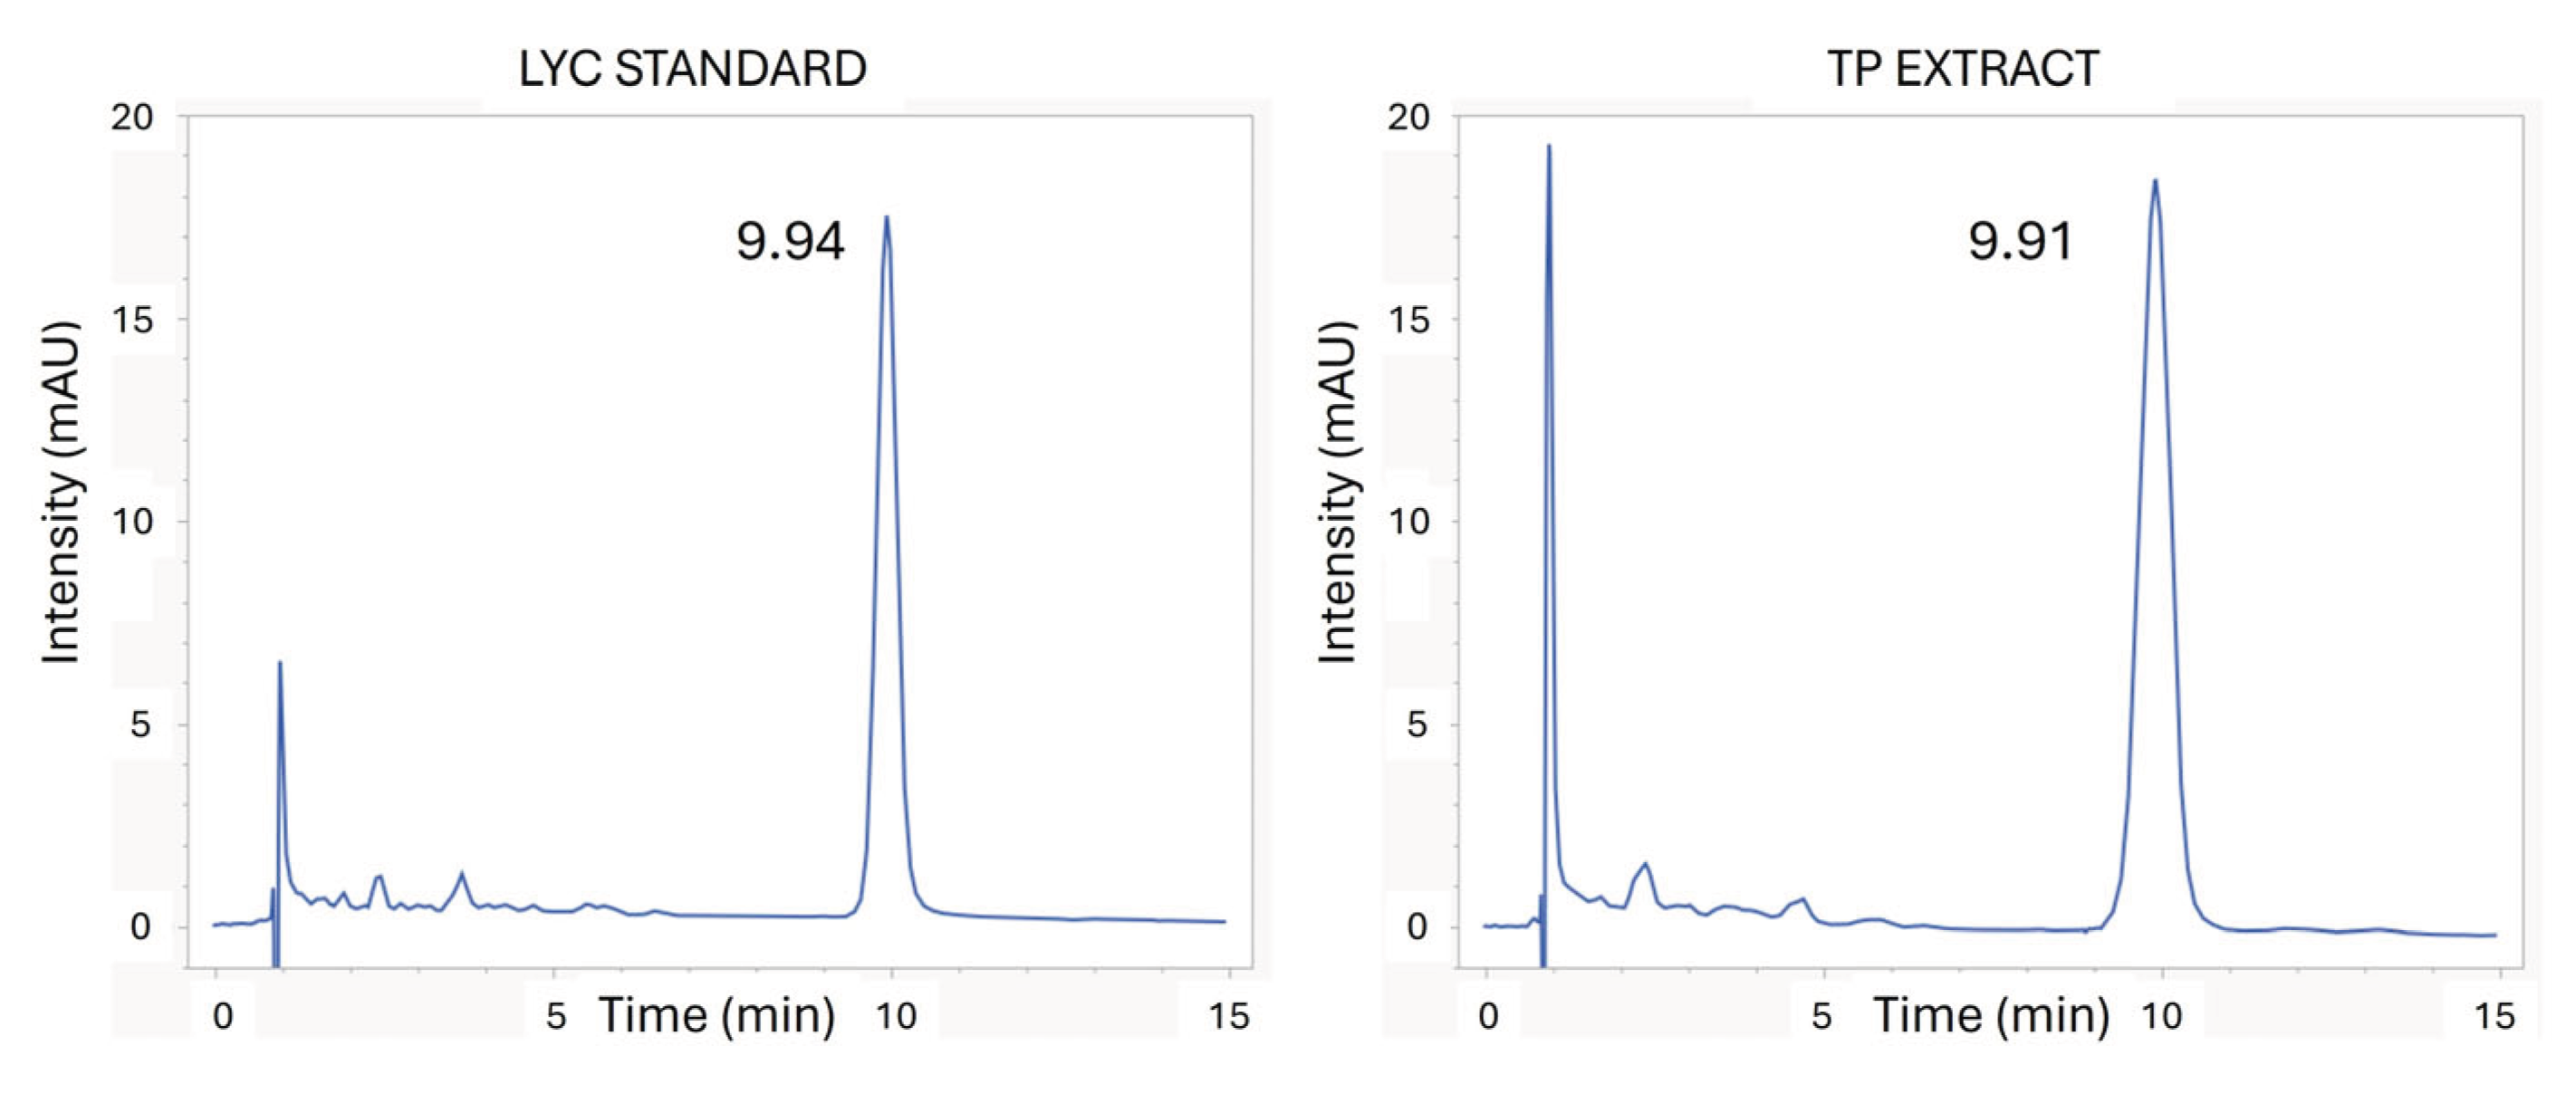
Figure 2.
UV-vis spectrum of TP extract and Lyc standard in ethyl acetate.
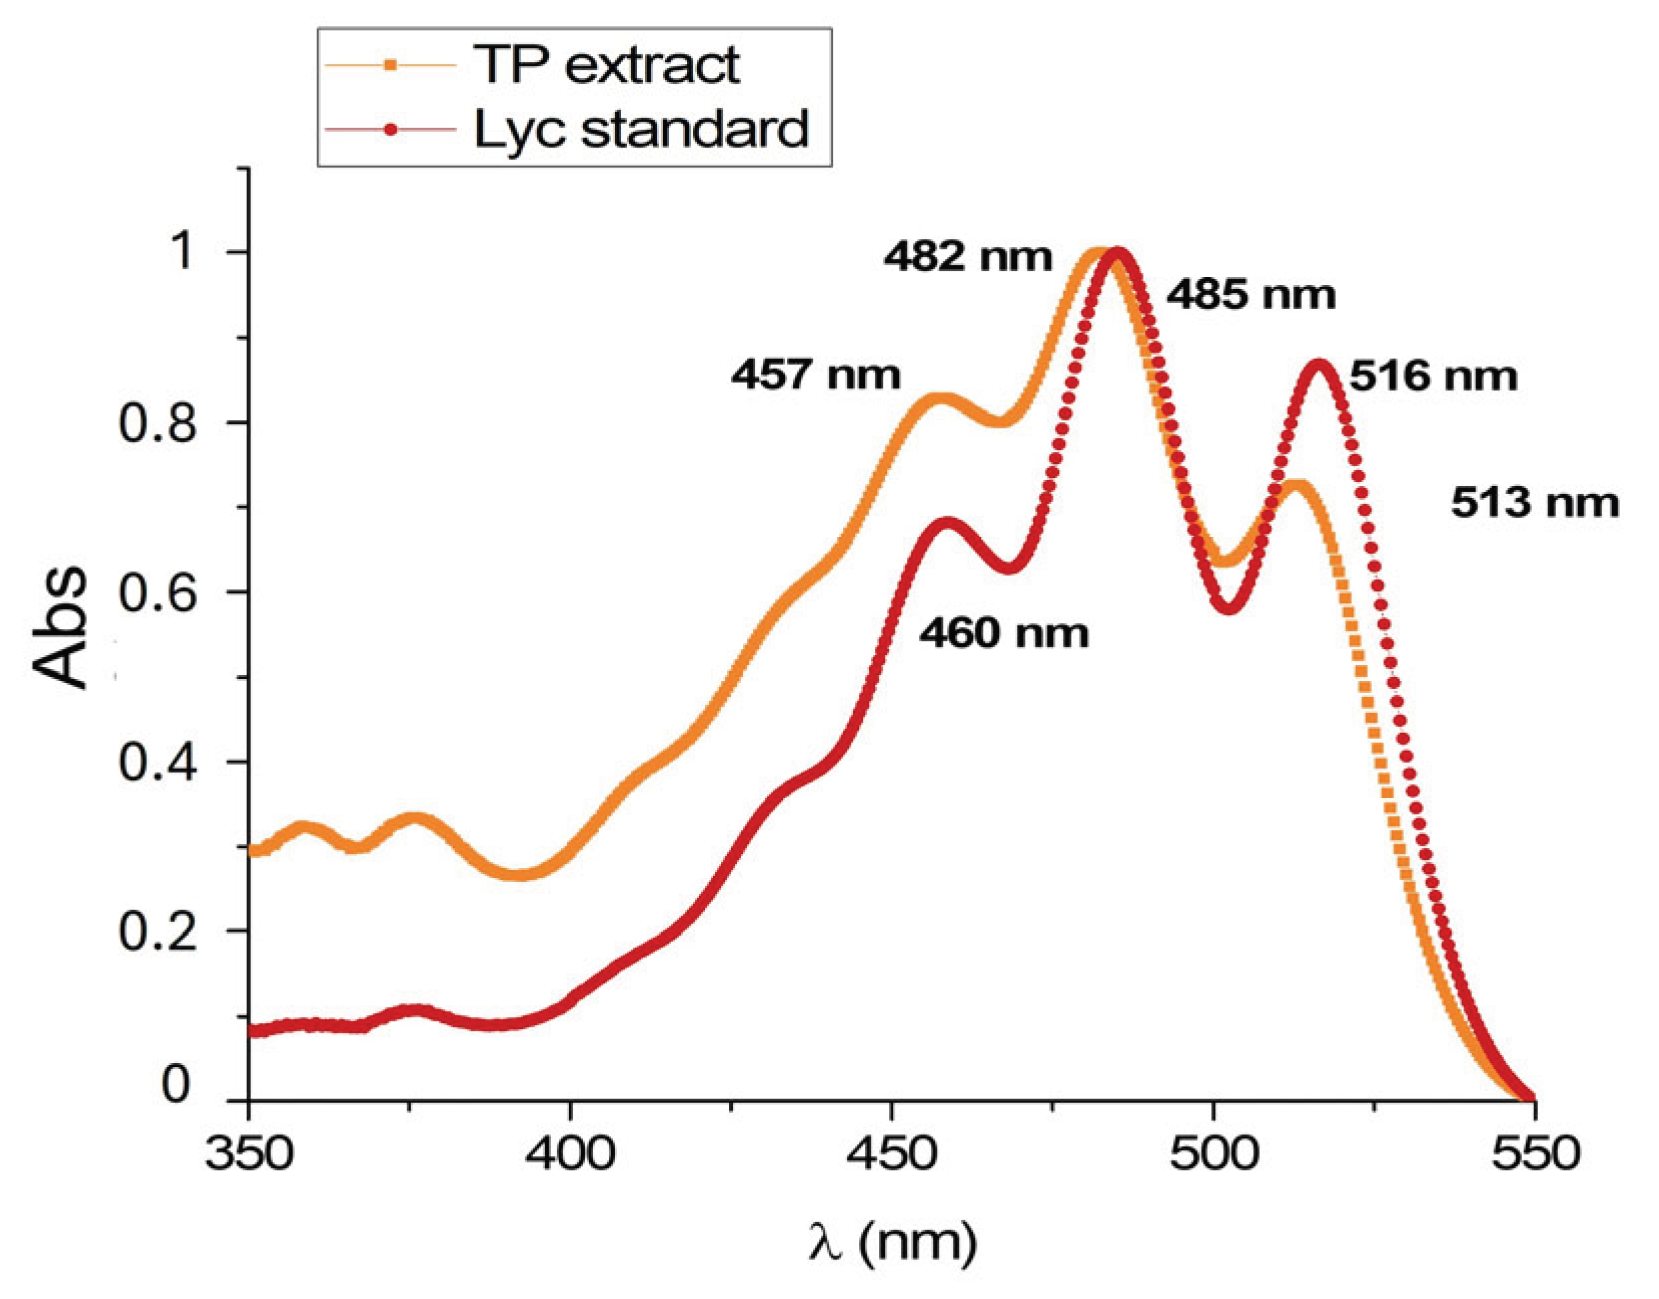
Figure 3.
Representative SEM images at different magnifications of single particle, for (A) Lyc@PLGA@PVA-NPs and (B) Lyc@PLGA@ Tween 20 -NPs.
Figure 3.
Representative SEM images at different magnifications of single particle, for (A) Lyc@PLGA@PVA-NPs and (B) Lyc@PLGA@ Tween 20 -NPs.
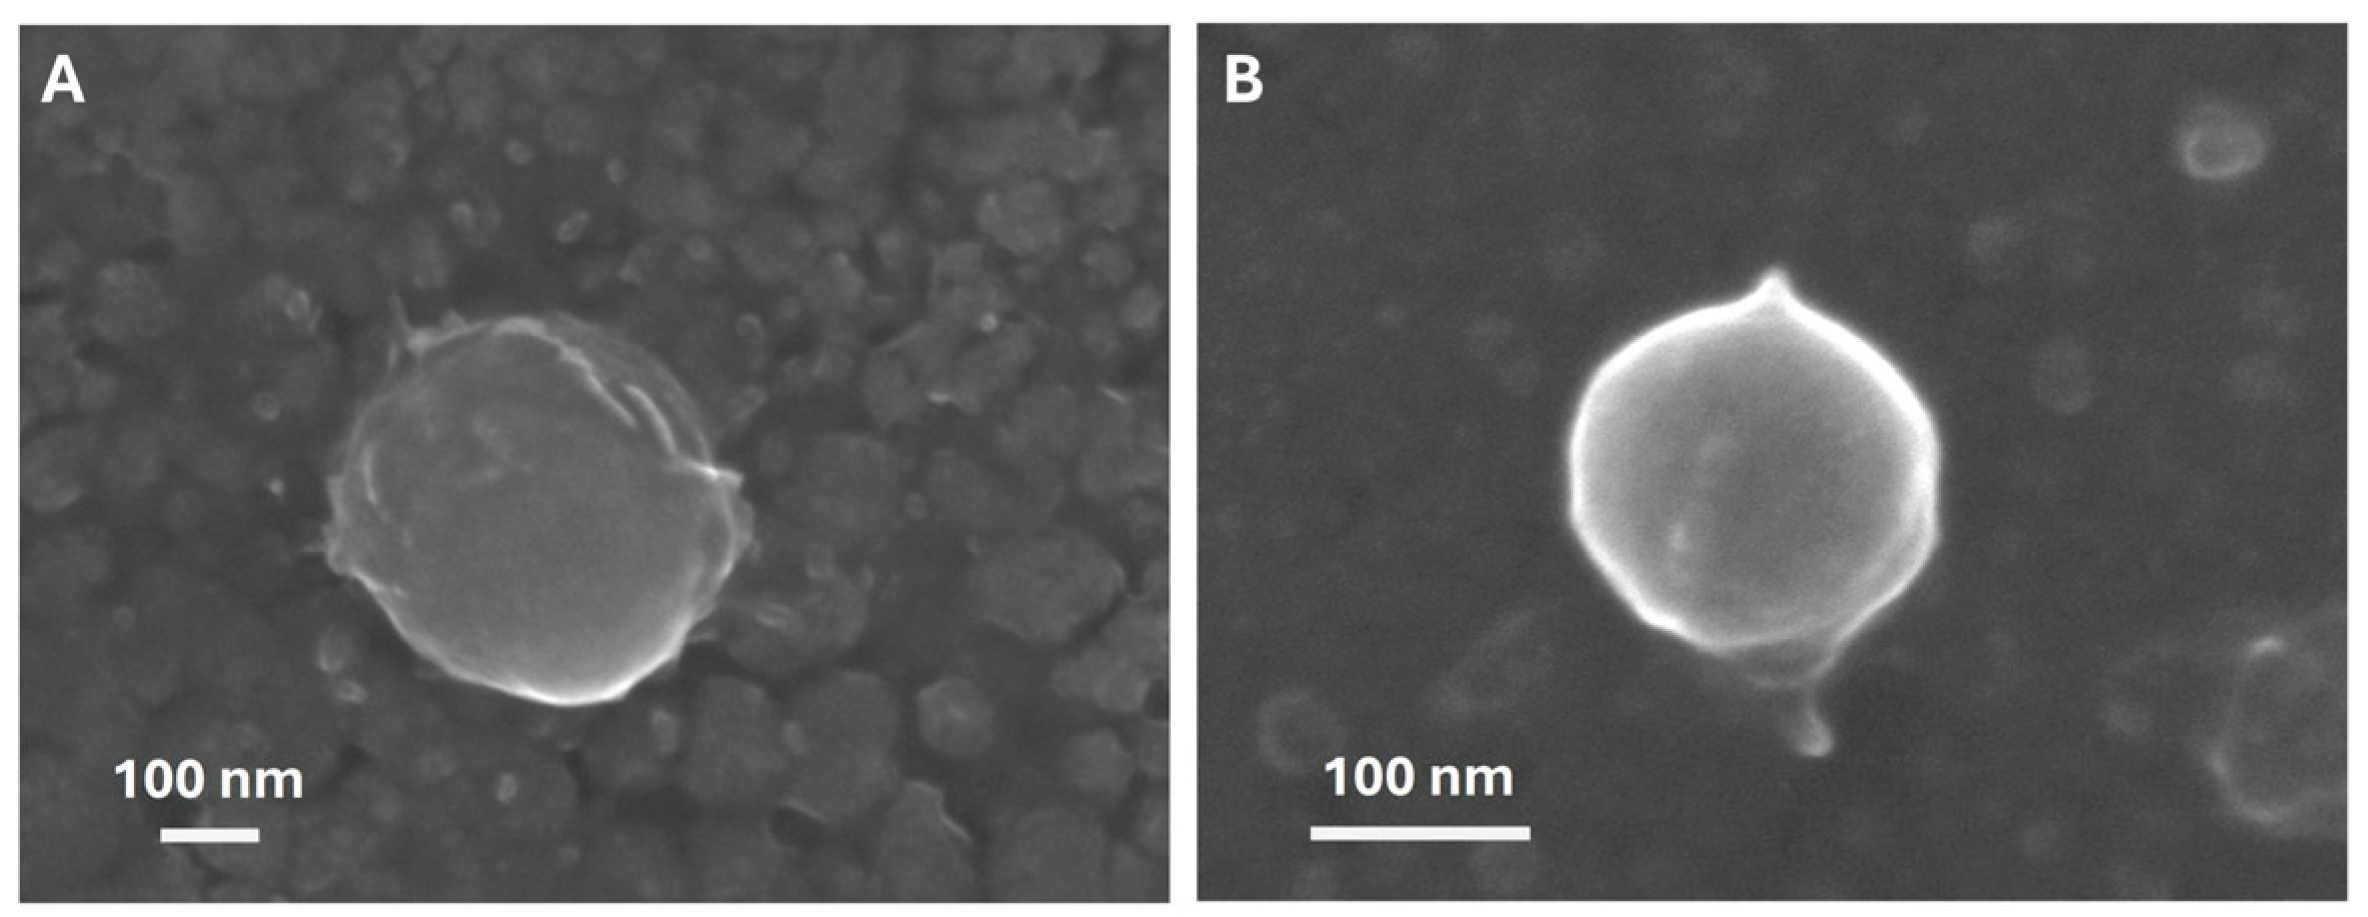
Figure 4.
FT-IR spectra of (A) Lyc@PLGA@PVA-NPs, (B) Lyc@PLGA@Tween20-NPs, (C) PLGA and (D) TP extract (in ethyl acetate).
Figure 4.
FT-IR spectra of (A) Lyc@PLGA@PVA-NPs, (B) Lyc@PLGA@Tween20-NPs, (C) PLGA and (D) TP extract (in ethyl acetate).
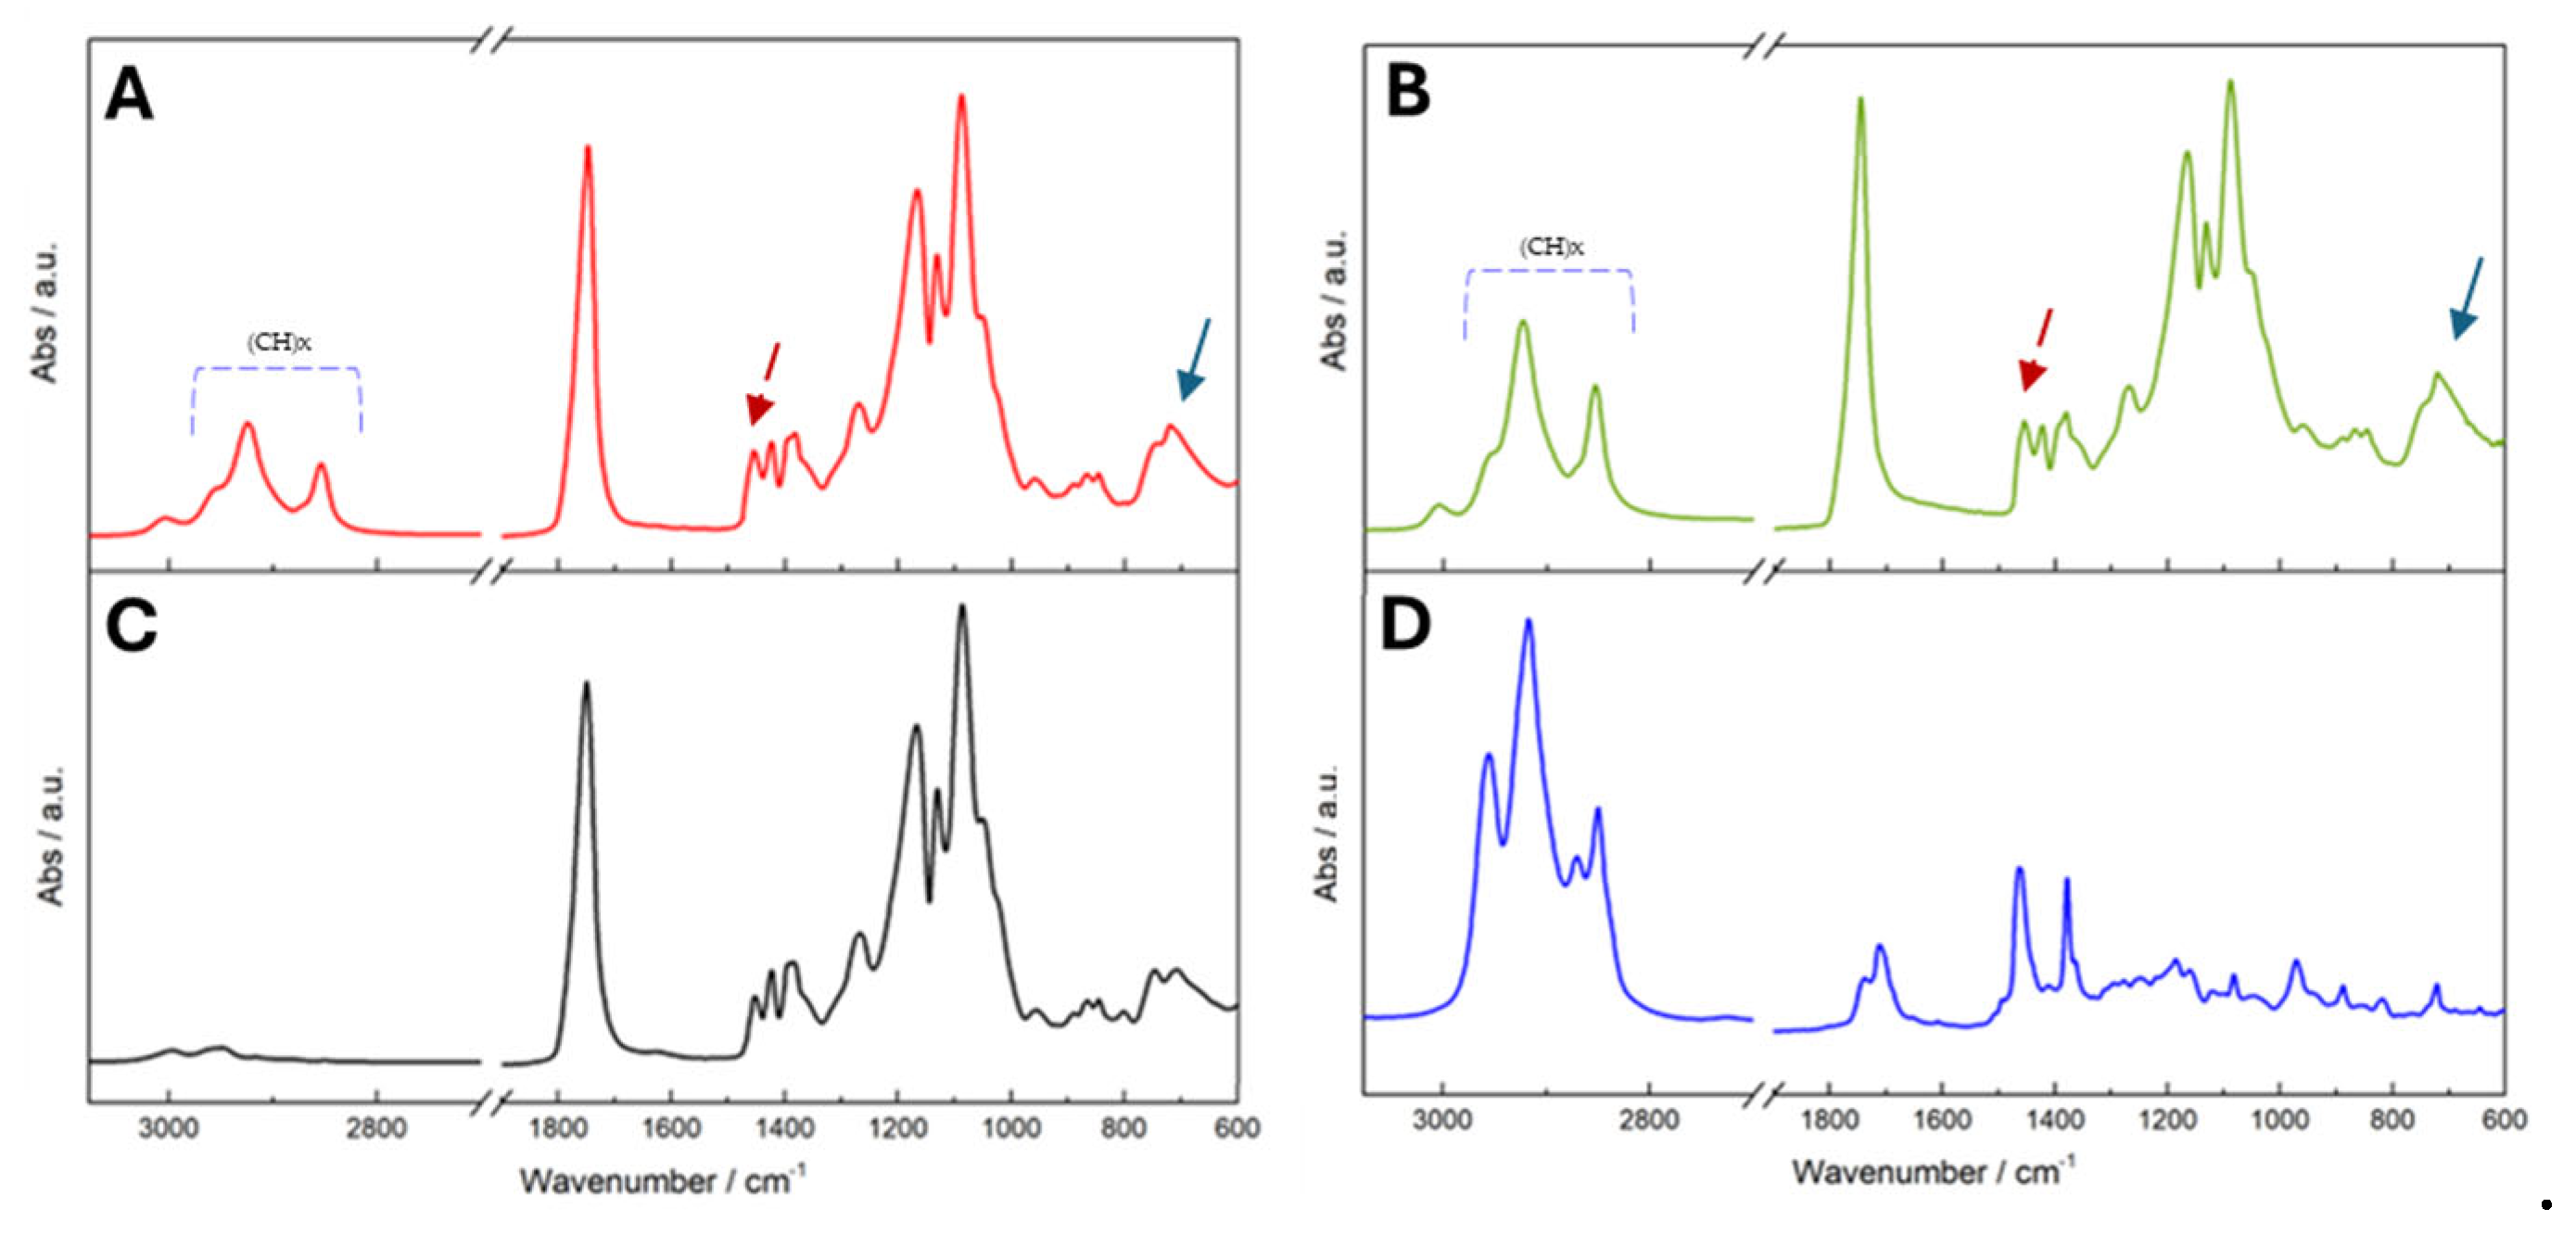
Figure 5.
(A) Lyc retention index % and (B) scavenging activity retention rate % of freeze-dried Lyc@PLGA@PVA-NPs and Lyc@PLGA@Tween20-NPs over time, stored at 4°C.
Figure 5.
(A) Lyc retention index % and (B) scavenging activity retention rate % of freeze-dried Lyc@PLGA@PVA-NPs and Lyc@PLGA@Tween20-NPs over time, stored at 4°C.
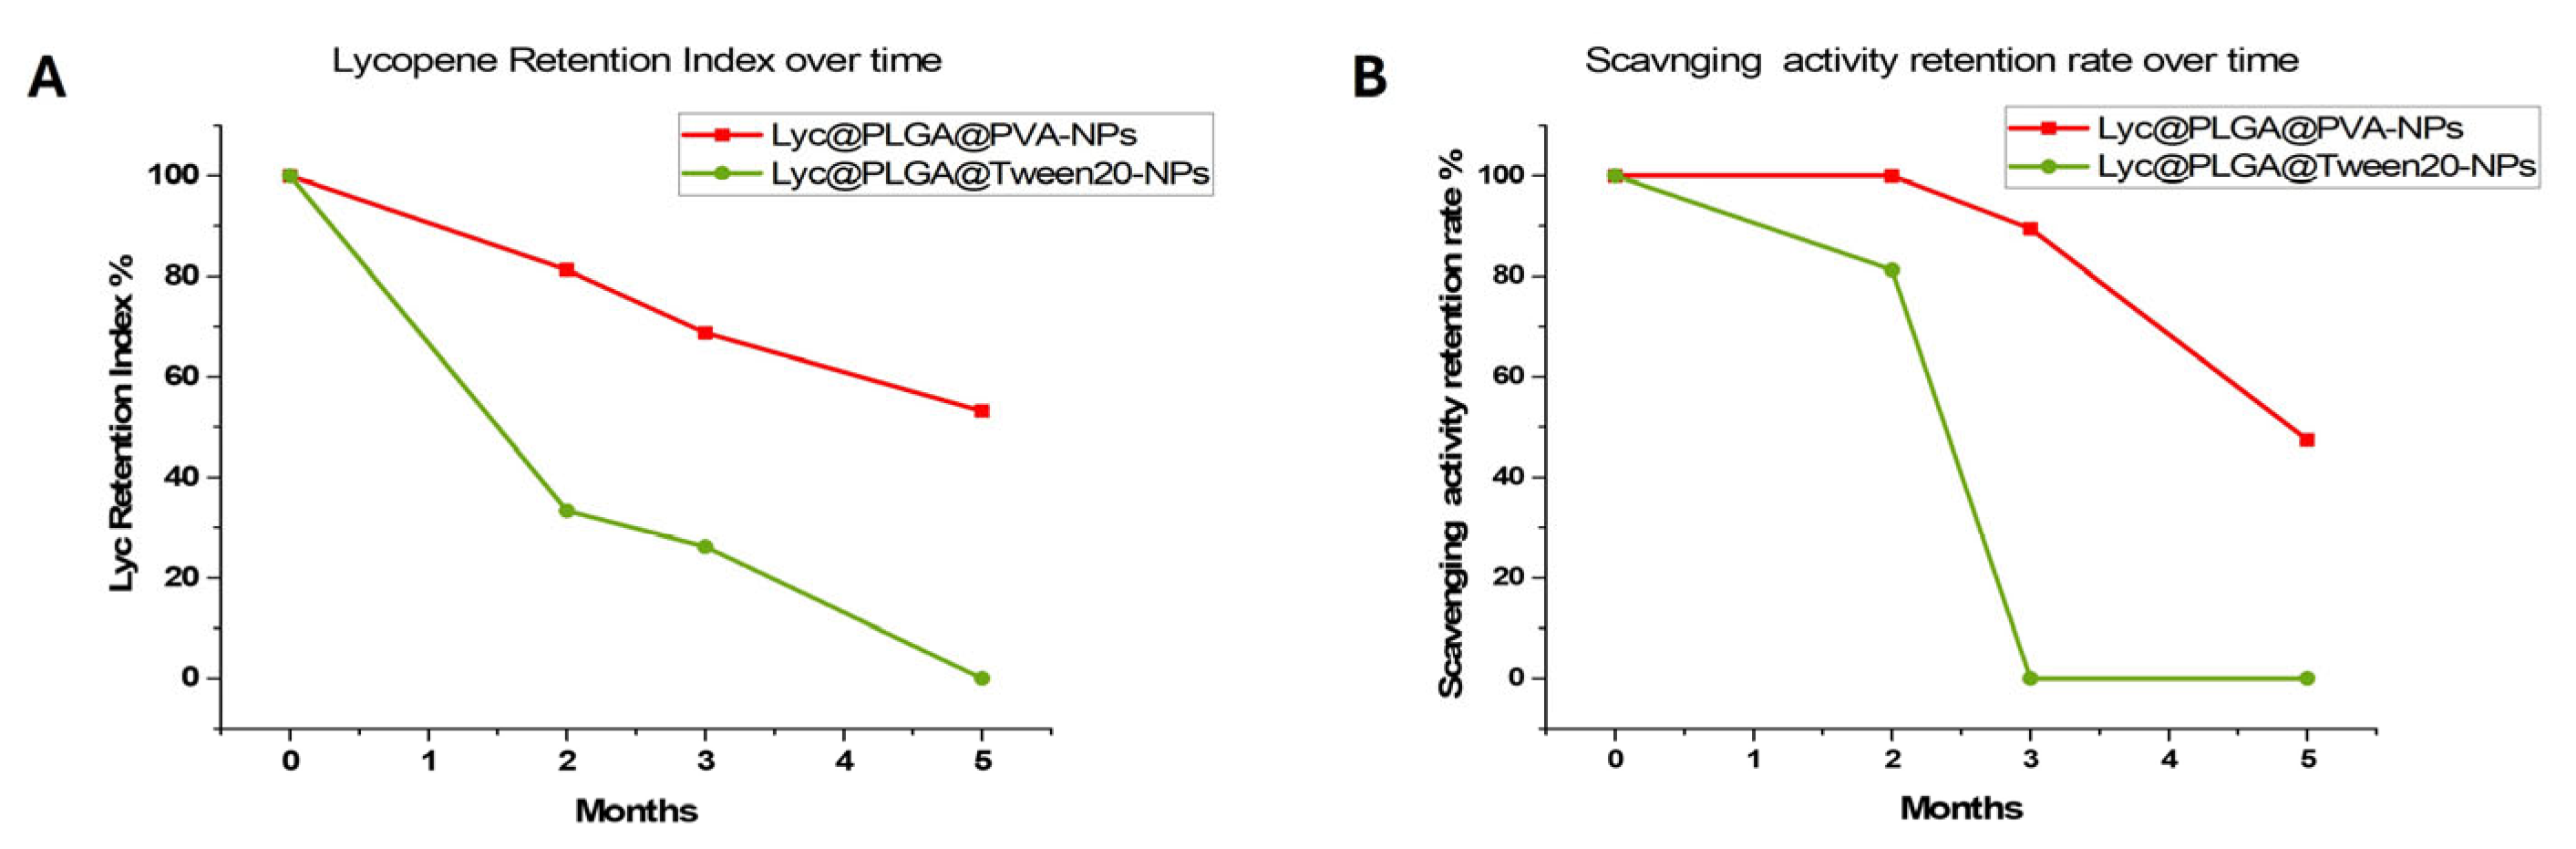
Figure 6.
Uptake of Lyc@PLGA@PVA-NPs and Lyc@PLGA@Tween20-NPs in HaCaT and SK-MEL-2 spheroids by confocal imaging. On the left, intensity fluorescence (normalized for spheroids volume) measured after 3 and 24h of treatment. Data have been reported as mean ± SD of 3 spheroids for each condition, analyzing 30 z stacks. Statistically significant value (∗) P ≤ 0.05 versus Lyc@PLGA@PVA-NPs 24 h-treatment, from the t-test. On the right, representative images of HaCaT and SK-MEL-2 spheroids after 24 h of treatment with Lyc@PLGA@PVA-NPs (A and C) and Lyc@PLGA@Tween 20-NPs (B and D); in green emitted fluorescence of Lyc (λ exc. = 488 nm) and in blue are cells nuclei stained with DAPI (λ exc. = 405 nm).
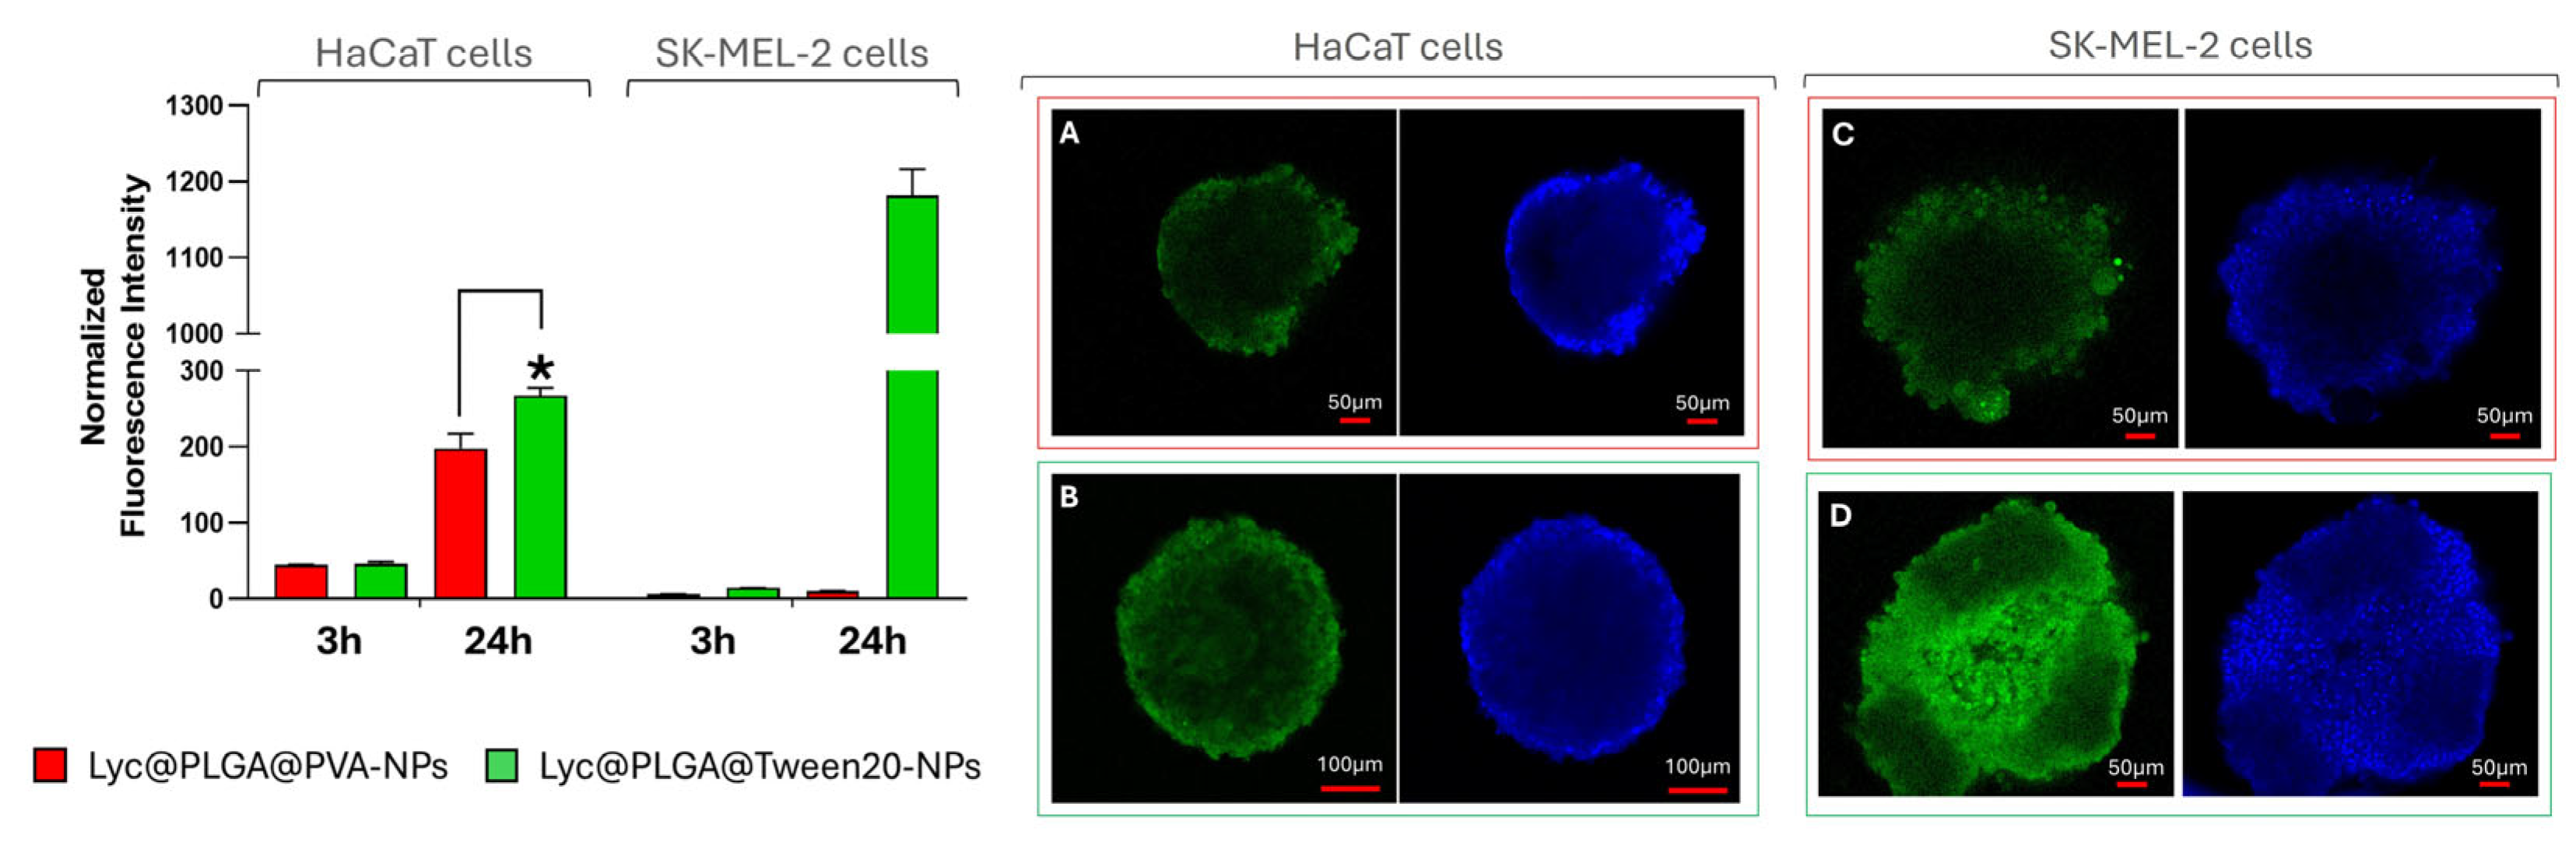
Figure 7.
ROS production percentages in HaCaT and SK-MEL-2 2D culture (A) and HaCaT and SK-MEL-2 spheroids (B), reporting negative control as untreated condition (blue histograms), positive control as treatment with only H2O2 (light blue histograms), treated conditions as treatment with NPs and H2O2 (red and green histograms). A) Data have been reported as mean ± SD of 3 experiments; B) Data have been reported as mean ± SD of 3 experiments, in which 12 spheroids were used for each condition. Statistically significant value (∗) P ≤ 0.05 and (∗∗) P ≤ 0.5 are versus not treated condition (blue histograms), from the t-test.
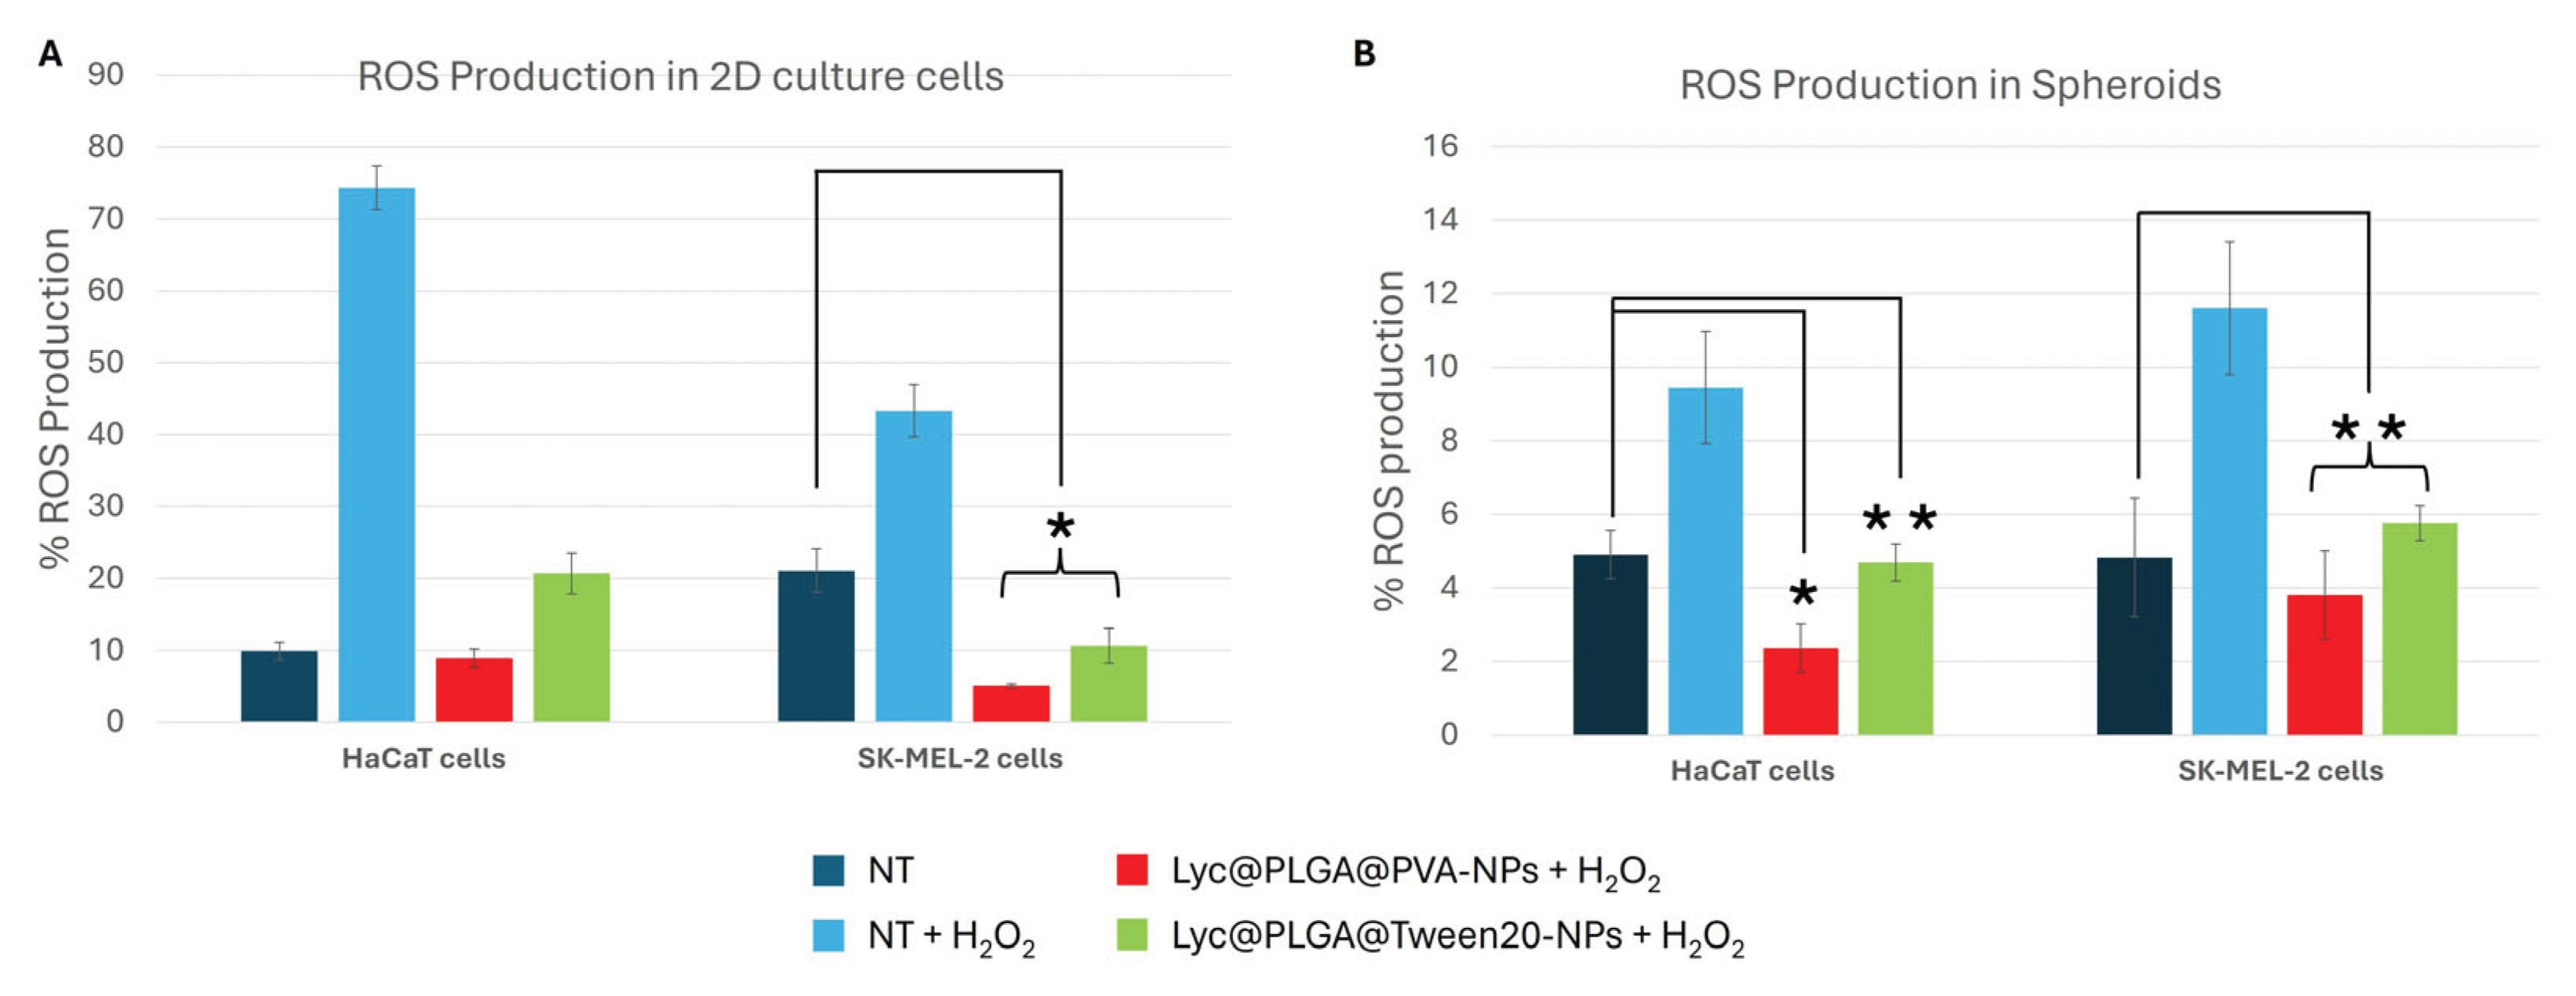

Table 1.
DLS parameters measured on diluted Lyc@PLGA-NPs suspensions in filtered distilled water (0.45μm).
Table 1.
DLS parameters measured on diluted Lyc@PLGA-NPs suspensions in filtered distilled water (0.45μm).
| Sample | ζ-potential (mV)1 | Z-average (nm)2 | PdI3 |
|---|---|---|---|
| Lyc@PLGA@PVA-NPs | -28.6±1.15 | 393.5±25.19 | 0.44±0.021 |
| Lyc@PLGA@Tween20-NPs | -43.6±1.47 | 177.6±8 | 0.4±0.016 |
Disclaimer/Publisher’s Note: The statements, opinions and data contained in all publications are solely those of the individual author(s) and contributor(s) and not of MDPI and/or the editor(s). MDPI and/or the editor(s) disclaim responsibility for any injury to people or property resulting from any ideas, methods, instructions or products referred to in the content. |
© 2025 by the authors. Licensee MDPI, Basel, Switzerland. This article is an open access article distributed under the terms and conditions of the Creative Commons Attribution (CC BY) license (http://creativecommons.org/licenses/by/4.0/).
Copyright: This open access article is published under a Creative Commons CC BY 4.0 license, which permit the free download, distribution, and reuse, provided that the author and preprint are cited in any reuse.


