
Submitted:
09 December 2025
Posted:
11 December 2025
You are already at the latest version
Abstract
Biodiversity is an essential natural resource providing raw material for evolution by natural selection. Bottleneck and founder effects lead to the lack of genetic variation and, in turn, a decreased adaptive potential and elevated risk of extinction. One of the mechanisms maintaining genetic diversity and phenotypic variation to avoid loss of heterozygosity is the acquiring of new genetic material via gene duplication. It can result from small-scale events like unequal crossing over, retroposition, or large-scale whole genome duplication (WGD). New transcriptomic patterns in polyploids lead to transcriptomic and phenotypic novelty that can facilitate increased adaptability under environmental changes. Despite the great genetic diversity potentially generated by WGD and further genome reorganization, only a few WGD events are evolutionary ‘successful.’ Macrostomum lignano, a free-living marine flatworm, is one of the astonishingly successful neopolyploid species. We uncovered the hidden polyploidy of its genome masked with intensive karyotype reorganization. The M. lignano genome consists of three subgenomes that emerged due to the formation of a large fused chromosome and its variants and maintained their heterozygosity through chromosomal rearrangements. In this study, we sought to unveil differences in gene expression and phenotypic variation among euploid and aneuploid worms of M. lignano, being hidden tetra- and hexaploids, respectively.
Keywords:
flatworms
; aneuploidy
; polyploidy
; whole-genome duplication
; differentially expressed gene
; transcriptome
; gene expression
; subgenomic organization
; trans-effects
1. Introduction
Biodiversity is an essential for biological evolution; it provides raw material for evolution through natural selection. Genome, transcriptome, and proteome diversity are necessary to be investigated and described in biodiversity studies. Genetic diversity is crucial for species adaptation to existing and new environmental challenges. Species with low genetic diversity have a low adaptive potential and a limited ability for successful response to natural selection and therefore face reduced chances of survival in new environments [1,2]. Adaptive (phenotypic) plasticity can be provided at the post-genomic level via formation of transcriptomic and proteomic diversity, for instance including epigenetics or alternative splicing [3,4]. Adaptive potential and a species-specific ability to evolve depend mostly on the level of the species’ genetic diversity, and the latter largely determines the species’ perspectives for future evolution.
Preservation of genetic diversity is essential for the long-term existence of populations. However, some factors, such as inbreeding, could result in a lack of genetic variation and, in turn, a decreased adaptive potential and elevated risk of extinction. On the other side, there are mechanisms maintaining genetic diversity and preserving phenotypic variation even despite the negative effect of inbreeding. Such mechanisms are of pivotal biological significance because the bottleneck and founder effect are often crucial in the evolution of the species. Maintenance and promotion of genetic diversity after population decline are crucial for population survival and further successful adaptation to new circumstances.
A high level of genetic heterozygosity is essential for sustaining diversity in large natural populations. What kind of genome organization and its manifestation facilitate preservation of biodiversity in inbred groups of animals or in a population decline? Limited recombination in the regions containing different gene variants could preserve the heterozygosity. Such mechanism to sustain heterozygosity was found in some species, for instance, the asexual nematode Diploscapter pachys [5], the flatworms Macrostomum lignano [6], and Schmidtea mediterranea [7].
Another way to avoid loss of heterozygosity is the acquiring of new genetic material that potentially can also serve as a new platform for the emergence of genetic novelty in evolution. Gene duplication is one of the major evolutionary forces [8]. It can result from small-scale events like unequal crossing over [9], retroposition [10], or the whole genome duplication (WGD) [11]. Considering the evolutionary fates of the duplicated gene copies, we should list pseudogenization (or loss), sub- and neofunctionalization [12]. Paralogs characterized by only small differences are similar to gene alleles but they cannot be lost in result of inbreeding. The WGD is more dramatic in comparison with gene duplication: a polyploid genome is often highly dynamic and is subject to numerous changes [13]. Furthermore, polyploids could exhibit wide variation in phenotypes that are not found in their diploid ancestors [14]. Moreover, new transcriptomic patterns in polyploid species could differ from the ones of their diploid ancestor(s), leading to transcriptomic and phenotypic novelty [15]. In plants, comparison of gene expression in di- and polyploid species revealed considerable differences, resulting in overall new phenotypic traits in polyploids. For instance, plants have achieved enhanced tolerance to stress conditions such as drought, salinity, and extreme temperatures through genome buffering, increased flexibility of gene expression, and epigenetic modifications [16]. The increased adaptability is considered an evolutionary advantage under environmental changes. For instance, the increased endopolyploidy in plant tissues under stress enables resilience and recovery through cellular redundancy and genomic plasticity [17].
The consequences of the WGD are complex and can differ among different species. Despite the great genetic diversity, which can be generated by the WGD and further genome reorganization, only a few WGD events are evolutionary ‘successful.’ The contemporary successful polyploids are only a small part of the arisen polyploid forms and observed their phenotypic variation had the advantageous traits to be favored for selection of the existing polyploid form among many other unobserved or extinct variants [14]. The studies of modern neopolyploids are essential for understanding the underpinning the reasons for their evolutionary success.
Macrostomum lignano, a free-living marine flatworm, is one of the astonishing neopolyploid ‘successful’ species. It has served as an exciting model organism for studies on numerous biological processes and mechanisms of development, regeneration, aging, sex allocation, bio-adhesion, karyotype evolution, etc. [18,19,20,21,22,23,24,25,26].
We uncovered the hidden polyploidy of the M. lignano genome masked with intensive karyotype reorganization after the recent WGD [23,27,28,29,30,31]. The karyotype of M. lignano consists of four chromosome pairs [30]; one pair consists of the large chromosomes (chromosome L), while the others are three pairs of small metacentrics (chromosomes S). The chromosome L contains highly homologous paralogous regions to nearly all regions of the S chromosomes [6,28,29] indicated that cytogenetic rediploidization after WGD included the fusions of small ancestral chromosomes into the large one followed by its intensive rearrangements. Furthermore, the chromosome rearrangements led to differentiation and genetically isolation of the L chromosome copies (L1 and L2). In result, nearly all the M. lignano genes from the specimens of the inbred DV1 line have three paralogs; two of them were encoded with genes located in the different two copies of the L chromosome while one was encoded with gene of located in the S chromosome. It allowed isolating in the M. lignano genome three subgenomes. Two of them associated with copies of the L chromosome (L1 and L2) are haploid ones while the highly homozygous subgenomes associated with S chromosomes is the diploid one. Such unusual genome organization (SSL1L2) facilitated preservation of the high genetic diversity in M. lignano, even in highly inbred laboratory line DV1 [6].
In the previous study we obtained from the euploid worms (2n=8; SSL1L2) of the DV1 line laboratory sublines of the worms with two additional copies of the large chromosome (2n=10; SSL1L1L2L2) [6]. Formally, worms of these sublines are aneuploids but it would more corrected to consider them as hidden hexaploids are hidden while euploid worms (2n=8; SSL1L2) are hidden tetraploids. In the present study, we sought to unveil differences in gene expression and phenotypic variation among eu- and aneuploid worms of M. lignano, being hidden tetra- and hexaploids, respectively.
2. Materials and Methods
Study organism
The commonly used inbred line of M. lignano, DV1 has been established via full-sib and half-sib inbreeding for 24 generations [32] and then was maintained under standard laboratory conditions [21] at small population sizes for a high level of genetic homozygosity. For the few years, the inbred DV1 line was regularly karyotyped and a high karyotype instability associated with the variable copy number of the largest chromosomes was revealed [24,28,29]. Previously we established purebred sublines with two different karyotypes, namely: (i) the species-specific 2n = 8 karyotype of M. lignano; (ii) the 2n = 10 karyotype with four copies of the largest chromosome. The obtained sublines were characterized with the stable karyotype. The experimental design was described earlier [6]. Briefly, we chose three out of five worm pools for each subline, DV1_8 and DV1_10 (DV1_8A, DV1_8C, DV1_8E, and DV1_10A, DV1_10C, DV1_10E, respectively) [6] according the data on reproduction, mortality, morphology, and/or behavior abnormality. We generated two replicate libraries for whole-genome sequencing from each of the selected pool; each library was generated from 60 worms.
RNA extraction, library preparation and RNA-sequencing
Total RNA extracted from pooled worm using PureZOL (Bio-Rad, США) according to the manufacturer’s instructions. The samples were treated with DNase I (New England Biolabs, USA) to eliminate DNA contamination. The total RNA was purified on Agencourt RNAClean XP beads (Beckman Coulter, Germany). Quantity of each sample was assessed by means Qubit 2.0 (Life Technologies, USA).
RNA-seq libraries were prepared in accordance with New England Biolab protocols. Briefly, polyA-tailed mRNA was purified from 300 ng of total RNA using the NEBNext Poly(A) mRNA Magnetic Isolation Module (New England Biolabs, USA, E7490S). Then, directional cDNA libraries were generated by means of the NEBNext Ultra II Directional RNA Library Prep Kit for Illumina (New England Biolabs, USA). following the manufacturer’s recommendations, and index codes were added to attribute sequences to each sample. The clustering of the index-coded samples was performed on a cBot Cluster Generation System using TruSeq PE Cluster Kit v4-cBot-HS (Illumina, USA) according to the manufacturer’s instructions. After cluster generation, the library preparations were sequenced on an Illumina HiSeq 2500 platform, and paired-end reads were generated. Library quality was assessed on the Agilent Bioanalyzer 2100 system (Agilent Technologies, Inc., USA).
Alignment and assembly of RNA-seq data and update of the reference gene annotation
The bulk RNA-seq data obtained during the project (the entire dataset, approximately 240 million paired reads) were used to create an expanded gene annotation of the M. lignano reference genome assembly. The main goals to be achieved by creating an updated M. lignano transcriptome annotation were that all obtained transcripts should be present in the assembly and all gene paralogs should be annotated. RNAseq data were preprocessed by cutadapt to remove adapters and SL exons and aligned to the existing M. lignano reference genome assembly version Mlig_3_7 (GCA_002269645.1) using the STAR mapping v.2.7.9a two-mapping strategy [33]. To generate the annotation, genome-guided transcriptome assemblies were obtained from mapped RNAseq data (StringTie v2.1.7b, PsiCLASS v1.0.3, and TransMeta v.1.0), and reliable splice sites were annotated using Portcullis v1.2.4 [34] on the reference genome. Furthermore, using minimap v.2.24-r1122, mRNAs and CDSs from the reference annotation Mlig_3_7 (macrostomum_lignano.PRJNA371498.WBPS14.annotations.gff3) were remapped with multiple matches allowed. The obtained data were integrated into a consensus gene annotation using Mikado v2.3.4 [35] with the original Mlig_3_7 annotation set as reference and filtering parameters optimized for flatworms.
The resulting and original reference annotations were compared using gffcompare v0.10.5 [36]. As a result, 48,604 of the 63,161 genes in the new annotation shared a common location with the Mlig_3_7 reference genes. Thus, the update to the M. lignano gene annotation significantly expands the gene set, primarily by annotating additional paralogs in duplicated regions. Functional annotation of the obtained gene models was carried out using the EnTAP v2.1.0 pipeline based on homology in the Uniprot:UniRef90 proteins database (https://www.uniprot.org/help/uniref) and the output of the InterProScan v.5.61-93.0 program. Clustering of highly homologous paralogs was performed using CD-HIT with additional post-processing of clusters to collapse gene overlaps.
DEG analysis
The updated gene annotation was used for identification of differentially expressed genes (DEGs) between groups of intact worms from the DV1_8 and DV1_10 sublines, characterized by different numbers of copies of large chromosome 1 (two and four copies, respectively).
We previously detected that the reference genome Mlig_3_7 contains quite a lot of copy number errors and chimeric sequences, mainly collapsed haplovariants, which are associated with difficulties in resolving highly homologous regions in the three subgenomes L1, L2, and S. Accordingly, the assessment of gene copy number using the existing version of the reference genome assembly of M. lignano, Mlig_3_7, turns out to be not entirely correct. In this case, the solution is to simultaneously sequence the genome (WGS) and transcriptome (RNA-seq) of each sample, which will allow the copy number of a gene to be taken into account when assessing its differential expression. WGS data from [6] were aligned to the reference genome using bowtie2 v2.4.4. Tables of read counts were produced with featureCounts command of the Subread package with the following parameters: “-M -Q 0 –O –p --countReadPairs –t gene” for WGS data and “-M –Q 0 –s 2 –p –countReadPairs –t exon” for RNA-seq data. Exonic content of genes was counted for RNA-seq libraries, and whole gene body was counted for low-pass WGS data; if gene was shorter than 10 Kb, it was expanded in both directions to this minimal length. Further processing and ctatistical analysis of differential gene expression was performed in R environment with Genomic Ranges and DESeq2 packages. Additionally, the ratio of WGS coverage between the DV1_8 (SSL1L2) and DV1_10 (SSL1L1L2L2) was used to assign the detected genes to the subgenomes S and L1/L2 using fixed tresholds: cr >= 1.375 for S and cr <= 1.125 for L1/L2.
WGS data were used to create gene-level matrix of size factors, that was further incorporated together with RNA-seq size factors in the general linear model of RNA-seq data to account for variation stem from different copy number of genes in two sublines or copy number errors in the reference genome. Briefly, WGS counts were initially normalized on both sequencing depth (DESeq2’s median of ratios method) and gene length for each subline independently. The resulting bimodally distributed counts were used to extract subset of genes belonging to subgenomes L1/L2 based on 1.5-fold difference of coverage between the groups. The matrix of WGS counts was again depth-normalized based on the above subset of genes and scaled. In cases of low gene coverage by the WGS library, we imputed the coefficient from its nearest gene. Finally, default calculated vector of RNA-seq size factors was multiplied by this matrix and used to construct the general linear model implemented in the DESeq2 package [37]. Genes having mean RNA-seq counts less than 10 in both groups were excluded from further analysis. The constructed model allowed us to detect changes in gene expression that are not linearly related to changes in gene copy number, including the effects of gene dosage compensation.
Morphometry
The measurements of morphometric traits of worms were done, as was described earlier [18]. Totally, we measured 30 worms per subline. Measurements for each worm includes the total body length and width, body area, sizes of gonads (incl. gonads’ area), eyes (diameter), stylet (proximal and distal openings, straight and fragmented length), and sperm (feeler, body, bristle, shaft, brush). The detailed morphology of sperm of M. lignano can be found in Figure S1 [18,32]. Morphometry of sperm was carried out according to the protocol [32] and included three sperm per worm (N=90 per each subline). Statistical analysis was done using Student t-test.
EdU Staining
The dividing cells were stained by adding in the EdU (5-Ethynyl-2-deoxyuridine, 20 uM) staining solution (Lumiprobe, Russia) to culture medium containing the worms of different ages, i.e. hatchlings (h), adult mature worms (m) (N=50). The EdU-labelled cells were detected using a click reaction with Cyanine3 azide in the presence of a copper catalyst according to the manufacturer’s protocol (Lumiprobe, Russia). Additionally, the number of EdU-labelled cells (i.e. S-phase cells) in the testes of adult worms can serve as a dynamic measure of testicular activity [38]. We assumed the number of EdU-positive cells as proliferative activity of cells in gonads (testes and ovaries).
Microscopy Analysis
Morphometric measurements were done on alive specimens of M. lignano using AxioImager.A2 microscope (Zeiss, Germany) with transmitted light. The microimages and measurements were obtained using the software ImageView version x64 (Olympus, Japan).
Microscopic analysis of EdU-labeled cells was performed using the confocal laser-scanning microscope Olympus FW3000 using the software OLYMPUS FLUOVIEW FV31S-DT (Olympus, Japan). To count EdU-positive cells in hatchlings the focus stacking or z-projection was applied (merging z-stacks into one plane, which creates a single composite microimage with an extended depth of field from multiple images taken at different focal planes).
Quantification of EdU-positive cells
The number of EdU-positive cells in adults was counted using cellSens software. Fluorescent specific signals from EdU-stained cells were counted for hatchlings (30 specimens per each subline) and gonads (testes and ovaries separately) of adult worms (30 specimens per each subline) from both 2n=8 and 2n=10 sublines. Statistical analysis was done using. We used a Student t-test to compare the observed number of EdU-positive cells in worms (hatchlings and gonads’ adults) of the DV1_8 and DV1_10 sublines.
Brood size measurements
Eu- and aneuploid worms from the DV1_8 and DV1_10 sublines were synchronized via egg laying. Then we harvested hatchling worms and isolated them separately in 24-well plates with f/2 medium containing diatom algae to allow larvae to develop into adult worms. After maturation, worms were plated together as virgins and were held in groups of 80 in Petri dishes (one mating group for each subline) for one day. To measure brood size and any reproductive defects brought about by ploidy differences, worms were individually separated on 24-well plates and transferred every 2–3 days to a new batch of 24-well plates with algae. This experiment was continued for 14 days. Eggs were counted and checked daily for the hatched offspring, and the number of offspring per egg was recorded. The dates of egg laying and of hatching were used to calculate the development time (from egg laying to hatching) of offspring in both sublines and then counted for viability (hatched vs. unhatched eggs). The hatchlings were isolated in 24-well plates with f/2 medium for two weeks to allow them to grow. Then we fixed the number of mature and malformed (no growth, lack of or incomplete formation of gonads, etc.) worms in the progeny from both the DV1_8 and DV1_10 sublines.
Statistical analysis
All statistical analyses were carried out using commercially available software (STATISTICA version 13 by StatSoft Inc., USA).
Validation of RNAseq datasets using a droplet digital PCR (ddPCR)
Three biological replicates were established (75 worms for each replicate) for the DV1_8 and DV1_10 sublines. For verification of the RNAseq analysis, we used three technical replicates per each biological replicate. Primers for the reference (COX5B, С14077, and C14804) and target genes (565G9 and 1804G1) were designed using Primer3Plus (http://www.bioinformatics.nl/cgi-bin/primer3plus/primer3plus.cgi). The primers and probes are listed in Table S1.
Total RNA was extracted using “Lira” reagent (Biolabmix, Novosibirsk, Russia) according to the manufacturer’s protocol. To prevent possible genomic DNA contamination, all specimens were treated with RNAse-free DNAse I based on the manufacturer’s recommendations (New England Biolabs Inc., M0303S). Then the mRNA was reverse transcribed using ProtoScript® II First Strand cDNA Synthesis Kit (New England Biolabs Inc., E6560S) according to the manufacturer’s instructions. Transcript abundance was measured using the Bio-Rad QX100 ddPCR System (Bio-Rad Laboratories, Inc., USA). The ddPCR SuperMix for probes reaction mixture (no dUTPs, Bio-Rad Laboratories, Inc., USA, #1863023) was used for DEGs’ validations. Three technical replicates of PCR mix for target and reference transcripts, and no-template control were included in each ddPCR run. In brief, each 22 μL 1x ddPCR SuperMix reaction mixture containing cDNA templates, forward and reverse primers (and two probes for target and reference genes, respectively) with optimized concentration was mixed with 70 μL of Droplet Generation oil for Probes (Bio-Rad Laboratories, Inc., USA, # 1863005) in a DG8 Cartridge (Bio-Rad Laboratories, Inc., USA, # 1864008). Probes were 5’-labeled with 6-carboxyfluorescein (FAM) or 6-carboxy-2, 4, 4,5, 7, 7 hexachlorofluorescein succinimidyl ester (HEX) as the reporter and BHQ-1 as the 3’-labeled double quenchers (Biolabmix, Novosibirsk, Russia). The cartridge was covered with a DG8 gasket and loaded into the QX100 Droplet Generator (Bio-Rad Laboratories, Inc., USA) to generate PCR droplets. From each droplet mix, 40 μL was transferred to a 96-well PCR plate (Bio-Rad Laboratories, Inc., USA, # 12001925) and sealed using PX1™ PCR plate Sealer (Bio-Rad Laboratories, Inc., USA). PCR thermal cycling was optimized, and the amplification signals were read using the QX100™ Droplet Reader and analyzed using QuantaSoft software v1.7.4.0917 (Bio-Rad Laboratories, Inc., USA).
The log2 fold change (log2FC) of each examined target transcript (DV1_10 vs. DV1_8) worms was calculated after normalization to the reference gene. Taking into account the belonging of 656G9 to the subgenome S (that means that its copy number in the DV1_10 is the same as in the DV1_8) and 1804G1 to the subgenome L1 or L2, correspondent correction was done on raw ddPCR data. To do this, we multiplied the value of the target transcript 656G9 (copies/ul) by 1.5 times and transcript 1804G1 (copies/ul) by 0.75 times in the DV1_10 replicates.
3. Results
In comparison to euploids, the genome of an aneuploid worm of M. lignano with two additional L chromosomes is about 1.5 times larger than that in euploids. In many organisms, the increased ploidy results in enlarged sizes at different levels, from cellular to organismal [39]. We measured the sizes of the body, gonads, the stylet, and sperm in euploid and aneuploid worms of two sublines (DV1_8, euploid worms, 2n=8; SSL1L2 and DV_10, aneuploid worms, 2n=10; SSL1L1L2L2). The increased sizes of all of them were revealed in aneuploid worms (Table 1). Earlier increased testes were observed in large mating groups in M. lignano. Probably, this enlargement was associated with increased cellular activity [38]. In our study, both eu- and aneuploid worms were kept in mating groups of the same size, and therefore the increased gonads’ size could not be linked to the mating-group size but could be associated with increased cell proliferation in testes of worms with increased genome size.
Sperm of M. lignano has the special morphological traits (Figure S1), including a feeler, a sperm body, a pair of lateral bristles anchored at the junction of the sperm body and the shaft, the shaft containing the nucleus, and a brush posterior to the shaft [40]. Sperm morphology and size are important factors for sperm competition. The feeler anchors sperm to the epithelium of the antrum, while lateral bristles have been predicted to reduce the likelihood of sperm being removed from the antrum during sucking behavior post copulation [40,41]. Measurements of the main sperm traits revealed that the worms with the 2n=10 karyotype produced bigger sperm (Table 2), having longer bristles and feelers. The longer bristles help sperm to avoid being sucked out, and longer feelers possibly allow better positioning in the antrum [42]; this increases the chance of successful fertilization of an egg.
Cell proliferative activity in euploid and aneuploid worms
The EdU proliferation assay is a sensitive and reliable technique for detection of the cell proliferation. A one-day-old M. lignano hatchling consists of about 1,500 cells; 50 of them are neoblasts [43]. In our study, the average number of cells involved in proliferation in one-day-old euploid hatchlings appeared to be 71.03±19.79. Unexpectedly, in the aneuploid hatchlings, the registered proliferative activity of the cells was significantly higher (Figure 1, Table 3). The cells with the EdU-positively stained nuclei were distributed throughout the body of aneuploid hatchlings, excluding their head region. There were only a few nuclei found in the head region of both eu- and aneuploid worms (Figure 1).
We referred most of the EdU-labeled cells to neoblasts and proliferating differentiating cells. Besides regeneration of the damaged and lost tissue or organs in M. lignano, neoblasts also renew them. In adults, about 160 neoblasts [43] occur evenly distributed throughout upper ‘layers’ of the body and in bands located laterally [44]. However, we revealed cells with the EdU-labeled nuclei throughout the worm body, including various tissues and organs. In contrast to the hatchlings, the large number of the EdU-labeled nuclei made their count difficult. We have counted EdU-positively stained nuclei only in the testes and ovaries of the euploid and aneuploid worms. Note, in M. lignano, the testes’ periphery contains spermatogonia, primary and secondary spermatocytes [45], while the maturing spermatids and mature sperm are located in the inner region of the testes. The anterior part of the testes is enriched for proliferating cells and serves as a ‘proliferative center’ [46]. The ovaries mainly consist of oogonia and oocytes. In both, eu-and aneuploids, the primordial germ cells, progenitors of sperm and ova are located at the periphery of testes and ovaries, respectively. In examined specimens of worms, the testes and ovaries of the aneuploid worms in comparison with euploid ones contained more cells with labeled nuclei (Table 3).
Brood size measurements of worms from the DV1_8 and DV1_10 sublines
The virgin adult worms from the DV1_8 and DV1_10 sublines were kept for one day in two mating groups of the same size (N=80). Then individual worms were isolated for the estimation of the egg laying and successful brood size in the euploid and aneuploid worms. The number of laid eggs, hatchlings, alive worms, and worms of normal size and morphology produced by 80 euploid and 78 aneuploid worms were counted (Table 4). Six DV1_8 and eight DV1_10 worms laid no egg. The 17 euploid and 26 aneuploid worms laid no hatched eggs. At the hatchling stage, the specimens were isolated in wells with algae. Further observations showed that they, being virgin, appeared to be capable of laying eggs. Since M. lignano is an obligate cross-fertilized worm, we referred these eggs to unfertilized. Therefore, in our experiments part of the counted unhatched eggs could also be unfertilized. The number of laid eggs had sharply decreased by the sixth day. However, later the worms began laying eggs again, with varying frequency and in varying quantities (Figure S2), but none of them hatched. Probably, most or all of them were unfertilized. Supposing that eggs laid after the sixth day were mostly unfertilized ones, we consider the eggs laid for the first six days of the experiment separately (Table 4). However, some unfertilized eggs could be laid also on the first day of the experiment. Therefore, even for the eggs laid in the first six days, we cannot be sure that all of them were fertilized ones. Due to this problem, the data on the fertilized egg number produced by DV1_8 and DV1_10 worms were difficult to interpret and analyze.
For this reason, the special attention was paid to the hatching and further development of the specimens. We should note that normally worms lay about a single-cell fertilized egg (zygote) per day [22], and the time between the egg laying and hatching is around five days [25]. In our experiment, egg hatching took place mainly three days after egg-laying in both euploid and aneuploid worms. In rare cases, egg hatching was observed later, e.g., in five, six, or even 10 days. All of these cases were registered for the worms of the DV1_8 subline (Figure S3).
Any disorders in the worm’s ontogenesis at any development stage negatively affect the worm’s maturation and normal phenotype formation. Comparing the offspring from euploid and aneuploid worms, we analyzed hatching and worm morphology and counted the number of hatchlings, juveniles, and adult worms developed from them (Table 4). Since we could not be definitely sure how many of the eggs were fertilized and how many were not, we took into account the number of the hatched eggs. During the experiment, we recorded the number of individuals who reached the juvenile stage and those worms that matured. Unexpectedly we found that only 34.11% of hatched eggs derived from euploid worms provided adult worms with normal phenotype (normal body size and morphology with visualized organ systems). Most of the hatchlings were too small for their age, and even later, their body sizes did not reach the normal one, and most of them were gone in a short time.
In contrast to the euploid worm offspring, the offspring from the aneuploid worms showed a very high level of viability and provided about 92% of normal mature worms (Table 4). For most aneuploid worms, the number of their mature offspring coincided or almost coincided with the number of laid eggs (Figure S4).
Aneuplody-driven changes in the transcriptome of M. lignano
For comprehensive genome-based analysis of the transcriptomes of the two sublines, we modified the original Mlig_3_7 reference gene annotation using multi-match mapping of both original Mlig_3_7 genes and transcripts assembled from the newly obtained RNA-seq data. The resulting consensus annotation significantly expanded the list of detected duplicated genes.
Direct comparison of RNA-seq data for the two sublines, normalized for sequencing depth, revealed a global increase in the expression of a large number of genes in aneuploid worms (Figure 2). Since we previously showed that the copy number of the three subgenomes within the genomes of these lines differs (SSL1L2 vs. SSL1L1L2L2), it was logical to assume that the observed differences in the expression of paralogous genes are due to differences in their dosage. To normalize transcriptome data for gene dosage in the genome, we used previously obtained WGS data for the worms of the DV1_8 (euploid) and DV1_10 (aneuploid) sublines [6]. This operation also eliminates any discrepancies in gene copy numbers between the reference and studied genomes and allows us to label annotated genes as belonging to the subgenomes S or L1/L2 (Figure 2a). Normalization for gene dosage eliminated the pattern of global differences between the transcriptomes of euploid and aneuploid worms, which affected genes on small chromosomes (Figure 2bc). Thus, under conditions of variable ploidy level and subgenome composition, the expression of the vast majority of the M. lignano genes is directly proportional to their genome dosage.
According to the results of the RNAseq analysis, the vast majority of genes are expressed in proportion to their copy numbers in the genome of M. lignano. In spite of this, changes in the expression level for some genes are not correlated with differences in their copy numbers.
Totally, 1776 genes out of 52,294 analyzed genes were defined as differentially expressed (adjusted p-value < 0.05) between the euploid (2n=8) and aneuploid (2n=10) worms. Based on absolute FC> 1.5, DEGs were screened. In total, 1308 genes were differentially expressed between in worms of the DV1_8 and DV1_10 sublines (Table S2). Overall, in aneuploid worms 596 genes were upregulated, while 712 were downregulated, compared with their level of expression in euploid worms. Based on the ratio S/L using the WGS data, we were able to predict the belonging of most DEGs to the subgenome S or subgenomes L1 and L2 taken together. Most of the DEGs were assigned to the L subgenomes (723 genes), while 385 genes were assigned to the subgenome S (Figure 3, Table 5, Table S3). This indicated that aneuploidy on the large chromosome equally affects the expression of genes encoded by all three subgenomes, including genes from the small chromosomes (subgenome S). Some of the DEGs that had intermediate coverage ratio values that did not pass a fixed threshold (Figure 2a, grey color) were counted as NA (Figure 3).
The validation of expression levels for selected DEGs was carried out by qRT-PCR. The results showed a high consistency between RNA-Seq and ddPCR data, confirming the high reliability of RNA-Seq. Both the constant expression of genes that served as intrinsic reference genes in the current study and the differential gene expression for a few target genes were validated for RNAseq data using ddPCR (Figure S5).
Functional enrichment analysis for DEGs
The patterns of gene expression can be evaluated in a variety of ways, for as by grouping genes based on pathway or function in GO or KEGG pathway analyses to identify which pathways are up- or down-regulated between groups.
Ploidy-specific transcriptional differences were further explored through an enrichment analysis of Gene Ontology (GO) terms. DEGs in euploids vs. aneuploids were annotated using the GO database and classified into three major GO categories, namely, biological process, cellular component, and molecular function, which were then further classified into functional subcategories (Table S4,S5). The DEGs were mostly enriched in GO terms linked with the primary GO category ‘Biological Process’, totaling 191 GO terms (Figure 4, Table S4).
In this category, ‘nuclear pore complex assembly,’ ‘nuclear migration involved in conjugation with cellular fusion,’ and ‘dynein-driven meiotic oscillatory nuclear movement’ were the most highly represented GO terms. In the cellular components, ‘cytoplasmic dynein complex’ was the most represented term. In the molecular functions category, ‘cytoskeletal motor activity’ was the dominant GO term. The predominant GO terms represent a general overview of content of gene ontologies and exhibit a wide range of active processes occurred in the M. lignano worms with increased genome ploidy.
Then we conducted KEGG pathway analysis to identify the pathways in which DEGs were involved. Totally, KEGGs were assigned for 1308 genes and 354 DEGs, and they were classified into five main categories (Table S3). The DEGs were assigned to the category ‘Organismal Systems’ (28.43%), ‘Metabolism’ (22.67%), ‘Environmental Information Processing’ (10.29%), ‘Cellular Processes’ (7.51%), ‘Genetic Information Processing’ (7.38%). The detailed information is presented in Supplementary Material (Table S6,S7).
KEGG enrichment analysis revealed four main categories enriched with DEGs. The first category “Organismal Systems’ included NOD-like receptor signaling pathway (ko04912), GnRH signaling pathway (ko04912), PPAR signaling pathway (ko03320), vasopressine-regulated water reabsorption (ko04962), renin-angiotensin system (ko04614). Flatworms lack a well-characterized in vertebrates GnRH signaling pathway, but related pathways were described in invertebrate model organism C. elegans. It uses a peptide with both adipokinetic hormone (AKH) and GnRH-like properties signals through this pathway to affect egg-laying timing and progeny numbers [46]. In some marine flatworms ‘platytocin’ (a neuropeptide derived from this vasopressine/oxytocin-type gene) was suggested to function as ‘antidiuretic hormone’, also organizes reproduction and chemosensory-associated behavior [47]. We propose that the KEGG ko04962 is important for physiological adaptations by regulation of the body fluids under the environmental salinities fluctuations.
The category ‘Metabolism’, included KEGG pathways linked with lipid metabolism, such as fatty acid elongation (ko00062), alpha-linolenic acid metabolism (ko0592), biosynthesis of unsaturated fatty acids (ko01040), valine, leucine and isoleucine biosynthesis (ko00290); and carbohydrate metabolism, such as phenylpropanoid biosynthesis (ko00940). The next enriched with DEGs category was ‘Genetic Information Processing’, which included the KEGG pathways ubiquitin-mediated proteolysis (ko04120) and RNA degradation (ko03018), which may be related to the increased genome ploidy level. The ubiquitin-mediated proteolysis via ubiquitin-proteasome system, a major pathway for protein degradation, regulates the amounts of many proteins for maintenance of homeostasis.
The third enriched category ‘Environmental Information Processing’ included a single KEGG pathway mTOR signaling pathway (ko04150). mTOR signaling pathway, a nutrient-sensing pathway, plays major roles in regulating the metabolism and behavior of stem cells. We suggest that in M. lignano, similar to planarians, the mTOR signaling pathway is involved in regulation the proliferation of neoblasts during cell turnover and regeneration.
Tissue-specific DEGs linked with changes in ploidy level
GO or KEGG enrichment analysis was unable to assign the term for many genes of M. lignano, including differentially expressed genes, at least in part due to the prominent gene novelty in M. lignano. As shown earlier [46], out of 2,604 germline-enriched transcripts, only 979 (37.60%) had homologs in human and 1,067 (40.98%) in S. mediterranea, while 1,412 (54.22%) were predicted to be M. lignano-specific [46]. In this situation, an alternative source of functional information on genes with broad coverage are the results of other genome-wide studies of M. lignano, and in particular data on tissue-specific gene expression.
To define the tissue or organ system enriched with DEGs, we used the transcriptome data from published studies on M. lignano [46,47] and linked with databases.
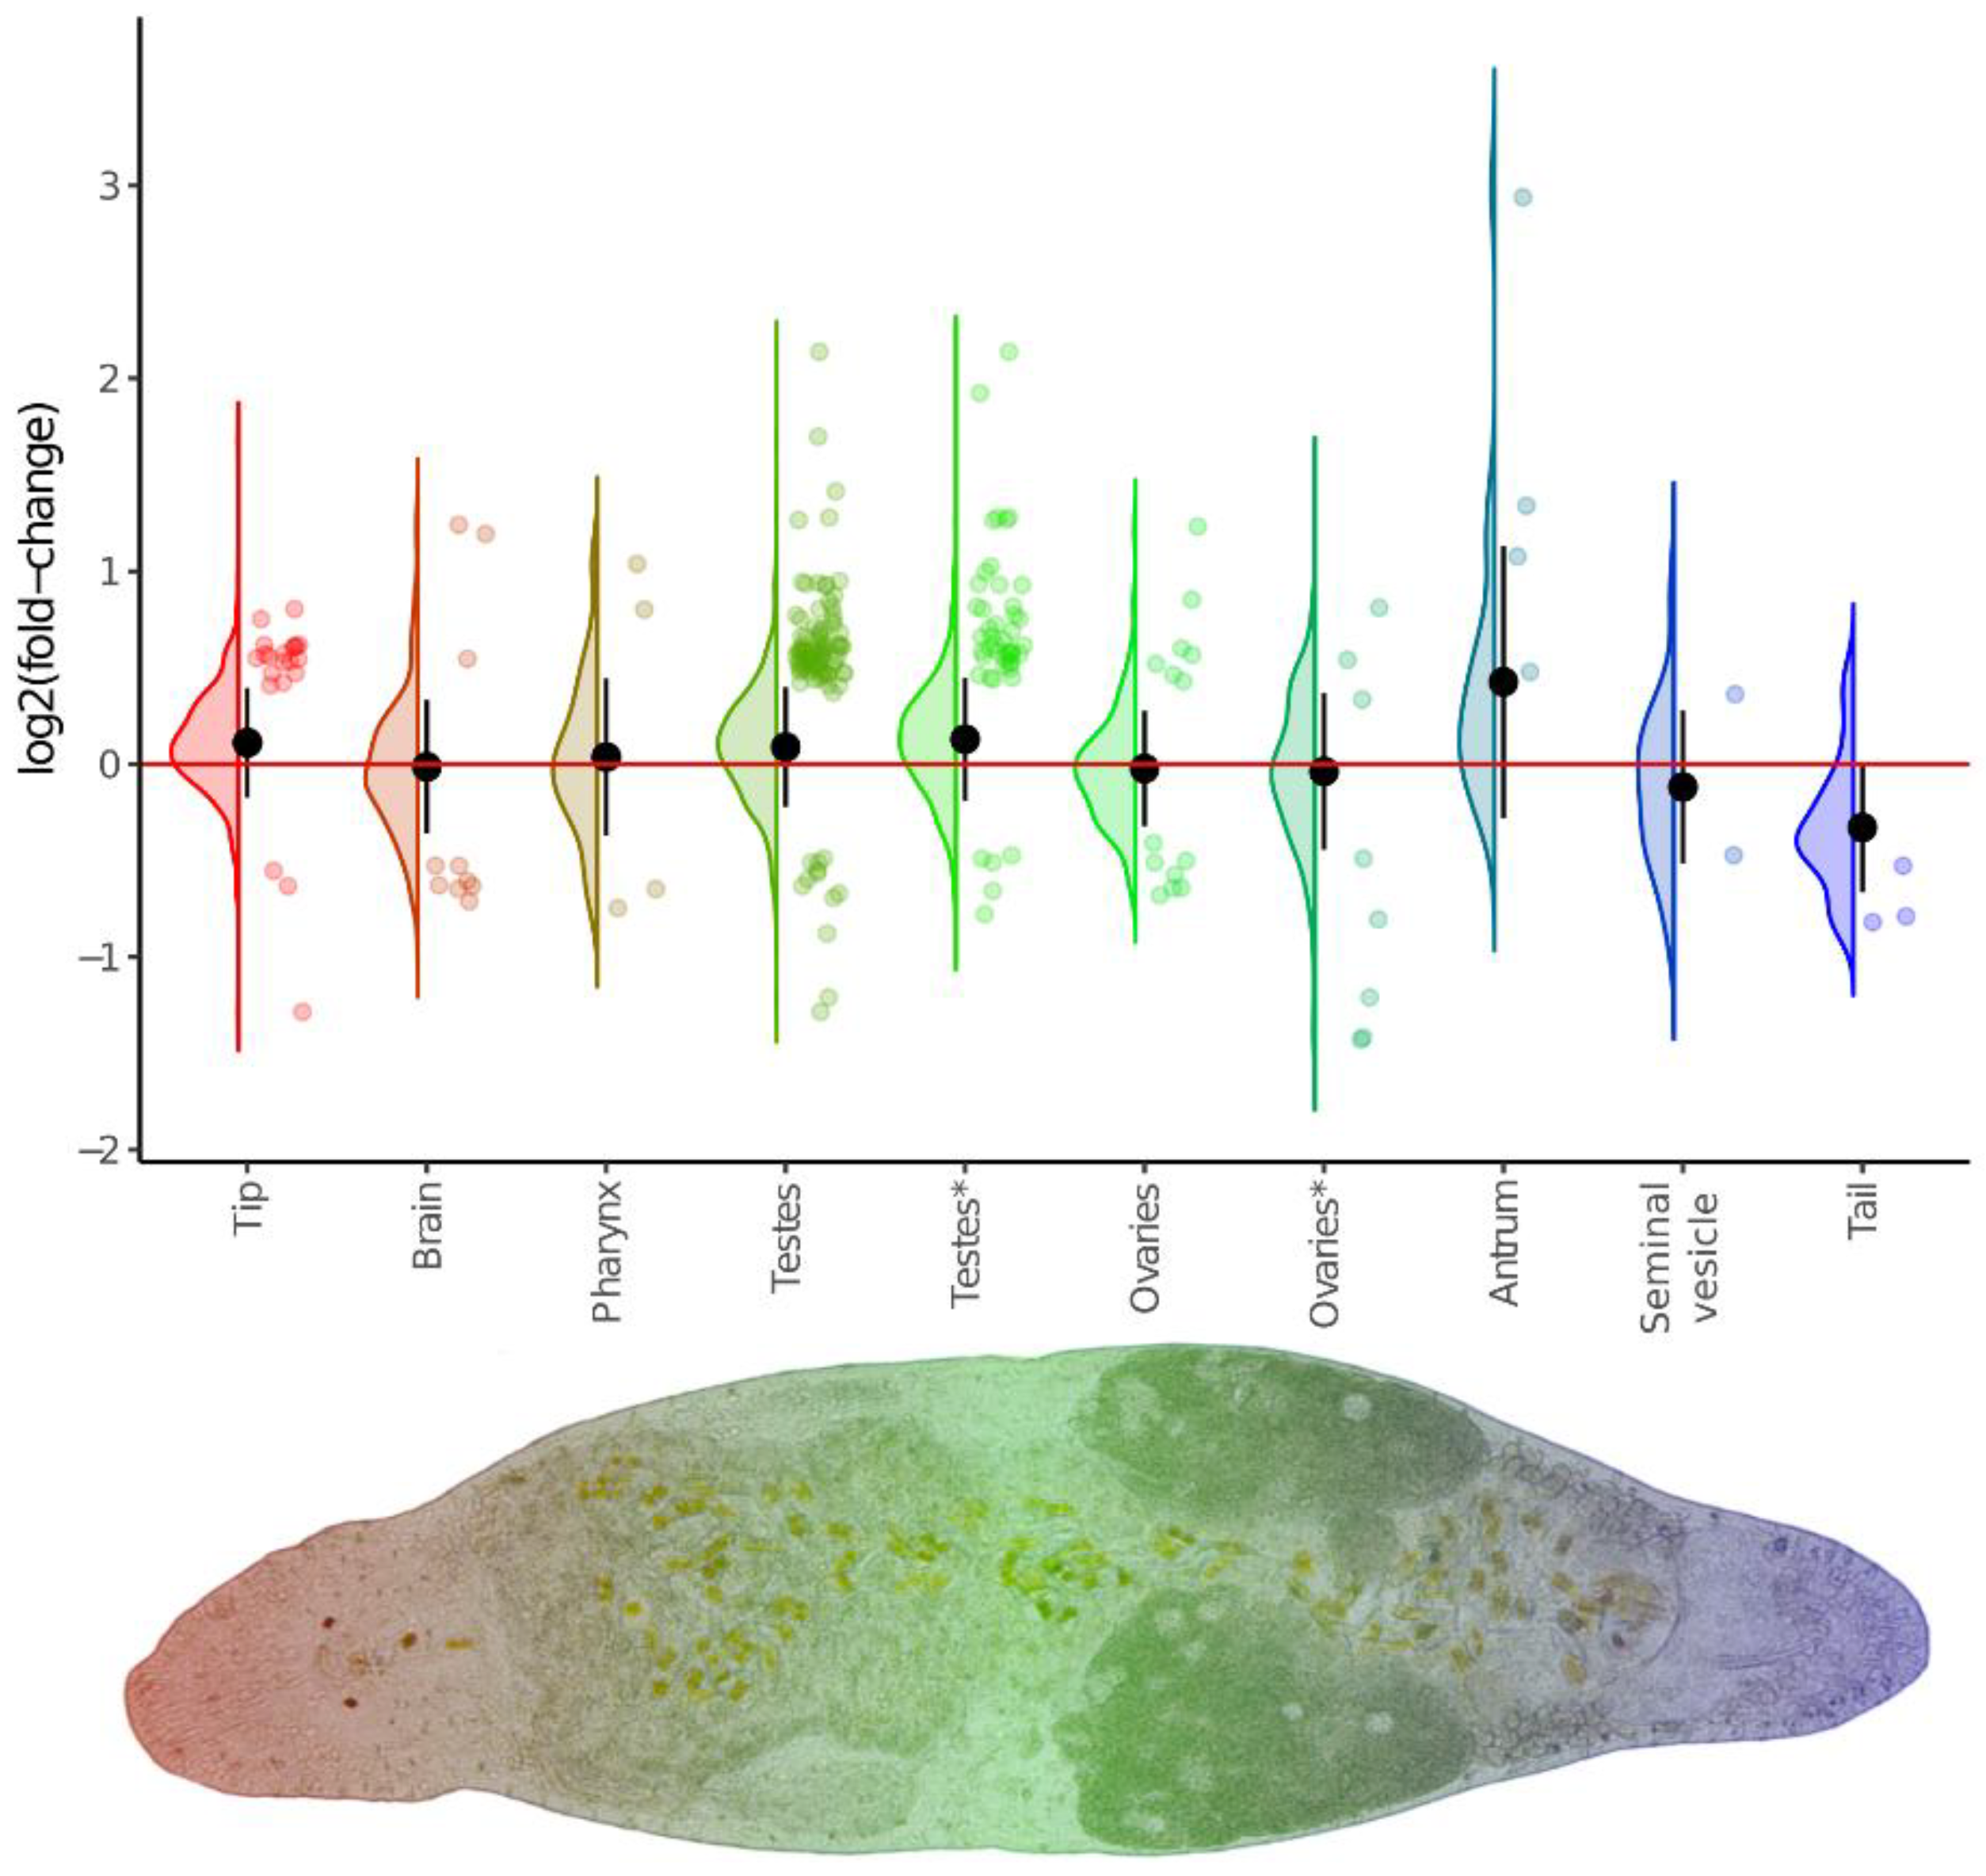
We found that a substantial number of DEGs exhibited spatially specific expression. Perhaps the most prominent of these were the tip- and testes-specific genes, whose expression was increased in the DV1_10 worms. Furthermore, the expression of the entire set of these region-specific genes was also elevated. The latter likely indicates an increased proportion of the corresponding organs in the body of the DV1_10 worms. This finding is strikingly consistent with the observed the increased sizes of gonads and more active proliferation in the testes and ovaries, we took a closer look at the gonad-specific DEGs that may orchestrate this phenotypic changes. Totally, we defined 33 gonad-specific DEGs; 28 of them had specific expression in testes (26 up- and only two downregulated genes), and the five genes had ovary-specific expression (the only up- and four downregulated). The upregulated testes-specific DEGs were associated with the Hedgehog signaling pathway (ko04340), the Hippo signaling pathway (ko04390 and ko04391), and the Wnt signaling pathway (ko04310) (Table S7).
Figure 5.
Violin/jitter plots for differences between euploids and aneuploid worms in expression of region-specific genes. Classification of region-specific gene sets is taken from database linked with [45]. Additionally, ovaries- and testes-specific genes were refined from [47] and marked by an asterisk. Violin plots illustrate log2FC distribution for the whole set of detected genes, while jitter plots show only differentially expressed genes. Black circles and whiskers show the mean and standard deviation of the violin plot.
4. Discussion
Owing to the peculiar genome organization of M. lignano, we were able to establish the neopolyploid model for the study of genomic, transcriptomic, and phenotypic biodiversity under ploidy level changes. The copy number of the large chromosome that encodes the subgenomes L1 or L2 varies between the karyotypes of the established sublines DV1_8 (SSL1L2) and DV1_10 (SSL1L1L2L2). The genomes of the worms from both sublines are identical, differing only with the copy number of the L1 and L2 subgenomes and, therefore, with the ploidy level. The DV1_8 worms are euploid with a hidden tetraploidy in their genome. The DV1_10 worms are aneuploids, or more correctly tetrasomics on the large chromosome, being, according to their genomic content, the hidden hexaploids. Therefore, the genome of the aneuploid DV_10 worms (SSL1L1L2L2) is 1.5 times larger than that of the euploids (SSL1L2).
The correct interpretation of the data obtained in morphometric and transcriptomic analysis required careful consideration of the genome composition of euploid and aneuploid worms. The SSL1L2 genome of euploid worms suggested offspring with the SSL1L2, SSL1L1, and SSL2L2 genomes. Under inbreeding, the adult worms with the heterozygous SSL1L2genome may have an advantage over the worms with the homozygous SSL1L1 or SS L2L2 genomes, or elimination of these genome variants can take place at earlier development stages. The independent evolution of the subgenomes L1 and L2 provided the gene diversity, which included gene loss or change of their function through subfunctionalization or neofunctionalization. We consider all possible variants: no formation of SSL1L1 or SS L2L2 zygote; no hatched SSL1L1 or SS L2L2 egg; developmental disorders at the hatchling and juvenile stages; and sterility of the adult SSL1L1 or SS L2L2 worms. In the offspring production experiment, the similar number of worms with no laid eggs was in both euploids and aneuploids. The euploid worms laid more eggs, but we could not determine how many of them were fertilized. Less than half the hatched eggs derived from euploid worms developed into phenotypically normal adult worms (~34%), while most of the hatched DV1_10 eggs developed into normal adult worms (92%). Half of the zygotes from the euploid worm crossing should be SSL1L1 and SSL2L2, but more than half of the specimens from the hatched euploid eggs showed developmental disorders and did not achieve maturation. We suggest they had the SSL1L1 and SS L2L2 genomes, while the genomes of normally developed worms contained both subgenomes, L1 and L2. It allows us to conclude all euploid specimens involved in morphometric and transcriptomic studies had the SSL1L2 genome.
We need to make a correction while estimating the capacity to survive of the SSL1L2 worms by counting the number of adult worms that developed from their hatched eggs. Among these hatched eggs, just half were SSL1L2, and the other half were both SSL1L1 and SS L2L2 varieties. The percentage of the developed euploid worms should be increased from about 34% to about 68%. Nevertheless, it is lower than estimated for aneuploid SSL1L1L2L2 worms (~92%), suggesting their higher viability. Morphometry revealed differences between measurements of body, gonads, and sperm between the SSL1L2 and SSL1L1L2L2 worms. Additionally, counting EdU-labeled cells indicated a change in the number of proliferating cells or in the duration of phases of the cell cycle. Probably, the observed phenotypic changes could have some benefits to aneuploids and a positive effect on the viability of aneuploid worms.
Comparison of transcriptomic patterns of the euploid and aneuploid worms revealed differences in their gene expression levels. Under ploidy changes and subgenome composition, the expression of the vast majority of the M. lignano genes is proportional to their copy numbers in the genome of M. lignano. In spite of this, 1308 genes were defined as differentially expressed between the euploid (SSL1L2) and aneuploid (SSL1L1L2L2) worms.
Overall, most of the DEGs were assigned to the L1, L2 subgenomes (723 genes), while 385 genes were assigned to the subgenome S. This indicated that aneuploidy on the large chromosome equally affects the expression of genes encoded by all three subgenomes, including genes from the small chromosomes (subgenome S). We observed the aneuploidy-induced transcriptional response [48], when genes with differential expression are not limited to the genes of aneuploid chromosome, the large chromosome of M. lignano, but includes a significant number from euploids small chromosomes. Trans effects of aneuploidy have been identified in aneuploid cells of yeast, mice, and humans [49]. In yeast, the trans effect of aneuploidy affects about 5-7% of genes. In human fibroblast with trisomy 21, about 88% of DEGs were distributed on other chromosomes [50]. In Turner (45,X) and Klinefelter (47,XXY) syndromes, more than 75% of DEGs were identified in autosomes, while in carriers of karyotypes 46,XXX and 47,XYY, less than 30% of DEGs were autosomal [51]. The extent to which trans effects of aneuploidy occur varies among species, and the underlying mechanisms are still poorly understood [52].
Thus, the phenotypic effects of aneuploidy may be associated either directly with changes in the copy number of genes located on the aneuploid chromosome or indirectly with changes in the expression of many genes on euploid chromosomes [49]. The result may be additive or synergistic expression and functional effects at the transcriptional and/or posttranscriptional levels [53]. This is consistent with the nonlinear nature of gene dosage effects that determine subsequent biochemical processes in the cell [54,55]. Although many of the biological effects caused by aneuploidy are consistent with the gene dosage balance hypothesis [56,57], it is worth considering the impact of the presence of extra chromosomes on the spatial nucleus organization and potentially on the genome-wide transcriptional activity of a wide variety of genes.
Summarizing the list of the revealed DEGs, unfortunately, many of them remained out of functional analysis because they lack detectable homologs in other species, indicating the prominent gene novelty and meaning their specificity to the M. lignano-lineage. Nevertheless, the DEGs with larger changes of transcriptional activity were observed.
One of the enriched pathways is the GnRH signaling pathway, which is evolutionarily conserved from worms to humans, playing a significant role in reproduction. In C. elegans, the GnRH pathway influences egg-laying timing and progeny numbers [59]. Functional annotation of upregulated testes-specific DEGs in aneuploids indicated their association with key signaling pathways, such as Hippo, Wnt, and Hedgehog (Hh) pathways, linked with spermatogenesis by regulating cell proliferation, survival, and differentiation. The Hh pathway is crucial for testes development, while blocking Hh signaling leads to disorders in testes resulting in sperm defects and infertility [60]. Wnt/β-catenin signalling plays an essential role in regeneration, regulating development of the embryo in axial patterning, germ layer formation, organogenesis, and stem cell fate determination [62]. In M. lignano, the Hippo pathway regulates neoblast activity during development and regeneration, while knockdown of the Hippo pathway genes disrupts tissue homeostasis [63].
Among the significantly enriched pathways for DEG in the worms SSL1L1L2L2, special attention we should be paid to the mTOR pathway. It plays a key role in the regulation of multiple fundamental processes that influence cell cycle, cell proliferation, organism growth, and survival [64]. Ploidy changes can lead to disorders in cell division like an asynchronous cell cycle, increased frequency of endomitosis, endocycle, genomic and chromosomal instability (CIN), and DNA damage. The mTOR signaling pathway participates in the control of translational initiation and early progression of G1. mTORC1 promotes transition of cells from G1 into S-phase, for example, by regulating the levels of specific cyclins and thus the activity of CDKs, while mTORC2 is essential for actin cytoskeleton rearrangement, while its loss disrupts the polarized organization of the actin cytoskeleton. Cell division directly depends on the dynamic and structural reorganization of the actin cytoskeleton and the correct segregation of duplicated chromosomes. [64].
Another significantly enriched pathway was linked with ubiquitin-mediated proteolysis and RNA degradation, which could be associated with increased genome ploidy level in aneuploid worms. The ubiquitin-mediated proteolysis via the ubiquitin-proteasome system, a major pathway for protein degradation, regulates the amounts of many proteins for maintenance of homeostasis. It was shown that in some aneuploid organisms (yeast), an increased level of ubiquitination was detected for proteins encoded on aneuploid chromosomes, and their abundance was reduced via the ubiquitin-proteasome system (UPS, Ubiquitin Proteasome System) [65]. The ubiquitin-mediated proteasomal degradation system plays an important, and possibly key, role in maintaining the balance of the proteome of an aneuploid cell [66].
It is possible to note the enriched metabolic pathways in aneuploids of M. lignano, especially carbohydrate and lipid metabolism, which reflects that aneuploids have significant advantages in carbon metabolism over euploids, which in turn may be responsible for the large body sizes observed in aneuploids. Moreover, various metabolic pathways regulate controlling the somatic and germline stem cell behavior (e.g., self-renewal, proliferation, and differentiation). Metabolic pathways convey information on the changes in the stem cell niche, physiological status, and nutrient availability to reprogram stem cell fate via epigenetics; conversely, metabolic pathways are reprogrammed by stem cell factors depending on cellular needs [64]. In some marine flatworms, ‘platytocin’ (a neuropeptide derived from this vasopressin/oxytocin-type gene) was suggested to function as an ‘antidiuretic hormone’ and also organizes reproduction and chemosensory-associated behavior [60]. We propose that those involved in these processes can improve physiological adaptations to new environments by regulation of the chemical content of the body fluids under the salinity fluctuations.
Our findings in transcriptome differences in euploid and aneuploid worms of M. lignano suggest the complex effect on expression level of many genes, and their interactions play essential roles in the homeostasis, fecundity, and viability of aneuploids of M. lignano. The abovementioned makes M. lignano an attractive model for studies of early stages of reorganization and functioning of the genome, transcriptome, and proteome levels in animal neopolyploids.
Supplementary Materials
The following supporting information can be downloaded at the website of this paper posted on Preprints.org, Figure S1. Transmission light microscopy of M. lignano; Figure S2. Dynamics of egg production and their hatching during experiment; Figure S3. Development time from the egg to hatching for eu- and aneuploid worms, Figure S4. Fecundity of the the euploid (DV1_8) and aneuploid (DV1_10) M. lignano worms, Figure S5. ddPCR validation for RNAseq data using DEGs of the DV1_10 subline; Table S1. Design of primers and oligoprobes for ddPCR; Table S2. Filtering out DEGs based adjusted p-value < 0.05. Table S3. Top ten most differentially expressed up- and down-regulated genes and their belonging to the subgenomes; Table S4. DEGs functional classifications by GO (enriched sub-categories, p-value < 0.05); Table S5. GO terms enriched with DEGs into the category ‘Biological Process’, ‘Cellular Component’, ‘Molecular Function’; Table S6. KEGG pathway analysis for DEGs; Table S7. KEGG pathways for DEGs; Table S8. Testes- and ovaries-specific DEGs.
Author Contributions
Conceptualization, K.S.Z. and Y.Y.; methodology, K.S.Z., N.I.E., N.P.B., and K.E.O.; software, K.S.Z. and N.I.E.; validation, K.S.Z., N.I.E., and K.E.O.; formal analysis, K.S.Z. and N.I.E; investigation, K.S.Z., N.P.B., K.E.O., and N.I.E.; resources, K.Z.S., N.P.B., K.E.O., N.I.E.; data curation, N.I.E.; writing—original draft preparation, K.S.Z. and N.B.R.; writing—review and editing, K.S.Z., N.I.E., and N.B.R.; visualization, K.S.Z. and N.I.E.; supervision, K.S.Z. and N.B.R.; project administration, K.S.Z.; funding acquisition, K.S.Z. All authors have read and agreed to the published version of the manuscript.
Funding
This research was funded by the Russian Science Foundation, grant number 24-24-00141 (https://rscf.ru/en/project/24-24-00141/).
Institutional Review Board Statement
The study was conducted according to international and national guidelines for the care and use of animals. Animal study protocol was approved by the Ethics Committee on Animal Care and Use of the Institute of Cytology and Genetics (protocol #45/2 of January 10, 2019 and #85 of June 15, 2021).
Informed Consent Statement
Not applicable.
Data Availability Statement
The data presented in this study are available in the article and supplementary material. The raw data supporting the conclusions of this article will be made available by the authors on request.
Acknowledgments
We thank the Core Facility for Microscopy of Biological Objects of the Siberian Branch of the Russian Academy of Sciences, Novosibirsk, Russia (regulation no. 3054) supported by Ministry of Science and Higher Education of the Russian Federation (grant numbers #FSUS-2024-0018 and #FWNR-2022-0015).
Conflicts of Interest
The authors declare no conflicts of interest.
Abbreviations
The following abbreviations are used in this manuscript:
| WGD | Whole Genome Duplication |
| WGS | Whole Genome Sequencing |
| ddPCR | digital droplet PCR |
References
- Lande, R.; Shannon, S. The role of genetic variation in adaptation and population persistence in a changing environment. Evolution 1996, 50, 434–437. [Google Scholar] [CrossRef]
- Merilä, J.; Hendry, A.P. Climate change, adaptation, and phenotypic plasticity: the problem and the evidence. Evol Appl 2014, 7, 1–14. [Google Scholar] [CrossRef]
- Steward, R.A.; de Jong, M.A.; Oostra, V.; Wheat, C.W. Alternative splicing in seasonal plasticity and the potential for adaptation to environmental change. Nat Commun 2022, 13, 755. [Google Scholar] [CrossRef]
- Mantica, F.; Irimia, M. Gene duplication and alternative splicing as evolutionary drivers of proteome specialization. Bioessays 2025, 47, e202400202. [Google Scholar] [CrossRef] [PubMed]
- Fradin, H.; Kiontke, K.; Zegar, C.; Gutwein, M.; Lucas, J.; Kovtun, M.; Corcoran, D.L.; Baugh, L.R.; Fitch, D.H.A.; Piano, F.; Gunsalis, K.S. Genome architecture and evolution of a unichromosomal asexual nematode. Curr Biol 2017, 27, 2928–2939. [Google Scholar] [CrossRef] [PubMed]
- Zadesenets, K.S.; Ershov, N.I.; Bondar, N.P.; Rubtsov, N.B. Unraveling the unusual subgenomic organization in the neopolyploid free-living flatworm Macrostomum lignano. Mol Biol Evol 2023, 40, msad250. [Google Scholar] [CrossRef]
- Brand, J.N.; Patil, A.B.; Pandolfini, L.; Zadesenets, K.; Rubtsov, N.; Robledillo, L.; Zhang, M.; Marques, A.; Rink, J.C. Stepwise emergence of recombination suppression precedes fissiparous asexuality in the planarian Schmidtea mediterranea. Biorxiv 2025. [Google Scholar] [CrossRef]
- Ohno, S. Evolution by gene duplication; Springer-Verlag: New York, USA, 1970. [Google Scholar]
- Zhang, J. Evolution by gene duplication: an update. Trends Ecol Evol 2003, 18, 192–198. [Google Scholar] [CrossRef]
- Long, M.; Betran, E.; Thornton, K.; Wang, W. The origin of new genes: glimpses from the young and old. Nat Rev Genet 2003, 4, 865–875. [Google Scholar] [CrossRef]
- Van de Peer, Y.; Mizrachi, E.; Marchal, K. The evolutionary significance of polyploidy. Nat Rev Genet 2017, 18, 411–424. [Google Scholar] [CrossRef]
- Lynch, M.; Conery, J.S. The evolutionary fate and consequences of duplicate genes. Science 2000, 290, 1151–1155. [Google Scholar] [CrossRef]
- Zadesenets, K.S.; Rubtsov, N.B. Genome duplication in animal evolution. Russ J Genet 2018, 54, 1125–1136. [Google Scholar] [CrossRef]
- Edger, P.P.; Soltis, D.E.; Yoshioka, S.; Vallejo-Marin, M.; Shimizu-Inatsugi, R.; Shimizu, K.K.; Salmon, A.; Hiscock, S.; Ainouche, M.; Soltis, P.S. Natural neopolyploids: a stimulus for novel research. New Phytol 2025, 246, 78–93. [Google Scholar] [CrossRef]
- Zhao, K.; Dong, J.; Xu, J.; Bai, Y.; Yin, Y.; Long, C.; Wu, L.; Lin, T.; Fan, L.; Wang, Y.; Edger, P.P.; Xiong, Z. Downregulation of the expression of subgenomic chromosome A7 genes promotes plant height in resynthesized allopolyploid Brassica napus. Theor Appl Genet 2023, 137, 11. [Google Scholar] [CrossRef]
- Van de Peer, Y.; Ashman, T.L.; Soltis, P.S.; Soltis, D.E. Polyploidy: an evolutionary and ecological force in stressful times. Plant Cell 2021, 33, 11–26. [Google Scholar] [CrossRef] [PubMed]
- Morris, J.P.; Baslan, T.; Soltis, D.E.; Soltis, P.S.; Fox, D.T. Integrating the study of polyploidy across organisms, tissues, and disease. Annu Rev Genet 2024, 58, 297–318. [Google Scholar] [CrossRef] [PubMed]
- Schärer, L.; Ladurner, P. Phenotypically plastic adjustment of sex allocation in a simultaneous hermaphrodite. P Roy Soc Lond B Bio 2003, 270, 935–941. [Google Scholar] [CrossRef] [PubMed]
- Morris, J.; Nallur, R.; Ladurner, P.; Egger, B.; Rieger, R.; Hartenstein, V. The embryonic development of the flatworm Macrostomum sp. Dev Genes Evol 2004, 214, 220–239. [Google Scholar] [CrossRef]
- Nimeth, K.T.; Mahlknecht, M.; Mezzanato, A.; Peter, R.; Rieger, R.; Ladurner, P. Stem cell dynamics during growth, feeding, and starvation in the basal flatworm Macrostomum sp. (Platyhelminthes). Dev Dyn 2004, 230, 91–99. [Google Scholar] [CrossRef]
- Ladurner, P.; Schärer, L.; Salvenmoser, W.; Rieger, R. M. A new model organism among the lower Bilateria and the use of digital microscopy in taxonomy of meiobenthic Platyhelminthes: Macrostomum lignano, n. sp. (Rhabditophora, Macrostomorpha). J Zool Syst Evol Res 2005, 43, 114–126. [Google Scholar] [CrossRef]
- Mouton, S.; Willems, M.; Braeckman, B.P.; Egger, B.; Ladurner, P.; Schärer, L.; Borgonie, G. The free-living flatworm Macrostomum lignano: a new model organism for ageing research. Exp Gerontol 2009, 44, 243–249. [Google Scholar] [CrossRef] [PubMed]
- Lengerer, B.; Pjeta, R.; Wunderer, J.; Rodrigues, M.; Arbore, R.; Schärer, L.; Berezikov, E.; Hess, M.W.; Pfaller, K.; Egger, B.; Obwegeser, S.; Salvenmoser, W.; Ladurner, P. Biological adhesion of the flatworm Macrostomum lignano relies on a duo-gland system and is mediated by a cell type-specific intermediate filament protein. Front Zool 2014, 11, 12. [Google Scholar] [CrossRef]
- Zadesenets, K.S.; Vizoso, D.B.; Schlatter, A.; Konopatskaia, I.D.; Berezikov, E.; Schärer, L.; Rubtsov, N.B. Evidence for karyotype polymorphism in the free-living flatworm, Macrostomum lignano, a model organism for evolutionary and developmental biology. PLoS One 2016, 11, e0164915. [Google Scholar] [CrossRef] [PubMed]
- Ramm, S.A.; Lengerer, B.; Arbore, R.; Pjeta, R.; Wunderer, J.; Giannakara, A.; Berezikov, E.; Ladurner, P.; Schärer, L. Sex allocation plasticity on a transcriptome scale: socially sensitive gene expression in a simultaneous hermaphrodite. Mol Ecol 2019, 28, 2321–2341. [Google Scholar] [CrossRef]
- Wunderer, J.; Lengerer, B.; Pjeta, R.; Bertemes, P.; Kremser, L.; Lindner, H.; Ederth, T.; Hess, M.W.; Stock, D.; Salvenmoser, W.; Ladurner, P. A mechanism for temporary bioadhesion. Proc Natl Acad Sci USA 2019, 116, 4297–306. [Google Scholar] [CrossRef] [PubMed]
- Wudarski, J.; Egger, B.; Ramm, S.A.; Schärer, L.; Ladurner, P.; Zadesenets, K.S.; Rubtsov, N.B.; Mouton, S.; Berezikov, E. The free-living flatworm Macrostomum lignano. EvoDevo 2020, 11, 5. [Google Scholar] [CrossRef]
- Zadesenets, K.S.; Schärer, L.; Rubtsov, N.B. New insights into the karyotype evolution of the free-living flatworm Macrostomum lignano (Platyhelminthes, Turbellaria). Sci Rep 2017, 7, 6066. [Google Scholar] [CrossRef]
- Zadesenets, K.S.; Ershov, N.I.; Berezikov, E.; Rubtsov, N.B. Chromosome evolution in the free-living flatworms: first evidence of intrachromosomal rearrangements in karyotype evolution of Macrostomum lignano (Platyhelminthes, Macrostomida). Genes (Basel) 2017, 8, 298. [Google Scholar] [CrossRef]
- Zadesenets, K.S.; Jetybayev, I.Y.; Schärer, L.; Rubtsov, N.B. Genome and karyotype reorganization after whole genome duplication in free-living flatworms of the genus Macrostomum. Int J Mol Sci 2020, 21, 680. [Google Scholar] [CrossRef]
- Egger, B.; Ishida, S. Chromosome fission or duplication in Macrostomum lignano (Macrostomorpha, Plathelminthes) – remarks on chromosome numbers in ‘archoophoran turbellarians’. J Zool Syst Evol Res 2005, 43, 127–132. [Google Scholar] [CrossRef]
- Janicke, T.; Schärer, L. Sperm competition affects sex allocation but not sperm morphology in a flatworm. Behav Ecol Sociobiol 2010, 64, 1367–1375. [Google Scholar] [CrossRef]
- Dobin, A.; Davis, C.A.; Schlesinger, F.; Drenkow, J.; Zaleski, C.; Jha, S.; Batut, P.; Chaisson, M.; Gingeras, T.R. STAR: ultrafast universal RNA-seq aligner. Bioinformatics 2013, 29, 15–21. [Google Scholar] [CrossRef]
- Mapleson, D.; Venturini, L.; Kaithakottil, G.; Swarbreck, D. Efficient and accurate detection of splice junctions from RNA-seq with Portcullis. Gigascience 2018, 7, giy131. [Google Scholar] [CrossRef]
- Venturini, L.; Caim, S.; Kaithakottil, G.G.; Mapleson, D.L.; Swarbreck, D. Leveraging multiple transcriptome assembly methods for improved gene structure annotation. Gigascience 2018, 7, giy093. [Google Scholar] [CrossRef]
- Pertea, G.; Pertea, M. GFF Utilities: GffRead and GffCompare. F1000Res. 2020, 9, ISCB Comm J-304. [Google Scholar] [CrossRef] [PubMed]
- Love, M.I.; Huber, W.; Anders, S. Moderated estimation of fold change and dispersion for RNA-seq data with DESeq2. Genome Biol 2014, 15, 550. [Google Scholar] [CrossRef]
- Schärer, L.; Ladurner, P.; Rieger, R.M. Bigger testes do work more: experimental evidence that testis size reflects testicular cell proliferation activity in the marine invertebrate, the free-living flatworm Macrostomum sp. Behav Ecol Sociobiol 2004, 56, 420–425. [Google Scholar] [CrossRef]
- Orr-Weaver, T.L. When bigger is better: the role of polyploidy in organogenesis. Trends Genet 2015, 31, 307–315. [Google Scholar] [CrossRef]
- Vizoso, D.B.; Rieger, G.; Schärer, L. Goings-on inside a worm: functional hypotheses derived from sexual conflict thinking. Biol J Linn Soc 2010, 99, 370–383. [Google Scholar] [CrossRef]
- Schärer, L.; Joss, G.; Sandner, P. Mating behaviour of the marine turbellarian Macrostomum sp.: These worms suck. Mar Biol 2004, 145, 373–380. [Google Scholar] [CrossRef]
- Santhosh, S.; Ebert, D.; Janicke, T. Sperm competition favours intermediate sperm size in a hermaphrodite. J Evol Biol 2024, 37, 829–838. [Google Scholar] [CrossRef]
- Egger, B.; Ladurner, P.; Nimeth, K.; Gschwentner, R.; Rieger, R. The regeneration capacity of the flatworm Macrostomum lignano - on repeated regeneration, rejuvenation, and the minimal size needed for regeneration. Dev Genes Evol 2006, 216, 565–577. [Google Scholar] [CrossRef]
- Pfister, D.; De Mulder, K.; Philipp, I.; Kuales, G.; Hrouda, M.; Eichberger, P.; Borgonie, G.; Hartenstein, V.; Ladurner, P. The exceptional stem cell system of Macrostomum lignano: screening for gene expression and studying cell proliferation by hydroxyurea treatment and irradiation. Front Zool 2007, 4, 9. [Google Scholar] [CrossRef] [PubMed]
- Sekii, K.; Salvenmoser, W.; De Mulder, K.; Schärer, L.; Ladurner, P. Melav2, an elav-like gene, is essential for spermatid differentiation in the flatworm Macrostomum lignano. BMC Dev Biol 2009, 9, 62. [Google Scholar] [CrossRef] [PubMed]
- Grudniewska, M.; Mouton, S.; Grelling, M.; Wolters, A.H.G.; Kuipers, J.; Giepmans, B.N.G.; Berezikov, E. A novel flatworm-specific gene implicated in reproduction in Macrostomum lignano. Sci Rep 2018, 8, 3192. [Google Scholar] [CrossRef] [PubMed]
- Arbore, R.; Sekii, K.; Beisel, C.; Ladurner, P.; Berezikov, E.; Schärer, L. Positional RNA-Seq identifies candidate genes for phenotypic engineering of sexual traits. Front Zool 2015, 12, 14. [Google Scholar] [CrossRef]
- Sheltzer, J.M.; Torres, E.M.; Dunham, M.J.; Amon, A. Transcriptional consequences of aneuploidy. Proc Natl Acad Sci U S A 2012, 109, 12644–12649. [Google Scholar] [CrossRef]
- Zadesenets, K.S.; Rubtsov, N.B. From cytogenetics to proteogenomics: new horizons in the study of aneuploidies. Vavilovskii Zhurnal Genet Selektsii 2025, 29, 335–348. [Google Scholar] [CrossRef]
- Sullivan, K.D.; Lewis, H.C.; Hill, A.A.; Pandey, A.; Jackson, L.P.; Cabral, J.M.; Smith, K.P.; Liggett, L.A.; Gomez, E.B.; Galbraith, M.D.; DeGregori, J.; Espinosa, J.M. Trisomy 21 consistently activates the interferon response. Elife 2016, 5, e16220. [Google Scholar] [CrossRef]
- Raznahan, A.; Parikshak, N.N.; Chandran, V.; Blumenthal, J.D.; Clasen, L.S.; Alexander-Bloch, A.F.; Zinn, A.R.; Wangsa, D.; Wise, J.; Murphy, D.G.M.; Bolton, P.F.; Ried, T.; Ross, J.; Giedd, J.N.; Geschwind, D.H. Sex-chromosome dosage effects on gene expression in humans. Proc. Natl. Acad. Sci. U S A 2018, 115, 7398–7403. [Google Scholar] [CrossRef]
- Li, R.; Zhu, J. Effects of aneuploidy on cell behaviour and function. Nat Rev Mol Cell Biol 2022, 23, 250–265. [Google Scholar] [CrossRef]
- Pavelka, N.; Rancati, G.; Zhu, J.; Bradford, W.D.; Saraf, A.; Florens, L.; Sanderson, B.W.; Hattem, G.L.; Li, R. Aneuploidy confers quantitative proteome changes and phenotypic variation in budding yeast. Nature 2010, 468, 321–325. [Google Scholar] [CrossRef]
- Veitia, R.A.; Bottani, S.; Birchler, J.A. Gene dosage effects: nonlinearities, genetic interactions, and dosage compensation. Trends Genet 2013, 29, 385–393. [Google Scholar] [CrossRef]
- Pires, J.C.; Conant, G.C. Robust yet fragile: expression noise, protein misfolding, and gene dosage in the evolution of genomes. Annu Rev Genet 2016, 50, 113–131. [Google Scholar] [PubMed]
- Birchler, J.A.; Veitia, R.A. Gene balance hypothesis: connecting issues of dosage sensitivity across biological disciplines. Proc Natl Acad Sci U S A 2012, 109, 14746–14753. [Google Scholar] [CrossRef]
- Veitia, R.A.; Potier, M.C. Gene dosage imbalances: action, reaction, and models. Trends Biochem Sci 2015, 40, 309–317. [Google Scholar] [CrossRef]
- Lindemans, M.; Liu, F.; Janssen, T.; Husson, S.J.; Mertens, I.; Gäde, G.; Schoofs, L. Adipokinetic hormone signaling through the gonadotropin-releasing hormone receptor modulates egg-laying in Caenorhabditis elegans. Proc Natl Acad Sci U S A 2009, 106, 1642–1647. [Google Scholar] [CrossRef]
- Kobayashi, A.; Hamada, M.; Yoshida, M.A.; Kobayashi, Y.; Tsutsui, N.; Sekiguchi, T.; Matsukawa, Y.; Maejima, S.; Gingell, J.J.; Sekiguchi, S.; Hamamoto, A.; Hay, D.L.; Morris, J.F.; Sakamoto, T.; Sakamoto, H. Vasopressin-oxytocin-type signaling is ancient and has a conserved water homeostasis role in euryhaline marine planarians. Sci Adv 2022, 8, eabk0331. [Google Scholar] [CrossRef] [PubMed]
- Mäkelä, J.A.; Saario, V.; Bourguiba-Hachemi, S.; Nurmio, M.; Jahnukainen, K.; Parvinen, M.; Toppari, J. Hedgehog signalling promotes germ cell survival in the rat testis. Reproduction 2011, 142, 711–721. [Google Scholar] [CrossRef]
- Kibet, M.K.; Hilchenbach, J.; Neumann, L.; Mayer, R.; Aigner, G.P.; Höckner, M.; Hobmayer, B.; Egger, B. Silencing of β-catenin1 blocks tail regeneration, but does not induce head regeneration in the flatworm Macrostomum lignano. Discov Dev Biol 2025, 235, 1. [Google Scholar] [CrossRef]
- Demircan, T.; Berezikov, E. The Hippo pathway regulates stem cells during homeostasis and regeneration of the flatworm Macrostomum lignano. Stem Cells Dev 2013, 22, 2174–2185. [Google Scholar] [CrossRef]
- Choudhury, D.; Ghosh, D.; Mondal, M.; Singha, D.; Pothuraju, R.; Malakar, P. Polyploidy and mTOR signaling: a possible molecular link. Cell Commun Signal 2024, 22, 196. [Google Scholar] [CrossRef] [PubMed]
- Muenzner, J.; Trébulle, P.; Agostini, F.; Zauber, H.; Messner, C.B.; Steger, M.; Kilian, C.; Lau, K.; Barthel, N.; Lehmann, A.; Textoris-Taube, K.; Caudal, E.; Egger, A.S.; Amari, F.; De Chiara, M.; Demichev, V.; Gossmann, T.I.; Mülleder, M.; Liti, G.; Schacherer, J.; Selbach, M.; Berman, J.; Ralser, M. Natural proteome diversity links aneuploidy tolerance to protein turnover. Nature 2024, 630, 149–157. [Google Scholar] [CrossRef] [PubMed]
- Storchová, Z. Cells cope with altered chromosome numbers by enhancing protein breakdown. Nature 2024, 630, 41–43. [Google Scholar] [CrossRef] [PubMed]
- Shyh-Chang, N.; Ng, H. H. The metabolic programming of stem cells. Genes Dev 2017, 31, 336–346. [Google Scholar] [CrossRef]
Figure 1.
Cells involved in proliferation in the one-day-old euploid (left) and aneuploid (right) hatchlings detected with the EdU proliferation assay. Scale bar 50 µm.
Figure 1.
Cells involved in proliferation in the one-day-old euploid (left) and aneuploid (right) hatchlings detected with the EdU proliferation assay. Scale bar 50 µm.
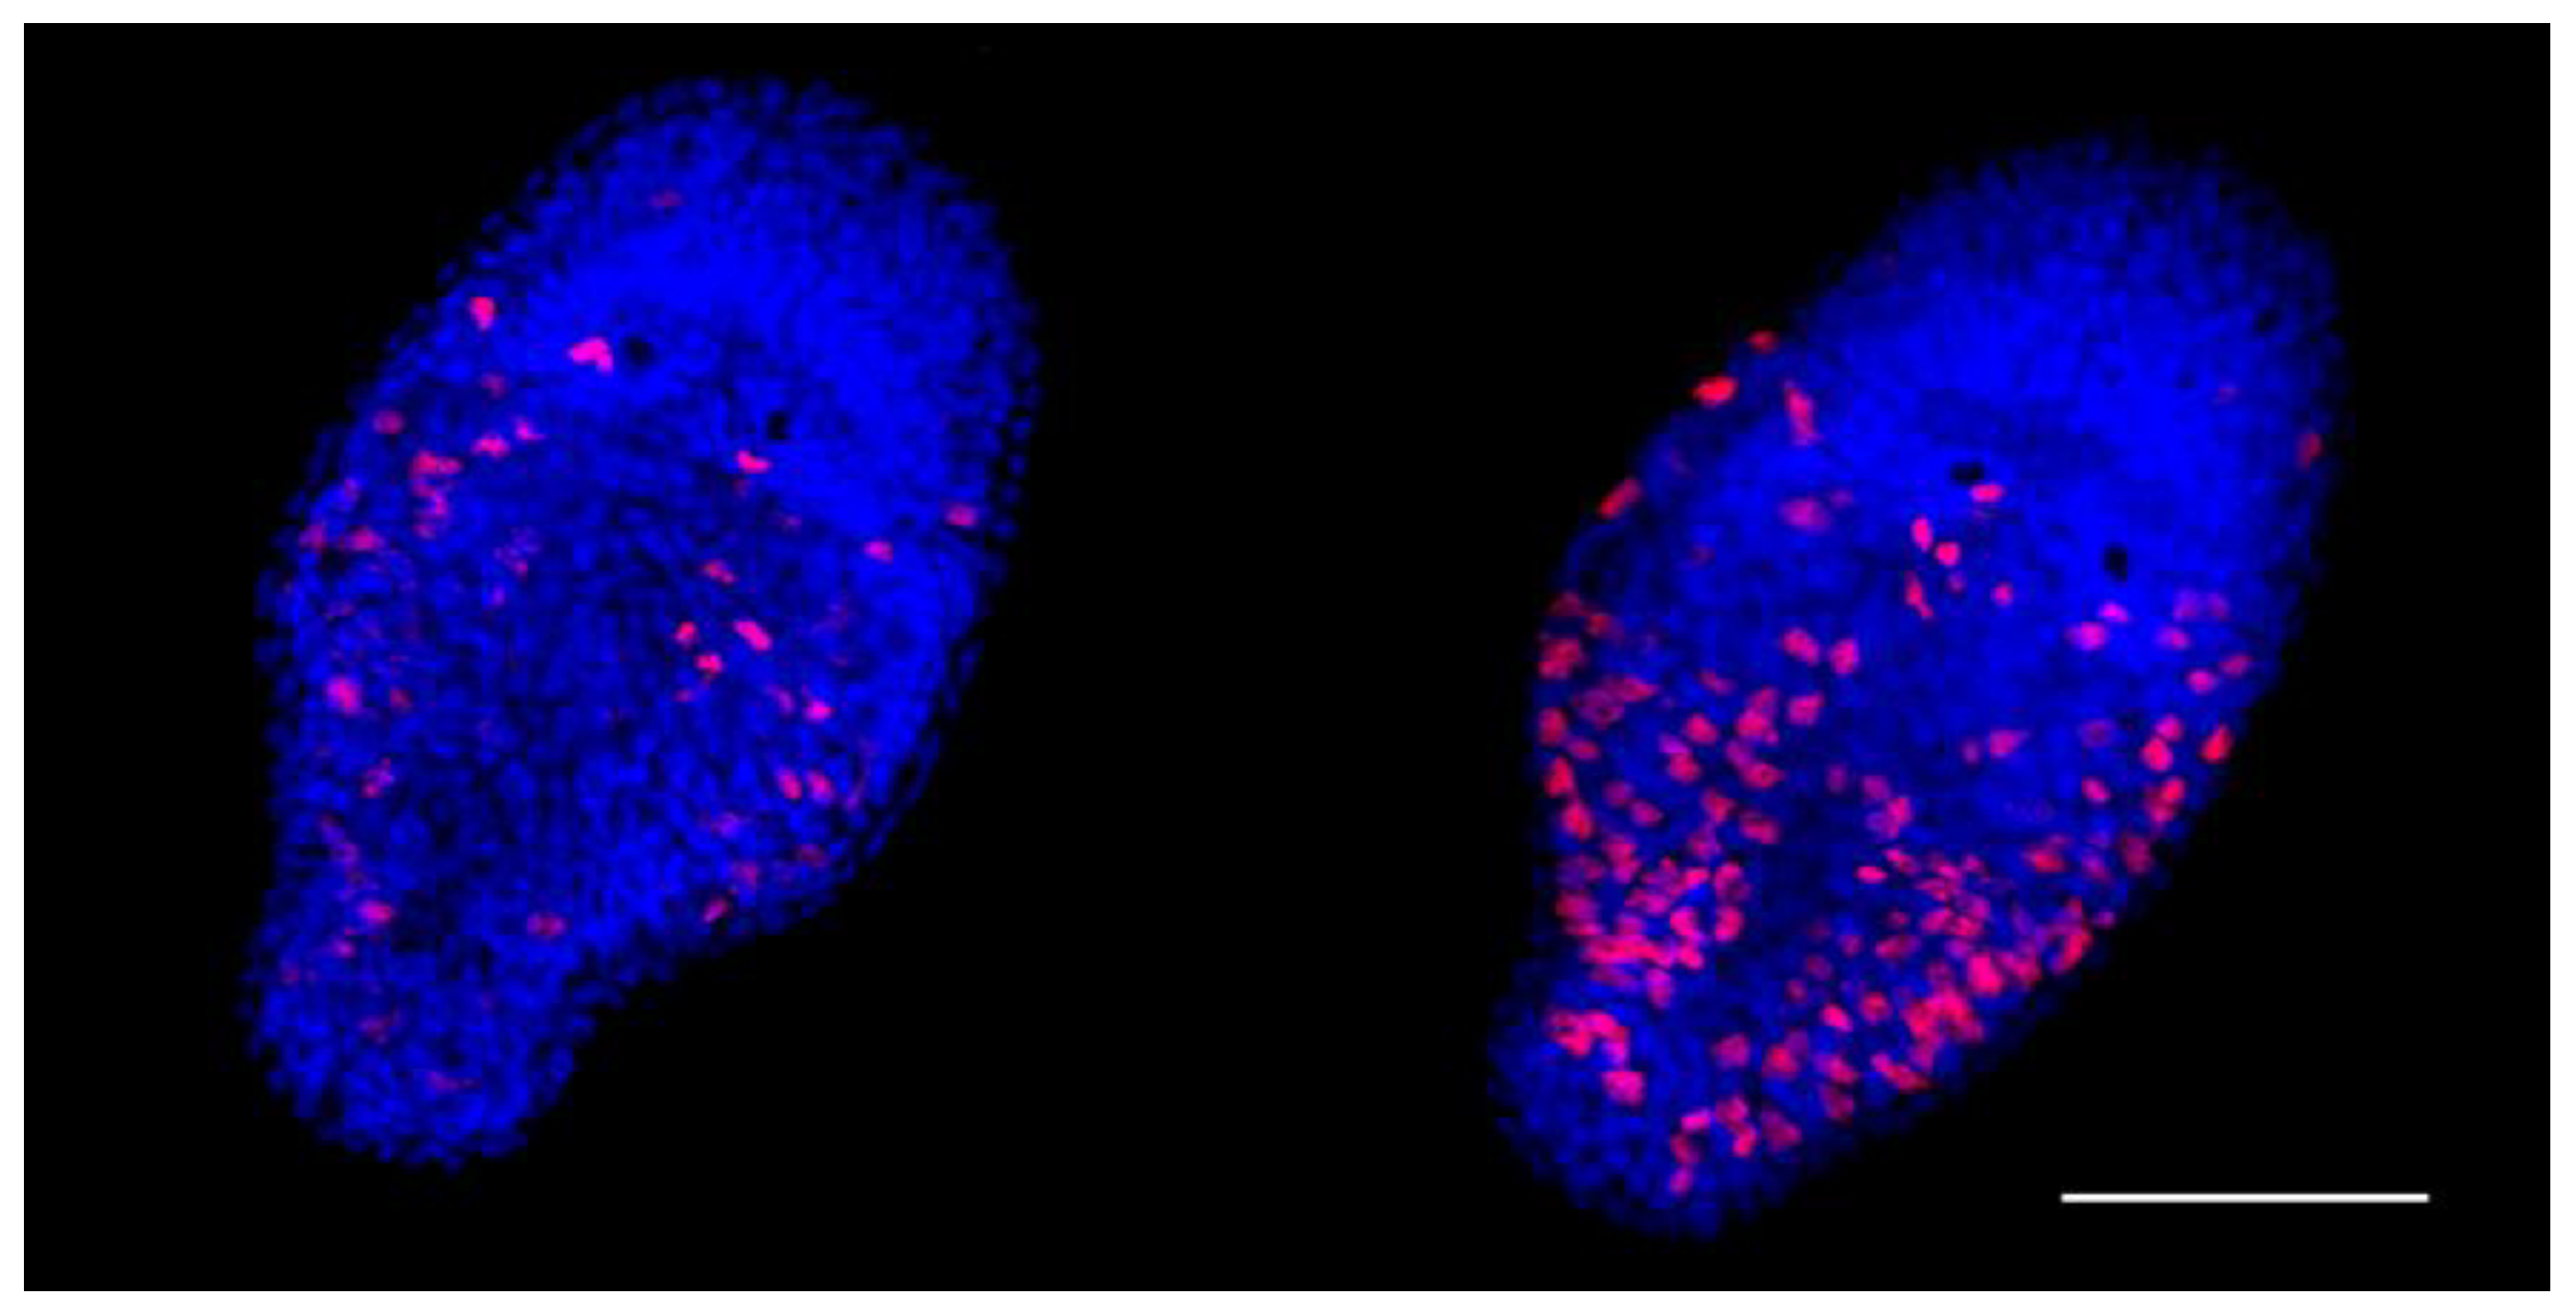
Figure 2.
Distribution of inter-strain fold-changes obtained for WGS and RNA-seq data with different normalizations. Values for depth-normalized WGS (a) and RNA-seq (b) data, and RNA-seq data that have been additionally normalized to gene dose (c). The color indicates the predicted assignment of the corresponding genes to the L1L2 (red), S (blue) subgenomes, or unassigned genes (grey), based on the fixed fold-change threshold for WGS data.
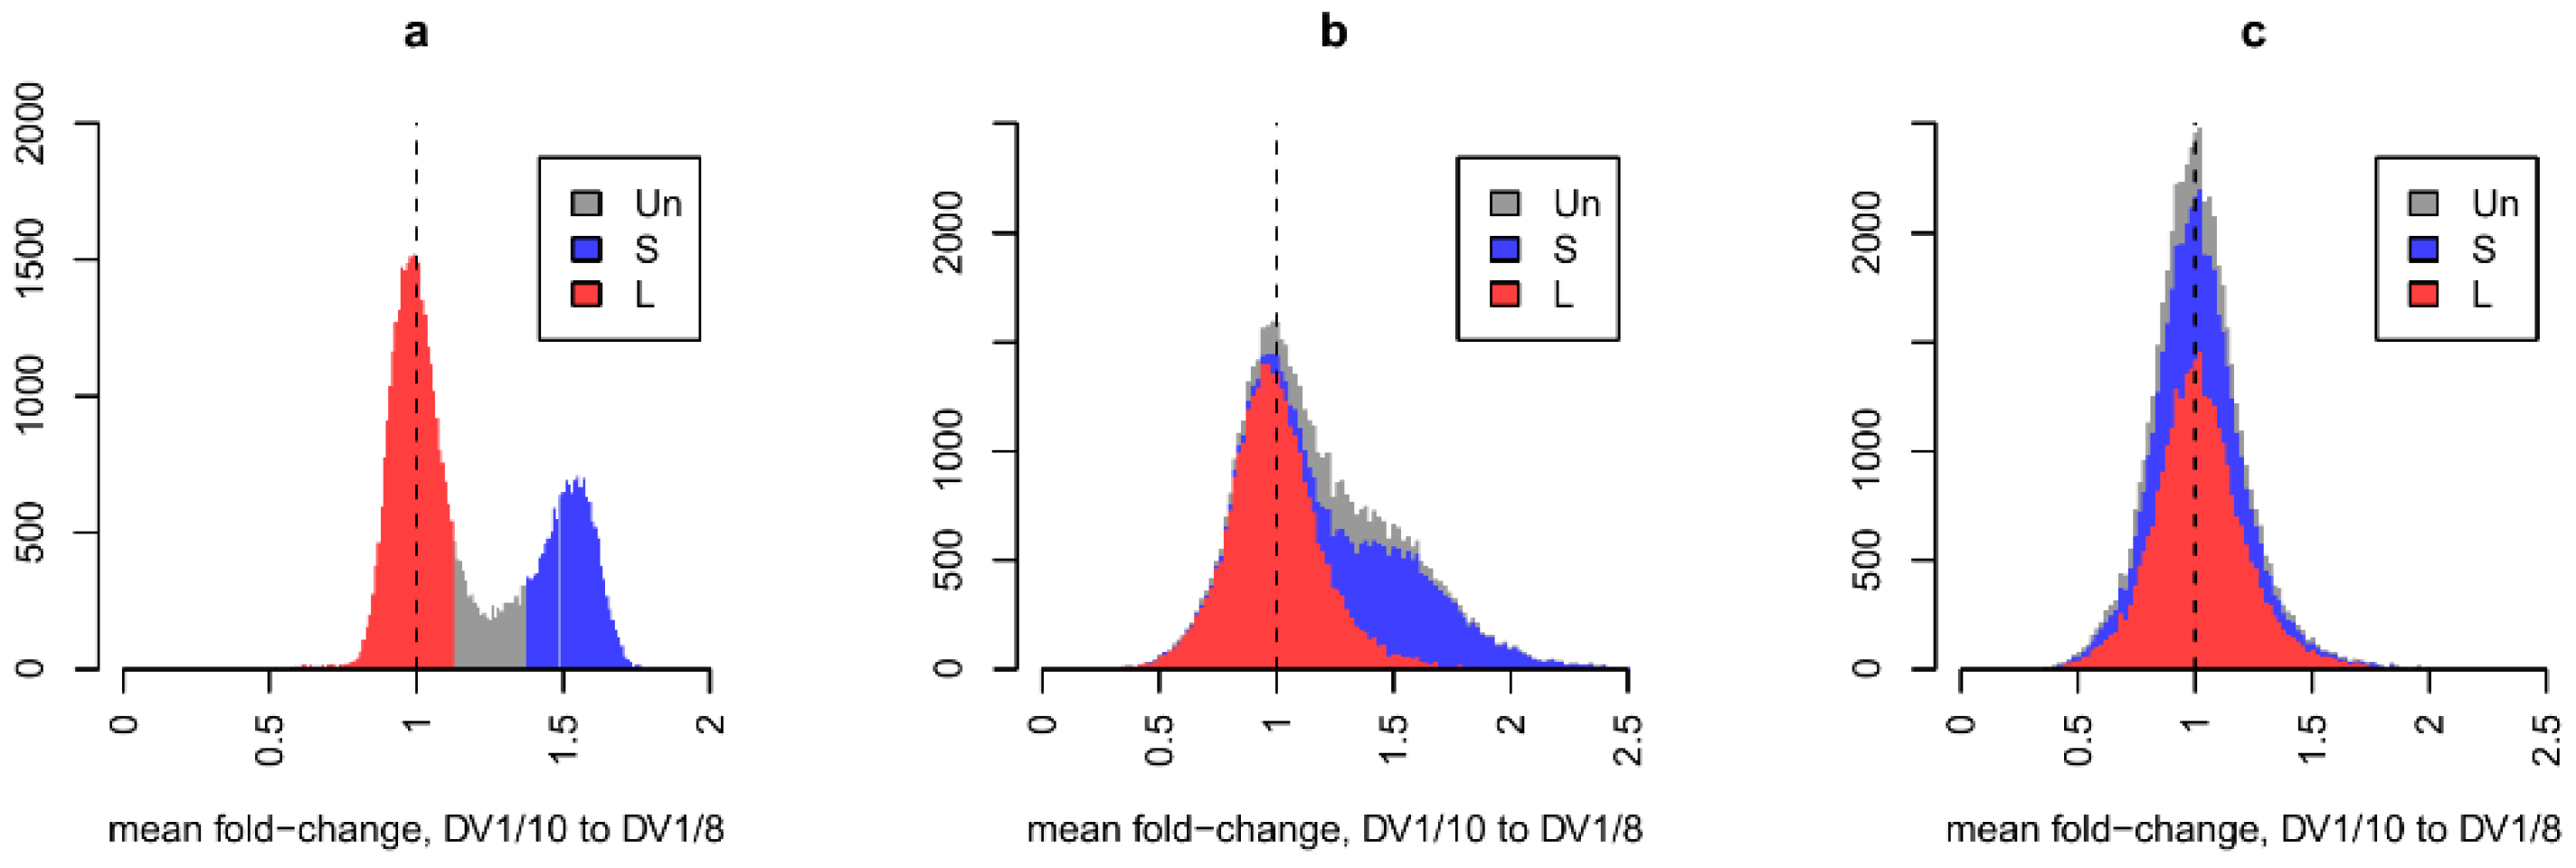
Figure 3.
DEGs belonging to the subgenomes L1/L2 and S, and DEGs with unknown attachment (NA). Up-and downregulated genes are indicated by colors (green and red, respectively). The numbers of genes are on the top of each bar.
Figure 3.
DEGs belonging to the subgenomes L1/L2 and S, and DEGs with unknown attachment (NA). Up-and downregulated genes are indicated by colors (green and red, respectively). The numbers of genes are on the top of each bar.
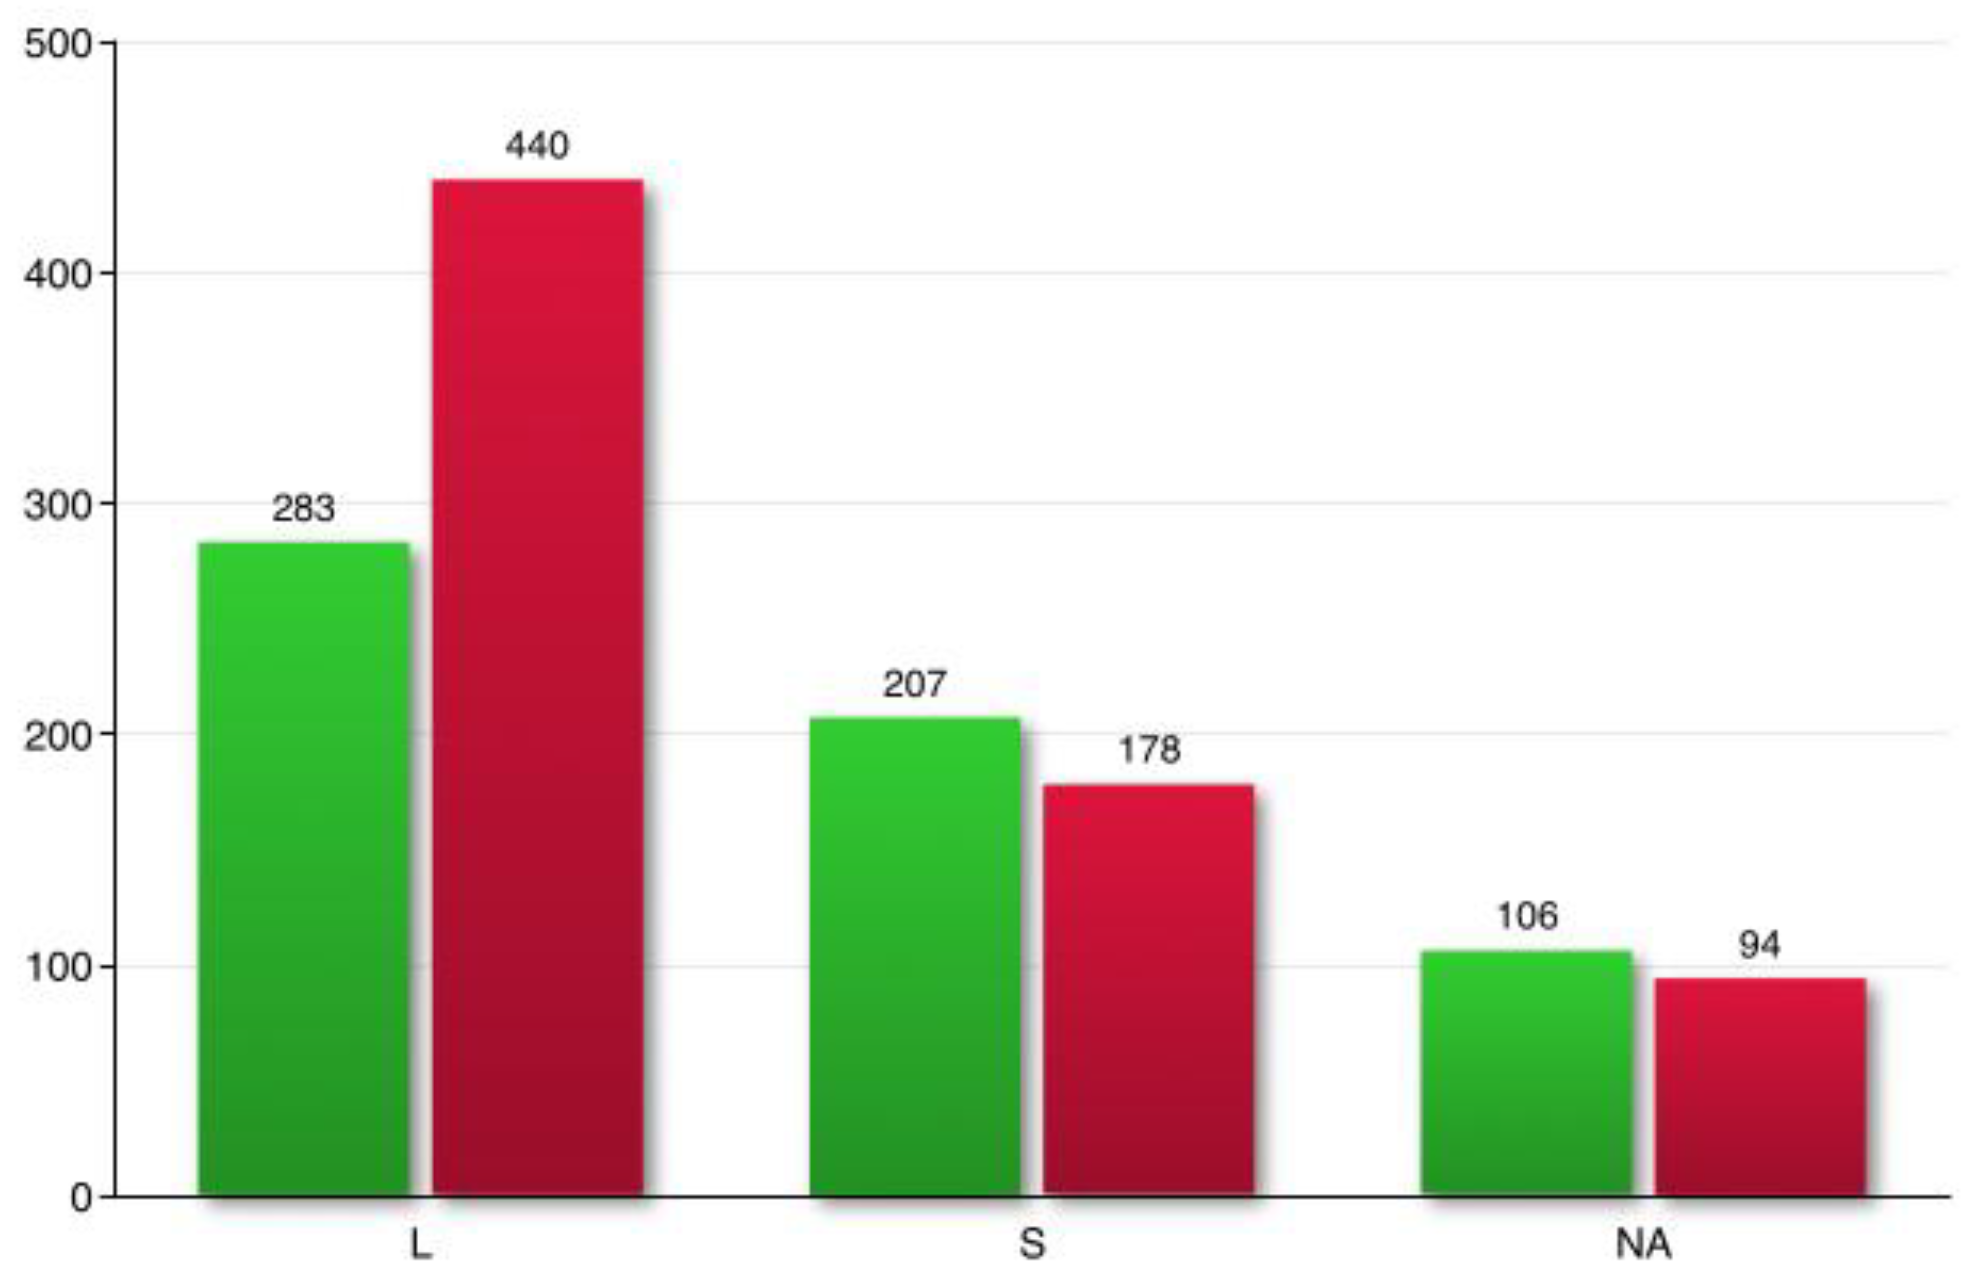
Figure 4.
Distribution of 22 top DEGs into gene ontologies by GO classification of transcripts biological process (BP), cellular component (CC), and molecular function (MF).
Figure 4.
Distribution of 22 top DEGs into gene ontologies by GO classification of transcripts biological process (BP), cellular component (CC), and molecular function (MF).


Table 1.
Morphometry of the euploid (the DV1_8 subline) and aneuploid worms (the DV1_10 subline).
| Subline | Body | Eye | Testis | Ovary | Stylet | Segmented L | ||||||
|---|---|---|---|---|---|---|---|---|---|---|---|---|
| L | W | A | d | L | A | L | A | Distal opening | Proximal opening | Straight L | ||
| DV1_8 | 1255,16 ±197,92 |
166,89 ±15,87 |
508642,71 ±37772,35 |
8.12 ±0.56 |
109.73 ±16.5 |
4147.32 ±1112.47 |
54.74 ±13.24 |
1510.19 ±485.92 |
4.82 ±0,66 |
14.58 ±2,41 |
69.88 ±3.91 |
70.39 ±4.28 |
| DV1_10 | 1480,83 ±156,27* |
183,44 ±26,59* |
520780,83 ±36558,49 |
8.39 ±0.62 |
144.89 ±16.61* |
7272.15 ±1331.13* |
72.76 ±23.89* |
2933.12 ±1741.63* |
4.76 ±0.6 |
15.09 ±2.46 |
75.68 ±4.69* |
74.39 ±12.21 |
The values represent means±1SD and include absolute length (L), width (W), diameter (d), or area (A). * - marks significant difference (P<0.05).
Table 2.
Morphometry of mature sperm.
| Subline | Sperm | ||||
|---|---|---|---|---|---|
| total L | body, L | feeler, L | brush, L | bristle, L | |
| DV1_8 | 53,85 ±6.06 |
11,86 ±1,50 |
17,01 ±1,63 |
5.15 ±0,86 |
11,79 ±0,86 |
| DV1_10 | 65,40 ±3,06* |
13,21 ±1,06* |
20,31 ±1,48* |
6,01 ±0,51* |
12,74 ±0,76* |
The values represent means±1SD and include absolute length (L) of different structures of sperm. * - marks significant difference (P<0.05).
Table 3.
Number of EdU-labeled cells in the body in the one-day-old DV1_8 and DV1_10 hatchlings and in the gonads of the adult worms.
Table 3.
Number of EdU-labeled cells in the body in the one-day-old DV1_8 and DV1_10 hatchlings and in the gonads of the adult worms.
| Subline | Hatchlings (h) | Adult worms (a) | ||||
|---|---|---|---|---|---|---|
| N | p-value | N | p-value | N | p-value | |
| testes | ovaries | |||||
| DV1_8 (2n=8) |
71.03 ±19.79 |
52.47 ±16.48 |
5.22 ±3.8 |
|||
| DV1_10 (2n=10) |
102.33 ±22.82* |
81.97 ±31.24* |
8.11 ±3.5* |
|||
| <0.00001 | 0.000015 | 4*10^-5 | ||||
The means±1SD are show. Significant p-values are written in bold. Statistical analysis was done using Student t-test. (t-value = -4.54, p-value = 0.000015); *marked significant difference (P<0.05).
Table 4.
Offspring production by the DV1_8 and DV_10 worms of M. lignano.
| Karyotype | N | Laid eggs (N) | Hatchlings (N) | Juveniles (N) | Abnormal/Dead worms (N) | Adults (N) |
|---|---|---|---|---|---|---|
| 2n=8 | 80 | 304 (209)* | 129 | 103 | 59 | 44 (34.11%)** |
| 2n=10 | 78 | 249 (161)* | 105 | 99 | 2 | 97 (92.38%)** |
*in brackets number of eggs laid to the sixth day of the experiment; **was counted for the number of hatched eggs.
Table 5.
Top ten most differentially expressed up- and down-regulated genes and their belonging to the subgenomes L1/L2 or S.
Table 5.
Top ten most differentially expressed up- and down-regulated genes and their belonging to the subgenomes L1/L2 or S.
| Transcript ID | Log2FC | Adjusted p-value | Subgenome |
|---|---|---|---|
| mikado.scaf1795G14 | 5.67 | 0.004391 | L |
| mikado.scaf3150G9 | 5.49 | 0.003809 | L |
| mikado.scaf656G9 | 4.26 | 1.92E-70 | S |
| mikado.scaf1804G1 | 3.59 | 9.03E-09 | L |
| mikado.scaf1592G1 | 3.16 | 0.022669 | L |
| mikado.scaf1151G13 | 3.16 | 0.002523 | L |
| mikado.scaf3332G6 | 2.99 | 1.8E-05 | S |
| mikado.scaf3157G7 | 2.89 | 0.001061 | NA |
| mikado.scaf3771G4 | 2.88 | 0.024537 | NA |
| mikado.scaf794G14 | 2.83 | 0.0418 | L |
| mikado.scaf514G9 | -2.29 | 0.00114 | L |
| mikado.scaf1021G14 | -2.32 | 0.007259 | NA |
| mikado.scaf4546G2 | -2.51 | 0.00025 | L |
| mikado.scaf572G34 | -2.55 | 0.009102 | L |
| mikado.scaf528G22 | -2.63 | 0.011372 | L |
| mikado.scaf77G16 | -3.16 | 1.31E-05 | S |
| mikado.scaf756G13 | -3.31 | 0.002773 | L |
| mikado.scaf1160G12 | -3.33 | 5.58E-05 | L |
| mikado.scaf1116G34 | -3.67 | 0.00151 | L |
| mikado.scaf249G20 | -4.93 | 0.01119 | S |
Disclaimer/Publisher’s Note: The statements, opinions and data contained in all publications are solely those of the individual author(s) and contributor(s) and not of MDPI and/or the editor(s). MDPI and/or the editor(s) disclaim responsibility for any injury to people or property resulting from any ideas, methods, instructions or products referred to in the content. |
© 2025 by the authors. Licensee MDPI, Basel, Switzerland. This article is an open access article distributed under the terms and conditions of the Creative Commons Attribution (CC BY) license (http://creativecommons.org/licenses/by/4.0/).
Copyright: This open access article is published under a Creative Commons CC BY 4.0 license, which permit the free download, distribution, and reuse, provided that the author and preprint are cited in any reuse.


