Submitted:
06 December 2025
Posted:
09 December 2025
You are already at the latest version
Abstract
A comprehensive study of the thermodynamic conditions (temperature, composition) of the existence of the cubic phase within the limits of homogeneity region in the quasi-binary PbF2-EuF3 system was carried out. Solid solution samples were obtained by solid-phase synthesis and co-precipitation technique from aqueous nitrate solutions. Phase equilibria were investigated in two regions: the solvus line in the range of 0-10 mol% EuF3 and the region of existence of the ordered rhombohedral R-phase in the range of 35-45 mol% EuF3. The structure of phases in the PbF2-EuF3 system was examined at temperatures below the phase transition temperature in lead fluoride (365°C). The possibility of obtaining a single-phase preparation of a cubic phase of high purity in 0-37 mol% EuF3 composition range has been demonstrated. The region of existence of the ordered rhombohedral R-phase in the concentration range from 37-39 to 43-44 mol% EuF3 was defined using X-ray phase analysis, optical probing, and Raman scattering.
Keywords:
europium fluoride
; lead fluoride
; solid solutions
; co-deposition
; solid-phase synthesis
1. Introduction
Lead fluoride crystal has favorable properties such as a high density, non-hygroscopic, relatively chemically inert and short radiation length, while the scintillation light output is too small to obtain a photo-absorption peak under gamma ray excitation. Thus, it could not be used in medical imaging applications [1]. Lead fluoride crystal is widely used for detection of beta rays due to its relatively small back scattering. Lead fluoride activated by Europium (PbF2:Eu) is light scintillators which are used for detection of charged particles and soft gamma ray up to several hundred keV [2].
Timing performance of PbF2 crystals of various lengths and surface conditions coupled to SiPMs was evaluated against a reference detector with an optimized test setup using high-frequency readout and novel time walk correction, with special attention to the inherent limitations of single-photon Cherenkov detection only [3, 4].
Ce doped PbF2 crystals did not show intense photo- and radio-luminescence, Eu and Ho doped ones showed several peaks excited under UV and 5.5-MeV alpha ray excitation, respectively [5].
In general, fluoride compounds and solid solutions in PbF2-REF3 systems (RE = rare earth element) are of interest for research as luminescent [6,7,8,9,10] and laser materials [11,12,13,14], especially effective in the mid-infrared range and in up-conversion imaging [10], as well as ionic conductors [15]. These systems have a wide crystallization region of the cubic fluorite phase Fmm (over 20 mol% at 650-700 °C) [6,7], but the phase diagrams and the phase existence regions at low temperatures (below 650 °C) are insufficiently studied. The complexity of studying these phase diagrams lies in the fact that lead fluoride undergoes a phase transition at 335-360 °C. The high-temperature cubic modification of lead difluoride (β-PbF2) crystallizes in a cubic fluorite-like structure (Fmm), while the low-temperature phase (α-PbF2) crystallizes in a rhombic structure (Pnma) [6]. There is no reliable information about the homogeneity limits of PbF2, given the need to conduct research with highly pure materials. Typically, the declared chemical purity of the PbF2 under study is no more than 99.9 wt%.
PbF2 β→α phase transition is "frozen" because of the metastable state of β-PbF2 at room temperature. It allows using this material as a fluoride-ion conductor and optical material. When heated, the phase transition occurs easily, whereas when β-PbF2 is cooled from high temperatures, the phase transition is kinetically hindered.
In general, for the systems (MF2 – REF3, where M=Ba2+, Sr2+, Ca2+, and Pb2+; RE=rare earth element), the presence of a rhombohedral ordered phase (R-phase) with the ideal composition M4RE3F17, existing in a relatively narrow concentration range of about 40 mol% REF3 [7,16,17,18,19,20] is assumed. According to the data [18], this phase is close to the fluorite phase, which complicates the identification of "rhombohedral fluorite".
The phase diagram of the PbF2-EuF3 system is insufficiently explored – the high-temperature range of 650-1300 °C is only predicted [6] based on diagrams of other rare earth elements, both F- and R-phases were identified at 650 °C [7], analysis conducted at 50 and 500 °C did not establish the presence of the R-phase, as this region was examined with a large interval of 10 mol%. Meanwhile, highly concentrated environments with reduced symmetry, activated by Eu, are promising materials for laser generation in the red spectral range [21].
Studies of solid solutions of PbF2-EuF3 and glass-ceramic materials have shown that the introduction of EuF3 in concentrations of 7-10 mol% stabilizes the high-temperature phase even when synthesized at temperatures below 300 °C [8,9]. Thus, on the T-X diagram of PbF2-EuF3 at temperatures below 365 °C and EuF3 concentrations of 0-10 mol%, there should be a line between the regions of crystallization of a single cubic phase solid solution Pb1-xRExF2+x and the region of crystallization of two phases (solvus line). In the two-phase region, the above-mentioned solid solution phase and a phase extremely close to α-PbF2 are in equilibrium, as the solubility of RE in the low-temperature phase of lead fluoride is negligible (Figure 1).
It is known that impurities even in concentrations of hundredths of a mol.% can significantly shift the boundaries of the homogeneity region, including the temperatures of polymorphic transitions. [22].
The global task of the research was to clarify the boundaries of the homogeneity re-gion of the cubic phase for future development of synthesis technology of single phase extra pure cubic phase preparations in PbF2-EuF3 system. To solve the task, we investigated two regions of the phase diagram of the quasi-binary system PbF2-EuF3 within the composition range of 0-45 mol% EuF3 and identified the R-phase within the composition range of 35-45 mol% EuF3.
2. Materials and Methods
Preparations within the PbF2-EuF3 system with EuF3 content ranging from 0 to 12 mol% and from 35 to 45 mol% were synthesized at low temperature using the co-precipitation technique [9,23]. The starting materials included Pb(NO3)2 (99.99 wt%, LANHIT, Russia), Eu(NO3)3 (99.99 wt%, LANHIT, Russia), and HF (99.9 wt%, TECH Systems, Russia) and additionally purified to 99.99999 wt%. Initially, lead and europium nitrate solutions were prepared in bidistilled water (0.08 mol/L). Subsequently, these solutions were meticulously mixed in predetermined proportions. The resulting solution was added dropwise to hydrofluoric acid solution (5 vol%) with continuous stirring and a 10-fold excess of hydrofluoric acid to maintain a constant pH during the process. The process involved continuous stirring of the mother liquor using a magnetic stirrer. At this stage, a chemical reaction has been conducting:
(1-x)Pb(NO3)2 + xEu(NO3)3·6H2O + (2+x)HF → Pb1-xEuxF2+x↓ + H2O,
The synthesis was carried out in a polypropylene reactor, and upon completion, the matrix solution was further stirred for one hour. The resulting precipitate was decanted, washed with bidistilled water until a negative reaction of diphenylamine to nitrate ions was observed, and then air-dried at 40–50 °C.
In order to determine the temperature of the phase transition, the powders were subjected to heat treatment at temperatures of 200, 300, 330, 350, 360, and 400°C for 48 hours in a resistance tube furnace. Subsequently, a comprehensive set of analysis was conducted. The samples were then placed in the furnace and subjected to heat treatment at the same temperatures for an additional 24 hours, followed by further investigation.
Preparations in the PbF2-EuF3 system with EuF3 concentrations ranging from 35 to 45 mol% were also obtained via solid-state synthesis at 550°C. PbF2 (99.99% purity, LANHIT, Russia) and EuF3 (99.99% purity, LANHIT, Russia) were used as starting materials. The solid-state synthesis was conducted in a resistance tube furnace at 550°C for 2 hours in corundum crucibles. Initially, the fluoride powders were ground in a mortar to increase the contact area between the reacting substances. Additionally, a fluorinating atmosphere was established [8, 9, 24] to prevent pyrohydrolysis.
The formation of a solid solution is described by the following chemical reaction.
(1-x)PbF2 + xEuF3→ Pb1-xEuxF2+x
After completion of the first stage, the resulting sintered powders were re-ground and placed in the furnace under identical conditions.
X-ray diffraction analysis was conducted using an Equinox 2000 X-ray diffractometer (CuKα radiation with a wavelength of λ = 1.54 Å), with an accuracy of lattice parameter determination of +1%·and sensitivity up to 1% of the impurity phase. X-ray diffraction patterns were interpreted using TOPAS software (PCPDFWIN electronic catalog and JCPDS-ICDD database), and phase ratios were calculated using Match! software. During the analysis, the absence of partially oxidized phase (Pb2OF2) was additionally monitored based on the peak at 2Θ = 26.75° [8,26].
Energy-dispersive X-ray spectroscopy (EDS) microanalysis was performed to determine the actual composition of the samples using a scanning electron microscope (SEM) model VEGA3-LMU (TESCAN, Brno, Czech Republic) equipped with a lanthanum hexaboride thermionic cathode and an Oxford Instruments X-MAX-50 EDS detector, operating in secondary electron mode. The AZTec software was utilized for data collection and processing. All measurements were conducted at room temperature, with no fewer than 8 points measured for each sample. Imaging was carried out at an accelerating voltage of 30 kV.
The impurity content of the starting materials and the resulting powders was determined by inductively coupled plasma mass spectrometry (ICP-MS). Lead fluoride-based powders were dissolved in 20 mL of sulfuric acid (7N, 96%) purified by a surface distillation systems Milestone DuoPUR (Milestone S.r.l., Sorisole, Italy) with microwave digestion of the sample in polytetrafluoroethylene autoclaves (DAP-100, PTFE, BERGHOFF GmbH&Co., Wenden, Germany) using a SPEEDWAVEFOUR microwave decomposition setup (BERGHOFF GmbH&Co., Wenden, Germany). The resulting solution was transferred to a polypropylene test tube, and diluted with water. Deionized water was obtained using an Aquapuri 5 - 551 Series (Young Lin Instruments Co., Ltd., Hogye, South Korea) and had an electrical resistance of 18.2 MΩ cm. The prepared solution was analyzed using inductively coupled plasma mass spectrometry (ICP-MS). Analytical measurements were carried out using an inductively coupled plasma mass spectrometer NexION300D (PerkinElmer Inc., Waltham, MA, USA) [26]. The resulting powders had a purity of greater than 99.99 wt% (see Table S1).
Europium (Eu3+) photoluminescence (PL) spectra were recorded using a Fluorolog FL3-22 spectrofluorometer (Horiba Jobin Yvon, USA) in the wavelength range of 400–700 nm with 0.1 nm step, excited by a diode laser (λ = 377 nm).
Raman scattering spectra (RS) were investigated using a HORIBA LabRam Soleil instrument (Horiba Jobin Yvon GmbH, Bensheim, Germany) with the ability to excite RS with lasers of three wavelengths: 377 nm, 532 nm, and 785 nm. In our case, only the 785 nm excitation wavelength was used, since in other caused excitation of Eu3+ fluorescence [27]. Measurements were carried out in the range of 149–3500 cm-1 with 2 cm-1 step.
Infrared (IR) transmittance measurements were performed using a Tensor 27 Fourier-transform infrared spectrometer (FTIR) (Bruker Optics Inc., Billerica, MA, USA) in the range of 400-8000 cm-1 with 1.9 cm-1 step.
3. Results and Discussion
3.1. Position of the Solvus line on the PbF2-EuF3 Diagram
The samples synthesized by co-precipitation method have appeared as fine white powders. The appearance did not change depending on the nominal europium content, indirectly indicating the absence of oxidized phases. Analysis of the phase composition of the samples after synthesis at nominal Eu concentrations from 0.5% to 7 mol% revealed the presence of two phases simultaneously: α-PbF2 and Pb1-xEuxF2+x. From 8 to 12 mol%, only one cubic phase of the solid solution with parameters corresponding to the nominal composition (Figure 2). In the composition range 0-5 mol% the X-ray reflections belonging to rhombic phase correspond to pure α-PbF2.
It is worth noting that the reflections of the cubic solid solution Pb1-xEuxF2+x are shifted relative to the reflections of nominally pure β-PbF2 in the greater Θ angles which indicates on compression of cubic lattice parameters because of incorporation of smaller Eu3+ ion in the crystal lattice of the solid solution.
The lattice parameter for these solid solutions obeys a linear equation (Vegard's law):
where 5.940 Å – β-PbF2 lattice parameter, x – the mol% of RE, the coefficient kEu = – 0.00237 was determined in [Error! Reference source not found.,Error! Reference source not found.].
a = 5.940 + kEu‧x,
The lattice parameter of the obtained solid solutions in the range of nominal EuF3 content from 1 to 7 mol% was found to be 5.919±0.003 Å, corresponding to EuF3 content of 7.0-9.5 mol% according to the Vegard law.
The examination of the PXRD patterns after heat treatments revealed (Figure 3, Figure S1, Table S2) that the proportion of the cubic phase began to increase starting from 300°C. For the sample with a nominal composition of Pb0.97Eu0.03F2.03, at 330°C, the volume fraction of α-PbF2 is small compared to the cubic phase of the solid solution (Fig. 3), which is consistent with the findings of a previous study [7].
A sharp increase in the proportion of the cubic phase is observed after 330°C; samples with a nominal EuF3 content exceeding 5 mol% in this temperature range are already the single-phase. In nominally pure PbF2, the rhombic phase is detected even after heat treatment at 360°C (Figure 4).
Remarkably, the lattice parameters of the cubic phase after heat treatment show a tendency to increase, indicating an approach to the lattice parameters of solid solutions obtained by solid-state synthesis at 500°C [8].
Figure 5.
Variation of lattice parameters of the cubic phase after heat treatment of samples with nominal composition Pb1-xEuxF2+x.
Figure 5.
Variation of lattice parameters of the cubic phase after heat treatment of samples with nominal composition Pb1-xEuxF2+x.
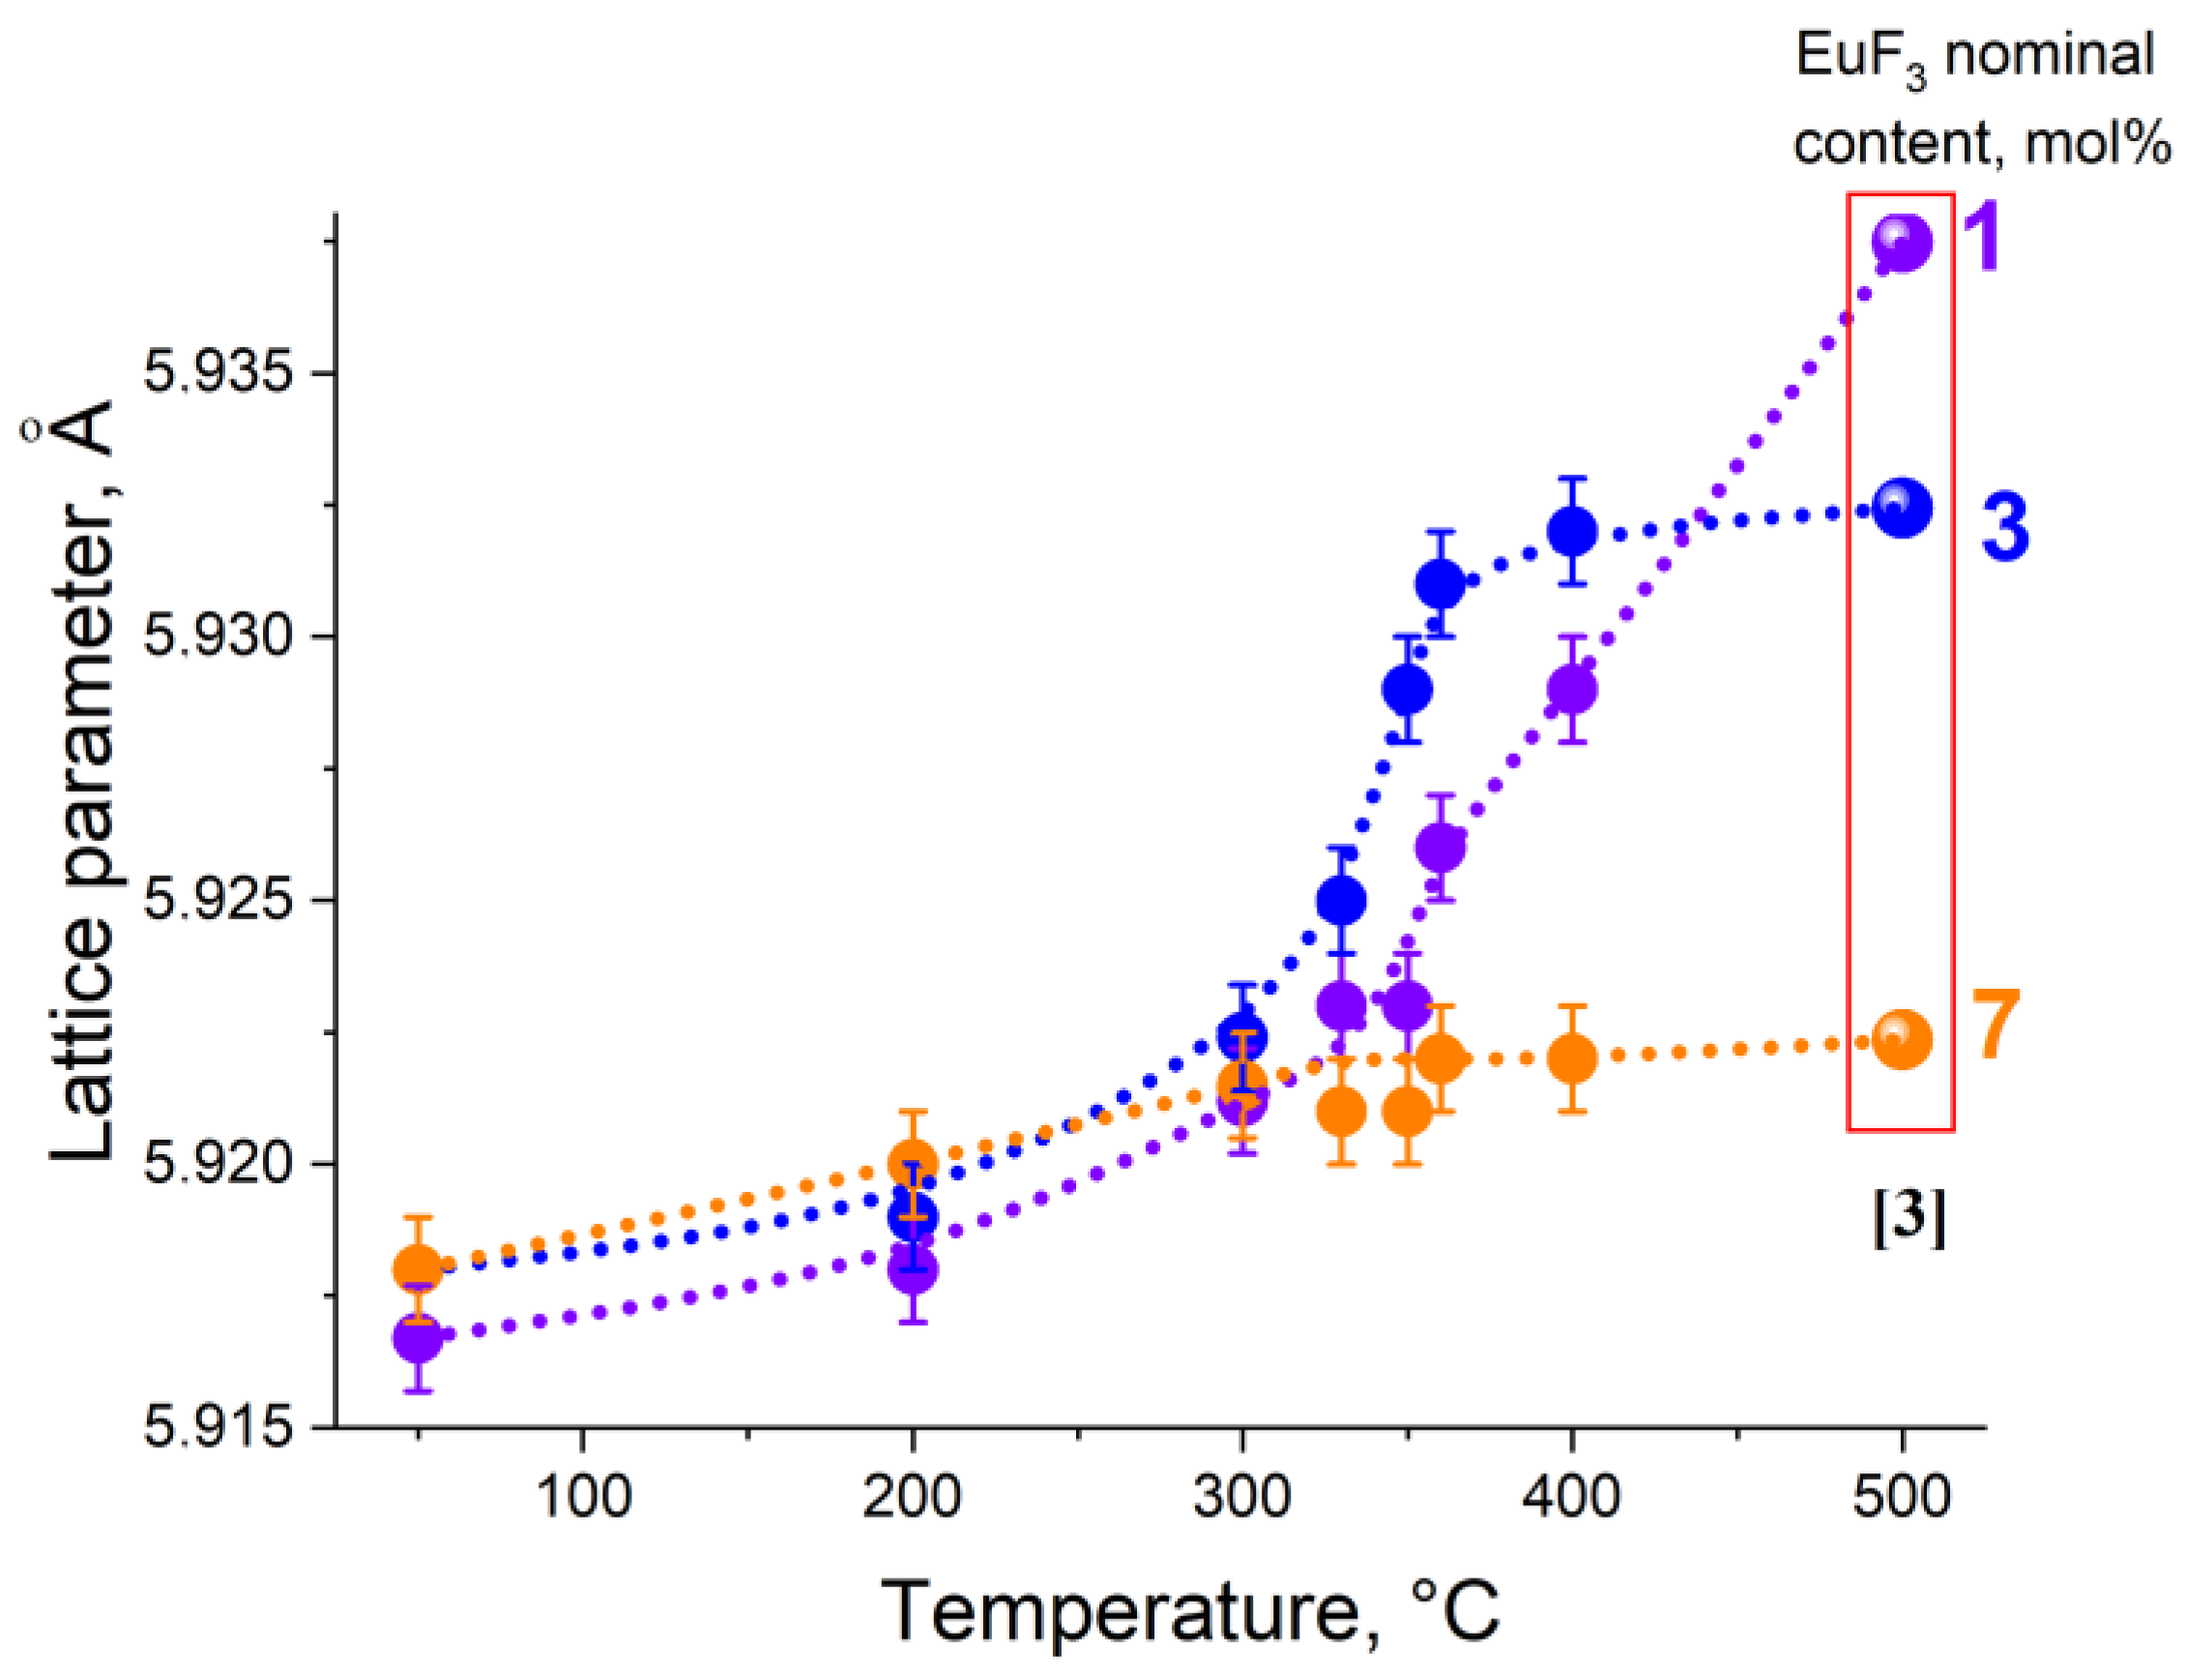
Such lattice parameter behavior and the unchanged properties of the powders after an additional 24-hour heat treatment indicate that the obtained values are close to equilibrium state.
Eu3+ is a luminescent-active impurity, and its spectrum is sensitive to changes in the symmetry of the surrounding environment. Thanks to this, the Eu3+ ion is often used as a spectroscopic probe, making samples with Eu3+ concentration of 0.1 mol% [28]. It is considered that at such concentrations, the additional introduction of Eu does not significantly alter the structure. In our case, the Eu concentration is knowingly higher and varies from sample to sample, so the use of all the fine capabilities of spectroscopic probing analysis may be incorrect, hence we used only an estimation of local symmetry by the asymmetry coefficient [8,9].
The electric dipole transition 5D0→7F2 (~ 612 nm) in the Eu3+ ion is highly sensitive. The magnetic dipole transition 5D0→7F1 (~ 590 nm), permitted in terms of parity, has an intensity that is practically independent of the point symmetry of the luminescent center and its environment. To characterize the local environment of Eu3+ ions, the asymmetry coefficient R21 is used. By definition, it is the ratio of the intensities of the highly sensitive electric dipole transition 5D0→7F2 and the magnetic dipole transition 5D0→7F1 [9]:
,
The greater the value of this ratio, the less symmetrical the environment of the europium ion in this matrix. Dominance in intensity of the band corresponding to the magnetic dipole transition 5D0→7F1 over the electric dipole transition 5D0→7F2 indicates an environment of the Eu3+ ion close to centrosymmetric, as observed in solid solutions (Figure 6).
The transition between the energy levels 5D0 and 7F0 is also forbidden by the selection rules for electronic dipole transitions, and moreover, these levels are degenerate and therefore have zero Stark splitting. This transition is practically absent in the fluorescence spectra of solid solutions, confirming a symmetry close to cubic for the Eu3+ optical centers.
As the annealing temperature increases, the asymmetry coefficient behaves differently depending on the nominal composition (Figure 7).
In samples with a nominal content of EuF3 ranging from 3 to 9 mol%, there is a gradual decrease in R21, indicating an increase in symmetry. In samples with 0.5 and 1 mol% EuF3, initially up to 200 °C, R21 increases due to structure relaxation, followed by a sharp decrease in R21, indicating increased centrosymmetry. In the phase transition region, R21 in all samples ranges from 0.30 to 0.35 (Table S2). Thus, the structural data obtained from XRD and luminescence studies coincide.
Figure 8 schematically represents a fragment of the T-X diagram of the quasi-binary system PbF2-EuF3 in the investigated range of temperatures and compositions. It is evident that with the increase in the nominal content of EuF3, the temperature of the phase transition sharply decreases. It is worth noting that the phase transition in all investigated compositions is frozen, as in nominally pure PbF2 [6], meaning that no phase separation occurs upon cooling for a long time (at least, no changes in the structure and luminescence of annealed powders have occurred over the course of a year).
3.2. Determining the Existence Region of the Rhombohedral R-Phase in the PbF2-EuF3 System
To determine the existence of the R-phase, samples were synthesized in the nominal Eu concentration range of 35 – 45 at% using co-precipitation and solid-phase methods. In both cases the synthesized samples appeared as white powders. It was particularly important in the case solid-phase synthesis, indicating the absence of oxidation processes and the formation of lead oxyfluorides and oxides.
X-ray spectral microanalysis allowed determining that the deviations from the theoretically calculated compositions of the samples during synthesis do not exceed 0.05 at% (Table S4). SEM analysis of powder images shows that the particle sizes obtained by co-precipitation technique vary widely from microns to tens of microns, with irregular shapes (Table S4). Finer powders (ranging from 0.5 to 1 micron) were obtained through solid-phase synthesis, attributed to several grinding steps during synthesis.
When studying the diffraction patterns of samples obtained by solid-phase synthesis (Figure 9a) and coprecipitation from aqueous nitrate solutions (Figure 9b), the presence of a solid solution with parameters different from the high-temperature cubic modification of PbF2 was discovered, which was especially noticeable at large values of 2Θ.
To confirm the assumption of the presence of the R-phase, the calculation of the unit cell parameter was carried out based on the obtained XRD data. Initially, the peaks were indexed within the framework of a cubic cell (Fmm) with parameters close to the high-temperature modification of lead fluoride. The obtained values of the unit cell parameter for samples obtained by solid-phase synthesis and co-precipitation technique are presented in Table S5.
Graphically analyzing the obtained results (Figure 10a), a significant difference is noticeable between the theoretical values obtained according to Vegard's law for a hypothetical solid solution Pb1-xEuxF2+x and the values of the unit cell parameter calculated for samples synthesized by co-precipitation and solid-phase methods. According to [28], the deviation is better observed in terms of the volume of the crystalline cell (Figure 10b), and correspondingly in linear equations (Röttgers’s rule):
where V0 – refers to the unit cell volume of the fluorite matrix MF2 (for β-PbF2 209,58 Å3), x – the mol% of RE, kV is the coefficient.
V = V0 + kV‧x,
kV = 3a0k,
Thus, from equations (3) and (6), kVEu = -0.2509.
In the range of 40-45 mol% EuF3, deviations in cell parameter and volume from the calculated values are observed. Scanning with a larger step [8] indicated that the violation of Vegard's law begins at 36±2 mol% EuF3, but a significantly different phase, based on the rhombic (Pnma) modification of europium trifluoride Er1-yPbyF3-y, can only be observed starting from 60 mol% EuF3. Thus, deviations from linear laws in the 40-45 mol% EuF3 range may be associated with the existence of a phase in this range, with reflections close to the Pb1-xEuxF2+x cubic solid solution, i.e., the R-phase.
We discovered, deviations from the linear law for samples obtained by solid-phase synthesis and co-precipitation were in opposite directions. A slight increase in the cell parameter for solid-phase samples corresponding to a solid solution with lower Eu concentration may indicate the presence of a narrow two-phase equilibrium region of the cubic solid solution Pb1-xEuxF2+x and its distorted modification, the R-phase. A decrease in the cell parameter for samples obtained by co-precipitation technique may be related to the non-equilibrium nature of the obtained phases.
Fluorescence spectra of powder samples in this concentration range were also investigated (Figure 11).
In 37-45 mol% EuF3 concentration range the asymmetry coefficient was significantly higher than in the range up to 10 mol% EuF3. For samples with composition (100-x)PbF2-xEuF3 (x=41 – 45 mol% EuF3), the coefficient R21 gradually increases (see Figure 12), indicating a slight increase in asymmetry due to the heterovalent substitution in the solid solution. However, with further increase in Eu concentration, R21 undergoes a sharp increase. Thus, the boundary at which the local structure begins to distort significantly is approximately 39 mol% Eu.
Additionally, vibrational spectra were investigated in this system. The complete vibrational representation for crystals with a fluorite structure can be expressed as [30]:
where F1u - represents a triply degenerate, antisymmetric vibration with respect to the center of symmetry, active in the infrared spectrum, and F2g - represents a triply degenerate, symmetric vibration with respect to the center of symmetry, active in the Raman spectrum.
Г = F1u (IR) + F2g (R),
FTIR spectroscopy (Figure S2) in our case does not allow determining the vibrational modes of cubic PbF2, as the F1u vibrations lie around 347 cm-1 (less than 400 cm-1) [30]. However, it did reveal the presence of nitro groups [NO3]– [31] and hydroxyl groups [OH]– [31] in samples obtained by co-precipitation (Fig. S2, Table S6), indicating the high sensitivity of the method, as the qualitative reaction of diphenylamine was negative, and the samples were dried for an extended period.
In the Raman spectra of crystals of undistorted fluorite type, a single line will be observed, and the frequency of this line for a crystal of nominally pure β-PbF2 falls within the range of 256-259 cm-1 [32], corresponding to the F2g vibration mode. This is clearly seen in the spectra of single-phase samples with concentrations of 5 and 11 mol% EuF3. When comparing the Raman spectra of samples with Eu concentrations ranging from 37 to 45 mol% EuF3, a noticeable shift in the peak maximum and broadening of the peaks can be observed (Figure 13, Table S7).
One can observe a significant shift in the peak maximum for samples containing Eu 37-43 at%, indicating the presence of another phase structurally similar (Figure 13). Since the phase of the cubic solid solution Pb1-xEuxF2+x and the R-phase are very close in structure and parameters, the splitting of the band into close components leads to its broadening. The narrowing of the band in the region of 43 at% Eu may be associated with the crystallization region of only the R-phase.
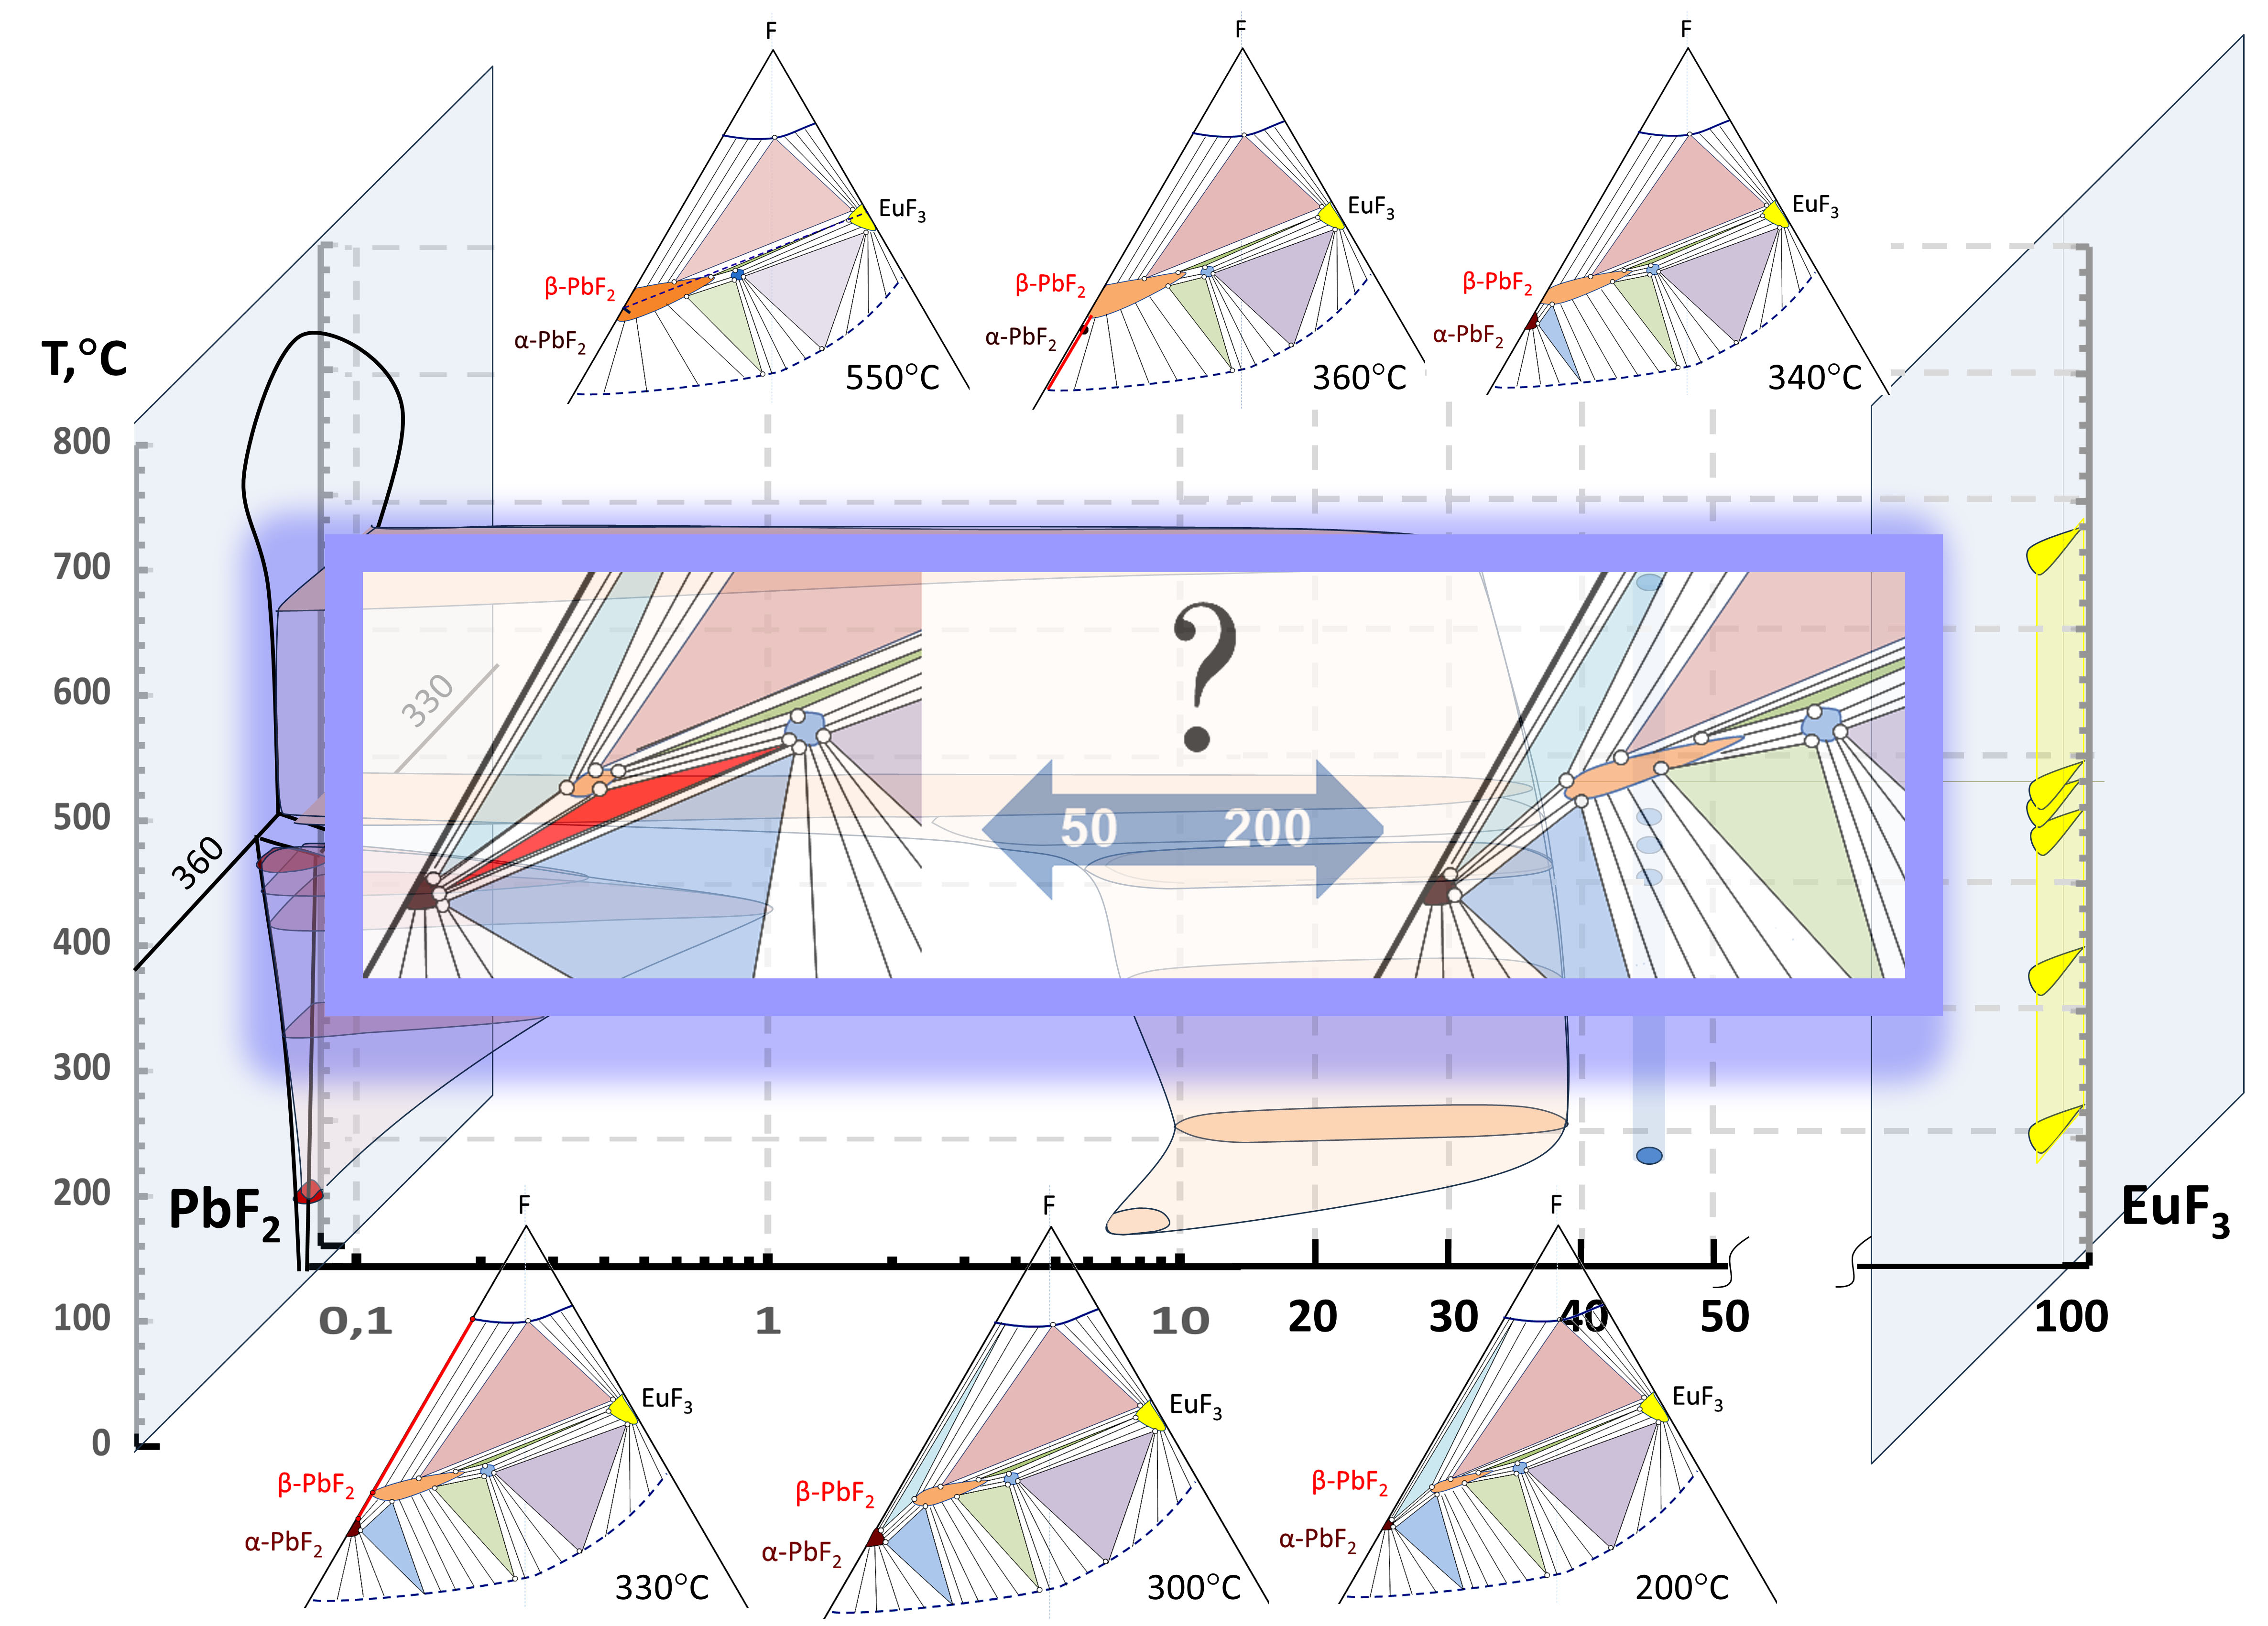
Summarizing the results of phase equilibria analysis we reconstructed T-X-Y diagram of Pb-Eu-F ternary system within the PbF2-EuF3 section (Figure 14). In this study we proved the general view of T-X-Y diagram [8] but expanded the temperature range from 50 to 550°C and clarified the concentration ranges of homogeneity limits for cubic and orthorhombic PbF2:Eu and R-phase. To better understanding we presented the fragment of T-X-Y diagram nearby PbF2-EuF3 quasi-binary cross-section in a variable scale with the large logarithmic scale near PbF2 and the linear scale starting from 10 mol.% of EuF3. The homogeneity limits were determined along PbF2-EuF3 quasi-binary cross-section in mol.% of EuF3. Their width towards Metal-F direction were less than 1 mol% which is typical for the homogeneity ranges of fluoride binary compounds [6].
The main features of the analyzed system were determined and it was established that the homogeneity region of the R-phase is about 1 mol.% and is within 44-45 mol.% EuF3, changing slightly with temperature over the entire temperature range under consideration.
The cubic solid solution Pb1-xEuxF2+x is located from 7.5 to 38 mol% EuF3 at 50-200°C with a retrograde motif. It then expanded from 7.5 to 37 mol.% EuF3 at 300°C. Starting at 330°C it reaches the T-Pb-F plane and no longer deviates from it with increasing temperature. The Eu-rich boundary of the cubic solid solution Pb1-xEuxF2+x shifts from 37 to 32 mol.% EuF3 at 550°C.
Simultaneously, the orthorhombic PbF2:Eu phase expanded from 0.1 to 1 mol.% EuF3 at temperature rise from 50 to 280°C. After then it is quickly compressed to zero at 360°C. In the entire temperature range under consideration, the homogeneity region of the orthorhombic PbF2 phase does not detach from the T-Pb-F plane.
So, we established that the stable cubic phase in PbF2-EuF3 quasi-binary system could be obtained at all temperatures starting from RT to 550°C and it exists in a wide concentration range up to 38 mol% of EuF3.
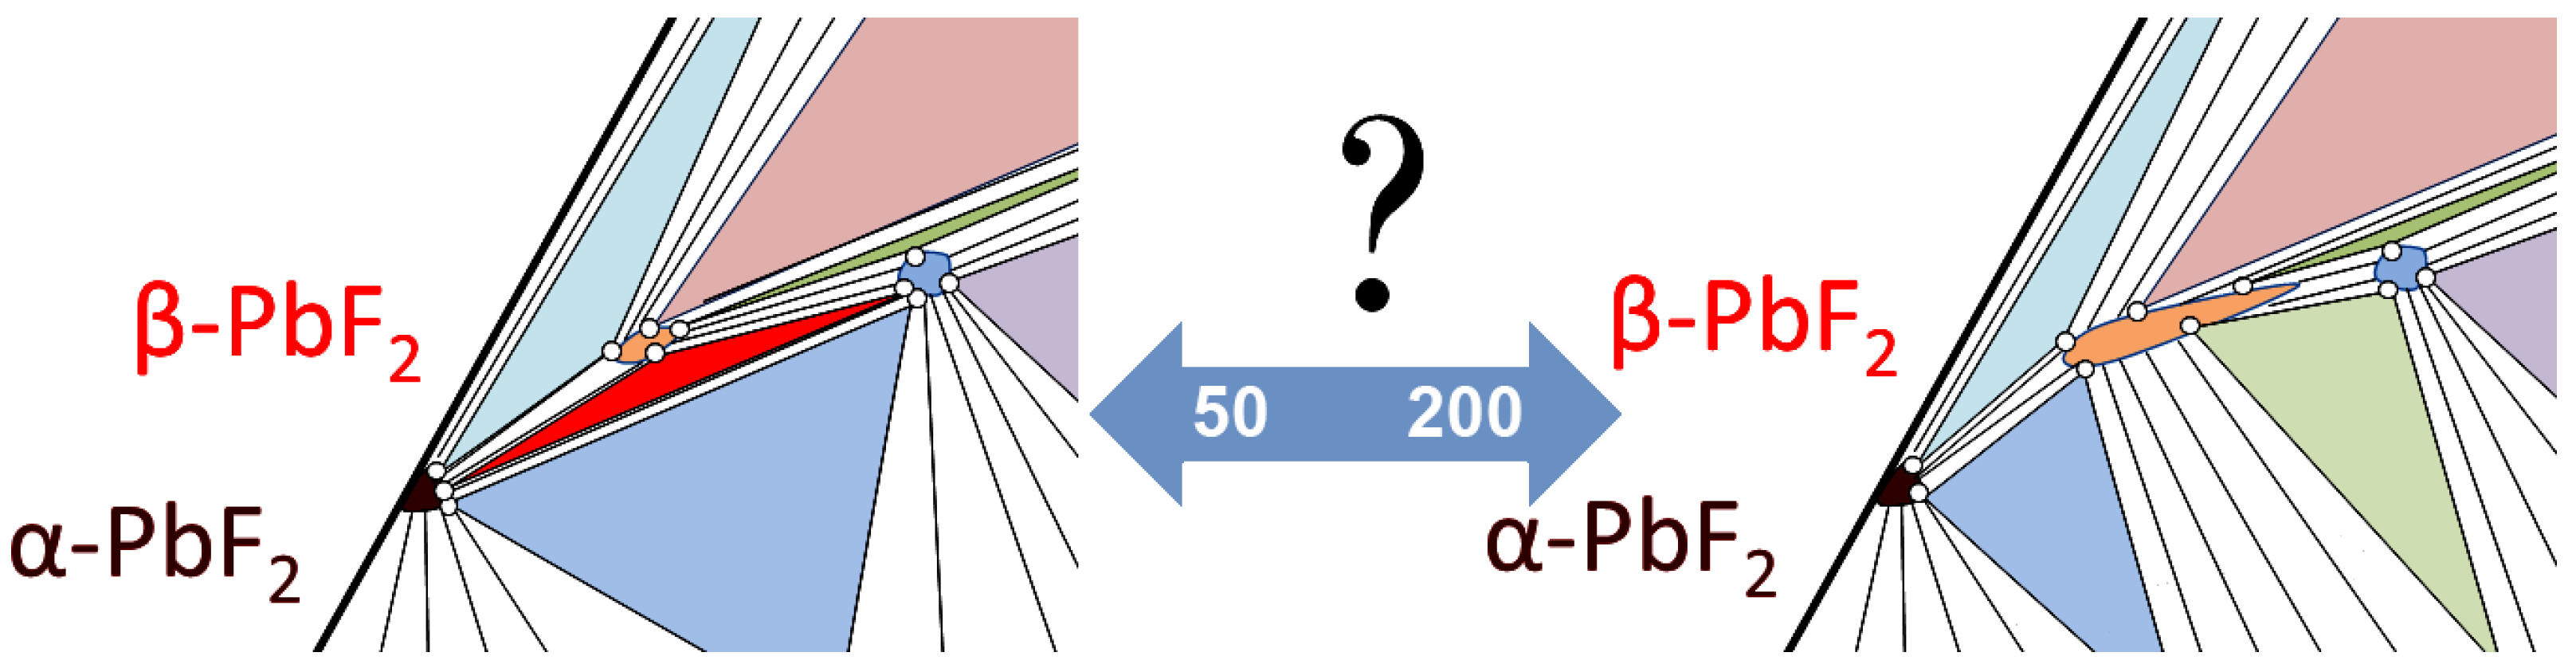
The only currently unclear issue is the existence of Sα-PbF2Sβ-PbF2SR-phaseV monovariant equilibrium at low temperatures (Figure 15 – red triangle). We believe this issue is important for the future operation of devices based on a cubic solid solution Pb1-xEuxF2+x phase.
4. Conclusions
Samples in the system (100-x)PbF2-xEuF3 were synthesized by co-precipitation from aqueous solutions with values of x ranging from 0 to 12 mol% EiF3. The phase composition of the obtained samples was determined as follows: for x equal to 0 mol% - α-PbF2, for the range 0.5 – 7 mol% - a mixture of phases α-PbF2 and a cubic solid solution with a composition close to Pb0.93Eu0.07F2.07, and for the range 8-12 mol% - a cubic solid solution corresponding to the nominal Pb1-xEuxF2+x. Thermal treatment was carried out at various temperatures (200 - 400°C), allowing the determination of phase transition temperatures for samples with x from 0 to 7. Investigation of the local structure of the Eu3+ ion environment showed a significant increase in symmetry during thermal treatments in the range of 300-350°C. The solvus line position was determined based on the combined data.
Samples in the quasi-binary system (100-x)PbF2-xEuF3 with x values from 35 to 45 mol% EuF3 were synthesized by solid-state and liquid-phase methods. A comparative X-ray diffraction analysis was conducted, showing deviation from Vegard's law and Röttgers's rule in the range of 39-44 mol% Eu. Spectral-luminescent analysis of samples obtained by co-precipitation with 37-44 mol% EuF3 content revealed a significant change in the asymmetry coefficient R21, indicating a change in the symmetry of the europium ion environment. The presence of a phase slightly different from the cubic one in the range of 37-43 at% Eu was established using Raman spectroscopy. Thus, in the range of x from 36 to 42 mol% EuF3, two close phases are present: cubic Pb0.64Eu0.36F2.36 and a rhombically distorted R-phase. It is likely that only the R-phase is present in the region of 43 mol% EuF3, as evidenced by the narrowing of the Raman band, and at higher EuF3 concentrations, a phase equilibrium is established, where the R-phase, Eu1-yPbyF3-y, and EuF3 are in equilibrium.
Supplementary Materials
The following supporting information can be downloaded at: https://www.mdpi.com/article/doi/s1, Figure S1: X-ray powder diffraction patterns of sample synthesized in the PbF2-EuF3 quasi-binary system by the co-precipitation technique and annealed at different temperatures; Figure S2: Fragment of the IR transmittance spectra of samples in the system (100-x)PbF2-xEuF3 (x=35-45 mol.% EuF3), obtained by co-precipitation technique; Table S1: Impurity element concentrations in the samples of PbF2 and Pb0.65Eu0.35F2.35 solid solution determined by ICM-MS; Table S2: Volume fraction of the cubic phase during heat treatment; Table S3: Values of the asymmetry coefficient R21 for samples with and without heat treatment; Table S4: Results of scanning electron microscopy supported by EDS analysis; Table S5: Cell parameter of Pb1-xEuxF2+x samples (x=35-45 mol%); Table S6: Absorption band values for (100-x)PbF2-xEuF3 samples (x=35-45 mol.% EuF3); Table S7: Raman spectra of solid solutions with different Eu content.
Author Contributions
Conceptualization, O.P. and I.A.; methodology, S.Z., K.R., O.P; software, M.B., and O.P.; validation, M.M., I.A.; formal analysis, K.R., and I.A.; investigation, Z.Z., K.R., M.M., and M.B.; resources, R.A.; data curation, K.R.; writing—original draft preparation, M.B., I.A.; writing—review and editing, O.P., R.A.; visualization, M.M., and M.B.; supervision, I.A.; project administration, I.A.; funding acquisition, R.A. All authors have read and agreed to the published version of the manuscript.
Funding
This research was funded by the Ministry of Science and Higher Education of Russia through the project FSSM-2025-0006.
Data Availability Statement
Not applicable.
Acknowledgments
The authors are grateful to the National Analytic Certification Laboratory of Mendeleev Center of D. Mendeleev University of Chemical Technology of Russia for ICP-MS, XRD, FTIR, luminescence measurements.
Conflicts of Interest
The authors declare no conflict of interest.
References
- Ntoupis, V.; Linardatos, D.; Saatsakis, G.; Kalyvas, N.; Bakas, A.; Fountos, G.; Kandarakis, I.; Michail, C.; Valais, I. Response of Lead Fluoride (PbF2) Crystal under X-Ray and Gamma Ray Radiation. Photonics 2023, 10 (1), 57. [CrossRef]
- PbF2 - Lead Fluoride Scintillator Crystal | Advatech UK https://www.advatech-uk.co.uk/pbf2.html (accessed on 13 November 2025).
- A roadmap for sole Cherenkov radiators with SiPMs in TOF-PET – IOPscience https://iopscience.iop.org/article/10.1088/1361-6560/ac212a (accessed on 20 November 2025).
- Cantone, C.; Carsi, S.; Ceravolo, S.; Di Meco, E.; Diociaiuti, E.; Frank, I.; Kholodenko, S.; Martellotti, S.; Mirra, M.; Monti-Guarnieri, P.; Moulson, M.; Paesani, D.; Prest, M.; Romagnoni, M.; Sarra, I.; Sgarbossa, F.; Soldani, M.; Vallazza, E. Beam Test, Simulation, and Performance Evaluation of PbF2 and PWO-UF Crystals with SiPM Readout for a Semi-Homogeneous Calorimeter Prototype with Longitudinal Segmentation. Front. Phys. 2023, 11. [CrossRef]
- Kurosawa, S.; Yokota, Y.; Yanagida, T.; Yoshikawa, A. Optical and Scintillation Property of Ce, Ho and Eu-Doped PbF2. Radiat. Meas. 2013, 55, 120–123. [CrossRef]
- Buchinskaya, I. I.; Fedorov, P. P. Lead Difluoride and Related Systems. Russ. Chem. Rev. 2004, 73 (4), 371–400. [CrossRef]
- Tyagi, A. K.; Patwe, S. J.; Achary, S. N.; Mallia, M. B. Phase Relation Studies in Pb1−xM′xF2+x Systems (0.0⩽x⩽1.0; M′=Nd3+, Eu3+ and Er3+). J. Solid State Chem. 2004, 177 (4–5), 1746–1757. [CrossRef]
- Petrova, O. B.; Mayakova, M. N.; Smirnov, V. A.; Runina, K. I.; Avetisov, R. I.; Avetissov, I. C. Luminescent Properties of Solid Solutions in the PbF2-EuF3 and PbF2–ErF3 Systems. J. Lumin. 2021, 238, 118262. [CrossRef]
- Sevostjanova, T. S.; Khomyakov, A. V.; Mayakova, M. N.; Voronov, V. V.; Petrova, O. B. Luminescent Properties of Solid Solutions in the PbF2–Euf3 System and Lead Fluoroborate Glass Ceramics Doped with Eu3+ Ions. Opt. Spectrosc. 2017, 123 (5), 733–742. [CrossRef]
- Savikin, A. P.; Egorov, A. S.; Budruev, A. V.; Perunin, I. Y.; Grishin, I. A. Visualization of 1.908-Μm Radiation of a Tm:YLF Laser Using PbF2-Based Ceramics Doped with Ho3+ Ions. Tech. Phys. Lett. 2016, 42 (11), 1083–1086. [CrossRef]
- Liao, J.; Chen, Q.; Niu, X.; Zhang, P.; Tan, H.; Ma, F.; Li, Z.; Zhu, S.; Hang, Y.; Yang, Q.; Chen, Z. Energy Transfer and Cross-Relaxation Induced Efficient 2.78 Μm Emission in Er3+/Tm3+: PbF2 Mid-Infrared Laser Crystal. Crystals 2021, 11 (9), 1024. [CrossRef]
- Huang, X.; Wang, Y.; Zhang, P.; Su, Z.; Xu, J.; Xin, K.; Hang, Y.; Zhu, S.; Yin, H.; Li, Z.; Chen, Z.; Zheng, Y.; Li, H. Efficiently Strengthen and Broaden 3 Μm Fluorescence in PbF2 Crystal by Er3+/Ho3+ as Co-Luminescence Centers and Pr3+ Deactivation. J. Alloys Compd. 2019, 811, 152027. [CrossRef]
- Li, X.; Zhang, P.; Yin, H.; Zhu, S.; Li, Z.; Hang, Y.; Chen, Z. Sensitization and Deactivation Effects of Nd 3+ on the Er 3+ : 27 Μm Emission in PbF 2 Crystal. Opt. Mater. Express 2019, 9 (4), 1698. [CrossRef]
- Zhou, M.; Zhang, P.; Niu, X.; Liao, J.; Chen, Q.; Zhu, S.; Hang, Y.; Yang, Q.; Yin, H.; Li, Z.; Chen, Z. Ultra-Broadband and Enhanced near-Infrared Emission in Bi/Er Co-Doped PbF2 Laser Crystal. J. Alloys Compd. 2022, 895, 162704. [CrossRef]
- Sorokin N. I.; Ivanovskaya N. A.; Buchinskaya I. I. Ionic Conductivity of Cold Pressed Nanoceramics Pr-=SUB=-0.9-=/SUB=-Pb-=SUB=-0.1-=/SUB=-F-=SUB=-2.9-=/SUB=- Obtained by Mechanosynthesis of Components. Phys. Solid State 2023, 65 (1), 101. [CrossRef]
- Sobolev, B. P. The Rare Earth Trifluorides: The High Temperature Chemistry of the Rare Earth Trifluorides 2. Introduction to Materials Science of Multicomponent Metal Fluoride Crystals; Arxius de les seccions de ciències; Institut d’Estudis Catalans, 2000.
- Achary, S. N.; Patwe, S. J.; Tyagi, A. K. Powder XRD Study of Ba 4 Eu 3 F 17 : A New Anion Rich Fluorite Related Mixed Fluoride. Powder Diffr. 2002, 17 (3), 225–229. [CrossRef]
- Dombrovski, E. N.; Serov, T. V.; Abakumov, A. M.; Ardashnikova, E. I.; Dolgikh, V. A.; Van Tendeloo, G. The Structural Investigation of Ba4Bi3F17. J. Solid State Chem. 2004, 177 (1), 312–318. [CrossRef]
- Patwe, S..; Achary, S..; Tyagi, A.. Synthesis and Characterization of Ba1−xErxF2+x (0.00≤x≤1.00). Mater. Res. Bull. 2002, 37 (14), 2243–2253. [CrossRef]
- Patwe, S. J.; Achary, S. N.; Tyagi, A. K. Synthesis and Characterization of Y1-XPb2+1.5xF7 (−1.33 ≤ x ≤ 1.0). Mater. Res. Bull. 2001, 36 (3–4), 597–605. [CrossRef]
- Loiko, P.; Rytz, D.; Schwung, S.; Pues, P.; Jüstel, T.; Doualan, J.-L.; Camy, P. Watt-Level Europium Laser at 703 Nm. Opt. Lett. 2021, 46 (11), 2702. [CrossRef]
- Kopylov, N.I.; Polyvyannyi, I.R.; Ivakina, L.P.; Antonuk, V.I. System ZnS-Na2S Russian J. Neorg.Khimii. 1978, 23(11), 3095-3101.
- Mayakova, M. N.; Voronov, V. V.; Iskhakova, L. D.; Kuznetsov, S. V.; Fedorov, P. P. Low-Temperature Phase Formation in the BаF2-CeF3 System. J. Fluor. Chem. 2016, 187, 33–39. [CrossRef]
- Karimov, D. N.; Sorokin, N. I.; Chernov, S. P.; Sobolev, B. P. Growth of MgF2 Optical Crystals and Their Ionic Conductivity in the As-Grown State and after Partial Pyrohydrolysis. Crystallogr. Reports 2014, 59 (6), 928–932. [CrossRef]
- Inaguma, Y.; Ueda, K.; Katsumata, T.; Noda, Y. Low-Temperature Formation of Pb2OF2 with O/F Anion Ordering by Solid State Reaction. J. Solid State Chem. 2019, 277, 363–367. [CrossRef]
- Strekalov, P. V.; Mayakova, M. N.; Runina, K. I.; Petrova, O. B. Organic Phosphor and Lead Fluoride Based Luminescent Hybrids. Tsvetnye Met. 2021, 25–31. [CrossRef]
- Borik, M. A.; Gerasimov, M. V.; Kulebyakin, A. V.; Larina, N. A.; Lomonova, E. E.; Milovich, F. O.; Myzina, V. A.; Ryabochkina, P. A.; Sidorova, N. V.; Tabachkova, N. Y. Structure and Phase Transformations in Scandia, Yttria, Ytterbia and Ceria-Doped Zirconia-Based Solid Solutions during Directional Melt Crystallization. J. Alloys Compd. 2020, 844, 156040. [CrossRef]
- Sorokin, N. I. Molar Volume Correlation between Nonstoichiometric M1 − XRxF2 + x (0 ≤ x ≤ 0.5) and Ordered MmRnF2m + 3n (m/n = 8/6, 9/5) Phases in Systems MF2–RF3 (M = Ca, Sr, Ba, Pb; and R = Rare-Earth Elements). Russ. J. Inorg. Chem. 2019, 64 (3), 351–356. [CrossRef]
- Anderson, A. The Raman Effect: Applications; The Raman Effect; M. Dekker, 1971.
- Bazhenov, A. V.; Smirnova, I. S.; Fursova, T. N.; Maksimuk, M. Y.; Kulakov, A. B.; Bdikin, I. K. Optical Phonon Spectra of PbF2 Single Crystals. Phys. Solid State 2000, 42 (1), 41–50. [CrossRef]
- Nakamoto, K. Infrared and Raman Spectra of Inorganic and Coordination Compounds; Wiley, 2008. [CrossRef]
- Thangadurai, P.; Ramasamy, S.; Kesavamoorthy, R. Raman Studies in Nanocrystalline Lead (II) Fluoride. J. Phys. Condens. Matter 2005, 17 (6), 863–874. [CrossRef]
- Crystallography Open Database https://www.crystallography.net/cod/1530196.html (accessed on 05 December 2025).
Figure 1.
T-x diagram of the quasi-binary system PbF2-EuF3: F – cubic phase Pb1-xEuxF2+x, R – orthorhombic phase, L – liquid phase.
Figure 1.
T-x diagram of the quasi-binary system PbF2-EuF3: F – cubic phase Pb1-xEuxF2+x, R – orthorhombic phase, L – liquid phase.
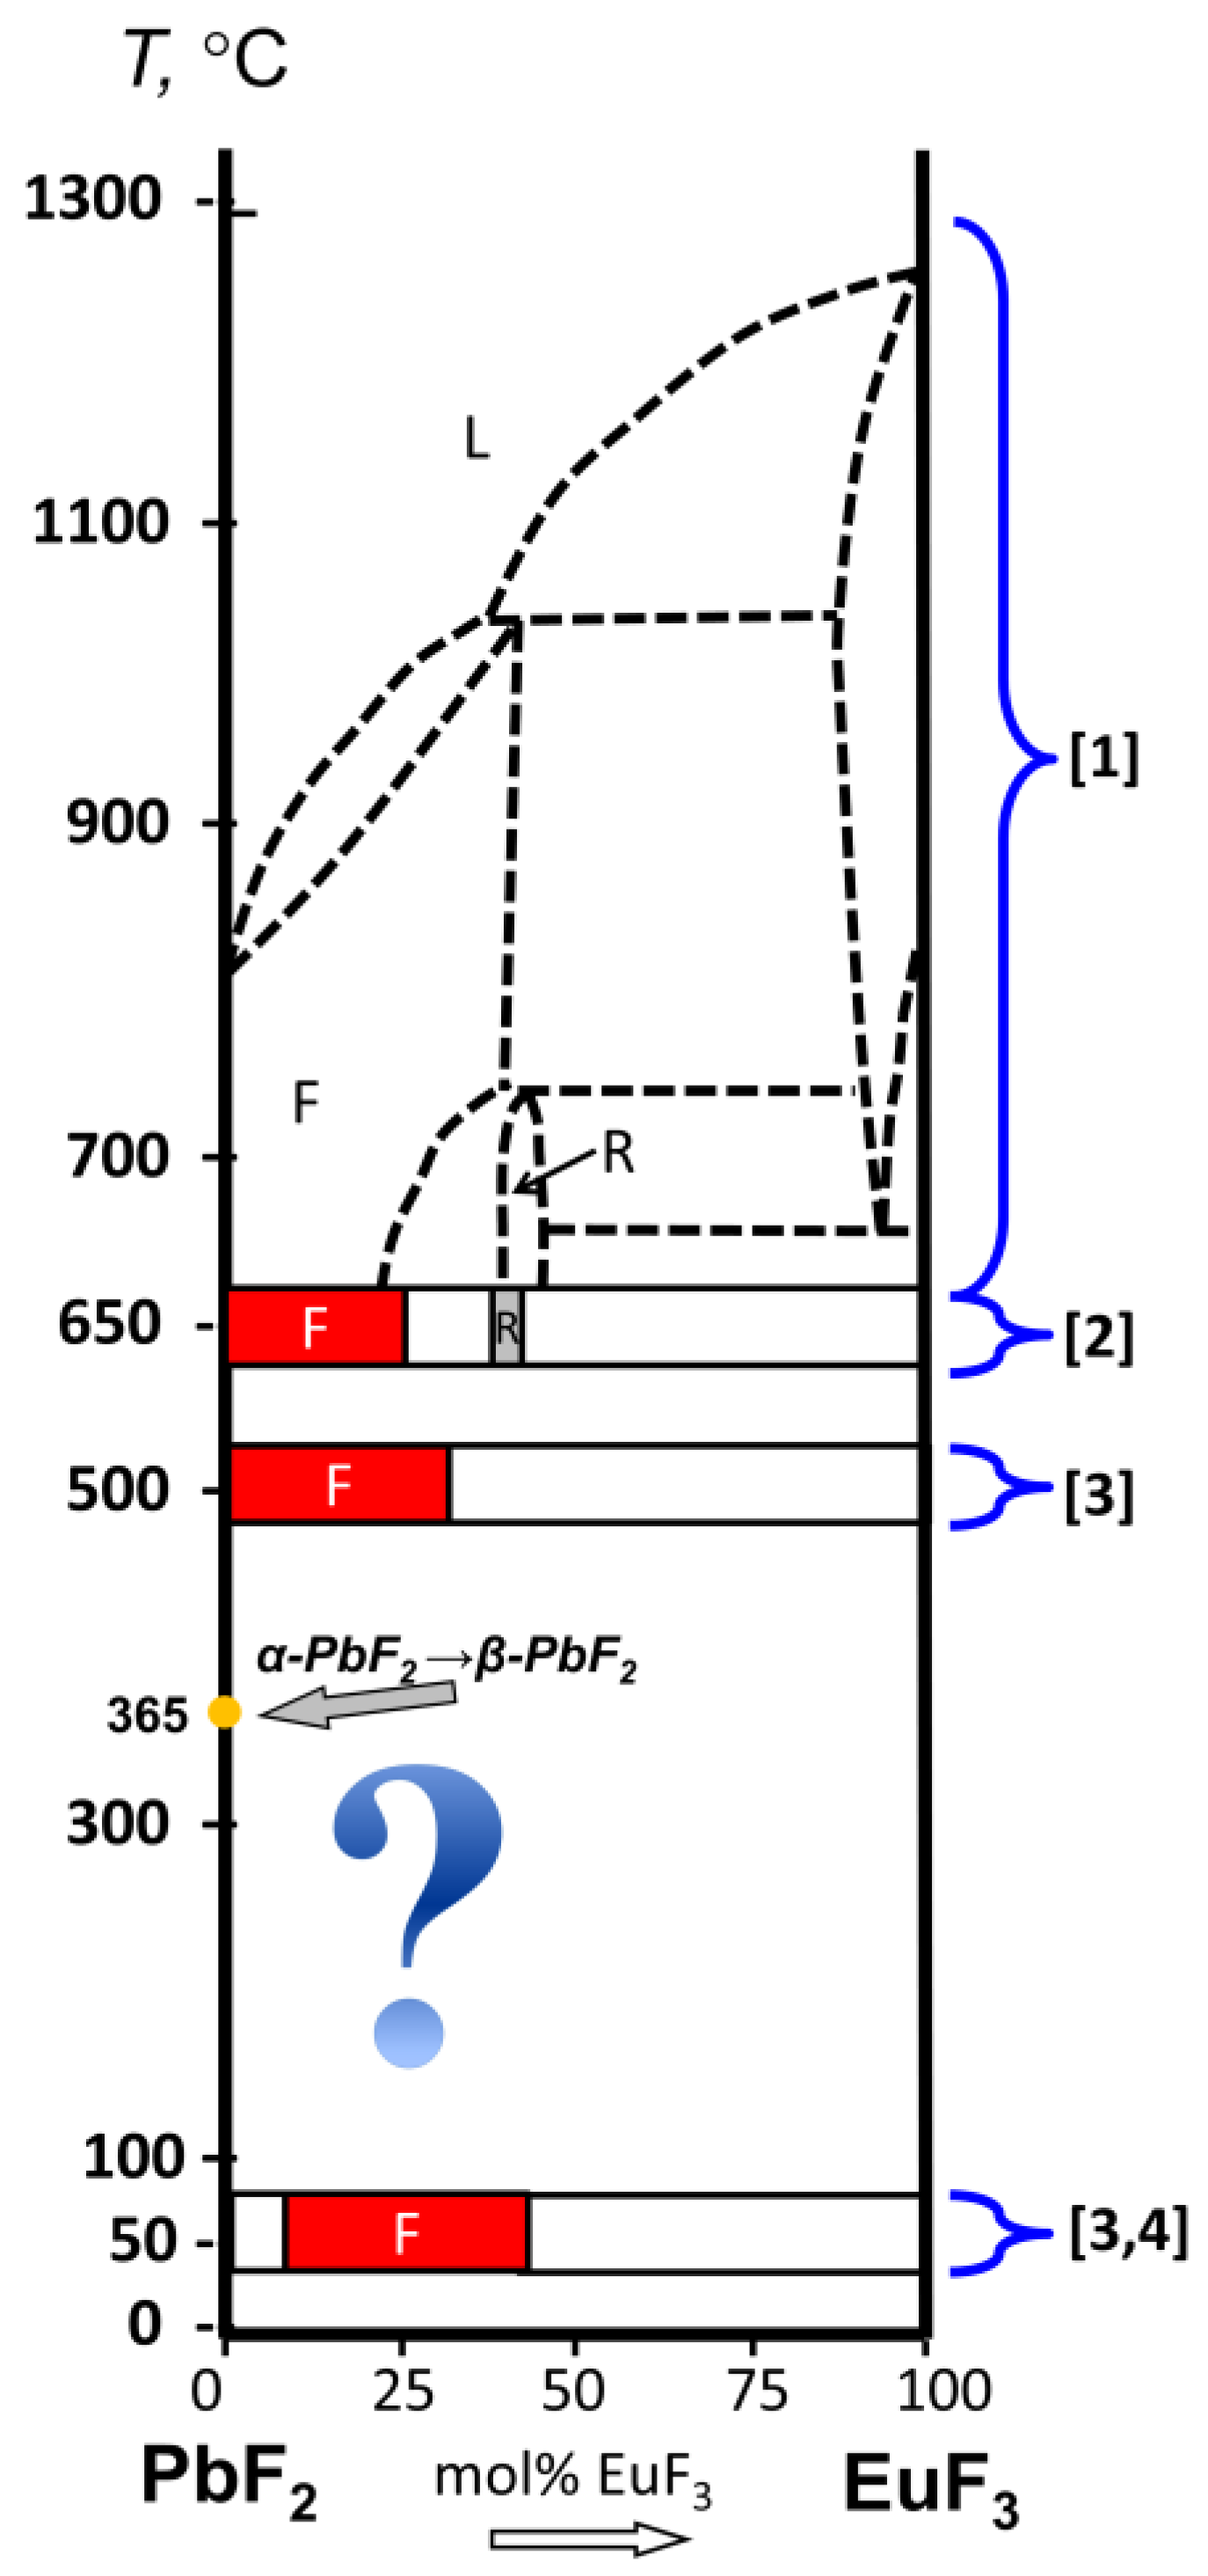
Figure 2.
X-ray diffraction patterns of the samples in the quasi-binary system PbF2-EuF3 with nominal content of EuF3 from 1 to 9 mol% (dot lines and Miller indices indicate the reflections of the cubic solid solution phase, black bars are reference data for β-PbF2 according to COD-1530196 [33].
Figure 2.
X-ray diffraction patterns of the samples in the quasi-binary system PbF2-EuF3 with nominal content of EuF3 from 1 to 9 mol% (dot lines and Miller indices indicate the reflections of the cubic solid solution phase, black bars are reference data for β-PbF2 according to COD-1530196 [33].
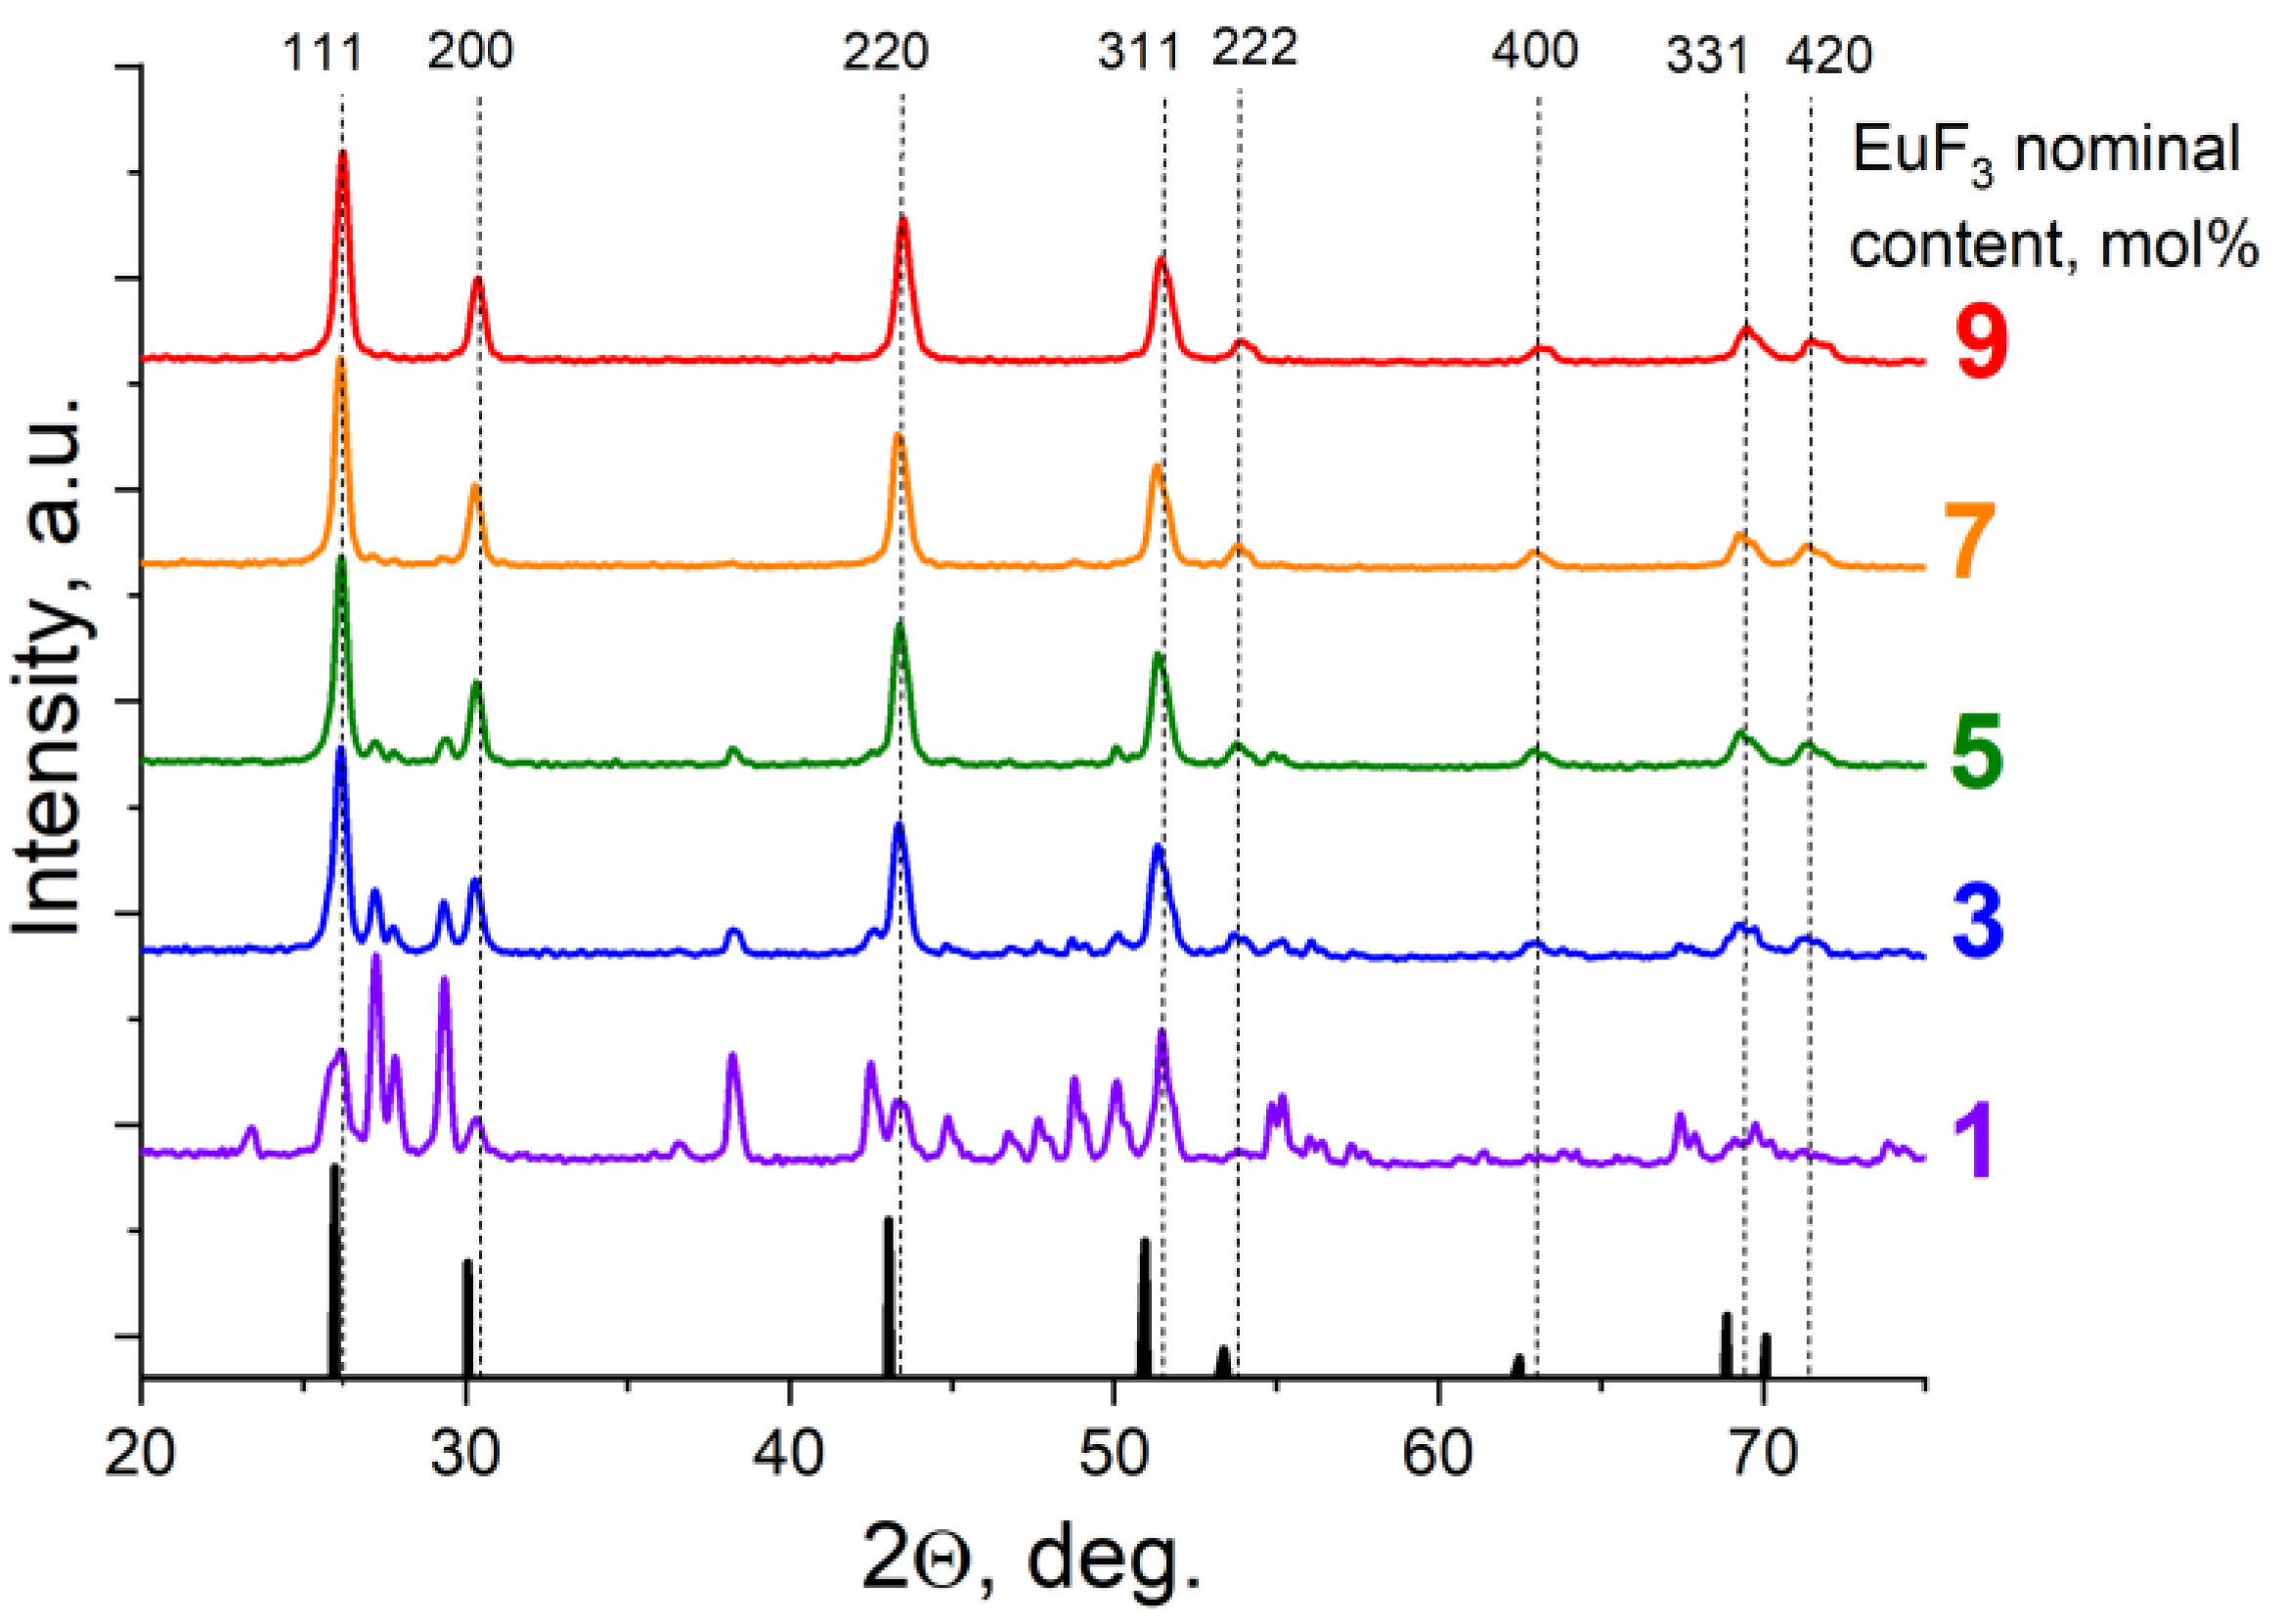
Figure 3.
X-ray diffraction patterns of the samples Pb0.97Eu0.03F2.03 at various temperatures (dashed lines and Miller indices indicate reflections of the cubic solid solution phase).
Figure 3.
X-ray diffraction patterns of the samples Pb0.97Eu0.03F2.03 at various temperatures (dashed lines and Miller indices indicate reflections of the cubic solid solution phase).
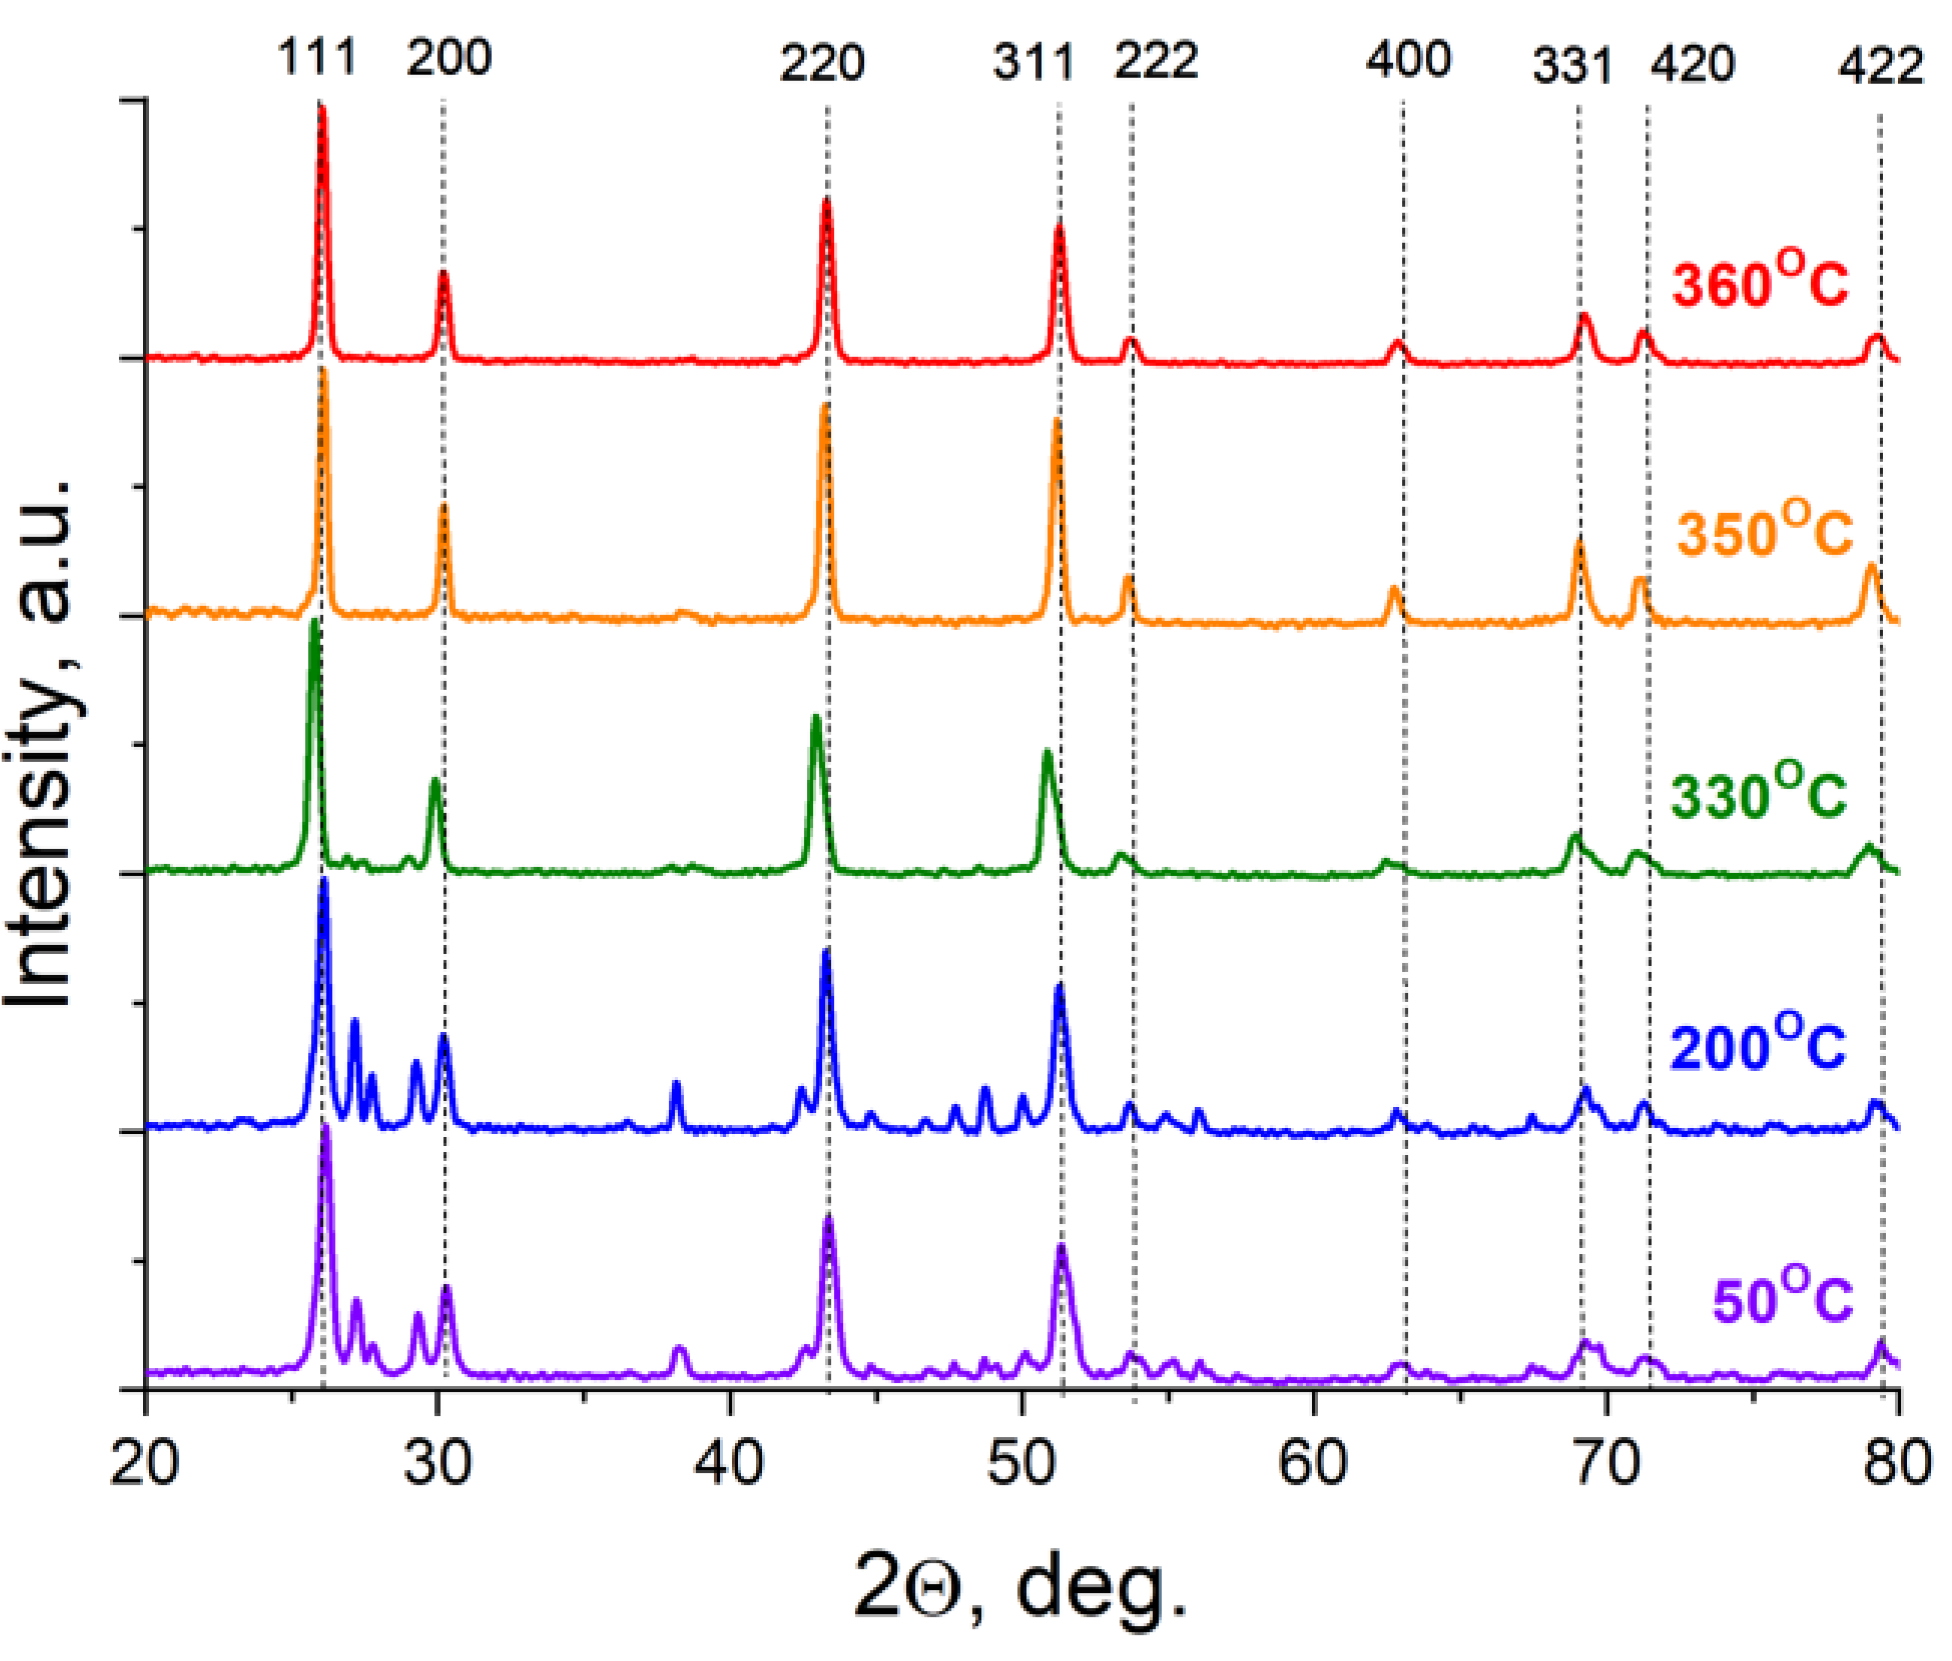
Figure 4.
Increase in the volume fraction of the cubic phase during heat treatments of samples with nominal composition Pb1-xEuxF2+x.
Figure 4.
Increase in the volume fraction of the cubic phase during heat treatments of samples with nominal composition Pb1-xEuxF2+x.
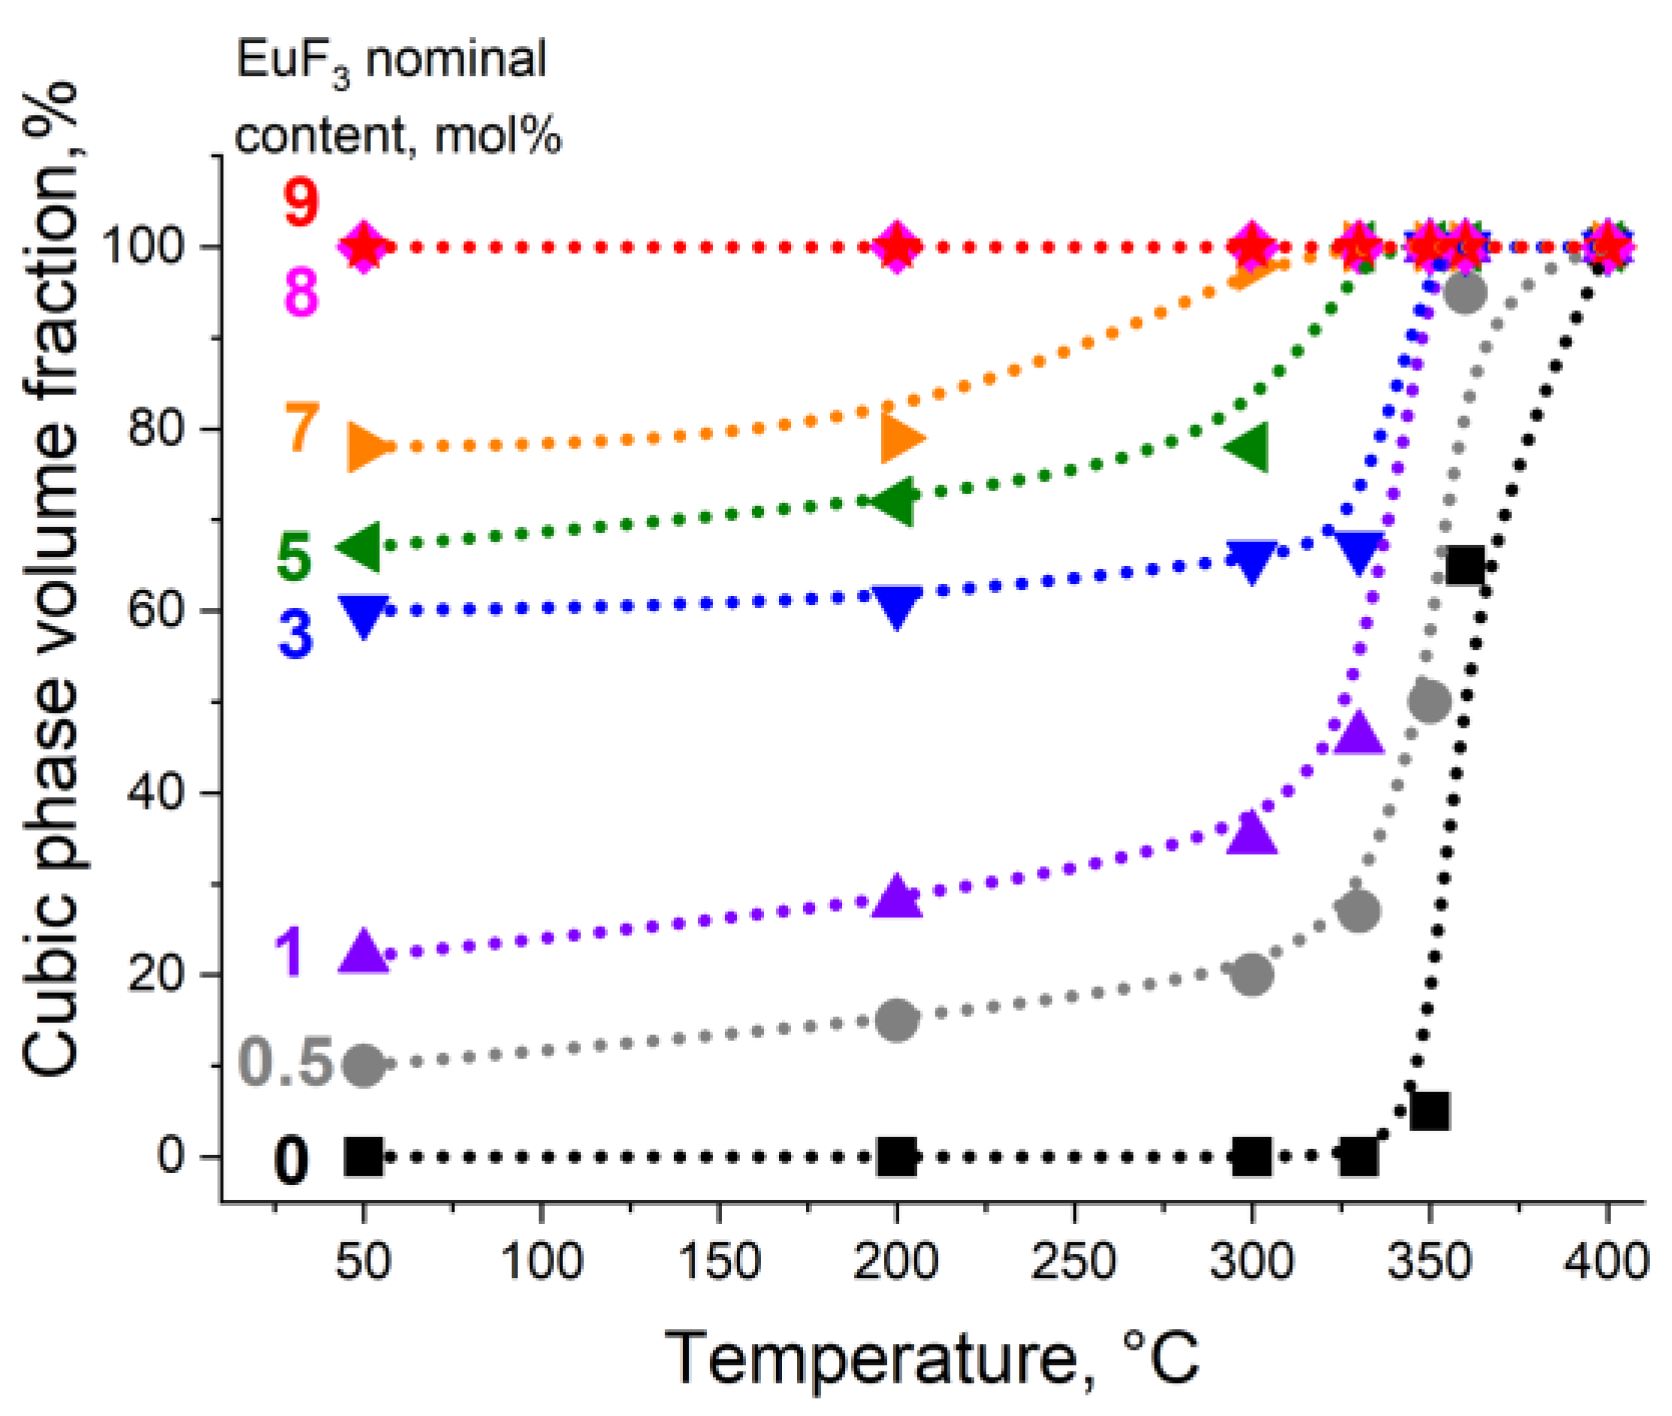
Figure 6.
Normalized PL spectra of Pb0.97Eu0.03F2.03 solid solutions after heat treatment at different temperatures (λexc=377 nm). The inset shows a diagram of the levels Eu3+.
Figure 6.
Normalized PL spectra of Pb0.97Eu0.03F2.03 solid solutions after heat treatment at different temperatures (λexc=377 nm). The inset shows a diagram of the levels Eu3+.
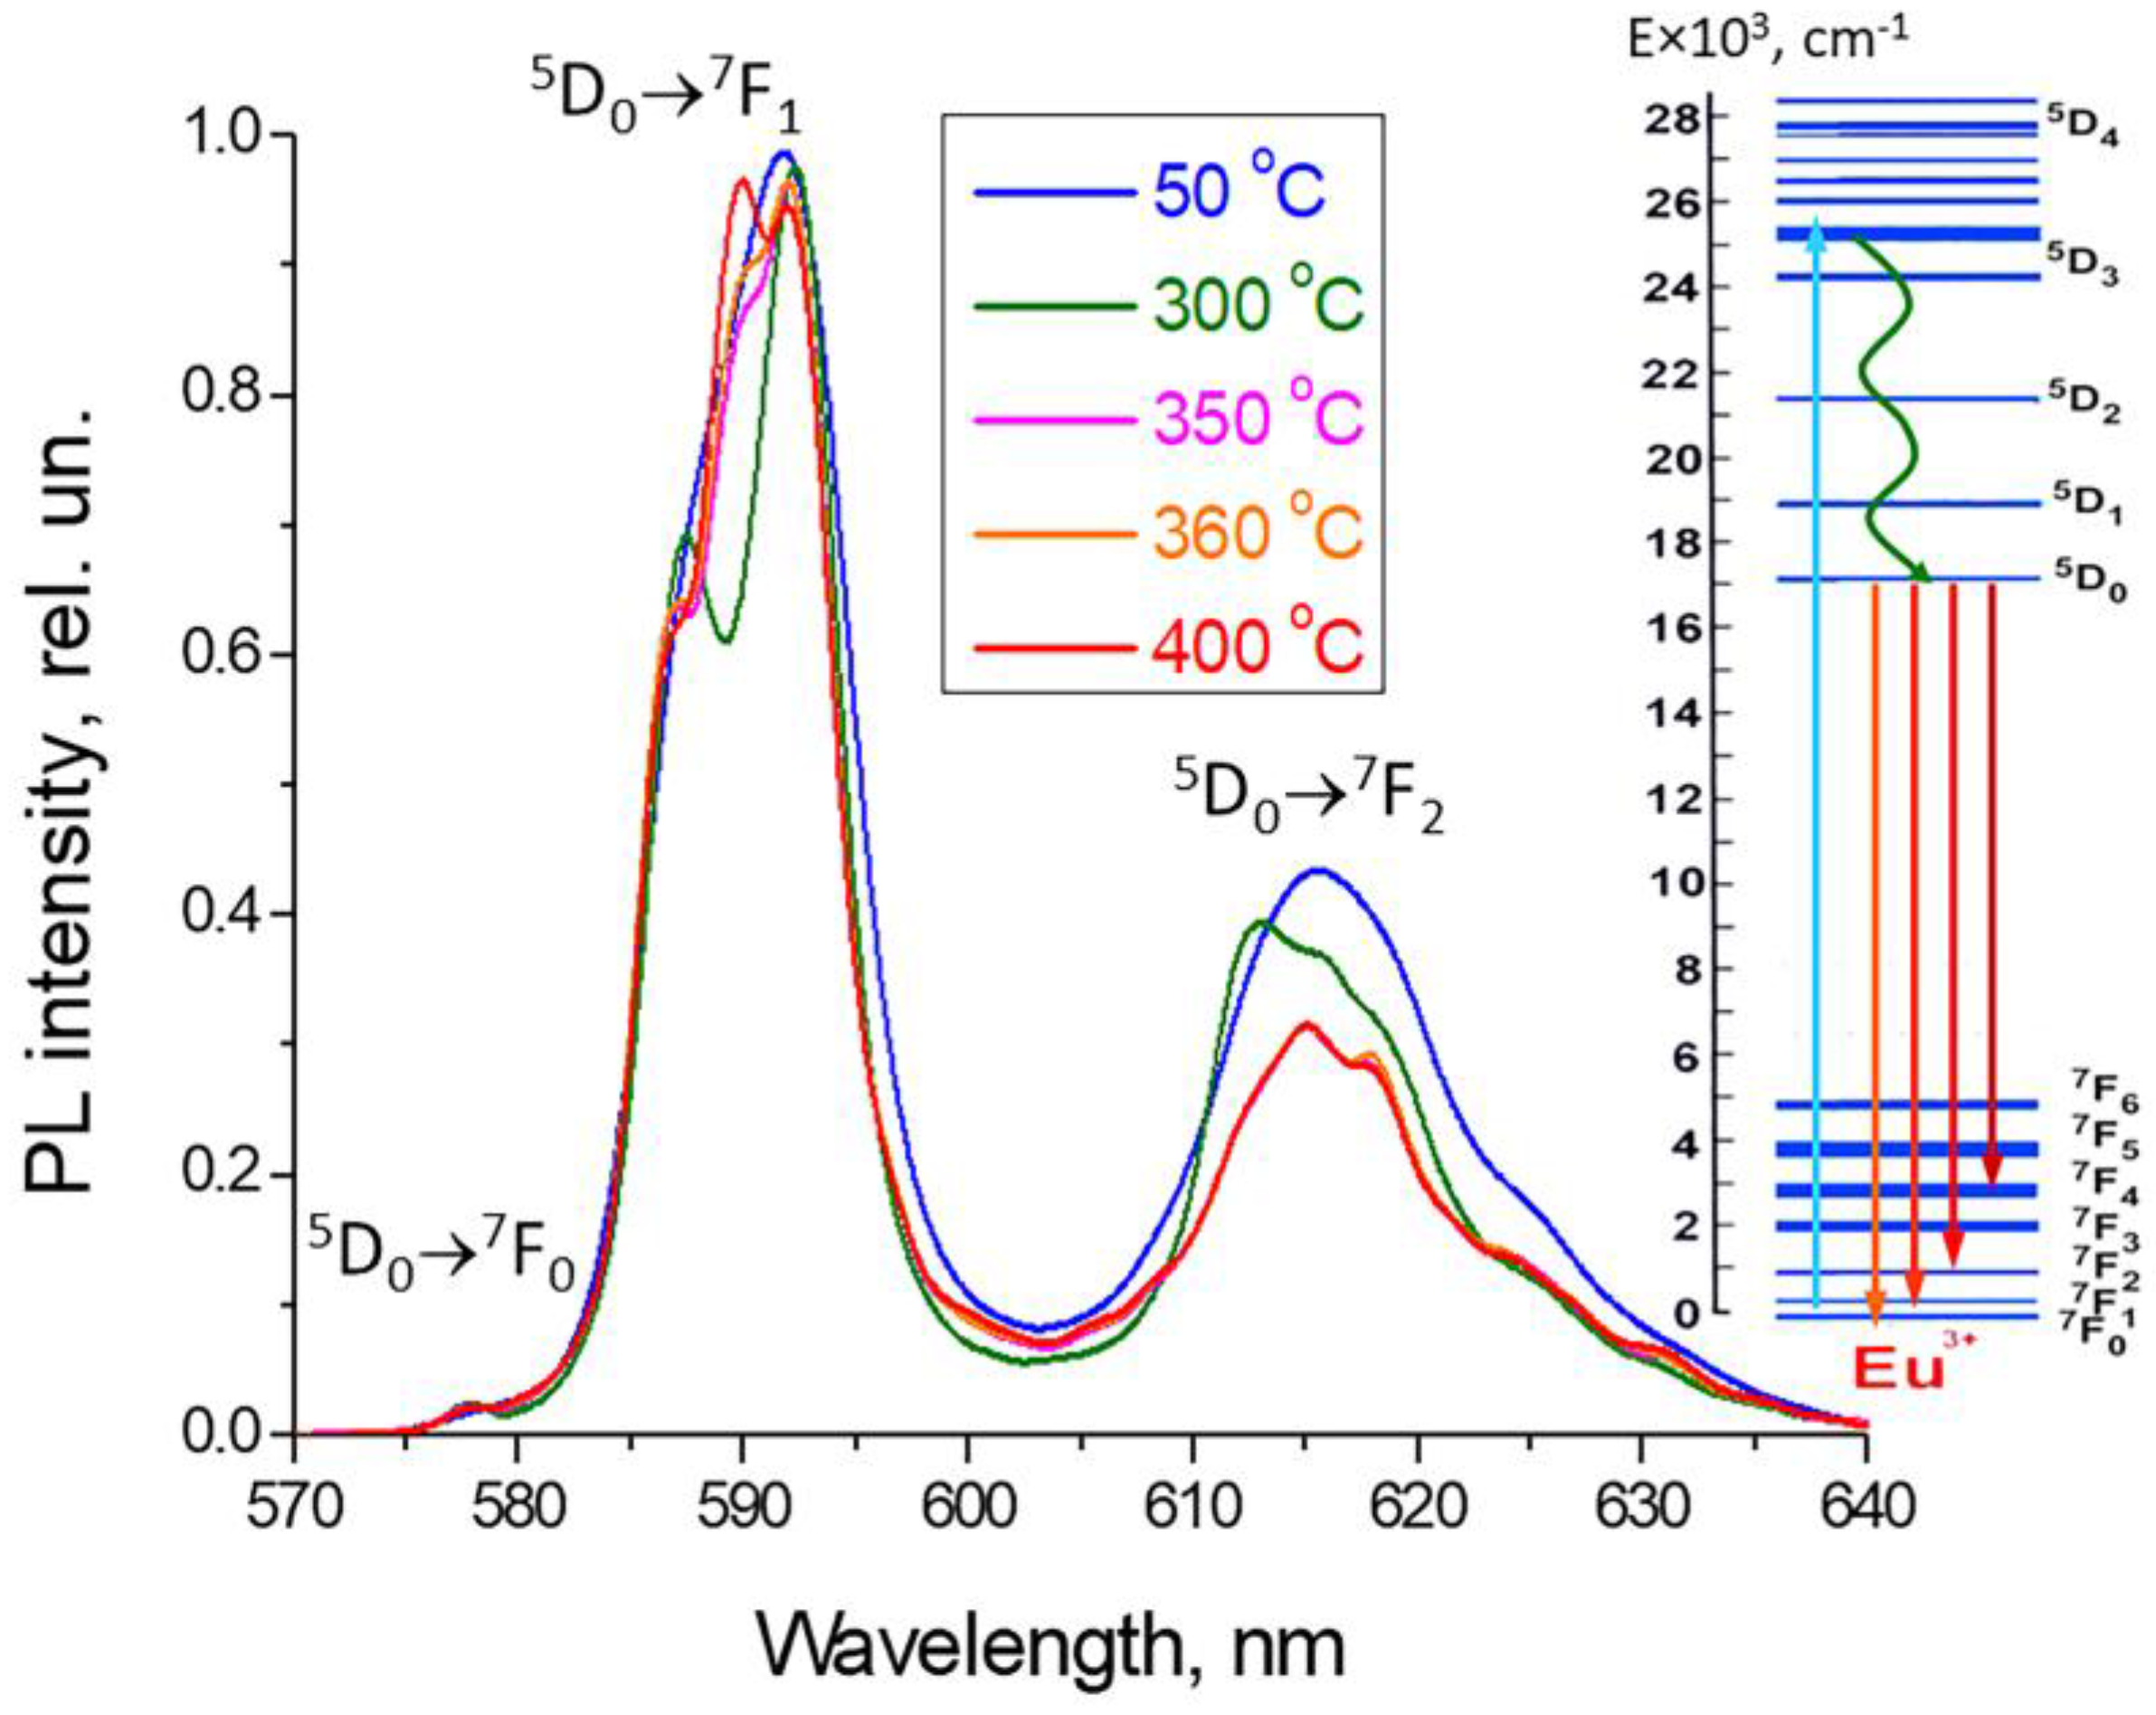
Figure 7.
Changes in the asymmetry coefficient after the annealing at different temperatures of samples with a nominal composition of Pb1-xEuxF2+x.
Figure 7.
Changes in the asymmetry coefficient after the annealing at different temperatures of samples with a nominal composition of Pb1-xEuxF2+x.
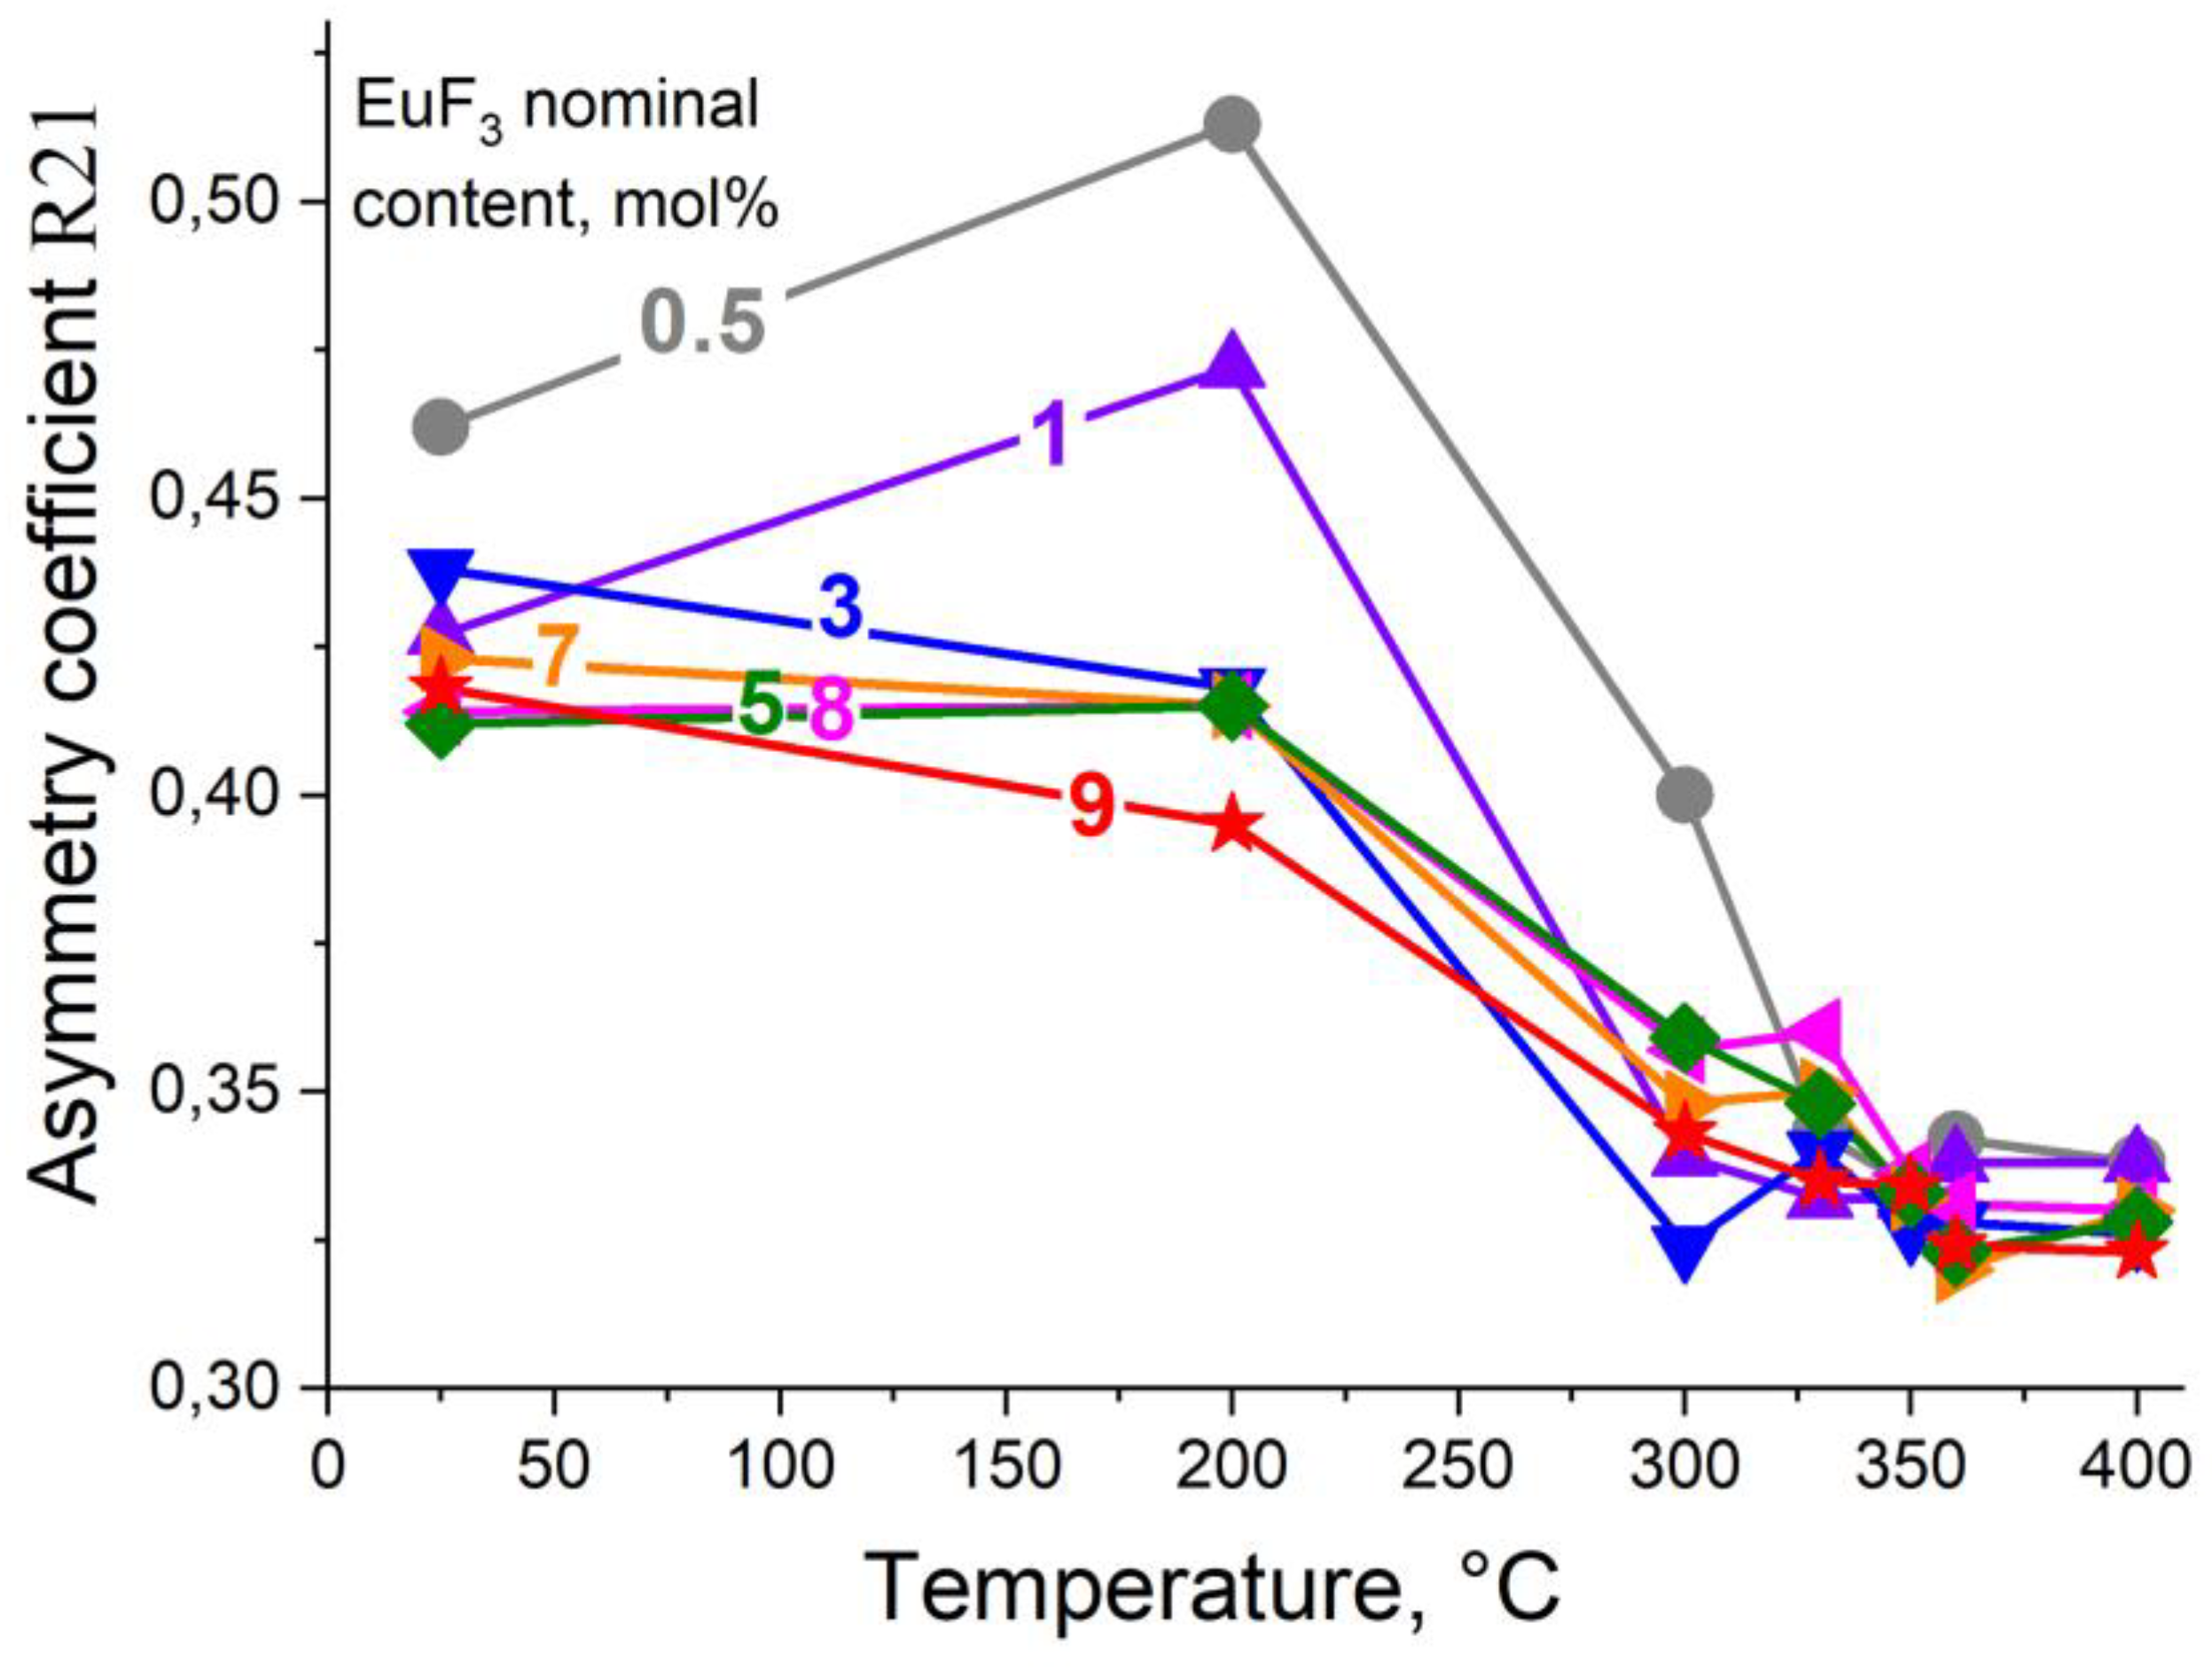
Figure 8.
Fragment of the T-X diagram of the quasi-binary system PbF2-EuF3, according to the results of XRD analysis.
Figure 8.
Fragment of the T-X diagram of the quasi-binary system PbF2-EuF3, according to the results of XRD analysis.
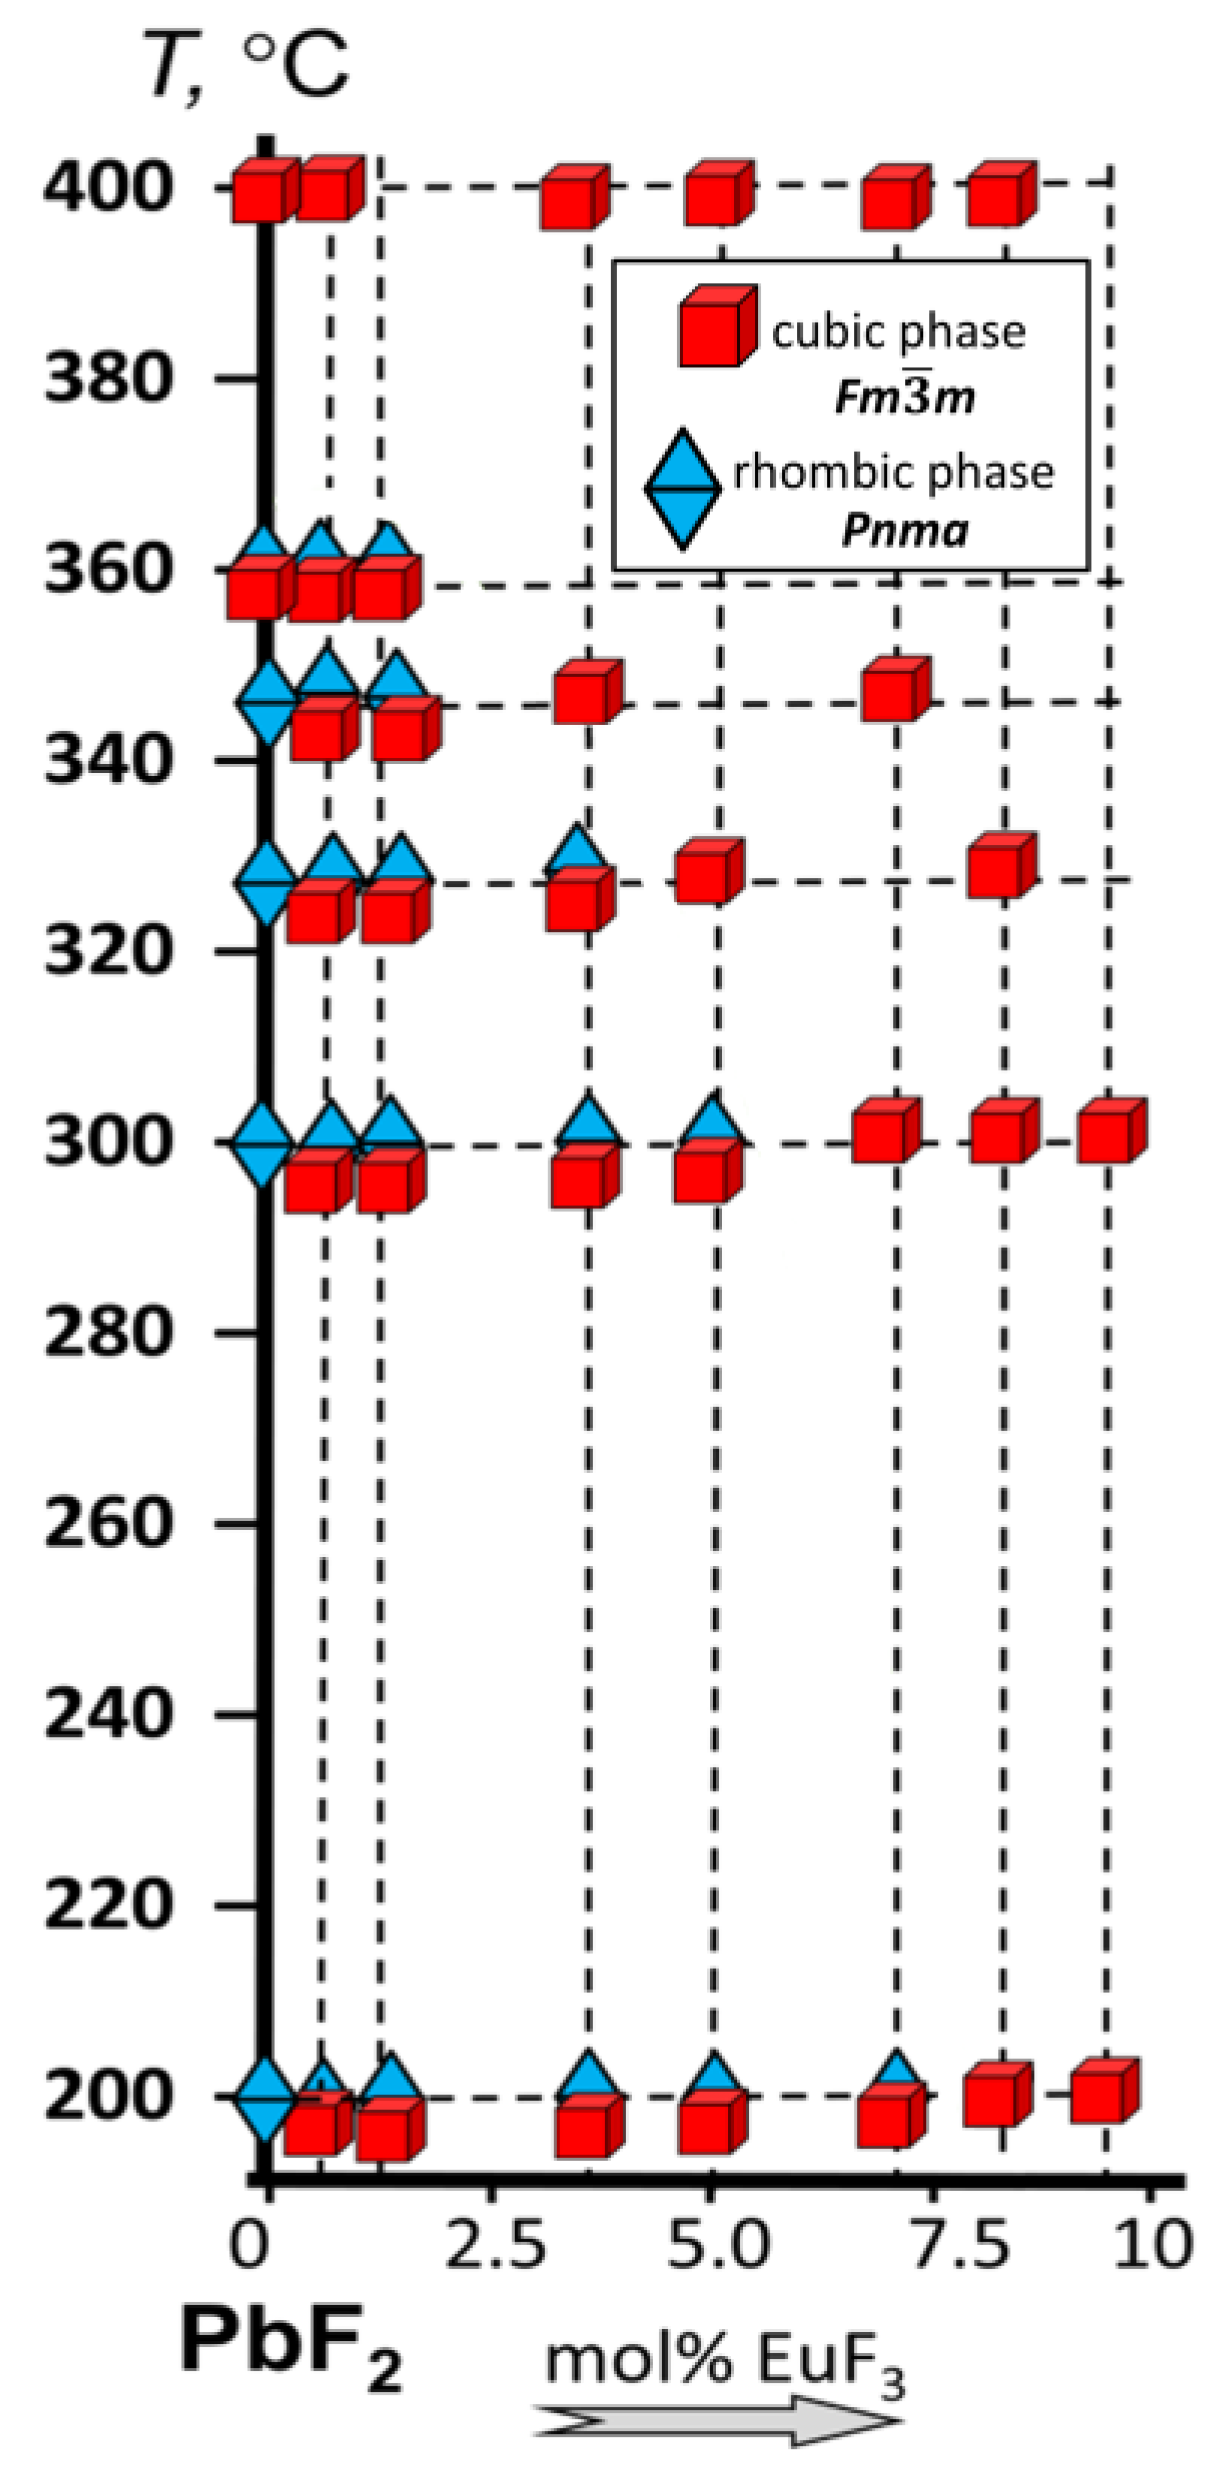
Figure 9.
X-ray diffraction patterns of samples obtained by solid-phase synthesis (a) and co-precipitation technique (b) in the quasi-binary system PbF2-EuF3 (dashed lines and Miller indices indicate nominally pure β-PbF2).
Figure 9.
X-ray diffraction patterns of samples obtained by solid-phase synthesis (a) and co-precipitation technique (b) in the quasi-binary system PbF2-EuF3 (dashed lines and Miller indices indicate nominally pure β-PbF2).
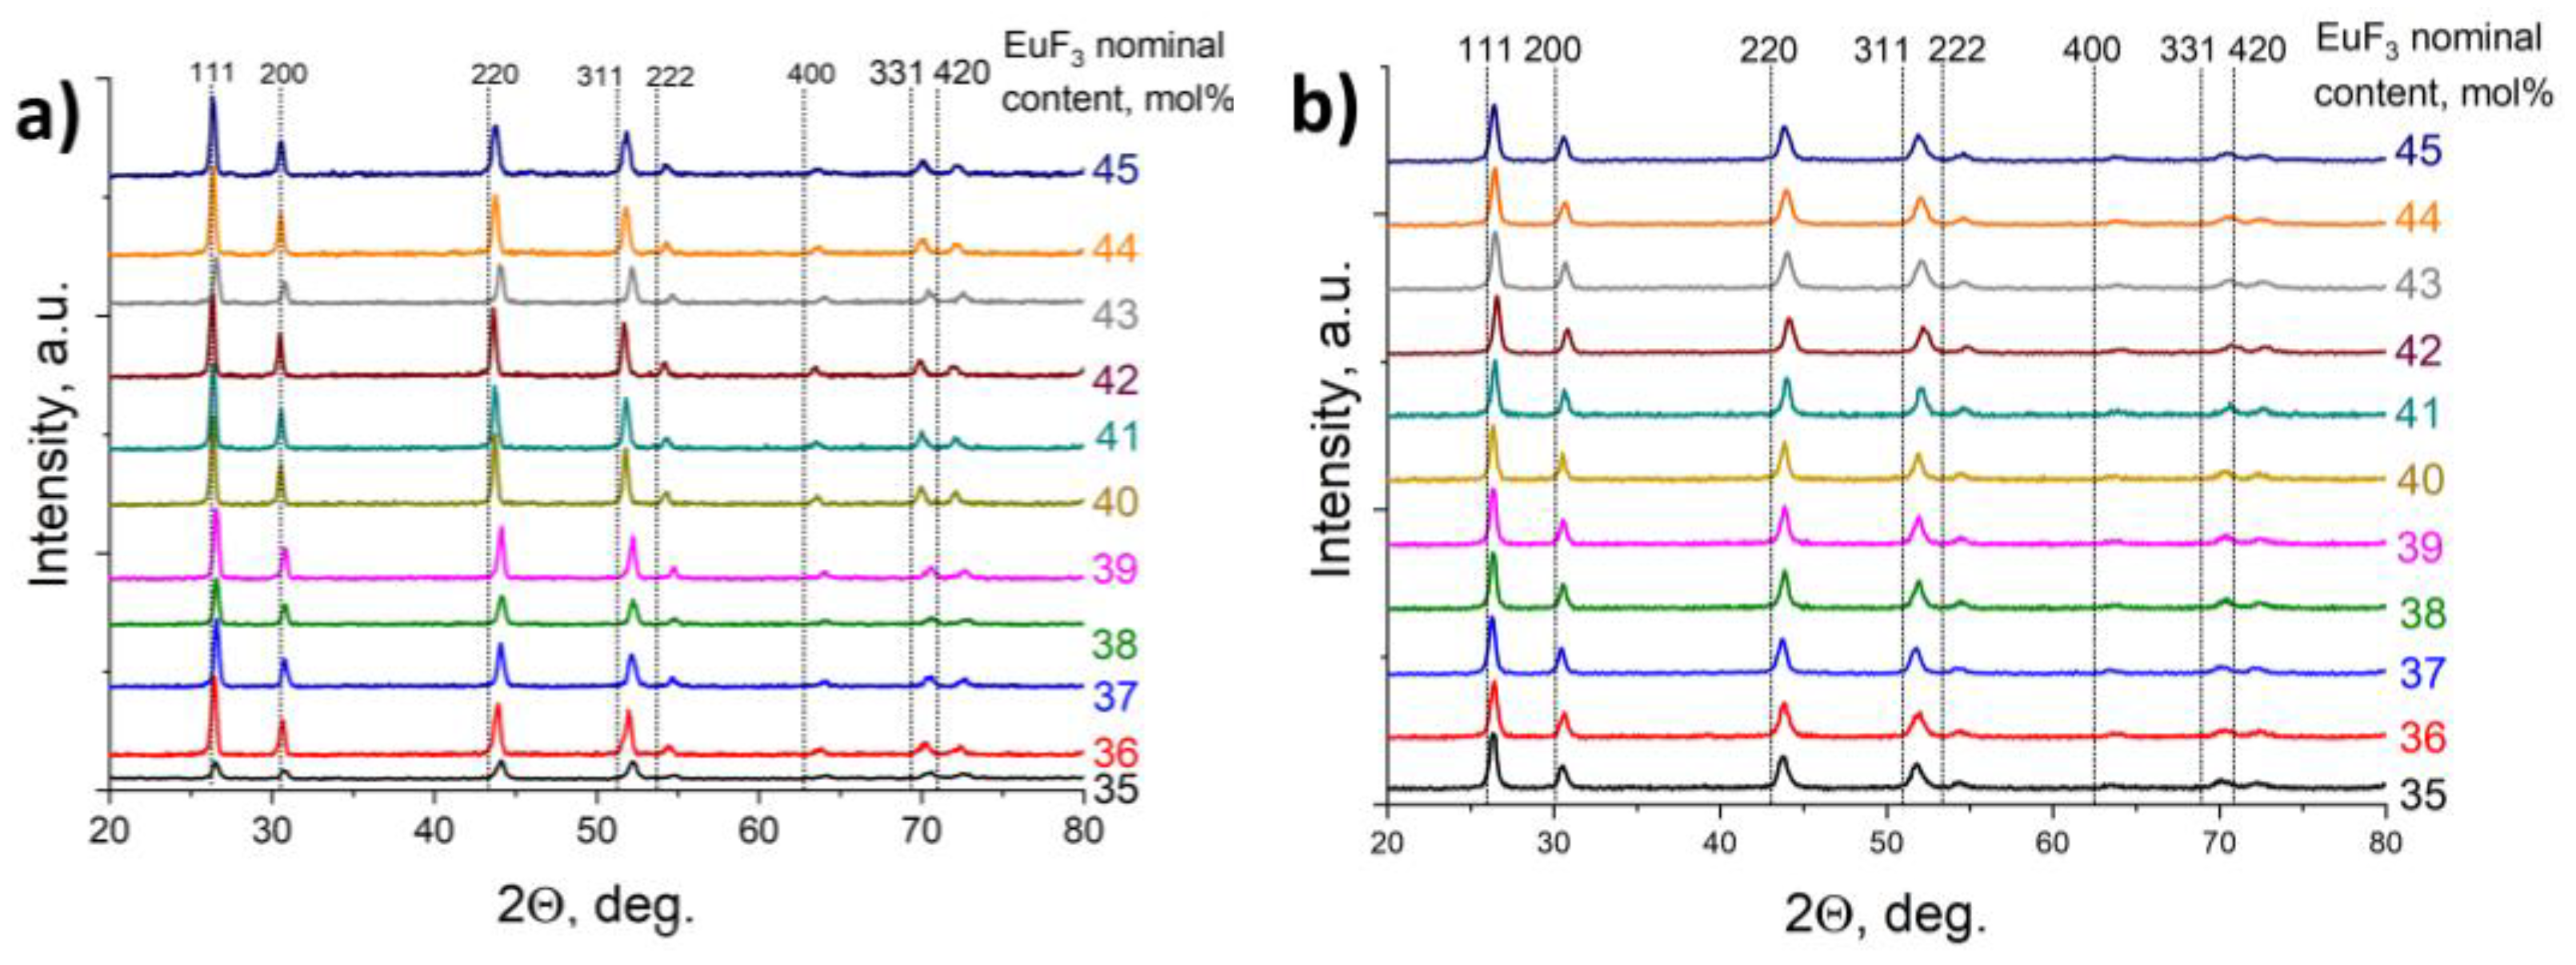
Figure 10.
Values of the unit cell parameter (a) and volume (b) for samples in the (100-x)PbF2-xEuF3 system (x=35-45 mol% EuF3) obtained by co-precipitation and solid-phase methods.
Figure 10.
Values of the unit cell parameter (a) and volume (b) for samples in the (100-x)PbF2-xEuF3 system (x=35-45 mol% EuF3) obtained by co-precipitation and solid-phase methods.
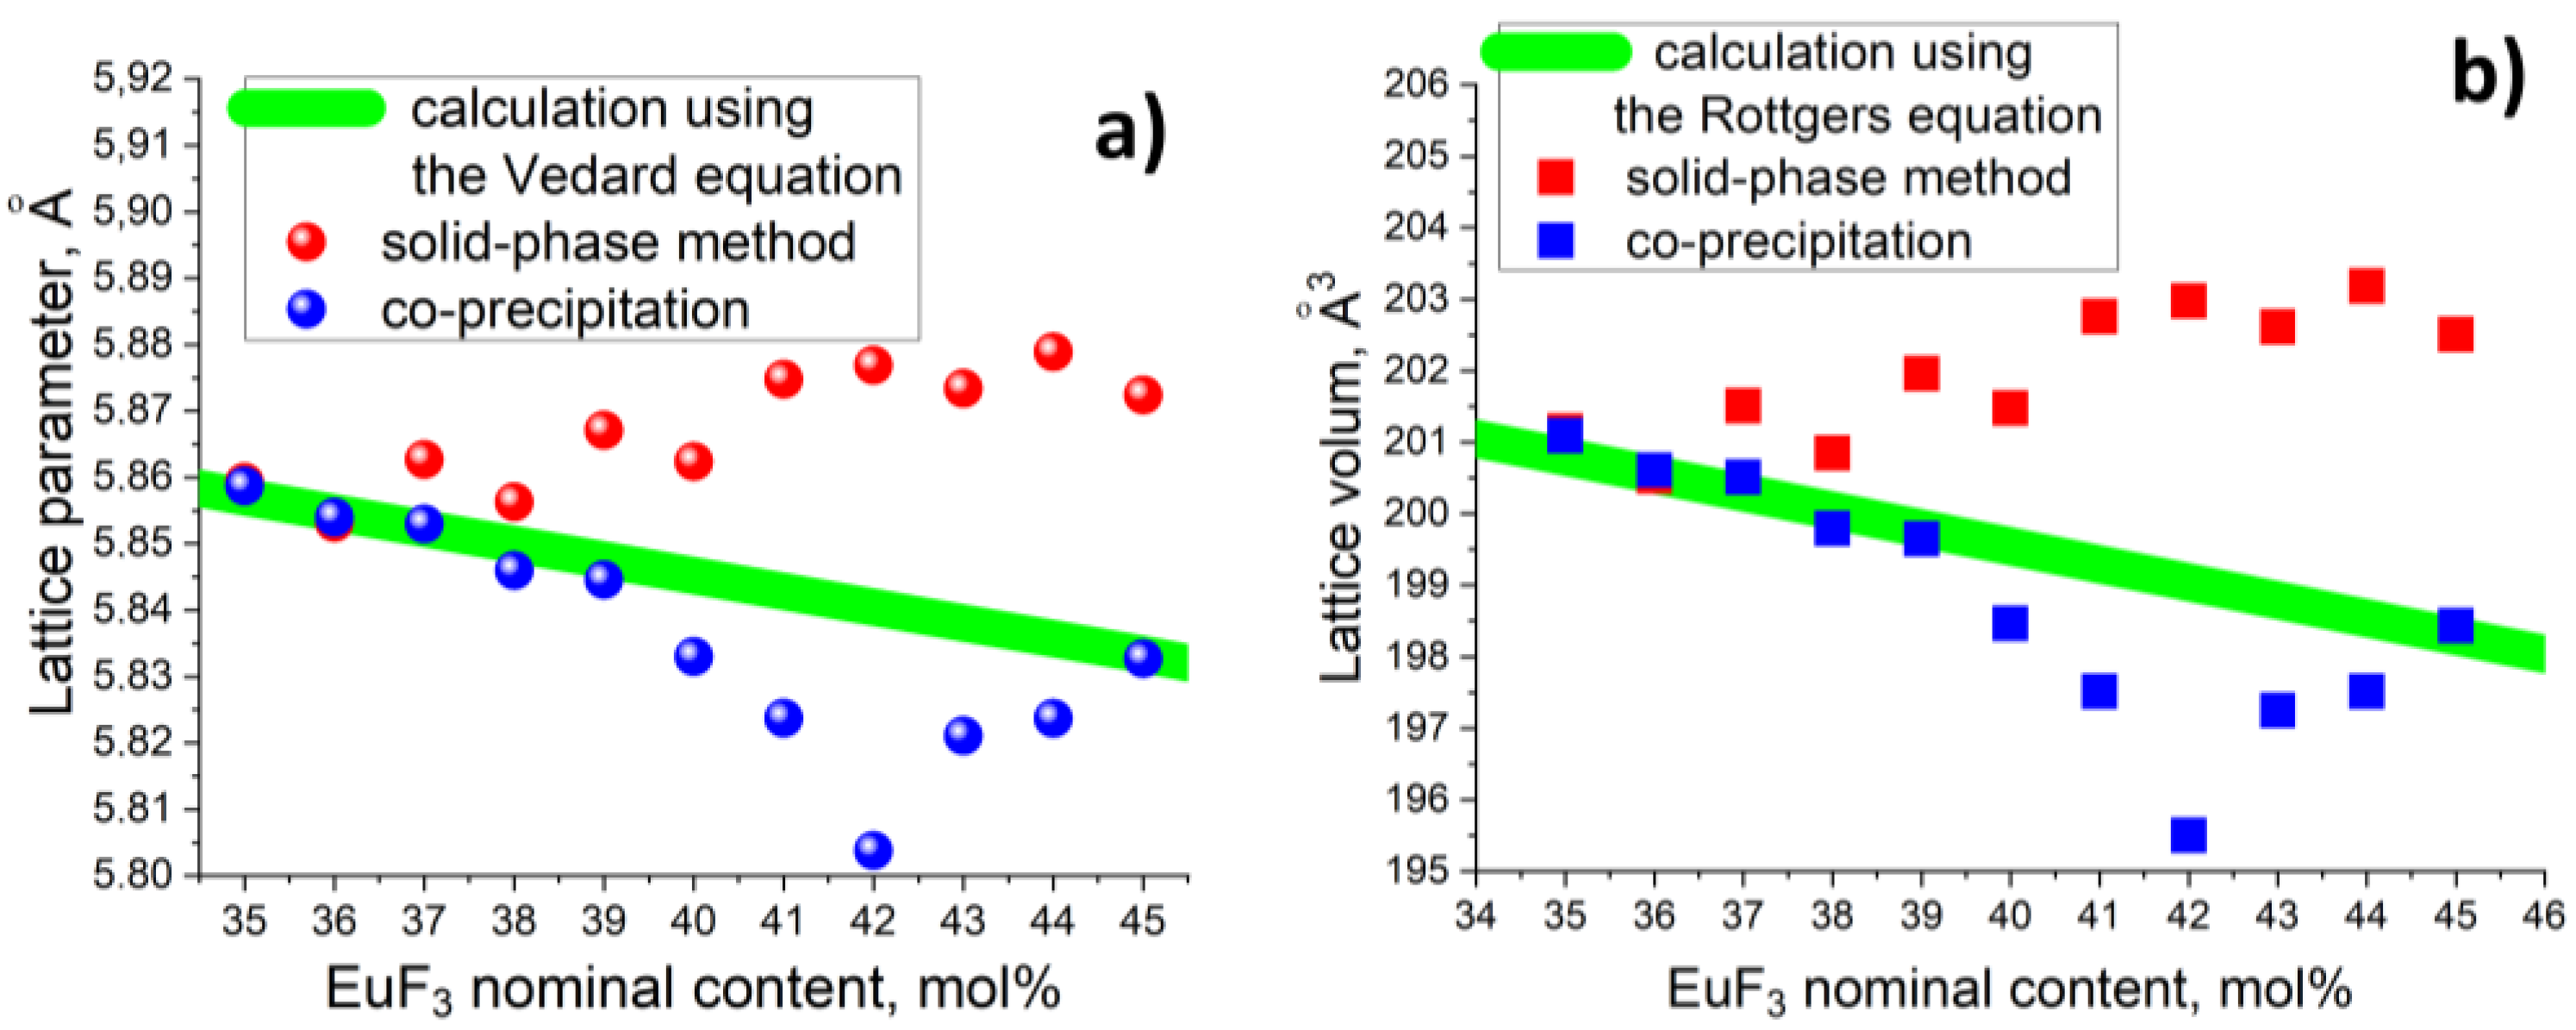
Figure 11.
Normalized PL spectra of samples in the (100-x)PbF2 -x EuF3 system (x=37-45 mol% EuF3), obtained by co-deposition (λexc=377 nm).
Figure 11.
Normalized PL spectra of samples in the (100-x)PbF2 -x EuF3 system (x=37-45 mol% EuF3), obtained by co-deposition (λexc=377 nm).
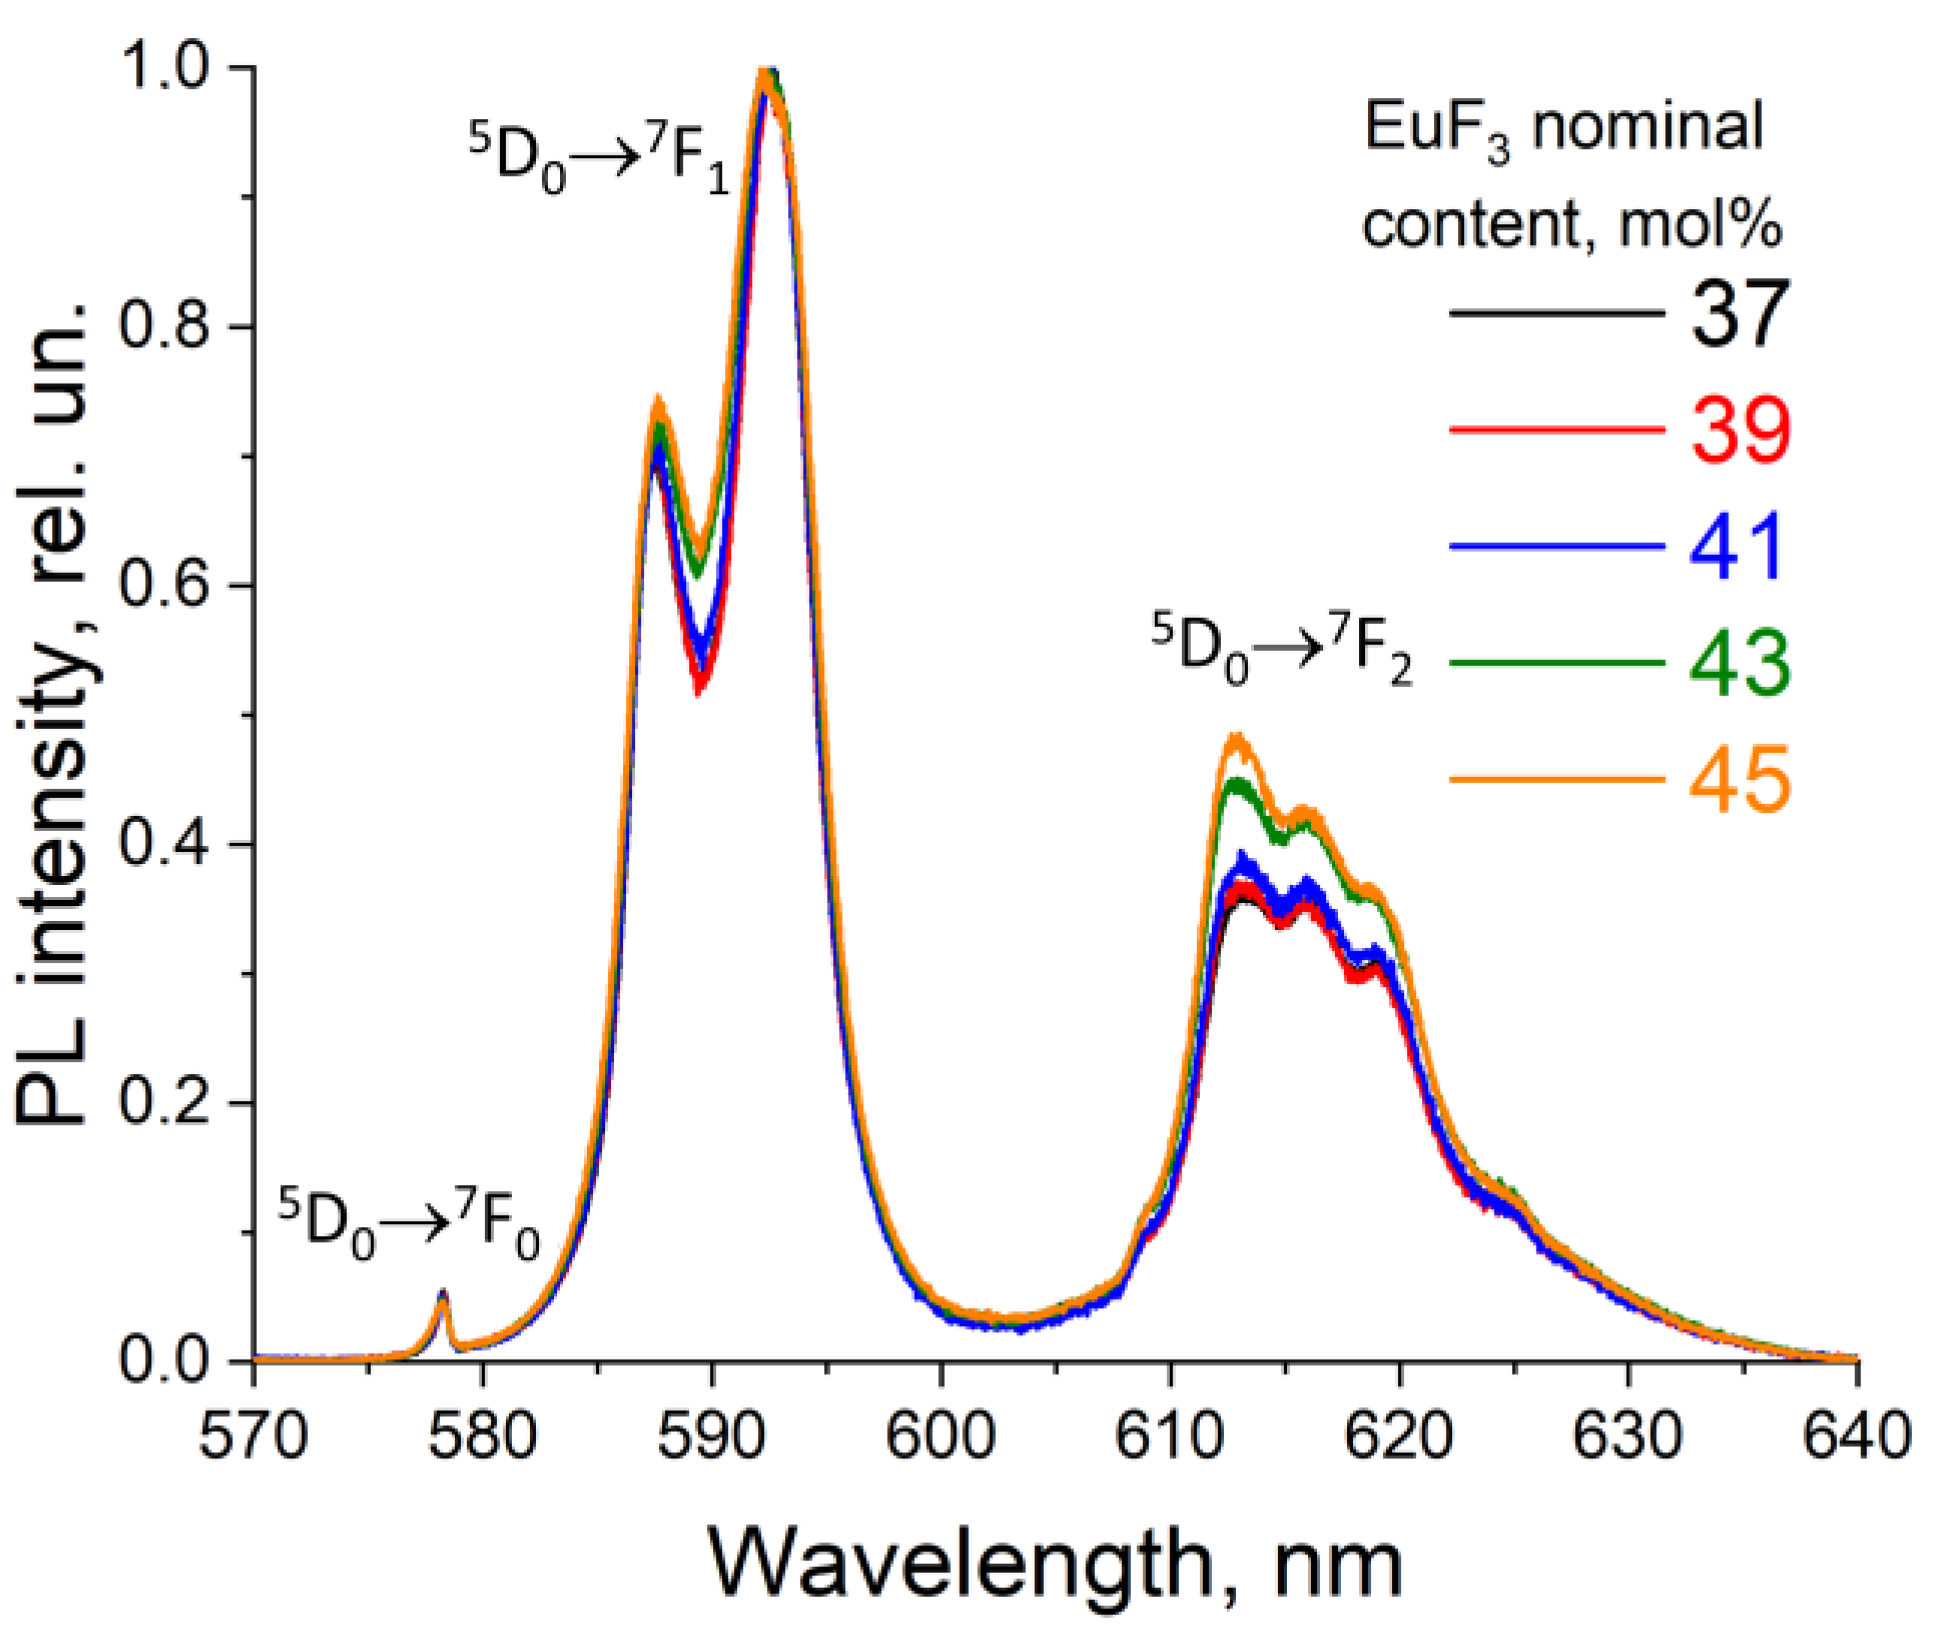
Figure 12.
Dependence of the asymmetry coefficient R21 on the EuF3 content in the system (100-x)PbF2-xEuF3 (x=37-45 mol% EuF3), obtained by co-precipitation technique.
Figure 12.
Dependence of the asymmetry coefficient R21 on the EuF3 content in the system (100-x)PbF2-xEuF3 (x=37-45 mol% EuF3), obtained by co-precipitation technique.
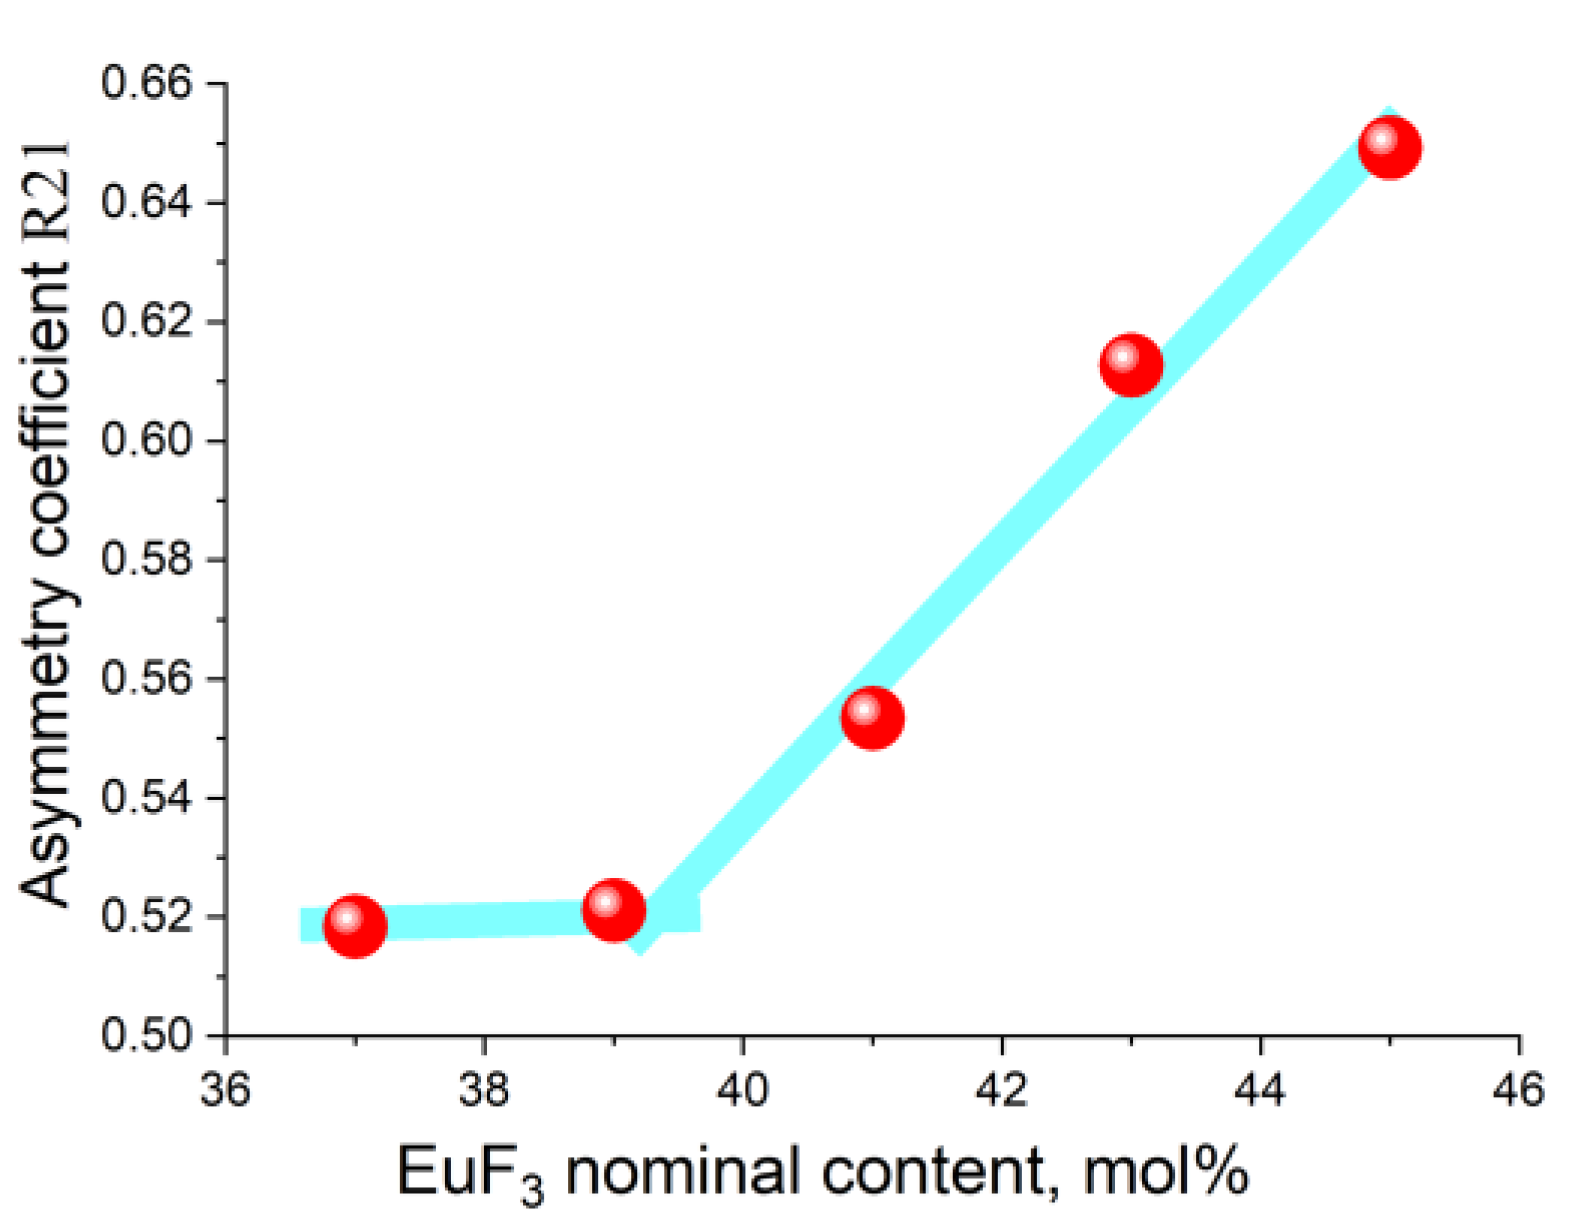
Figure 13.
Overall view of the normalized and Gaussian-fitted Raman spectra of (100-x)PbF2-xEuF3 samples (x=37-45 mol% EuF3), obtained by co-precipitation technique.
Figure 13.
Overall view of the normalized and Gaussian-fitted Raman spectra of (100-x)PbF2-xEuF3 samples (x=37-45 mol% EuF3), obtained by co-precipitation technique.
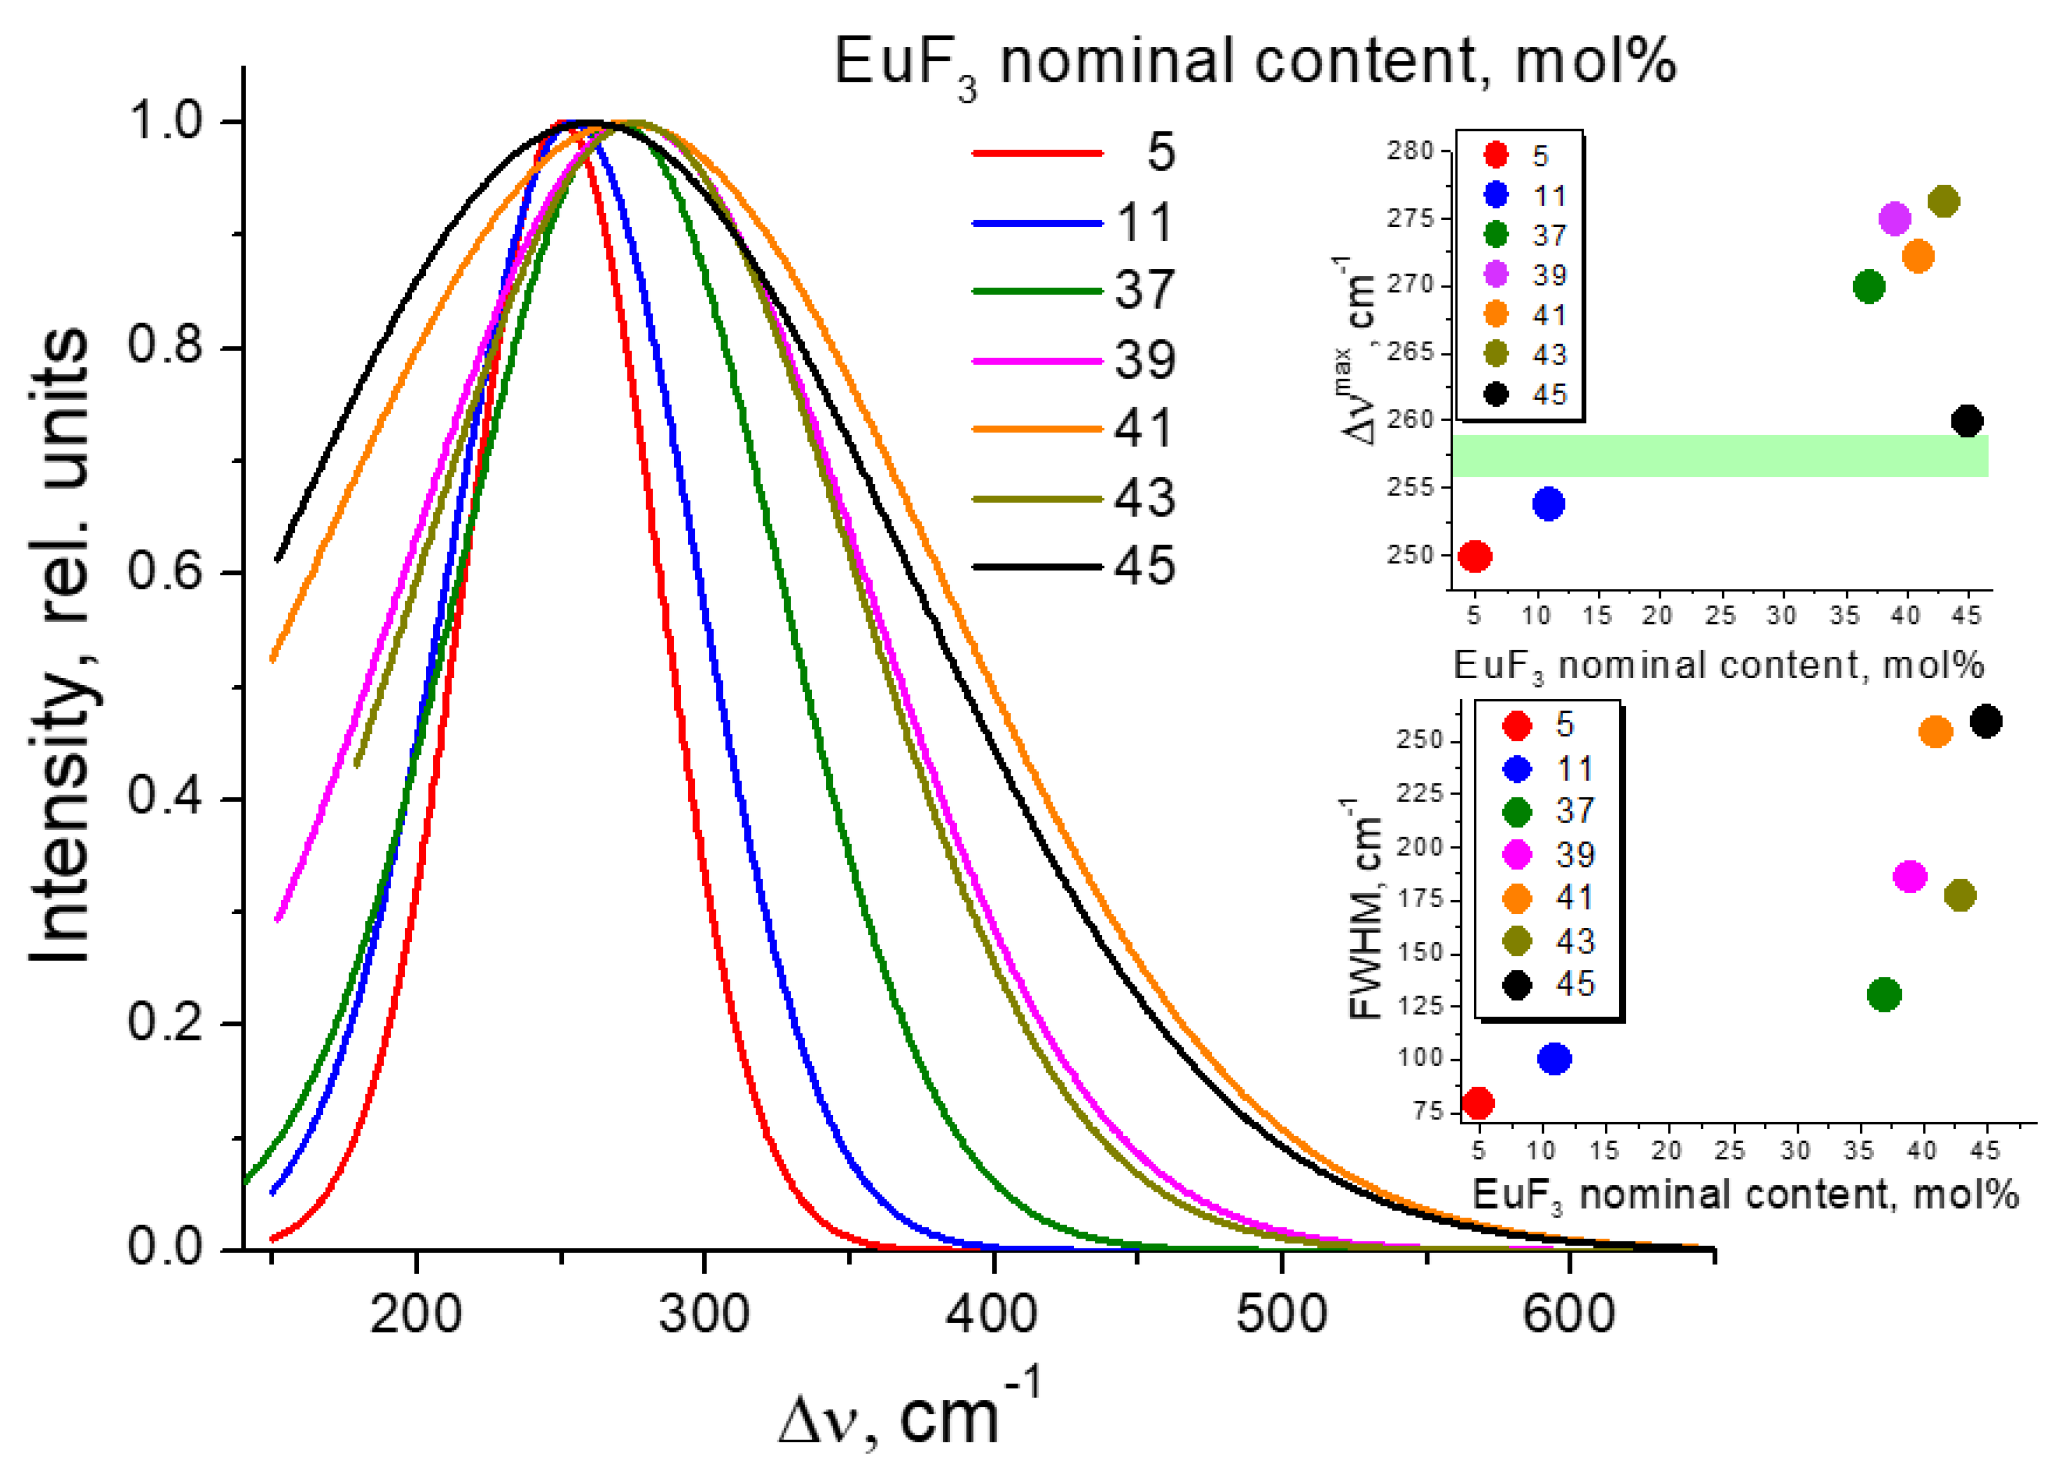
Figure 14.
T-X diagram near quasi-binary PbF2-EuF3 section of ternary Pb-Eu-F system in variable scale. The sketches of isothermal cross-sections of T-X-Y projection of ternary Pb-Eu-F diagram are presented schematically.
Figure 14.
T-X diagram near quasi-binary PbF2-EuF3 section of ternary Pb-Eu-F system in variable scale. The sketches of isothermal cross-sections of T-X-Y projection of ternary Pb-Eu-F diagram are presented schematically.
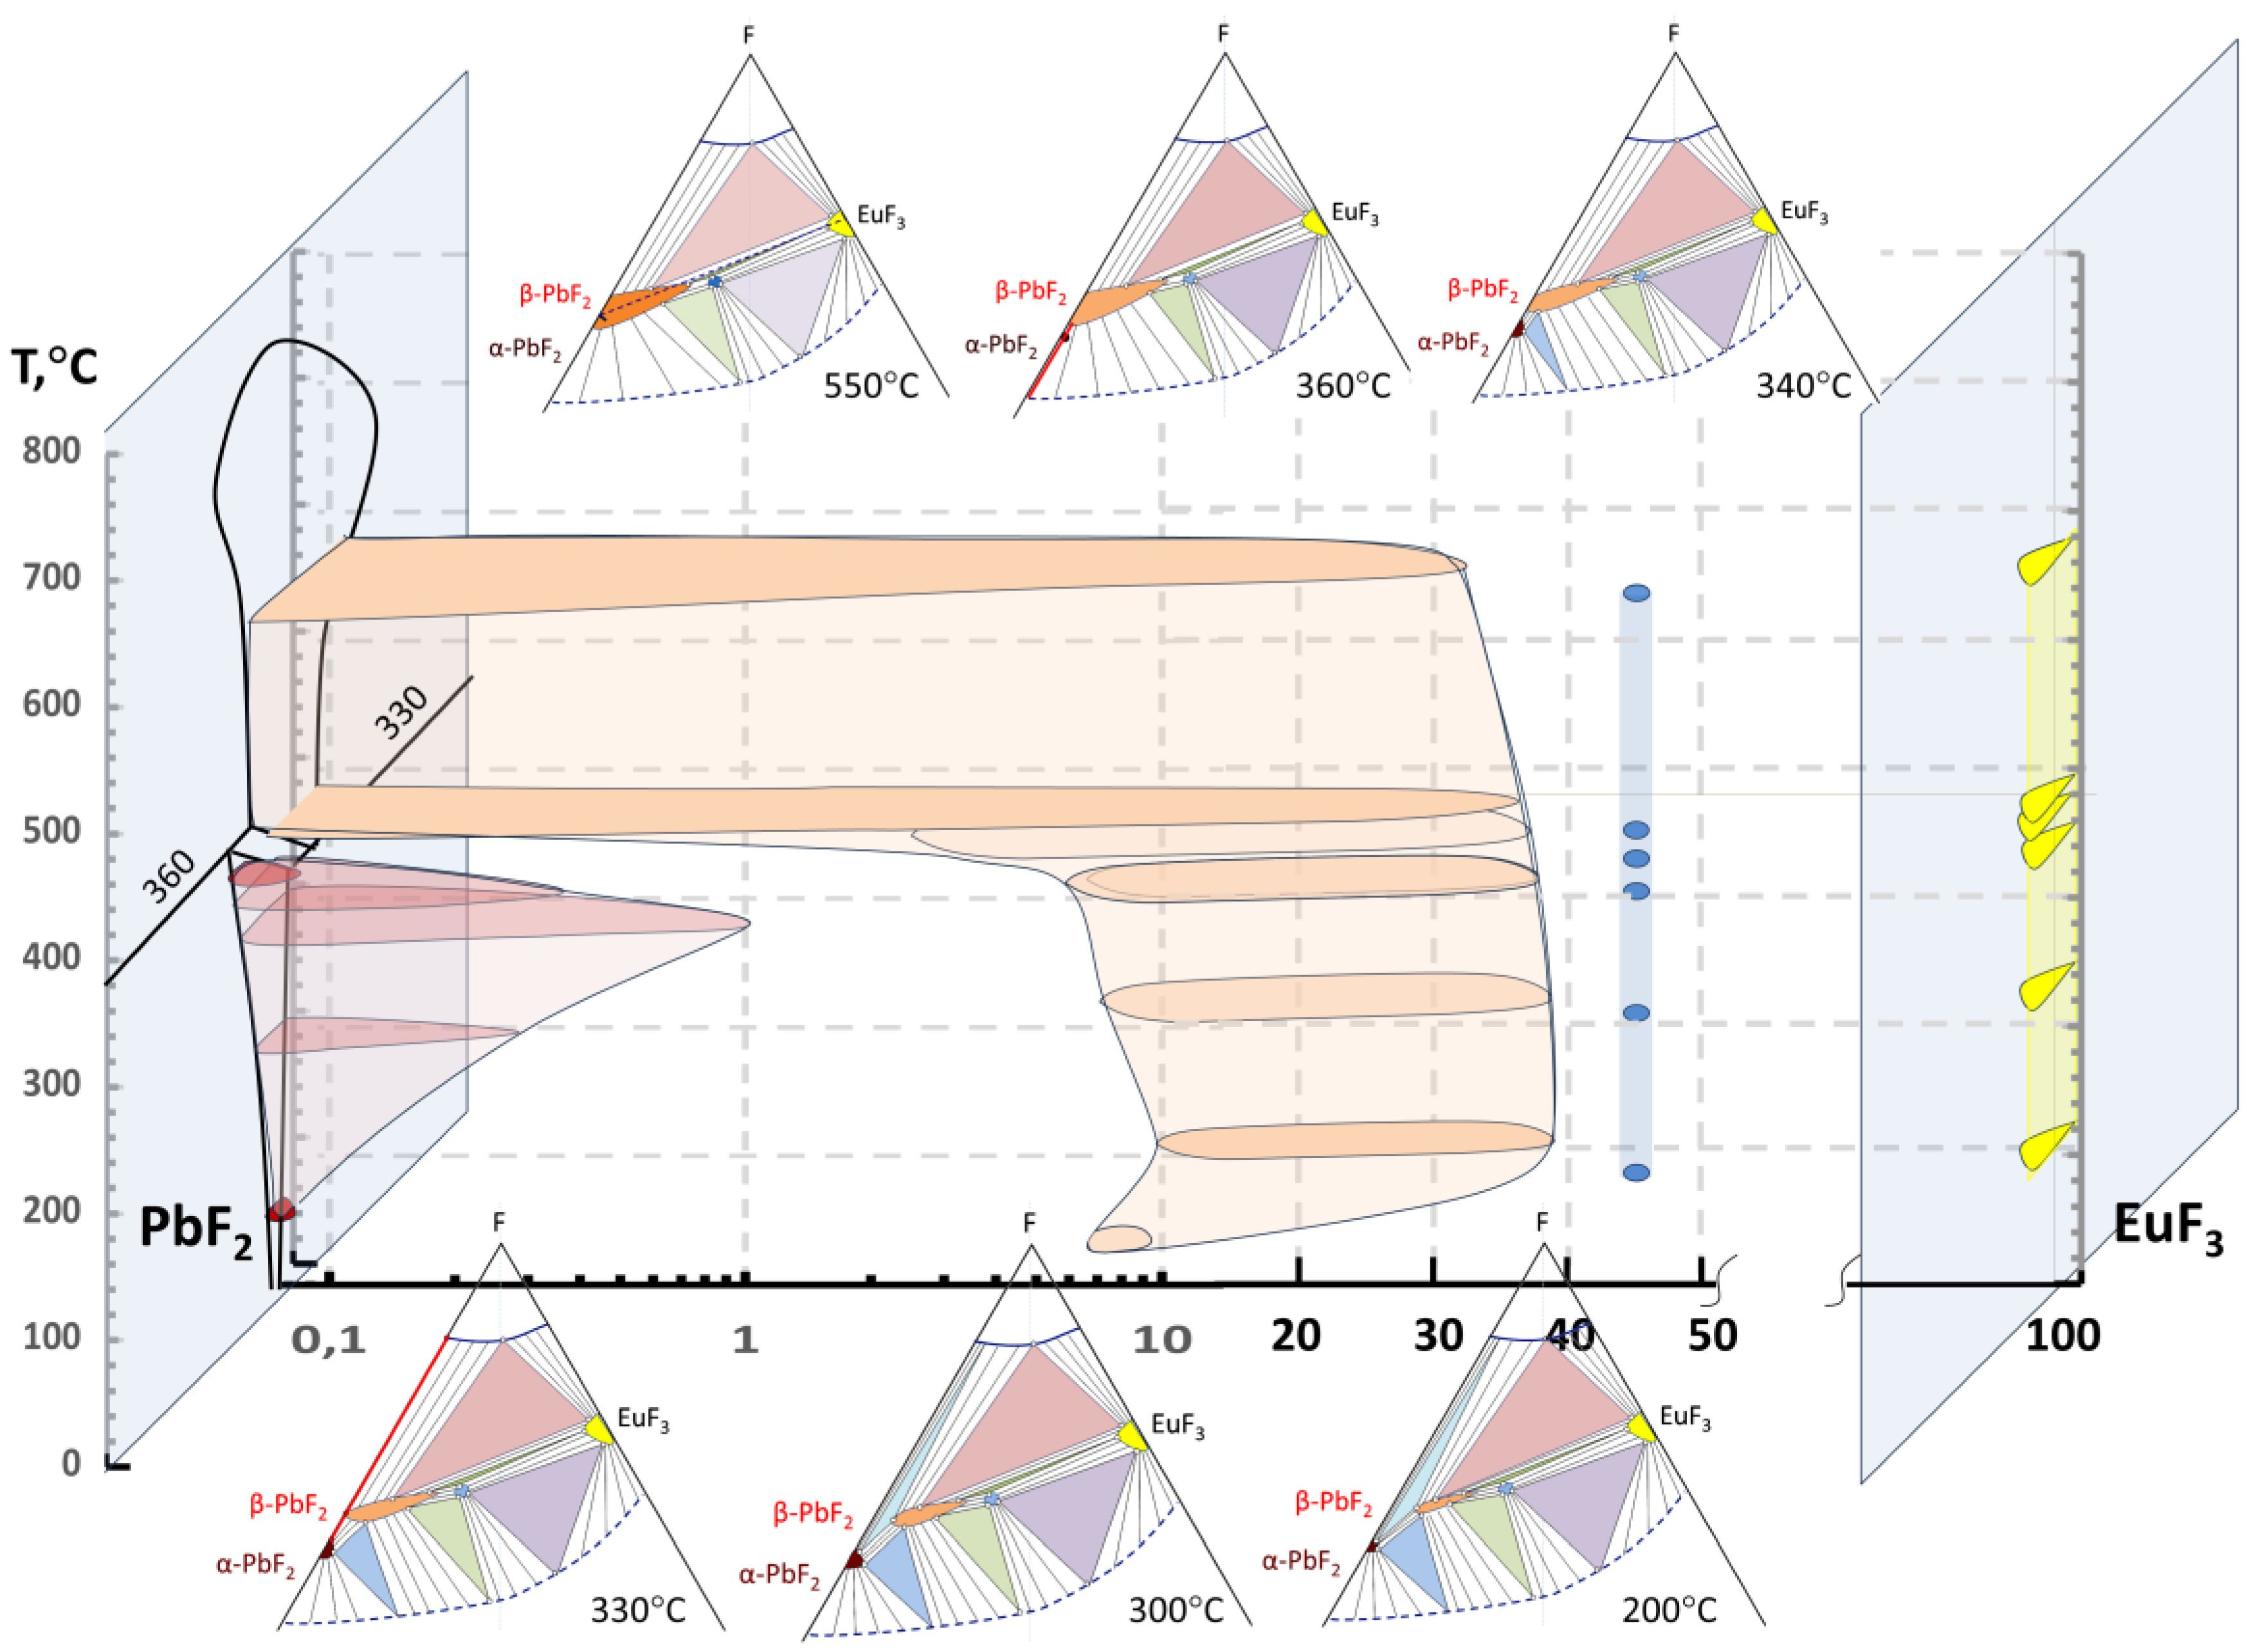
Figure 15.
Fragments of possible isothermal cross-sections of T-X-Y projection of ternary Pb-Eu-F diagram at 50-200 °C temperature range.
Figure 15.
Fragments of possible isothermal cross-sections of T-X-Y projection of ternary Pb-Eu-F diagram at 50-200 °C temperature range.
Disclaimer/Publisher’s Note: The statements, opinions and data contained in all publications are solely those of the individual author(s) and contributor(s) and not of MDPI and/or the editor(s). MDPI and/or the editor(s) disclaim responsibility for any injury to people or property resulting from any ideas, methods, instructions or products referred to in the content. |
© 2025 by the authors. Licensee MDPI, Basel, Switzerland. This article is an open access article distributed under the terms and conditions of the Creative Commons Attribution (CC BY) license (http://creativecommons.org/licenses/by/4.0/).
Copyright: This open access article is published under a Creative Commons CC BY 4.0 license, which permit the free download, distribution, and reuse, provided that the author and preprint are cited in any reuse.


