
Submitted:
03 December 2025
Posted:
05 December 2025
You are already at the latest version
Abstract
Southern blight, a fungal disease favored by hot and humid conditions in southeastern United States, poses a serious challenge to hemp production in Tennessee. Black plastic mulch (BPM), commonly used for weed control, can exacerbate the disease. There is limited information on the effects of straw mulch (SM), known to moderate soil temperatures and moisture, or planting time in disease management. Field studies were conducted in 2022 and 2023 at Tennessee State University to evaluate the effects of planting time, mulch type, and bio-fungicide application on disease severity, weed suppression, plant growth, and cannabinoid production in floral hemp. SM significantly reduced southern blight incidence and moderated soil temperature, while BPM increased both. Early planting reduced disease severity by 28% in 2022 and by 53% and 34% in 2023 for first and second planting dates, respectively. SM lowered soil temperature by 6%, enhanced chlorophyll content by 30%, and increased plant height and biomass by 20% and 25%, respectively. Early planting increased cannabidiol (CBD) concentration by 0.4%, while late planting increased tetrahydrocannabinol (THC) by 0.25%. These findings demonstrate that integrating straw mulch with early planting can reduce disease severity, stabilize soil microclimate, and enhance hemp productivity under warm, humid conditions.
Keywords:
industrial hemp
; southern blight
; cannabidiol
; tetrahydrocannabidinol
; straw and black plastic mulch
; soil temperature
; weed control
; planting time
1. Introduction
Industrial hemp (Cannabis sativa L.) is one of the earliest domesticated crops, historically cultivated for fiber, food, and medical uses worldwide [1]. In the United States, production declined sharply in the mid-20th century due to marijuana-related regulations, resulting in a prolonged gap in agronomic research and production knowledge. The resurgence of hemp cultivation after removal from the Schedule I controlled substances list under the 2018 Farm Bill has highlighted its potential contributions to sustainable agriculture, environmentally friendly manufacturing, soil health, and rural economic development, particularly in Tennessee. However, modern production remains constrained by strict federal compliance requirements, vulnerability to pests and diseases, and limited region-specific agronomic information.
Current federal regulations define industrial hemp as Cannabis sativa plants containing no more than 0.3% tetrahydrocannabinol (THC) on a dry weight basis [2,3]. Plants exceeding this threshold are legally classified as marijuana [4]. Industrial hemp is a multipurpose crop with three major categories of use: fiber, grain, and cannabinoids. Fiber cultivars are the tallest, and are harvested at flowering [5,6], for fiber used in paper, building materials, textiles, biocomposites, animal bedding, and biofuels [7]. Grain cultivars are shorter and grown for seed rich in omega-3 and omega-6 fatty acids, γ-linoleic acid, and antioxidants, with extracted oil utilized in food, biofuel, nutritional supplements, and cosmetics [6,7]. Floral cultivars are bred specifically for cannabinoid production, particularly cannabidiol (CBD) and THC, and now dominate production in Tennessee [8].
Cannabidiol (CBD) is one of the many cannabinoids, a class of plant-derived terpenophenolic compounds found in marijuana and industrial hemp that exert distinct physiological effects in humans. The best-known cannabinoid is the psychoactive delta-9 THC. Interest in CBD has increased substantially because of its documented therapeutic potential [9], including applications in epilepsy management [10,11,12], depression and anxiety disorders [13,14] and pain relief [15]. Ongoing research continues to evaluate additional medical uses. Continued research is needed to optimize production systems and support long-term economic viability.
The interaction between CBD and THC biosynthesis in hemp remains poorly understood. Anecdotal evidence suggests an inverse relationship in which higher concentrations of one compound may coincide with lower concentrations of the other, a dynamic that is important for guiding agronomic and breeding strategies to optimize cannabinoid profiles. Although high-yielding CBD cultivars are desirable, biotic and abiotic stresses can trigger THC spikes and increase the risk of regulatory non-compliance. Preliminary studies indicate that drought, flooding, nutrient imbalances, heat, and cold may elevate THC concentrations [16], yet results remain inconsistent. For example, De Prato, Ansari [17] reported that daylength, temperature and nitrogen strongly influence hemp development and cannabinoid production, whereas Sikora, Berenji [18] found that soil temperature increased CBD production without affecting THC. Toth, Smart [19] observed no effects of flooding, powdery mildew, herbicides, or physical injury on CBD or THC, though temperature interactions were not tested. Further research is therefore needed to clarify how environmental conditions influence cannabinoid composition and regulatory compliance.
Although cannabinoids are present throughout hemp tissues, they are concentrated primarily in the glandular trichomes of female inflorescences [20]. Unfertilized female flowers accumulate higher cannabinoid concentrations than pollinated flowers [2], which is why commercial CBD production relies on feminized seed or clonal propagation systems, with routine scouting to remove male plants.
Hemp is a dioecious, annual, photoperiod-sensitive species [6,21,22], with a life cycle of approximately four to eight months, and harvest timing strongly influences both yield and cannabinoid composition. Maximum CBD concentrations are often achieved at about nine weeks of flowering [23], while THC generally continues to increase with plant age, prompting early harvest to avoid regulatory violations. However, the influence of planting date on cannabinoid yield, THC compliance, and pest or disease incidence remains poorly understood, particularly under varying soil temperatures and environmental conditions.
Diseases, insect pests, and weeds are major constraints to hemp production [24], a challenge exacerbated by the limited number of pesticides registered for use in hemp. In the southeastern United States, high humidity favors disease development, and substantial yield losses have been reported by Tennessee growers [25]. Among the most economically damaging problems are southern blight, leaf spot, and corn earworm [25]. Southern blight, caused by the soil-borne fungus Sclerotium rolfsii, is particularly destructive in hot, humid regions, including Tennessee [25,26,27]. The pathogen has an exceptionally broad host range, infecting more than 500 plant species across over 100 plant families, including tomato, potato, pepper, eggplant, and cucurbit crops [28,29,30].
The southern blight pathogen is characterized by rapid growth and prolific production of sclerotia, which can persist for many years in surface soils and serve as a continuous source of inoculum in rotational systems [31]. Early symptoms include wilting, decline, and dieback, typically beginning as a water-soaked lesion at the crown near the soil surface. The lesion rapidly girdles the stem, disrupting nutrient transport and causing plant collapse and death [32]. The pathogen survives as sclerotia or mycelium on plant debris and spreads through irrigation water, infested soil, infected transplants, and contaminated equipment [33].
Effective fungicides approved for control of southern blight in hemp are very limited. Currently, the biofungicide Defguard® (Bacillus amyloliquefaciens) is the only registered product [33]. As such, an integrated disease management strategies are essential and include the use of disease-free planting material, avoidance of stem and root injuries, exclusion of infested fields, routine scouting, prompt removal of diseased plants, sanitation of equipment, and deep plowing to bury infested debris and reduce surface inoculum.
Southern blight development is favored by high soil moisture and warm temperatures between 27 and 35°C [33]. Black plastic mulch with drip irrigation, widely used in floral hemp production for weed control, can further elevate soil temperatures and intensify disease risk. Despite this, plastic mulch remains common because of the lack of herbicides approved for hemp. In contrast, straw mulch conserves soil moisture, reduces evaporation and erosion, and moderates soil temperature extremes [34,35,36]. To date, no study has evaluated the combined effects of planting date, mulch type, and biofungicide application on southern blight development, weed pressure, and cannabinoid production in hemp.
The objectives of this study were therefore to evaluate the combined effects of planting date, mulching practice (plastic vs. straw), and biofungicide application on southern blight incidence, weed suppression, cannabinoid production, THC concentration, and overall plant performance. We hypothesized that:
- a)
- straw mulch would reduce southern blight severity compared to black plastic mulch,
- b)
- earlier planting would reduce southern blight incidence and enhance plant growth and CBD yield,
- c)
- the combination of straw mulch and early planting would produce the greatest reduction in disease and the most favorable growth conditions,
- d)
- both straw and plastic mulch would suppress weeds, with plastic providing the greatest suppression,
- e)
- application of Bacillus amyloliquefaciens (Defguard®) would reduce disease severity relative to untreated controls, and
- f)
- early planting would increase CBD concentration due to extended vegetative growth and more favorable environmental conditions.
2. Materials and Methods
Field experiments were conducted in 2022 and repeated in 2023 at the Tennessee State University Research and Agricultural Experiment Centre (TSU AREC) in Nashville (36°10'34.0"N 86°49'36.5"W) to determine the effect of mulches and planting time on managing southern blight and enhancing industrial floral hemp production. Soil at the study site was classified as Armour and Byler loam with a pH of 6.07 and 1.13% organic matter [37].
The study followed a randomized complete block design (RCBD) with four replications. Treatments combined three planting dates, mulching practice (black plastic, straw, or no mulch), and application of a biological fungicide (Bacillus amyloliquefaciens strain D747; Defguard®). Independent variables included planting date, mulch, and fungicide, while response variables were southern blight disease incidence and severity, weed density and biomass, plant height and total biomass, soil temperature, chlorophyll content, and cannabinoid composition. Blocks were arranged to account for field variability.
Fields were disked and then rotavated to approximately 14 cm depth to incorporate residues. Beds were raised using a tractor-mounted plastic layer that simultaneously installed black polyethylene mulch and drip irrigation lines where assigned. Straw mulch was unrolled manually from large round bales across designated plots. Each plot measured 1.5 m in width and 9.1 m in length, with mulch applied before transplanting. Feminized CBD hemp (‘Fukuoka’) seedlings were used. Immediately before transplanting, seedlings assigned to the fungicide treatment were root-dipped in a suspension of 14.78 mL Defguard® per 1895 mL water, following the product label. Control plants were dipped in water only before planting.
Weather data were obtained from the on-site station. During the cropping period (approximately May to November), weekly mean maximum temperatures ranged from 26.8 to 31.3 °C (mean 29.3 °C) and minimum temperatures from 23.0 to 26.0 °C (mean 24.5 °C). Relative humidity ranged from 72.8% to 78.5% and total rainfall was approximately 109 mm. Conditions were comparable between years.
Plant height was measured from the soil surface to the apical meristem during early vegetation and maturity, recorded in centimeters on 10 randomly selected plants per plot. Soil temperature was monitored in each treatment at 5 cm depth using a Comark T125, 2.54 cm dial-type thermometer, with two random readings per plot. Weed density and biomass were sampled at 4–5 weeks after planting using a 0.25 m² quadrat. All aboveground weeds within the quadrat were clipped at the soil surface, counted, and weighed fresh. Samples were then oven-dried to constant weight and reweighed to determine dry biomass. Southern blight severity was visually assessed every two weeks based on typical symptoms (crown and basal lesions, white mycelial growth, leaf yellowing, wilting, and dieback), with incidence recorded simultaneously, on a scale of 0-100, with plants assessed to have died from the pathogen rated as 100% diseased.
Chlorophyll content was assessed in 2023 only, because a SPAD meter was not available in 2022. In 2023, chlorophyll readings were taken with a Minolta SPAD-502 DL at approximately 30, 60, and 90 days after planting. Three plants were selected randomly from each net plot, and eight leaves were measured per plant (four from the lower canopy and four from the mid-to-upper canopy). Readings were averaged to the plant and plot levels.
At harvest, two whole plants per plot were cut at the stem base and weighed immediately to obtain fresh biomass. Plants were then hung upside down in a dark, ventilated room to cure for approximately four weeks. After curing, plants were reweighed to determine dry biomass. Floral material and leaves were manually stripped from dried stems, bagged, and stored at low temperature for subsequent analysis. Dried floral subsamples were homogenized and analyzed for cannabinoid content by New Bloom Labs (Chattanooga, TN).
2.1. Statistical Analysis
Because 2022 served as a preliminary trial year with fewer variables measured, data from 2022 and 2023 were analyzed separately. Mixed-effects models were fitted in R (R Core Team, 2021) using the nlme package [38], with planting date, mulch, and fungicide as fixed factors and block as a random factor. Where applicable, sampling date was included as a repeated measure. Treatment means were separated using least significant difference (LSD) tests at α = 0.05 with the agricolae package [39]. In addition to the ANOVA, Spearman’s rank correlation analysis was conducted to assess the relationship between chlorophyll content (SPAD) and disease severity (DS). Spearman’s rank correlation coefficient (ρ) was used to assess the strength and direction of monotonic associations between disease severity and chlorophyll content (SPAD). The coefficient (ρ) ranges from –1 to +1, where values close to ±1 indicate strong relationships and values near 0 indicate weak or no association. For interpretation, correlation strength was classified following Evans [40]: ρ = ±0.00–0.39, weak; ±0.40–0.69, moderate; and ±0.70–1.0, strong. Statistical significance (p < 0.05) indicates that the observed association is unlikely due to chance, even when the effect size is small.
3. Results
3.1. 2022 Results
The 2022 trial was conducted as a preliminary study with limited resources, which restricted the scope of data collection. A chlorophyll meter was not available that year, so SPAD readings were not recorded. In addition, dry biomass data could not be obtained for the third planting time due to poor plant establishment and the loss of at least one replicate, resulting in incomplete data for that treatment. Because of these limitations and the resulting imbalance in the dataset, results from 2022 and 2023 were analyzed separately (Table 1).
3.1.1. Disease Severity, 2022
In 2022, no significant three- or four-way interactions were detected among mulch, fungicide, planting time, and sampling date. However, a significant mulch × planting time interaction was observed for disease severity (p = 0.0476; Table 1). Disease severity was greatest in plots planted at the first planting time and mulched with black plastic (Figure 1). Although straw mulch produced numerically lower disease severity at this planting time, the difference was not statistically significant.
3.1.2. Weed Density, 2022
Mulch had a highly significant effect on weed density (p < 0.0001; Table 1), while fungicide, planting time, and their interactions with mulch were not significant. Weed density was lowest under black plastic mulch and highest under straw mulch, with intermediate values in the no-mulch control (Figure 2). Compared to the no-mulch control, black plastic mulch reduced weed density by 97.26% and straw mulch by 90.73%. Fungicide applications and differences in planting time did not alter weed density.
3.1.3. Plant Biomass Yield, 2022
Both mulch type (p = 0.0481) and planting time (p < 0.0001) significantly influenced biomass. Straw mulch yielded the highest biomass, followed by black plastic and no mulch. Early planting (Planting Time 1) produced significantly higher total dry weight (TDW) compared to later planting times (Figure 3 and Figure 4).
3.1.3. Soil Temperature, 2022
A significant mulch × sampling date interaction was detected for soil temperature (p = 0.00391; Table 1); therefore, results were separated by sampling date. Temperatures were measured in July and August. Across both dates, soil temperature was higher under black plastic than under straw mulch, with the greatest separation in August; the no-mulch control was intermediate (Figure 5). Fungicide and planting time had no effect, and no other interactions were significant.
3.1.3. Cannabinoid Profile, 2022
Analysis of cannabinoid profiles indicated that planting time had a significant impact on both THC (p = 0.0016) and CBD (p < 0.0001), with earlier planting producing the highest concentrations of each (Table 1; Figure 6 and Figure 7). Mulch and fungicide had no significant effects on cannabinoid levels.
3.2. 2023 Results
3.2.1. Disease Severity, 2023
In 2023, a significant mulch × planting time interaction (p = 0.0576) and a marginally significant planting time × sampling date interaction (p = 0.085) were observed for disease severity (Table 2). Black plastic mulch increased southern blight incidence by at least 25% compared with straw and no-mulch treatments during the first and second planting times (Figure 8). Disease severity tended to be highest in September compared to the earlier sampling dates in July and August (Figure 9). Spearman’s rank correlation indicated a significant negative association between chlorophyll content (SPAD) and disease severity (ρ = –0.179, p = 0.0106; n = 204). Regression analysis further supported this trend (slope = –0.477 ± 0.117, R² = 0.076, p < 0.001; Figure 10) demonstrating that higher disease pressure was associated with reduced chlorophyll levels in hemp plants. These findings contrasted with 2022, when no treatment effects were detected for disease severity.
3.2.2. Plant Height, 2023
Mulch type, planting time, and fungicide application significantly affected plant height (p = 0.047; Table 2). Straw mulch, particularly in combination with early planting and fungicide application, resulted in the tallest plants (Figure 11). In contrast, black plastic mulch generally reduced plant height across planting times, while no mulch plots produced intermediate values. Plant height was not measured in 2022.
3.2.3. Chlorophyll Content, 2023
Chlorophyll content was significantly influenced by the mulch × planting time × fungicide interaction (p = 0.0368; Table 2). The highest SPAD readings occurred under straw mulch in combination with early planting and fungicide application (Figure 12). Black plastic mulch generally resulted in lower chlorophyll content, while no mulch plots were intermediate (Figure 12).
3.2.4. Weed Density, 2023
Mulch type had a highly significant effect on both broadleaf and grass weed density (p < 0.0001; Table 2). Black plastic mulch was the most effective, reducing broadleaf weed counts by 92.1% and grass weed counts by 91.3% compared to the no-mulch control (Figure 13 and Figure 14). Straw mulch also provided substantial suppression, particularly for broadleaf weeds, though it was less effective than black plastic. In the absence of mulch, weed pressure was markedly higher. These results were consistent with 2022 findings, where black plastic also provided the greatest reduction in weed density, straw mulch was intermediate, and no-mulch plots had the highest weed pressure, underscoring the importance of mulching in integrated weed management.
3.2.5. Soil Temperature, 2023
Although results indicated a significant mulch × fungicide interaction (p = 0.0392; Table 2) for soil temperature, the differences between mulches were only marginally modified by fungicide application (Figure 15), with mulch treatments primarily driving the response. Significant mulch × sampling date (p < 0.0001; Figure 16) and planting time × sampling date (p = 0.00021; Figure 17) interactions showed that mulch effects were most pronounced during the hottest summer months. Plastic mulch produced the highest soil temperatures, particularly during June and July, while straw mulch consistently moderated temperatures compared with both plastic and bare soil.
Findings from 2023 were consistent with those observed in 2022, when a significant mulch × sampling date interaction was detected (p = 0.00391; Table 1). In both years, plastic mulch elevated soil temperatures relative to straw (Figure 15), with the greatest separation occurring during the hottest months (Figure 16). The no-mulch control remained intermediate in both trials. Together, these results confirm that straw mulch is more effective than plastic or bare soil in moderating soil temperature across environments and seasons.
4. Discussion
4.1. Disease Severity
Across both study years, black plastic mulch consistently increased southern blight severity relative to straw mulch and the no-mulch control (Figure 1 and Figure 9). The higher soil temperatures observed under black plastic (Figure 5 and Figure 21) likely created a more favorable environment for Sclerotium rolfsii development and disease progression, as elevated temperature and soil moisture are known to promote pathogen growth and infection [24,32,41]. In contrast, straw mulch substantially reduced disease severity, particularly during the first planting in both years, by moderating soil temperature and likely promoting a more stable soil surface microenvironment that was less favorable for pathogen activity (Figure 21), consistent with Pane, Cosentino [26], who demonstrated suppression of soil-borne pathogens in soils amended with organic residues, and with Du, Trivedi [42], who showed that soil biological balance and environmental conditions strongly influence pathogen prevalence.
Although the Spearman’s rank correlation between chlorophyll content and disease severity (ρ = –0.178; Figure 11) was weak, its statistical significance (p = 0.0106) suggests that increased disease pressure reduced photosynthetic efficiency and overall plant vigor, consistent with the physiological effects of S. rolfsii infection [32,42]. The small effect size reflects the expected physiological response, as reduced green leaf area and chlorotic lesions are typical consequences of pathogen infection. These findings align with prior studies demonstrating that organic mulches and soil amendments can suppress soil-borne pathogens by regulating soil temperature, improving microbial diversity, and reducing inoculum survival [26,36,41,43]. Moreover, the increasing frequency of southern blight reports in hemp systems [33,44] underscores the need for continued research into environmentally sustainable management strategies for S. rolfsii.
4.2. Weed Density
In both years, black plastic mulch was the most effective in suppressing broadleaf and grass weeds (Figure 2, Figure 18, and Figure 19), achieving reductions exceeding 90%. Straw mulch also provided substantial weed suppression, though it was slightly less effective than black plastic. The absence of mulch resulted in markedly higher weed density. These findings align with previous reports [36,45] demonstrating that mulching can simultaneously suppress weeds, conserve soil moisture, and moderate soil temperature —factors that indirectly support crop vigor and disease management in humid regions such as Tennessee. By limiting weed competition and buffering soil temperatures around the root zone, mulched treatments likely promoted greater plant vigor, thereby strengthening natural defense mechanisms against pathogens. As noted by Agrios [46], well-nourished and vigorous plants resist pathogen invasion more effectively through stronger structural and biochemical defenses. Similarly, Lucas [47] reported that plant vigor and stress tolerance often correlate with reduced disease susceptibility, while Panth, Hassler [41] demonstrated that cultural practices enhancing soil health and root resilience can reduce disease pressure by improving the microbial balance in the rhizosphere. However, further studies are needed to establish direct correlations among weed pressure, temperature regulation, plant vigor, and disease severity in hemp production systems.
4.3. Plant Biomass
Straw mulch consistently produced the highest plant biomass, followed by black plastic mulch and the no-mulch control (Figure 3). The favorable growing environment created by straw mulch, including cooler soil temperatures (Figure 21) and reduced weed competition (Figure 18 and Figure 19), likely contributed to greater vegetative growth and biomass accumulation through improved soil microclimate and resource availability, as previously reported in other cropping systems [36,48]. Early planting also resulted in significantly greater biomass compared to later planting times (Figure 4), consistent with findings showing that early planting increases vegetative duration and total dry matter accumulation in hemp [49,50]. Similar trends were observed in 2023, reinforcing the role of straw mulch in promoting favorable soil and canopy conditions for hemp growth and biomass development. Beyond its direct effects on growth, the moderated soil environment under straw mulch may have contributed indirectly to reduced disease pressure and improved overall plant vigor [24,26].
4.4. Plant Height
Plant height followed a trend similar to biomass, with straw mulch producing the tallest plants, followed by black plastic mulch and the no-mulch control (Figure 3). The moderated soil temperatures and improved moisture retention associated with straw mulch (Figure 21) likely created more favorable conditions for root and shoot development, leading to greater plant stature. Early planting also resulted in significantly taller plants than later planting times (Figure 4), consistent with findings by Linder, Young [50] and Mediavilla, Leupin [49], who reported that earlier establishment extends the vegetative growth period and enhances overall plant height due to longer exposure to optimal photoperiod and temperature conditions, given hemp’s photoperiod sensitivity [6,21,22]. Similar patterns were observed in 2023, reinforcing the combined benefits of early planting and straw mulch in promoting robust vegetative growth under Tennessee’s warm, humid growing conditions.
4.5. Chlorophyll Content
Chlorophyll content, measured using SPAD readings, varied significantly across treatments in 2023, with a notable mulch × planting time × fungicide interaction (p = 0.0368; Table 2). In general, plants grown with straw mulch maintained higher chlorophyll levels than those under black plastic or bare soil, suggesting that moderated soil temperature and moisture favored sustained photosynthetic activity. Early planting also produced higher chlorophyll content than later planting, consistent with greater vegetative vigor and longer canopy development. Although the main effect of fungicide was not significant (p = 0.709), its interaction with planting time (p = 0.1989) and mulch suggests a possible role in maintaining chlorophyll levels early in the season, particularly under conditions conducive to disease development. However, mulch and planting time remained the primary drivers of chlorophyll variation.
These results correspond closely with the negative correlation observed between chlorophyll content and disease severity (ρ = –0.178, p = 0.0106; Figure 11), indicating that higher chlorophyll levels were generally associated with reduced disease pressure. Similar relationships have been reported in other crops where greater chlorophyll retention reflected improved plant vigor and reduced pathogen stress [24,41]. In hemp, stress factors such as high soil temperature, pathogen infection, and nutrient imbalance are known to diminish chlorophyll accumulation and photosynthetic capacity [17]. Collectively, these findings highlight the role of early planting and straw mulch in maintaining photosynthetic efficiency and overall plant health by moderating soil microclimate and limiting disease impact under Tennessee’s warm, humid conditions.
4.6. Soil Temperature
The moderating effects of mulch and planting time observed in chlorophyll content were closely reflected in their influence on soil temperature, a key driver of disease development, plant vigor, and overall crop performance. Although our results indicated a significant mulch × fungicide interaction (p = 0.0392) for soil temperature, the differences between mulches were only marginally modified by fungicide application (Figure 21), with mulch type being the primary determinant. Significant mulch × sampling date (p < 0.0001; Figure 20) and planting time × sampling date (p = 0.00021; data not shown) interactions showed that differences among mulch types were most pronounced during the hottest summer months. Plastic mulch produced the highest soil temperatures, particularly during June and July, while straw mulch consistently moderated temperatures compared to both plastic and bare soil.
These results align with previous findings demonstrating that black plastic mulch increases soil temperature by enhancing radiation absorption and limiting evaporative cooling, whereas organic mulches such as straw buffer soil temperature by improving insulation and reducing heat flux [35,36]. Findings from 2023 were consistent with those from 2022, when a significant mulch × sampling date interaction was detected (p = 0.00391; Table 1). In both years, plastic mulch elevated soil temperature relative to straw, with the greatest separation occurring during the hottest periods (Figure 5). The no-mulch control remained intermediate in both trials. Together, these results confirm that straw mulch is more effective than plastic or bare soil in moderating temperature extremes across environments and seasons, thereby contributing to improved root-zone stability, sustained chlorophyll levels, and reduced disease incidence.
4.7. Cannabinoid Profiles
Our findings that earlier planting time significantly increased both total THC (p = 0.0016; Table 1) and CBD concentrations (p < 0.0001; Table 1) reflect the strong influence of environmental conditions and developmental timing on cannabinoid biosynthesis in hemp. Plants established earlier in the season were exposed to longer photoperiods and more favorable temperature regimes, which likely enhanced metabolic activity and extended the vegetative phase, thereby increasing the accumulation of secondary metabolites such as cannabinoids [17,49,50]. Similar patterns were observed in 2023 (data not shown), supporting the consistency of these responses across growing seasons.
The lack of significant mulch or fungicide effects indicates that cannabinoid synthesis was primarily governed by physiological and environmental factors rather than by soil-surface management. This agrees with previous studies showing that cannabinoid content is most responsive to light duration, temperature, and plant maturity rather than soil moisture or disease management inputs [16,18,19]. Notably, the same early planting conditions that enhanced biomass and chlorophyll content in this study also appear to have favored cannabinoid accumulation, suggesting that photosynthetic vigor and secondary metabolism respond synergistically to optimal environmental cues. Collectively, these findings underscore the importance of optimizing planting time to maximize cannabinoid yield and maintain regulatory compliance with THC limits in southeastern U.S. production systems.
5. Conclusions
This study demonstrates that planting time and mulch type strongly influence southern blight severity, chlorophyll content, plant growth, and cannabinoid accumulation in hemp production systems in Tennessee. Early planting consistently enhanced plant vigor, chlorophyll content, biomass accumulation, and cannabinoid concentrations, primarily due to extended vegetative growth and longer exposure to favorable photoperiod and temperature conditions. Straw mulch moderated soil temperature and reduced disease severity compared to black plastic and bare soil, contributing to improved plant performance across growing seasons.
The combined effects of early planting and straw mulch highlight the value of cultural practices that optimize both soil microclimate and plant physiological responses. In contrast, fungicide application with Bacillus amyloliquefaciens (Defguard®) played a secondary role and was less effective than cultural measures in influencing plant health and disease outcomes. Collectively, these results emphasize that management strategies integrating optimal planting time and organic mulch can reduce disease incidence, stabilize soil temperature, and enhance both yield and quality of hemp grown under warm, humid conditions.
Further research is needed to refine these relationships by evaluating long-term impacts of mulch type and planting time on soil microbial activity, sclerotia persistence, and cannabinoid stability across cultivars and environmental conditions. Such studies will be critical for developing sustainable, integrated approaches to disease management and production optimization in emerging hemp production systems of the southeastern United States.
Author Contributions
Emmanuel C. Omondi: Conceptualization; methodology; investigation; formal analysis; data curation; writing, review and editing; visualization; validation; resources; funding acquisition; project administration; supervision. Sai S. Maddela: Methodology; investigation; formal analysis; writing, original draft. Margaret Mmbaga: Investigation; writing, review and editing; validation. Anand Kumar Investigation; formal analysis; writing, review and editing. Bharat Pokharel: Formal analysis; software; writing, review and editing; validation. Mitchell Richmond: Formal analysis; writing, review and editing; validation. Philip O. Hinson: Formal analysis; writing, review and editing. All authors have read and agreed to the published version of the manuscript
Funding
This research was funded by USDA-NIFA Capacity Building Grant, grant award number 2023-38821-40122.
Data Availability Statement
The raw data supporting the findings of this study are available from the corresponding author upon reasonable request.
Acknowledgments
The authors would like to thank Dr. Lucas Mackasmiel for his contributions throughout the experiment. We also extend our appreciation to Mr. Eddie William, former Farm Manager at the Tennessee State University Main Farm, for providing initial supplies and assisting with field preparation during the initial setup of the experiment. Special thanks are extended to Dr. Chandra Reddy, Dean, College of Agriculture, TSU; Dr. Latif Lighari, Associate Director of Extension, College of Agriculture, TSU; Dr. Dilip Nandwani, Professor of Organic Agriculture, College of Agriculture, TSU; and the TSU Main Farm staff for their continued support.
Conflicts of Interest
The authors declare no conflicts of interest
References
- Rupasinghe, H.V., et al., Industrial hemp (Cannabis sativa subsp. sativa) as an emerging source for value-added functional food ingredients and nutraceuticals. Molecules, 2020. 25(18): p. 4078. [CrossRef]
- Williams, D. and R. Mundell, An introduction to industrial hemp and hemp agronomy. 2018, ID-250, University of Kentucky College of Agriculture, Food, and Environment ….
- 3. USDA-AMS, Establishment of a domestic hemp production program. Federal Register Rules and Regulations, 2021. 86: p. 5596-691.
- Visković, J., et al., Industrial hemp (Cannabis sativa L.) agronomy and utilization: A review. Agronomy, 2023. 13(3): p. 931. [CrossRef]
- Angelini, L.G., S. Tavarini, and M. Di Candilo, Performance of new and traditional fiber hemp (Cannabis sativa L.) cultivars for novel applications: Stem, bark, and core yield and chemical composition. Journal of Natural Fibers, 2016. 13(2): p. 238-252. [CrossRef]
- Ehrensing, D.T., Feasibility of industrial hemp production in the United States Pacific Northwest. 1998.
- Cherney, J.H. and E. Small, Industrial hemp in North America: production, politics and potential. Agronomy, 2016. 6(4): p. 58. [CrossRef]
- Walker, E. Status of Industrial Hemp in Tennessee. 2018. DOI: https://extension.tennessee.edu/publications/Documents/W777.pdf.
- Mark, T., et al., Economic Viability of Industrial Hemp in the United States: A Review of State Pilot Programs. 2020.
- O'Connell, B.K., D. Gloss, and O. Devinsky, Cannabinoids in treatment-resistant epilepsy: a review. Epilepsy & Behavior, 2017. 70: p. 341-348. [CrossRef]
- Billakota, S., O. Devinsky, and E. Marsh, Cannabinoid therapy in epilepsy. Current opinion in neurology, 2019. 32(2): p. 220-226.
- Samanta, D., Cannabidiol: a review of clinical efficacy and safety in epilepsy. Pediatric neurology, 2019. 96: p. 24-29. [CrossRef]
- Silote, G.P., et al., Emerging evidence for the antidepressant effect of cannabidiol and the underlying molecular mechanisms. Journal of chemical neuroanatomy, 2019. 98: p. 104-116. [CrossRef]
- Xu, C., et al., Pharmacokinetics of oral and intravenous cannabidiol and its antidepressant-like effects in chronic mild stress mouse model. Environmental toxicology and pharmacology, 2019. 70: p. 103202. [CrossRef]
- Capano, A., R. Weaver, and E. Burkman, Evaluation of the effects of CBD hemp extract on opioid use and quality of life indicators in chronic pain patients: a prospective cohort study. Postgraduate medicine, 2020. 132(1): p. 56-61. [CrossRef]
- Place, G. Hemp Production – Keeping THC Levels Low. North Carolina Cooperative Extension, 2019.
- De Prato, L., et al., The cannabinoid profile and growth of hemp (Cannabis sativa L.) is influenced by tropical daylengths and temperatures, genotype and nitrogen nutrition. Industrial Crops and Products, 2022. 178: p. 114605.
- Sikora, V., J. Berenji, and D. Latković, Influence of agroclimatic conditions on content of main cannabinoids in industrial hemp (Cannabis sativa L.). Genetika-Belgrade, 2011. 43(3): p. 449-456. [CrossRef]
- Toth, J.A., et al., Limited effect of environmental stress on cannabinoid profiles in high-cannabidiol hemp (Cannabis sativa L.). GCB Bioenergy, 2021. 13(10): p. 1666-1674. [CrossRef]
- Mechoulam, R. and Y. Gaoni, Recent advances in the chemistry of hashish. Fortschritte der Chemie Organischer Naturstoffe/Progress in the Chemistry of Organic Natural Products/Progrès dans la Chimie des Substances Organiques Naturelles, 1967: p. 175-213. [CrossRef]
- Clarke, R.C. and D.P. Watson, Cannabis and natural cannabis medicines, in Marijuana and the Cannabinoids. 2007, Springer. p. 1-15.
- Cosentino, S.L., et al., Sowing time and prediction of flowering of different hemp (Cannabis sativa L.) genotypes in southern Europe. Industrial crops and products, 2012. 37(1): p. 20-33. [CrossRef]
- Crispim Massuela, D., et al., Impact of Harvest Time and Pruning Technique on Total CBD Concentration and Yield of Medicinal Cannabis. Plants, 2022. 11(1): p. 140. [CrossRef]
- Punja, Z.K., First report of Fusarium proliferatum causing crown and stem rot, and pith necrosis, in cannabis (Cannabis sativa L., marijuana) plants. Canadian Journal of Plant Pathology, 2021. 43(2): p. 236-255. [CrossRef]
- Hansen, Z., et al. Hemp disease and pest management. 2020.
- Pane, A., et al., First report of southern blight caused by Sclerotium rolfsii on hemp (Cannabis sativa) in Sicily and Southern Italy. Plant Disease, 2007. 91(5): p. 636-636. [CrossRef]
- Akinrinlola, R.J., Improved and sustainable management of economically important plant-parasitic nematodes of field crops and fungal diseases of soybean and hemp in Tennessee. 2022.
- Mersha, Z., M. Kering, and S. Ren, Southern blight of hemp caused by Athelia rolfsii detected in Virginia. Plant Disease, 2020. 104(5): p. 1562. [CrossRef]
- F. Baysal-Gurel, P. Liyanapathiranage, and A. Blalock Southern Blight Management. 2015.
- Farr, D.F., et al., Fungi on plants and plant products in the United States. 1989: APS press. [CrossRef]
- Punja, Z., Sclerotium (Athelia) rolfsii, a pathogen of many plant species, in Advances in plant pathology. 1988, Elsevier. p. 523-534.
- Mullen, J., Southern blight, southern stem blight, white mold. The Plant Health Instructor, 2001. [CrossRef]
- Singh, R., et al., First Report of Southern Blight of Industrial Hemp Caused by Athelia rolfsii in Louisiana. Plant Health Progress, 2021: p. PHP-05-21-0084-BR. [CrossRef]
- Chen, S., et al., Effects of straw mulching on soil temperature, evaporation and yield of winter wheat: field experiments on the North China Plain. Annals of Applied Biology, 2007. 150(3): p. 261-268.
- Ramakrishna, A., et al., Effect of mulch on soil temperature, moisture, weed infestation and yield of groundnut in northern Vietnam. Field crops research, 2006. 95(2-3): p. 115-125. [CrossRef]
- Cheng, D., et al., Combined effects of mulching and crop density on soil evaporation, temperature, and water use efficiency of winter wheat. Experimental Agriculture, 2021. 57(3): p. 163-174. [CrossRef]
- USDA, N., United States department of agriculture. Natural Resources Conservation Service. Plants Database. http://plants. usda. gov (accessed in 2000), 1999.
- Pinheiro, J., et al., Linear and nonlinear mixed effects models in R. 2013.
- Mendiburu, F.d., Agricolae: statistical procedures for agricultural research. (No Title), 2019.
- Evans, J.D., Straightforward statistics for the behavioral sciences. 1996: Thomson Brooks/Cole Publishing Co.
- Panth, M., S.C. Hassler, and F. Baysal-Gurel, Methods for management of soilborne diseases in crop production. Agriculture, 2020. 10(1): p. 16.
- Du, S., et al., The proportion of soil-borne fungal pathogens increases with elevated organic carbon in agricultural soils. Msystems, 2022. 7(2): p. e01337-21. [CrossRef]
- Bonanomi, G., et al., Identifying the characteristics of organic soil amendments that suppress soilborne plant diseases. Soil Biology and Biochemistry, 2010. 42(2): p. 136-144. [CrossRef]
- Amaradasa, B., et al., First Report of Southern Blight Caused by Sclerotium rolfsii in Industrial Hemp in Southern Virginia. Plant Disease, 2020. 104(5): p. 1563-1563. [CrossRef]
- Iqbal, R., et al., Potential agricultural and environmental benefits of mulches—a review. Bulletin of the National Research Centre, 2020. 44: p. 1-16. [CrossRef]
- Agrios, G.N., Plant pathology. 2005: Elsevier.
- Lucas, J.A., Plant pathology and plant pathogens. 2020: John Wiley & Sons.
- Zhang, P., et al., Effects of organic mulching on moisture and temperature of soil in greenhouse production of tomato under unheated greenhouse cultivation in the cold zone of China. Food Science & Nutrition, 2023. 11(8): p. 4829-4842. [CrossRef]
- Mediavilla, V., M. Leupin, and A. Keller, Influence of the growth stage of industrial hemp on the yield formation in relation to certain fibre quality traits. Industrial Crops and Products, 2001. 13(1): p. 49-56. [CrossRef]
- Linder, E.R., et al., The effect of transplant date and plant spacing on biomass production for floral hemp (Cannabis sativa L.). Agronomy, 2022. 12(8): p. 1856. [CrossRef]
Figure 1.
Average percent southern blight disease severity of floral hemp grown under three mulch treatments (black plastic, straw mulch, and no-mulch control) at three different planting times (1, 2, and 3) in 2022 at the Tennessee State University research farm. Error bars are ± s.e. Means of bars followed by the same letter are not significantly different (LSD, alpha = 0.05).
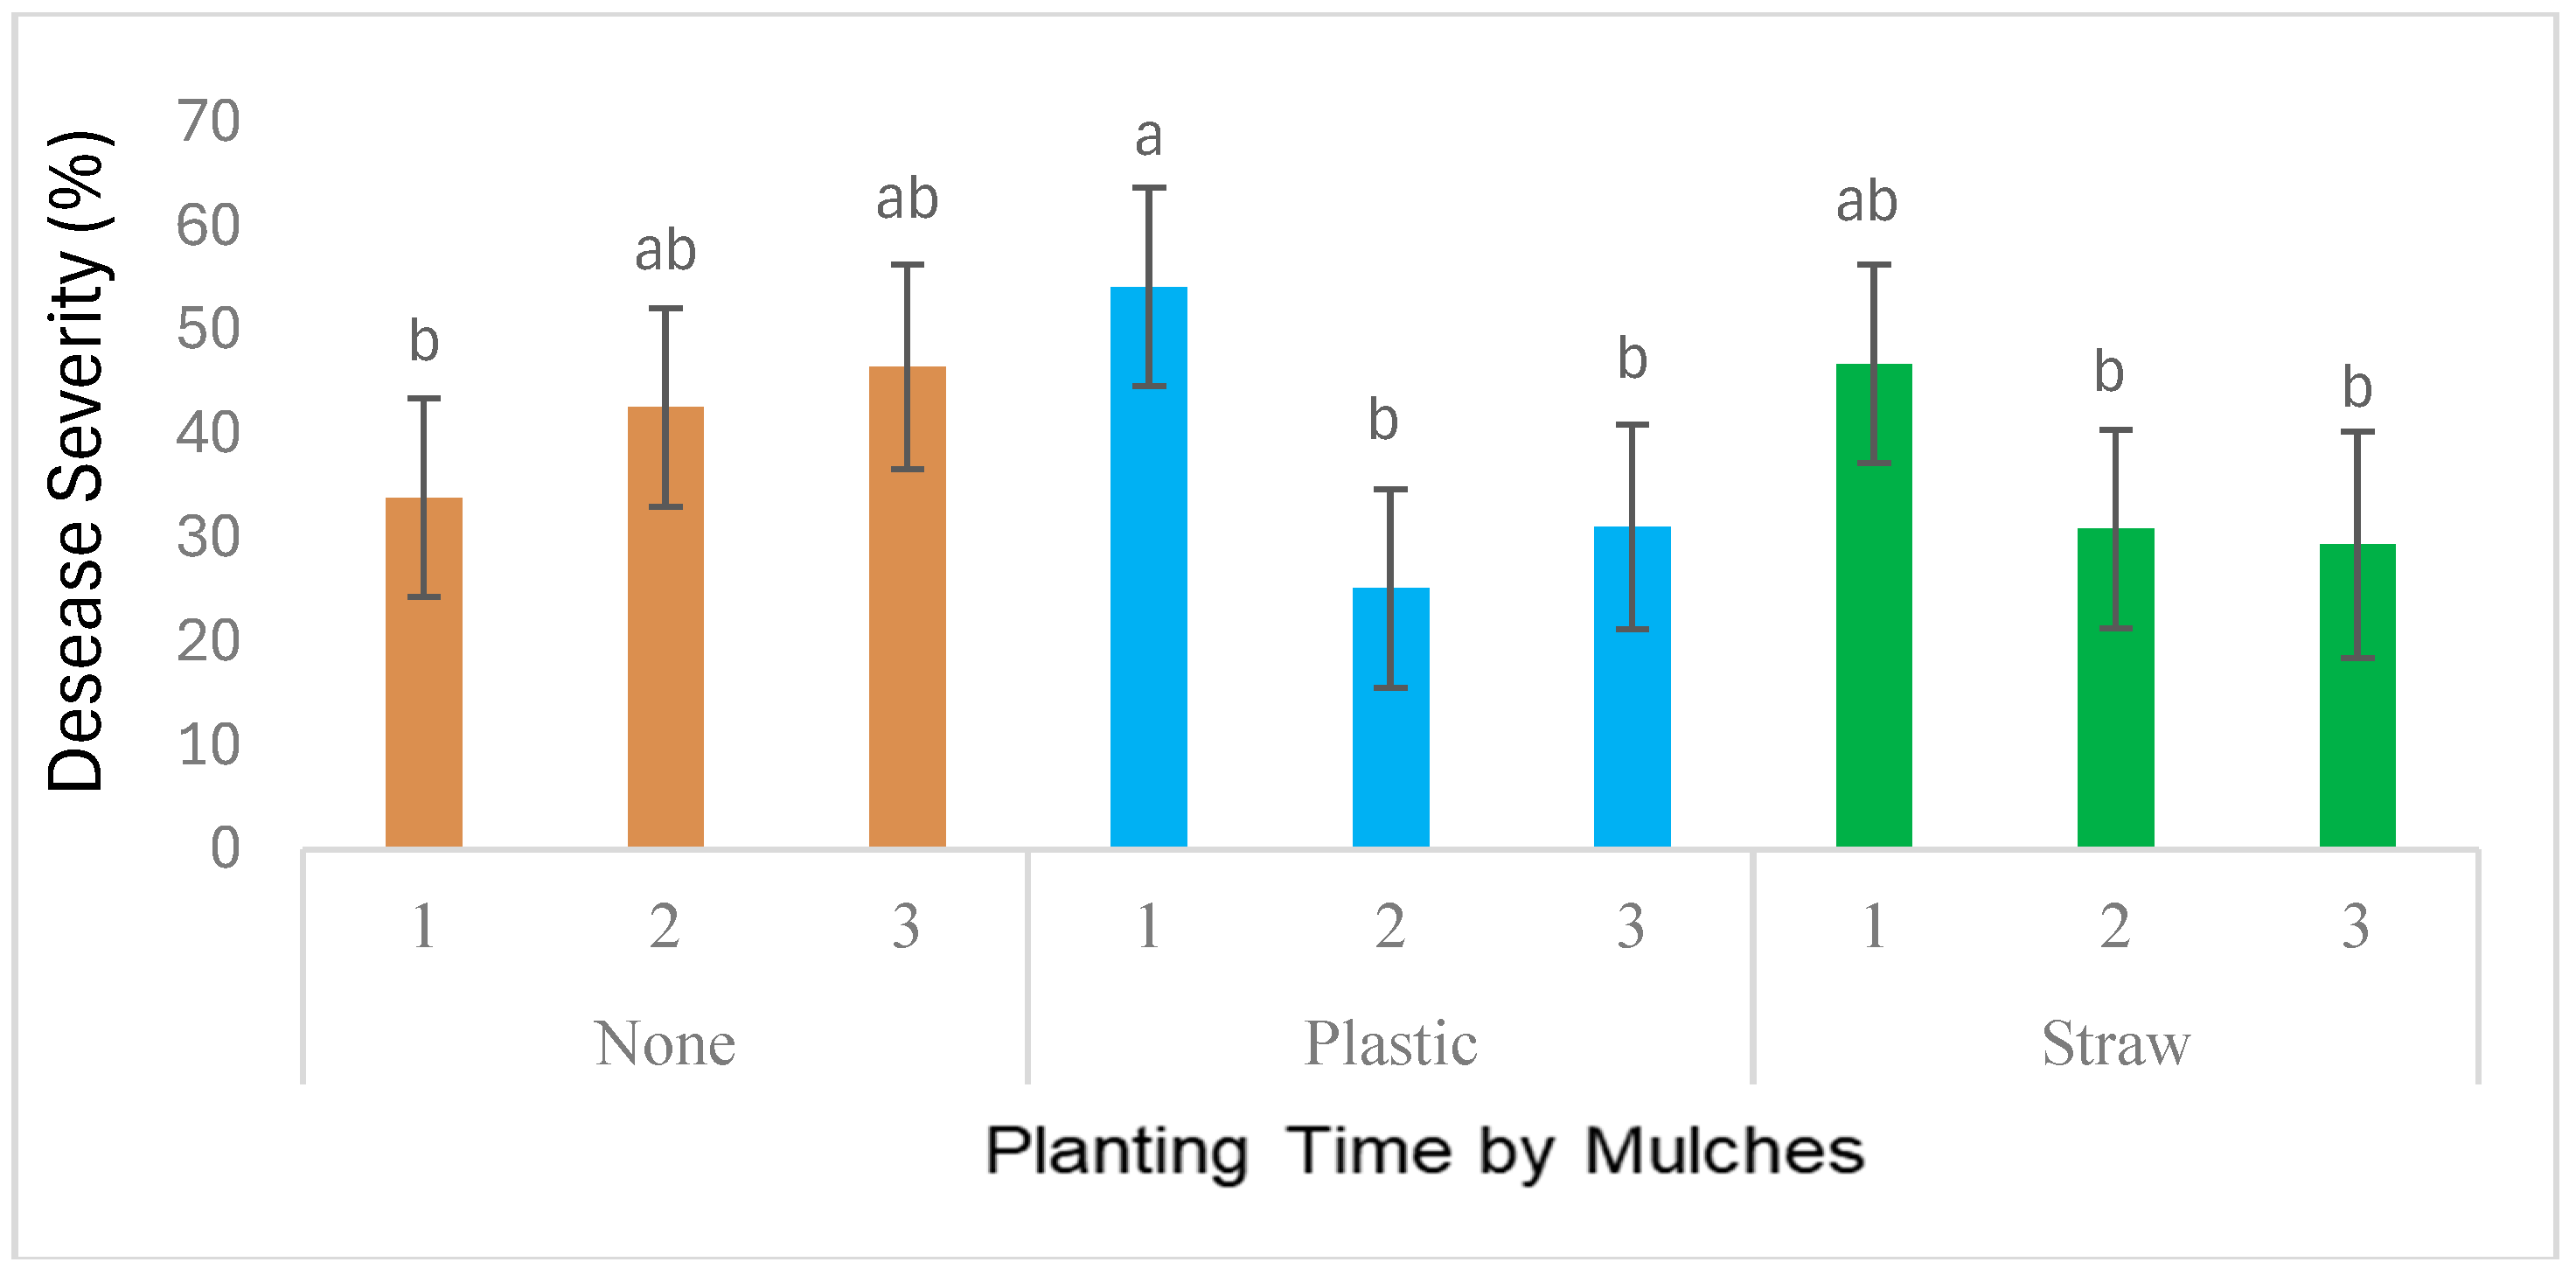
Figure 2.
Main effects of mulch material on total weed density in 2022 at the Tennessee State University research farm. Error bars are ± s.e. Means of bars followed by the same letter are not significantly different (LSD, alpha = 0.05).
Figure 2.
Main effects of mulch material on total weed density in 2022 at the Tennessee State University research farm. Error bars are ± s.e. Means of bars followed by the same letter are not significantly different (LSD, alpha = 0.05).
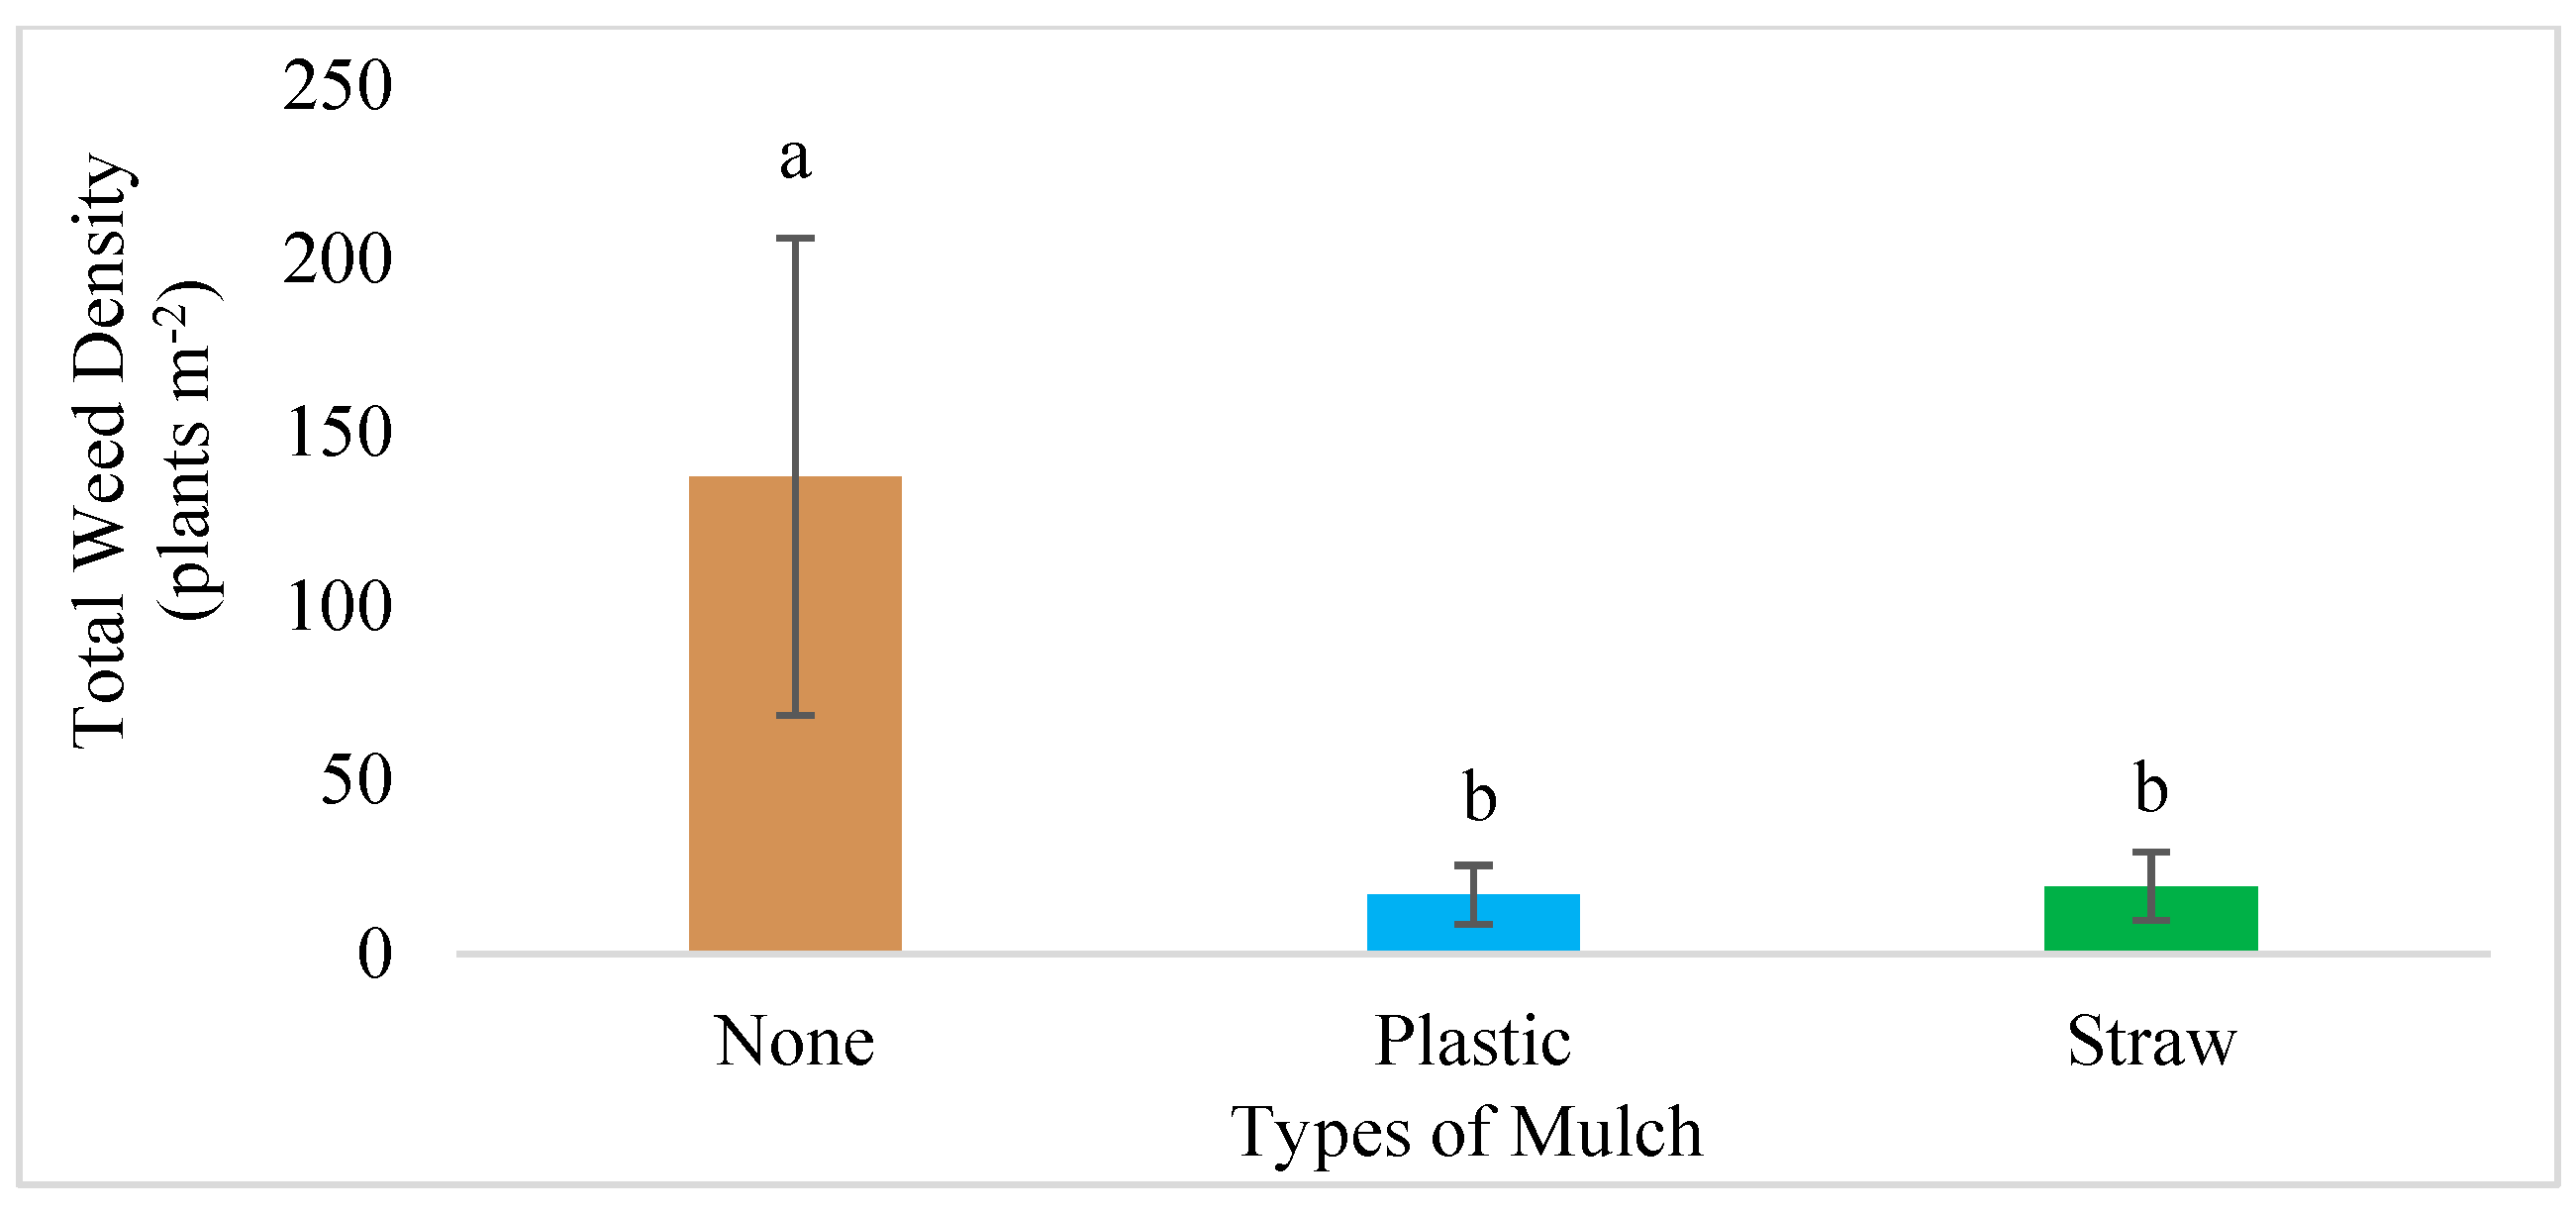
Figure 3.
Main effect of mulch material on total dry weight in 2022 at the TSU AREC farm. Data for the third planting time were excluded due to poor plant establishment and loss of at least one replicate. Error bars are ± s.e. Means of bars followed by the same letter are not significantly different (LSD, alpha = 0.05).
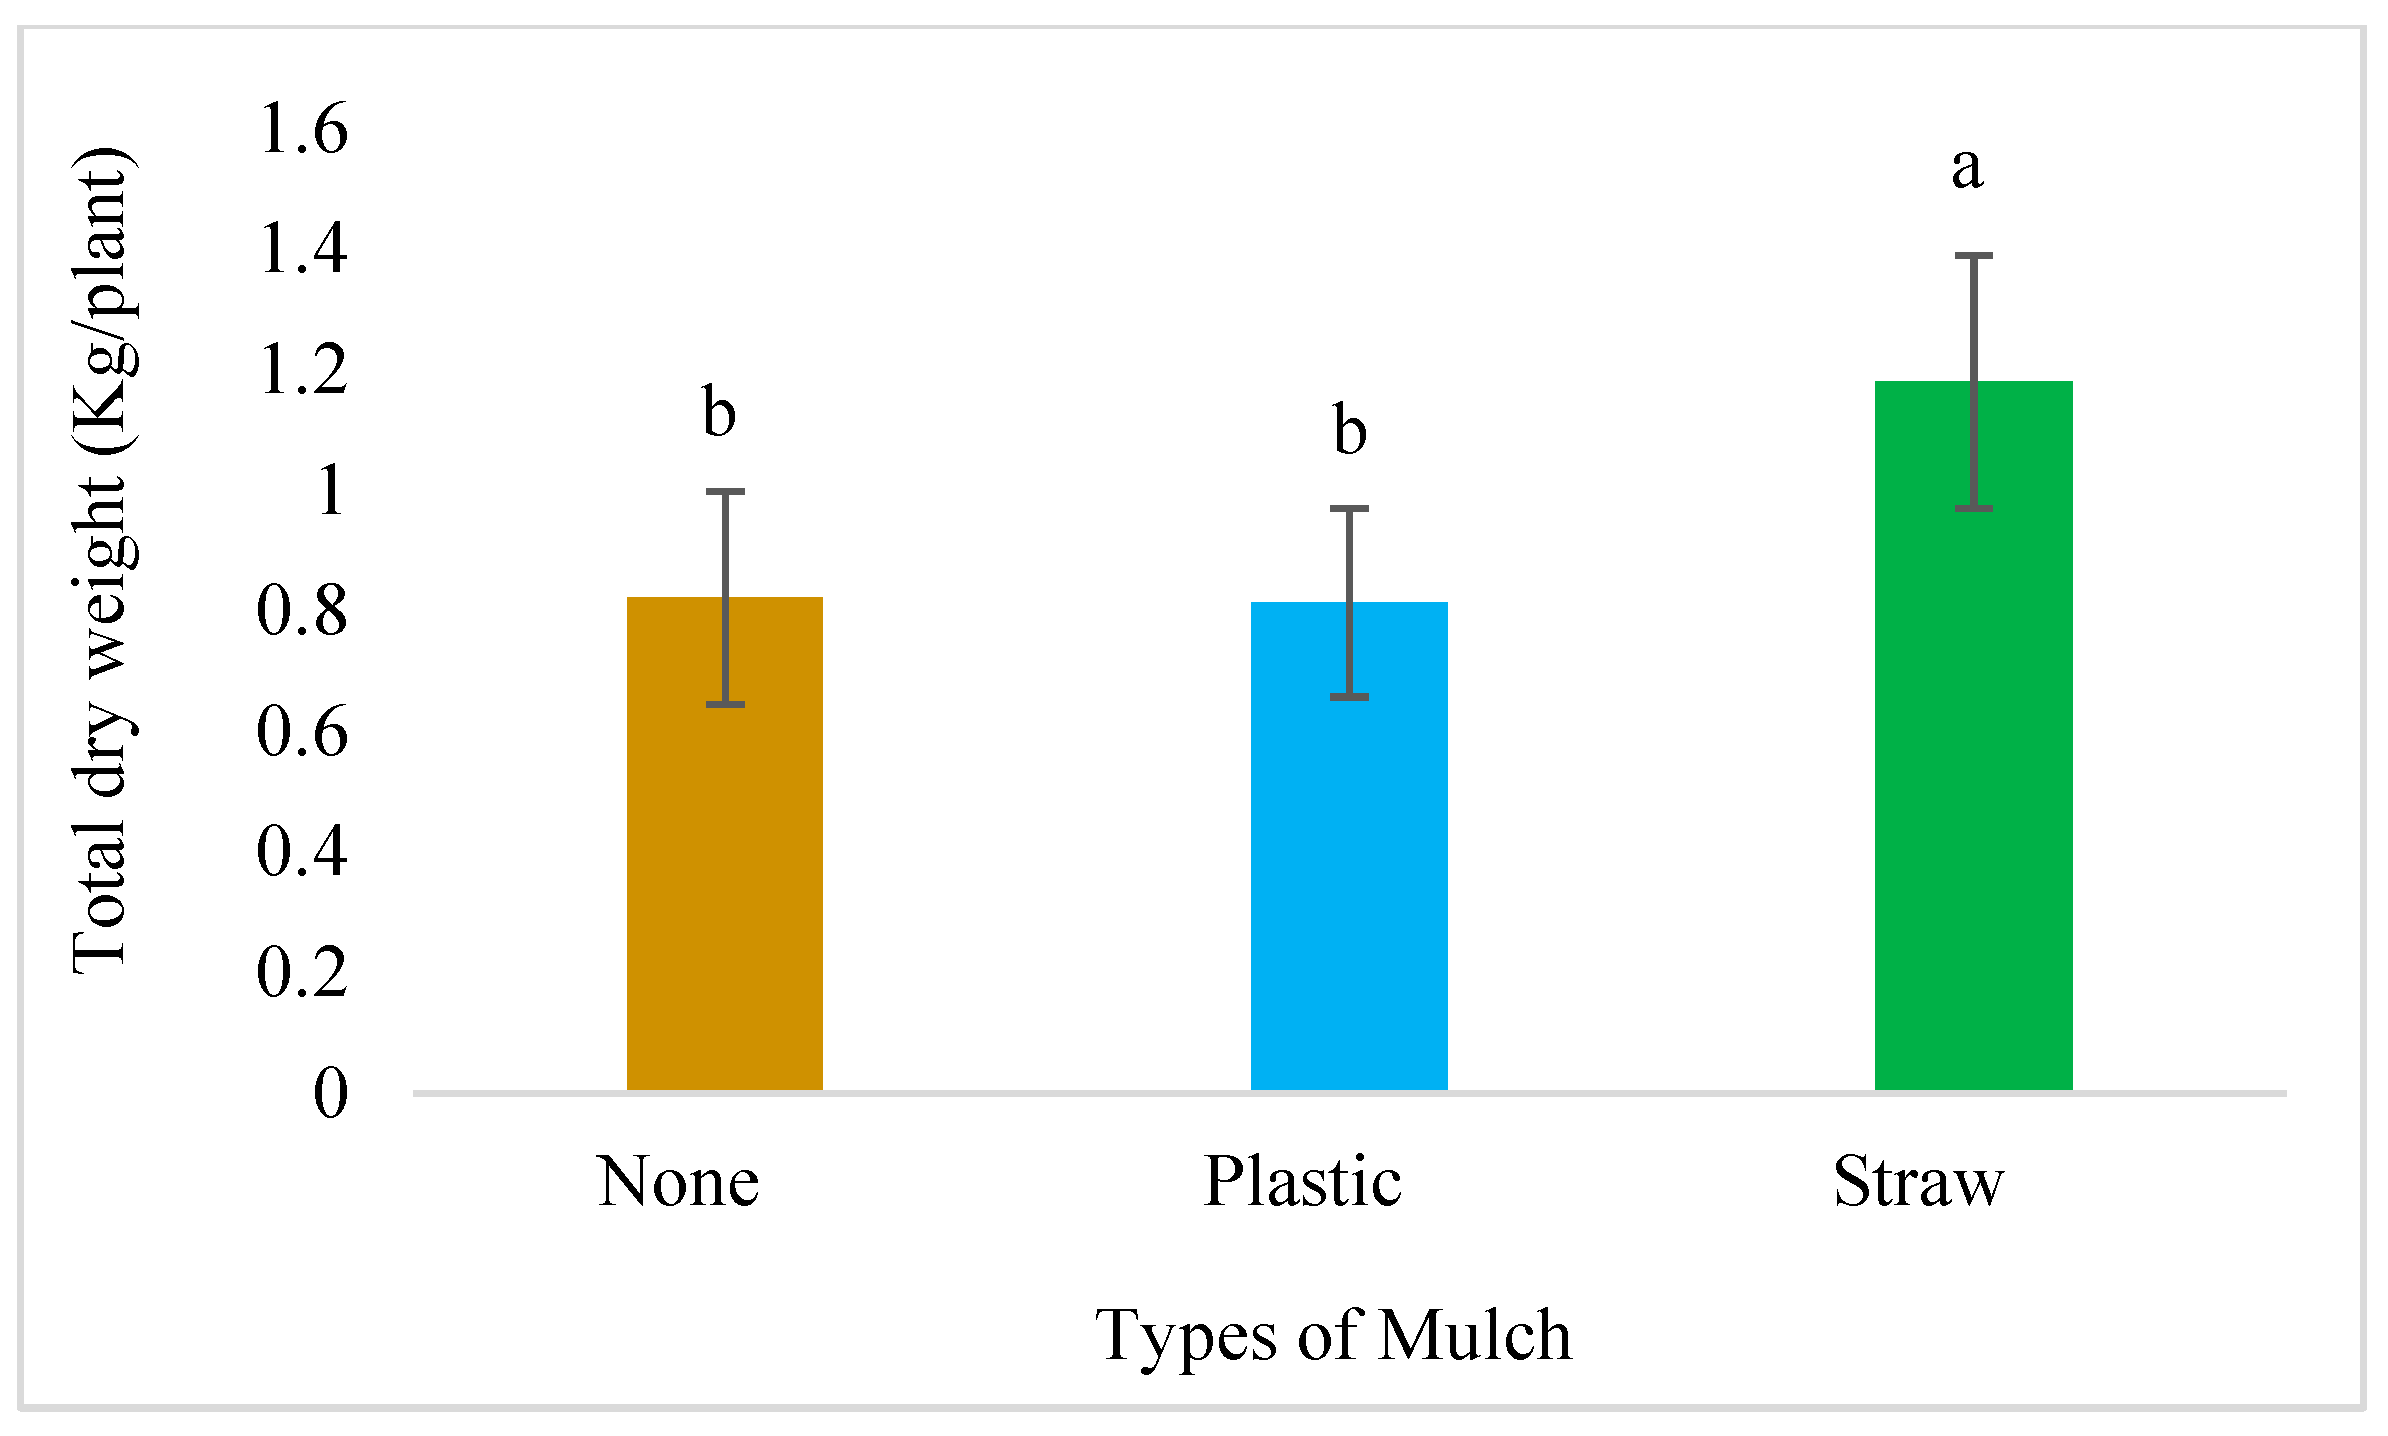
Figure 4.
Main effects of planting times (1, 2) on total dry weight in 2022 at the TSU AREC farm. Error bars are ± s.e. Means of bars followed by the same letter are not significantly different (LSD, alpha = 0.05).
Figure 4.
Main effects of planting times (1, 2) on total dry weight in 2022 at the TSU AREC farm. Error bars are ± s.e. Means of bars followed by the same letter are not significantly different (LSD, alpha = 0.05).
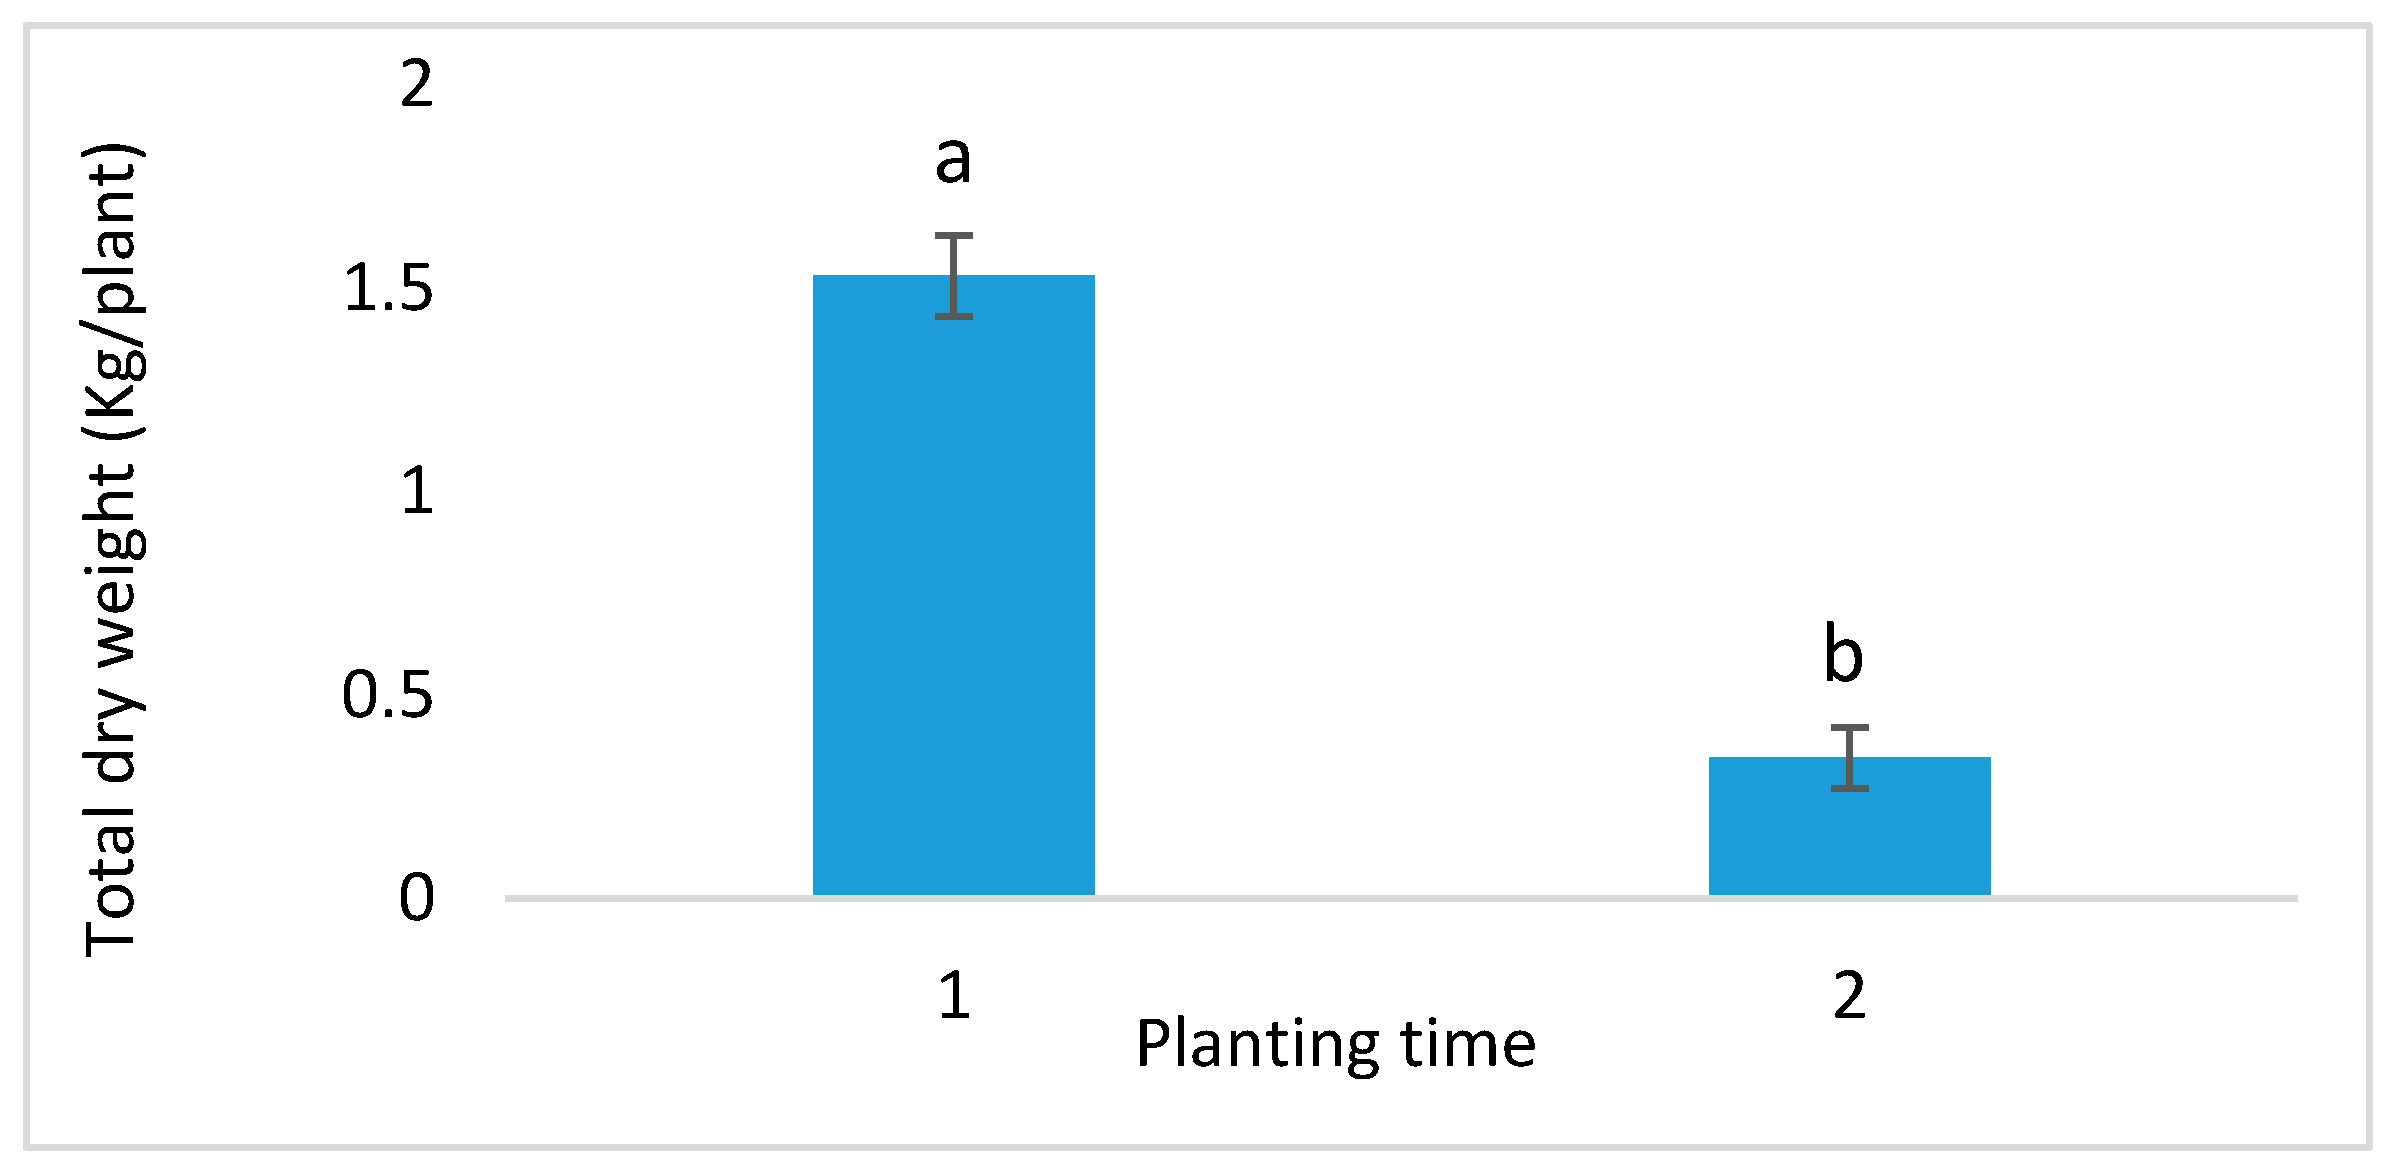
Figure 5.
Average soil temperature of floral hemp grown under plastic-, straw-, and no-mulch plots sampled at two dates (July, August) in 2022 at the TSU AREC farm. Error bars are ± s.e. Means of bars followed by the same letter are not significantly different (LSD, alpha = 0.05).
Figure 5.
Average soil temperature of floral hemp grown under plastic-, straw-, and no-mulch plots sampled at two dates (July, August) in 2022 at the TSU AREC farm. Error bars are ± s.e. Means of bars followed by the same letter are not significantly different (LSD, alpha = 0.05).
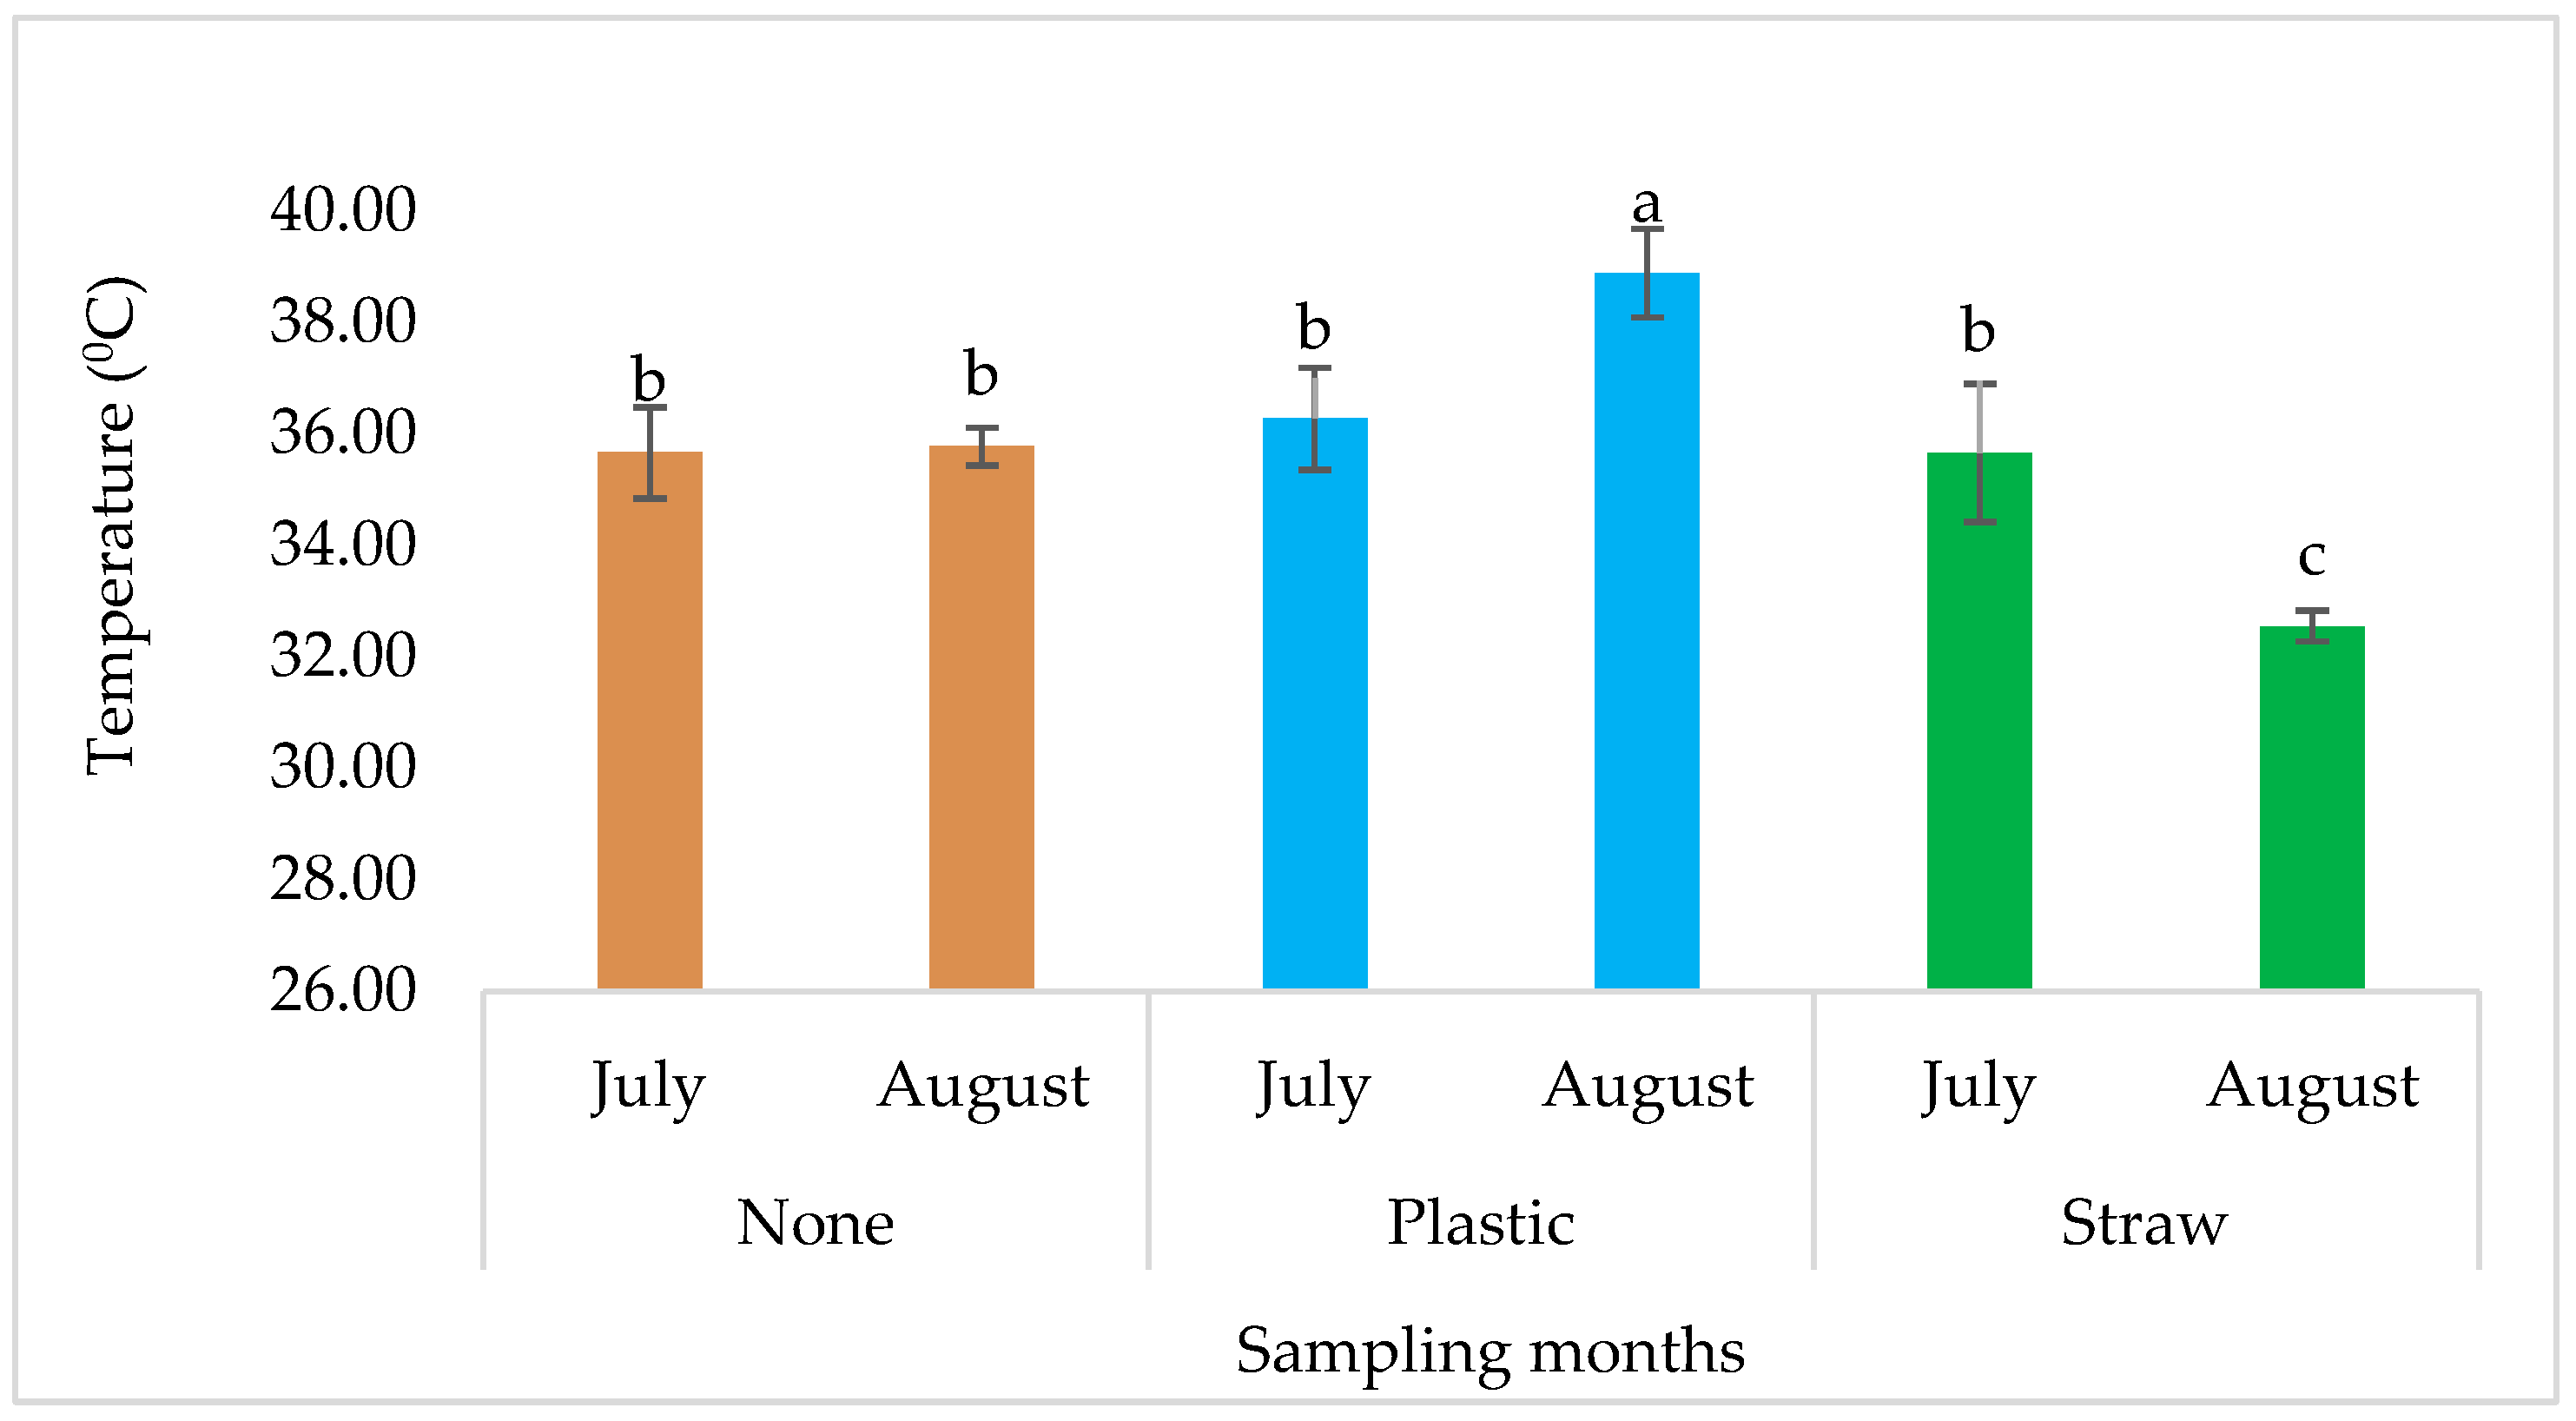
Figure 6.
Total THC of floral hemp grown at grown at different planting times (1,2,3) in 2022 at the Tennessee State University research farm. Error bars are ± s.e. Means of bars followed by the same letter are not significantly different (LSD, alpha = 0.05).
Figure 6.
Total THC of floral hemp grown at grown at different planting times (1,2,3) in 2022 at the Tennessee State University research farm. Error bars are ± s.e. Means of bars followed by the same letter are not significantly different (LSD, alpha = 0.05).
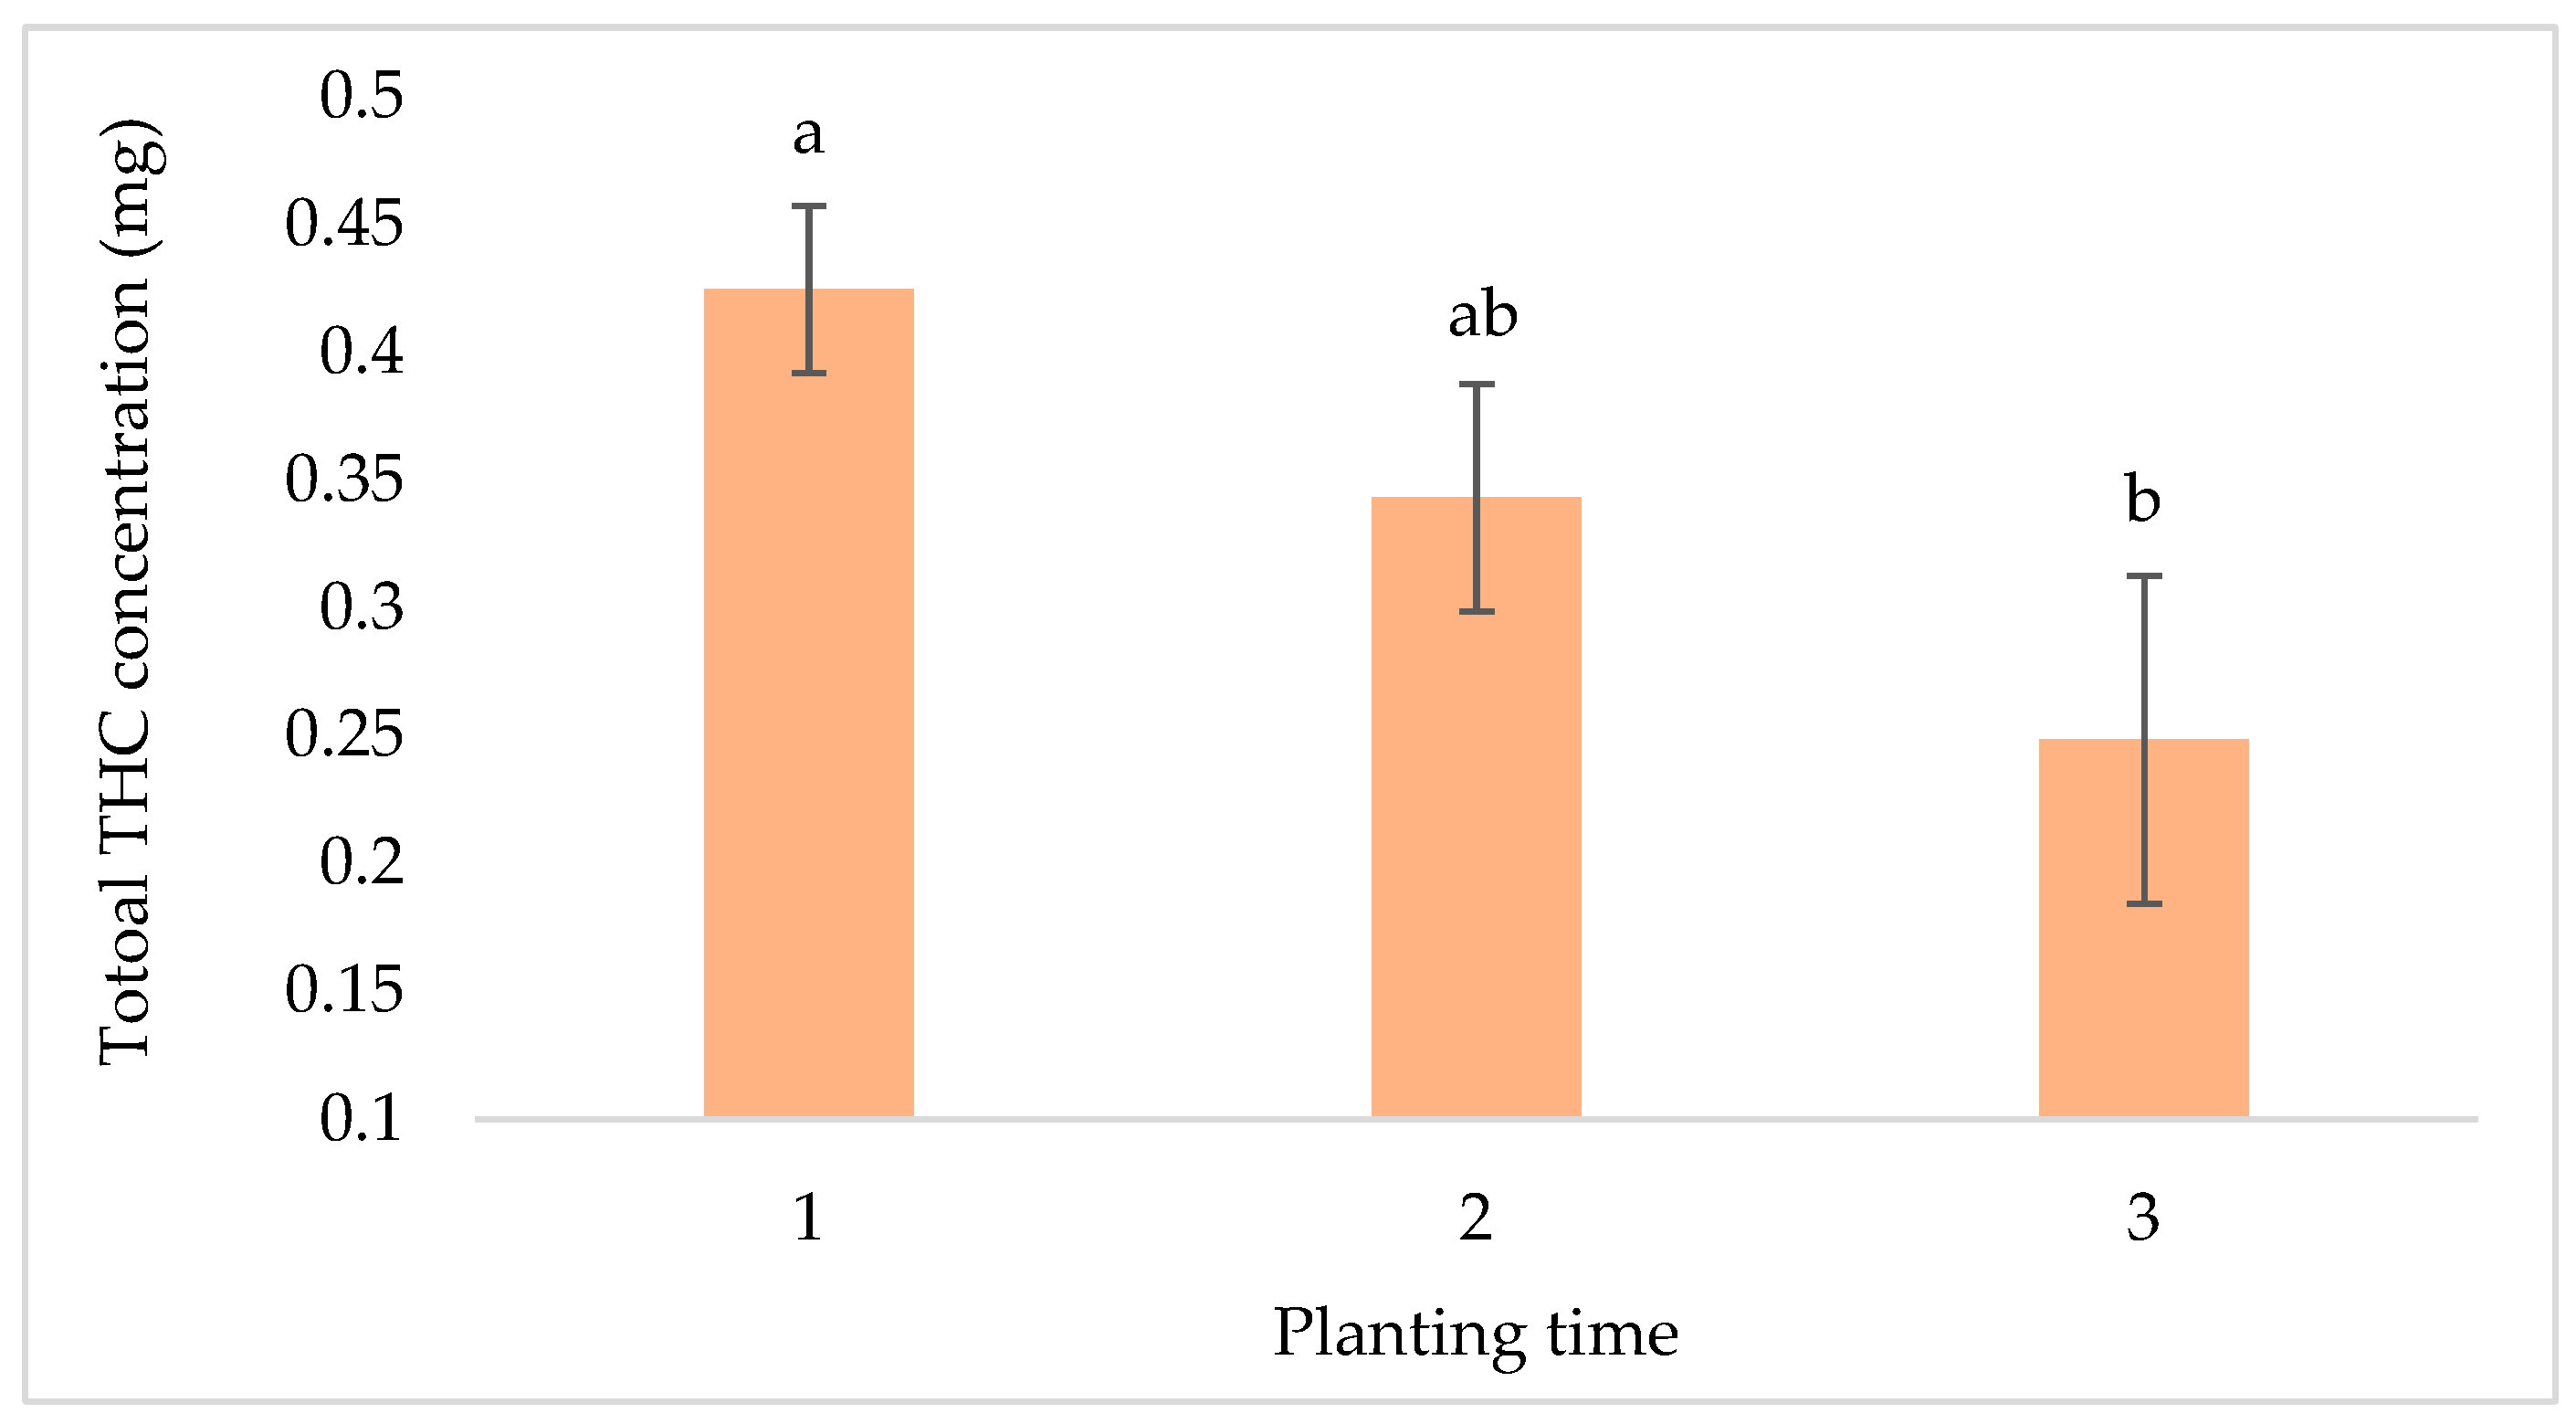
Figure 7.
Cannabidiol (CBD) of floral hemp grown in three different planting times (1, 2, 3) in 2022 at the Tennessee State University research farm. Error bars are ± s.e. Means of bars followed by the same letter are not significantly different (LSD, alpha = 0.05).
Figure 7.
Cannabidiol (CBD) of floral hemp grown in three different planting times (1, 2, 3) in 2022 at the Tennessee State University research farm. Error bars are ± s.e. Means of bars followed by the same letter are not significantly different (LSD, alpha = 0.05).
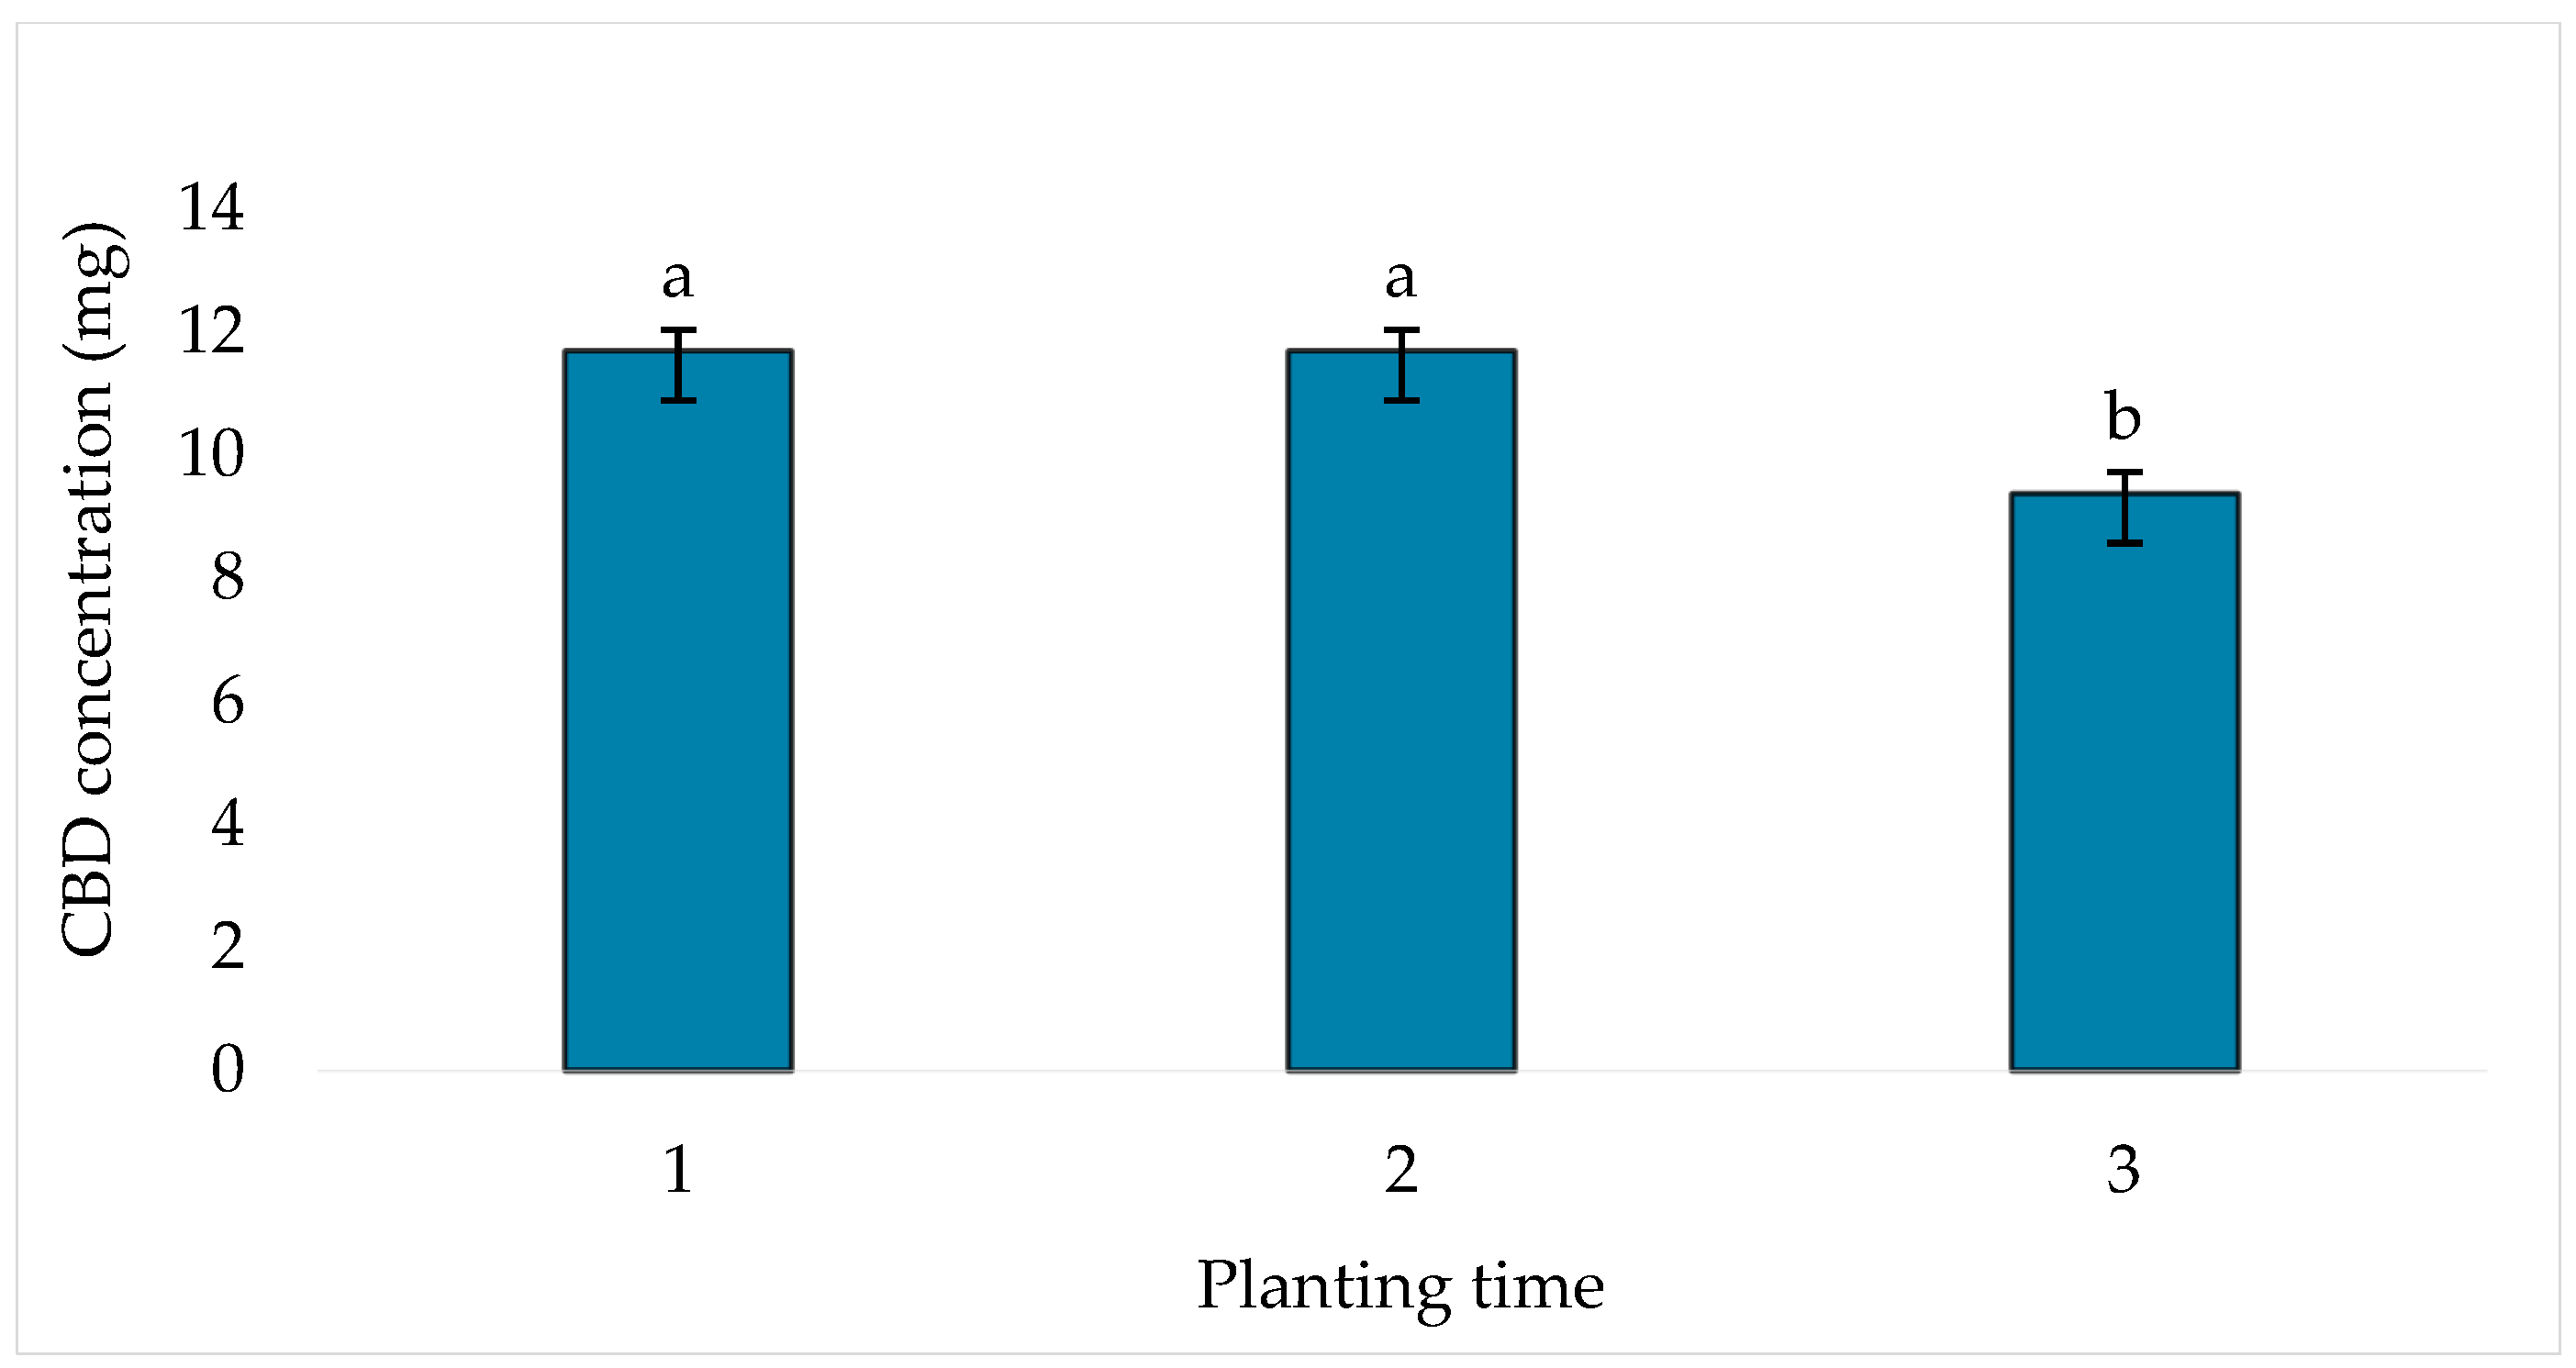
Figure 8.
Southern blight percent disease severity of floral hemp grown under three mulch treatments (black plastic, straw mulch, and no-mulch control) at three different planting times (1, 2, and 3) in 2023 at the TSU AREC. Error bars are ± s.e. Means of bars followed by the same letter are not significantly different (LSD, alpha = 0.05).
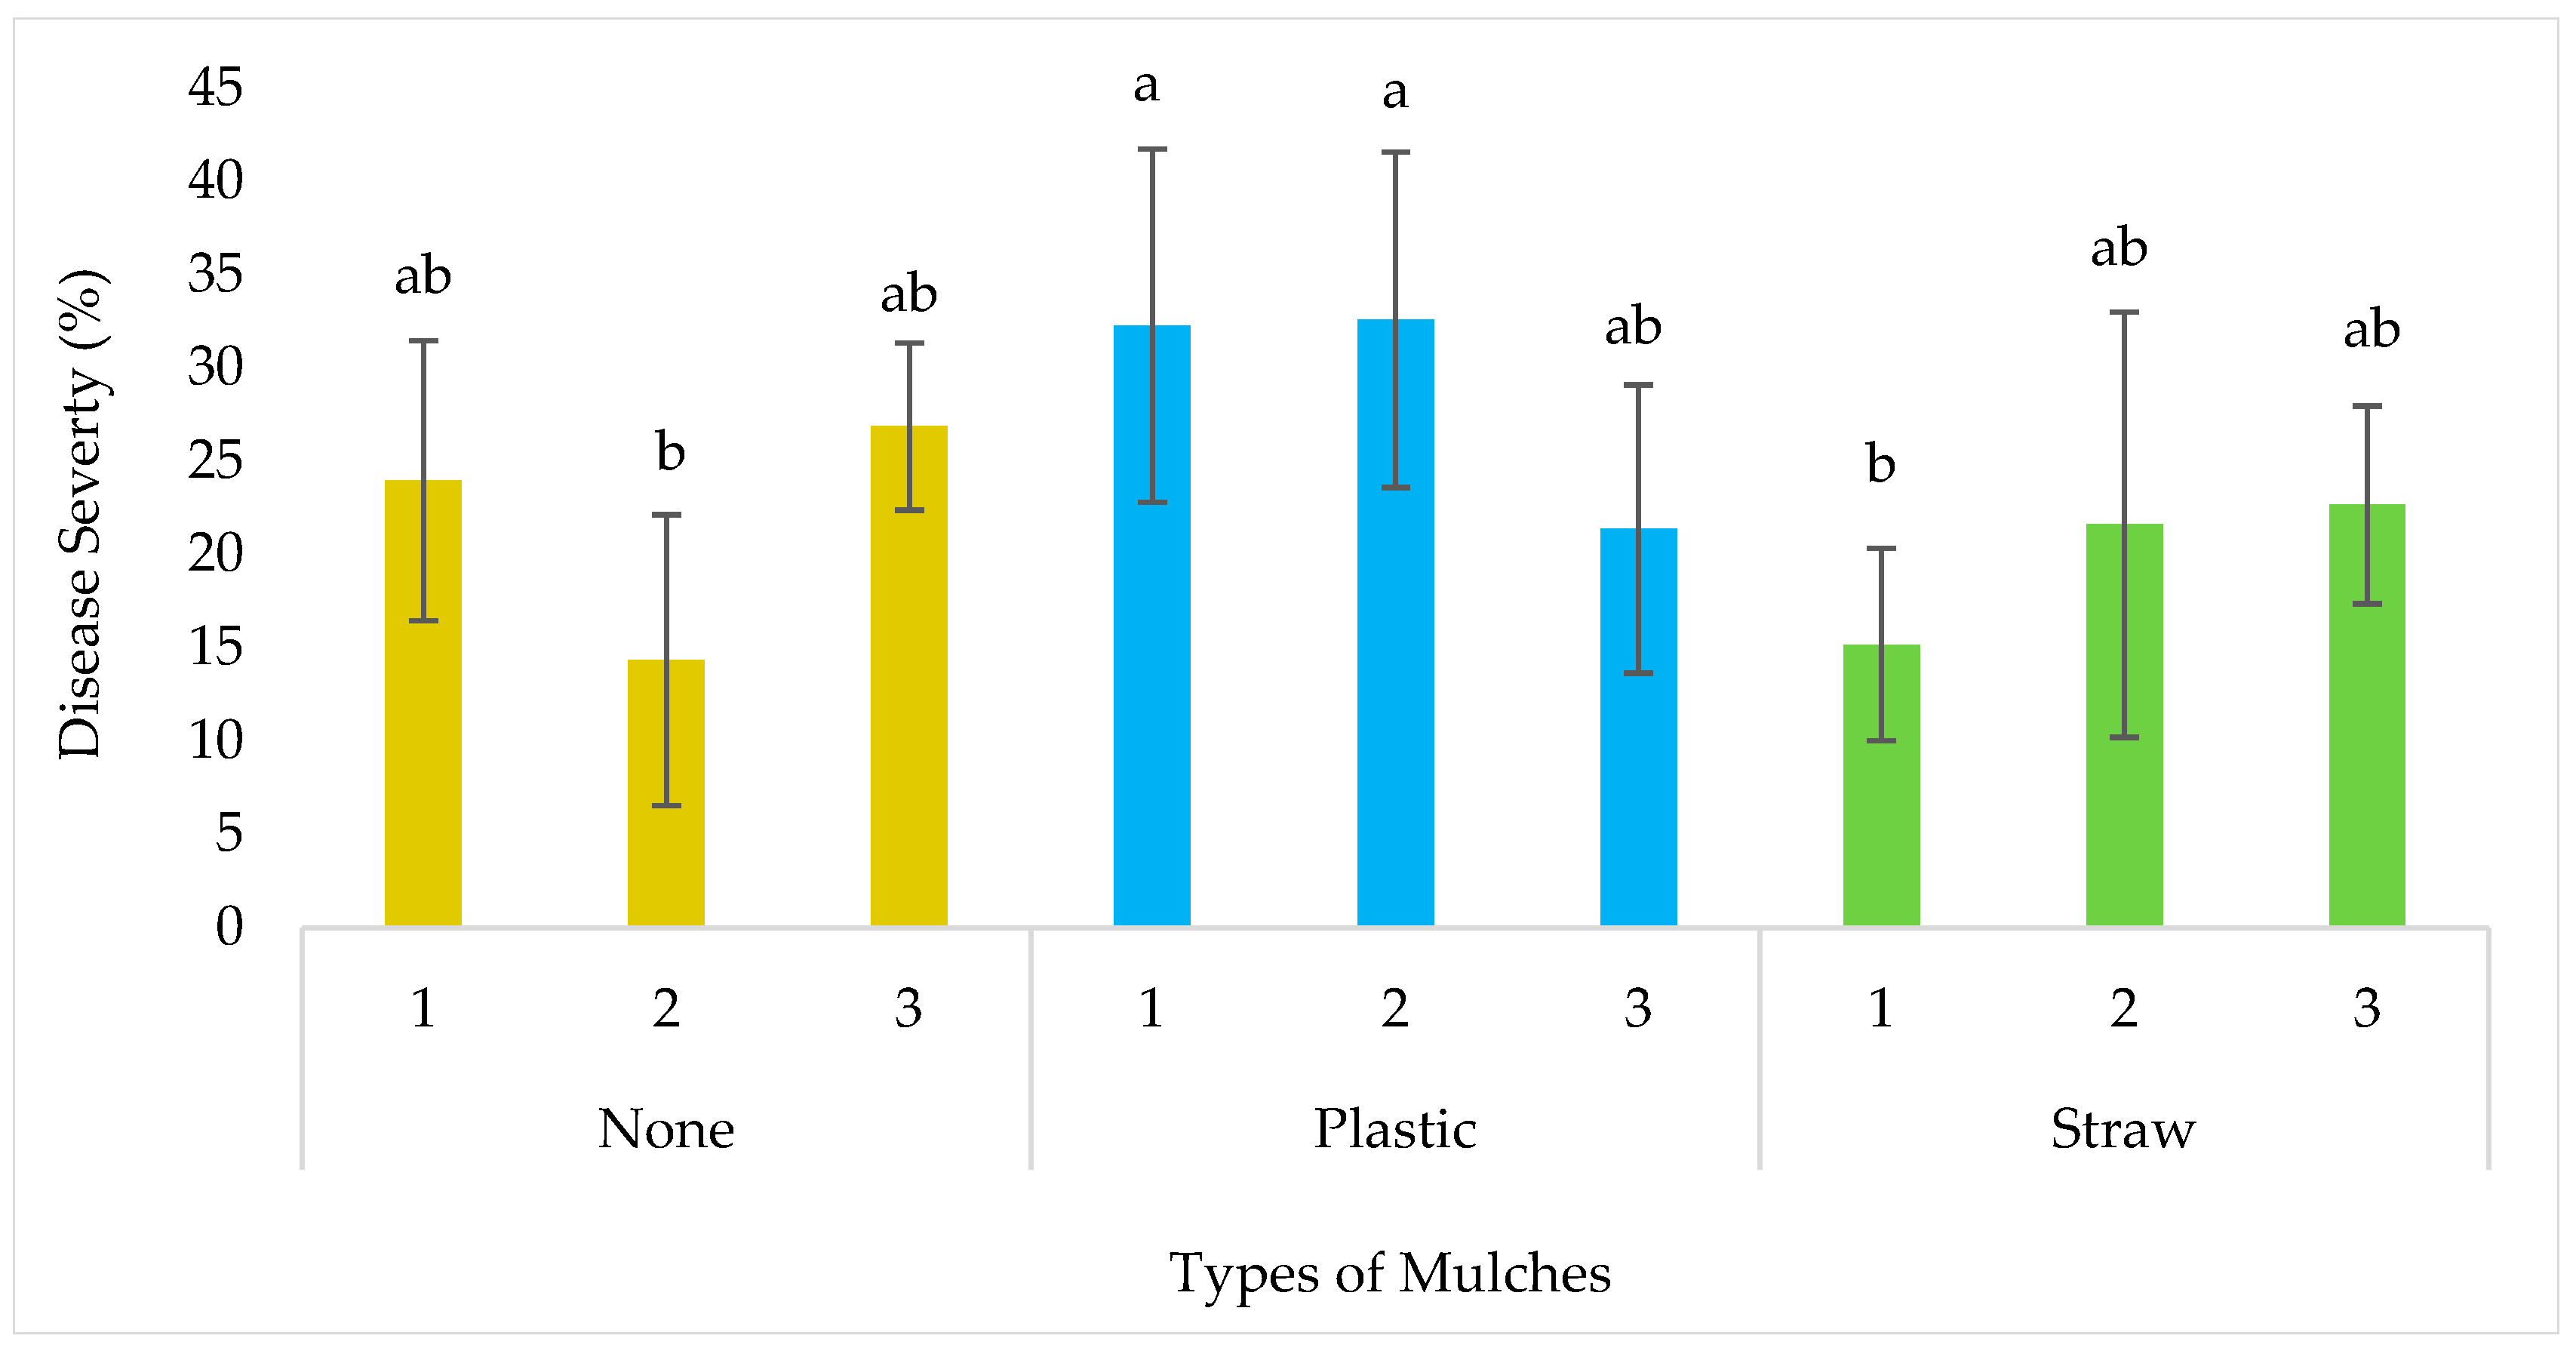
Figure 9.
Average percent southern blight disease severity of floral hemp grown at three different planting times (1, 2, and 3) and sampled at three different dates (July, August, and September) in 2023 at the TSU AREC farm. Error bars are ± s.e. Means of bars followed by the same letter are not significantly different (LSD, alpha = 0.05).
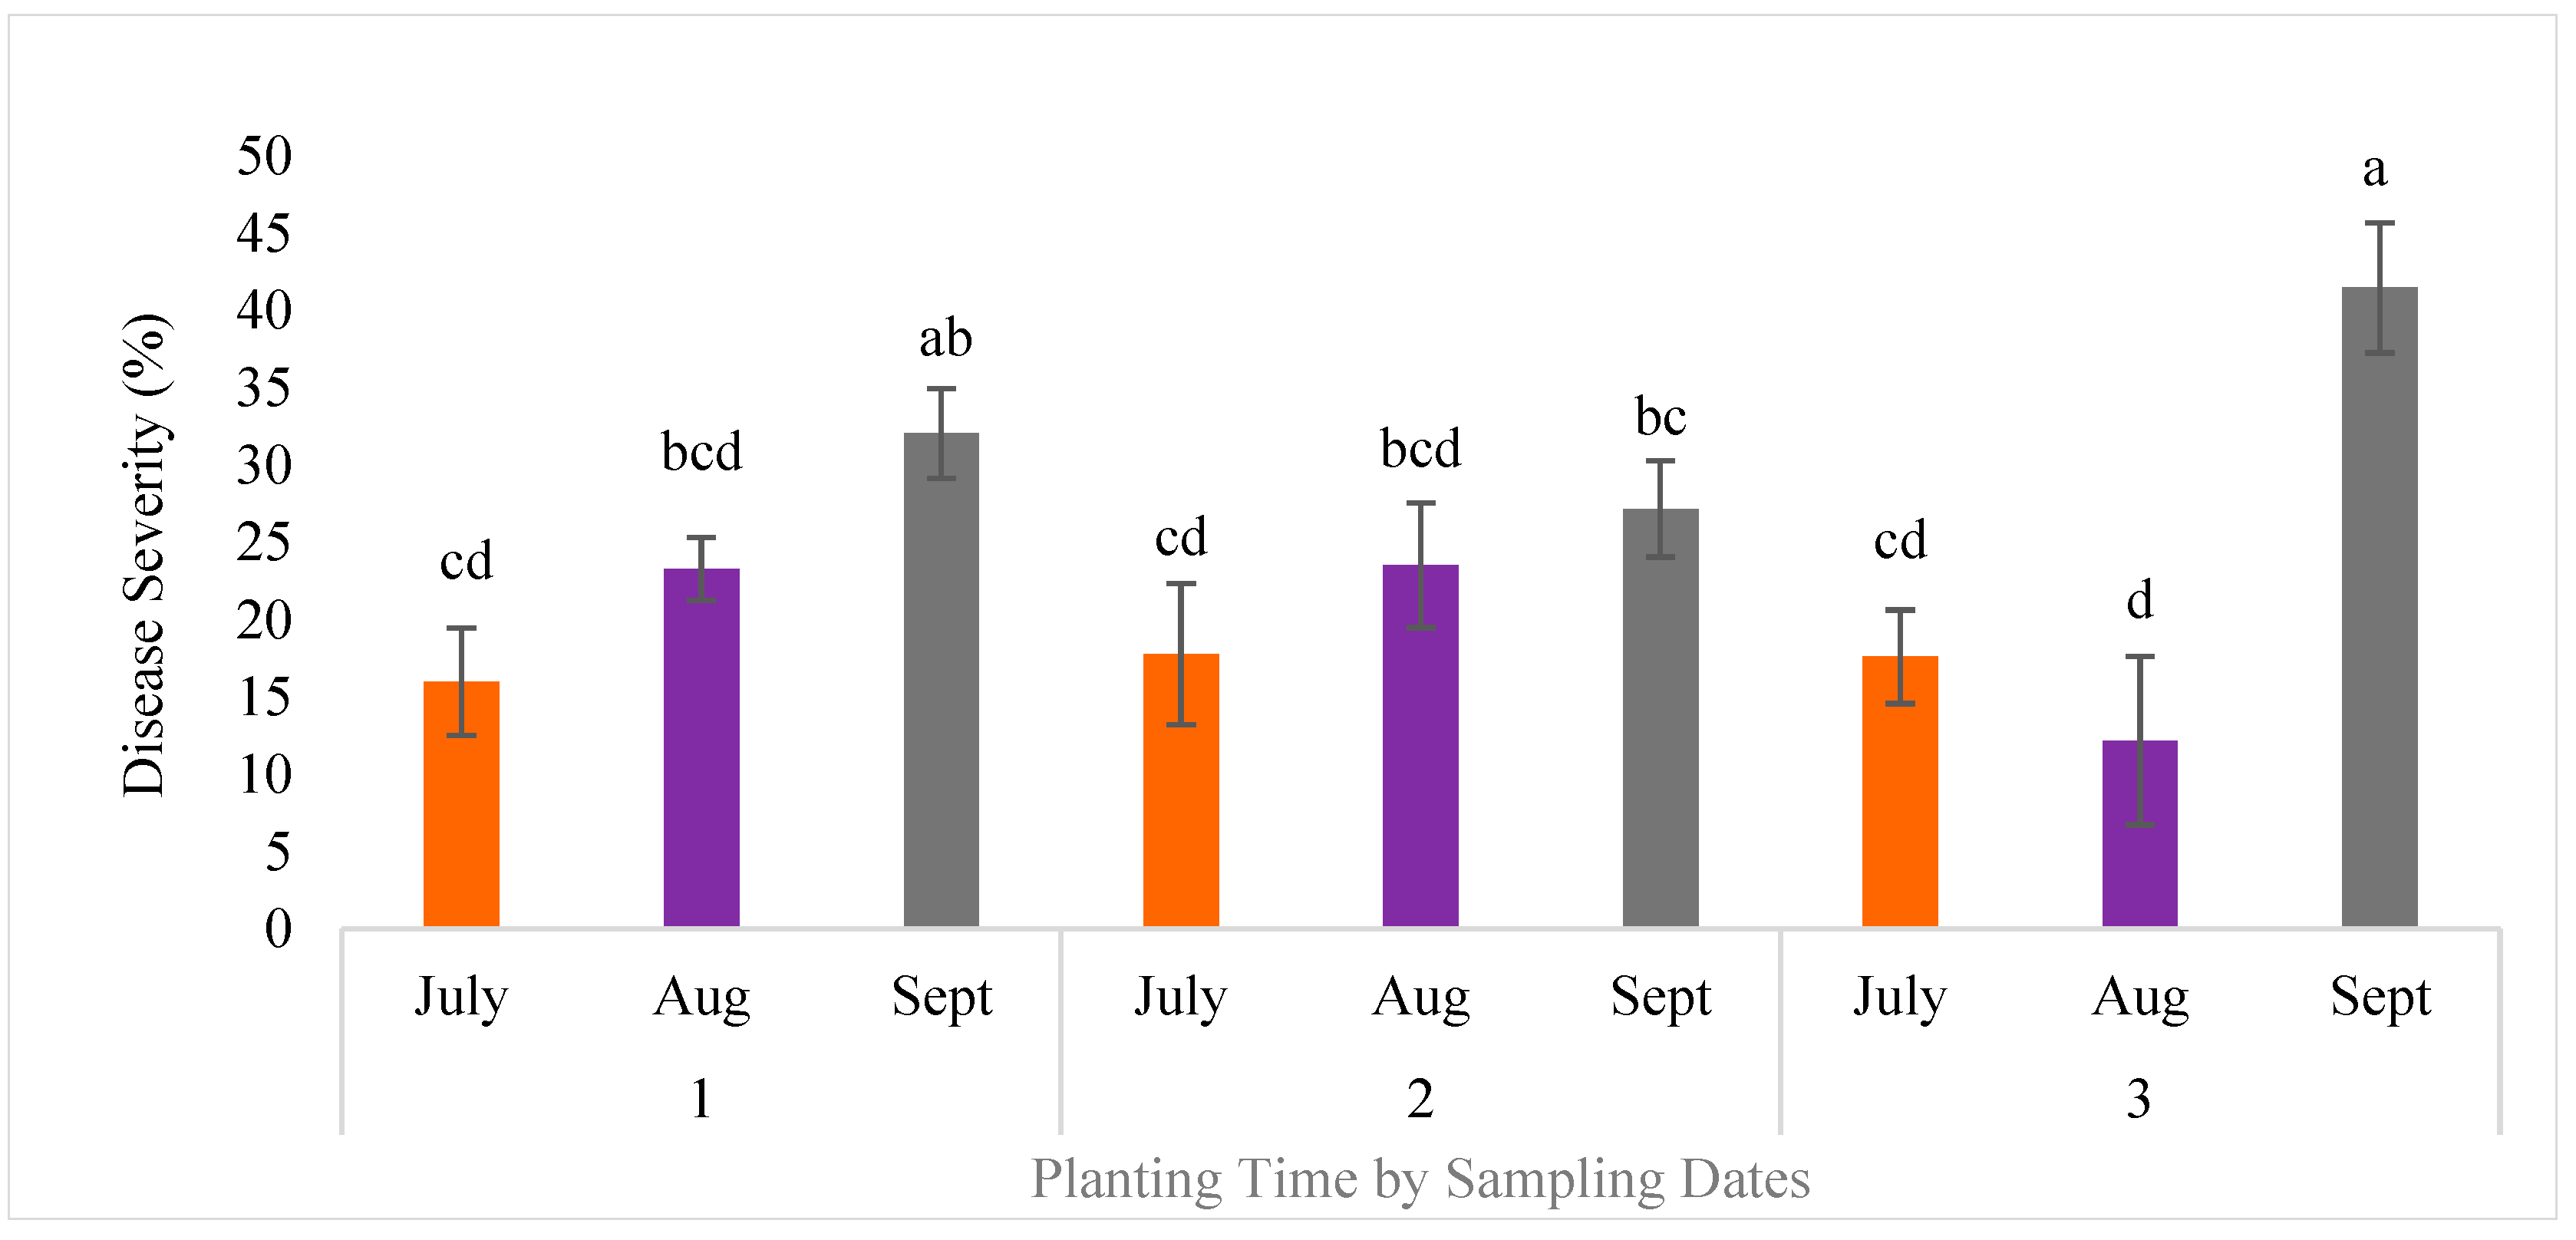
Figure 10.
Spearman’s correlation analysis of chlorophyll content (SPAD) versus disease severity (DS). The distribution of data points and the fitted trend line illustrate the overall trend across the observed range.
Figure 10.
Spearman’s correlation analysis of chlorophyll content (SPAD) versus disease severity (DS). The distribution of data points and the fitted trend line illustrate the overall trend across the observed range.
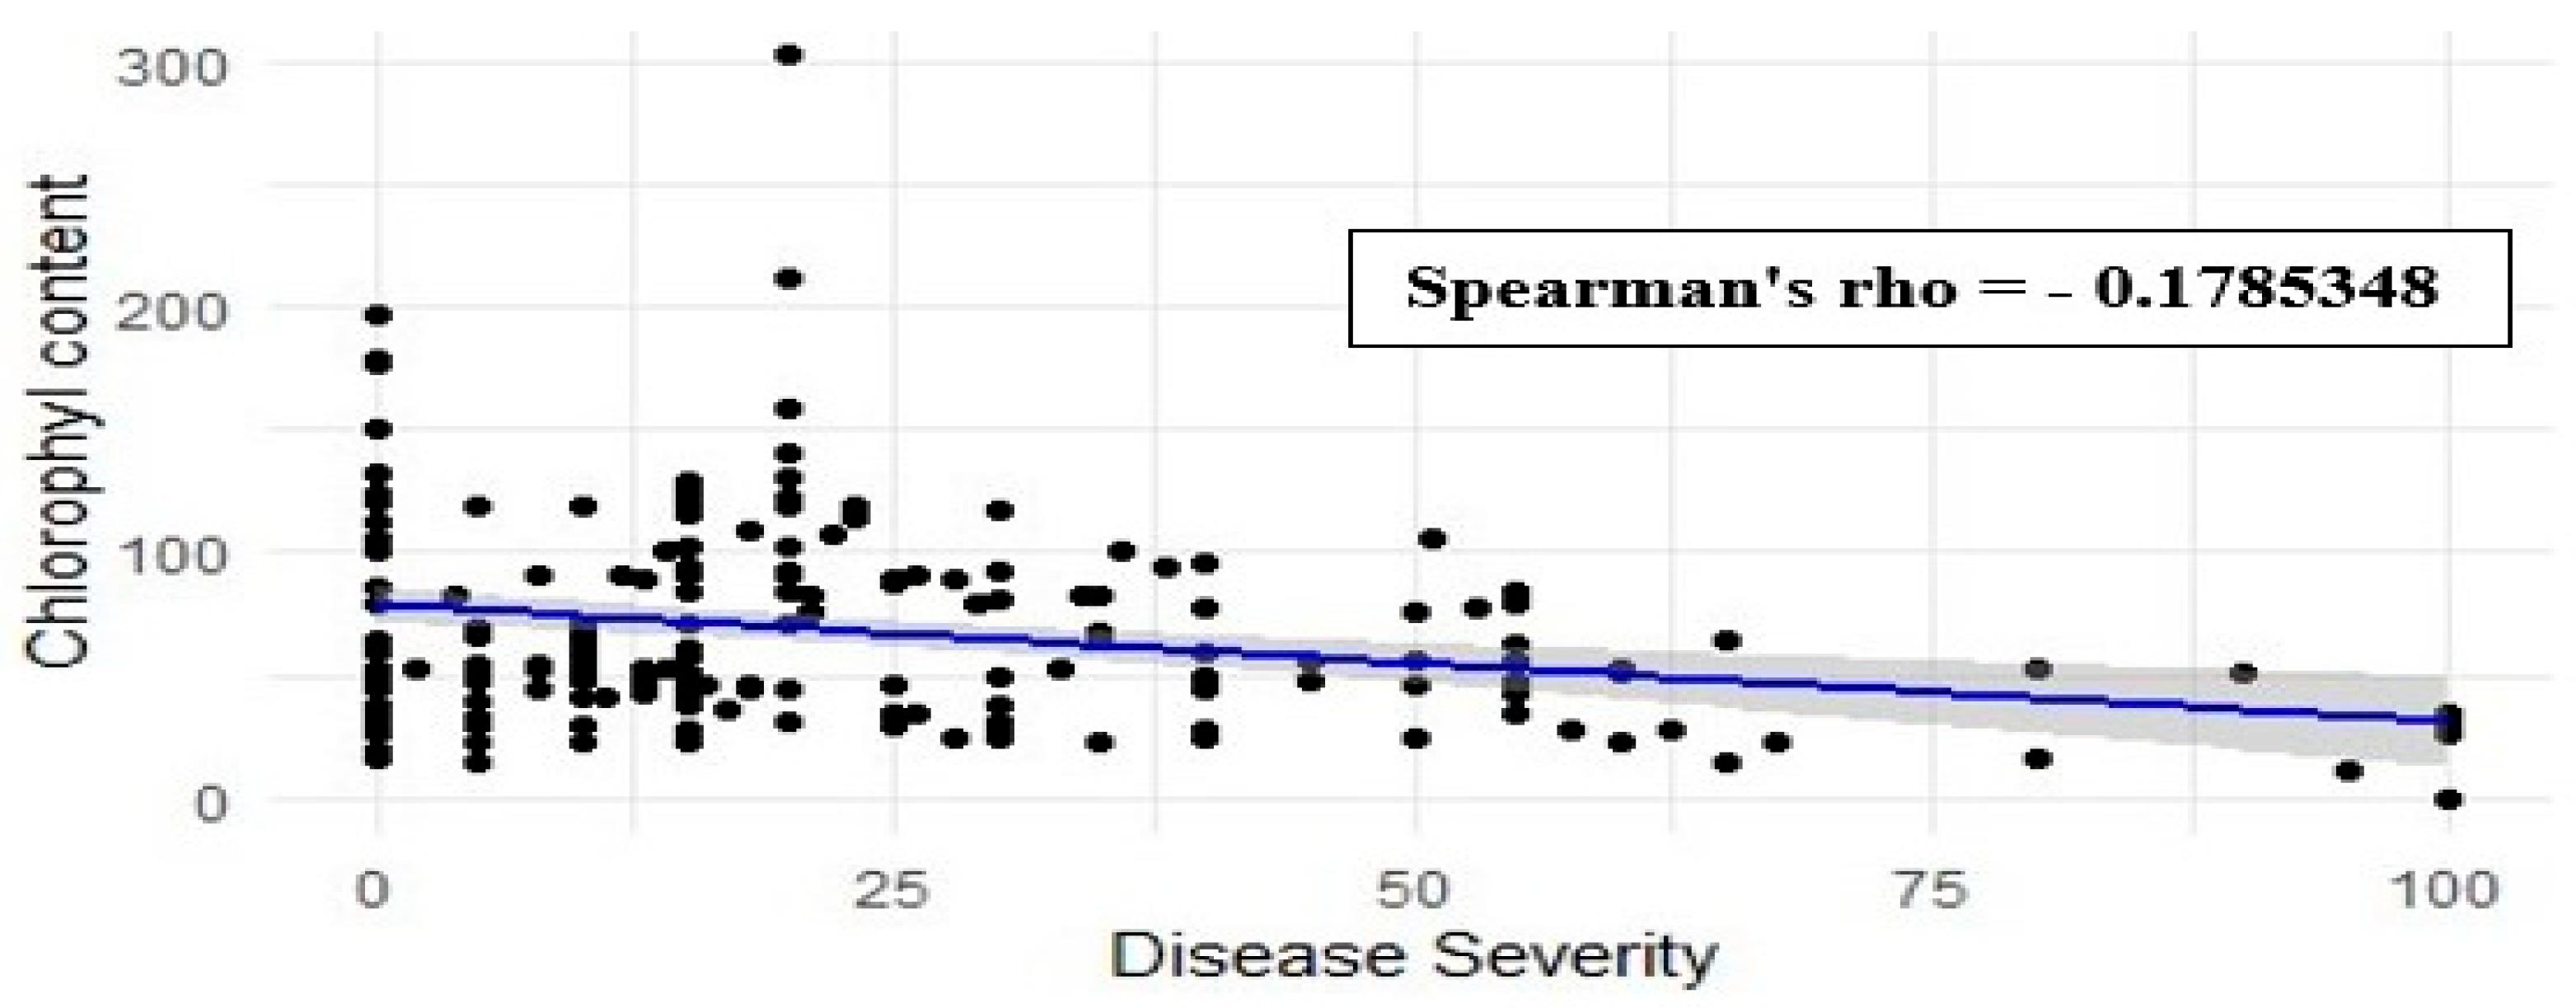
Figure 11.
Average plant heights of floral hemp grown in three mulches (plastic, straw, and none) sampled at three planting times (1, 2, 3) and fungicides (NF-no fungicide, F-fungicide) in 2023 at the TSU AREC farm. Error bars are ± s.e. Means of bars followed by the same letter are not significantly different (LSD, alpha = 0.05).
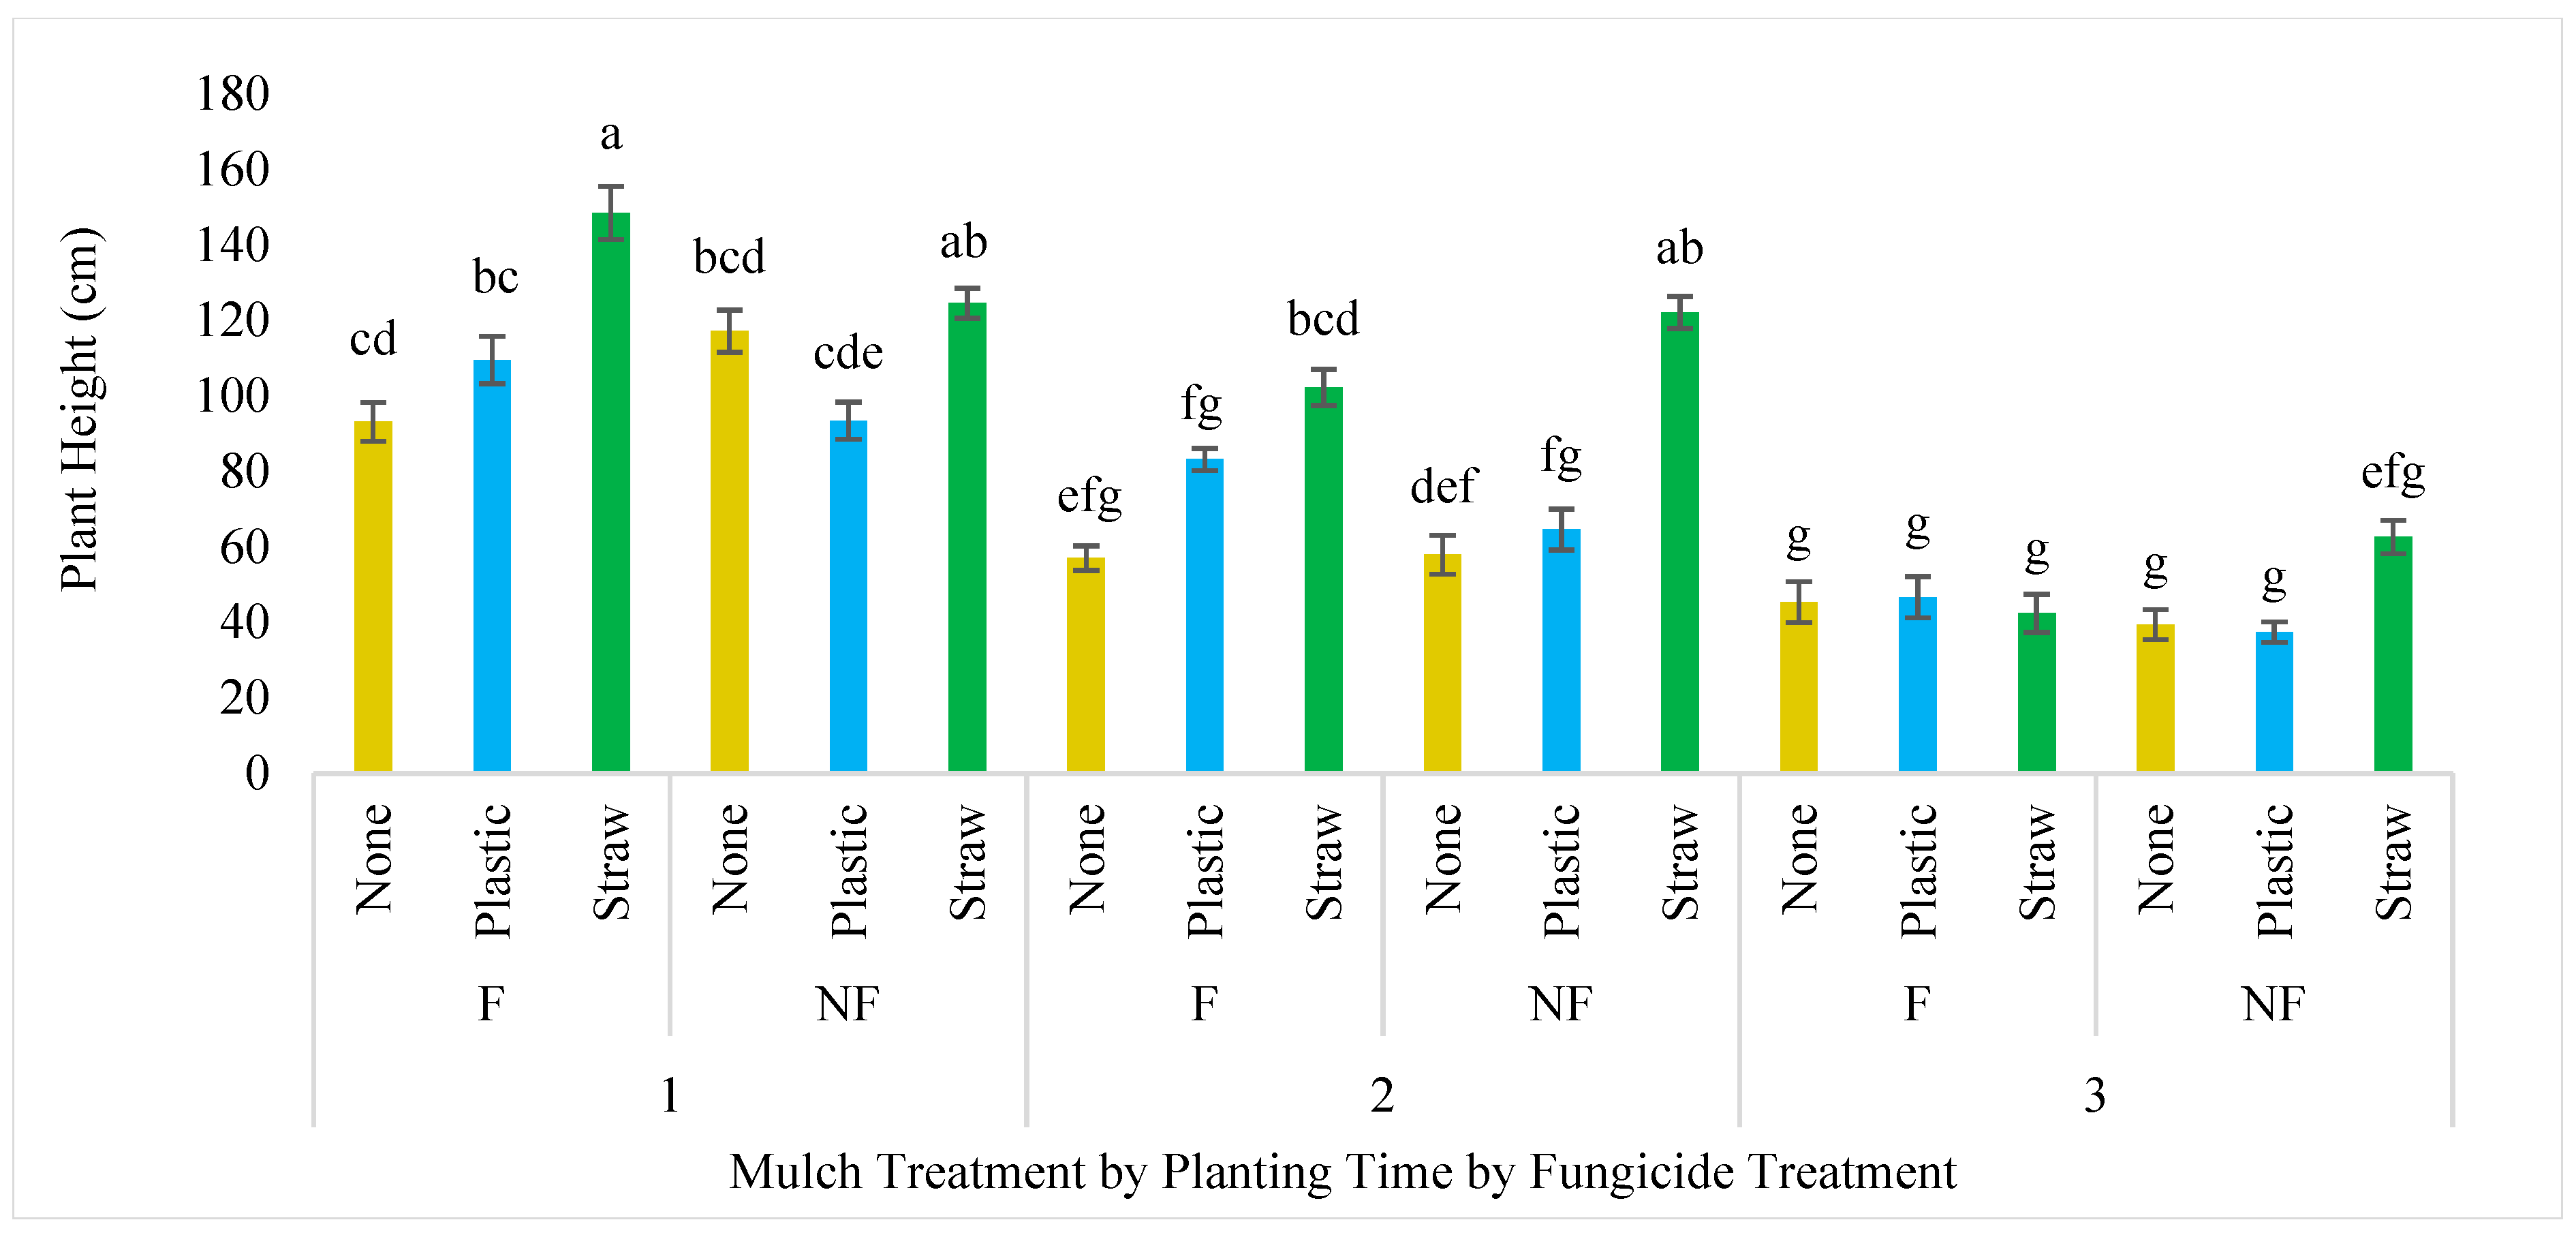
Figure 12.
Chlorophyll content (SPAD) of floral hemp grown in three mulches (plastic, straw, and none) sampled at three different planting time (1, 2, 3) and fungicides (NF-no fungicide, F- fungicide) in 2023 at the TSU AREC farm. Error bars are ± s.e. Means of bars followed by the same letter are not significantly different (LSD, alpha = 0.05).
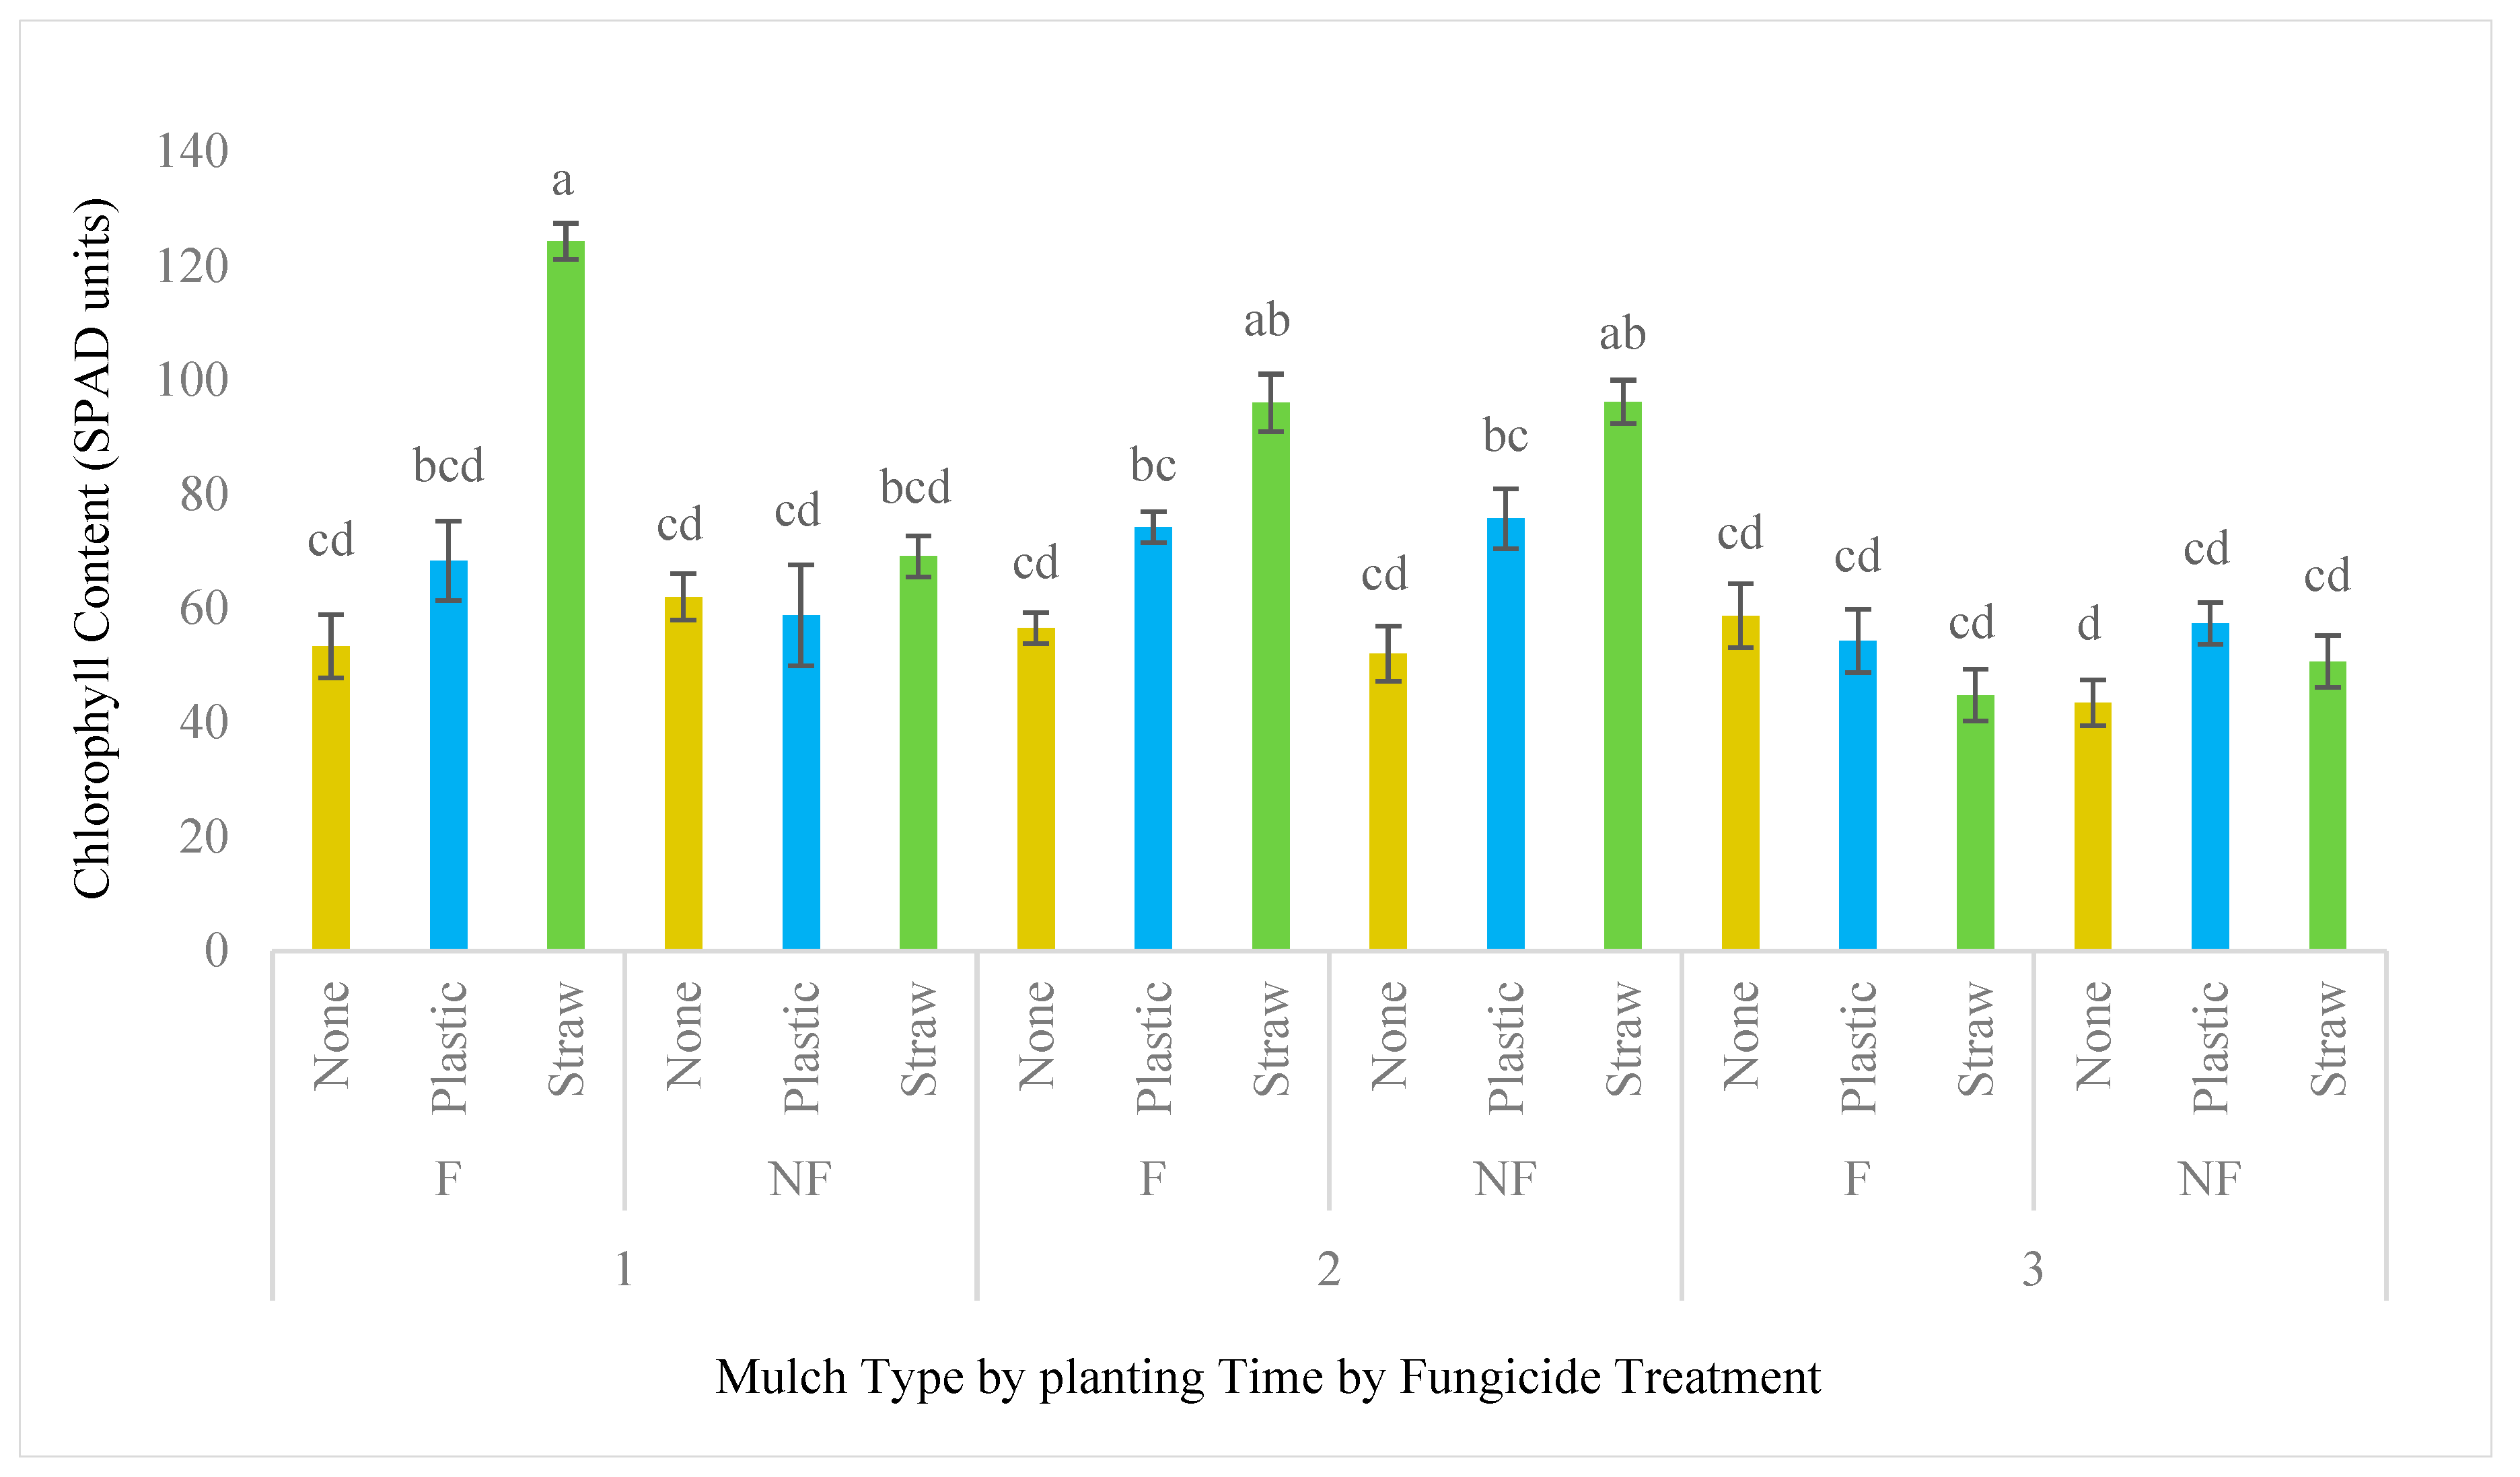
Figure 13.
Main effects of mulch material on weed density (broad leaf count) in 2023 at the TSU AREC farm. Error bars are ± s.e. Means of bars followed by the same letter are not significantly different (LSD, alpha = 0.05).
Figure 13.
Main effects of mulch material on weed density (broad leaf count) in 2023 at the TSU AREC farm. Error bars are ± s.e. Means of bars followed by the same letter are not significantly different (LSD, alpha = 0.05).
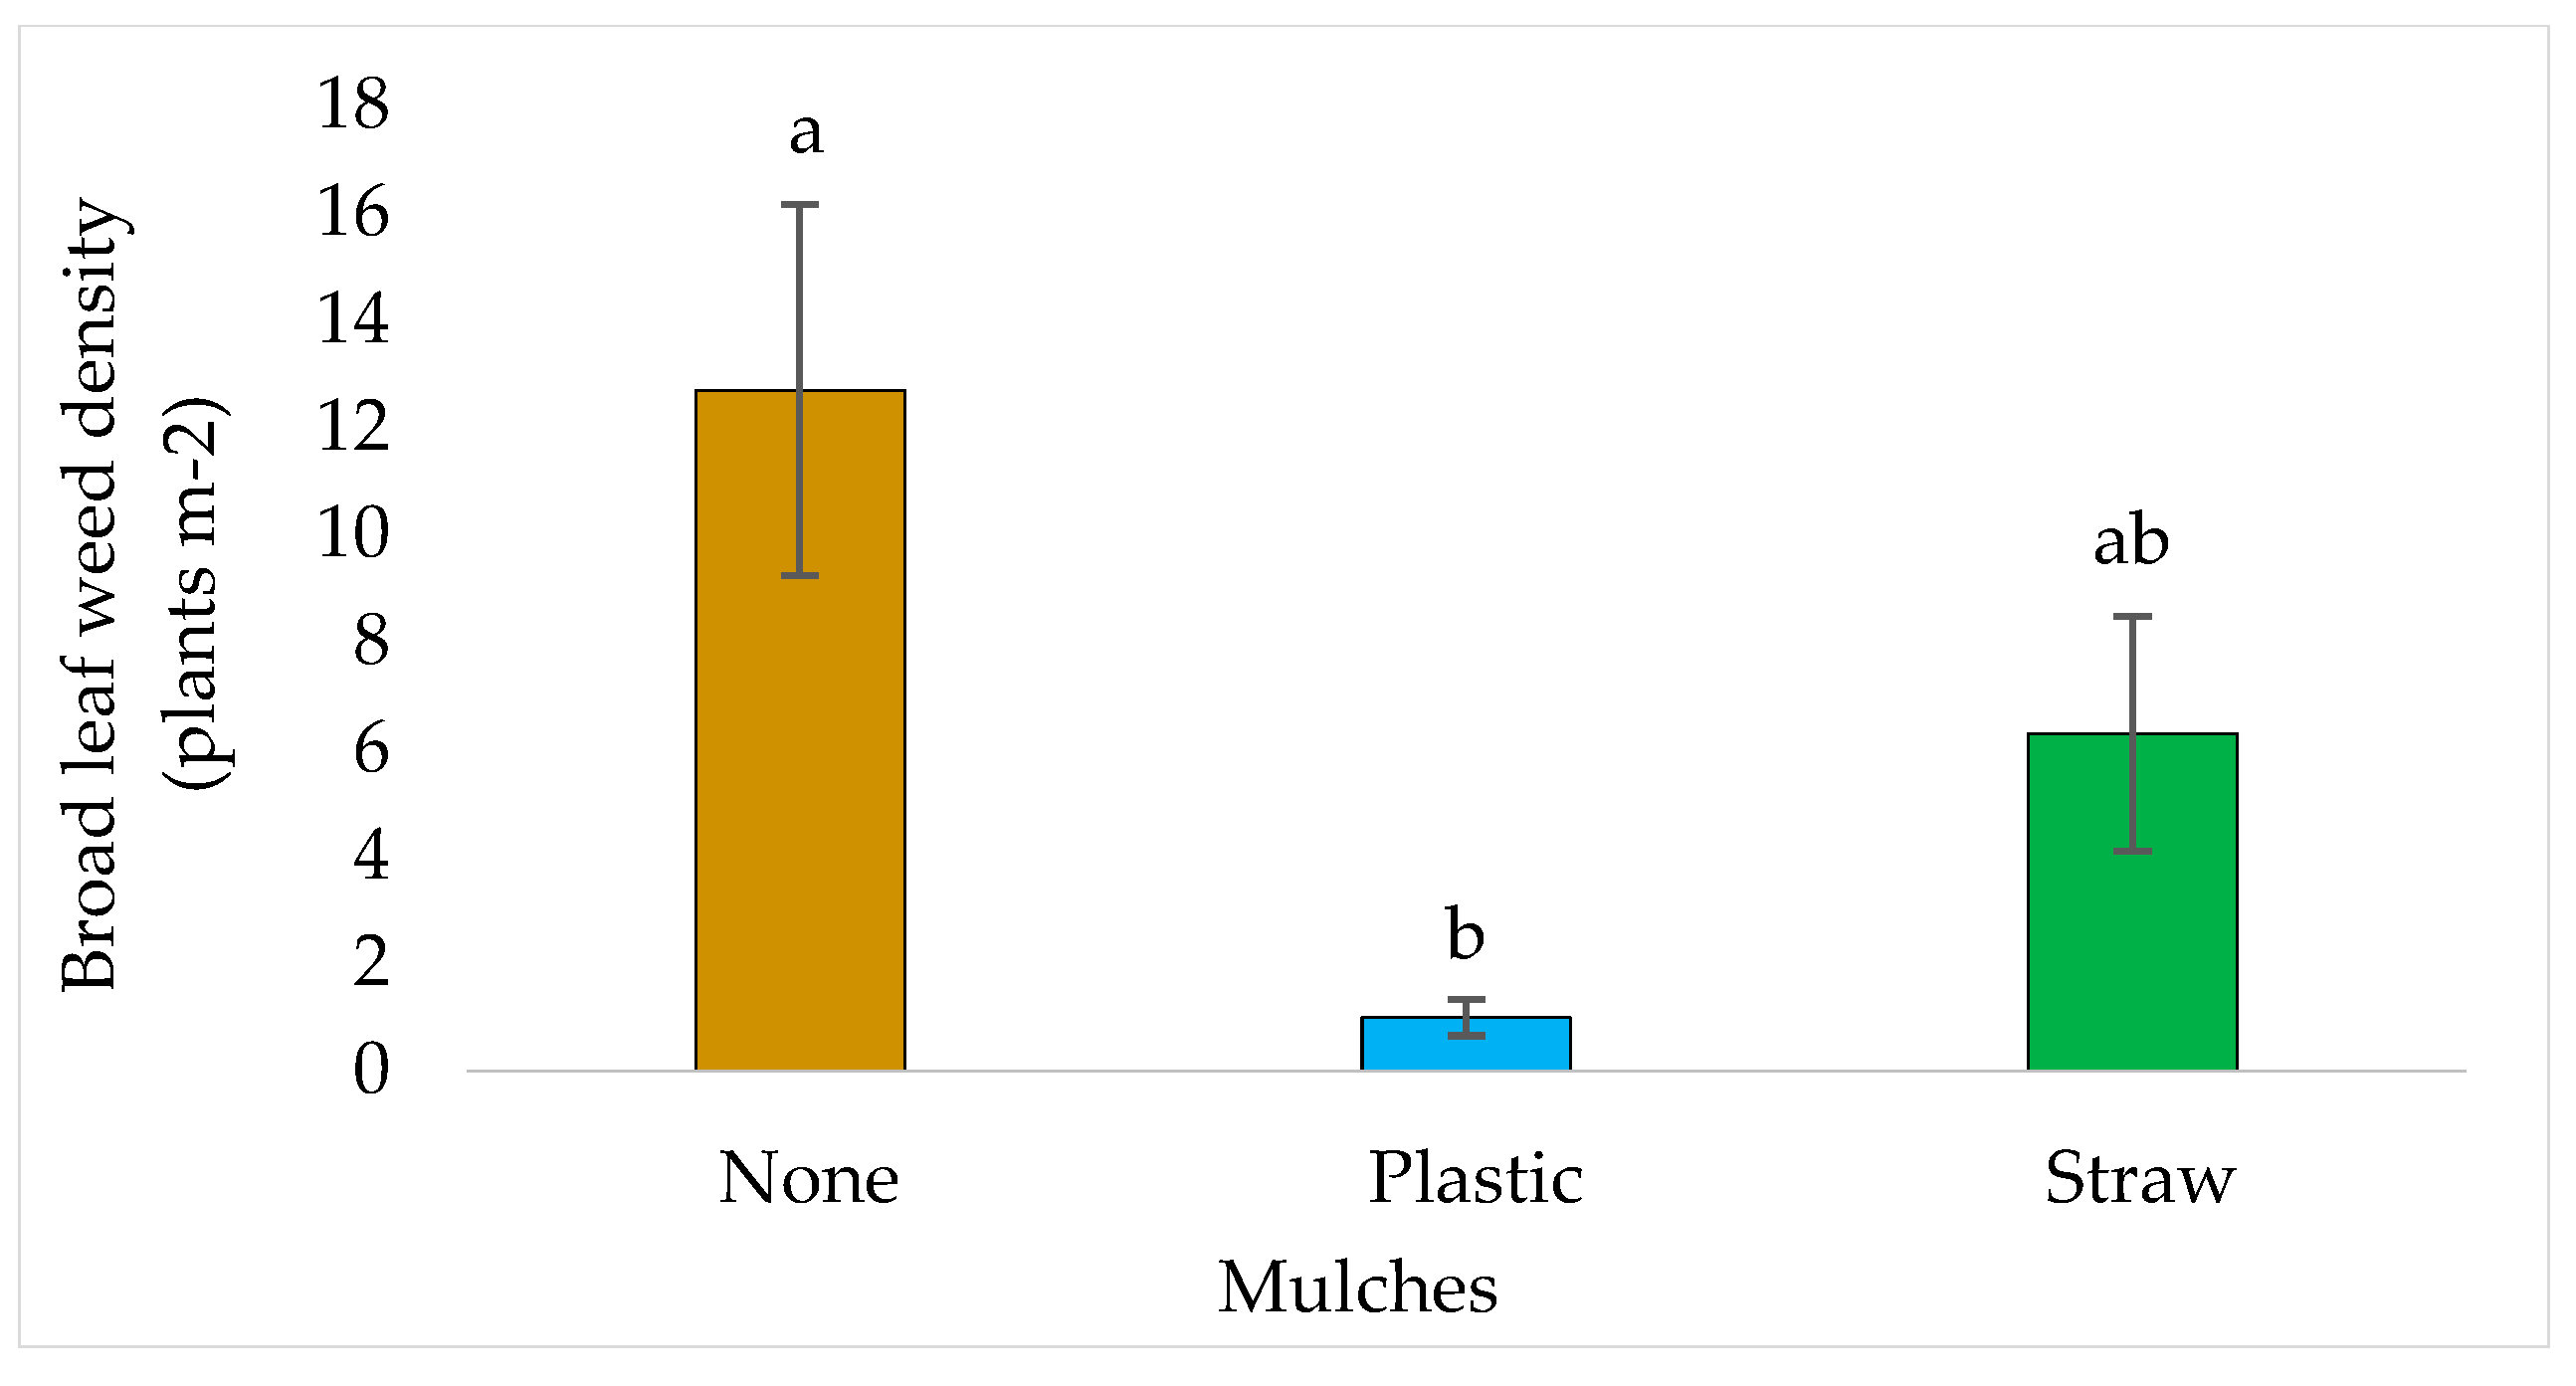
Figure 14.
Main effects of mulch material on weed density (grass count) in 2023 at the Tennessee State University research farm. Error bars are ± s.e. Means of bars followed by the same letter are not significantly different (LSD, alpha = 0.05).
Figure 14.
Main effects of mulch material on weed density (grass count) in 2023 at the Tennessee State University research farm. Error bars are ± s.e. Means of bars followed by the same letter are not significantly different (LSD, alpha = 0.05).
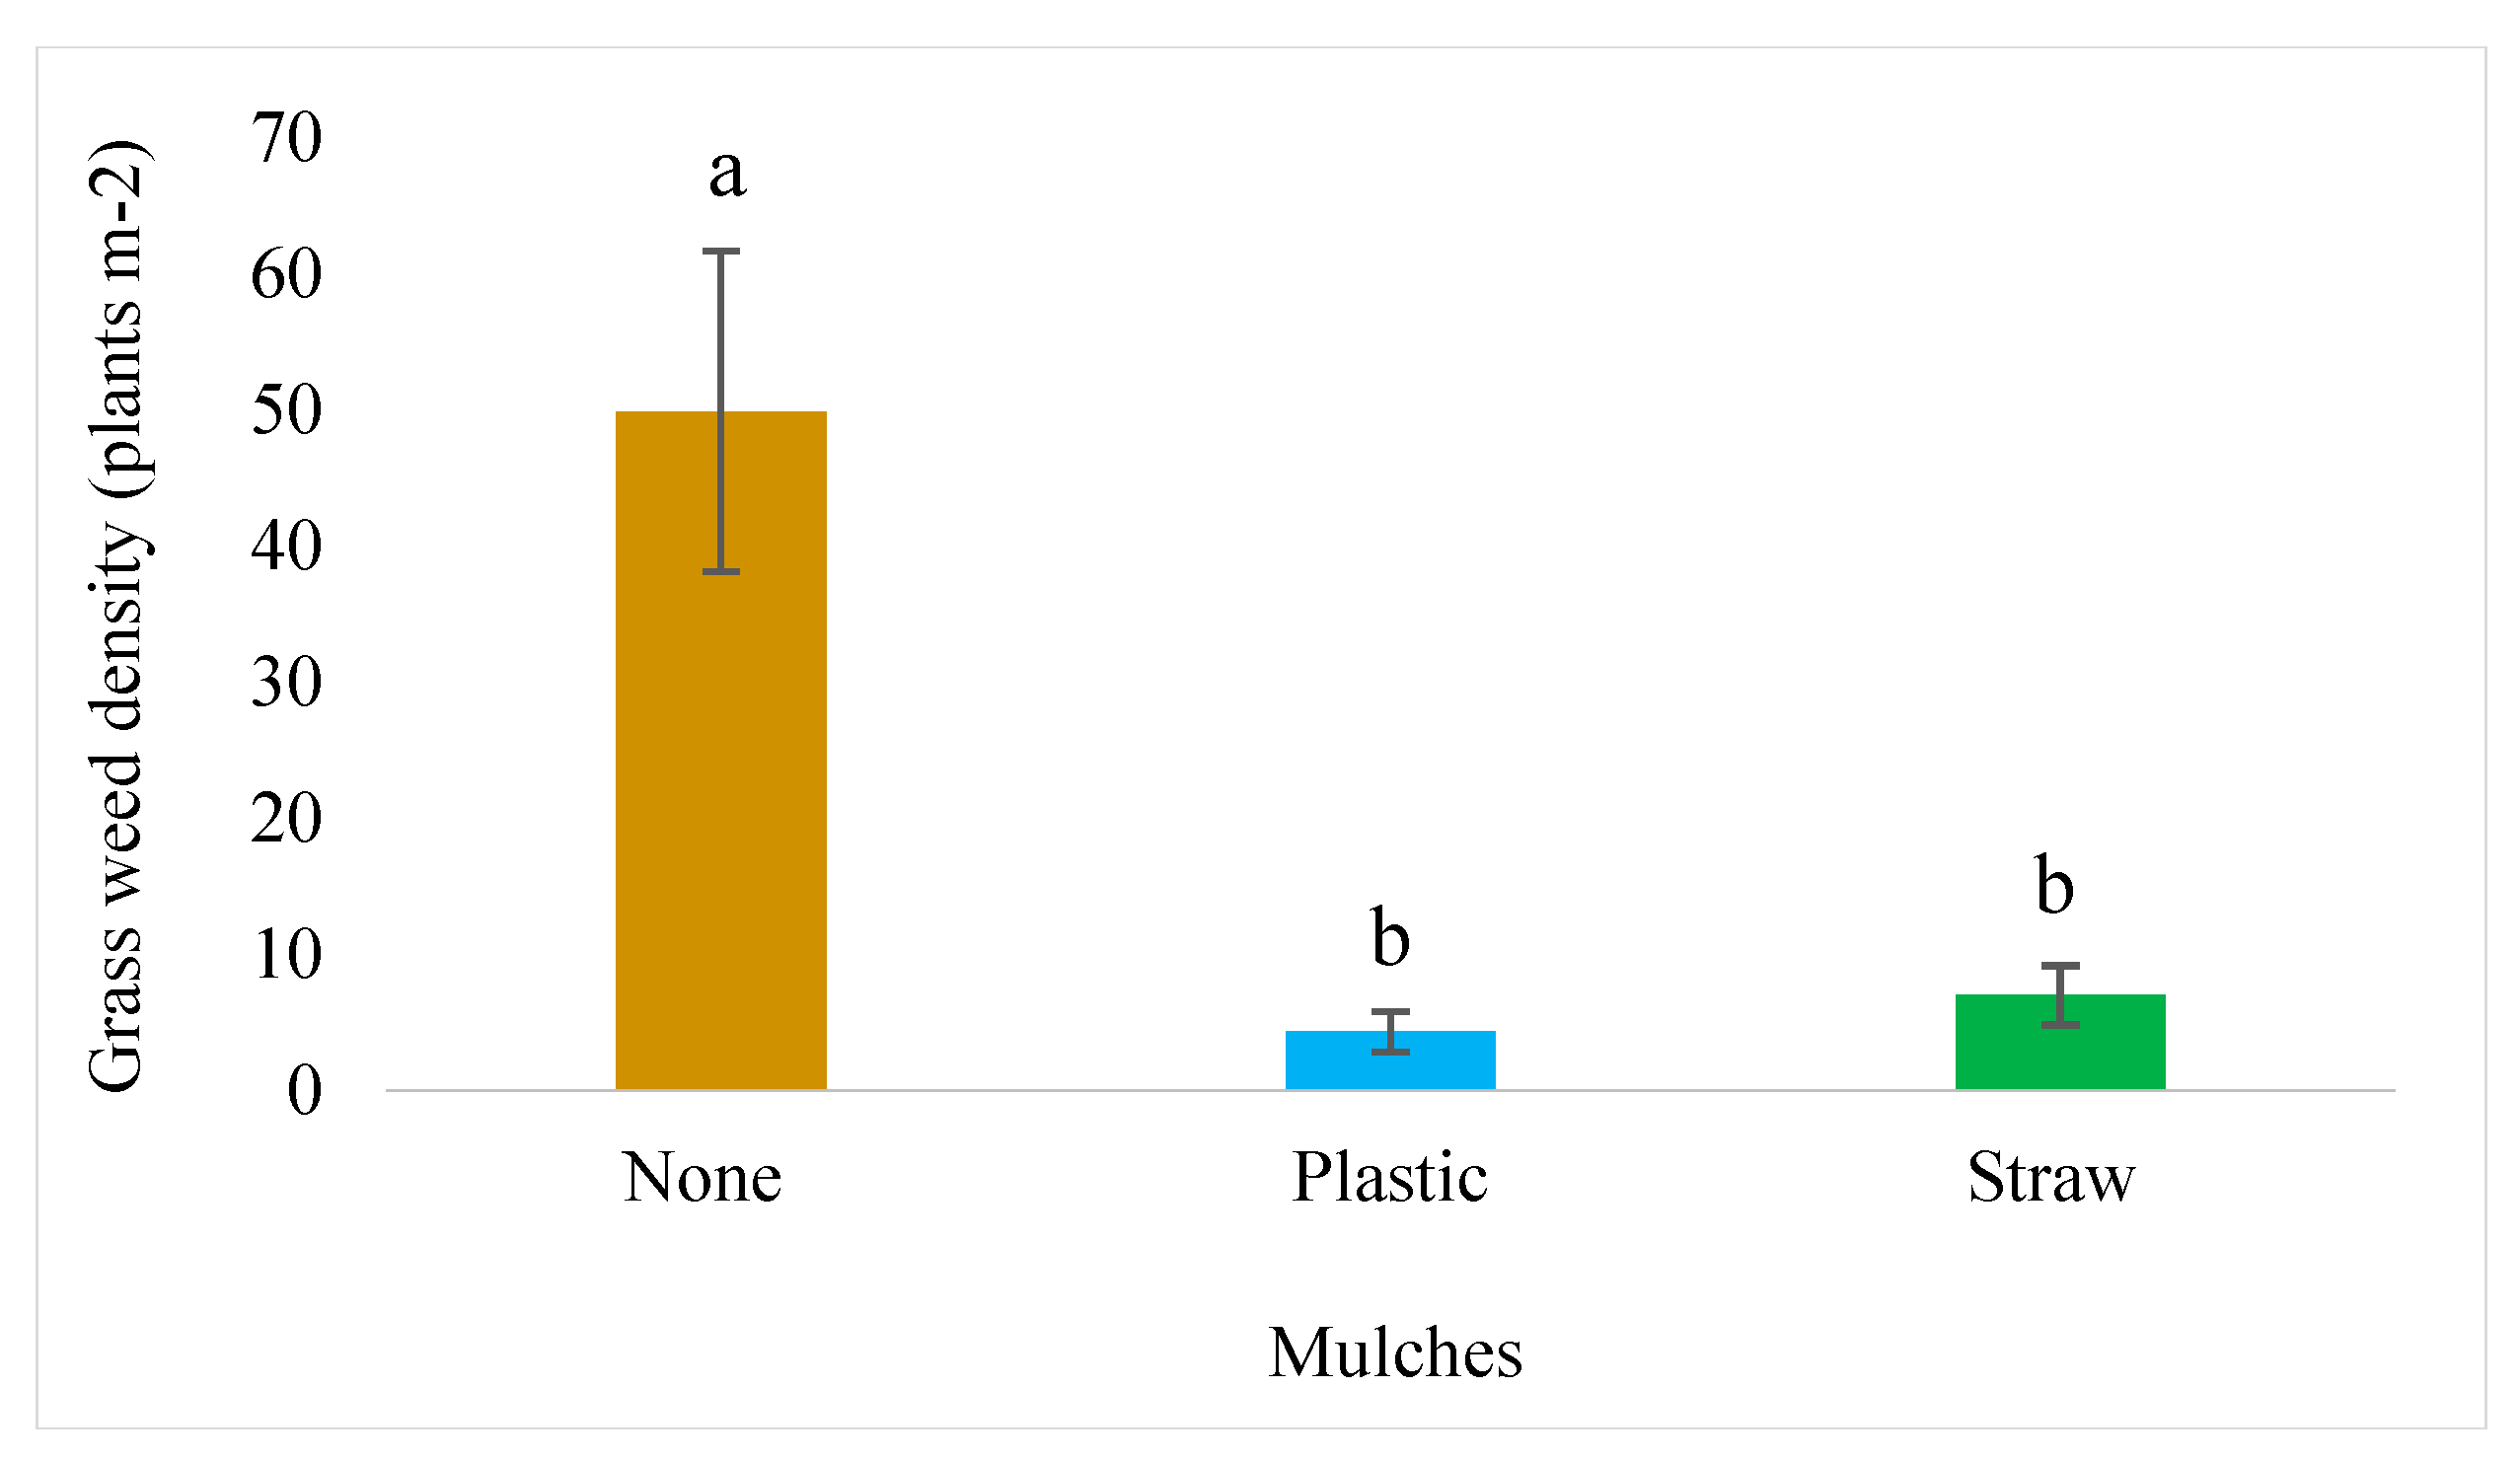
Figure 15.
Soil temperature of floral hemp grown in three mulches (plastic, straw, and none) with fungicide (F) and without fungicide (NF) in 2023 at the TSU AREC. Error bars are ± s.e. Means of bars followed by the same letter are not significantly different (LSD, alpha = 0.05.
Figure 15.
Soil temperature of floral hemp grown in three mulches (plastic, straw, and none) with fungicide (F) and without fungicide (NF) in 2023 at the TSU AREC. Error bars are ± s.e. Means of bars followed by the same letter are not significantly different (LSD, alpha = 0.05.
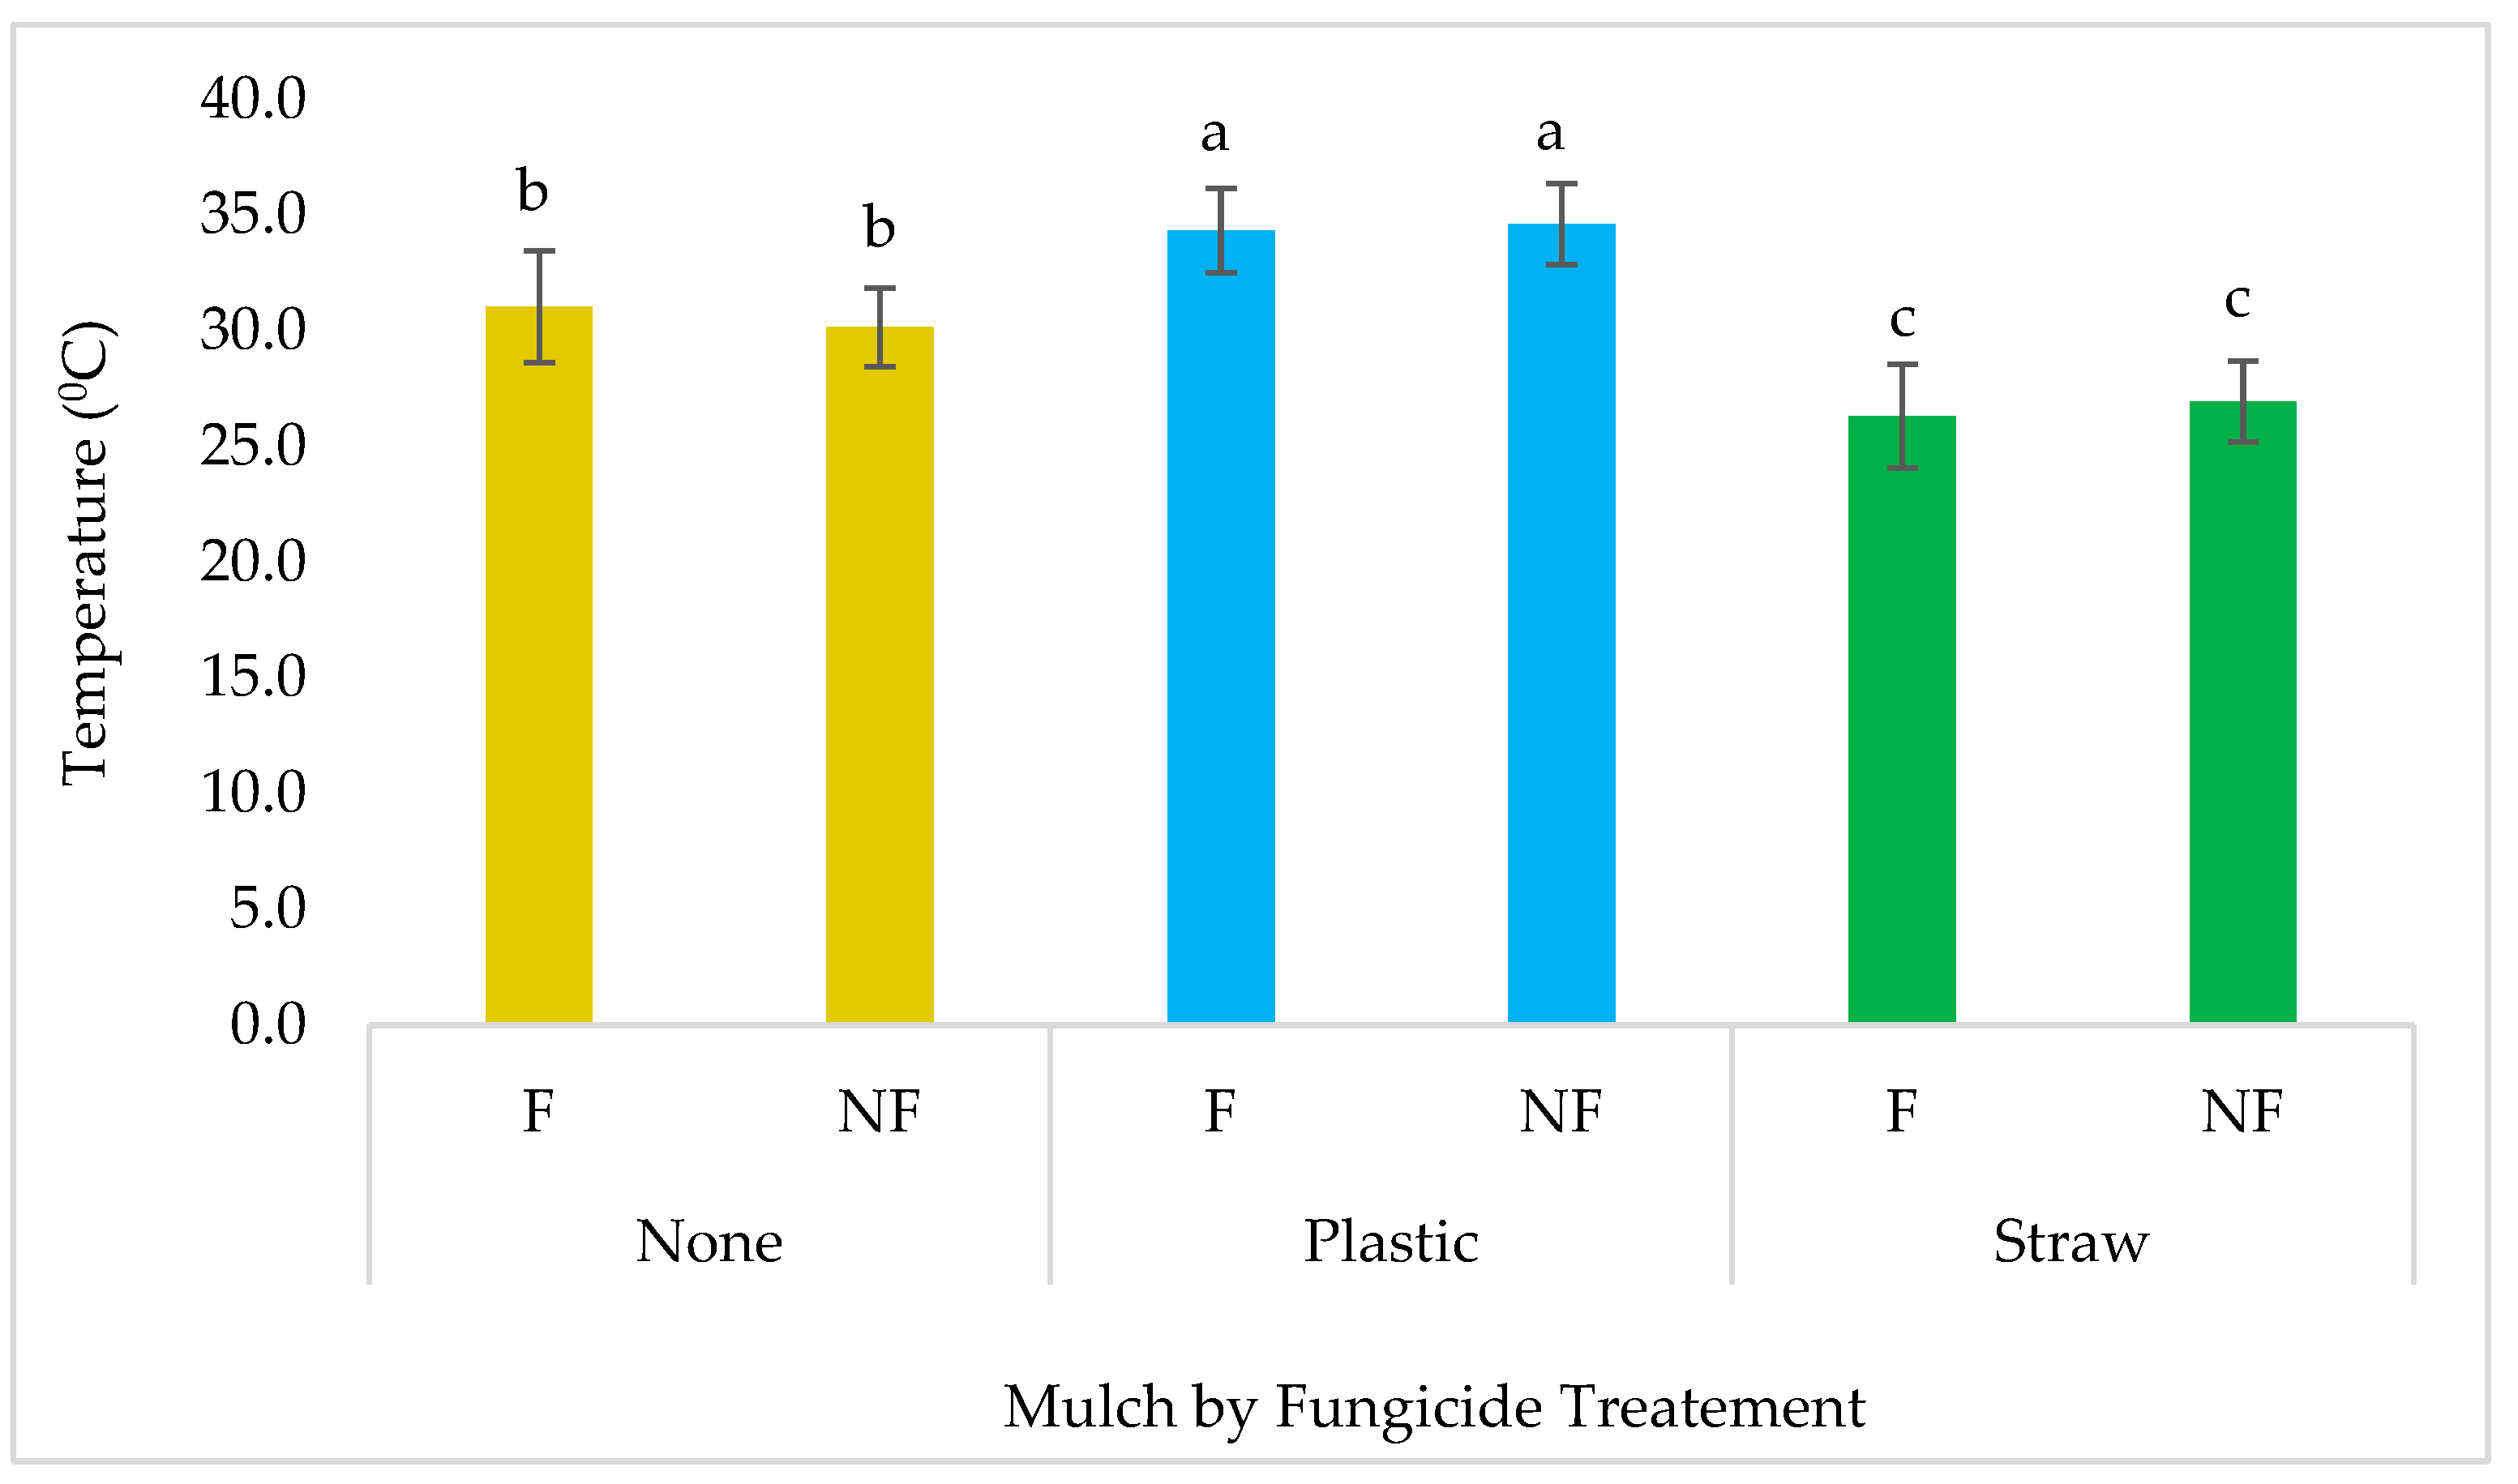
Figure 16.
Soil temperature of floral hemp grown in three mulches (Plastic, straw, and none) sampled at four different sample dates of summer (June, July, August, and September) in 2023 at the Tennessee State University research farm. Error bars are ± s.e. means of bars followed by the same letter are not significantly different (LSD, alpha = 0.05).
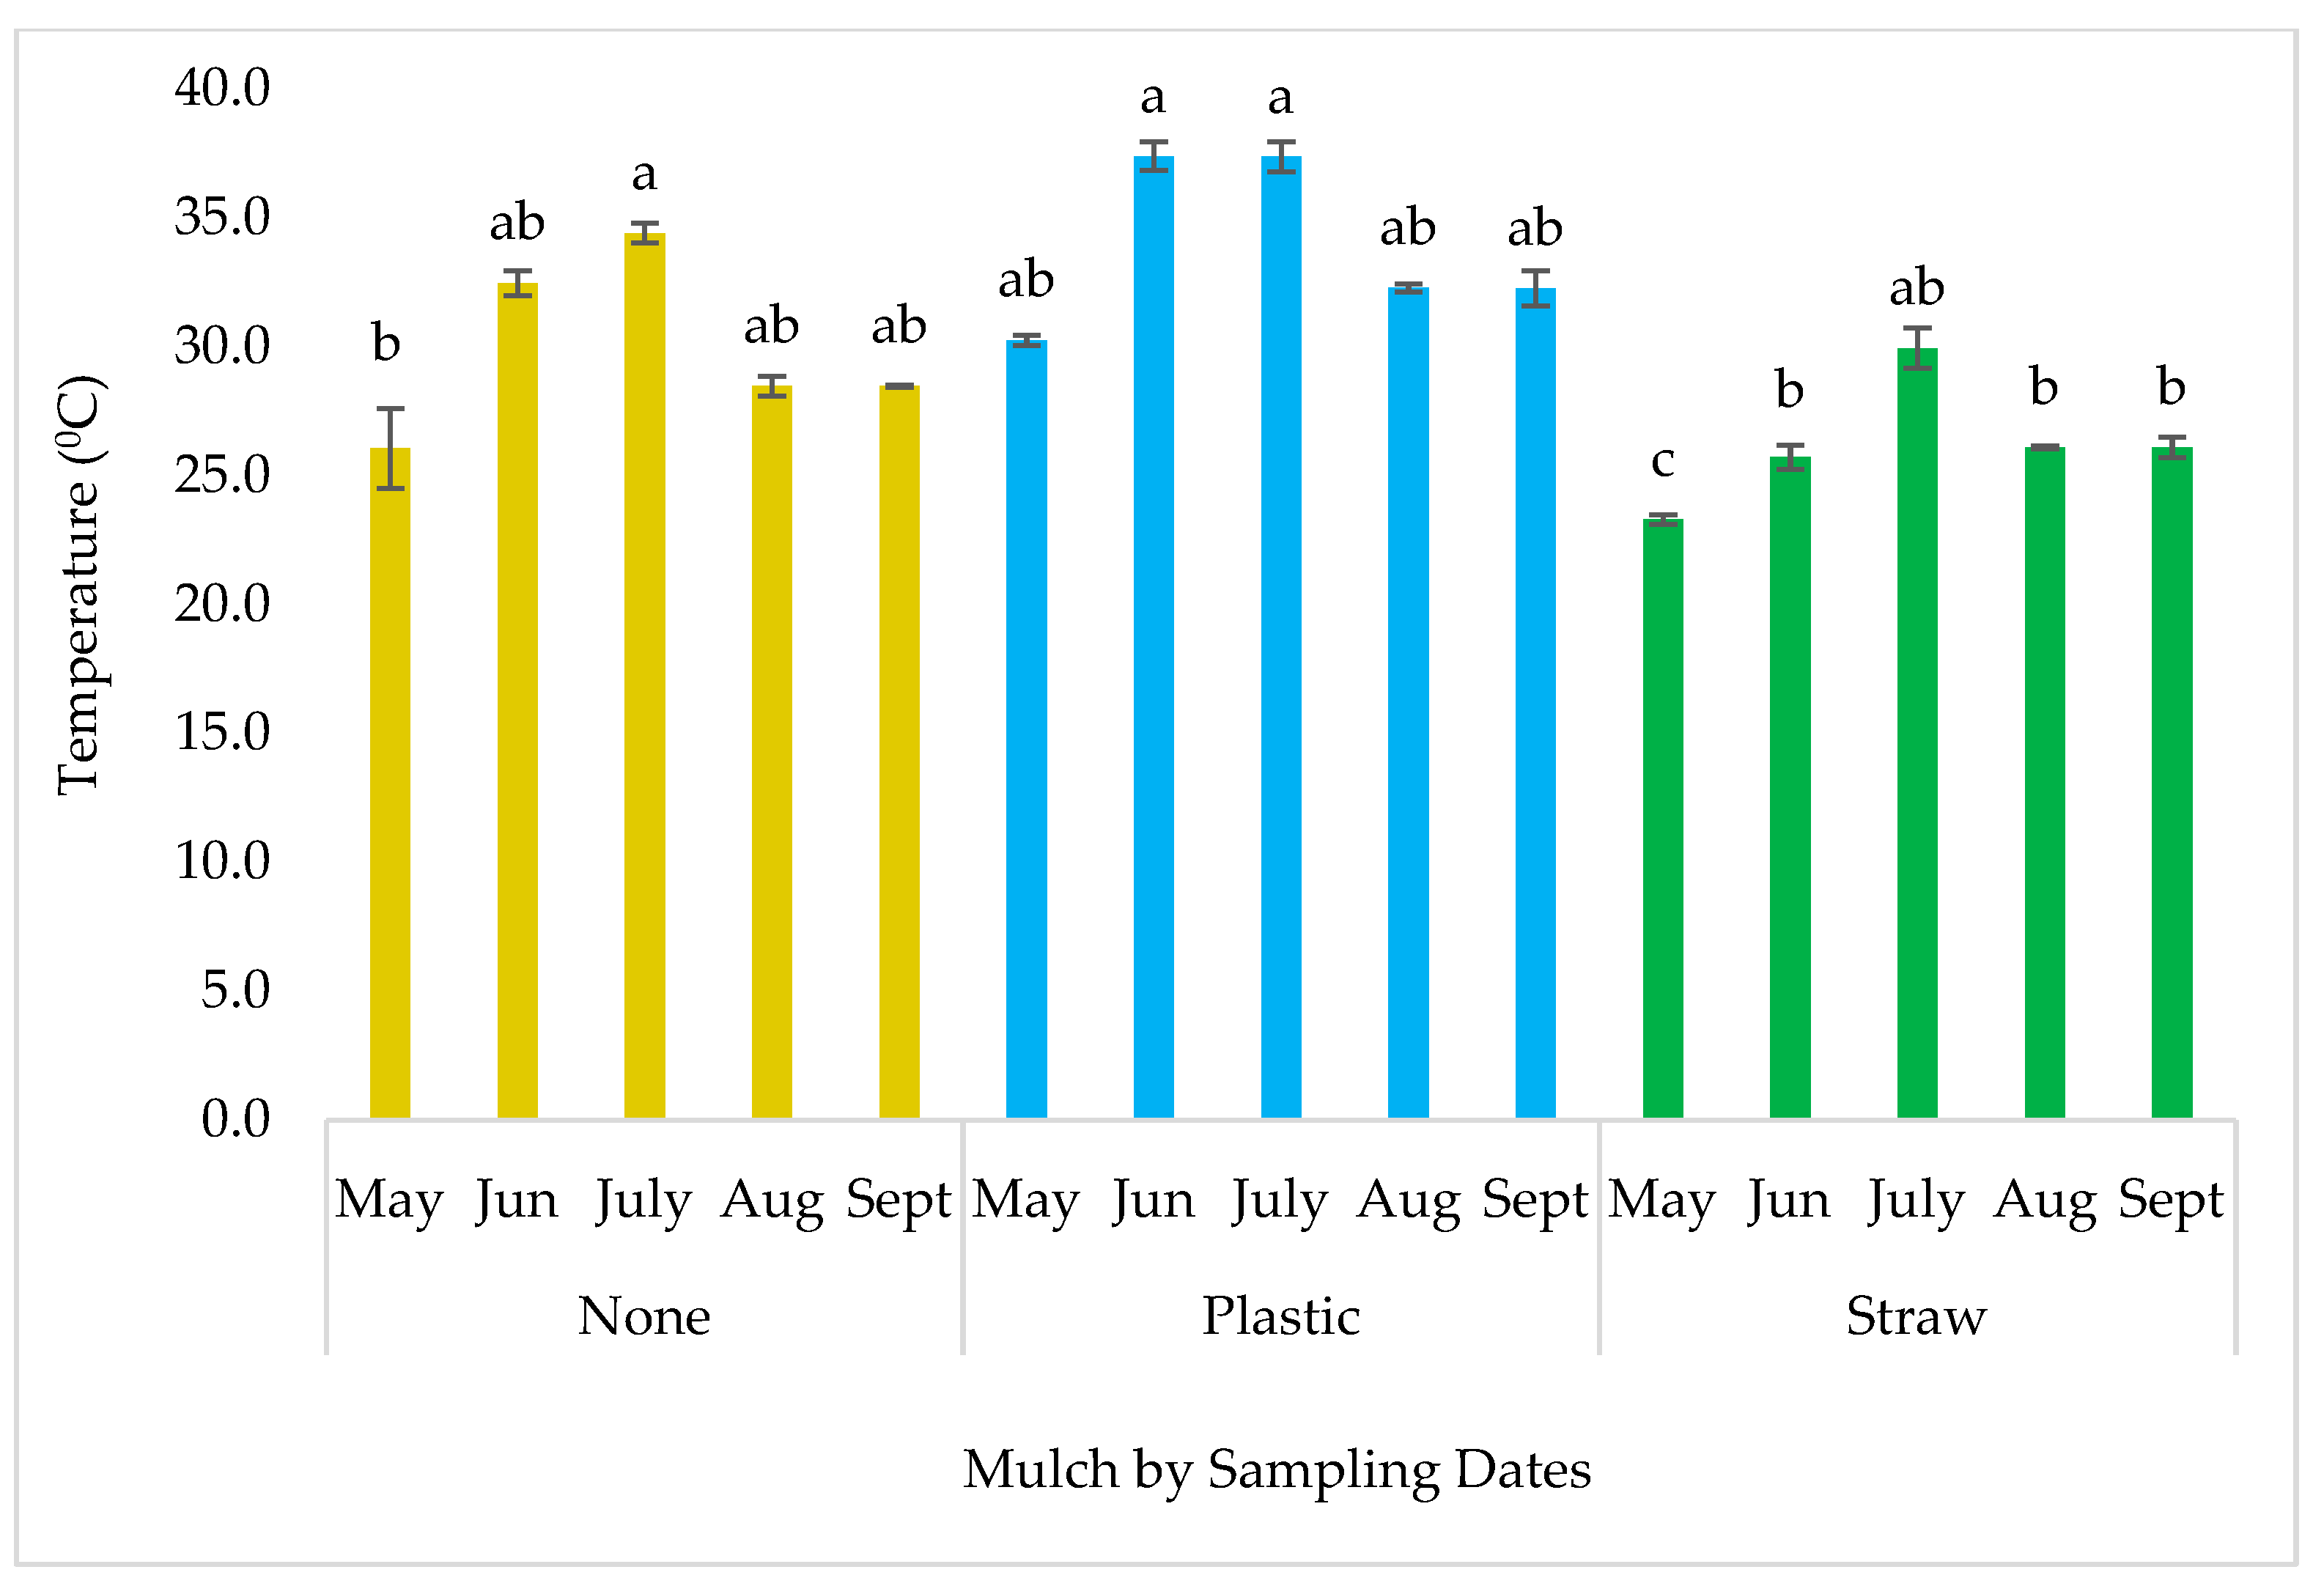
Figure 17.
Soil temperature of floral hemp grown at three planting times (1, 2, and 3) sampled at four different sample dates of summer (June, July, August, and September) in 2023 at the Tennessee State University research farm. Error bars are ± s.e. means of bars followed by the same letter are not significantly different (LSD, alpha = 0.05).
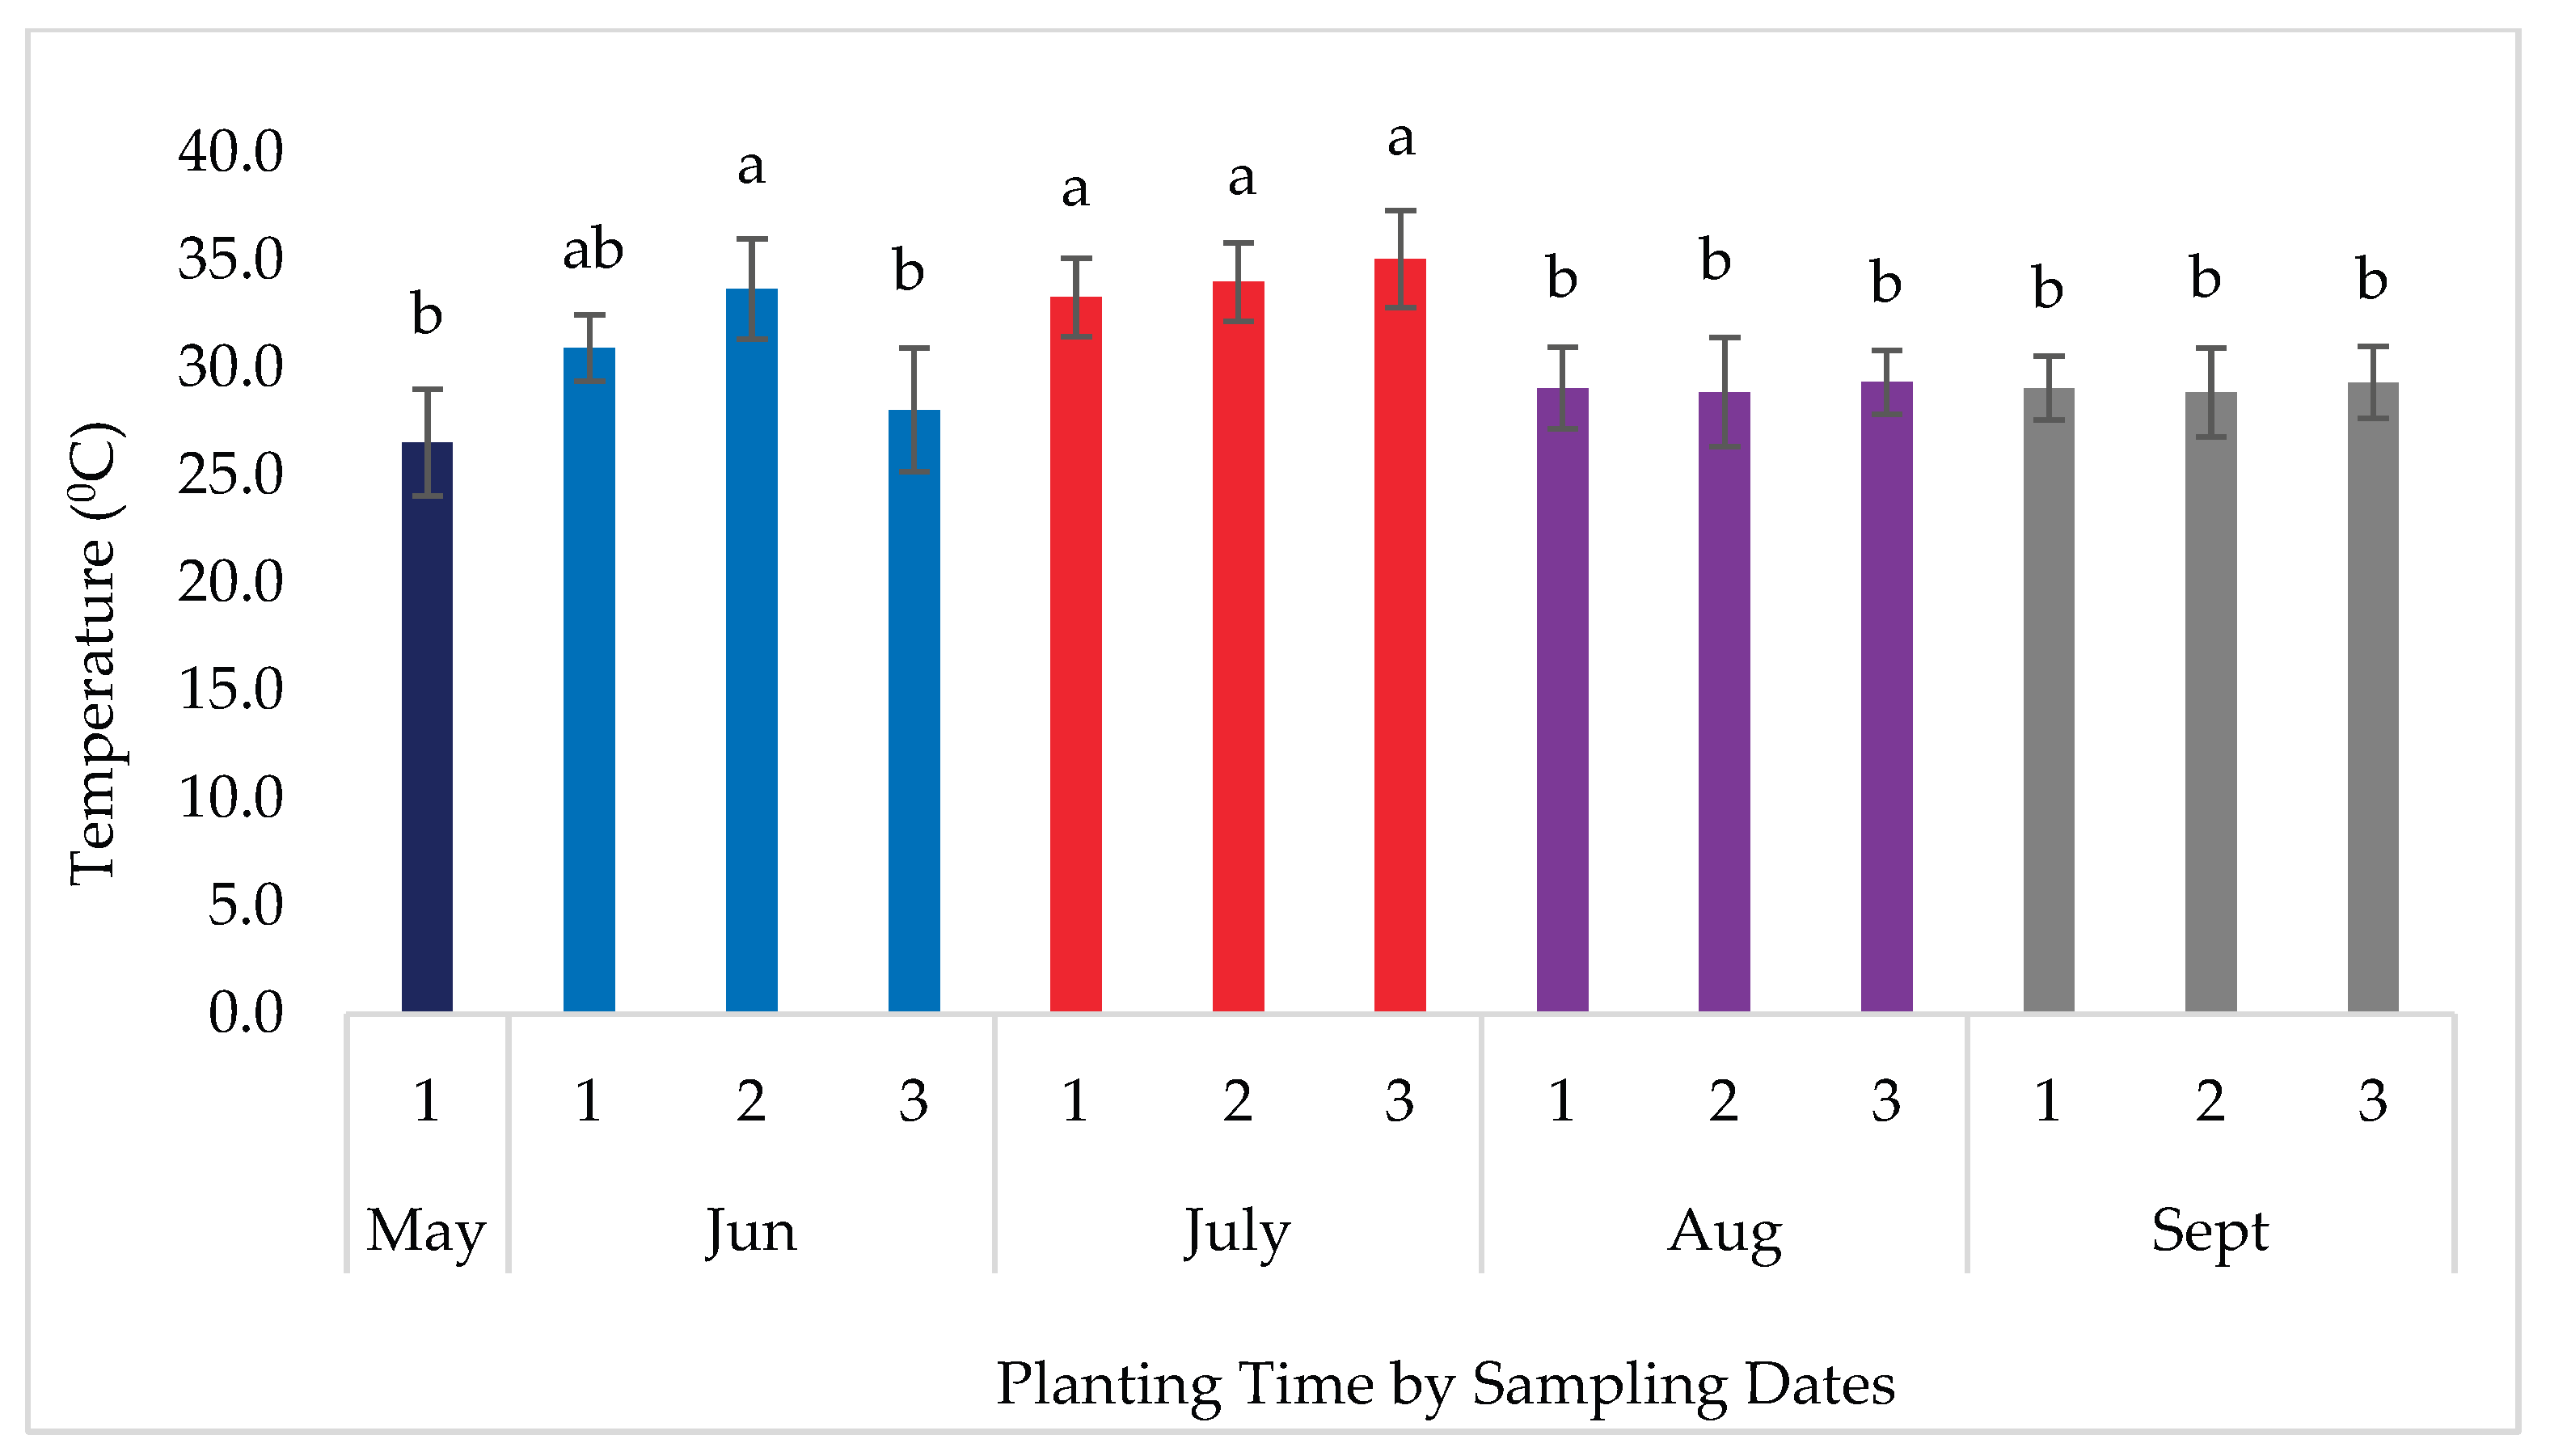

Table 1.
Partial analysis of variance values for southern blight percent severity, total weeds density (T.Weed), plant biomass, soil temperature (S.Temp), tetrahydrocannabidiol (THC), and Cannabidiol (CBD) as affected by fungicide application (FCide), planting time (PltTime), mulch material and their interactions at Tennessee State University (TSU AREC) in 2022.
| Source of variation | df | Disease | T. Weed | Biomass | S.Temp | THC | CBD |
|---|---|---|---|---|---|---|---|
| Mulch | 2 | 0.3949 | 0.0001 | 0.0481 | <0.0001 | 0.911 | 0.911 |
| Planting Time (PltTime) | 2 | 0.00046 | 0.918 | 0.00001 | 0.8919 | 0.0016 | 0.0152 |
| Fungicide (FCide) | 1 | 0.4122 | 0.724 | 0.1108 | 0.2192 | 0.410 | 0.1131 |
| Sampling Date (Date) | 2 | NA | 0.918 | NA | 0.8168 | NA | NA |
| Mulch*PltTime | 4 | 0.0476 | 0.751 | 0.3496 | 0.9539 | 0.2181 | 0.5321 |
| Mulch*FCide | 2 | 0.5954 | 0.912 | 0.5248 | 0.2232 | 0.8833 | 0.3353 |
| PltTime*FCide | 2 | 0.8823 | 0.746 | 0.28 | 0.6571 | 0.5708 | 0.5809 |
| Mulch*Date | 4 | NA | 0.751 | NA | 0.00391 | NA | NA |
| PltTime*Date | 4 | NA | 0.918 | NA | 0.7727 | NA | NA |
| FCide*Date | 2 | NA | 0.746 | NA | 0.5915 | 0.5708 | 0.5809 |
| Mulch*PltTime*FCide | 4 | 0.8167 | 0.988 | 0.5086 | 0.9717 | 0.2443 | 0.8927 |
Table 2.
Partial analysis of variance (P > F) values for southern blight severity (%) and other agronomic parameters: plant height, chlorophyll (SPAD nmol/cm2), broadleaf weeds (B. Weeds), grass weeds (G. Weeds), plant biomass, and soil temperature (S. Temp) as affected by fungicide application (FCide), planting time (PltTime), and mulches at TSU AREC in 2023.
| Source of variation | df | Disease | Height | SPAD | B. Weeds | G. Weeds | S. Temp |
|---|---|---|---|---|---|---|---|
| Mulch | 2 | 0.0395 | <0.0001 | <0.0001 | 0.00807 | <0.0001 | <0.0001 |
| Planting time (Pltime) | 2 | 0.9729 | <0.0001 | 0.0005 | 0.705 | 0.5101 | <0.0001 |
| Fungicide (FCide) | 1 | 0.5179 | 0.5362 | 0.0541 | 0.709 | 0.691 | 0.5709 |
| Sampling Date (Date) | 2 | <0.0001 | <0.0001 | <0.0001 | 0.641 | 0.0243 | <0.0001 |
| Mulch*Pltime | 4 | 0.0576 | 0.029 | 0.0112 | 0.555 | 0.1312 | 0.3954 |
| Mulch*FCide | 2 | 0.329 | 0.116 | 0.2285 | 0.876 | 0.3645 | 0.0392 |
| Pltime*FCide | 2 | 0.577 | 0.769 | 0.1989 | 0.191 | 0.8394 | 0.5658 |
| Mulch*Date | 4 | 0.572 | 0.0748 | 0.5324 | 0.388 | 0.1312 | <0.0001 |
| Pltime*Date | 4 | 0.085 | 0.655 | 0.8174 | 0.807 | 0.5101 | 0.00021 |
| FCide*Date | 2 | 0.576 | 0.612 | 0.8803 | 0.735 | 0.8394 | 0.9976 |
| Mulch*Pltime*FCide | 4 | 0.913 | 0.047 | 0.0368 | 0.319 | 0.2482 | 0.9720 |
| Mulch*PltTime*Date | 8 | 0.372 | 0.868 | 0.958 | 0.319 | 0.2164 | 0.9304 |
| Mulch*FCide*Date | 4 | 0.648 | 0.689 | 0.475 | 0.490 | 0.3539 | 0.9183 |
| PltTime*FCide*Date | 4 | 0.522 | 0.621 | 0.957 | 0.876 | 0.1895 | 0.425 |
| Mulch*PltTime*FCide*Date | 8 | 0.757 | 0.967 | 0.950 | 0.319 | 0.2313 | 0.969 |
Disclaimer/Publisher’s Note: The statements, opinions and data contained in all publications are solely those of the individual author(s) and contributor(s) and not of MDPI and/or the editor(s). MDPI and/or the editor(s) disclaim responsibility for any injury to people or property resulting from any ideas, methods, instructions or products referred to in the content. |
© 2025 by the authors. Licensee MDPI, Basel, Switzerland. This article is an open access article distributed under the terms and conditions of the Creative Commons Attribution (CC BY) license (https://creativecommons.org/licenses/by/4.0/).
Copyright: This open access article is published under a Creative Commons CC BY 4.0 license, which permit the free download, distribution, and reuse, provided that the author and preprint are cited in any reuse.


