
Submitted:
20 March 2025
Posted:
21 March 2025
You are already at the latest version
Abstract
Production of organic strawberries in Texas is becoming more popular because consum-ers prefer locally grown berries and are willing to pay premium prices. However, local climatic conditions pose a high risk of insect problems and fungal diseases, and hence ef-fective pest and disease management strategies are needed. Developing effective and safe methods of producing organic strawberries is necessary for meeting local consumer demand. The objective of this study was to evaluate the impacts of selected commercially available soil-applied biopesticides on yield and the quality of Camino Real strawberries established using bare roots on plastic mulch covered-beds with drip irrigation. The ten biopesticide treatments were replicated three times in a completely randomized design. The berries used for this study were subsampled from harvests made in mid-April, late-April, and mid-May 2019. Yield, weight loss, biometrical characteristics, and physicochemical analyses such as pH, acidity, total soluble solids, sugars and organic acid contents, firmness, and instrumental color were determined after each harvest period of the fresh strawberries. Experimental data were analyzed using the PROC Mixed model procedure of SAS. The biopesticides showed no negative effects on yield and fruit quality and thus they could serve as alternatives to conventional products used.
Keywords:
organic pesticides
; Camino Real strawberry
; physicochemical properties
; sugar content
; color
1. Introduction
Consumer awareness of the impact of fruit intake on overall health and well-being is continually increasing. Therefore, the consumption of berry fruits such as strawberries (Fragaria x ananassa) has been promoted for their significant health benefits such as antioxidant, anti-inflammatory, and anti-diabetic activities (Milosavljević et al., 2022; Afrin et al., 2016). Strawberry fruit is a valuable horticultural crop widely consumed due to its appearance (color and biometrical characteristics), firmness and chemical composition. These attributes determine crop value and consumer acceptance of the fruit (Ornelas-Paz et al., 2013). However, strawberry production exhibits enormous difficulties due to its susceptibility to pests and diseases. In the USA, the two top strawberry producers are California and Florida. However, strawberry production is increasing in Texas and some Mid-Southern states because of consumer interest in locally grown berries. The warm climate in the Mid-South also increases the risk of strawberry disease and insect pests (Samtani et al., 2019).
As a result, strawberry farmers often use conventional pesticides to protect crops from diseases (Botrytis cinerea, Oidium fragariae, and Mycospharella fragariae) and pests (Steneotarsonemus fragariae, Anthonomus rubi, and Tetranychus urticae) (Sójka et al., 2015). Thus, efficient protection is critical for the quality and yield of this commodity crop.
Conventional strawberry production has the potential for leaving pesticide residues on the fruits. However, organic cultivation approaches minimize the negative impact of pesticide residues and hence are increasingly becoming more popular. Organic products have a comparatively lower potential for leaving residues on fruits sold in the market (Wippich Andrade et al., 2016). Using conventional pesticides such as fungicides can modify the chemical composition of the fruits and contribute to the risk of the residue contamination of the strawberry fruits (Wysocki and Banaszkiewicz, 2014). This concern provides an opportunity for the use of biopesticides to control fruit diseases and pests instead of conventional pesticides.
According to the United States Environmental Protection Agency (EPA), biopesticides are usually inherently less toxic and effective in small quantities. Moreover, they often decompose rapidly which results in lower exposure thereby, avoiding the pollution problems caused by conventional pesticides. These biopesticides are derived from natural sources such as animals, plants, bacteria, and certain minerals (EPA, 2023). The rapid growth of organic farming is due to the consumer’s demand for healthier foods and government initiatives supporting the environmental sustainability of agricultural practices (Maggio et al., 2013).
Normally, high-quality strawberries are selected based on several attributes, including color, shape, size, appearance, firmness, and flavor (Birania et al., 2022). However, factors such as environmental conditions, agricultural practices, and harvest timing can significantly impact the quality of strawberry fruits (Prasad et al., 2022). In this study, we evaluated the impacts of selected commercially available biocontrol and organic products applied in a soil system on yield and the quality characteristics of Camino Real strawberries grown in Southwest Texas.
2. Results and Discussion
2.1. Strawberry Yields
The treatments used in this trial are found in Table 1. The effects of the soil-applied biopesticide treatments on strawberry yield varied. Application frequency resulted in a significant difference for Regalia (T8 vs T4) and Double Nickel (T9 vs. T5) in terms of marketable fruit numbers and weights (Table 2). Making three applications one at transplanting and two subsequently at 8-week intervals significantly increased (p < 0.05) fruit numbers and yield weights for Regalia and Double Nickel treated plants compared to the same treatments made in 6 applications, one at transplanting time followed by 5 additional treatments at 4-week intervals afterwards. Similarly, an increase of 36.7% and 49.6% was observed for fruit numbers and weights for Actinovate treatments for the same application frequencies (T6 vs T10), but the difference was not statistically significant (p > 0.05). The opposite was observed for Rootshield Plus treatments where the six-time application treatment (T3) yielded 42.3% and 56.4% more fruit numbers and weights respectively compared to the three-time application treatment (T2). Strawberry yield (fruit numbers and weights) for Regalia (T8), Double Nickel (T9) and Actinovate (T10) applied in 3
applications were statistically similar to the standard conventional treatment (Ridomil Gold + Abound FL), which can also be considered as a positive control. Yields for these treatments were also significantly different from the untreated untreated control (T1) as expected. However, the RootShield Plus treatments were mostly similar statistically to the untreated control. These results suggest that biopesticides applied at the right time and frequency have the potential to perform at similar levels like their conventional counterparts. These results are contrary to observations by Pruitt (2020), which indicated no clear yield advantages for Camino Real and Sweet Sensation using biopesticides.
2.2. Biometrical Characteristics
The fruit length and major diameter were not affected (p > 0.05) by the biopesticide treatments in the strawberries harvested in mid-April or mild-May (Table 3). However, an increase in fruit length was noted (42.1 ± 0.93 mm) in the T6 compared to the control (35.8 ± 0.93 mm) when the strawberries were harvested in late-April. In general, biopesticide treatments did not have a significant effect (p > 0.05) on the length and major diameter of strawberry fruit in each harvested period, except in late-April (Table 3).
The length and major diameter of strawberry fruit are not commonly reported in the literature. In our study, the length and major diameter of tested fruits were similar to those values reported by several authors. Basak et al. (2022) reported a fruit length of 41.0 ± 4.17 mm and a diameter of 31.1 ± 1.71 mm in strawberry (Fragaria x ananassa Duch.) fruits harvested three-quarters (75%) red. A range of 36.9 ± 1.4 mm – 38.8 ± 1.4 mm fruit length and 26.2 ± 1.1 mm – 29.5 ± 1.3 mm major diameter in ‘Albion’ strawberry cultivar during ripening were reported by Ornelas-Paz et al. (2013). Birania et al. (2022) reported length and major diameter (width) of 43.66 ± 3.53 mm and 31.81 ± 1.78 mm in medium size strawberries. On the other hand, Chaves et al. (2017) reported that the cv. Camino Real has a lower fruit diameter average of 24.8 ± 1.70 mm compared to the values observed in our study. Also, Muzzaffar et al. (2016) observed low average fruit length (26.77 ± 0.10 mm) and width (24.19 mm ± 0.01 mm) in fresh strawberries (cv. Chandler). Overall, the Camino Real strawberries collected in our trial exhibited good biometrical characteristics in all the biopesticide treatments harvested during any period.
2.3. Total Soluble Solid Content, pH, and Titratable Acidity
The soil-applied biopesticide treatments had a significant effect (p < 0.05) on the total solid soluble (TSS) content, pH, titratable acidity (TA), and TSS/TA ratio in the Camino Real strawberries harvested at different periods (Table 3 and Table 4). The T3 samples harvested in mid-April presented greater TSS (8.08 ± 0.214 °Brix) than the untreated control samples (UCtrl, T1). However, no significant differences (p > 0.05) were observed among the UCtrl, T2, T3, T4, T5, T6, T7 (positive control, +CTrl), T9, and T10 samples (Table 3).
The T2 samples (7.55± 0.115 °Brix) harvested in late-April exhibited the highest TSS as compared to the +CTrl samples. On the other hand, the T3 samples presented a lower TSS (6.04 ± 0.312 °Brix) in Camino Real strawberries harvested during mid-May when compared to the +CTrl and UCtrl samples (Table 4). Camargo et al. (2011) reported that the cultivar Camino Real produced fruits with higher TSS (7.96 °Brix) in a conventional system. In contrast, Chaves et al. (2017) and Zahid et al. (2022) indicated low TSS of 5.1 ± 0.40 and 4.93 ± 0.76 °Brix, respectively, in the Camino Real cultivar.
The TSS consists of polysaccharides and organic acids found in fruits, impacting their flavor and indicating ripeness (Al-Hilifi et al., 2024).
In comparison with the +Ctrl samples, lower pH was observed in the fruits of all treatments in the fruits harvested in mid-April, except in the T6 and T8 (Table 4). The T4 treatment exhibited the highest pH (3.83 ± 0.032) in the fruits harvested in late-April. In the Camino Real strawberries harvested during mid-May, no significant differences (p > 0.05) were noted in the pH among treatment samples and the +Ctrl samples (Table 5). Pelayo-Zaldívar et al. (2005) reported pH values of 3.6 ± 0.03, 3.7 ± 0.03, and 3.8 ± 0.03 in the strawberry cultivars Aroma, Diamante, and Selva, respectively, harvested in May. However, a higher pH (4.09 ± 0.14) has been reported in strawberry cv. Chandler (Zahid et al., 2022). The pH is an important indicator of fruit properties such as sourness and flavor (Schwieterman et al., 2014). The pH value increases as the fruit ripens and oxidizes over time (Al-Hilifi et al., 2024).
In this study, the ranges of the TA (% citric acid) were 0.65-0.79%, 0.58-0.88%, and 0.64-1.24% in Camino Real strawberries harvested in mid-April, late-April, and mid-May, respectively (Table 5). Camargo et al. (2011) determined the acidity of berries from Camino Real that was 0.94% in the conventional system. A percent of TA of 0.84 had been reported in the Chandler cultivar by Zahid et al. (2022). However, Pelayo-Zaldivar et al. (2005) reported TA values of 0.74, 0.87, and 075% in the cultivars Aroma, Diamante, and Selva, respectively, when the fruits were harvested in May. Depending on the cultivar and preharvest factors, TSS and TA in strawberries harvested at commercial ripeness varied from 5 to 12% and from 0.50 to 1.87%, respectively (Pelayo-Zaldívar et al., 2005). For an acceptable strawberry flavor, it is recommended to have a maximum of 0.8% TA and/or a minimum of 7% TSS (Pelayo et al., 2003). Overall, the Camino Real strawberries treated with the biopesticides, harvested during mid-April, late-April, or mid-May, exhibited acceptable flavor based on these recommended values of TA and TSS.
The TSS/TA ratio values ranged from 9.61-11.47 in Camino Real strawberries harvested mid-April (Table 4). The highest TSS/TA ratio was observed in T10 compared to the +Ctrl in fruits harvested mid-April. A lower TSS/TA ratio was observed in T2 (8.71 ± 0.385) compared to the +Ctrl in Camino Real strawberries harvested in late-April (Table 4). The results observed in this study were higher than those reported by others for Camino Real. Pinelli et al. (2011) and Chiomento et al. (2023) indicated TSS/TA ratio values of 8.4 ± 0.2 and 4.55 ± 1.04, respectively. The relationship between TSS and TA is crucial for assessing fruit quality. The flavor of the ripe strawberry is in part determined by the sugars and acids ratio (Pinelli et al., 2011; Liu et al., 2016). The TSS/TA ratio, as a measure of sweetness, is a good indicator of organoleptic evaluation for strawberries (Liu et al., 2016). Likewise, in this study, we observed an acceptable relationship between sugar and acidity, TSS/TA ratio based on Pelayo-Zaldívar et al., 2005.
2.4. Sugars and Organic Acids Contents in Strawberry
The soluble sugars, glucose, fructose, and sucrose were studied in Camino Real strawberry fruits. The soluble sugar contents, total sugars, sweetness indexes, and total sweetness indexes from the ten treatments are presented in Table 5 and Table 6. We found a significant difference (p < 0.05) on glucose and fructose contents in the harvested fruits when biopesticides were applied (Table 5). The highest glucose content was observed in T9 (1684 ± 52.87 mg/100 g) in the strawberries harvested in mid-April when compared to the +Ctrl or conventional pesticide. However, the highest fructose content was observed in T10 (2087 ± 78.78 mg/100 g) in strawberries harvested in mid-April.
No significant differences (p > 0.05) were observed in the glucose content in the fruits harvested during late-April when compared to the +Ctrl samples or conventional samples. Glucose concentrations were higher in T2 (2244 ± 66.30 mg/100 g) samples harvested in mid-May compared to +Ctrl samples (Table 5). Schwieterman et al. (2014) evaluated fresh strawberry (cv. Festival) harvested in winter and reported the contents of glucose, fructose, and sucrose were 1903, 2049, and 1218 mg/100 g in the early season 1 (week 2) and 1127, 1311, and 309 mg/100 g in the late season 1 (week 7). The authors noted that glucose, fructose, and sucrose represent the major soluble sugars present in strawberries (Schwieterman et al., 2014). The sucrose content in berries is lower than fructose and glucose contents (Okan et al., 2018). In this study, we observed the same trends of glucose, fructose, and sucrose levels in the berries as compared to the reported values (Okan et al., 2018; Schwieterman et al., 2014).
As shown in Table 6, total sugar (4472 ± 121.21 mg/100 g), sweetness index (7453 ± 210.90 mg/100 g), and total sweetness index (5127 ± 143.88 mg/100 g) were highest in T10 in Camino Real strawberries harvested in mid-April compared to the +Ctrl samples. In the Camino Real strawberries harvested in mid-May, no significant differences were noted in the total sugar, sweetness, and total sweetness indexes when compared to the +Ctrl samples. Total sugar contents of 5169 mg/100 g and 4490 mg/100 g have been reported in the cultivars Festival and Aromas, respectively (Schwieterman et al., 2014; Pelayo-Zaldívar et al., 2005). An average total sugar content of 5250 ± 80.00 mg/100 g was observed by Muzzaffar et al. (2016) in ripe strawberries (cv. Chandler).
One of the main parameters influencing the flavor of berries is the sugar content, which is considered an essential criterion to evaluate nutritive value and overall fruit quality. Sugar levels are affected by diverse factors including genetic factors, cultivation techniques, and preharvest conditions (Akšić et al., 2019). In general, the application of biopesticides in the soil did not adversely affect the soluble sugar or the total sugar contents of fresh strawberries in our experiments.
The results for organic acids contents (Table 7) demonstrate that the most abundant acid in Camino Real strawberries is citric acid which ranged from 0.58 ± 0.030 mg/100 g to 0.73 ± 0.030 mg/100 g in mid-April, 0.45 ± 0.017 mg/100 g to 0.69 ± 0.017 mg/100 g in late-April, and 0.57 ± 0.029 mg/100 g to 0.70 ± 0.029 mg/100 g in mid-May. The highest (p < 0.05) citric acid contents in our trial were observed in T10 (0.73 ± 0.030%) and T2 (0.65 ± 0.017%) in samples harvested during mid-April and mid-May, respectively. We also noted higher (p < 0.05) malic acid contents in T4 (0.14 ± 0.030%), T5 (0.14 ± 0.030%), T8 (0.15 ± 0.030%), T9 (0.16 ± 0.030%), and T10 (0.16 ± 0.030%) in samples harvested in mid-April. No effects (p > 0.05) were observed on the malic acid contents of the Camino Real strawberries harvested in mid-May comparing the biopesticide treatments and the +Ctrl treatment. (Table 7). Similar results for citric acid content were reported in Diamante (0.67 ± 0.03%) and Aromas (0.52 ± 0.03%) cultivars harvested in May by Pelayo-Zaldívar et al. (2005). However, these authors reported higher malic acid contents in Diamante (0.18 ± 0.02%) and Aromas (0.17 ± 0.02%) than those quantities observed in our study.
2.5. Firmness and Instrumental Color in Strawberry
Firmness is a major index for evaluating the quality of strawberry fruits and a desirable characteristic for consumers. Moreover, the fruit firmness is associated with resistance to transportation and storage.
In our study, we did not observe any negative impact on the firmness of Camino Real strawberries following biopesticide treatments compared to the +Ctrl treatment (Table 7). Statistically higher (p < 0.05) values of firmness were noted in T2 (3628 ± 201.65 g force), T3 (3391 ± 201.65 g force), and T4 (3514 ± 201.65 g force) in samples harvested in late-April compared to the +Ctrl samples.
The biopesticides treatments had a significant effect (p < 0.05) on the internal and external color parameters (Table 8 and Table 9). Compared to the +Ctrl samples, we observed a lower value of Chromai in T10 (38.51 ± 0.782) in samples harvested in late-April (Table 8). However, the lowest values of Huei were noted in T8 (52.31 ± 0.541) and T2 (55.92 ± 0.458) samples harvested in mid-April and mid-May, respectively, while the highest Huei value was observed in T5 (57.62 ± 0.344) in Camino Real strawberry samples harvested in late-April (Table 8).
For the surface or external color parameters, lower values of Lightnesse were found in T3 (21.98 ± 0.331) and T4 (21.79 ± 0.331) for Camino Real strawberries harvested in mid-April compared to the +Ctrl samples (Table 9). Slightly darker colors were also noted in T8 (19.83 ± 0.454) for Camino Real strawberries harvested in mid-May indicating that the fruits in these treatments developed a slightly darker color. We also noted the lower value of Chromae (17.32 ± 0.611) and the highest value of Huee (73.66 ± 0.607) in T5 strawberries harvested during mid-April (Table 9). In fruits harvested in mid-May, we observed lower Chromae values in T3 (19.02 ± 0.704) and T8 (18.76 ± 0.704) compared to the +Ctrl treatment (Table 9). We speculated that the effects observed for some of the biopesticide treatments could be associated with factors such as chemical composition (anthocyanins and sugar contents), harvest time, and application frequency. These results are different from those of Ornelas-Paz (2013) who reported higher values of surface (external) color parameters L* (50.4 ± 1.1), Chroma (31.7 ± 1.1), and Hue (45.8 ± 2.6) in organic Albion strawberry cultivar (harvested with 75% red). These authors observed low Hue values (18.2 ± 0.6) in strawberries harvested in dark red. The authors noted that this value fell into the reddest region of the chromaticity diagram, suggesting that the fruit in this stage was considerably rich in red pigments. Capocasa et al. (2008) also reported higher L* (32.9 ± 0.4) and Chroma (42.0 ± 0.6) values on the color surface in the Camarosa cultivar than those observed in our study. In addition, Pelayo-Zaldívar et al. (2005) reported high L* (33.2 ± 0.84) and Chroma (36.6 ± 1.05) values and low Hue (29.1 ± 1.13) values in the Aromas cultivar.
In general, the biocontrol and organic products in the soil did not adversely affect the internal and external color of Camino Real strawberry. The strawberry fruit color is an important attribute for consumer product acceptance and/or preferences.
Future research may include optimizing the application of biopesticides across various strawberry varieties and production systems. Additionally, evaluating the effects of these biopesticides on yield, quality, and nutritional values of postharvest strawberries will be essential for improving agricultural practices.
3. Materials and Methods
3.1. Chemical and Reagents
The biopesticides used in this study were obtained from various commercial sources. Phenolphthalein, ethanol, and sodium hydroxide (NaOH) were purchased from Sigma-Aldrich (St. Louis, MO, USA). Orion buffer solutions (pH 4 and 7) were purchased from Thermo Fisher Scientific (Pittsburgh, PA, USA). Biochemical kits to quantify sucrose/D-glucose/D-fructose, citric acid, and L-malic acid (CAT# 10-716-260-035, CAT# 10-139-076-035, and CAT# 10-139-068-035) were obtained from R-Biopharm (Darmstadt, Germany). All chemicals were of analytical reagent grade and all solutions were prepared with deionized water that was obtained by passing distilled water over a mixed bed of a cation-anion exchange.
3.2. Soil Characteristics and Climatic Conditions of Study Site
The strawberry experiment was conducted at the Prairie View A&M University Research Farm (Longitude 30.080400, Latitude -95.990930) from October 2018 to May 2019. The soil at the site is classified as sandy loam soil (Fine-loamy, siliceous, semiactive, hyperthermic Oxyaquic Paleudalfs). The soil properties at the beginning of the experiment are as follows: pH 7.1, EC 1149 umho/cm, nitrate-N 200 ppm, phosphorus 195 ppm, potassium 312 ppm, calcium 2,498 ppm, magnesium 174 ppm and sulfur 157 ppm. Climatic conditions during the growing season are summarized in Table 1. Monthly precipitation for the growing season ranged from 14.98 mm (in October 2018) to highs of 250 mm (in May 2019). Seventeen precipitation events occurred in February 2019 and was the highest during the growing season. On the other hand, the highest temperature, relative humidity, and wind speed during the growing season were all recorded in May 2019 (Table 10).
3.3. Planting Material and Experimental Design
The variety Camino Real was planted on October 19, 2018, using bare roots. Twenty (20) bare roots were planted 0.3 meters apart per plot on raised beds covered with black plastic mulch lined with drip tape for irrigation. The ten soil-applied biopesticides (Table 1) used were arranged in a completely randomized design with three replications per treatment. Timing of applications and rates used are also presented in Table 1. Water was used as the untreated control (UCtrl) to receive the same degree of wetness during pesticide application. Conventional pesticides (Ridomil Gold + Abound FL0) were used as a control positive (+Ctrl). The crop received approximately 2.54 cm of water including rainfall per week. Fertilizer application was based on soil test recommendations. Nutrient requirements were met through fertigation using water potassium nitrate (13-0-46). While weeds immediately around strawberry plants were pulled by hand, those between rows were managed through a tractor-driven rotary tiller.
3.4. Strawberry Harvesting and Sampling
The strawberry fruits were harvested by hand when at least 75% ripe, every three days in the morning hours. The photographs of strawberry plants and harvested fruits are shown in Figure 1 A and B. The harvested fruits were sorted into marketable and culled categories, then counted and weighed. Strawberries used for the quality analyses were subsampled from marketable fruits. The strawberry fruits used for this study were harvested on April 16 (mid-April), April 30 (late-April), and May 17 (mid-May) in 2019 and immediately transported to the laboratory while maintaining the cold chain (≤4 °C). The samples were visually inspected, and damaged strawberries were removed to ensure uniformity in color and size. Strawberry fruits (approximately 800 g of fruit) per treatment from each harvesting time were placed in refrigerated storage (4 °C) and subsampled (400 g) for fresh analysis within 1-3 days of receipt, except for the determination of biometrical characteristics, pH, titratable acidity (TA), total soluble solids (TSS), color (L*, a*, and b*), and firmness. Another set of subsampled strawberry fruits (400 g) were stored at –80 °C for later biochemical analysis such as sugars (glucose, fructose, and sucrose) and organic acids (citric and malic acids).
3.5. Determination of Biometrical Characteristics
Biometrical characteristics and visual shapes were immediately evaluated on 5 berry samples per treatment from each harvesting time. Fruits were washed and dried with paper towels, and the sepals were removed. Length and major diameter (mm) of the fruits were measured using a Digimatic caliper (Mitutoyo, Japan).
3.6. Determination of pH, Titratable Acidity, and Total Soluble Solids
To determine pH, TA, and TSS of samples, three replicates of strawberry juices were used in this study. Strawberry samples were homogenized in a blender (Model WF2211314, Waring Laboratory Science, Torrington, CT, USA) to obtain the fruit juice. The TSS was determined by a direct reading at room temperature (~22 °C) using a refractometer (Model 300010; Sper Scientific Ltd., Scottsdale, Arizona, USA). The refractometer was calibrated using deionized water and the results were reported in °Brix.
The TA in the fresh strawberry samples was determined according to the method of Perez Cayo et al. (2016). Briefly, the strawberry juice was centrifuged (Avanti J-E centrifuge, Beckman Coulter Inc., Indianapolis, IN, USA) at 12,000 rpm for 20 min. An aliquot (6 g) was diluted with 50 mL of deionized water. The mixture was titrated with standardized 0.1 N NaOH until the first color change, which signals the endpoint (at pH 8.1-8.3 endpoint), persisted for 30 s. Phenolphthalein (1% w/v in 95% ethanol) was used as an indicator. The results were reported in percentage of citric acid. The pH of the samples was measured using a benchtop pH meter (Accumet AE150, Fisher Scientific, USA) at 25 °C. The pH meter was calibrated with reference buffers (4.00 and 7.00; Orion buffer solutions; Thermo Fisher Scientific, Pittsburgh, PA, USA). The ratio of total soluble solids to titratable acidity (TSS/TA) was also calculated.
3.7. Determination of Color and Firmness
The firmness of randomly selected fruits was measured using a TA.XT.plus Texture Analyzer (Texture Technologies Corp., Hamilton, MA, USA) fitted with a 5 kg load cell and controlled by a computer. The whole strawberries were cut in half to improve how they packed into the 13-tine Multiple Puncture Rig (TA-65). Approximately 185 g of samples were used, and the test was conducted using the return to start test in Compression with the following settings: pre-test speed of 10 mm/s, test speed of 5 mm/s; and post-test speed 5 mm/s. The puncture rig tines traveled 90% through the container according to the procedure of Texture Technologies Corp (Texture Technologies Corp., 2018), and the results of firmness were reported in Newtons.
On each strawberry fruit, external (on opposing shoulder) and internal (adjacent to the central cavity) color parameters were determined by reflectance using a HunterLab colorimeter (ColorFlex Spectrophotometer, Hunter Associates Laboratory, Inc., Reston, VA). The colorimeter was calibrated using a white tile with D65/10° Illuminant/observer and 8 mm aperture size, to estimate strawberries color space: Lightness (L*), Chroma (Chroma = [(a*)2 + (b*)2]1/2) and Hue angle (Hue = tan1 [b*/a*]. The lightness value determines whether a sample is bright (high L*) or dark (low L*). The Chroma value indicates color saturation or intensity, and Hue value was determined as a color wheel, with red-purple color at 0°, yellow color at 90°, bluish-green color at 180°, and blue color at 270° (McGuire, 1992). The external and internal color of each sample were determined at room temperature (~22 °C) at each harvested period.
3.8. Quantification of Sugars and Organic Acids
The quantifications of sucrose/D-glucose/D-fructose, citric acid, and L-malic acid were determined according to the procedure of Schwieterman et al (2014) using biochemical kits (per manufacturer’s instructions). The absorbance of samples was measured at 365 nm using a Spectramax Max Plus spectrophotometer (Molecular Devices, Sunnyvale, CA, USA). The sugars and organic acids concentrations were reported as mg/100 g.
The Sweetness Index (SI) content and Total Sweetness Index (TSI) were calculated to determine the sweetness perception of fruits using the following formulas (Akšić et al., 2019):
SI=(1.00×[glucose])+(2.30×[fructose])+(1.35×[sucrose])
TSI=(1.00×[sucrose])+(0.76×[glucose])+1.50×[fructose])
3.9. Statistical Analysis
Experimental data were analyzed using the PROC Mixed model procedure of SAS (version 9.4, SAS Institute Inc., Cary, NC, USA). Analysis of variance (ANOVA) were performed with biopesticide treatment, harvest date, and biopesticide treatment x harvest date interaction. The data were analyzed separately by harvest day because of two-way interaction was significant (p ˂ 0.05). Thus, the effect of biopesticides treatments on physicochemical characteristics of strawberry fruit was carried out by one-way analysis of variance and Least Significant Difference (LSD) post hoc test was used (p ˂ 0.05). The physicochemical determinations in the samples were performed in triplicate.
4. Conclusions
The quality attributes of fruits such as strawberries are important not only for the producers, but also for the consumers. The effects of the soil-applied biopesticide treatments on strawberry yield varied. The results of strawberry yield suggest that if biopesticides are applied at the right time and frequency, they have the potential to perform at similar levels to their conventional counterparts. This is important because consumers are increasingly interested in safe produce with less chemical residues. More so, the premium price opportunities for organic producers make the use of biopesticides attractive. This study demonstrated that the selected commercially available soil-applied biopesticides showed no negative effects on yield and fruit quality and thus they could serve as alternatives to conventional products used. Further research and field trials are necessary to optimize the application of biopesticides in different varieties and agricultural systems and then evaluate their effects on yield and the quality and nutritional values of postharvest fresh strawberries.
Author Contributions
Conceptualization, P.A.Y.A. and M.T.N.G.; methodology, P.A.Y.A., M.T.N.G.; formal analysis, M.T.N.G., S.W., and E.O.; investigation, M.T.N.G.; resources, M.T.N.G. and P.A.Y.A.; statistical analysis, Y.J.; interpretation of data and writing—original draft preparation, M.T.N.G. and P.A.Y.A.; writing—review and editing, P.A.Y.A., M.T.N.G., R.A., A.M-G., and R.W.; visualization, E.O.; supervision, M.T.N.G. and P.A.Y.A.; project administration, P.A.Y.A.; funding acquisition, P.A.YA. and R.W. All authors have read and agreed to the published version of the manuscript.
Funding
This research was funded by Sustainable Agriculture Research and Education (SARE) Project Number LS16-275 and USDA-NIFA Evans-Allen funding to the Cooperative Agricultural Research Center of the College of Agriculture, Food and Natural Resources at Prairie View A&M University.
Data Availability Statement
The data presented in this study are available from the corresponding authors upon reasonable request.
Conflicts of Interest
The authors declare no conflicts of interest. The funders had no role in the design of the study; in the collection, analyses, or interpretation of data; in the writing of the manuscript; or in the decision to publish the results.
References
- Milosavljević, D.M.; Maksimović, V.M.; Milivojević, J.M.; Nakarada, Đ.J.; Dragišić Maksimović, J.J. Rich in phenolics-strong antioxidant fruit? Comparative study of 25 strawberry cultivars. Plants 2022, 11, 3566. [Google Scholar] [CrossRef] [PubMed]
- Afrin, S.; Gasparrini, M.; Forbes-Hernandez, T.Y.; Reboredo-Rodriguez, P.; Mezzetti, B.; Varela-López, A.; Giampieri, F.; Battino, M. Promising health benefits of the strawberry: A focus on clinical studies. J. Agric. Food Chem. 2016, 64, 4435–4449. [Google Scholar] [CrossRef] [PubMed]
- Ornelas-Paz, J.deJ.; Yahia, E.M.; Ramírez-Bustamante, N.; Pérez-Martínez, J.D.; Escalante-Minakata, M.DelP.; Ibarra-Junquera, V.; Acosta-Muñiz, C.; Guerrero-Prieto, V.; Ochoa-Reyes, E. Physical attributes and chemical composition of organic strawberry fruit (Fragaria x ananassa Duch, Cv. Albion) at six stages of ripening. Food Chem. 2013; 138, 372–381. [Google Scholar] [CrossRef]
- Samtani, J.B.; Rom, C.R.; Friedrich, H.; Fennimore, S.A.; Finn, C.E.; Petran, A.; Wallace, R.W.; Pritts, M.P.; Fernandez, G.; Chase, C.A; Kubota, C.; Bergefurd, B. The status and future of the strawberry industry in the United States. HortTechnology 2019, 29, 11–24. [Google Scholar] [CrossRef]
- Sójka, M.; Miszczak, A.; Sikorski, P.; Zagibajło, K.; Karlińska, E.; Kosmala, M. Pesticide residue levels in strawberry processing by-products that are rich in ellagitannins and an assessment of their dietary risk to consumers. NFS Journal. 2015, 1, 31–37. [Google Scholar] [CrossRef]
- Wippich Andrade, C.A.; Almeida Miguel, A.C.; Spricigo, P.C.; Dos Santos Dias, C.T.; Jacomino, A.P. Comparison of quality between organic and conventional strawberries from multiple farms. Rev. Bras. Frutic. 2016, 39, e–045. [Google Scholar] [CrossRef]
- Wysocki, K.; Banaszkiewicz, T. The effect of selected fungicides on the chemical composition of strawberry fruits and contamination with dithiocarbamate residues. Folia Hort. 2014, 26, 125–132. [Google Scholar] [CrossRef]
- EPA. Ingredients Used in Pesticide Products. 2023. Available online: https://www.epa.gov/ingredients-used-pesticide-products/what-are-biopesticides (accessed on 2 October 2024).
- Maggio, A.; De Pascale, S.; Paradiso, R.; Barbieri, G. Quality and nutritional value of vegetables from organic and conventional farming. HortScience 2013, 164, 532–539. [Google Scholar] [CrossRef]
- Birania, S.; Attkan, A.K.; Kumar, S.; Kumar, N.; Sing, V.K. Mass modeling of strawberry (Fragaria x ananasa) based on selected physical attributes. J. Food Process Eng. 2022, 45, e14023. [Google Scholar] [CrossRef]
- Prasad, R.; Lisiecka, J.; Raj, K. Strawberry- More than a popular summer fruit: A Mini-review. Adv. Nutri. Food Sci 2022, ANAFS-230, 1–5. [Google Scholar] [CrossRef]
- Pruitt, K. B. An Evaluation of Biopesticide Combinations on Yield Performance and Disease/Arthropod Control of Strawberries Grown in High Tunnel Plasticulture Production Systems in Arkansas. (2020). MS Thesis, University of Arkansas, Fayetteville, AR, 2020. Graduate Theses and Dissertations Retrieved from https://scholarworks.uark.edu/etd/3628.
- Basak, J.K.; Madhavi, B.G.K.; Paudel, B.; Kim, N.E.; Kim, H.T. Prediction of total soluble solids and pH of strawberry fruits using RGB, HSV and HSL colour spaces and machine learning models. Foods 2022, 11, 2086. [Google Scholar] [CrossRef]
- Chaves, V.C.; Calvete, E.; Reginatto, F.H. Quality properties and antioxidant activity of seven strawberry (Fragaria x ananassa duch) cultivars. Sci. Hort. 2017, 225, 293–298. [Google Scholar] [CrossRef]
- Muzzafar, S.; Jan, R.; Wani, I.A.; Masoodi, F.A.; Munaff Bhat, M.; Wani, T.A.; Wani, G.R.; Yildiz, F. Effect of preservation methods and storage period on the chemical composition and sensory properties of strawberry crush. Cogent Food Agric. 2016, 2, 1–11. [Google Scholar] [CrossRef]
- Camargo, L.K.P.; Resende, J.T.V.; Tominaga, T.T.; Kurchaidt, S.M.; Camargo, C.K.; Figueiredo, A.S.T. Postharvest quality of strawberry fruits produced in organic and conventional systems. Hortic. Bras. 2011, 29, 577–583. [Google Scholar]
- Zahid, N.; Maqbool, M.; Tahir, M.M.; Horvitz, S. Hamid, A.; Khalid, M.S.; Ejaz, S.; Jawad, R.; Awan, S.I.; Rehman, A.; Ali, A. Influence of organic and inorganic fertilizer regimes on growth Patterns and antioxidants capacity of strawberry (Fragaria × Ananassa Duch.) cv. Chandler. J. Food Qual 2022, 2022, 618854. [Google Scholar] [CrossRef]
- Al-Hilifi, S.A.; Al-Ali, R.M.; Dinh, L.N.M; Yao, Y.; Agarwal, V. Development of hyaluronic acid based polysaccharide-protein composite edible coatings for preservation of strawberry fruit. Int. J. Biol. Macromol. 2024, 259, 128932. [Google Scholar] [CrossRef]
- Pelayo-Zaldívar, C.; Ebeler, S.E.; Kader, A.A. Cultivar and harvest date effects on flavor and other quality attributes of California strawberries. J. Food Qual. 2005, 28, 78–97. [Google Scholar] [CrossRef]
- Pelayo, C.; Ebeler, S.E.; Kader, A.A. Postharvest life and flavor quality of three strawberry cultivars kept at 5 °C in air or air+20 kPA CO2. Postharvest Biol. Technol. 2003, 27, 171–183. [Google Scholar] [CrossRef]
- Pineli, L.L.O.; Moretti, C.L.; dos Santos, M.S.; Campos, A.B.; Brasiliero, A.V.; Córdova, A.C.; Chiarello, M.D. Antioxidants and other chemical and physical characteristics of two strawberry cultivars at different ripeness stages. J. Food Compos. Anal. 2011, 24, 11–16. [Google Scholar] [CrossRef]
- Chiomento, J.L.T.; De Nardi, F.S.; Kujawa, S.C.; dos Santos Deggerone, Y. Fante, R.; Kaspary, I.J.; Dornelles, A.G.; Huzar-Novakowiski, J.; dos Santos Trentin, T. Multivariate contrasts of seven strawberry cultivars in soilless cultivation and greenhouse in southern Brazil. Adv. Chemicobiol. Res. 2023, 2, 62–76. [Google Scholar] [CrossRef]
- Liu, L.; Ji, M.-L.; Chen, M.; Sun, M-Y.; Fu, X-L.; Li, L.; Gao, D-S.; Zhu, C-Y. The flavor and nutritional characteristic of four strawberry varieties cultured in soilless system. Food Sci. Nutr. 2016, 4, 858–868. [Google Scholar] [CrossRef]
- Schwieterman, M.L.; Colquhoun, T.A.; Jaworski, E.A.; Bartoshuk, L.M.; Gilbert, J.L.; Tieman, D.M.; Odabasi, A.Z.; Moskowitz, H.R.; Folta, K.M.; Klee, H.J.; Sims, C.A.; Whitaker, V.M.; Clark, D.G. Strawberry flavor: Diverse chemical compositions, a seasonal influence, and effects on sensory perception. PLoS ONE 2014, 9, e88446. [Google Scholar] [CrossRef] [PubMed]
- Okan, O.T.; Deniz, I.; Yayli, N.; Sat, I.G.; Öz, M.; Hatipoğlu Serdar, G. Antioxidant activity, sugar content and phenolic profiling of blueberries cultivars: A comprehensive comparison. Not. Bot. Horti Agrobo. 2018, 46, 639–652. [Google Scholar] [CrossRef]
- Akšić, M.F.; Tosti, T.; Sredojević, M.; Milivojević, J; Meland, M; Natić, M. Comparison of sugar profile between leaves and fruits of blueberry and strawberry cultivars grown in organic and integrated production system. Plants 2019, 8, 205. [Google Scholar] [CrossRef] [PubMed]
- Capocasa, F.; Scalzo, J.; Mezzetti, B.; Battino, M. Combining quality and antioxidant attributes in the strawberry: The role of genotype. Food Chem. 2008, 111, 872–878. [Google Scholar] [CrossRef]
- Perez Cayo, Y; Sargent, S.; do Nascimiento Nunes, C.; Whitaker, V. Composition of commercial strawberry cultivars and advanced selections as affected by season, harvest, and postharvest storage. HortScience 2016, 51, 1134–1143. [Google Scholar] [CrossRef]
- Texture Technologies Corp. TA.XTPlus texture analyzer study: Fresh strawberry firmness. 2018. Available online: https://texturetechnologies.com/application-studies/strawberries (accessed on 19 July 2018).
- McGuire, R.G. Reporting of objective color measurements. HortScience 1992, 27, 1254–1255. [Google Scholar] [CrossRef]
Figure 1.
Photographs of Camino Real strawberry plants (A) and harvested fruits (B).
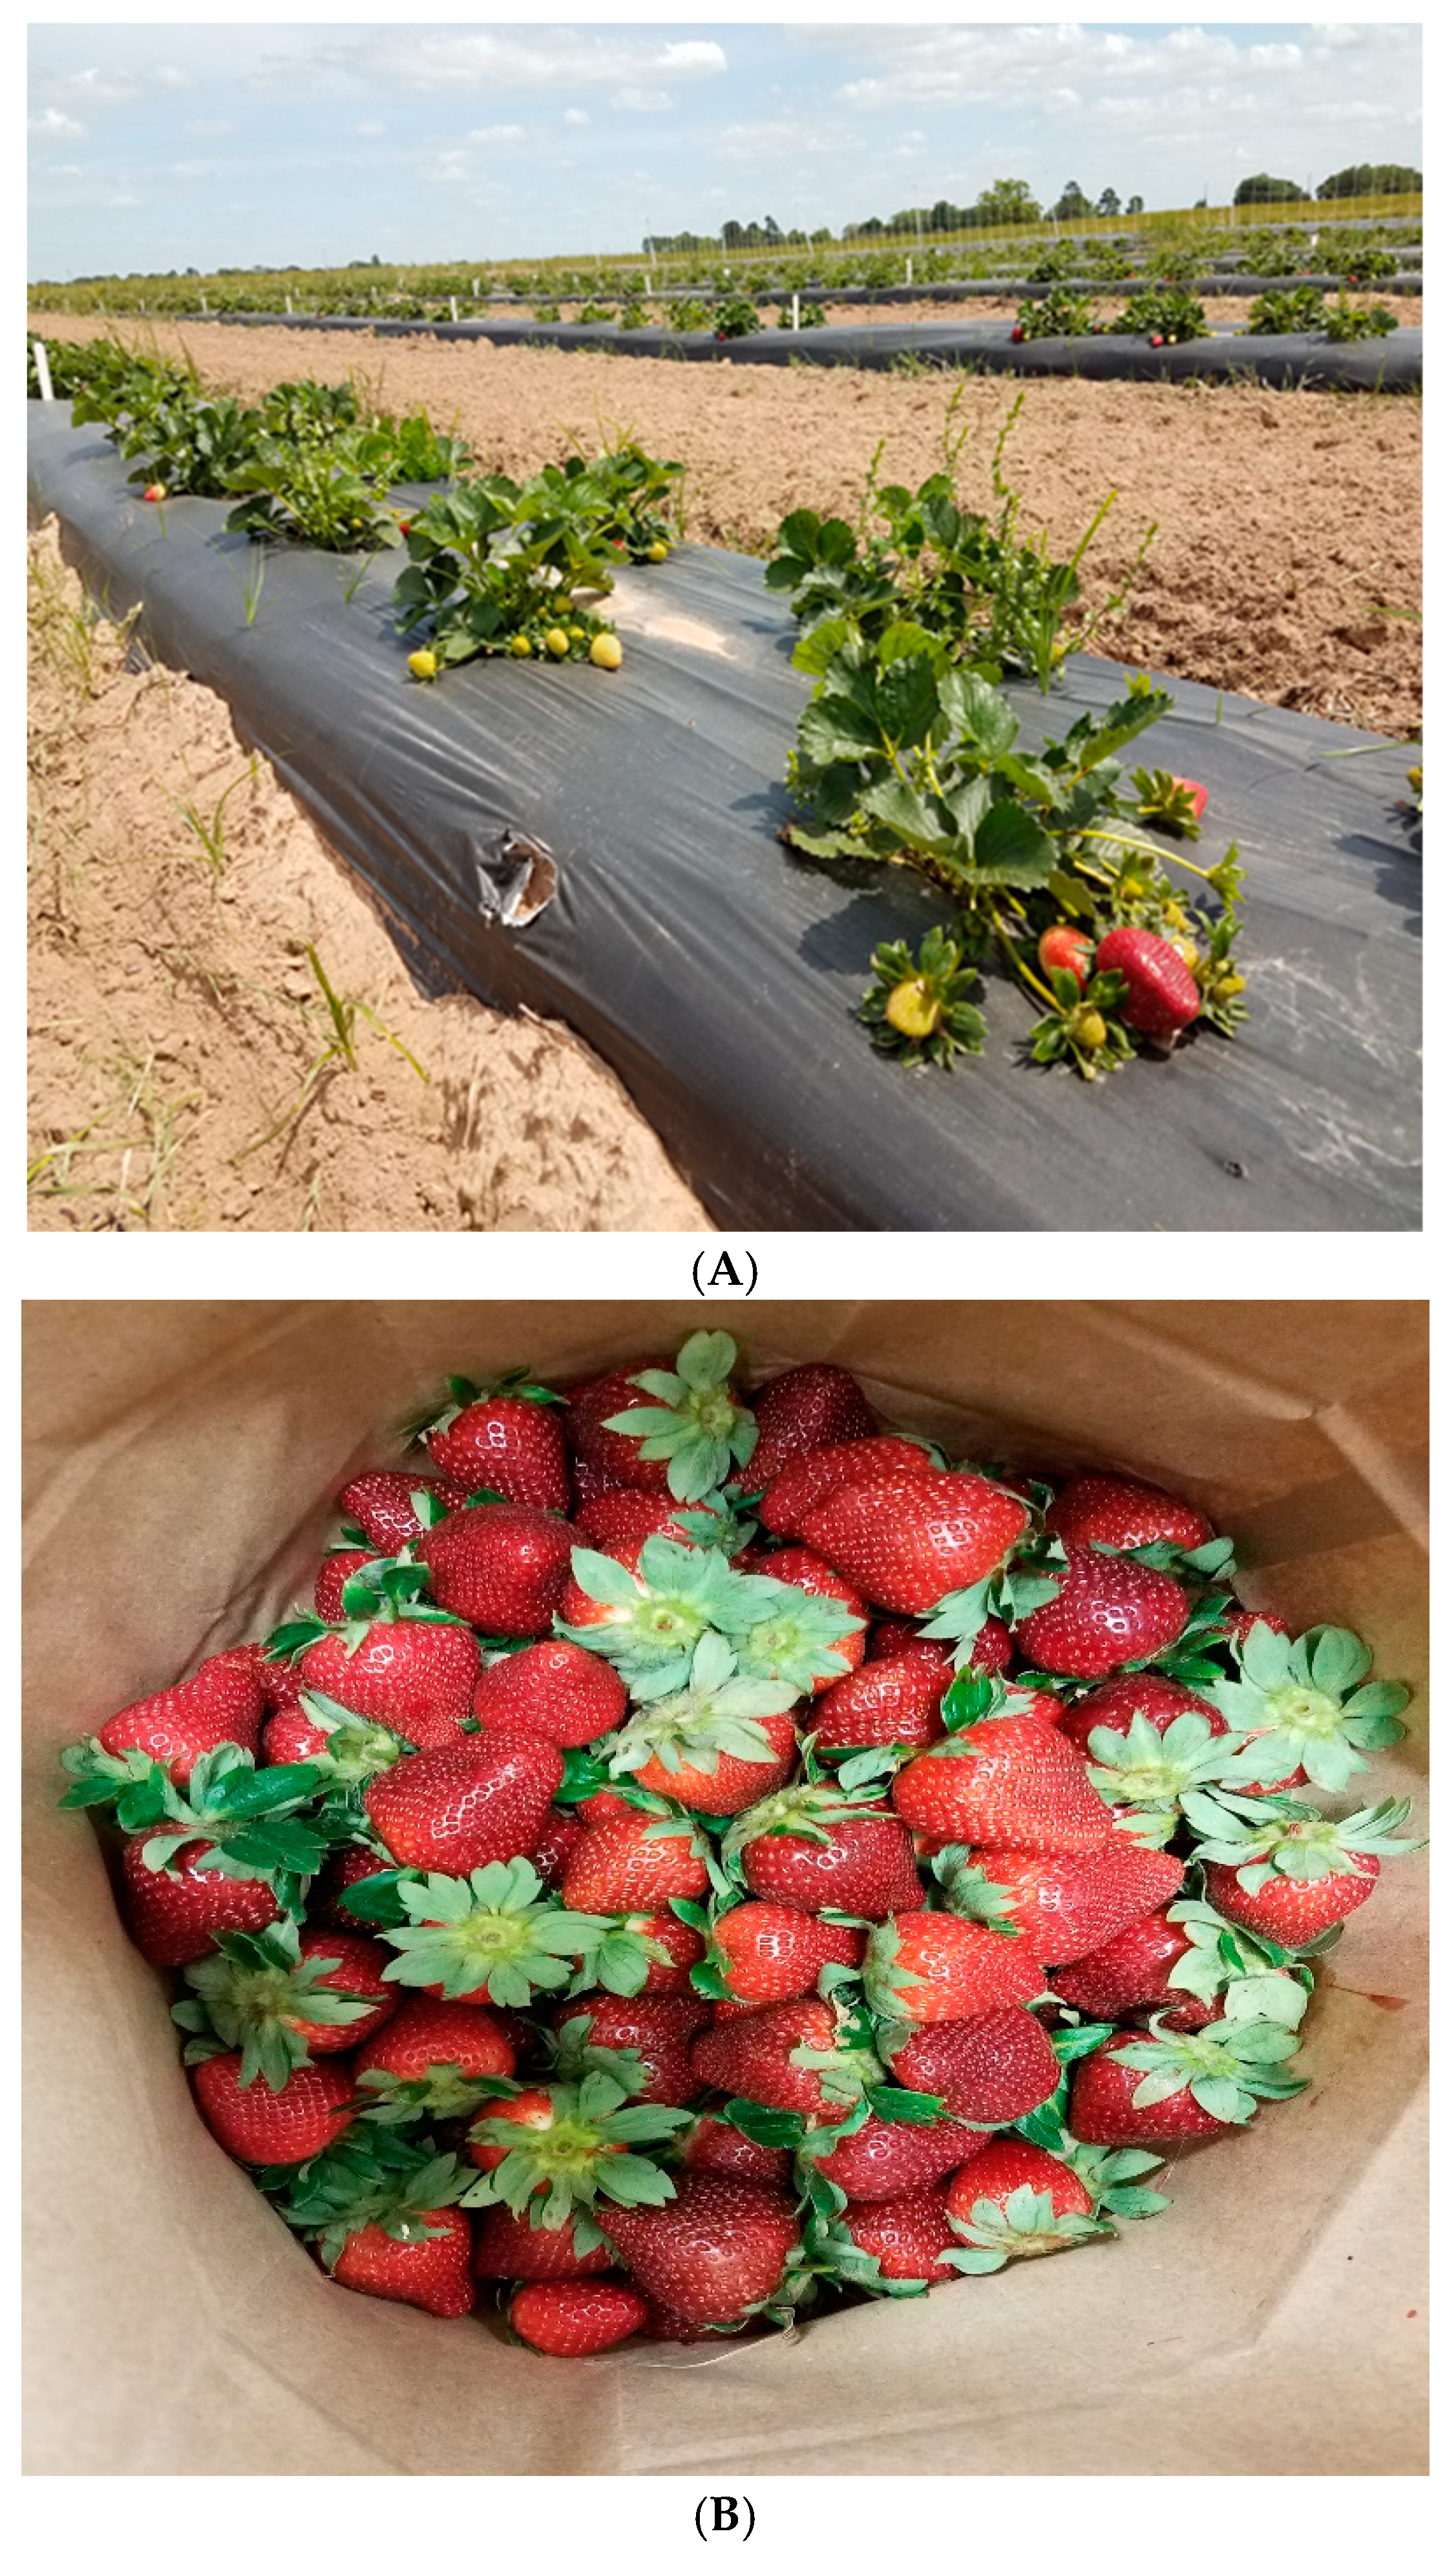

Table 1.
Soil-applied biopesticides used, their actvie ingredients, application timing and rates.
| Treatment | Biopesticide | Active Ingredient | Product Rate/ha (via irrigation) |
Application Timing |
|---|---|---|---|---|
| T1 (UCtrl)† | Untreated | - | - | - |
| T2 | RootShield Plus | Trichoderma harzianum + T. virens | 0.585 L/100 gallons | ‡‡T + 22 wks + 16 wks |
| T3 | RootShield Plus | Trichoderma harzianum + T. virens | 0.585 L/100 gallons | T + 4 wks + 8 wks + 12 wks + 16 wks + 20 wks |
| T4 | Regalia | Extract of Reynoutria sachalinensis | 5.844 L†† | T+ 4 wks + 8 wks + 12 wks + 16 wks + 20 wks |
| T5 | Double Nickel | Bacillus amyloliquefaciens strain D747 | 2.337 L | T+ 4 wks + 8 wks + 12 wks + 16 wks + 20 wks |
| T6 | Actinovate | Streptomycens lydicus WYEC 108 | 0.263 L | T+ 4 wks + 8 wks + 12 wks + 16 wks + 20 wks |
| T7 (+Ctrl)‡ | Ridomil Gold + Abound FL | Azoxystrobin + Mefenoxam | 1.168 L | T+ 8 wks + 16 wks |
| T8 | Regalia | Extract of Reynoutria sachalinensis | 5.844 L | T+ 8 wks + 16 wks |
| T9 | Double Nickel | Bacillus amyloliquefaciens strain D747 | 2.337 L | T+ 8 wks + 16 wks |
| T10 | Actinovate | Streptomycens lydicus WYEC 108 | 0.263 L | T+ 8 wks + 16 wks |
†UCtrl = Untreated Control; ‡+Ctrl = Conventional or positive control; ††T = Time of transplanting; wks = weeks; ‡‡L = Liters.
Table 2.
Marketable fruit yield for the soil-applied biopesticide treatments.
| Treatment | Biopesticide | Marketable Fruit Number/Plot | Marketable Fruit Weight/Plot (g) |
|---|---|---|---|
| T1 (UCtrl)† | Untreated Control | 87.00cd | 1802.30bc |
| T2 | RootShield Plus | 82.00d | 1602.50c |
| T3 | RootShield Plus | 116.70abcd | 2506.10ab |
| T4 | Regalia | 97.00cd | 2012.43bc |
| T5 | Double Nickel | 122.70abc | 2564.40ab |
| T6 | Actinovate | 99.00bcd | 1889.83bc |
| T7 (+Ctrl)‡ | Ridomil Gold + Abound FL | 148.33a | 3061.60a |
| T8 | Regalia | 142.70a | 2916.53a |
| T9 | Double Nickel | 150.33a | 3118.03a |
| T10 | Actinovate | 135.33ab | 2827.03a |
| p-value | 0.0050 | 0.0022 |
†UCtrl = Untreated Control; ‡+Ctrl = Conventional or positive control. Values represent the least squares means and their standard errors (SE). Means in the same column within each application treatment with different lowercase superscripts are significantly different (p ˂ 0.05).
Table 3.
Effect of soil-applied biopesticide treatments on fruit size and total soluble solids of fresh strawberries.
Table 3.
Effect of soil-applied biopesticide treatments on fruit size and total soluble solids of fresh strawberries.
| Fruit Length (mm) | Fruit Major Diameter (mm) | Total Soluble Solids (°Brix) | |||||||||
|---|---|---|---|---|---|---|---|---|---|---|---|
| Treatment | Mid-April | Late-April | Mid-May | Mid-April | Late-April | Mid-May | Mid-April | Late-April | Mid-May | ||
| T1 (UCtrl)† | 41.6 | 35.8b | 26.4 | 39.1 | 35.3 | 28.0 | 7.07bc | 7.67a | 8.50a | ||
| T2 | 40.8 | 36.4b | 28.6 | 34.6 | 33.6 | 28.8 | 7.43ab | 7.55a | 7.50ab | ||
| T3 | 44.7 | 37.2b | 32.0 | 38.3 | 33.5 | 33.0 | 8.08a | 6.83b | 6.04b | ||
| T4 | 40.6 | 39.1ab | 32.2 | 32.9 | 34.9 | 31.8 | 7.60ab | 6.83b | 8.00a | ||
| T5 | 41.8 | 39.1ab | 31.9 | 35.7 | 36.1 | 32.8 | 7.27abc | 6.77b | 7.70a | ||
| T6 | 43.2 | 42.1a | 31.6 | 38.2 | 35.3 | 31.3 | 7.50ab | 7.27ab | 8.00a | ||
| T7 (+Ctrl)‡ | 41.7 | 38.3ab | 31.2 | 35.8 | 34.7 | 30.1 | 7.47ab | 6.80b | 7.92a | ||
| T8 | 40.2 | 38.8ab | 31.7 | 34.7 | 35.2 | 30.9 | 6.32c | 6.93b | 7.92a | ||
| T9 | 40.4 | 36.2b | 32.0 | 36.0 | 34.9 | 31.7 | 7.87ab | 6.93b | 7.20ab | ||
| T10 | 41.5 | 36.6b | 28.2 | 35.4 | 33.5 | 30.2 | 7.55ab | 6.93b | 8.30a | ||
| SE | 1.40 | 0.93 | 1.38 | 1.44 | 1.11 | 1.28 | 0.214 | 0.115 | 0.312 | ||
| p-value | 0.410 | 0.0005 | 0.050 | 0.064 | 0.724 | 0.189 | <0.0001 | <0.0001 | 0.0004 | ||
†UCtrl = Untreated Control; ‡+Ctrl = Conventional or positive control. Values represent the least squares means and their standard errors (SE). Means in the same column within each application treatment with different lowercase superscripts are significantly different (p ˂ 0.05).
Table 4.
Effect of soil-applied biopesticide treatments on pH, titratable acidity, and total soluble solids/titratable acidity ratio of fresh strawberries.
Table 4.
Effect of soil-applied biopesticide treatments on pH, titratable acidity, and total soluble solids/titratable acidity ratio of fresh strawberries.
| Treatment | pH | TA (%) | TSS/TA | ||||||||
|---|---|---|---|---|---|---|---|---|---|---|---|
| Mid-April | Late-April | Mid-May | Mid-April | Late-April | Mid-May | Mid-April | Late-April | Mid-May | |||
| T1 (UCtrl)† | 3.35cde | 3.36d | 3.79ab | 0.65c | 0.83a | 0.88 | 10.95ab | 9.34cd | 9.89b | ||
| T2 | 3.37cd | 3.74ab | 3.55abc | 0.67c | 0.88a | 0.80 | 11.15a | 8.71d | 9.85b | ||
| T3 | 3.39bc | 3.75ab | 3.69abc | 0.79a | 0.62b | 1.10 | 10.21ab | 11.03abc | 9.59b | ||
| T4 | 3.33cde | 3.83a | 3.72abc | 0.71b | 0.65b | 0.70 | 10.78ab | 10.56bc | 11.50a | ||
| T5 | 3.30de | 3.68bc | 3.85a | 0.72abc | 0.61b | 0.64 | 10.16ab | 11.11abc | 12.07a | ||
| T6 | 3.50a | 3.70ab | 3.54abc | 0.68c | 0.58b | 1.10 | 10.95ab | 12.68a | 12.35a | ||
| T7 (+Ctrl)‡ | 3.51a | 3.66bc | 3.53abc | 0.77ab | 0.59b | 0.75 | 9.61b | 11.52ab | 10.72ab | ||
| T8 | 3.46ab | 3.71ab | 3.42bc | 0.65c | 0.60b | 1.21 | 9.64b | 11.58ab | 10.04ab | ||
| T9 | 3.34cde | 3.69abc | 3.52abc | 0.72ab | 0.60b | 0.80 | 11.00ab | 11.72ab | 8.95b | ||
| T10 | 3.27e | 3.55bc | 3.34c | 0.66c | 0.61b | 1.24 | 11.47a | 11.49ab | 8.94b | ||
| SE | 0.018 | 0.032 | 0.091 | 0.018 | 0.027 | 0.258 | 0.319 | 0.385 | 0.748 | ||
| p-value | <0.0001 | <0.0001 | 0.004 | <0.0001 | <0.0001 | 0.686 | 0.001 | <0.0001 | 0.014 | ||
†UCtrl = Untreated Control; ‡+Ctrl = Conventional or positive control. Values represent the least squares means and their standard errors (SE). TA = Titratable acidity (% as citric acid equivalent); TSS = Total soluble solids (Brix). Means in the same column within each application treatment with different lowercase superscripts are significantly different (p ˂ 0.05).
Table 5.
Effect of soil-applied biopesticide treatments on sugar content of fresh strawberries.
| Treatment | Glucose (mg/100 g) | Fructose (mg/100 g) | Sucrose (mg/100 g) | ||||||||
|---|---|---|---|---|---|---|---|---|---|---|---|
| Mid-April | Late-April | Mid-May | Mid-April | Late-April | Mid-May | Mid-April | Late-April | Mid-May | |||
| T1 (UCtrl)† | 1261cd | 1993ab | 2380a | 1367d | 2280 | 2801a | 611 | 985 | 492 | ||
| T2 | 1297cd | 1980ab | 2244ab | 1534cd | 2249 | 2681ab | 709 | 1034 | 561 | ||
| T3 | 1522abc | 2084a | 1892c | 1638bcd | 2274 | 2347b | 739 | 847 | 433 | ||
| T4 | 1260cd | 1887b | 2099abc | 1471d | 2316 | 2384b | 630 | 798 | 404 | ||
| T5 | 1192d | 1892b | 2022bc | 1388d | 2410 | 2509ab | 541 | 896 | 384 | ||
| T6 | 1223d | 1991ab | 1964bc | 1403d | 2483 | 2562ab | 807 | 896 | 418 | ||
| T7 (+Ctrl)‡ | 1398bcd | 2032ab | 1898c | 1602bcd | 2368 | 2457ab | 817 | 896 | 453 | ||
| T8 | 1576ab | 2099a | 1949b | 1877abc | 2238 | 2462ab | 532 | 847 | 423 | ||
| T9 | 1684a | 2037ab | 1897c | 1941ab | 2295 | 2478ab | 601 | 925 | 433 | ||
| T10 | 1617ab | 1975ab | 1918b | 2087a | 2306 | 2464ab | 768 | 817 | 394 | ||
| SE | 52.87 | 36.90 | 66.30 | 78.78 | 61.38 | 74.47 | 92.02 | 79.01 | 61.29 | ||
| p-value | <0.0001 | 0.008 | 0.0003 | <0.0001 | 0.191 | 0.012 | 0.281 | 0.572 | 0.671 | ||
†UCtrl = Untreated Control; ‡+Ctrl = Conventional or positive control. Values represent the least squares means and their standard errors (SE). Means in the same column within each application treatment with different lowercase superscripts are significantly different (p ˂ 0.05).
Table 6.
Effect of soil-applied biopesticide treatments on total sugar content of fresh strawberries.
Table 6.
Effect of soil-applied biopesticide treatments on total sugar content of fresh strawberries.
| Treatment | Total Sugar (mg/100g) | Sweetness Index (mg/100 g) | Total Sweetness Index (mg/100g) | ||||||||
|---|---|---|---|---|---|---|---|---|---|---|---|
| Mid-April | Late-April | Mid-May | Mid- April |
Late-April | Mid-May | Mid- April |
Late-April | Mid-May | |||
| T1 (UCtrl)† | 3239cdef | 5257 | 5674a | 5229def | 8565 | 9488a | 3619def | 5919 | 6503a | ||
| T2 | 3540cdef | 5263 | 5487ab | 5782cdef | 8548 | 9169ab | 3995cdef | 5912 | 6292ab | ||
| T3 | 3899abcd | 5205 | 4673c | 6288bcd | 8458 | 7876c | 4353bcd | 5842 | 5392c | ||
| T4 | 3361cdef | 5000 | 4886bc | 5495cdef | 8291 | 8127bc | 3795def | 5706 | 5574bc | ||
| T5 | 3121f | 5198 | 4915bc | 5115f | 8645 | 8312abc | 3529f | 5949 | 5685abc | ||
| T6 | 3434cdef | 5370 | 4945abc | 5541cdef | 8912 | 8421abc | 3842cdef | 6134 | 5754abc | ||
| T7 (+Ctrl)‡ | 3808bcde | 5296 | 4808bc | 6176bcde | 8689 | 8161bc | 4276bcde | 5993 | 5581bc | ||
| T8 | 3984abc | 5184 | 4835bc | 6611abc | 8390 | 8184bc | 4545abc | 5799 | 5598bc | ||
| T9 | 4226ab | 5258 | 4809bc | 6959ab | 8567 | 8182bc | 4792ab | 5917 | 5592bc | ||
| T10 | 4472a | 5098 | 4776bc | 7453a | 8382 | 8117bc | 5127a | 5777 | 5547bc | ||
| SE | 121.21 | 87.03 | 146.72 | 210.90 | 168.96 | 246.25 | 143.88 | 114.24 | 168.64 | ||
| p-value | <0.0001 | 0.240 | 0.001 | <0.0001 | 0.391 | 0.003 | <0.0001 | 0.390 | 0.003 | ||
†UCtrl = Untreated Control; ‡+Ctrl = Conventional or positive control. Values represent the least squares means and their standard errors (SE). Means in the same column within each application treatment with different lowercase superscripts are significantly different (p ˂ 0.05).
Table 7.
Effect of soil-applied biopesticide treatments on organic acids content and firmness of fresh strawberries.
Table 7.
Effect of soil-applied biopesticide treatments on organic acids content and firmness of fresh strawberries.
| Treatment | Citric Acid (%) | Malic Acid (%) | Firmness (g force) | ||||||||
|---|---|---|---|---|---|---|---|---|---|---|---|
| Mid-April | Late-April | Mid-May | Mid-April | Late-April | Mid-May | Mid-April | Late-April | Mid-May | |||
| T1 (UCtrl)† | 0.71a | 0.69a | 0.70 | 0.13a | 0.13 | 0.15a | 4450ab | 3307abc | 2832 | ||
| T2 | 0.67a | 0.65a | 0.63 | 0.11b | 0.13 | 0.15a | 3556b | 3628a | 2302 | ||
| T3 | 0.69a | 0.62ab | 0.61 | 0.11b | 0.12 | 0.14ab | 3958b | 3391abc | 1951 | ||
| T4 | 0.59b | 0.56bc | 0.64 | 0.14a | 0.13 | 0.13ab | 4388ab | 3514ab | 2526 | ||
| T5 | 0.60b | 0.56bc | 0.57 | 0.14a | 0.12 | 0.13ab | 5441a | 2562bcd | 2545 | ||
| T6 | 0.58b | 0.57bc | 0.58 | 0.11b | 0.12 | 0.13ab | 3979b | 2729abcd | 2142 | ||
| T7 (+Ctrl)‡ | 0.60b | 0.52bcd | 0.64 | 0.12b | 0.13 | 0.13ab | 4304ab | 2263d | 2249 | ||
| T8 | 0.68a | 0.45d | 0.59 | 0.15a | 0.11 | 0.12ab | 3785b | 2611bcd | 2908 | ||
| T9 | 0.71a | 0.50cd | 0.58 | 0.16a | 0.11 | 0.11b | 4408ab | 2464cd | 2637 | ||
| T10 | 0.73a | 0.53cd | 0.60 | 0.16a | 0.12 | 0.13ab | 3895b | 2705abcd | 2882 | ||
| SE | 0.030 | 0.017 | 0.029 | 0.030 | 0.007 | 0.006 | 229.14 | 201.65 | 348.97 | ||
| p-value | 0.009 | <0.0001 | 0.124 | 0.028 | 0.414 | 0.018 | 0.001 | 0.0005 | 0.550 | ||
†UCtrl = Untreated Control; ‡+Ctrl = Conventional or positive control. Values represent the least squares means and their standard errors (SE). Means in the same column within each application treatment with different lowercase superscripts are significantly different (p ˂ 0.05).
Table 8.
Effect of soil-applied biopesticide treatments on internal color attributes of fresh strawberries.
Table 8.
Effect of soil-applied biopesticide treatments on internal color attributes of fresh strawberries.
| Treatment | Lightnessi | Chromai | Huei | ||||||||
|---|---|---|---|---|---|---|---|---|---|---|---|
| Mid-April | Late-April | Mid-May | Mid-April | Late-April | Mid-May | Mid-April | Late-April | Mid-May | |||
| T1 (UCtrl)† | 48.00ab | 42.14a | 38.37ab | 37.68abc | 39.86abc | 33.25ab | 54.71ab | 55.99b | 56.86cd | ||
| T2 | 45.24b | 40.47ab | 41.35a | 39.60a | 39.63abc | 34.54ab | 55.16a | 56.55ab | 55.92d | ||
| T3 | 45.84b | 41.14ab | 36.25b | 38.12ab | 41.32ab | 36.22a | 56.03a | 56.48ab | 57.00bcd | ||
| T4 | 45.34b | 39.09abc | 39.09ab | 35.56bc | 41.44ab | 33.95ab | 55.01a | 56.63ab | 58.86abc | ||
| T5 | 45.50b | 36.36c | 41.04a | 36.72abc | 41.06abc | 34.44ab | 55.82a | 57.62a | 57.18bcd | ||
| T6 | 45.20b | 40.79ab | 36.44b | 35.62bc | 37.66c | 31.66b | 56.93a | 56.10ab | 59.96a | ||
| T7 (+Ctrl)‡ | 46.01ab | 37.43bc | 38.45ab | 36.69abc | 42.12a | 33.65ab | 56.98a | 55.73b | 58.44abc | ||
| T8 | 50.55a | 39.44abc | 37.72ab | 35.25bc | 38.58abc | 33.11ab | 52.31b | 56.09ab | 58.99ab | ||
| T9 | 47.32ab | 37.41bc | 39.37ab | 35.11c | 38.74abc | 34.24ab | 55.34a | 56.81ab | 57.30bcd | ||
| T10 | 44.47b | 40.46ab | 39.87ab | 36.99abc | 38.51bc | 32.16b | 56.48a | 57.16ab | 57.16bcd | ||
| SE | 1.022 | 0.881 | 0.850 | 0.642 | 0.782 | 0.833 | 0.541 | 0.344 | 0.458 | ||
| p-value | 0.0016 | ˂0.0001 | 0.0001 | ˂0.0001 | ˂0.0002 | 0.0140 | ˂0.0001 | ˂0.0047 | ˂0.0001 | ||
†UCtrl = Untreated Control; ‡+Ctrl = Conventional or positive control. Values represent the least squares means with their standard errors (SE). Means in the same column within each application treatment with different lowercase superscripts are significantly different (p ˂ 0.05). Lightnessi, L*, internal; Chromai = [(a*)2 + (b*)2]1/2, internal; Huei: hue angle = tan-1 [b*/a*], internal.
Table 9.
Effect of soil-applied biopesticide treatments on external color attributes of fresh strawberries.
Table 9.
Effect of soil-applied biopesticide treatments on external color attributes of fresh strawberries.
| Treatment | Lightnesse | Chromae | Huee | ||||||||
|---|---|---|---|---|---|---|---|---|---|---|---|
| Mid-April | Late-April | Mid-May | Mid-April | Late-April | Mid-May | Mid-April | Late-April | Mid-May | |||
| T1 (UCtrl)† | 24.09a | 21.56 | 21.37abc | 19.66bcd | 20.67a | 20.06ab | 69.90bc | 68.01b | 67.66 | ||
| T2 | 23.85a | 21.29 | 19.95b | 18.94cd | 17.51b | 20.69ab | 70.63b | 71.12ab | 65.55 | ||
| T3 | 21.98c | 21.82 | 19.93b | 17.32d | 18.51ab | 19.02b | 73.66a | 71.30ab | 69.17 | ||
| T4 | 21.79c | 21.51 | 23.31a | 21.63abc | 17.10b | 20.48ab | 67.78cd | 72.96a | 69.21 | ||
| T5 | 22.69abc | 21.47 | 22.20ab | 23.19a | 16.27b | 21.64ab | 66.82d | 72.61a | 68.39 | ||
| T6 | 22.21bc | 21.09 | 20.55bc | 19.12cd | 16.13b | 20.03ab | 70.33bc | 74.11a | 69.19 | ||
| T7 (+Ctrl)‡ | 23.53ab | 21.47 | 22.15ab | 22.10ab | 17.33b | 22.79a | 68.04bcd | 71.19ab | 67.54 | ||
| T8 | 22.75abc | 21.18 | 19.83c | 20.51abc | 16.20b | 18.76b | 69.34bcd | 73.65a | 69.70 | ||
| T9 | 22.05bc | 21.05 | 22.52ab | 19.36bcd | 16.44b | 21.49ab | 69.73bc | 73.22a | 67.65 | ||
| T10 | 23.05abc | 21.94 | 22.08ab | 20.59abc | 18.07ab | 21.84ab | 69.88bc | 72.74a | 69.78 | ||
| SE | 0.331 | 0.239 | 0.454 | 0.611 | 0.539 | 0.704 | 0.607 | 0.822 | 1.025 | ||
| p-value | ˂0.0001 | 0.125 | ˂0.0001 | ˂0.0001 | ˂0.0001 | 0.0008 | ˂0.0001 | ˂0.0001 | 0.120 | ||
†UCtrl = Untreated Control; ‡+Ctrl = Conventional or positive control. Values represent the least squares means with their standard errors (SE). Means in the same column within each application treatment with different lowercase superscripts are significantly different (p ˂ 0.05). Lightnesse: L*, external; Chromae = [(a*)2 + (b*)2]1/2, external; Huee: Hue angle = tan-1 [b*/a*], external.
Table 10.
Precipitation amounts, days of precipitation, temperature, relative humidity, and wind speed during the strawberry growing season from October 2018 to May 2019.
Table 10.
Precipitation amounts, days of precipitation, temperature, relative humidity, and wind speed during the strawberry growing season from October 2018 to May 2019.
| Date | Precipitation (mm) |
Days of precipitation | Temperature Min ± Max (°C) |
Relative humidity (%) | Wind speed (mph) |
|---|---|---|---|---|---|
| October 1-31, 2018 | 14.98 | 5 | 16.6 ± 26.6 | 47.87 | 5.71 |
| November 1-30, 2018 | 61.21 | 10 | 8.1 ± 18.6 | 48.83 | 6.14 |
| December 1-31, 2018 | 167.38 | 10 | 7.3 ± 17.2 | 48.90 | 6.81 |
| January 1-31, 2019 | 128.77 | 15 | 4.8 ± 15.9 | 49.77 | 6.22 |
| February 1-28, 2019 | 42.16 | 17 | 9.7 ± 18.1 | 49.89 | 6.86 |
| March 1-31, 2019 | 14.22 | 6 | 10.1 ± 21.2 | 50.64 | 7.03 |
| April 1-30, 2019 | 50.54 | 8 | 13.4 ± 25.3 | 49.60 | 7.33 |
| May 1-31, 2019 | 250.44 | 10 | 19.3 ± 27.9 | 57.16 | 7.51 |
| Total | 729.7 | 81 |
Disclaimer/Publisher’s Note: The statements, opinions and data contained in all publications are solely those of the individual author(s) and contributor(s) and not of MDPI and/or the editor(s). MDPI and/or the editor(s) disclaim responsibility for any injury to people or property resulting from any ideas, methods, instructions or products referred to in the content. |
© 2025 by the authors. Licensee MDPI, Basel, Switzerland. This article is an open access article distributed under the terms and conditions of the Creative Commons Attribution (CC BY) license (http://creativecommons.org/licenses/by/4.0/).
Copyright: This open access article is published under a Creative Commons CC BY 4.0 license, which permit the free download, distribution, and reuse, provided that the author and preprint are cited in any reuse.


