1. Introduction
Soybean (
Glycine max (L.) Merrill) is a globally cultivated oilseed crop [
1] and an important legume that serves as a major source of high-quality protein. Its popularity has grown due to its dual role in livestock feed and human nutrition [
2]. Over the past decade, soybean production in Europe has increased by more than 87% [
3], while in the European Union, the increase reached 116% [
4]. Although cultivation is primarily concentrated in southern and eastern Europe, production has been expanding into new regions, underscoring its growing economic and agronomic importance [
5]. In Croatia, between 2019 and 2023, the area under soybean cultivation ranged from 76,690 to 90,670 ha [
6].
Among the most detrimental biotic factors affecting soybean production is
Macrophomina phaseolina (Tassi) Goid (Goidanish, 1947) [
7], a globally distributed necrotrophic soil- and seed-borne fungal pathogen. It is the causal agent of several diseases, including charcoal rot (also known as dry root rot or crown rot), stem rot, root rot, and seedling blight [
8,
9,
10]. Beyond soybean, M. phaseolina infects more than 500 plant species [
11,
12] across over 100 families [
13], including cereals and other legumes [
14]. The pathogen colonizes the vascular tissues of roots, disrupting the transport of water and nutrients to aerial parts of the plant. Characteristic symptoms include yellowing and premature senescence of leaves that remain attached by petioles, sloughing of cortical tissues, and grey discoloration due to abundant microsclerotia, often resulting in premature plant death [
15,
16,
17]. On soybean, symptoms typically manifest as stunted growth, chlorosis, early leaf senescence, and incomplete pod filling, depending on the developmental stage at infection [
18,
19]. The fungus survives in soil primarily as microsclerotia, which can remain viable for up to 15 years [
20,
21], making disease management particularly challenging [
22]. Populations of
M. phaseolina are most abundant in the upper soil layer (0–5 cm), followed by the 20–30 cm depth [
23].
M. phaseolina has a wide geographic distribution and thrives under hot and dry conditions [
24,
25,
26]. Under high temperatures (30–35 °C) and low soil moisture (<60%), it can cause severe yield losses in soybean, significantly impacting farmers’ income [
27]. Yield losses in experimental plots have been reported to range between 18 and 30% [
28], while complete (100%) losses have been recorded in groundnut cultivars infected at the pre-emergence stage [
29]. In the United States, soybean yield losses exceeding 1.9–2.0 million tons were attributed to charcoal rot between 2003 and 2012 [
30]. Despite substantial research efforts, effective management of
M. phaseolina remains difficult. Understanding host–pathogen interactions is therefore essential for identifying genotypes with promising genetic resistance [
31]. Several genotypes from maturity groups MG III to MG V have been identified as moderately resistant [
32]. The use of resistant cultivars remains one of the most effective strategies for managing charcoal rot [
33], as genetic resistance minimizes fungicide dependence, reduces yield losses, and supports sustainable crop production [
17,
34,
35].
In Croatia, there are no economic assessments of yield losses caused by this ubiquitous pathogen. Given the trend of increasingly warm and dry summers, particularly in eastern Croatia [
36], where soybean is primarily grown,
M. phaseolina is expected to have an escalating impact on yields. The pathogen’s extensive host range will likely further contribute to its persistence and spread.
Climate change is expected to alter pathogen dynamics and host susceptibility through multiple mechanisms, including shifts in temperature and precipitation patterns, pathogen evolution, and the breakdown of host resistance [
37,
38,
39]. Climate projections indicate a higher frequency of extreme weather events, such as storms, droughts, and heatwaves [
40], which are likely to intensify disease outbreaks and expand the cultivation range of susceptible hosts [
41]. These environmental fluctuations can disrupt plant physiology, reduce inherent resistance, and enhance pathogen virulence and dispersal, ultimately leading to decreased crop productivity and increased plant mortality [
42,
43,
44].
Soybean is a thermophilic crop with an optimal germination temperature between 20 °C and 30 °C. When exposed to low soil and air temperatures (below 10–12 °C during germination and below 15 °C during early growth), plants experience metabolic and structural disturbances collectively referred to as cold stress [
45]. These conditions impair membrane integrity, enzyme activity, and nutrient uptake, resulting in slower growth and a reduced defense capacity [
19]. Cold stress also increases the accumulation of reactive oxygen species (ROS) and reduces the synthesis of phenolic compounds, lignin, and pathogenesis-related proteins—key components of the plant’s defense response [
46,
47]. Furthermore, it suppresses defense-related enzymes such as phenylalanine ammonia-lyase (PAL), peroxidase, and β-1,3-glucanase [
48], thereby increasing plant susceptibility to opportunistic fungal pathogens.
Cold stress thus acts as a predisposing factor that heightens soybean vulnerability to fungal infections, particularly during germination and early vegetative growth. By weakening cellular defenses, prolonging seedling emergence, and modifying the soil microenvironment, low temperatures create favorable conditions for opportunistic and soilborne pathogens. Although
M. phaseolina typically develops under high temperatures and drought, soybean plants weakened by early cold stress may exhibit increased susceptibility later in the season when water stress occurs [
49].
The aim of this study was to evaluate the sensitivity of several commercial soybean cultivars from different maturity groups (MG 00, 0, and 0–I) to M. phaseolina infection under controlled cold-stress and optimal growth conditions. Specifically, the study aimed to determine whether cultivar-specific differences in susceptibility exist and how individual cultivars respond to the combined effects of biotic and abiotic stress.
3. Discussion
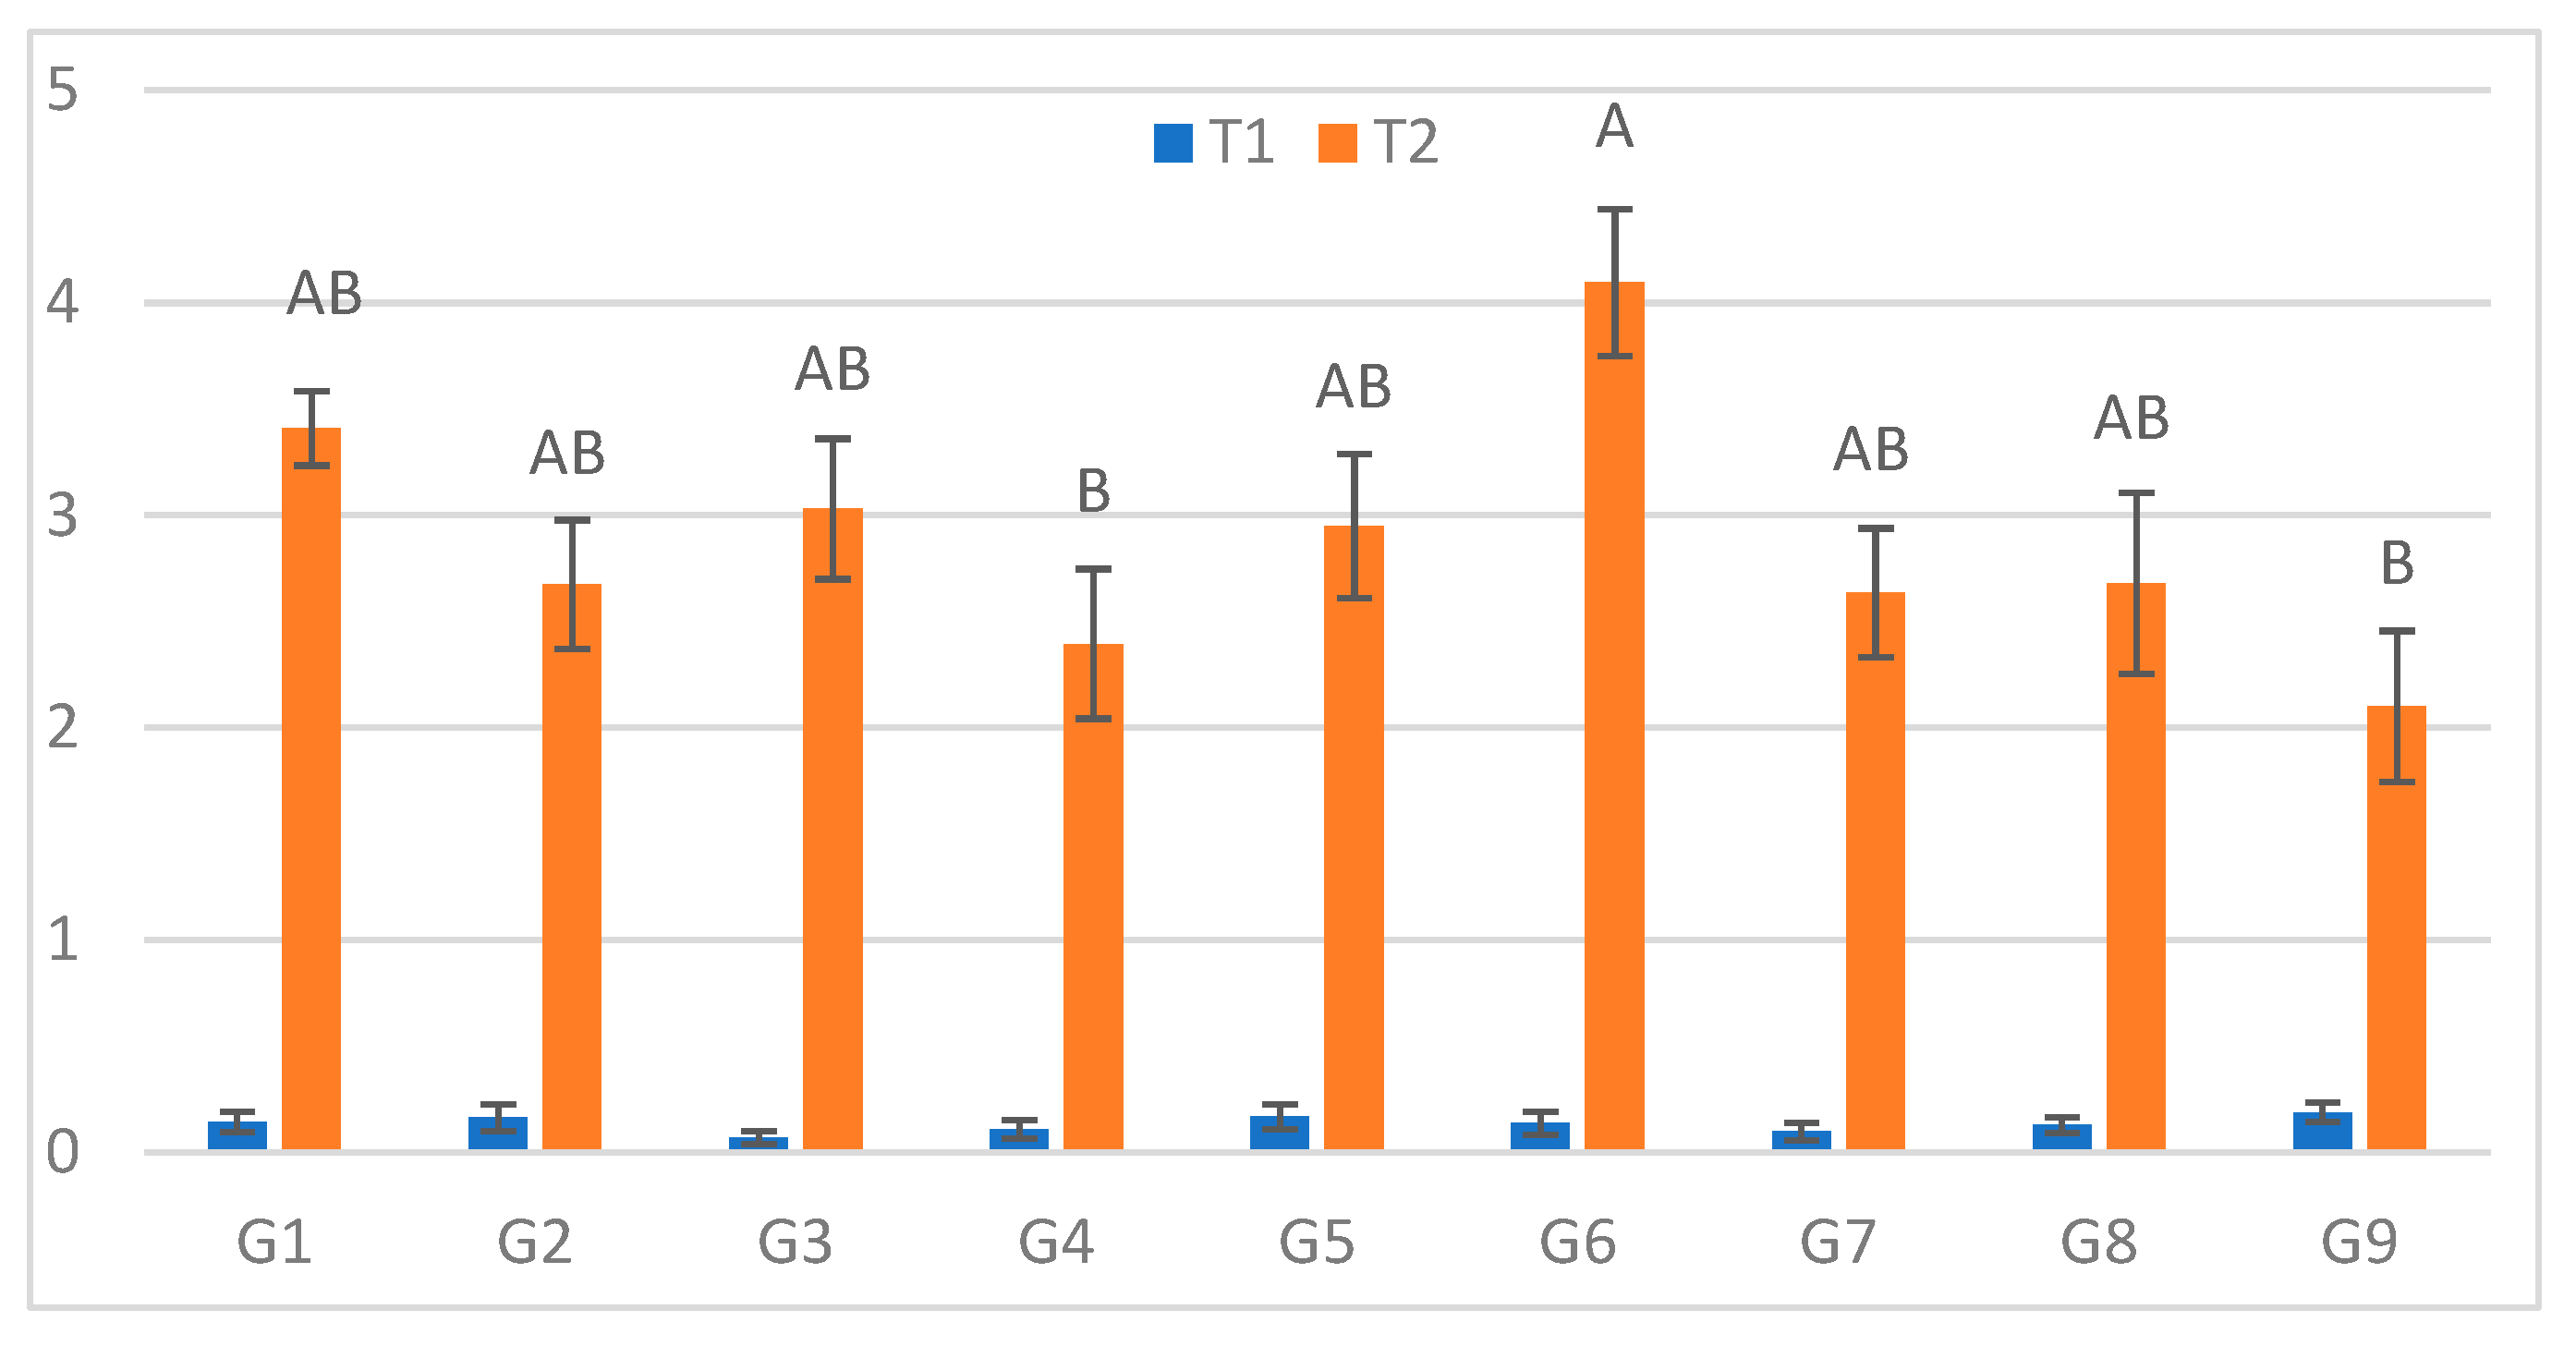
The present study demonstrated that transient cold stress significantly increased the severity of M. phaseolina infection in soybean and that the magnitude of this effect depended on both the timing of assessment and the genotype tested. Analysis of variance revealed that treatment, genotype, and their interaction were significant sources of variation in lesion length across all five measurements, confirming that both environmental and genetic factors, as well as their interaction, play a crucial role in the development of charcoal rot symptoms under controlled conditions.
3.1. Cold Stress as a Predisposing Factor for Infection
Cold stress markedly enhanced lesion development, particularly at the earliest assessment, where the relative difference between treatments (T1 vs. T2) was the greatest. This finding is consistent with the concept that low temperatures act as a predisposing factor by weakening host defenses and creating more favorable conditions for subsequent pathogen colonization. As described in previous studies, exposure to suboptimal temperatures disrupts membrane integrity, reduces enzyme activity, and impairs nutrient uptake [
45], resulting in reduced overall physiological fitness of soybean seedlings and young plants [
19].
At the biochemical level, cold stress is known to increase the accumulation of reactive oxygen species (ROS) and to reduce the synthesis of phenolic compounds, lignin, and pathogenesis-related proteins [
46,
47]. The suppression of key defense-related enzymes such as phenylalanine ammonia-lyase (PAL), peroxidase, and β-1,3-glucanase under cold conditions [
48] further compromises the ability of plants to restrict pathogen ingress and spread. Our results, showing stronger infection and longer lesions in plants previously exposed to low temperatures, are in line with these physiological insights and support the hypothesis that short episodes of cold stress can substantially increase host susceptibility to necrotrophic fungal pathogens.
Although
M. phaseolina is typically associated with high temperatures and drought [
24,
25,
26,
27], our findings indicate that prior exposure to cold can intensify disease development once favorable temperatures are re-established. This agrees with the notion that stress combinations or stress sequences—such as early cold stress followed by warmer, drier conditions—may exacerbate disease impact beyond what would be expected from individual stress factors alone [
37,
39]. In this context, cold stress appears not as an alternative to heat and drought stress, but as an additional abiotic factor that can predispose plants to more severe charcoal rot when typical conducive conditions for
M. phaseolina occur later in the season [
49].
3.2. Temporal Patterns of Lesion Development
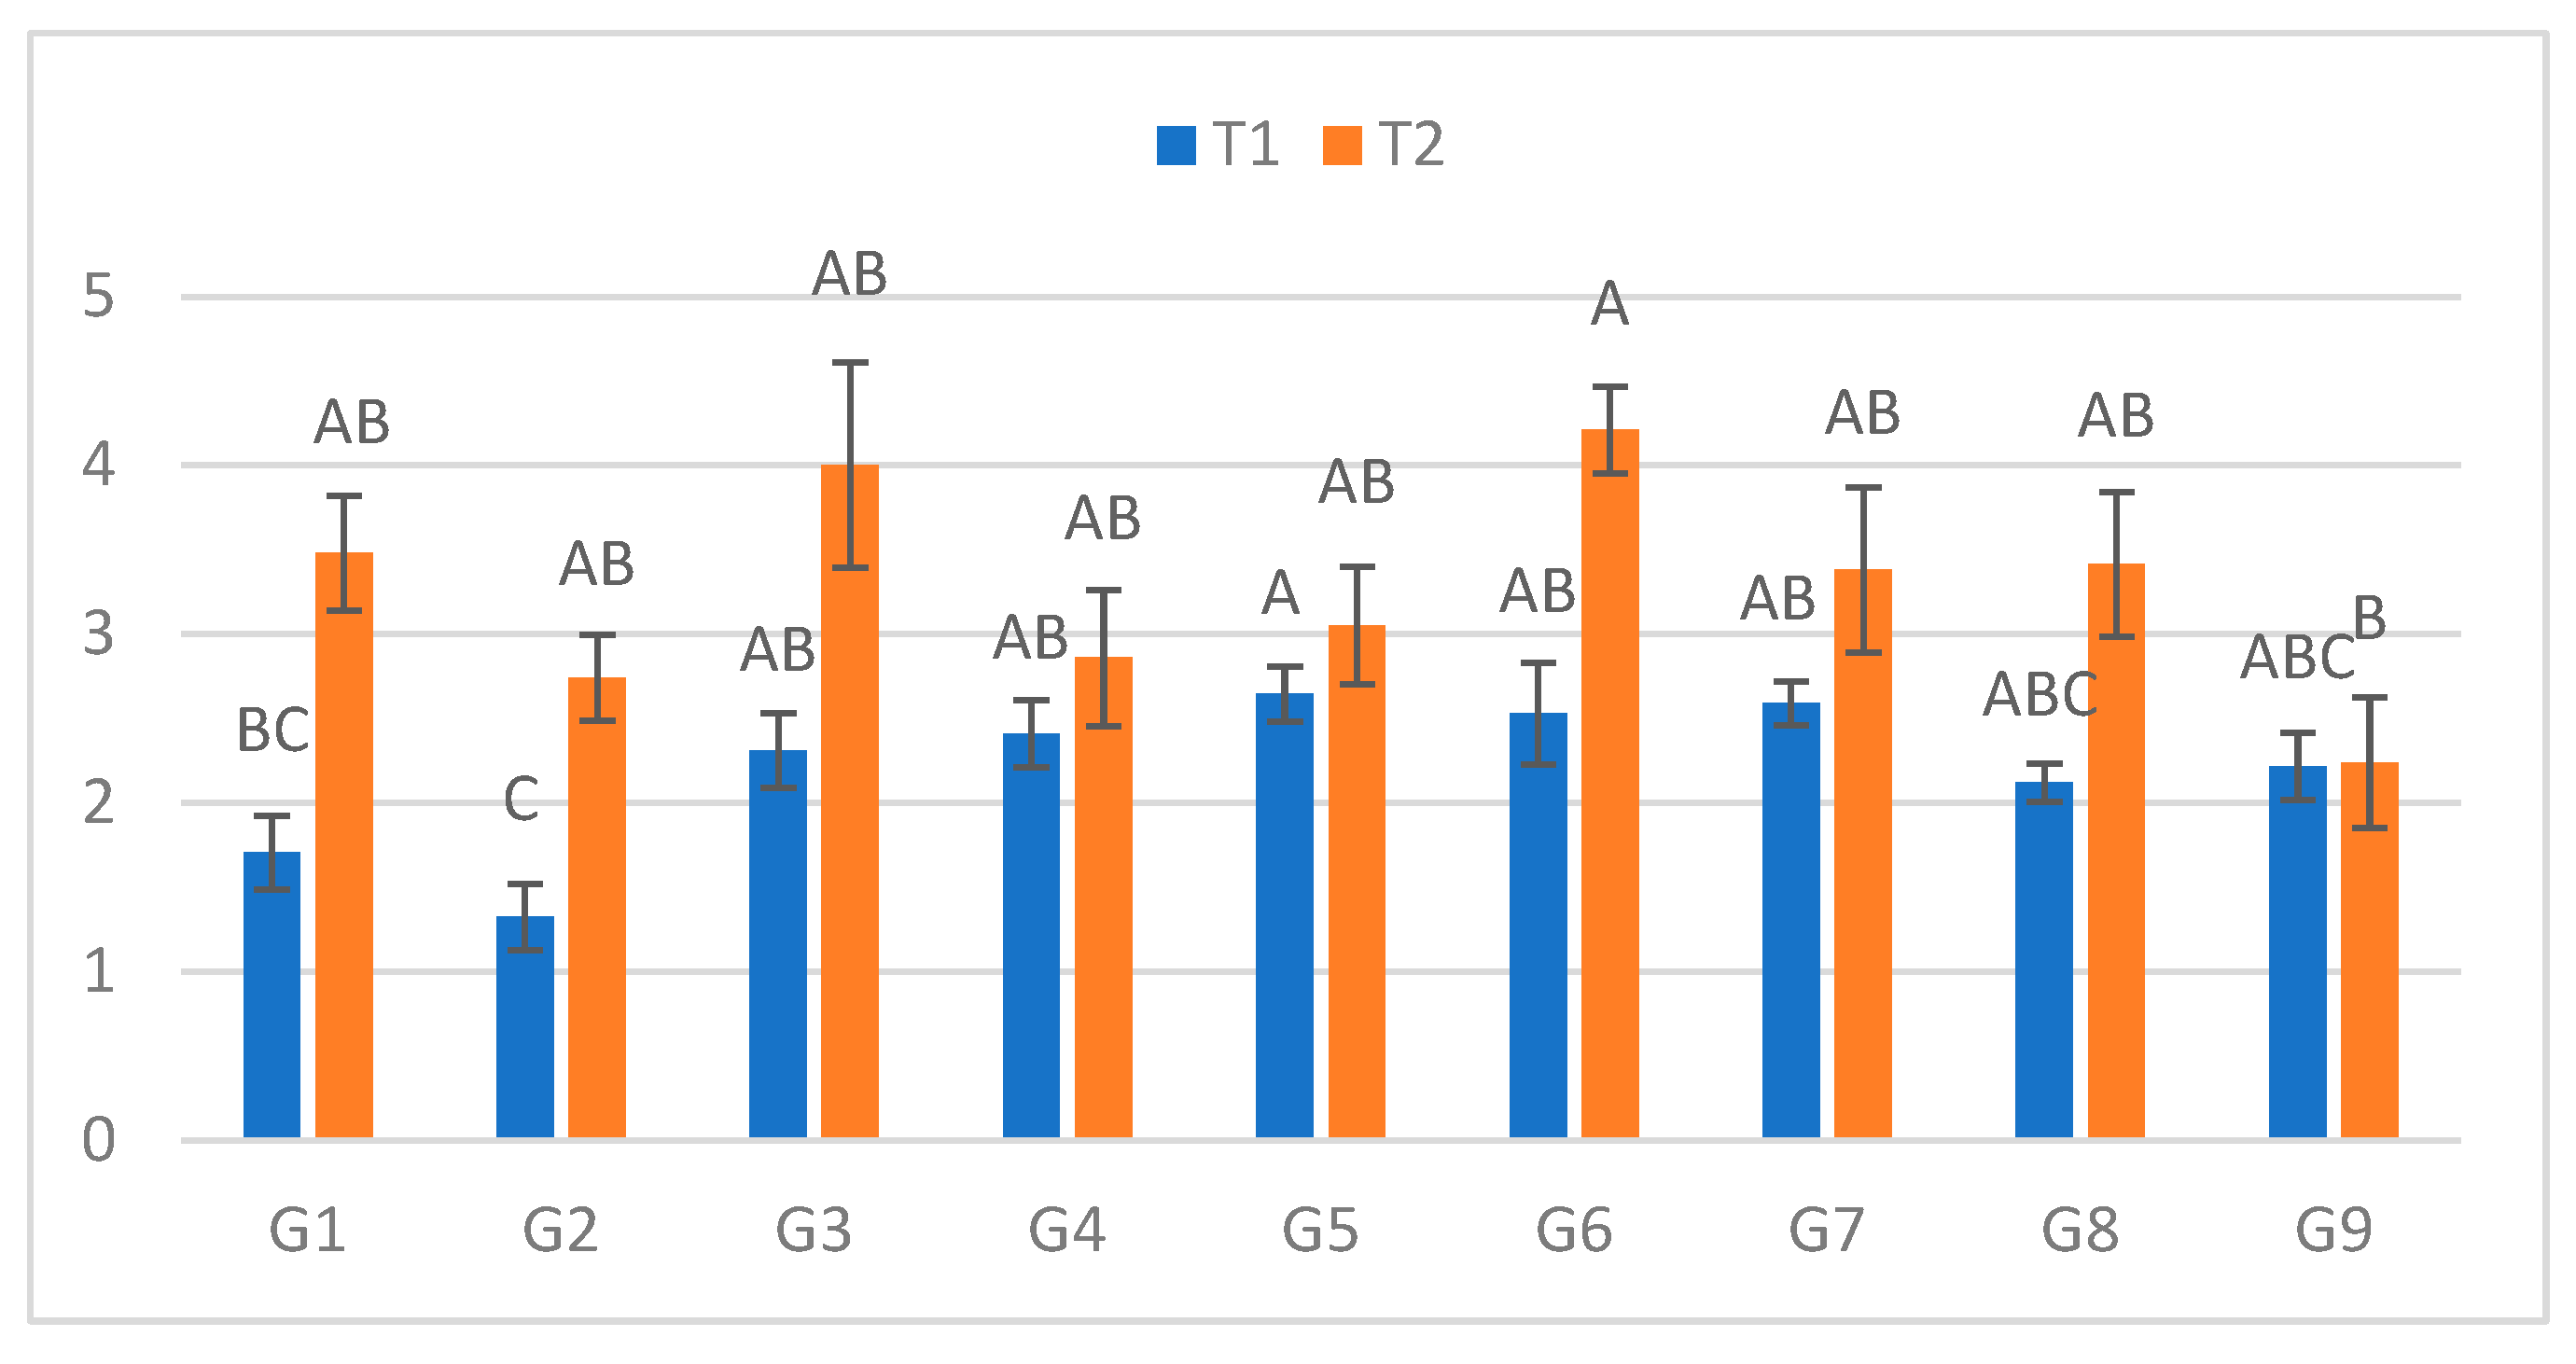
The relative difference in lesion length between cold-stressed and control plants was highest at the first measurement and decreased in subsequent assessments, although absolute lesion lengths generally remained higher under cold stress. This temporal pattern suggests that the early phase of infection is particularly sensitive to prior physiological weakening induced by low temperatures. Once infection is established, lesion expansion appears to be driven more by inherent genotypic resistance or susceptibility and less by the initial cold stress event.
The stabilization of treatment differences over time is consistent with models of host–pathogen interaction in which abiotic stresses primarily influence the initial stages of colonization and penetration, whereas later stages reflect the balance between pathogen aggressiveness and host structural and biochemical defenses [
19,
44]. In practical terms, this implies that short cold spells during early vegetative stages can have disproportionate consequences for subsequent disease development, even if environmental conditions later in the season appear favorable for plant growth.
3.3. Genotype-Specific Responses to Cold Stress and M. phaseolina
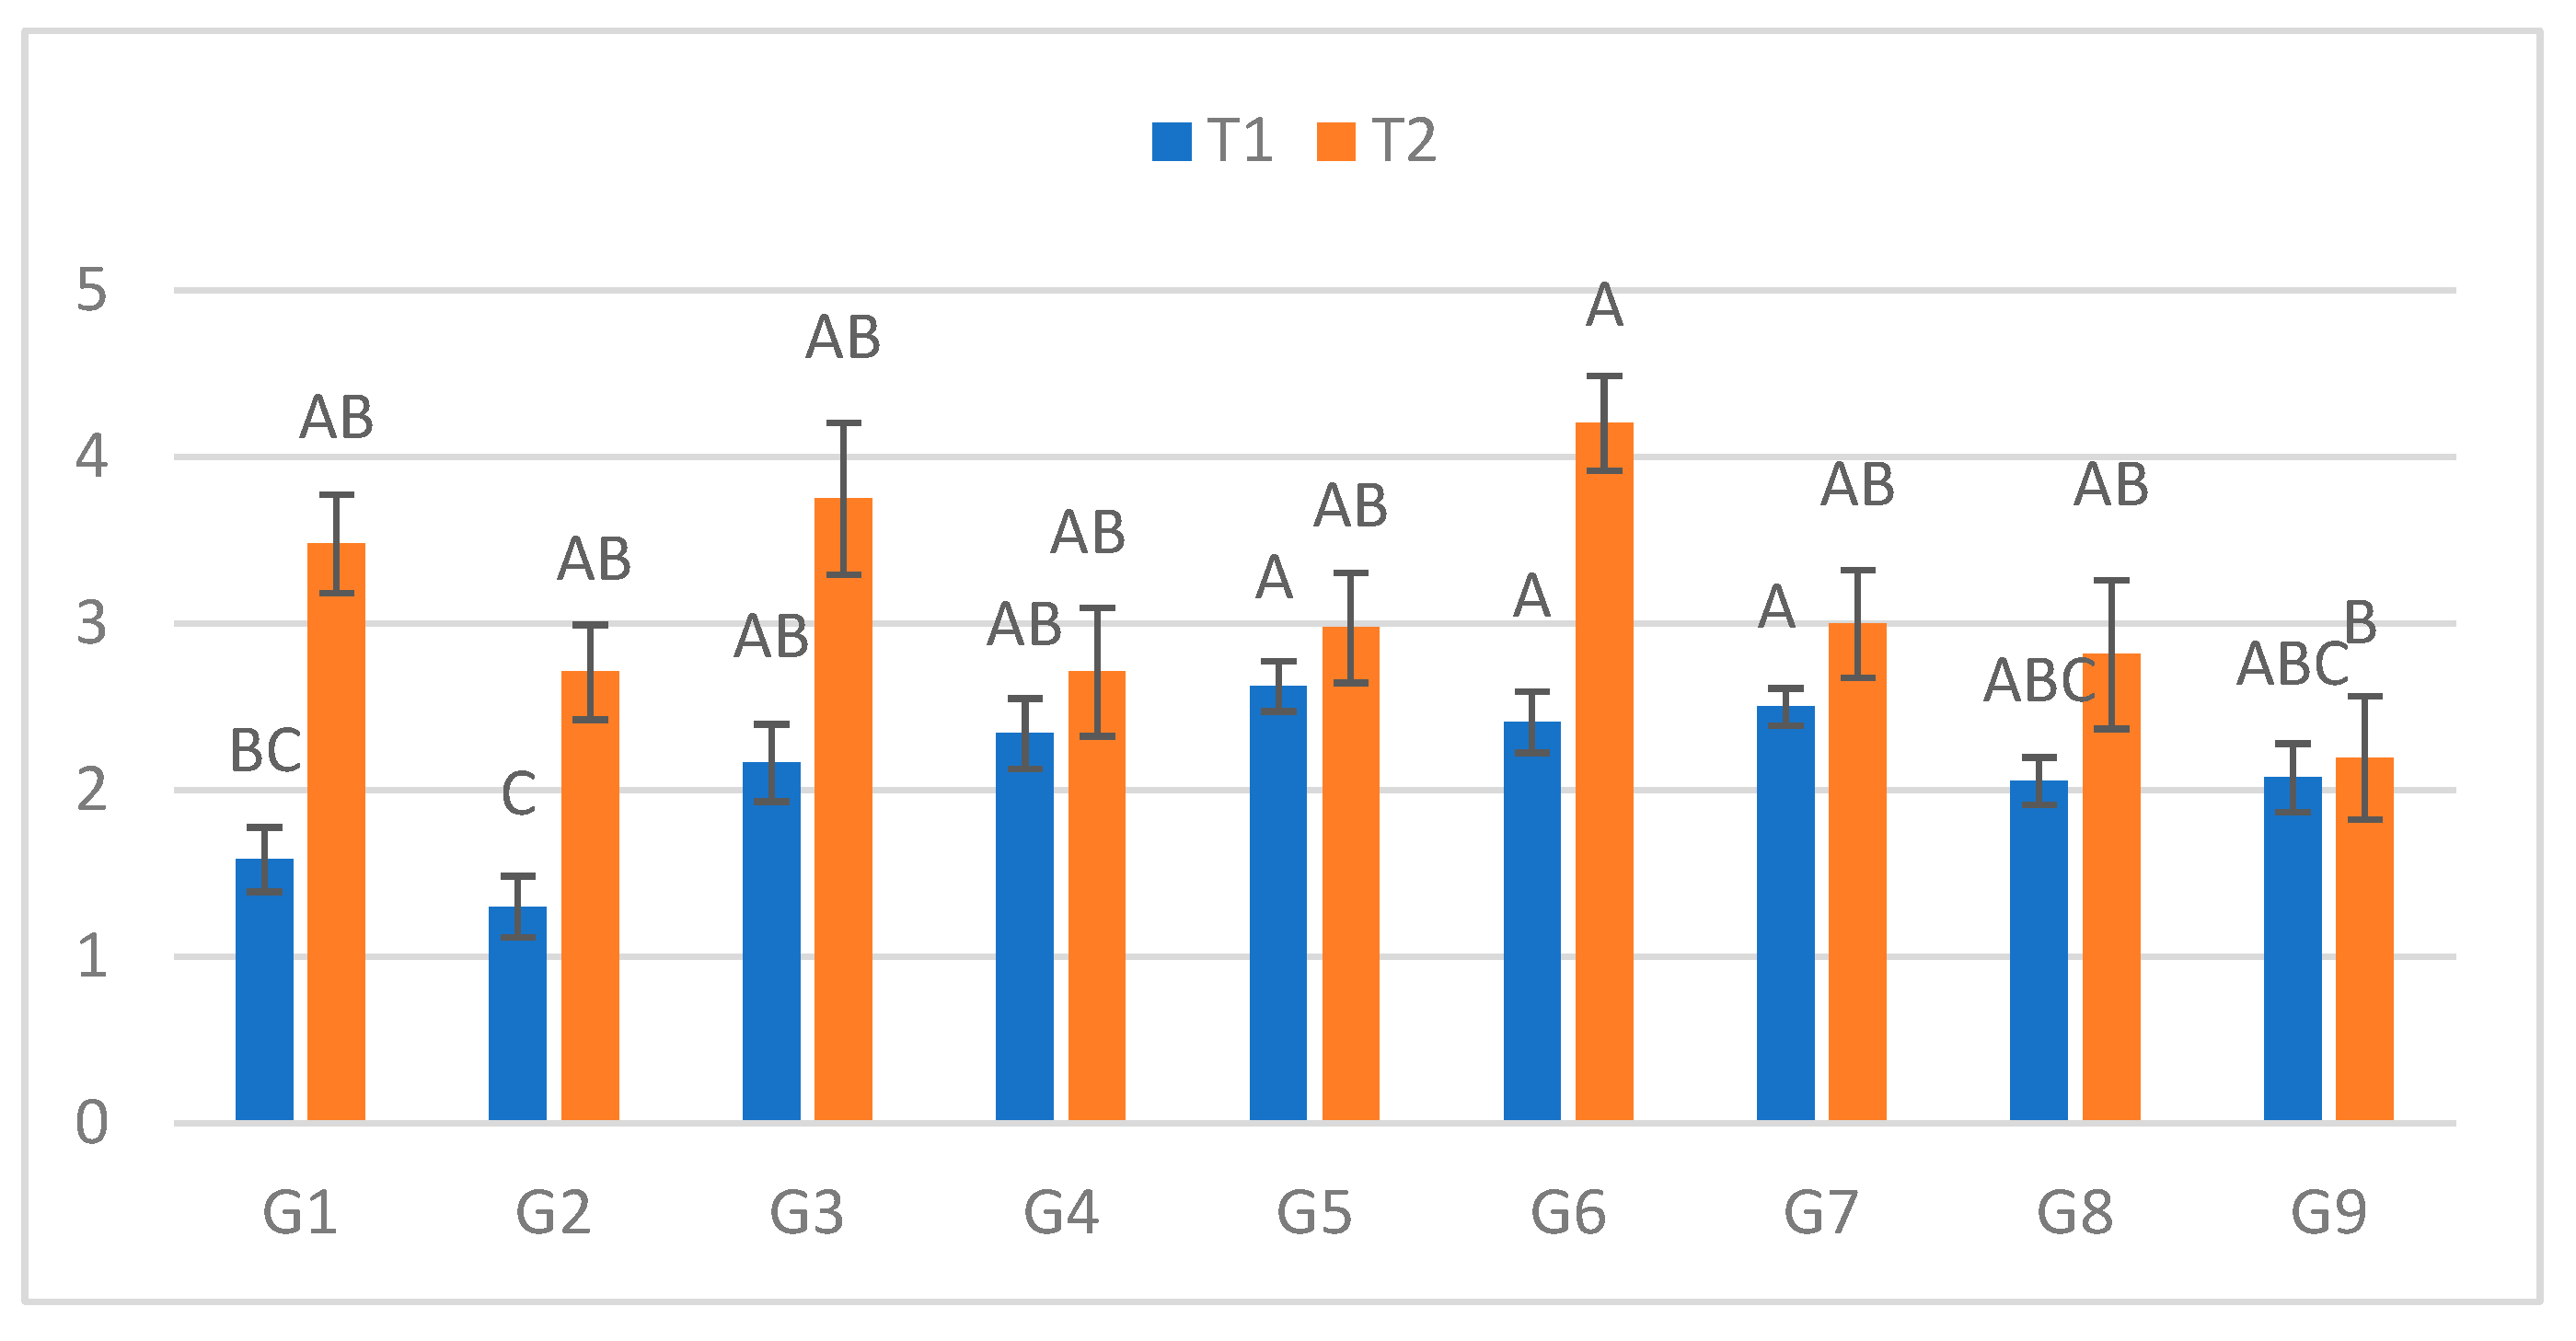
Genotype significantly affected lesion length in all measurements except the first assessment under optimal conditions, indicating that genetic variability in susceptibility becomes evident as infection progresses. Moreover, the significant T × G interaction across all time points confirms that genotypes responded differently to cold predisposition and that their relative performance was not constant across treatments.
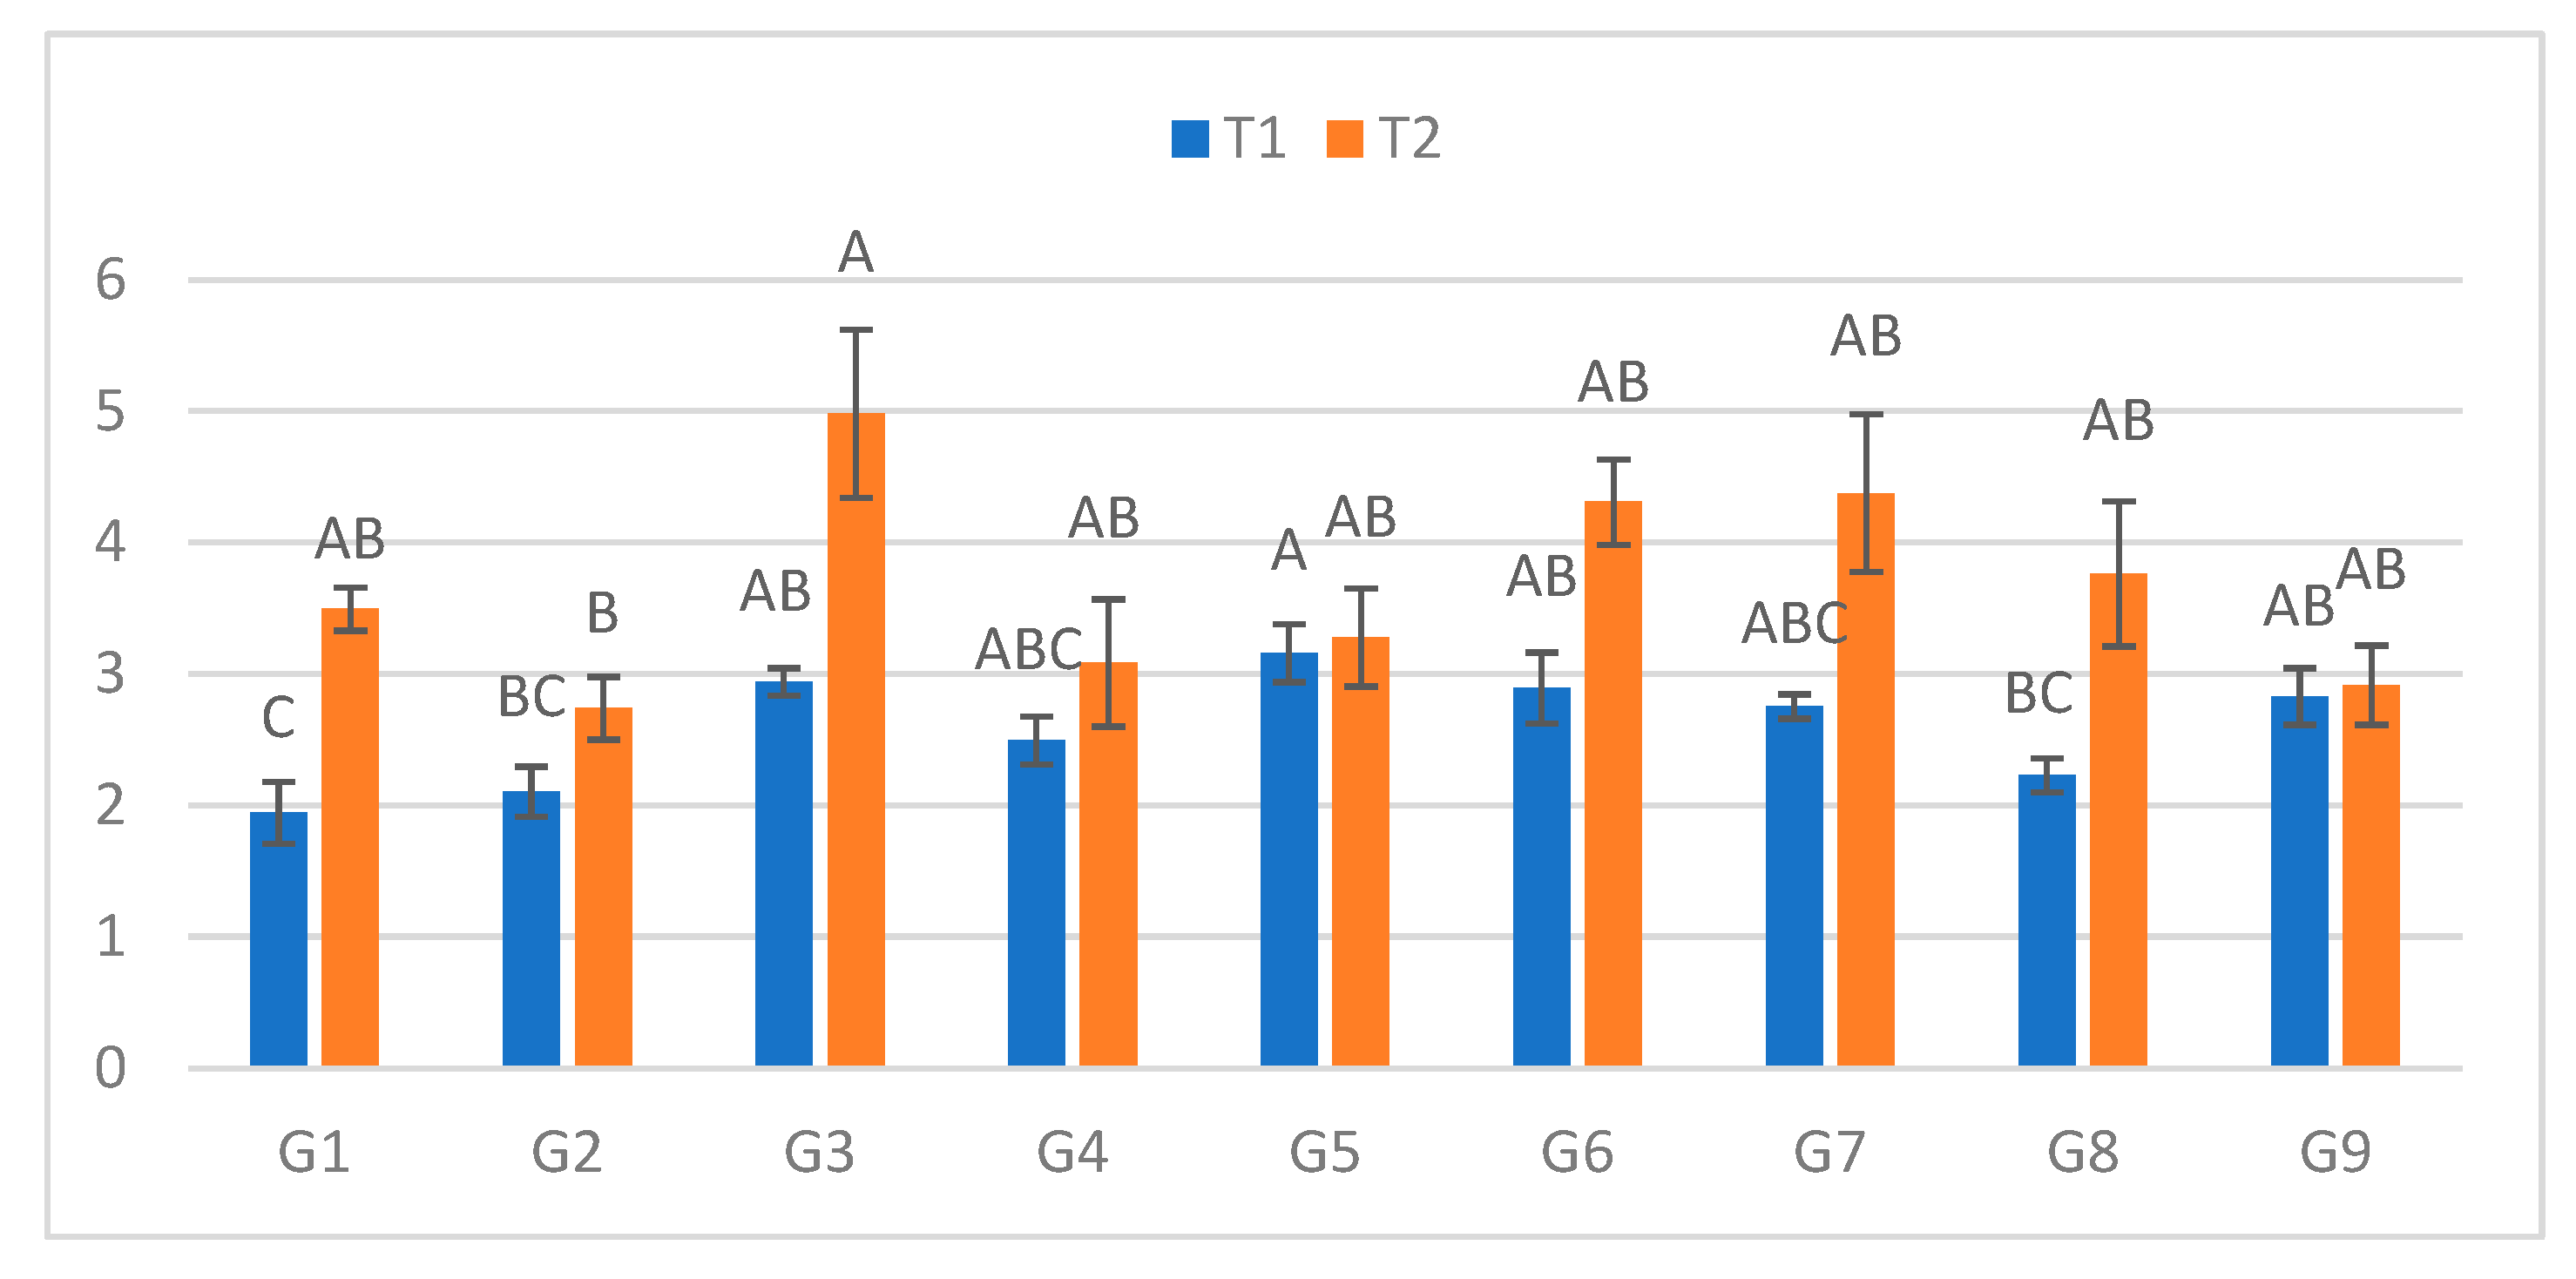
Several consistent trends emerged. Genotype G9 repeatedly showed the smallest treatment-induced increase in lesion length across measurements, suggesting a relatively stable response to infection and potential partial tolerance to cold stress–mediated predisposition. In contrast, genotypes such as G3, G6, and G7 often exhibited the greatest increases in lesions under cold stress, indicating heightened sensitivity when exposed to low temperatures prior to infection. These patterns agree with previous findings reporting genotypic variability in resistance to charcoal rot, where some soybean lines exhibit reduced lesion lengths and lower yield losses in the presence of
M. phaseolina [
28,
31,
32].
The identification of genotypes with relatively stable performance under both optimal and cold-stress conditions is of particular interest for breeding programs. Resistant or less susceptible cultivars are recognized as one of the most effective and environmentally sustainable strategies for managing charcoal rot [
33], as they reduce dependence on fungicides, minimize yield losses, and support long-term sustainable production [
17,
34,
35]. Our results suggest that genotypes similar to G9, which combine comparatively low lesion development and reduced sensitivity to cold stress, may represent promising candidates for further genetic and physiological characterization.
3.4. Implications Under Changing Climatic Conditions
Climate change is expected to alter the epidemiology of plant diseases by modifying host physiology, pathogen biology, and the timing and frequency of abiotic stress events [
37,
38,
39]. Projections indicate not only increased temperatures and more frequent droughts but also greater variability in early-season weather, including cold spells and fluctuating temperatures in temperate regions [
40]. In such a scenario, soybean crops in regions like eastern Croatia may increasingly experience combinations of abiotic stresses that favor charcoal rot: early-season cold episodes followed by hot and dry periods later in the growing season.
Our findings highlight that cold stress alone, even when transient, can significantly predispose soybean plants to more severe
M. phaseolina infection. When combined with the known preference of this pathogen for high temperatures and low soil moisture [
24,
27,
30], this suggests that climate variability may intensify charcoal rot risk in areas where soybean is expanding or where production already relies on marginal climatic conditions. For Croatia, where summers are becoming warmer and drier, and where no formal economic assessments of charcoal rot damage are currently available, the integration of cold-stress predisposition into risk models could improve the accuracy of future disease forecasts and management strategies.
3.5. Methodological Considerations and Limitations
The use of a controlled growth chamber and a single
M. phaseolina isolate allowed a precise evaluation of treatment and genotype effects under standardized conditions. The cut-stem inoculation method applied at the V2 stage is widely used for resistance screening and offers high reproducibility and sensitivity [
51]. However, several limitations should be considered when extrapolating these findings to field conditions.
First, only one isolate (MP1) was used, and it is well established that
M. phaseolina populations can exhibit substantial genetic and pathogenic variability across regions and hosts [
13,
14]. Future studies should therefore include multiple isolates representing the diversity of field populations in Croatia and neighboring countries. Second, the cut-stem method bypasses some early infection stages occurring in natural soil or residue-borne infections. Although this approach is highly informative for assessing relative lesion development and host responses, complementary experiments using soil inoculation under field or semi-controlled conditions would provide additional insight into root infection dynamics.
Third, the present study focused primarily on lesion length as a measure of disease severity. While this parameter is widely accepted and informative, integrating additional traits such as plant biomass, physiological status (e.g. chlorophyll content, photosynthetic activity), and yield components would help to link lesion development more directly with agronomic performance. Finally, the cold-stress regime applied here was designed to simulate a realistic but specific scenario (three consecutive days of low temperature at early vegetative stage). Other stress intensities, durations, and timings—especially in combination with drought—should be explored to better reflect the range of conditions expected under future climate scenarios.
3.6. Future Research and Breeding Perspectives
The present findings provide a useful framework for further research on the interaction between cold stress and charcoal rot in soybean. Future studies should aim to:
Validate genotypic responses under field conditions, using multilocation trials that include environments with documented early-season cold spells and mid- to late-season drought.
Characterize physiological and molecular responses of contrasting genotypes (e.g. G9 vs. highly susceptible lines) to combined cold stress and M. phaseolina infection, focusing on ROS metabolism, lignification, and expression of defense-related genes.
Integrate resistance screening with marker-assisted or genomic selection, using the identified tolerant genotypes as potential sources of alleles conferring stable performance across variable environments.
Develop predictive models that incorporate early-season cold stress, soil inoculum levels, and temperature–moisture patterns to improve charcoal rot risk assessment in regions affected by climate change.
Overall, this study demonstrates that even short episodes of cold stress can substantially increase susceptibility of soybean to M. phaseolina and that genotypes differ markedly in their responses to this combined abiotic–biotic stress scenario. These results underscore the importance of considering both climatic variability and host genetic resistance in the development of sustainable strategies for managing charcoal rot in soybean.
4. Material and Methods
4.1. Plant Material and Experimental Design
The experiment included nine soybean cultivars—six developed within the soybean breeding program of the Agricultural Institute Osijek (AIO), Croatia, and three introduced cultivars. The cultivars represented three maturity groups (MG): three MG 0–I, three MG 0, and three MG 00.
Two independent experiments were conducted. In the first experiment, soybean seeds were exposed to cold temperature stress, while in the second experiment, seeds were grown under optimal temperature and light conditions for soybean growth and development.
Each experiment was arranged in a completely randomized design with four biological replicates per cultivar and ten plants per replicate. Plants were grown in plastic containers (600 × 400 × 200 mm) filled with 5.5 kg of soil (pH (CaCl₃) = 5.7; N (NH₄⁺ + NO₃⁻) = 70 mg/L; P (P₂O₅) = 50 mg/L; K (K₂O) = 90 mg/L; EC = 40 mS/m). Each tray contained six rows with alternating configurations of three and two planting spaces. Three genotypes were planted per tray, three trays were included per replicate, and twelve trays per treatment. The order of genotypes within each replicate was randomized, and trays were shuffled daily in the growth chamber before the lights were switched on. All plants were watered with tap water every second day.
4.2. Fungal Isolate and Inoculum Preparation
A ten-day-old culture of
M. phaseolina isolate MP1 was used to prepare the inoculum. The MP1 isolate was obtained from a hemp field in Vladislavci (45.4646950° N, 18.5674770° E), near Osijek, Croatia. The sequence of isolate MP1 (GenBank accession no. OQ389757) showed 100% nucleotide identity with the reference sequence of
M. phaseolina (GenBank accession no. MG434668) [
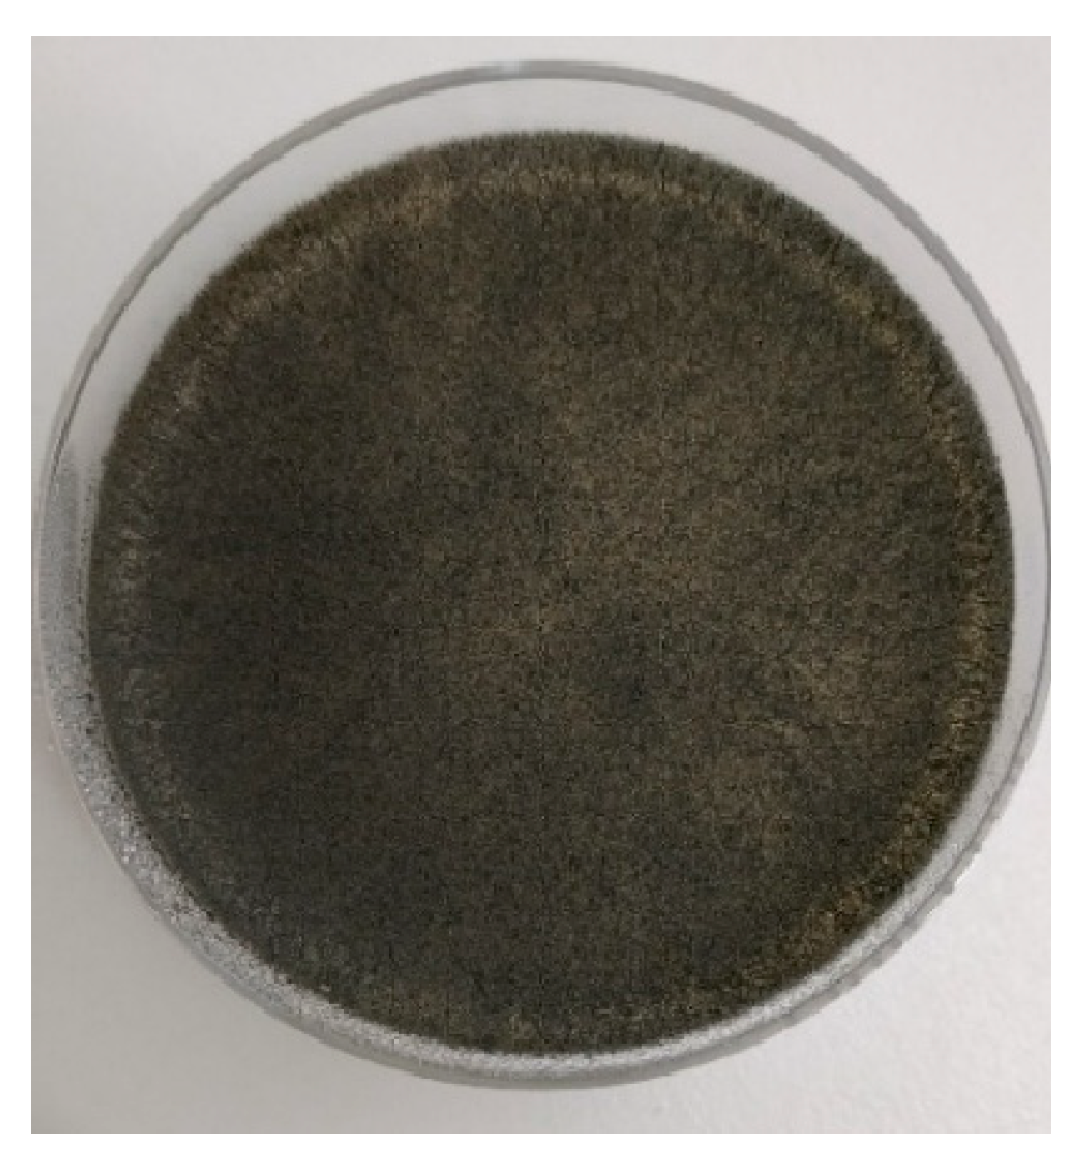
50]. Culture plates were incubated at 28 ± 2 °C for ten days in the dark, producing numerous dark, hard, ovoid microsclerotia (
Figure 6).
4.3. Inoculation Procedure
To assess cultivar susceptibility, ten plants per cultivar were inoculated at the V2 growth stage (fully developed second trifoliate leaf) using the cut-stem method [
51], a standard approach for evaluating soybean resistance to
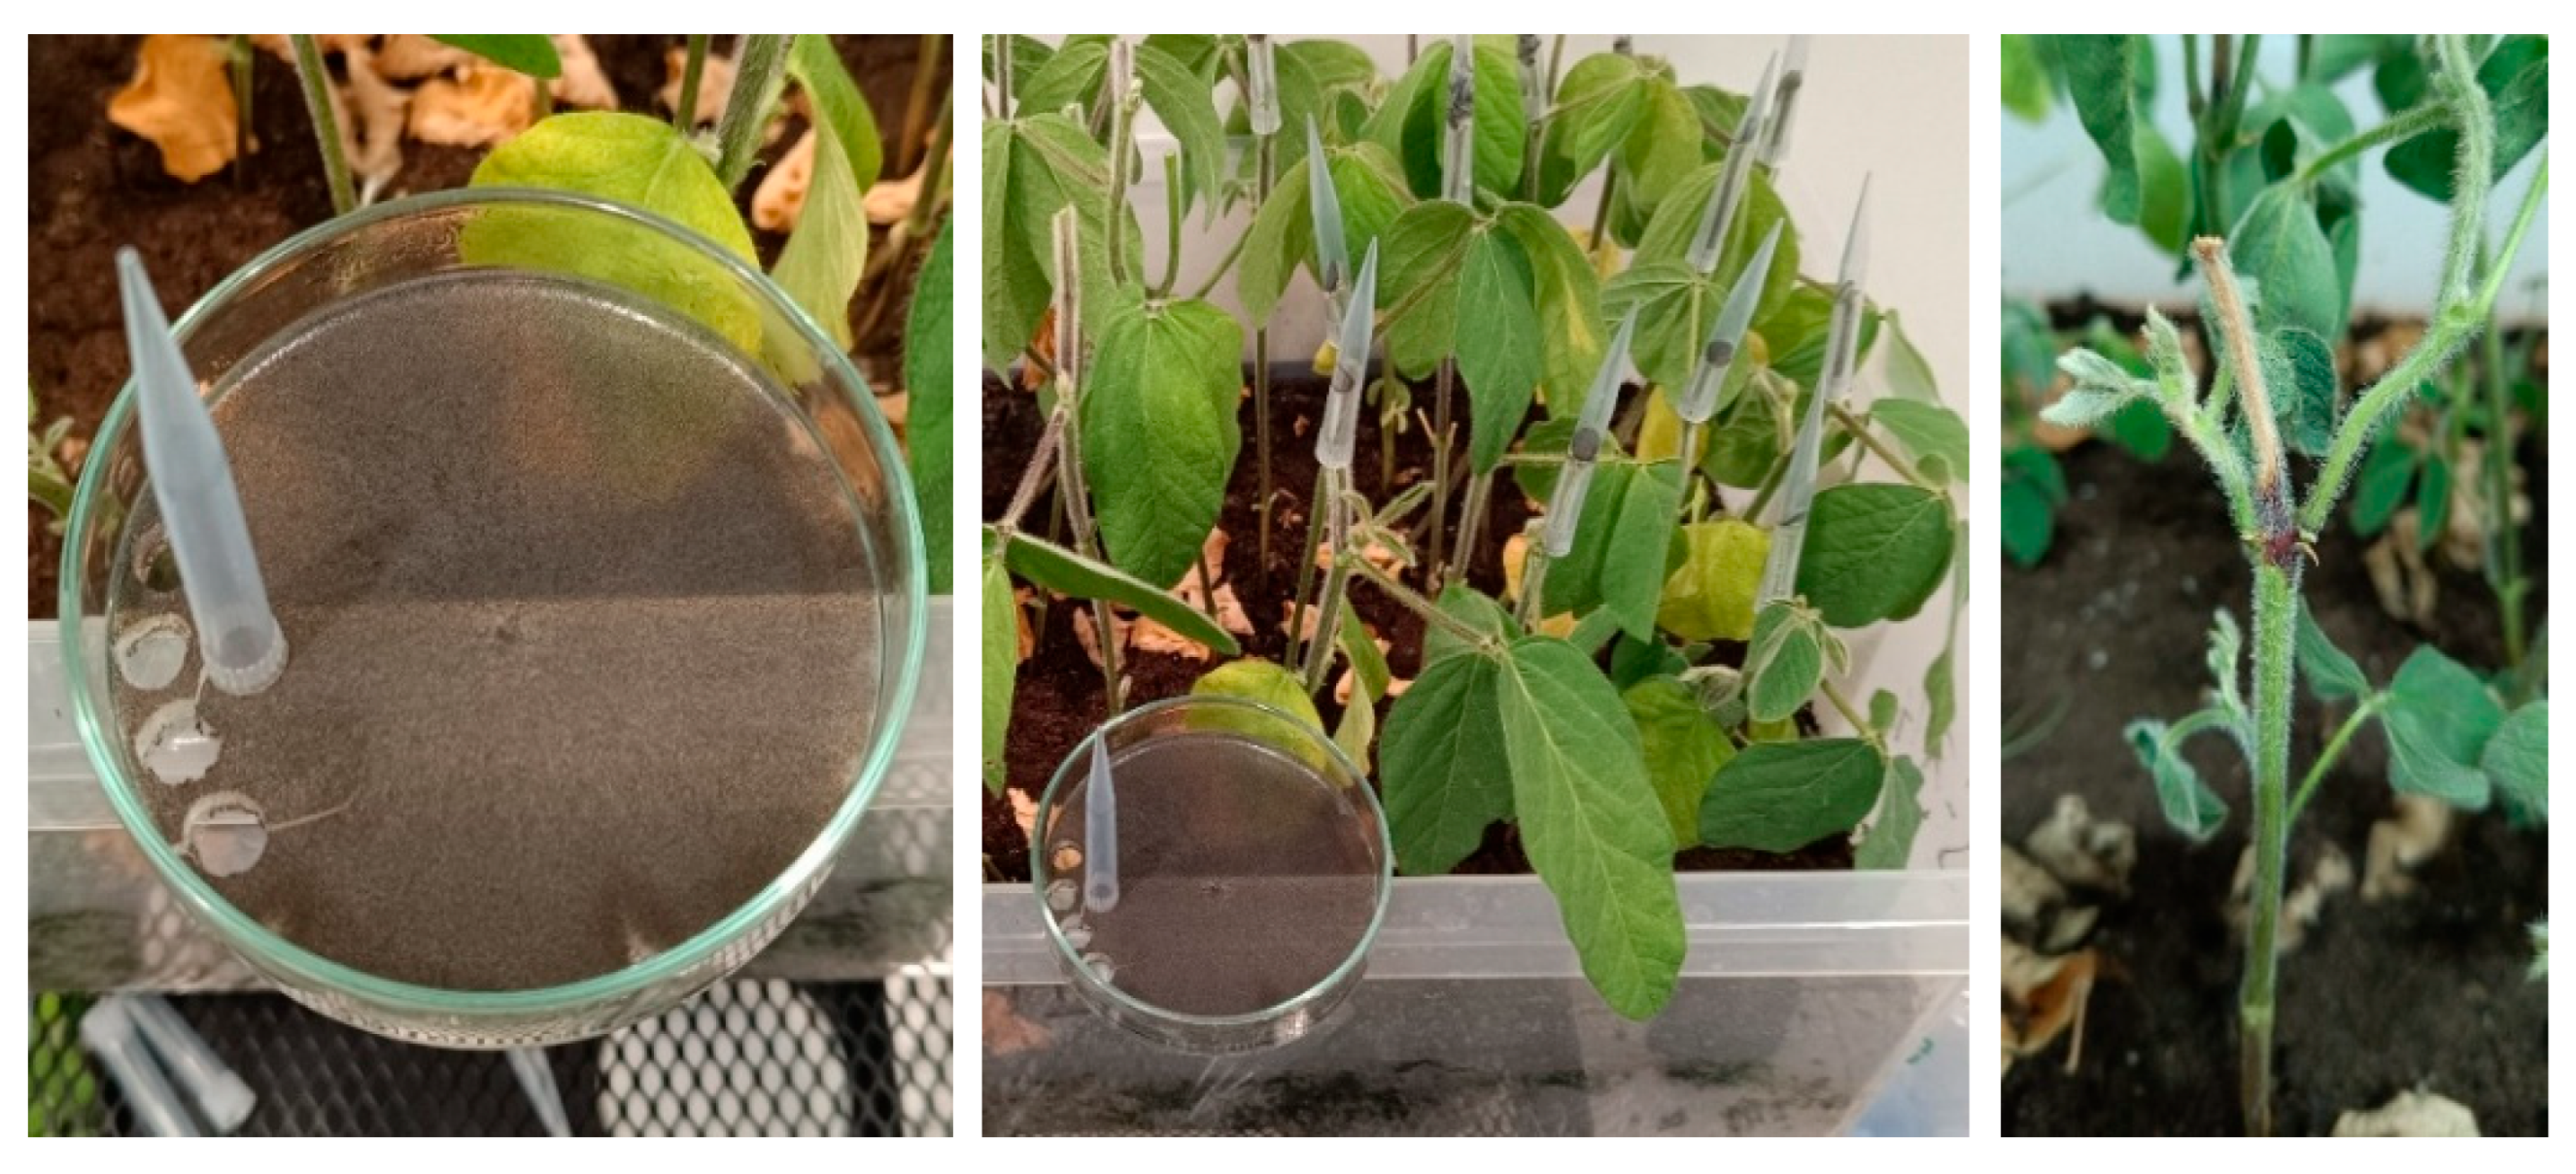
M. phaseolina. Plants were cut 25 mm above the unifoliolate node, and a circular agar disk containing fungal mycelium was placed onto the cut surface (
Figure 7).
The cut-stem inoculation method used for screening soybean susceptibility to M. phaseolina at the V2 growth stage. (A) Agar disks with actively growing fungal mycelium were taken from the margin of a PDA culture using a 200 µL pipette tip. (B) The agar disk was placed on the freshly cut stem surface, 25 mm above the unifoliolate node, to initiate infection. Control plants received sterile agar disks without mycelium.
The open end of a 200-µL pipette tip was pressed into the margin of an actively growing M. phaseolina culture on potato dextrose agar (PDA), and an agar disk was cut and removed. The pipette tip containing the agar disk with fungal mycelium was immediately placed over the cut stem and gently pushed down to secure the agar disk in contact with the stem tissue. Control plants were treated with sterile PDA disks without mycelium.
Following inoculation, pipette tips were removed, and disease progression was visually assessed. Lesion length on stems was measured with a ruler every three to four days for a period of three weeks.
4.4. Growth Conditions and Treatments
The experiment was conducted in a walk-in growth chamber (Fitoclima 10.000 HP; Aralab, Rio de Mouro, Portugal). Two treatments were applied in separate time series: (1) control (C), in which plants were grown under optimal conditions, and (2) cold stress (S), where plants were exposed to low temperatures for three consecutive days simulating 0early-spring cold spells.
The cold-stress treatment (S) began when soybean plants had developed the first fully expanded trifoliate leaf, approximately 20 days after sowing (DAS). The time required for full development of the first trifoliate was previously determined under identical conditions.
The growth chamber maintained a 16 h/8 h (light/dark) photoperiod with a light intensity of 300 μmol m⁻
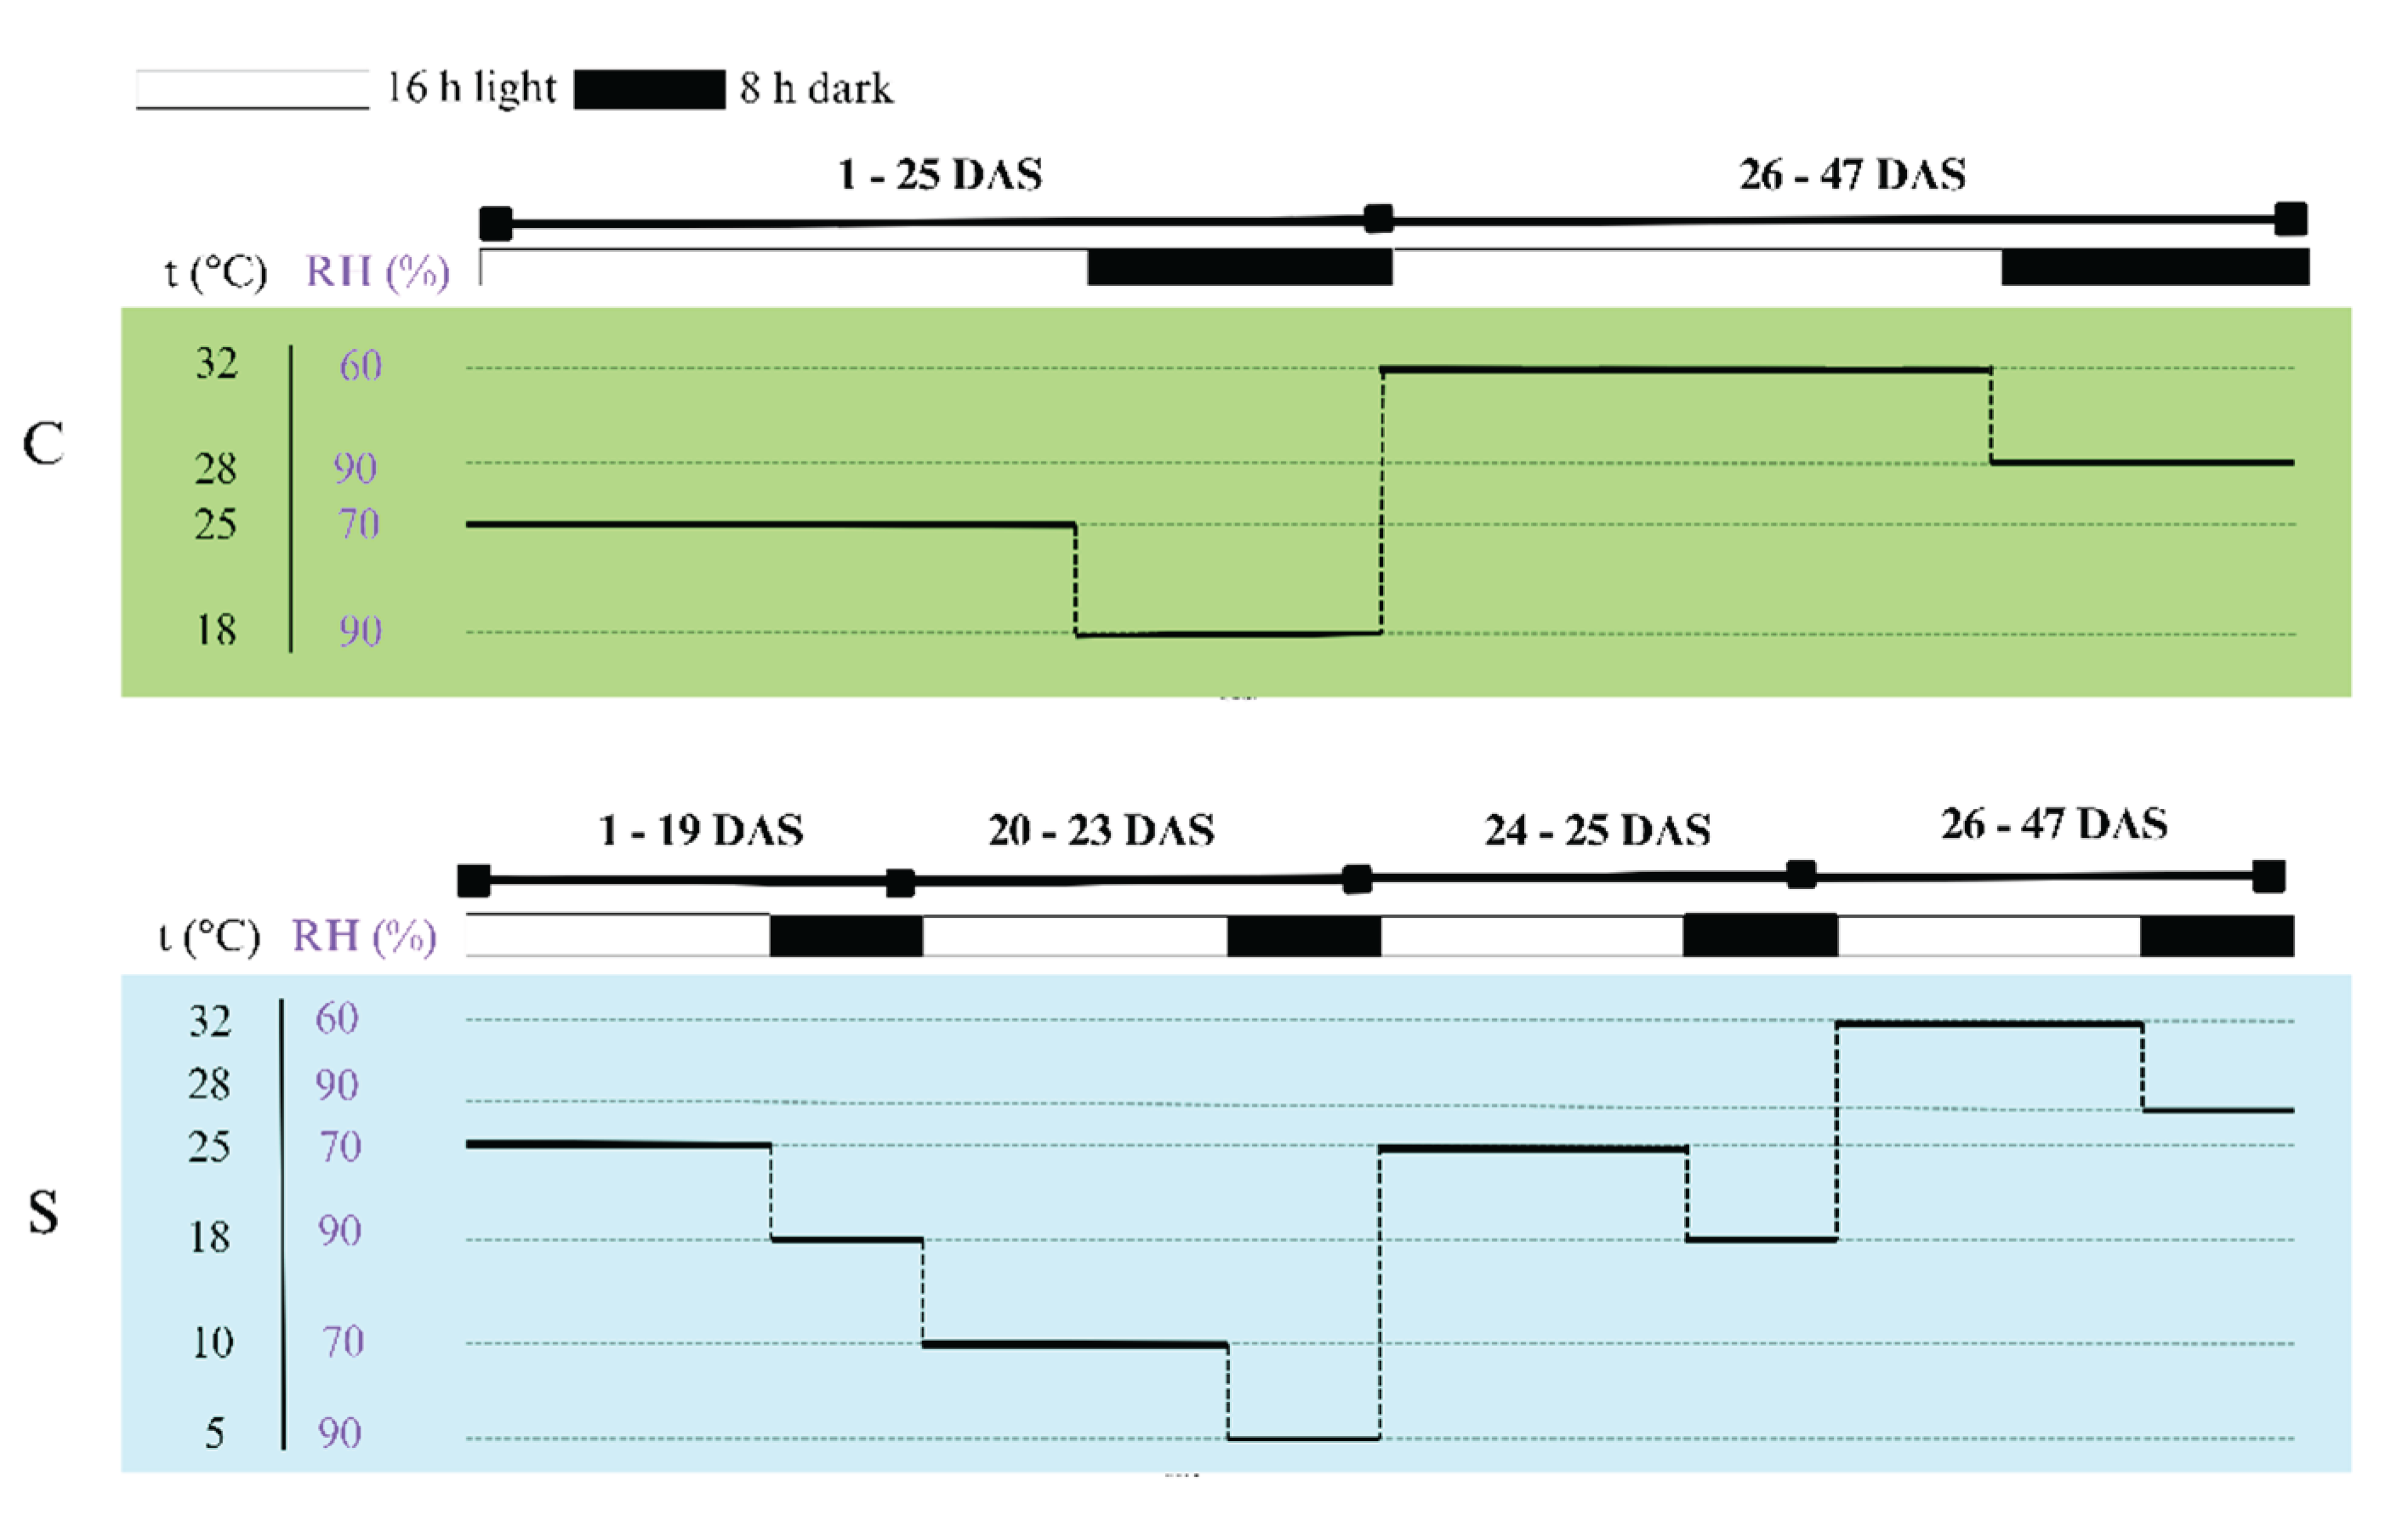
2 s⁻¹. Temperature and relative humidity regimes varied according to treatment and phase (day/night, pre-/post-infection) and are summarized in
Figure 8. Environmental parameters were continuously monitored and recorded using the FitoLog9000 data logger (Aralab, Rio de Mouro, Portugal). The inoculation was performed on the 26th day after sowing (DAS), followed by lesion measurements every three to four days over a 21-day observation period.
Growth-chamber settings for control (C) and cold-stress (S) treatments from day 1 to 47 after sowing (DAS). The diagram shows temperature (t °C), relative humidity (RH %), and light/dark cycles (16 h light / 8 h dark). During the cold-stress treatment, plants were exposed to low temperatures for three consecutive days (20–23 DAS) simulating early-spring cold spells.
4.5. Data Collection and Statistical Analysis
Disease severity was assessed by measuring stem lesion length (mm) every three to four days over a 21-day period following inoculation. For each cultivar, ten plants per replicate were evaluated, and the mean lesion length per replicate was calculated. In addition to lesion length, overall plant vigor and visible disease symptoms (leaf chlorosis, wilting, premature senescence) were qualitatively recorded to complement quantitative data on infection severity.
The obtained data were subjected to statistical analysis to evaluate the effects of cultivar, treatment, and their interaction on M. phaseolina infection. Analysis of variance (ANOVA) was performed using the general linear model (GLM) procedure. When significant differences were detected (p < 0.05), means were separated using Tukey’s Honest Significant Difference (HSD) test. Normality of residuals and homogeneity of variances were verified prior to the ANOVA to ensure compliance with statistical assumptions.
All statistical analyses were performed using STATISTICA 13.0 (TIBCO Software Inc., Palo Alto, CA, USA). Graphical representations of mean lesion lengths and standard errors were generated using GraphPad Prism 9.0 (GraphPad Software, San Diego, CA, USA).
5. Conclusions
This study provides clear evidence that transient cold stress significantly increases soybean susceptibility to Macrophomina phaseolina, particularly during the early stages of infection. The predisposition caused by cold stress was strongest at the initial measurement, indicating that early physiological disturbances play a key role in shaping subsequent disease development.
Genotypes differed markedly in their responses, with some lines (e.g., G9) showing relatively stable lesion development across treatments, while others exhibited substantial increases under cold stress. These results underscore the importance of incorporating cold-stress predisposition into resistance screening and highlight several genotypes as promising candidates for further evaluation and breeding for improved stability.
Given the expected rise in climatic variability—including early-season cold spells combined with mid-season heat and drought—understanding how abiotic stress interacts with charcoal rot will be crucial for developing resilient soybean cultivars. Integrating physiological studies, multi-isolate testing, and field validation will strengthen breeding strategies aimed at mitigating the impacts of this increasingly important disease.
Figure 1.
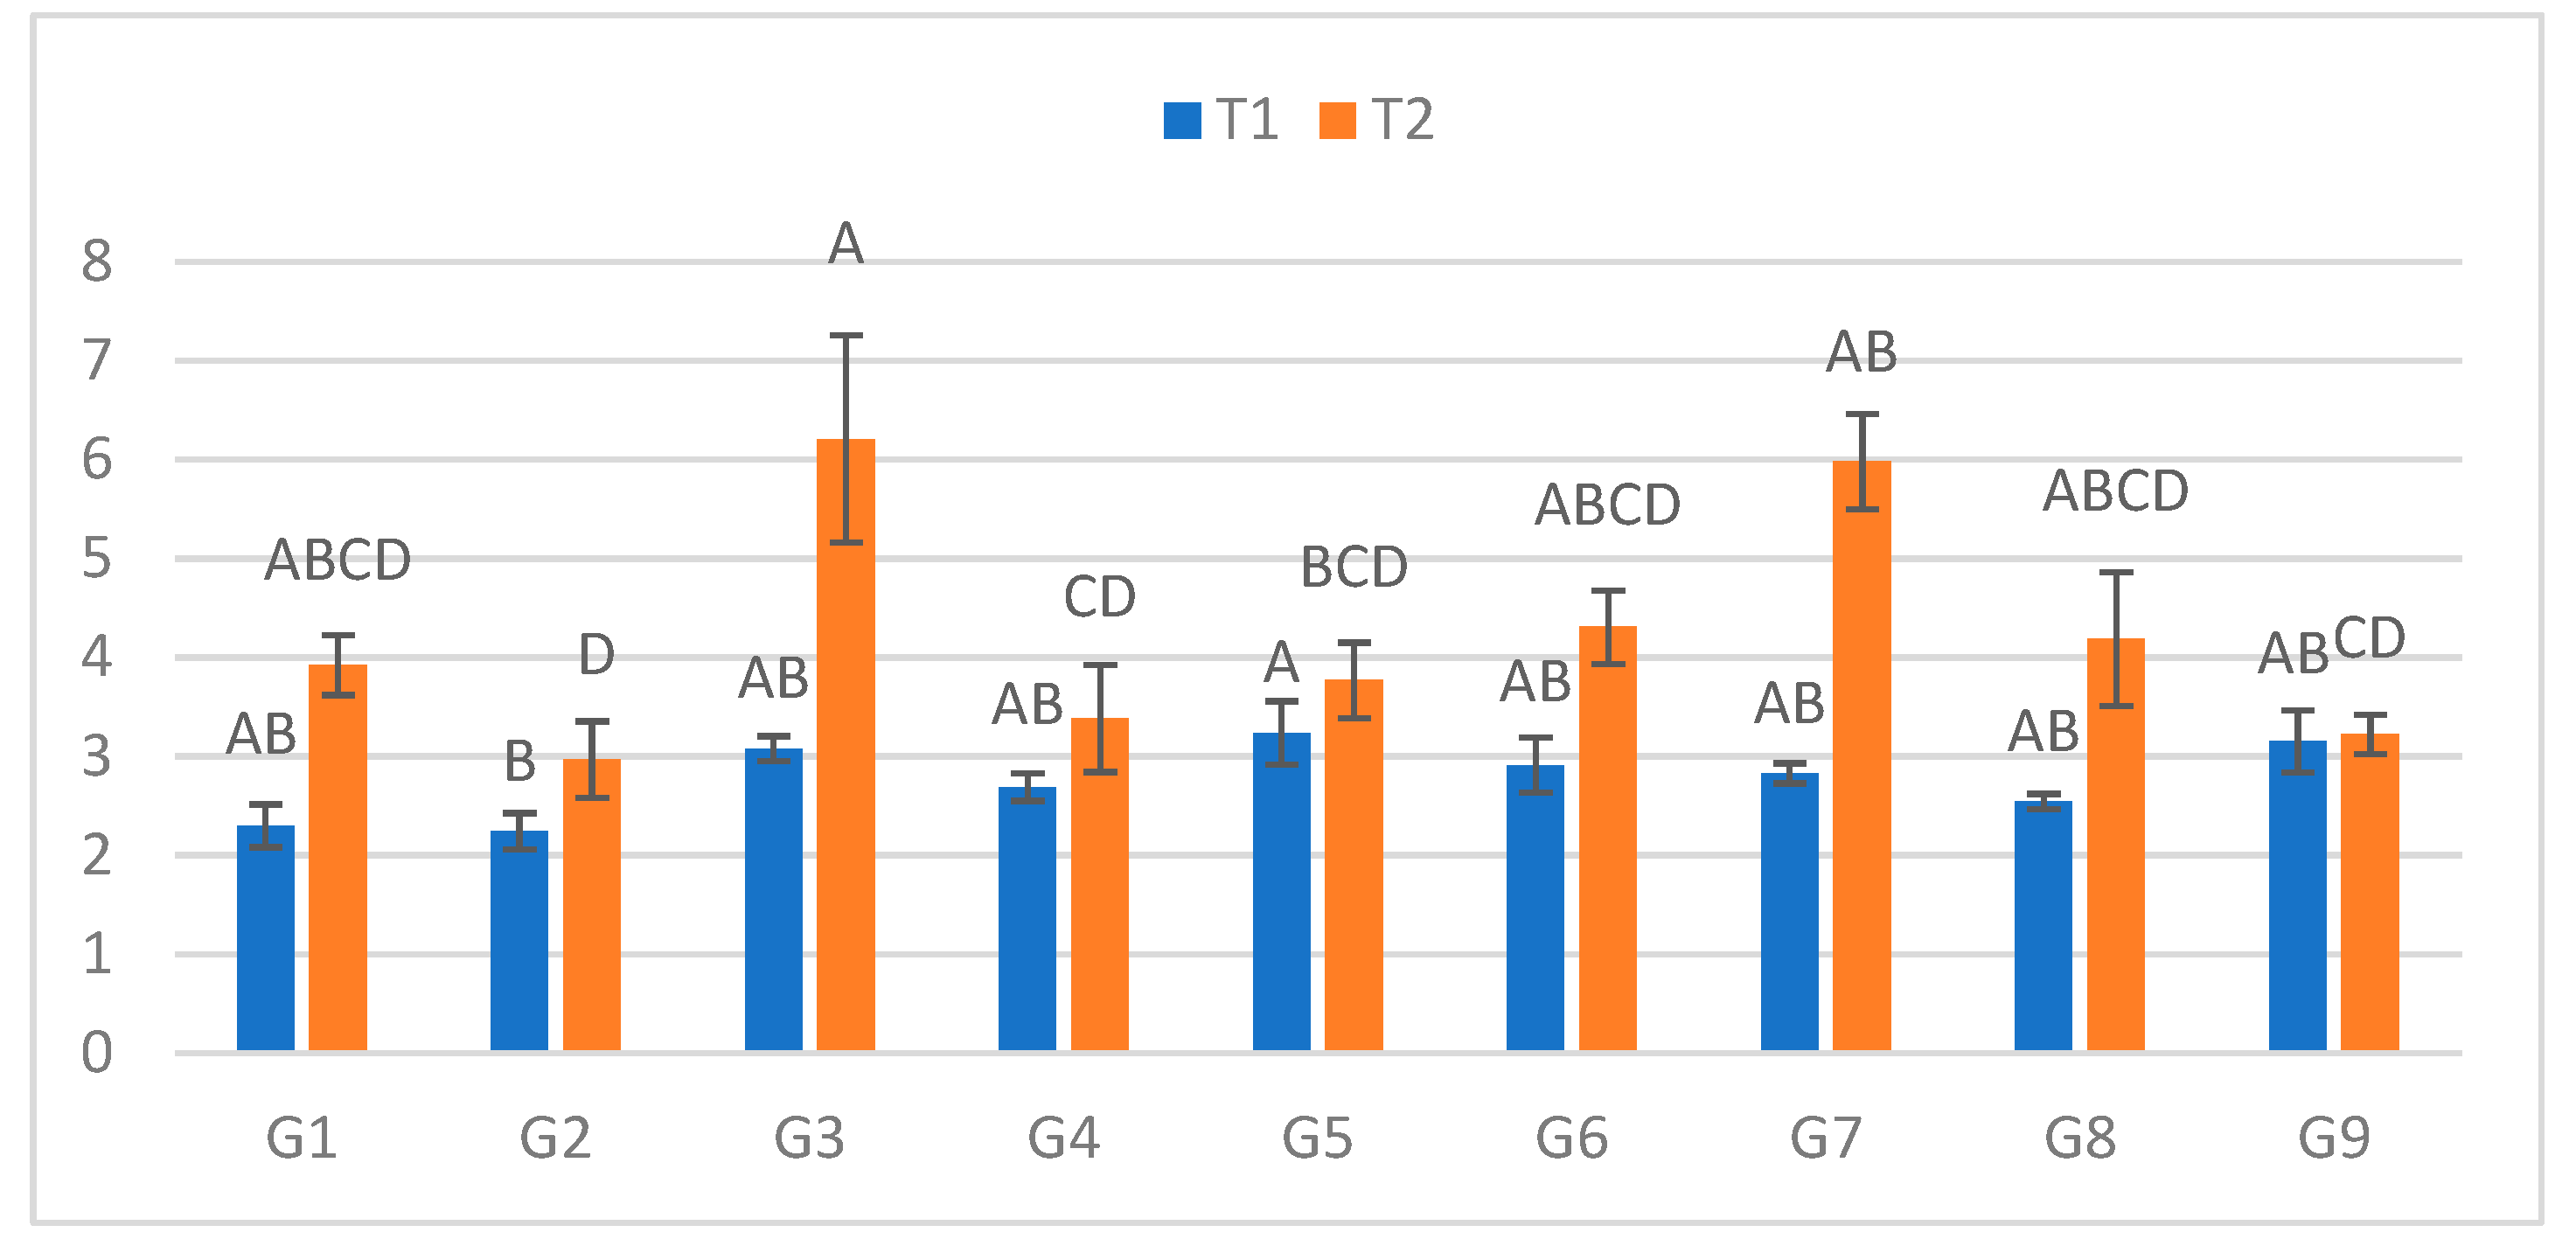
Infection lesion length (cm) at the first assessment by genotype (G1–G9) and treatment (T1 = optimal conditions; T2 = after a 48h low-temperature exposure); n = 20 plants per genotype–treatment. Bars show means ± standard error (SE). Uppercase letters above the T2 columns indicate significant differences among genotypes under cold-stress conditions (one-way ANOVA followed by Tukey’s HSD, α = 0.05).
Figure 1.
Infection lesion length (cm) at the first assessment by genotype (G1–G9) and treatment (T1 = optimal conditions; T2 = after a 48h low-temperature exposure); n = 20 plants per genotype–treatment. Bars show means ± standard error (SE). Uppercase letters above the T2 columns indicate significant differences among genotypes under cold-stress conditions (one-way ANOVA followed by Tukey’s HSD, α = 0.05).
Figure 2.
Infection lesion length (cm) at the second assessment by genotype (G1–G9) and treatment (T1 = optial conditions; T2 = after a 48h low-temperature exposure); n = 20 plants per genotype–treatment. Bars show means ± standard error (SE). Different uppercase letters above the columns indicate significant differences among genotypes within each treatment (one-way ANOVA followed by Tukey’s HSD, α = 0.05).
Figure 3.
Infection lesion length (cm) at the third assessment by genotype (G1–G9) and treatment (T1 = optimal conditions; T2 = after a 48h low-temperature exposure); n = 20 plants per genotype–treatment. Bars show means ± standard error (SE). Different uppercase letters above the columns indicate significant differences among genotypes within each treatment (one-way ANOVA followed by Tukey’s HSD, α = 0.05).
Figure 4.
Infection lesion length (cm) at the fourth assessment by genotype (G1–G9) and treatment (T1 = optimal conditions; T2 = after a 48h low-temperature exposure); n = 20 plants per genotype–treatment. Bars show means ± standard error (SE). Different uppercase letters above the columns indicate significant differences among genotypes within each treatment (one-way ANOVA followed by Tukey’s HSD, α = 0.05).
Figure 5.
I Infection lesion length (cm) at the fifth assessment by genotype (G1–G9) and treatment (T1 = optimal conditions; T2 = after a 48h low-temperature exposure); n = 20 plants per genotype–treatment. Bars show means ± standard error (SE). Different uppercase letters above the columns indicate significant differences among genotypes within each treatment (one-way ANOVA followed by Tukey’s HSD, α = 0.05).
Figure 6.
M. phaseolina isolate MP1 grown on potato dextrose agar (PDA) after 10 days of incubation at 28 ± 2 °C in the dark. The culture produced numerous dark, hard, ovoid microsclerotia used for inoculum preparation.
Figure 6.
M. phaseolina isolate MP1 grown on potato dextrose agar (PDA) after 10 days of incubation at 28 ± 2 °C in the dark. The culture produced numerous dark, hard, ovoid microsclerotia used for inoculum preparation.
Figure 7.
The cut-stem inoculation method used for screening soybean susceptibility to M. phaseolina at the V2 growth stage. (A) Agar disks with actively growing fungal mycelium were taken from the margin of a PDA culture using a 200 µL pipette tip. (B) The agar disk was placed on the freshly cut stem surface, 25 mm above the unifoliolate node, to initiate infection. Control plants received sterile agar disks without mycelium.
Figure 8.
Growth-chamber settings for control (C) and cold-stress (S) treatments from day 1 to 47 after sowing (DAS). The diagram shows temperature (t °C), relative humidity (RH %), and light/dark cycles (16 h light / 8 h dark). During the cold-stress treatment, plants were exposed to low temperatures for three consecutive days (20–23 DAS) simulating early-spring cold spells.
Table 1.
Two-way ANOVA summary for stem lesion length across the five assessments (M1–M5). Factors are treatment (T), genotype (G), and their interaction (T × G). Values shown are F-statistics with corresponding p-values; common degrees of freedom are df(T)=1, df(G)=8, df(T×G)=8, and residual df=342.
| Sources of variation |
df |
M1-F(p) |
M2-F(p) |
M3-F(p) |
M4-F(p) |
M5-F(p) |
| TREATMENT (T) |
1 |
605.448 (<.001) |
52.973 (<.001) |
49.509 (<.001) |
44.541 (<.001) |
55.093 (0.025) |
| GENOTYPE (G) |
8 |
3.041 (0.003) |
4.010 (<.001) |
3.529 (<.001) |
4.310 (<.001) |
5.042 (0.025) |
| T x G |
8 |
3.145 (0.002) |
2.965 (0.003) |
2.099 (0.035) |
2.235 (0.025) |
3.554 (0.025) |
| Residuals |
342 |
|
|
|
|
|