
Submitted:
03 December 2025
Posted:
03 December 2025
You are already at the latest version
Abstract
The cave of Altamira (Spain), a UNESCO World Heritage site, contains one of the most fragile and inaccessible Paleolithic rock-art environments in Europe, where conventional geomatics workflows are limited by severe spatial, lighting, and safety constraints. This study applies a confined-space UAV equipped with LiDAR-based SLAM navigation to document and assess the stability of the vertical rock wall leading to “La Hoya” Hall, a structurally sensitive sector of the cave. Twelve autonomous and assisted flights were conducted, generating dense LiDAR point clouds and video sequences processed through videogrammetry to produce high-resolution 3D meshes. A Mask R-CNN deep learning model was trained using manually segmented images to automatically detect cracks under variable illumination and viewing conditions. The results reveal active fractures, overhanging blocks, and sediment accumulations located on inaccessible ledges, demonstrating the capacity of UAV-SLAM workflows to overcome the limitations of traditional surveys in confined subterranean environments. All datasets were integrated into the DiGHER digital twin platform, enabling long-term storage, multitemporal comparison, and collaborative annotation. The study confirms the feasibility of UAV-based SLAM mapping combined with videogrammetry and deep learning segmentation as a robust approach for structural assessment and preventive conservation in Paleolithic caves and similarly constrained cultural heritage contexts.
Keywords:
confined-space UAV
; LiDAR SLAM
; videogrammetry
; structural monitoring
; Digital Twin
; rock wall stability in Paleolithic caves
; Cultural Heritage conservation
; cave of Altamira
; deep learning crack detection
1. Introduction
The cave of Altamira (Santillana del Mar, Cantabria, Spain) (Figure 1 and Figure 2) contains one of the most remarkable ensembles of Paleolithic rock art in Europe, featuring polychrome representations of bison, horses, deer and hand stencils [1,2,3,4,5,6,7,8]. The site was inscribed on the UNESCO World Heritage List in 1985 for its Outstanding Universal Value. Its significance lies not only in the exceptional artistic quality of the paintings, among the earliest recognised as Paleolithic in Europe, but also in the remarkable preservation of the karstic environment in which they are embedded.
The inherent vulnerability of rock art makes structural monitoring a key tool for preventive conservation and long-term heritage management [9,10,11,12,13]. This is particularly critical in subterranean contexts, where confined and environmentally sensitive conditions amplify the challenges associated with documentation, monitoring and conservation efforts. Decorated caves are highly stable but sensitive micro-ecosystems that can be disrupted by variations in microclimate, ventilation patterns, CO₂ concentration, humidity or anthropogenic presence [14]. Such alterations favour microbial colonisation, condensation processes and the physical degradation of pigments and rock surfaces. In caves with rock art, studies have shown that imbalance in environmental conditions facilitates microbial growth and biodeterioration, while the geological dynamics of karstic systems (such as collapses, structural instability or ground movement) further complicate preservation strategies. In the cave of Altamira, these factors have historically required consolidation interventions and strict environmental monitoring protocols to ensure long-term conservation.
In December 2024, the geomatics recording of the rock wall at the entrance to the La Hoya Hall, located inside the cave of Altamira, was carried out as part of the experimental project for documentation and monitoring within the cave.
This intervention forms part of a methodological proposal for conservation that relies on geomatics techniques, including videogrammetry, 3D laser scanning, and high-resolution image acquisition. The action addresses a geological issue related to the need for structural control and monitoring of this vertical surface. The wall exhibits a marked state of deterioration, evidenced by the presence of cracks of varying lengths and dimensions, as well as by a substantial accumulation of sedimentary material along the different natural ledges that define it. Furthermore, the height of the wall and the configuration of these ledges constitute the main challenge for accurate documentation, as they hinder physical access and prevent direct observation.
Figure 1.
Location of the study area on the PNOA-IGN cartographic base. Topographic plan of the cave adapted from the Spanish Ministry of Culture [15].
Figure 1.
Location of the study area on the PNOA-IGN cartographic base. Topographic plan of the cave adapted from the Spanish Ministry of Culture [15].

Figure 2.
Landscape evolution of the cave area from the mid-20th century to the present, derived from IGN base data.
Figure 2.
Landscape evolution of the cave area from the mid-20th century to the present, derived from IGN base data.

To overcome these difficulties, a secure and controlled recording and monitoring strategy based on an unmanned aerial vehicle (UAV) was selected. The UAV is specifically engineered for the safe inspection of confined spaces, a capability originally developed for industrial environments. This platform is equipped with a 4K-resolution RGB camera, a thermographic camera, and a 3D LiDAR laser-scanning system based on SLAM technology, which, simultaneously with image capture, generates a point cloud that references each image acquired and facilitates spatial localisation within the cave. The acquired images were used to train a crack segmentation model based on Mask R-CNN architecture [16].
Mask R-CNN has emerged as one of the most influential deep learning frameworks for instance segmentation and has seen growing adoption in crack detection across a range of scientific and engineering domains [17,18,19,20,21]. Its capacity to generate pixel-level segmentation masks while simultaneously performing object detection makes it particularly well suited to challenging environments such as Paleolithic caves, where cracks are often subtle, morphologically irregular, and embedded in noisy or textured backgrounds [22,23]. Building on the Faster R-CNN architecture, Mask R-CNN incorporates a dedicated mask prediction branch and typically employs a deep convolutional backbone (e.g., ResNet) combined with a Region Proposal Network, thereby enabling the precise localization and delineation of fine surface discontinuities [20].
Therefore, we present the results of applying a confined-space drone equipped with LiDAR-SLAM, integrating videogrammetry and automated crack segmentation to assess rock-surface stability and to put forward a new preventive-conservation approach. All the collected information was subsequently integrated into a digital twin of the cave through the DiGHER platform, in order to facilitate collaborative analysis.
2. Materials and Methodology
2.1. Study Area
The cave of Altamira is located in the municipality of Santillana del Mar (Cantabria, northern Spain) (Figure 2 and Figure 3), on the western flank of a small karstic valley developed in Cretaceous limestones. The cave extends for approximately 270 meters and consists of a series of chambers and galleries formed by dissolution processes characteristic of the Cantabrian karst system. Its stable interior microclimate (characterized by low air circulation, high relative humidity, and limited thermal variability) creates highly sensitive environmental conditions that directly influence the preservation of both geological structures and Paleolithic parietal art [24].
The study area corresponds to the vertical rock wall that provides access to the La Hoya Hall, one of the deepest sectors of the cave (Figure 4). This wall is composed of stratified limestone exhibiting pronounced verticality and complex fracture patterns, including open joints, exfoliation surfaces, and detached blocks. The morphology of this sector promotes the accumulation of unconsolidated sediment on natural ledges, while its inaccessibility and confined geometry complicate direct observation and conventional surveying methods.
La Hoya Hall is classified as a critical zone within the conservation framework due to its geological instability and restricted accessibility. The combination of structural fragility, active cracking, and microenvironmental sensitivity necessitates non-invasive, high-resolution documentation and monitoring strategies. These conditions make the site particularly suitable for confined-space UAV operations integrating LiDAR SLAM and videogrammetric techniques, enabling detailed analysis of rock-wall stability and contributing to broader preventive conservation efforts within the cave.
2.2. Geological and Historical Background
The cave of Altamira is located at the top of the Santillana del Mar karst system, 159 meters above sea level, and developed within geological units of Cenomanian–Turonian age (Late Cretaceous). These units are characterized by marked stratification in metric beds of alternating limestone and calcarenite, separated by thin marl–clay layers. This stratification governs the morphology of the chambers and galleries of the cave, particularly the configuration of the ceilings, which form flat slabs affected by hydroplastic deformations. Together with stratification, the discontinuities of the rock mass constitute the second essential element shaping the cavity, defining water circulation routes and representing a key factor in the stability of the galleries.
Measuring just 290 meters in length, the cave consists of a main gallery from which two chambers branch off: the Polychrome Hall and La Hoya Hall, located approximately 200 meters from the cave entrance. “Hoya” (like hoyo, joyo, or juyo) is a linguistic variant used in Cantabria to refer to a depression, cavity, or hole. It therefore indicates its position at a lower level than the rest of the cave. Even though it is the deepest gallery in the system, it lies only 14 meters from the outer hillside (Figure 3 and Figure 4).
The La Hoya Hall was included in tourist visits, and access to it was arranged during the 1950s or 1960s. To facilitate the descent, stairs were built to overcome the 6-meter drop leading into the chamber. At the entrance, clear evidence of artificial modification can be observed: controlled blasting was used to regularize the opening, as shown by open fractures and blast marks on the walls.
Above the lintel of the entrance to the La Hoya Hall lies a nearly vertical wall about 12 meters high. At its upper end, remnants of black pigment are visible in an area now inaccessible but evidently used during the Upper Paleolithic period. Several cracks and blocks detached from the wall can be observed, along with clay accumulations, loose stones, and boulders resting on ledges and protrusions—elements that could not be accessed for recording their exact position or assessing the risk they may pose if dislodged.
To assess the condition of the rock mass hosting the cave galleries, a geological risk study was conducted in 2014 using geomechanical monitoring stations [12]. This study characterized fracturing patterns and the state of discontinuities in La Hoya, identifying a high overall risk level, and a particularly high to very high risk in the access zone (Figure 5). The rock mass exhibits a very high degree of fracturing, with fracture apertures exceeding 1 cm [25], low to medium persistence, visible water circulation along fracture planes, and clay-filled fissures. These fractures also show a high degree of interconnection, producing decimetric blocks above the visitor pathway and several cantilevered blocks. According to the applied assessment system, this area was classified within the maximum level of point-type risk, requiring systematic monitoring of potential block movements.
To evaluate these potential displacements, two digital crackmeters with continuous recording and micron-level resolution were installed. The installation was carried out using metal supports fixed to the stairs leading to the chamber, thus preventing the transmission of vibrations to unstable blocks during placement (Figure 5). Each sensor includes an onboard data logger, allowing monthly data downloads with minimal intervention.
The results show a close relationship between rainfall and block displacement [26]. When accumulated rainfall exceeds 250 mm, the sensors record movements after approximately 24 hours (the time required for water to percolate through discontinuities until reaching the clay fillings). When rainfall is below 250 mm, the delay is longer, or no significant displacement is detected. Periods of sustained heavy rainfall over several days produce continuous movements that cease only after several dry days.
Since this chamber is part of the public tour route and is also used regularly by the scientific team working inside the cave, the situation of elevated risk highlighted the need for a more accurate assessment of the condition of the wall.
This area is located in the intermediate section of the cave of Altamira (Figure 5), identified as area VI within the sequence of spaces that make up the cavity. However, the rock wall documented in this study is actually situated above the access to this chamber, within area VII, known as the "Great Hall," one of the largest spaces in the entire cave.
Given the complex geological structure of the cave of Altamira, particularly the pronounced instability observed in the La Hoya Hall area, ongoing monitoring and documentation efforts are essential for understanding the evolving condition of the cave. The accumulation of sediment, extensive fracturing, and the vertical orientation of the rock wall above the access to La Hoya Hall present significant challenges for traditional surveying techniques. These factors, combined with the history of structural interventions and the continuous risk of collapse, make La Hoya Hall an ideal candidate for applying advanced geomatics methods, such as UAV-based LiDAR and videogrammetry, to monitor and document the condition of the cave with greater precision and detail. The following case study presents the application of these innovative techniques to assess the stability and structural integrity of this critical area.
La Hoya Hall is considered one of the most structurally vulnerable sectors within the Altamira karst system [12]. This instability is intrinsically linked to the geological characteristics of the cavity. The cave is located in the upper region of a Pliocene karst, characterized by a tabular structure of limestones with a marked inclination in the fracture planes. This configuration leads to a geomorphological evolution dominated by successive gravitational collapses, rather than by chemical dissolution processes [11,27]. As such, the karst system exhibits a tendency toward progressive collapse, marking a terminal geological state in which destructive processes predominate over sedimentation.
Historical documentation since the discovery of the cave has confirmed the continuous dynamics of this structural degradation process, with recorded collapse events in 1924 and 1935, although they continue to the present day. In response to this documented critical instability, structural corrective measures were implemented during the 1940s and 1950s, notably the construction of artificial walls that served a threefold purpose: direct support for ceiling strata threatened by collapse, containment of potentially detachable blocks, and safety for visitor access. Simultaneously, cracks and fractures were sealed by filling with hydraulic mortar for superficial fissures and cement injections for deeper fractures. While these interventions successfully stabilized the cavity structurally, they also contributed to microenvironmental modifications, including alterations to ventilation patterns, drainage pathways, isolation of previously interconnected sectors, disruption of microclimatic equilibrium, and the creation of new water infiltration problems [28].
Recent years have seen efforts to better understand the structural specifics of the cavity, particularly in La Hoya Hall. Geophysical prospecting using Ground Penetrating Radar (GPR) has enabled precise characterization of the internal architecture of discontinuities within La Hoya Hall [24], revealing a significant concentration of vertical and subvertical discontinuities that can be classified into three main categories: deep developmental structures (>3.80 m), establishing direct hydraulic connections between the exokarst and endokarst; an interconnected system of joints forming a complex network; and areas where structural weakness planes, corresponding to potential or initial detachment phases, are detected.
Recent studies indicate that La Hoya Hall is experiencing active geological impacts of gravitational, hydrogeological, and weathering nature. The current management strategy focuses on preventive conservation principles: continuous non-invasive monitoring, strict environmental control, and, with regard to the subject of this study, systematic documentation through various high-resolution systems for early detection of structural changes and volumetric evolution within the space.
The general geological structure of the cave is characterised by the presence of almost horizontal strata, up to one metre thick, separated by thin clay layers. The cave exhibits an unstable geodynamic behaviour, with frequent roof collapses and gravitational subsidence of the cave floor.These processes produce rockfalls in the form of large blocks, leaving traces in the form of planar surfaces, breaks with trapezoidal cross-sections, and a floor composed of a chaotic accumulation of collapsed blocks (an arrangement observed repeatedly throughout the cavity). The rock wall of the Hall VII that provides access to the La Hoya Hall is no exception to this phenomenon. This situation underscores the need to establish a methodology that enables proper monitoring and long-term structural assessment.
The wall examined in this study is a vertically oriented rock surface, approximately 14 m wide and reaching a maximum height of 11.74 m, with a frontal extent of 7.96 m. As noted above, this wall presents two main issues.
First, the vertical surface displays an irregular morphology resulting from stratigraphic alternation, which gives rise to projections of varying dimensions, some extending between 30 and 40 cm. These overhangs constitute a risk factor by facilitating the accumulation of substantial volumes of unconsolidated sedimentary material derived from erosion processes and rockfall events.
The second issue is the high degree of fracturing, particularly in the area corresponding to the direct access to the La Hoya Hall. Although this main fracture has already been subjected to structural inspection, the micro-geological condition of the overlying zone remains unknown. It is likely that fractured blocks are present across the entire vertical surface, although they are not easily identifiable through direct visual observation.
This context poses considerable difficulties for accurate documentation of the rock mass, primarily due to its substantial height. Moreover, the presence of the access to the La Hoya Hall further complicates the use of conventional recording techniques, such as digital-camera photogrammetry or terrestrial 3D laser scanning, given the morphology and spatial constraints of the area.
2.3. Materials
Due to the spatial constraints and the specific characteristics of the wall, the documentation work was carried out using a drone specifically designed to operate in confined environments. This system enables the simultaneous acquisition of photographs and the recording of a three-dimensional point cloud that references each image, providing an accurate and detailed basis for the structural analysis of the entire chamber. The model employed was the Elios 3, manufactured by Flyability (Figure 6). This drone is equipped with a 4K Ultra HD RGB camera, with a resolution of 3840 × 2160 pixels at 30 frames per second, a thermographic camera and a LiDAR scanning system. The RGB camera is mounted on a support allowing up to 180° rotation along the X-axis (Table 1). It should be noted that the primary purpose of the camera is not to acquire individual photographs, but rather to continuously record video during the flight, enabling real-time documentation of the entire surface being surveyed.
Its operational features also include the ability to regulate the four front LED lights with which it is equipped, reaching up to 16,000 lumens. In addition, the drone allows the alternate activation of the lateral lights, enabling the creation of different lighting configurations to enhance micro-reliefs and surface details on the inspected rock face.
The system is complemented by an Ouster OS0-32 LiDAR sensor with 32 channels [29] which employs SLAM technology for mobile mapping (Figure 7). This sensor enables the generation of a three-dimensional point cloud during flight, with a ranging precision that varies between approximately ±0.8 cm at short distances and ±4 cm at longer ranges (Figure 12). The device is particularly useful, as it allows the precise spatial location of each video frame to be registered within the point cloud generated during the inspection. Another notable feature is that it is an indoor drone equipped with anti-collision proximity sensors and a protective cage made of highly resistant materials such as carbon fibre. This cage prevents accidental impacts from compromising the stability of the drone or damaging critical components such as the propellers. The design, inherited from its original functional use in industrial inspection, is fundamental when operating in caves for heritage documentation. Its protective structure ensures safe operation for both personnel and the cave environment, making it exceptionally well suited for this type of application.
To ensure adequate working conditions and, in particular, to guarantee optimal illumination during video capture in each flight, it was necessary to install auxiliary lighting points strategically distributed throughout the area. These spotlights were placed along the entire frontal zone facing the rock surface under study. In total, four light sources were positioned, each oriented directly towards the area to be documented. Their purpose was to uniformly illuminate the surface without oversaturating it, functioning exclusively as ambient lighting and significantly improving visibility conditions during the flights.
2.4. Methodology
The proposed method aims to accurately document the access wall to the La Hoya Hall. This documentation is intended to serve as a baseline for monitoring the evolution of fractures and identifying potential unstable blocks, thus enabling future comparisons and assessments of the structural condition of the rock mass (Figure 8).
Another key objective is the detailed observation and characterisation of the material accumulated on the ledges formed along the rock surface. The aim is to individuate each fragment, record its size, and analyse how it is arranged on its respective ledge, in order to better understand the erosion and accumulation processes affecting the wall.
The inspection of the fracture network constitutes an additional fundamental aspect of the study, with priority given to achieving an accurate representation of fracture continuity and aperture, particularly those developing parallel to the rock surface. These fractures are of particular concern, as their distribution across the entire wall may intersect with other discontinuities, leading to the formation of detached rock blocks. In the context of a vertical wall, such blocks could be left almost cantilevered, suspended over the access to the La Hoya area, representing a significant potential hazard.
The objectives outlined above require a series of technical specifications aimed at ensuring adequate documentation and structural inspection. For this purpose, high-definition imagery of the area was acquired and integrated into a three-dimensional environment, a requirement that forms the basis of the technical approach developed in this study. Furthermore, the metric demands of the project required the results to achieve, at minimum, millimetric accuracy.
Although several documentation campaigns have been carried out to generate high-resolution orthophotos (with accuracies reaching up to 2 mm/pixel) the natural configuration of the rock surface and its considerable height prevent these products from being generated satisfactorily (Figure 9). Orthophotos produced in previous campaigns cannot be used in this case, as they do not provide the perspective or resolution necessary to reliably identify fissures or sediment accumulations on the ledges. This is largely due to distortions and aberrations introduced during orthophoto generation when they rely on automatic correlations derived from photogrammetric 3D models captured from lower vantage points.
This acquisition strategy is framed DiGHER project (Digital Twins for Cultural Heritage), funded by MCIU/AEI/10.13039/501100011033 and by the European Union “NextGenerationEU”/PRTR. DiGHER addresses a long-standing challenge in cultural heritage management: the technological fragmentation and dispersion of geomatics, monitoring and documentation data across heterogeneous repositories and formats. DiGHER develops a multiscale, multitemporal and multispectral web platform based on digital twins that integrates data from multiple sources (LiDAR, videogrammetry, photogrammetry, historical imagery, IoT sensors, etc.) into a single coherent environment. Within this environment, 3D point clouds, meshes, time-stamped image sequences and semantic annotations can be jointly explored, compared over time and enriched by domain experts. The platform is conceived as a tool for long-term monitoring and preventive conservation—facilitating the early detection of structural or environmental changes—as well as for research and public dissemination through web-based visualisation interfaces. Its design follows the FAIR (Findable, Accessible, Interoperable and Reusable) [30] data principles, so that datasets and derived products can be systematically stored, shared and reused. In this context, the data acquired during the monitoring of access to La Hoya Hall in the cave of Altamira have been deployed within the DiGHER platform, so that researchers at the Museo Nacional y Centro de Investigación de Altamira can easily access them and use them in monitoring and research initiatives focusing on the cave itself.
Within this unified digital twin environment, the extracted image sequences served as the input dataset for the Deep Learning–based crack detection model. The segmentation workflow was based on the standard Mask R-CNN architecture [16] (Figure 10), consisting of a Backbone ResNet50 + FPN that extracts multi-scale feature maps through lateral 1×1 convolutions and top-down fusion. These feature maps feed into the Region Proposal Network (RPN), a fully convolutional module that predicts candidate object coordinates and objectness scores. RoI Align then accurately samples features for each proposal, preserving spatial alignment before forwarding them into two parallel heads: a classification branch with FC layers that outputs the object category and refined bounding-box coordinates, and a Fully Convolutional Network (FCN) branch that generates high-resolution instance masks. Together, these three branches (RPN proposals, category prediction, and pixel-level mask segmentation) enable end-to-end learning of detection and segmentation across objects of different scales.
Training deep learning models typically requires large, high-quality annotated datasets. In this study, we adopted a transfer-learning strategy by combining a photo-interpreted crack dataset with pre-training on the COCO dataset [31]. Transfer learning is particularly effective for specialized tasks such as crack detection, where annotated data are often limited. By initializing the Mask R-CNN model with weights learned from COCO, the network benefits from general visual features (such as edges, textures, and geometric structures) thereby reducing computational cost and training time while improving convergence and performance [32].
The COCO dataset contains over 300,000 images across 80 object categories. Our photo-interpreted dataset consists of 167 image tiles of size 512×512 pixels, each containing at least one annotated crack (Figure 11). The training set was constructed from tiles extracted from frames acquired during the first UAV flight, whereas the testing set comprises tiles from the fifth flight. This split ensures that the evaluation includes cracks captured under varying illumination conditions and different UAV–wall distances. To further increase data variability and mitigate overfitting, we applied a simple data augmentation strategy by horizontally flipping 50% of the training images.
Model performance was evaluated using the Intersection over Union (IoU) metric, which quantifies the overlap between the predicted segmentation mask and the ground-truth annotation. IoU (also known as the Jaccard Index) is defined as the ratio between the area of intersection and the area of union of the two masks. This metric calculates the area of the intersection between the prediction
and the ground-truth label , and divides it by the area of their union (Equation 1).
Higher IoU values indicate more accurate localization and delineation of cracks. This metric enables a consistent assessment of segmentation quality across varying illumination and flight conditions, providing a reliable indicator of the ability of the model to generalize. The IoU metric is rooted in the classical Jaccard similarity coefficient [33]. Model performance was assessed using mean Average Precision at 50% Intersection-over-Union (mAP@IoU=50), a standard benchmark in instance segmentation. This metric computes the area under the precision–recall curve after determining whether a predicted mask sufficiently overlaps with a ground-truth annotation, where IoU ≥ 0.50 is considered a correct detection. By averaging precision scores across all classes and confidence thresholds, mAP@IoU=50 quantifies both localization accuracy and segmentation quality, providing a robust summary of detection performance.
2.5. Description of the Segmentation and Validation Workflow
Across heritage, archaeological, and engineering applications, Mask R-CNN has demonstrated high segmentation accuracy and robustness in the presence of complex visual clutter, outperforming or matching alternative approaches such as U-Net, YOLO-based detectors, and conventional feature-based methods [34,35]. In Cultural Heritage conservation, the model has been used to map deterioration patterns and structural pathologies with high precision, facilitating large-scale and automated condition assessments [23]. Similarly, in structural monitoring of concrete, metal, and composite materials, Mask R-CNN has been shown to improve crack detection rates and reduce false positives, particularly when integrated with domain-specific preprocessing and augmentation strategies [19,21].
Despite its advantages, several limitations must be acknowledged. The two-stage architecture is computationally intensive and requires substantial training data, often demanding extensive manual annotation and domain adaptation to achieve optimal performance [20,34]. Moreover, model effectiveness can be sensitive to hyperparameter choices, including learning rate schedules and augmentation pipelines, and thus requires careful tuning and validation [21].
Taken together, existing research indicates that Mask R-CNN provides a powerful and adaptable framework for automated crack detection, delivering the precision required for complex and delicate cultural heritage contexts, such as subterranean or rock-art sites These characteristics make it a promising candidate for application to Paleolithic cave surfaces, where accurate, high-resolution mapping of crack networks is essential for conservation, documentation, and long-term monitoring.
3. Results
3.1. Processing of Flights
The two main areas selected for inspection were identified as “Zone A” and “Zone B”. Zone A is located on the left sector of the rock surface and focuses primarily on one of the lower projections. This area covers approximately 1.5 × 7 metres (10.5 m²). Zone B, situated in the central section of the same rock face, encompasses a larger extent, as it was necessary to document an area of 10 × 2 metres (20 m²). A total of 12 flights were conducted, with an average duration of 6 minutes and 30 seconds each, resulting in approximately 80 minutes of recorded footage (Table 2). The videos obtained during these flights were not limited exclusively to Zones A and B, but instead covered most of the rock face, following the guidelines provided at all times by the technical staff and curators of the Museo Nacional y Centro de Investigación de Altamira.
Thanks to the LiDAR system integrated into the drone, it was possible to generate 12 point clouds, each consisting of approximately 14,500,000 points. This density provides sufficient geometric accuracy to serve as a robust basis for conducting detailed metric analyses of the surface.
3.2. Integration of the LiDAR–SLAM Point Cloud
The different types of files generated (e.g., videos, images, navigation path data, and point clouds) were processed and visualised using the software Inspector 5. This program enables, among other functionalities, the simultaneous display of the 4K-quality video together with the spatial position of the corresponding frame within the LiDAR point cloud.
One of the most notable tools in the program is the Point of Interest (POI) system, which allows relevant locations to be recorded both in the video and in the point cloud. This is particularly useful for documenting visible anomalies and facilitating their monitoring in future inspection campaigns.
The POI system also allows measurements to be taken directly on the selected reference frame. Although the precision of these measurements is lower than that provided by a high-resolution photographic camera or a terrestrial 3D laser scanner, its value lies in the ability to combine geometric and visual information in a spatially referenced and coherent manner.
The videos played a key role in the preliminary identification of risks. Their analysis enabled the detection of cracks, material displacements, sediment accumulations, potentially unstable elements, and signs of anthropogenic impact. All of these factors represent latent threats that require monitoring. This capacity for early visual assessment not only makes it possible to evaluate the current state of the environment but also helps in planning preventive measures to mitigate potential future damage.
3.3. Videogrammetry
The captured videos were used by extracting frames at a rate of between 2 and 3 frames per second. As a result, 12 meshed models were generated (one for each flight) which will serve as a documentary baseline for monitoring the conservation state of the rock surface located above the access to the La Hoya Hall.
In order to maximise the use of the digital record, a videogrammetric processing workflow was carried out based on the videos captured with the drone. The main objective of this procedure was to transform the continuous visual information recorded during the flights into detailed three-dimensional models, in order to generate resources that optimise the monitoring of the conservation state of the rock surface located above the access to the La Hoya Hall. Over the last decades, 3D videogrammetry has been consolidated as a reliable technique for obtaining accurate three-dimensional models in diverse fields such as biomechanics [36], biomedical engineering [37,38,39], sports performance monitoring [40], and the documentation of architectural heritage in narrow spaces [41].
In a first stage, those video segments with the highest geometric stability and best lighting conditions were selected, discarding the segments affected by abrupt movements and blurring caused by the drone positioning, as well as segments affected by glare from the LED lights of the drone. From these selected segments, a systematic frame extraction was performed, using a rate of between 2 and 3 images per second depending on both the duration and the speed of each flight, thus obtaining a uniform amount of information to work with (Table 2). This sampling balanced the need to guarantee sufficient overlaps between images with the need to limit the total volume of data generated.
The extracted frames were subjected to a basic pre-processing step, including brightness and contrast correction, white balance adjustment and, when necessary, the removal of redundant images or images containing people or out-of-context artefacts. Subsequently, each image set corresponding to a single flight was processed independently using two photogrammetric software packages, Agisoft Metashape 2.1. and Pix4D 4.8.4, following a standardised workflow in which automatic detection and matching of tie points within the images and the computation of the relative camera orientation led to the generation of two main products for each flight: on the one hand, a dense point cloud that, on average, contains between 50 and 100 million points; and, on the other, a meshed model with an average of 10 million faces.
The dense point clouds generated through videogrammetry were then used to derive textured surface meshes. Mesh generation was carried out using triangulation algorithms suitable for complex geometries, with the aim of faithfully reproducing the micro-reliefs associated with cracks and, more generally, the geomorphology of the rock wall. Textures were generated from the original video images, so that each triangle of the mesh was associated with high-resolution radiometric information.
In this way, 12 preliminary meshed models were obtained, one for each flight, with sufficient resolution to identify cracks, potentially unstable blocks and sediment accumulations on natural ledges.
The use of two different photogrammetric processing software packages aims to ensure the accurate generation of digital models by cross-validating the results and comparing the Structure-from-Motion (SfM) and Multi-View Stereo (MVS) algorithms implemented in both systems. To guarantee geometric consistency between the different models, metric references derived from the LiDAR SLAM point cloud and from clearly identifiable structural elements on the wall (edges, ledges and major fractures) were used as internal controls.
The lighting conditions of the chamber in which the monitoring and documentation area is located, together with its geomorphological singularities, limited the ability to perform a homogeneous data acquisition in terms of reflectance of the rock surface. This resulted in overexposed and underexposed areas in the recorded footage, affecting brightness, saturation and contrast levels, and consequently generating in the subsequent meshed models an alteration of these photographic parameters that is difficult to correct. Integrating distance-sensing technology into the UAV substantially increased safety during data acquisition in the subterranean setting. By avoiding contact with the surrounding surfaces and ensuring a constant standoff distance of roughly 30 cm across all 12 flights, the system provided both operational protection and more stable imaging conditions, thereby improving the quality of the photogrammetric workflow.
In a later stage, a fine registration between the videogrammetric meshed models and the integrated LiDAR point cloud was performed. This step aimed to correct possible local deviations arising from the limitations of photogrammetry under heterogeneous lighting conditions, taking advantage of the metrological stability of LiDAR. The result is a set of three-dimensional models that combines the geometric accuracy of the point cloud with the surface detail of the textures, suitable for the detection and measurement of discontinuities, overhanging blocks and variations in sediment accumulations.
3.4. Generation of Point Clouds and Meshes
The videogrammetric processing was complemented with geometric information provided by the LiDAR sensor integrated into the drone, in order to obtain high-density and high-accuracy point clouds and meshed models. In the field of cultural heritage, integrated solutions for three-dimensional modelling have been proposed based on videogrammetry combined with V-SLAM or laser/spherical SLAM technologies [42,43] , as well as workflows that exploit UAV video for detailed urban modelling [44] and its incorporation into HBIM environments [45]. This integration constitutes an essential step for the metric characterisation of the wall and for the design of future structural monitoring strategies.
In a first step, the 12 point clouds generated by the LiDAR SLAM system during each of the flights were exported from the drone control software in a standard format (LAS). Each cloud was subjected to an initial filtering in order to remove isolated points, noise at the beam edges and artefacts generated by abrupt movements during take-off and landing. Unlike other works, the information was not clipped to the immediate surroundings of the wall of interest, thus allowing it to be contextualised within the so-called Hall VII of the cave of Altamira.
The use of a single local coordinate system by the LiDAR SLAM system allowed the aligned integration of each of the point clouds generated in each flight, resulting in a coherent combined model of the inspected volume (Figure 12).
These models constitute the basis for subsequent analyses, both for the automatic segmentation of cracks using deep learning techniques and for multi-temporal comparison in future monitoring campaigns. Their integration into the DiGHER platform also allows interactive consultation and collaborative annotation by the technical team responsible for the conservation of the cave of Altamira.
3.5. Segmentation for Crack Detection
The proposed model achieved a mAP@IoU=50 of 20% when validated against the flight 5 dataset. While the network successfully identifies the presence and general location of cave-wall cracks, this relatively low score reflects systematic over-segmentation: ground-truth annotations represent each digitized crack as a single continuous mask, whereas the model frequently predicts multiple smaller subcracks instead of the complete structure. These fragmented detections reduce IoU with the annotated region, lowering precision and thereby decreasing the overall mAP value, despite visually plausible crack localization.
Large cracks are generally well predicted, with the model capturing most of their spatial extent and overall morphology (Figure 13.b). These major fractures present substantial depth, producing characteristic shadows that make them visually distinctive and easier for the network to detect. However, the model also generates some false positives by interpreting unrelated shadow patterns or lighting variations as cracks, as illustrated in Figure 13.a. Furthermore, due to the low resolution of certain image tiles and the high density of fine fissures, many small cracks were not included during manual annotation. In these cases, the model occasionally identifies subtle subcracks overlooked by the expert, revealing both annotation limitations and the sensitivity of the model to minor structural discontinuities (Figure 13).
4. Discussion
4.1. Analysis of the AI Model for Automated Crack Detection
A key component of this study is the integration of a deep learning approach for automated crack detection on high-resolution UAV imagery acquired within a confined subterranean environment. The performance of the Mask R-CNN model demonstrated clear potential but also highlighted important limitations primarily related to data quality and annotation completeness.
As shown in the results, the model performance is strongly influenced by the quality and completeness of the annotated dataset. Because many fine-scale cracks were not digitized during manual labeling, the network lacks sufficient examples to learn their visual characteristics, leading to fragmented predictions and reduced mAP scores. Increasing the number of annotated masks (particularly for thin, low-contrast cracks) would provide a more representative training distribution and help the model better generalize across varying wall textures, lighting conditions, and crack morphologies.
To achieve this, a larger digitization effort is required, ideally incorporating systematic labeling of small fissures that are currently underrepresented. However, manually annotating these structures is time-consuming, subjective, and prone to omission due to low resolution and visual ambiguity. Future work may therefore benefit from semi-automatic or fully automatic labeling strategies (such as weak supervision, active learning, or self-training) to accelerate mask generation and reduce expert workload. Such approaches could expand the training dataset, enhance crack boundary precision, and ultimately improve both detection accuracy and segmentation consistency.
Despite these limitations, the Mask R-CNN architecture remains well suited for this type of analysis due to its ability to jointly perform object detection and pixel-level segmentation. Its region-proposal mechanism allows it to localize cracks of varying shapes and scales, while the parallel mask-prediction branch provides detailed delineation of crack boundaries even under heterogeneous imaging conditions. Moreover, Mask R-CNN is highly modular and can be adapted through improved backbones, feature-pyramid designs, and domain-specific augmentations, making it a robust foundation for future enhancements. With a more comprehensive annotated dataset, the inherent strengths of the model (particularly its capacity to capture fine structural details) could be fully leveraged to achieve substantially higher detection and segmentation performance.
4.2. Integration of Geospatial Data into a Digital Twin Framework: Infrastructure and Hierarchical Model
The development of advanced tools for 3D point cloud and mesh integration in the DiGHER platform relies on a robust and scalable digital infrastructure. At its core lies a relational database implemented in PostgreSQL [46], structured to reflect a four-level hierarchy of municipalities, collections, items, and visualizations. This organization enables consistent storage, efficient search, and meaningful contextualization of cultural heritage data. The platform architecture follows a client-server model built on Django [47] (Python) for the backend, paired with HTML, CSS, and JavaScript on the frontend using the Foundation framework. This setup allows for responsive design, embedded visualization, and streamlined data entry. User and permission management is tightly integrated, ensuring that collaborators can upload, annotate, and manage content at different levels of access while maintaining the integrity and security of the data. This foundational structure enables the sophisticated processing and visualization capabilities detailed in the following sections.
4.3. Point Cloud Integration and Web-Based Visualization
One of the standout features of the DiGHER platform is the integration of large-scale 3D point cloud data, such as those obtained from LiDAR acquisitions in the cave of Altamira. To render these datasets in the browser efficiently, the platform uses a system based on WebGL and JavaScript technologies (Figure 14). The core visualization engine is derived from Potree [48], but more importantly, it relies heavily on foundational libraries such as three.js for 3D rendering and proj4.js for geospatial coordinate transformations. However, displaying billions of points from a laser scan requires careful preprocessing. The system therefore uses laszip [49] in the backend for point data management and compression tool to prepare the raw point cloud data. PotreeConverter takes a point cloud (in a standard format like LAS or LAZ) and converts it into a multi-resolution octree structure that can be efficiently streamed and visualized.
The platform supports point cloud data in various formats. Notably, it can handle E57 files (a standard format for aerial and terrestrial LiDAR data) which often contain multiple scans and rich metadata. When a user uploads an E57 file via the web interface (through a custom upload form on the item page), the backend automatically converts it into a single LAS file as an intermediate step. This conversion is done using PDAL (Point Data Abstraction Library) [50], which is a versatile tool for point cloud data processing. The PDAL library (accessible in Python or via command-line pipelines) reads the E57 format and writes out a merged LAS/LAZ file, standardizing the data for further processing. Automating this conversion saves users from manual steps; they can simply provide the raw scanner output, and the platform handles the rest. Once PDAL produces a LAS file, the PotreeConverter is invoked (server-side) to generate the folder of octree tiles and an accompanying HTML/JavaScript viewer configuration. The entire process is streamlined so that, after a short processing delay, the high-resolution 3D point cloud becomes accessible for viewing directly on the item page, embedded via the corresponding viewer.
Access to these point cloud visualizations is controlled by the earlier-mentioned permissions; only authorized users (for example, project members or authorized researchers for the cave of Altamira data) can load the 3D viewer for non-public data. The static files produced in the backend (including binary tiles, metadata, and supporting assets) are served by a dedicated NGINX [51] server, which acts as a reverse proxy to the Django application. These files are stored in a location marked as "internal" in the NGINX configuration, meaning they are not directly accessible via public URLs. When a user requests a point cloud visualization, Django verifies their access permissions. If the user is authorized, the response includes an X-Accel-Redirect header, instructing NGINX to serve the static files internally. This mechanism ensures that sensitive 3D content is securely protected while benefiting from NGINX as an optimized static file server. By decoupling file serving from application logic and leveraging the high-speed capabilities of NGINX, the platform gains both security and efficiency in delivering high-resolution 3D content. This integration means that the complex output of PotreeConverter (often thousands of small files for a single scan) is handled seamlessly: NGINX ensures that as a user navigates and zooms around the cave of Altamira point cloud, the data streams without significant lag.
4.4. Mesh Integration and Semantic Enrichment
Beyond point clouds, the DiGHER platform also handles meshed 3D models – typically the outputs of photogrammetry or high-density laser scanning that have been processed into 3D surfaces (meshes) with textures. Integrating these models required evaluating available technologies.
The suite of tools developed by the Smithsonian Institution [52] which are built on top of widely adopted web technologies like three.js and WebGL (Figure 15). These tools provide rich interactivity, high-performance rendering, and extensible annotation functionalities through open-source components, forming a solid basis for building customized 3D heritage viewers. Both options presented significant advantages and shaped the direction of the final implementation adopted in the DiGHER platform.
Ultimately, the DiGHER platform approach to meshed models takes inspiration from these tools while tailoring the experience for simplicity. The platform expects 3D meshes to be in or converted to the glTF/GLB format [53] (an open standard for 3D scenes that is efficient for web delivery) (Figure 16). When a user uploads a 3D model in a format like OBJ along with its texture images, the backend automatically converts it into a single binary .glb file. This is done using the Trimesh library in Python [54], which can import geometry and materials from OBJ and export to GLB. Converting to GLB ensures that geometry and textures are bundled together and reduces the number of server requests needed to load the model. After conversion, an optimization step is applied: the platform utilizes gltf-transform [55], a CLI tool for optimizing glTF files. With gltf-transform, the model is processed to compress its data without losing visual quality. One key optimization is applying Draco [56] compression to the mesh geometry. Draco is a technique (supported via the KHR_draco_mesh_compression extension in glTF) that significantly reduces the size of 3D mesh data, often by 95% or more, at the cost of a tiny decoding delay. This compression is crucial for web-based models of something as large and detailed as the cave of Altamira interior – it enables faster streaming of the model to users’ browsers, even if the original mesh was tens or hundreds of millions of polygons. In addition to Draco, gltf-transform might be used to optimize textures (for example, encoding them as WebP or KTX2 compressed textures) and remove any extraneous data (nodes, unused vertices, etc.), resulting in a lean GLB ready for web viewing.
Once the model is prepared and optimized, files are served through NGINX in an efficient and secure manner as explained for pointcloud models, and the platform displays it using a web-based 3D viewer component. In the current implementation, a Voyager Explorer [52] based component is integrated into the item page to provide the rendering. This modern viewer leverages three.js under the hood and comes with built-in support for things like lighting control, camera navigation, and annotation display. Crucially, the DiGHER platform supports an annotation editor on these 3D models. Users (with appropriate permissions) can enter a customized annotation mode, which allows them to click on the 3D model to drop a marker and enter annotation text. Each annotation consists of a point on the model, a textual description, and optionally a link to an external media reference. A particularly innovative feature is the support for linked video timestamps: an annotation can include a timestamped video URL for an internal project video that relates to that point on the model. In the case of Altamira, this could mean an annotation marker placed on a particular pictograph in the 3D model of the cave wall, accompanied by a note and a link to a documentary or excavation recording where that pictograph is discussed at a specific time. When users view the annotation, they not only see descriptive text but can also click to play the corresponding video segment, providing rich context that combines spatial and narrative information.
The annotation interface of the platform is designed to be accessible to non-technical users. Rather than exposing the full complexity of a tool like Voyager Story [52] (which, while powerful, might be overwhelming with its multiple menus for tours, articles, etc.), DiGHER provides a simplified workflow: add a marker, fill a form (text and optional media link), and save. The underlying system then associates this annotation with the 3D model (storing it in a JSON format and linking it to the database). The viewer itself is configured to display these annotations as interactive hotspots – typically as icons or pins on the model that a user can click to read the note or play the linked media. Since a model can have several variants, and each variant may contain different annotations, the interface had to be extended to support that. The decision to evaluate and partially adopt these components was motivated by a desire to combine high-performance visualization with rich storytelling. By converting models to glTF and using a state-of-the-art WebGL viewer, the platform ensures smooth rendering of the detailed 3D meshes of cave of Altamira. By building a custom annotation layer, it encourages researchers to interpret and explain the data, not just view it. The result is that the cave of Altamira 3D models in DiGHER are not static digital replicas; they become interactive, interpretative resources.
4.5. Deployment Strategy and System Scalability
Deploying a complex platform like DiGHER (with its mix of database, backend logic, and specialized 3D processing tools) can be challenging. To simplify this and ensure consistency across different servers and development environments, the entire system is containerized using Docker [57]. The project provides a Docker image based on Ubuntu LTS, which serves as a stable foundation. Within this image, all necessary dependencies and libraries are pre-installed and configured. This includes the core runtime (Python and required Python libraries listed in a requirements.txt, such as Django, Django ORM extensions, PDAL bindings, Trimesh, etc.), as well as external tools like PotreeConverter and gltf-transform. PotreeConverter (a C++ binary) is added to the image so that point cloud conversions can happen without any manual setup. PDAL is installed (via apt, along with any plugins needed for E57) so that the point cloud pipeline of the platform works out-of-the-box. The Node.js [58] environment and gltf-transform CLI are also included, enabling the model optimization steps to run automatically. By assembling these components into one Docker image, the platform achieves a self-contained deployment. When it is time to set up the platform on a server (for example, at a data center or on a cloud service), one only needs to run the Docker container (this ensures that the same versions of all tools are being used, eliminating the “it works on my machine” problems). Developers, too, can use the Docker image to develop or test locally in an environment identical to production.
This approach greatly enhances reproducibility and maintainability. Docker encapsulates the entire environment (OS libraries, third-party tools, and application code), ensuring that if the platform runs correctly in one place, it will run the same way elsewhere. For an academic project with potentially many collaborators (or future maintainers), this is crucial: instead of spending time resolving dependency conflicts or configuring servers, they can focus on the heritage content. Moreover, containerization aids long-term preservation of the platform itself. In the heritage field, one must consider not just preserving data but also the tools needed to access that data. The Docker image can be seen as a snapshot of the current software environment. Even years later, if someone wants to revisit the DiGHER platform functionality or migrate it, having this container means they won’t have to rebuild the setup from scratch (they can simply instantiate the container and have a running system as it was originally configured). Maintenance is also simplified: updates to the platform can be made by updating the Dockerfile (for instance, to bump the version of Django or add a new library), and then a new image is built and deployed. This controlled process reduces the risk of inconsistencies. The inclusion of a requirements.txt inside the container (and using it to pip-install the exact versions of Python packages) guarantees that all instances of the platform use the same code libraries. In practice, after code changes or adding new features, the developers rebuild the Docker image, test it, and deploy it, knowing that what they tested is exactly what is running in production.
From a deployment perspective, the DiGHER Docker container runs the Django backend and it is configured behind a web server or reverse proxy, which it is NGINX as mentioned before. Static files and media uploads are all handled within the filesystem of the container or its mounted volumes. This means that deploying DiGHER is largely a matter of launching the container on a suitable host and ensuring the database (which is a PostgreSQL container) is accessible. The Dockerization thus encapsulates not only the code but also the workflow of processing cave of Altamira data (with tools like PotreeConverter and glTF pipelines ready to run). This yields a deployment that is reproducible, portable, and easier to maintain than a traditional setup.
4.6. Overall Interpretation
Taken together, the UAV-based LiDAR SLAM mapping, videogrammetric reconstruction, automated crack detection, and digital twin integration constitute a comprehensive methodological framework for structural monitoring in highly constrained subterranean environments. The approach not only overcomes physical barriers that limit traditional surveying techniques but also provides the technical foundation for long-term preventive conservation.
Future efforts should focus on improving the completeness of annotated datasets, enhancing the robustness of segmentation models, and expanding the temporal depth of the digital twin through repeated inspections. These steps will enable more accurate detection of structural evolution and contribute to safeguarding the unique Paleolithic heritage preserved within the cave of Altamira.
5. Conclusions
The use of drones equipped with SLAM systems, combined with high-resolution imaging sensors specifically designed for confined-space inspection, has proven to be a highly effective solution compared to traditional geomatics documentation methods such as pole-based photogrammetry, at least for scenarios presenting similar constraints. The ability of the drone to maintain stable flight in environments with complex geometries, combined with its 4K RGB camera and LiDAR sensor, enabled the precise documentation of the inaccessible rock wall located at the entrance to the La Hoya Hall. Importantly, this work constitutes the first documented application of a confined-space UAV with LiDAR-SLAM technology for structural monitoring inside a Paleolithic World Heritage cave. This pioneering deployment demonstrates that hybrid SLAM–videogrammetric workflows can overcome the physical, geometric and safety constraints typical of subterranean cultural heritage environments, offering a new operational framework for high-precision geomatics inspection.
The videographic analysis synchronised with the LiDAR-derived point cloud provided an initial technical assessment of the structural condition of the inspected surface. This approach enabled the identification of critical elements such as active fractures, overhanging blocks and accumulations of unconsolidated sediment, representing a significant step forward in the early detection of geostructural risks. These observations lay a solid foundation for future preventive-conservation actions in the cave of Altamira, as well as in other subterranean environments with similarly demanding monitoring requirements.
It is recommended to maintain and further consolidate this hybrid methodology—based on the integration of high-resolution video and LiDAR scanning—in future inspection campaigns. The generation of high-density meshes in accessible areas may complement the acquired data, enriching both visual and metric analyses. Additionally, establishing a regular documentation schedule would facilitate the evolutionary monitoring of fractures, sediment accumulations and unstable structural elements.
All datasets generated—including 3D models, point clouds and video—have been integrated into the DiGHER platform of the University of Zaragoza. This tool provides advanced interactive visualization, offering spatial synchronisation between the 3D models and their associated audiovisual information. Its interoperability enables measurement, temporal comparison and collaborative annotation, making it an essential resource for managing and monitoring the structural conditions of the cave.
Future work should prioritise the periodic repetition of UAV-based inspections to build a multitemporal dataset capable of detecting structural evolution with millimetric precision. Expanding and refining the annotated imagery used for deep learning segmentation will further enhance the performance of automated crack-detection models. Together, these efforts will strengthen early-warning capabilities and support more informed, data-driven strategies for the preventive conservation of Paleolithic rock-art caves. The incorporation of this documentation not only ensures its long-term digital preservation and autonomous management within a FAIR geomatics ecosystem, but also significantly expands analytical possibilities, remote access and the planning of future interventions by the technical team of the Museo Nacional y Centro de Investigación de Altamira and other stakeholders involved in cultural heritage conservation.
Author Contributions
Conceptualization, J.A., M.B. and C.V.; methodology, J.A., M.B., C.V., C.I., G.R., M.A.S. and V.B.; software J.A., C.V., C.I. and G.R.; validation, J.A., M.B., C.V., C.I. and G.R.; formal analysis, J.A., M.B., C.V., C.I. and G.R.; investigation, J.A., M.B., C.V., C.I., G.R., P.F., M.A.S. and V.B.; resources, J.A., P.F. and C.D.L.H.; data curation, J.A., M.B., C.V., C.I. and G.R.; writing—original draft preparation, J.A., M.B., C.V., C.I., G.R., M.A.S. and V.B.; writing—review and editing, J.A., M.B., C.V., C.I., G.R., P.F., C.D.L.H., M.A.S., V.B., A.P. and L.D.-G.; visualization, J.A., M.B., C.V., C.I. and G.R.; supervision, J.A., P.F. and C.D.L.H.; project administration, J.A., P.F. and C.D.L.H.; funding acquisition, J.A., P.F. and C.D.L.H. All authors have read and agreed to the published version of the manuscript.
Funding
This study was supported by the research project DiGHER (grant number CPP2022-009631), led by Dr. Jorge Angás and funded by the MCIU/AEI/10.13039/501100011033 and by the European Union through the “NextGenerationEU”/PRTR programme at the University of Zaragoza. Museo Nacional y Centro de Investigación de Altamira supported the archaeological data acquisition. This work was also benefitted from the collaboration of the research project Searching for the Origins of Rock Art in Aragón (SEFORA), led by Dr. Manuel Bea financed by the Proy_H04_24, Government of Aragón. Cristian Iranzo worked on this paper through PhD research contract funded by Department of Science, University and Knowledge Society of the Government of Aragón (Spain). The APC was funded by SeGAP (University of Zaragoza).
Data Availability Statement
The research data supporting this publication are not publicly available. The data were collected by the University of Zaragoza (Spain) as part of the research and conservation studies of the cave of Altamira. These data are kept in the Museo Nacional y Centro de Investigación de Altamira and at the SeGAP of the University of Zaragoza (Spain).
Acknowledgments
The authors express their gratitude to the open-source libraries and tools that made this work possible, all of which were used in full compliance with their respective Creative Commons and open-source licensing agreements. The authors gratefully acknowledge GIM Geomatics for supplying additional topographic plans that supported the topographic verification process. We also thank Flyability for their technological support and the SeGAP of the University of Zaragoza for their collaboration.
Conflicts of Interest
The authors declare no conflict of interest.
Abbreviations
The following abbreviations are used in this manuscript:
| CLI | Command-Line Interface |
| CNIG | Centro Nacional de Información Geográfica |
| COCO | Common Objects in Context dataset |
| FAIR | Findable, Accessible, Interoperable and Reusable |
| FCN | Fully Convolutional Network |
| FPS | Frames per Second |
| FPN | Feature Pyramid Network |
| GLB | Binary form of glTF |
| glTF | GL Transmission Format |
| IGN | Instituto Geográfico Nacional |
| IMU | Inertial Measurement Unit |
| IoT | Internet of Things |
| IoU | Intersection over Union |
| JSON | JavaScript Object Notation |
| KTX2 | Khronos Texture 2.0 |
| MVS | Multi-View Stereo |
| NGINX | NGINX Web Server |
| PDAL | Point Data Abstraction Library |
| PNOA | Plan Nacional de Ortofotografía Aérea |
| POI | Point Of Interest |
| R-CNN | Region-based Convolutional Neural Network |
| ResNet | Residual Network |
| RoI | Region of Interest |
| RPN | Region Proposal Network |
| SfM | Structure from Motion |
| SLAM | Simultaneous Localization and Mapping |
| ToF | Time-of-Flight |
| YOLO | You Only Look Once |
References
- Fatás Monforte, P. Altamira, símbolo, identidad y marca. In El patrimonio cultural como símbolo. Actas del Simposio Internacional; Garrote, L., Ed.; Fundación del Patrimonio Histórico de Castilla y León: Valladolid, 2011; 163–186.
- de las Heras, C.; Montes, R.; Lasheras, J.A. Altamira: nivel gravetiense y cronología de su arte rupestre. In Pensando el Gravetiense: nuevos datos para la región cantábrica en su contexto peninsular y pirenaico; de las Heras, C., Lasheras, J.A., Arrizabalaga, Á., de la Rasilla, M., Eds.; Monografías del Museo Nacional y Centro de Investigación de Altamira; Ministerio de Educación, Cultura y Deporte: Madrid, 2013, 476–491. Madrid.
- Sanz de Sautuola, M. Breves apuntes sobre algunos objetos prehistóricos de la Provincia de Santander; Imprenta y Litografía de Telesforo Martínez: Santander, 1880. [Google Scholar]
- Lasheras, J.A. El arte paleolítico de Altamira. In Redescubrir Altamira; Lasheras, J.A., Ed.; Turner: Madrid, 2002; 65–92. [Google Scholar]
- Lasheras, J.A.; de las Heras, C.; Fatás Monforte, P. El nuevo museo de Altamira. Boletín de la Sociedad de Investigación del Arte Rupestre de Bolivia 2002, 16, 23–28. [Google Scholar]
- Lasheras, J.A.; de las Heras, C. Estudio introductorio a Sanz de Sautuola, M. 1880. Breves apuntes sobre algunos objetos prehistóricos de la Provincia de Santander. In Breves apuntes sobre algunos objetos prehistóricos de la Provincia de Santander; Botín, E., Ed.; Grupo Santander: Madrid, 2004.
- Lasheras, J.A.; de las Heras, C.; Montes, R.; Rasines, P.; Fatás Monforte, P. La Altamira del siglo XXI (el nuevo Museo y Centro de Investigación de Altamira). Patrimonio 2002, 23–34.
- Fatás Monforte, P.; Lasheras Corruchaga, J.A. La cueva de Altamira y su museo / The cave of Altamira and its museum. Cuadernos de Arte Rupestre 2014, 7, 25–35. [Google Scholar]
- Sánchez-Moral, S.; Cuezva, S.; Fernández Cortés, Á.; Janices, I.; Benavente, D.; Cañaveras, J.C.; González Grau, J.M.; Jurado, V.; Laiz Trobajo, L.; Portillo Guisado, M. del C.; et al. Estudio integral del estado de conservación de la cueva de Altamira y su arte paleolítico (2007–2009). Perspectivas futuras de conservación; Monografías del Museo Nacional y Centro de Investigación de Altamira; Ministerio de Educación, Cultura y Deporte: Madrid, Spain, 2014.
- Sánchez, M.A.; Foyo, A.; Tomillo, C.; Iriarte, E. Geological Risk Assessment of the Area Surrounding Altamira Cave: A Proposed Natural Risk Index and Safety Factor for Protection of Prehistoric Caves. Engineering Geology 2007, 94, 180–200. [Google Scholar] [CrossRef]
- Sanchez-Moral, S.; Cuezva, S.; Garcia-Anton, E.; Fernandez-Cortes, A.; Elez, J.; Benavente, D.; Cañaveras, J.C.; Jurado, V.; Rogerio-Candelera, M.A.; Saiz-Jimenez, C. Microclimatic Monitoring in Altamira Cave: Two Decadesof Scientific Projects for Its Conservation. In The Conservation of Subterranean Cultural Heritage; CRC Press, 2014.
- Guichen de, G. Programa de Investigación Para La Conservación Preventiva y Régimen de Acceso de La Cueva de Altamira (2012–2014); Ministerio de Cultura: Madrid, 2014, 4.
- Bayarri, V.; Prada, A.; García, F.; Ibáñez, M.; Benavente, D. Integration of Remote-Sensing Techniques for the Preventive Conservation of Paleolithic Cave Art in the Karst of the Altamira Cave. Remote Sensing 2023, 15, 1087. [Google Scholar] [CrossRef]
- Bontemps, Z.; Crovadore, J.; Sirieix, C.; Bourges, F.; Gessler, C.; Lefort, F. Dark-Zone Alterations Expand throughout Paleolithic Lascaux Cave despite Spatial Heterogeneity of the Cave Microbiome. Environmental Microbiome 2023, 18, 31. [Google Scholar] [CrossRef]
- Ministerio de Cultura y Deporte. Cueva de Altamira. Arte Rupestre Cantábrico. Available online: https://www.arterupestrecantabrico.es/cuevas/cueva-de-altamira.html (accessed on 1 November 2025).
- He, K.; Gkioxari, G.; Dollár, P.; Girshick, R. Mask R-CNN. IEEE Transactions on Pattern Analysis and Machine Intelligence 2020, 42, 386–397. [Google Scholar] [CrossRef] [PubMed]
- Yu, Y.; Zhang, K.; Yang, L.; Zhang, D. Fruit Detection for Strawberry Harvesting Robot in Non-Structural Environment Based on Mask-RCNN. Computers and Electronics in Agriculture 2019, 163. [Google Scholar] [CrossRef]
- Zhang, Q.; Chang, X.; Bian, S. Vehicle-Damage-Detection Segmentation Algorithm Based on Improved Mask RCNN. IEEE access : practical innovations, open solutions 2020, 8, 6997–7004. [Google Scholar] [CrossRef]
- Wu, S.; Fu, F. Crack Control Optimization of Basement Concrete Structures Using the Mask-RCNN and Temperature Effect Analysis. PLOS ONE 2023, 18. [Google Scholar] [CrossRef]
- Ameli, Z.; Nesheli, S.J.; Landis, E.N. Deep Learning-Based Steel Bridge Corrosion Segmentation and Condition Rating Using Mask RCNN and Yolov8. Infrastructures 2023. [Google Scholar] [CrossRef]
- Yang, F.; Huo, J.; Cheng, Z.; Chen, H.; Shi, Y. An Improved Mask R-CNN Micro-Crack Detection Model for the Surface of Metal Structural Parts. Sensors (Basel, Switzerland) 2023, 24. [Google Scholar] [CrossRef]
- Bonhage, A.; Eltaher, M.; Raab, T.; Breuß, M.; Raab, A.; Schneider, A. A Modified Mask Region-Based Convolutional Neural Network Approach for the Automated Detection of Archaeological Sites on High-Resolution Light Detection and Ranging-Derived Digital Elevation Models in the North German Lowland. Archaeological Prospection 2021, 28, 177–186. [Google Scholar] [CrossRef]
- Hatır, M.E.; İnce, İ.; Korkanç, M. Intelligent Detection of Deterioration in Cultural Stone Heritage. Journal of building engineering 2021, 44, 102690. [Google Scholar] [CrossRef]
- Bayarri, V.; Prada, A.; García, F. A Multimodal Research Approach to Assessing the Karst Structural Conditions of the Ceiling of a Cave with Palaeolithic Cave Art Paintings: Polychrome Hall at Altamira Cave (Spain). Sensors 2023, 23, 9153. [Google Scholar] [CrossRef] [PubMed]
- Mechanics, I.S. for R. Suggested Methods for Rock Characterization, Testing and Monitoring; Brown, E.T., Ed.; Pergamon Press: Oxford, UK, 1981. [Google Scholar]
- Sánchez, M.A.; Bruschi, V.; Iriarte, E. Evaluación del riesgo geológico en las cuevas de Altamira y Estalactitas. In Monografías del Museo y Centro de Investigación Altamira; Ministerio de Cultura: Madrid, Spain, n.d.
- Hoyos, M.; Bustillo, A.; García, A.; Martín, C.; Ortiz, R.; Suazo, C. Características Geológico-Kársticas de La Cueva de Altamira; Ministerio de Cultura: Madrid, 1981.
- Lasheras, J.A.; Heras, C.; Prada, A.; Fatás, P. La Conservación de Altamira Como Parte de Su Gestión. ARKEOS 2014, 37, 2395–2414. [Google Scholar]
- Ouster, Inc. OS0 Ultra-Wide View High-Resolution Imaging Lidar: Datasheet (Rev7, v3.1); Ouster, Inc.: San Francisco, CA, 2025. [Google Scholar]
- Wilkinson, M.; Dumontier, M.; Aalbersberg, Ij.J.; Appleton, G.; Axton, M.; Baak, A.; Blomberg, N.; Boiten, J.-W.; Bonino da Silva Santos, L.O.; Bourne, P.; et al. The FAIR Guiding Principles for Scientific Data Management and Stewardship. Scientific Data 2016, 3. [Google Scholar] [CrossRef]
- Lin, T.-Y.; Maire, M.; Belongie, S.; Bourdev, L.; Girshick, R.; Hays, J.; Perona, P.; Ramanan, D.; Zitnick, C.L.; Dollár, P. Microsoft COCO: Common objects in context. In Computer Vision – ECCV 2014; Fleet, D.; Pajdla, T.; Schiele, B.; Tuytelaars, T., Eds.; Lecture Notes in Computer Science; Springer: Cham, Switzerland, 2014; Volume 8693, pp. 740–755. [CrossRef]
- Jaikumar, P.; Vandaele, R.; Ojha, V. Transfer Learning for Instance Segmentation of Waste Bottles Using Mask R-CNN Algorithm. ArXiv 2022, abs/2204.07437. [CrossRef]
- Jaccard, P. The distribution of the flora in the alpine zone. New Phytologist 1912, 11, 37–50. [Google Scholar] [CrossRef]
- Luo, S.; Wang, H. Digital Twin Research on Masonry–Timber Architectural Heritage Pathology Cracks Using 3D Laser Scanning and Deep Learning Model. Buildings 2024. [Google Scholar] [CrossRef]
- Xu, X.; Zhao, M.; Shi, P.; Ren, R.; He, X.; Wei, X.; Yang, H. Crack Detection and Comparison Study Based on Faster R-CNN and Mask r-CNN. Sensors (Basel, Switzerland) 2022, 22. [Google Scholar] [CrossRef] [PubMed]
- Peña-Trabalon, A.; Moreno-Vegas, S.; Estebanez-Campos, M.B.; Nadal-Martinez, F.; Garcia-Vacas, F.; Prado-Novoa, M. A Low-Cost Validated Two-Camera 3D Videogrammetry System Applicable to Kinematic Analysis of Human Motion. Sensors 2025, 25, 4900. [Google Scholar] [CrossRef]
- Matuzevičius, D.; Serackis, A. Three-Dimensional Human Head Reconstruction Using Smartphone-Based Close-Range Video Photogrammetry. Applied Sciences 2022, 12, 229. [Google Scholar] [CrossRef]
- Quispe-Enriquez, O.C.; Valero-Lanzuela, J.J.; Lerma, J.L. Craniofacial 3D Morphometric Analysis with Smartphone-Based Photogrammetry. Sensors 2024, 24, 230. [Google Scholar] [CrossRef]
- Teixeira Coelho, L.C.; Pinho, M.F.C.; Martinez de Carvalho, F.; Meneguci Moreira Franco, A.L.; Quispe-Enriquez, O.C.; Altónaga, F.A.; Lerma, J.L. Evaluating the Accuracy of Smartphone-Based Photogrammetry and Videogrammetry in Facial Asymmetry Measurement. Symmetry 2025, 17, 376. [Google Scholar] [CrossRef]
- Marčiš, M.; Fraštia, M.; Hideghéty, A.; Paulík, P. Videogrammetric Verification of Accuracy of Wearable Sensors Used in Kiteboarding. Sensors 2021, 21, 8353. [Google Scholar] [CrossRef]
- Sun, Z.; Zhang, Y. Accuracy Evaluation of Videogrammetry Using a Low-Cost Spherical Camera for Narrow Architectural Heritage: An Observational Study with Variable Baselines and Blur Filters. Sensors 2019, 19, 496. [Google Scholar] [CrossRef]
- Ortiz-Coder, P.; Sánchez-Ríos, A. An Integrated Solution for 3D Heritage Modeling Based on Videogrammetry and V-SLAM Technology. Remote Sensing 2020, 12, 1529. [Google Scholar] [CrossRef]
- Pepe, M.; Alfio, V.S.; Costantino, D.; Herban, S. Rapid and Accurate Production of 3D Point Cloud via Latest-Generation Sensors in the Field of Cultural Heritage: A Comparison between SLAM and Spherical Videogrammetry. Heritage 2022, 5, 1910–1928. [Google Scholar] [CrossRef]
- Alsadik, B.; Khalaf, Y.H. Potential Use of Drone Ultra-High-Definition Videos for Detailed 3D City Modeling. ISPRS International Journal of Geo-Information 2022, 11, 34. [Google Scholar] [CrossRef]
- Currà, E.; D’Amico, A.; Angelosanti, M. HBIM between Antiquity and Industrial Archaeology: Former Segrè Papermill and Sanctuary of Hercules in Tivoli. Sustainability 2022, 14, 1329. [Google Scholar] [CrossRef]
- PostgreSQL Global Development Group. PostgreSQL; Relational database management system; PostgreSQL Global Development Group, 2025.
- Django Software Foundation. Django Web Framework; Web application framework for Python; Django Software Foundation: Huntersville, NC, USA, 2025.
- Schütz, M. Potree: Rendering Large Point Clouds in Web Browsers. Ph.D. Thesis, Technische Universität Wien, Vienna, Austria, 2015.
- Isenburg, M. LASzip: Lossless LiDAR Compression; LiDAR compression software; rapidlasso GmbH, 2025.
- PDAL Contributors. PDAL: Point Data Abstraction Library; Point cloud processing library; PDAL Project, 2025.
- NGINX, Inc. NGINX Web Server; HTTP and reverse proxy server; NGINX, Inc.: San Francisco, CA, USA, 2025.
- Smithsonian Institution Digitization Program Office. Smithsonian Voyager / DPO-Voyager Tools; 3D visualization and annotation toolkit; Smithsonian Institution: Washington, DC, USA, 2025.
- Khronos Group. glTF: GL Transmission Format; 3D scene and model transmission format; The Khronos Group, Inc.: Beaverton, OR, USA, 2025.
- Trimesh Developers. Trimesh: Python library for loading and processing 3D geometry; Geometry processing library for Python; 2025.
- McCurdy, D. glTF-Transform: Toolkit for glTF Optimization; 2025.
- Google LLC. Draco Compression Library; 3D geometry compression library; Google LLC: Mountain View, CA, USA, 2025.
- Docker, Inc. Docker; Containerization platform; Docker, Inc.: Palo Alto, CA, USA, 2025.
- Node.js Foundation. Node.js JavaScript Runtime; JavaScript runtime environment; Node.js Foundation: San Francisco, CA, USA, 2025.
Figure 3.
Location of the study area on the PNOA cartographic base and marked A–B section of the area corresponding to Hall VII and the wall above the access to the La Hoya Hall.
Figure 3.
Location of the study area on the PNOA cartographic base and marked A–B section of the area corresponding to Hall VII and the wall above the access to the La Hoya Hall.

Figure 4.
Correlation of the A–B cross-section (Fig. 3) with the schematic representation of the terrain section of Hall VII and the rock-wall access to La Hoya Hall, generated through the integration of cartographic data, the second PNOA-LiDAR coverage (CNIG–IGN), and the LiDAR-SLAM point cloud collected by the confined-space UAV.

Figure 5.
Top left: general view of the access area to the La Hoya Hall. Top right: detail of the decimeter-sized blocks cantilevered over the access. Bottom left: diagram showing the installation system. Bottom right: image of the support containing the sensor at the top resting on the unstable blocks.

Figure 6.
Data acquisition and inspection process with the confined-space UAV, using LiDAR-SLAM navigation and simultaneous video capture for videogrammetry.
Figure 6.
Data acquisition and inspection process with the confined-space UAV, using LiDAR-SLAM navigation and simultaneous video capture for videogrammetry.

Figure 7.
Confined-space UAV inspection with real-time SLAM-based self-positioning over the LiDAR point cloud.
Figure 7.
Confined-space UAV inspection with real-time SLAM-based self-positioning over the LiDAR point cloud.

Figure 8.
Workflow of the processing pipeline.

Figure 9.
Orthophoto of the rock surface highlighting the sections inspected in each flight. Based on the topographic survey conducted by the Museo de Nacional y Centro de Investigación de Altamira.
Figure 9.
Orthophoto of the rock surface highlighting the sections inspected in each flight. Based on the topographic survey conducted by the Museo de Nacional y Centro de Investigación de Altamira.

Figure 10.
Mask R-CNN architecture.

Figure 11.
Examples of crack masks generated under varying illumination and viewing conditions in frames captured during the first flight.
Figure 11.
Examples of crack masks generated under varying illumination and viewing conditions in frames captured during the first flight.
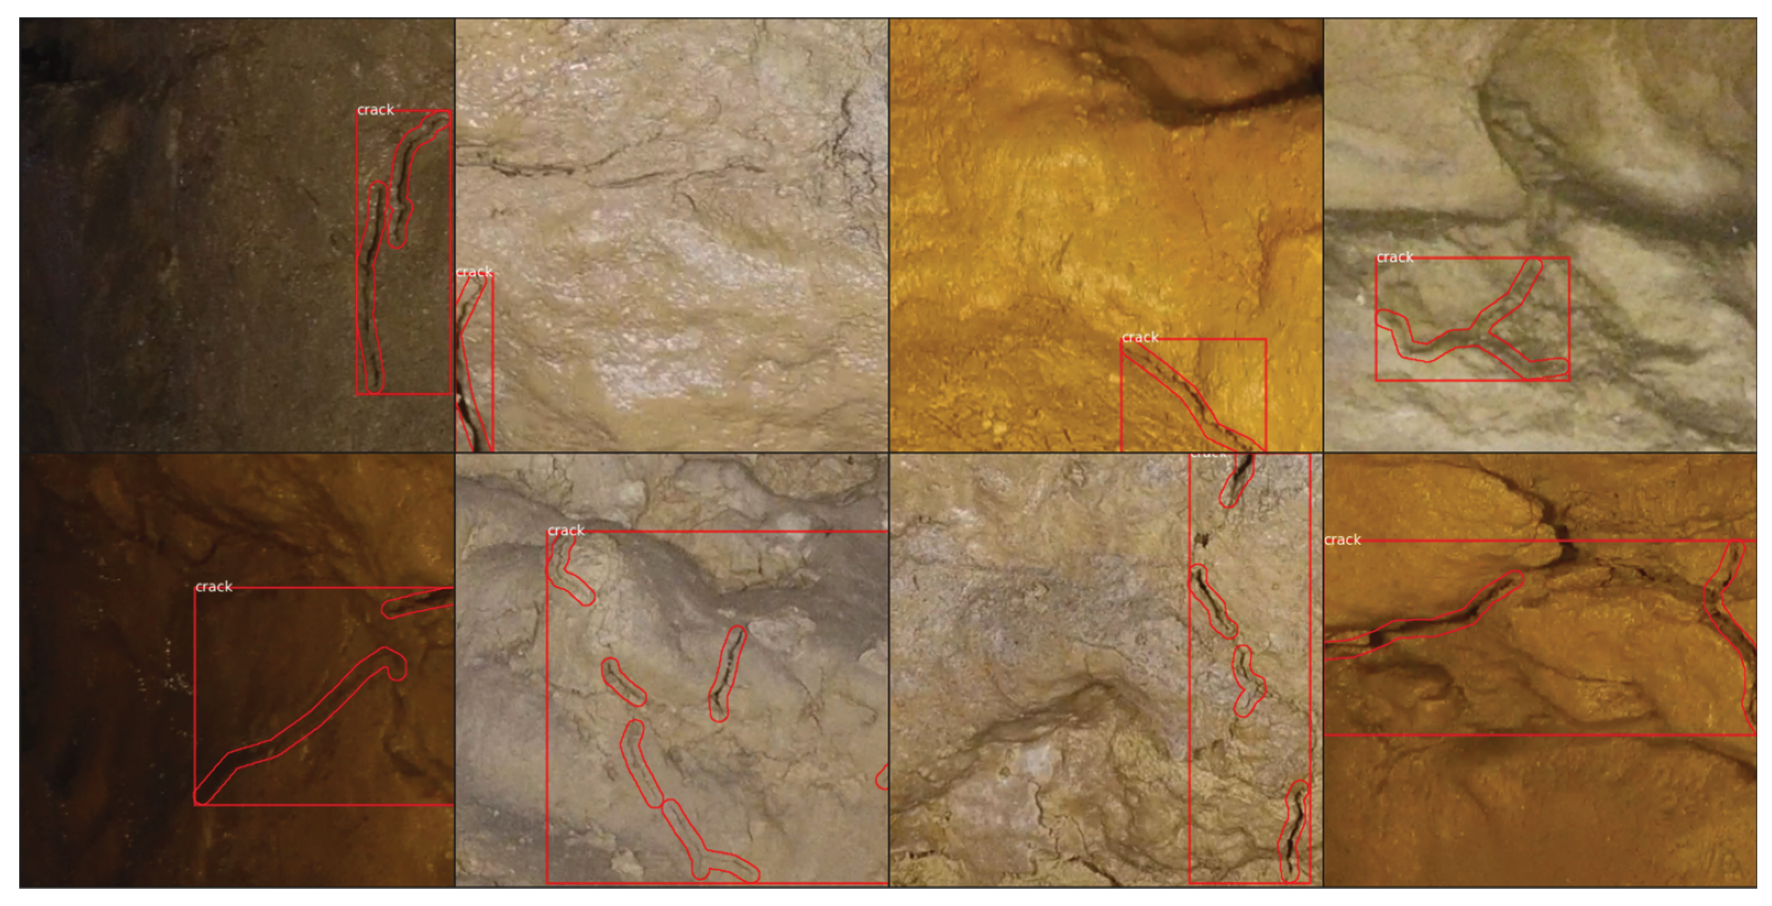
Figure 12.
Precision profile of the Ultra-Wide View High-Resolution Imaging LiDAR mounted on the UAV [29]. The plot illustrates the range-dependent standard deviation (1σ) derived from 100 observations on static Lambertian and retroreflective targets, with typical precision values ranging from ±0.8 cm to ±4 cm across the operational range.

Figure 13.
Qualitative comparison between ground-truth and predicted crack segmentations. The top row displays the manually annotated reference masks from the Flight 5 dataset, while the bottom row shows the corresponding predictions generated by the proposed model. Column (a) illustrates a shadow-induced false positive, where the network misinterprets illumination artifacts as cracks. Column (b) presents a correctly segmented large crack, demonstrating accurate localization and shape reconstruction. Column (c) shows a predicted crack that was not included in the expert annotations, highlighting the ability of the model to detect subtle fissures overlooked during manual labeling.
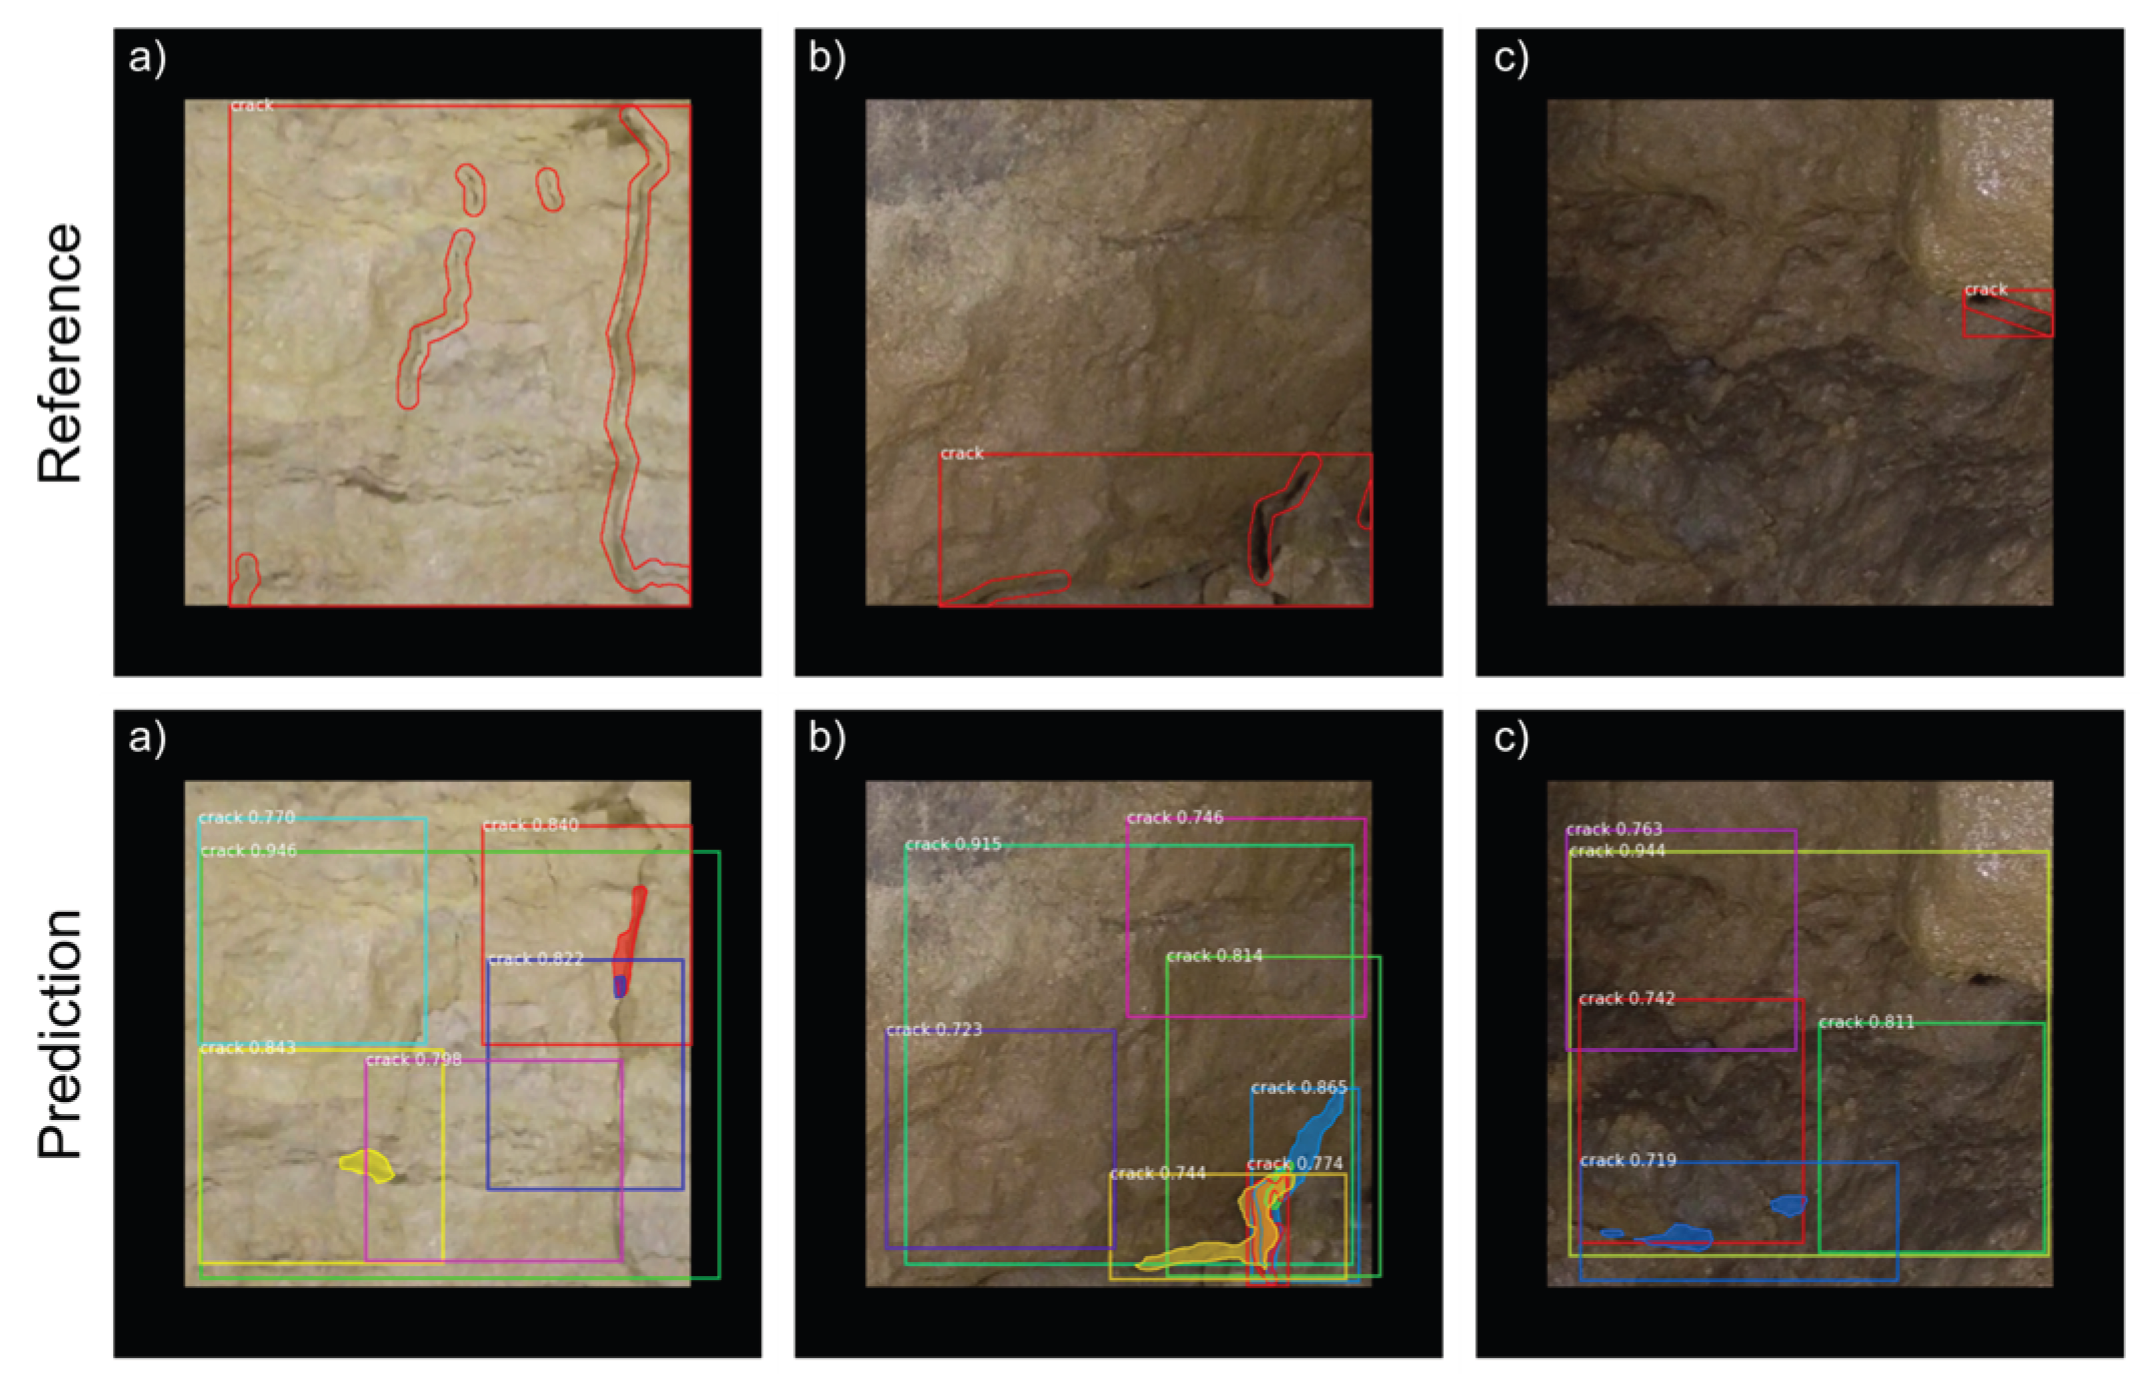
Figure 14.
Schematic representation of the point cloud integration workflow in the DiGHER platform. Point cloud files in E57, LAZ, and LAS formats are processed and aligned on the server side and made accessible via an interactive visualization interface supporting measurement tools, semantic enrichment, and collaborative analysis.

Figure 15.
Integration and annotation workflow for meshed models in the DiGHER platform. Imported 3D assets (OBJ and GLB formats) are processed and aligned on the server, after which they are published in an interactive viewer that supports collaborative annotation, metadata structuring, and multi-format interoperability.

Figure 16.
View of the processed platform displaying the meshed GLB models with annotations and synchronized video keyframes over the 3D model.
Figure 16.
View of the processed platform displaying the meshed GLB models with annotations and synchronized video keyframes over the 3D model.


Table 1.
Characteristics of Elios confined-space drone and sensors.
| Elios 3 | |
|---|---|
| Manufacturer | Flyability |
| Weight (g) | Approx. 1,900 g includes battery, payload & protection |
| Max. payload (g) | 2,350 g |
| Power source | 4350 mAh LiPo |
| Endurance (min) | 9-12 min |
| Camera | 2.71 mm focal length. Fixed focal |
| Thermal Camera | Sensor Lepton 3.5 FLIR |
| LiDAR Sensors | Ouster OS0-32 beams sensor1 |
| Flight control sensors | IMU, magnetometer, barometer, LiDAR, 3 computer vision cameras and ToF distance sensor |
1 See Figure 12 for detailed specifications and precision.
Table 2.
Description of each flight, including flight duration, image extraction, and mean reprojection error.
Table 2.
Description of each flight, including flight duration, image extraction, and mean reprojection error.
| Video Records | POI (nº) | FPS | Total Images | Mean Reprojection Error1 | |
|---|---|---|---|---|---|
| Flight 1 | 5 min 20 s | 12 | 3 fps | 796 (3840x2160 px) | 0.21 px (Pix4D) |
| Flight 2 | 6 min 21 s | 7 | 3 fps | 807 (3840x2160 px) | 1.32 px (Metashape) |
| Flight 3 | 6 min 49 s | 5 | 3 fps | 738 (3840x2160 px) | 2.8 px (Metashape) |
| Flight 4 | 8 min | 5 | 3 fps | 921 (3840x2160 px) | 0.21 px (Pix4D) |
| Flight 5 | 6 min 43 s | 8 | 3 fps | 920 (3840x2160 px) | 1.23 px (Metashape) |
| Flight 6 | 5 min 15 s | 11 | 3 fps | 726 (3840x2160 px) | 1.46 px (Metashape) |
| Flight 7 | 6 min 22 s | 13 | 2 fps | 765 (3840x2160 px) | 1.34 px (Metashape) |
| Flight 8 | 7 min 8 s | 12 | 2 fps | 858 (3840x2160 px) | 1.51 px (Metashape) |
| Flight 9 | 7 min 21 s | 11 | 2 fps | 885 (3840x2160 px) | 0.21 px (Pix4D) |
| Flight 10 | 6 min 35 s | 3 | 2 fps | 649 (3840x2160 px) | 0.21 px (Pix4D) |
| Flight 11 | 7 min 35 s | 3 | 2 fps | 807 (3840x2160 px) | 1.49 px (Metashape) |
| Flight 12 | 7 min 6 s | 6 | 2 fps | 763 (3840x2160 px) | 0.22 px (Pix4D) |
1 Agisoft Metashape 2.1 and Pix4Dmapper Pro 4.8.4 were tested to assess the accuracy and consistency of the image-alignment process.
Disclaimer/Publisher’s Note: The statements, opinions and data contained in all publications are solely those of the individual author(s) and contributor(s) and not of MDPI and/or the editor(s). MDPI and/or the editor(s) disclaim responsibility for any injury to people or property resulting from any ideas, methods, instructions or products referred to in the content. |
© 2025 by the authors. Licensee MDPI, Basel, Switzerland. This article is an open access article distributed under the terms and conditions of the Creative Commons Attribution (CC BY) license (http://creativecommons.org/licenses/by/4.0/).
Copyright: This open access article is published under a Creative Commons CC BY 4.0 license, which permit the free download, distribution, and reuse, provided that the author and preprint are cited in any reuse.


