Submitted:
13 November 2024
Posted:
13 November 2024
You are already at the latest version
Abstract
This paper presents methods for a UAV-based survey of the site "Kuklica" near Kratovo, North Macedonia. Kuklica is a rare natural complex with earth pyramids, and because of its exceptional scientific, educational, tourist, and cultural significance, it was proclaimed as a Natural Monument in 2008. However, after the proclamation, the interest in visiting this site and the threats of its potential degradation rapidly grew, increasing the need for a detailed survey and monitoring. Given the site's small size (0.5 km2), the freely available satellite images and digital elevation models do not allow comprehensive analysis and monitoring, especially of the individual forms. Instead, new tools are increasingly used, including UAV (Unmanned Aircraft Vehicles) and LiDAR (Light Detection and Ranging). Since professional LiDAR is very expensive and still poorly available, we used a low-cost UAV (DJI Mini 4 Pro) for a detailed survey. First, the flight path, the altitude of the UAV, the camera angle, and photo recording intervals were precisely planned and defined. Also, the ground markers (checkpoints) were carefully selected. Then, the recorded drone photos are aligned and processed through the Agisoft Metashape software, producing a digital elevation model and orthophoto imagery with very high (sub-decimeter) resolution. Following this procedure, more than 120 earth pyramids are delineated, ranging in height from 1-2 m to 30 m of the highest. In this stage, a very accurate UAV-based 3D model of the most remarkable earth pyramids is made (accuracy is checked with the iPhone 14 Pro LiDAR module), and their morphometrical properties are calculated. Also, the site's erosion rate and flash flood potential are calculated, showing high susceptibility. The final goal is to follow the changes and to minimize the degradation of the unique land-scape, thus protecting the geosite and its values much better.
Keywords:
drone survey
; geosites
; Remose Sensing
; orthophoto
; erosion
; flash floods
; machine learning
1. Introduction
Geoheritage monitoring is crucial for effectively managing and protecting natural areas, playing a significant role in regional zoning and territorial organization [1,2]. Geosites, as integral parts of geoheritage, represent specific geological or geomorphological features that possess historical and scientific importance, making them worthy of protection due to their value in understanding Earth’s processes [3,4]. Precise geosite mapping aids in their management, conservation, and monitoring, thereby supporting evaluations of geodiversity and geoheritage. Recent developments in digital technologies and geoinformatics have notably advanced research practices within geoheritage.
Over the past decade, the use of Unmanned Aerial Vehicles (UAVs), integrated with digital cameras and photogrammetric techniques such as structure-from-motion (SfM), has facilitated the creation of high-resolution Digital Elevation Models (DEMs) for inventorying and analyzing geosites [5]. UAV-based aerial photogrammetry enables rapid data collection, especially in difficult-to-access areas [6], and contemporary photogrammetric software is increasingly designed to integrate UAV imagery effectively. UAV technology is particularly valuable for producing highly detailed 3D models of landscapes and specific landforms, with its rising popularity driven by the affordability and accessibility of UAVs, specialized cameras, and photogrammetric tools [7]. The high accuracy and spatial resolution achieved through UAV photogrammetry make it a strong alternative to conventional survey methods like LiDAR or terrestrial laser scanning, especially for analyzing various terrains and geological structures [8]. Even commercially available UAVs can yield data sufficient for observing geomorphological changes [9]. Effective UAV flight planning and control are essential for producing high-quality imagery and reliable data, which depend on parameters such as ground sampling distance, overlap, camera angle, flight height, orientation, and path [10,11,12]. Standard flight patterns, such as cross grids, are efficient but encounter challenges in rugged terrain [13]. High-relief landscapes and steep slopes may lead to image distortion, complicating subsequent analyses [14].
Alternative methods, including vertical camera positioning or oblique photography, can be employed, though they face limitations in identifying steep slopes [14,15,16]. Although flight planning tools using DEMs are available, they primarily incorporate elevation data [17]. Besides UAV monitoring, assessing natural hazards is essential for protecting and managing geoheritage areas. Our study specifically focuses on the risks of erosion and flash floods, as these are the only hazards analyzed in this case study.
In Europe, soil erosion assessments are commonly conducted using a variety of qualitative, quantitative, and model-based approaches [18,19,20]. Widely known empirical models, such as the Universal Soil Loss Equation (USLE) [21], PESERA [22], KINEROS [23], WEP [24], and WEPP [25,26], are extensively applied in erosion modeling. Locally adapted models, like the Erosion Potential Model (EPM), also demonstrate significant accuracy when applied in regional contexts [19,27]. Over the past two decades, geospatial databases and GIS technology advancements have further enhanced these models, including EPM, allowing for more precise spatial analysis and data management [28,29].
Understanding flash floods, often caused by intense, short-duration rainfall in catchments under 1000 km², is essential for analyzing their hydrological dynamics. Such events frequently expose previously unobserved behaviors in catchments, shedding light on extreme flood responses and their relation to catchment characteristics [30,31]. Flash flood regimes in Europe differ between Continental and Mediterranean regions, with seasonal transitions from summer to autumn [32], influencing land use and climate change considerations.
This study adopts a parametric approach to assess flash flood vulnerability, utilizing freely available databases and integrating remote sensing and GIS technologies with advanced modelling techniques for improved flood prediction and management [33,34,35]. Various methodologies, including multicriteria evaluation [36], decision tree analysis [37,38,39], weight of evidence [40], artificial neural networks [41,42], frequency ratio [43], and logistic regression [44], are commonly employed for flood sensitivity mapping.
The Flash Flood Potential Index (FFPI) model is used to identify vulnerable areas, leveraging the frequency ratio (FR) method for its simplicity and established application in prior studies [45,46]. Results are integrated into a GIS framework to produce flood hazard maps, which are standard in hazard mapping research [47,48].
North Macedonia, though relatively small (25,713 km²), boasts extensive geodiversity and many geomorphological sites [49]. The country’s current network of protected natural heritage includes 91 areas, covering around 13.9% of the national territory, among which approximately 30 are significant geoheritage sites. The Kuklica Natural Monument (NM Kuklica) is particularly notable, featuring 120 earth pyramids. Earth pyramids (or hoodoos) can be found worldwide, and this type of landform is probably present in more countries. However, their existence is not well documented due to different names (earth figures, hoodoos, earth pinnacles, pillars, etc.) and lack of research. As rare and endangered landforms, they are classified as geoheritage objects and are usually protected. However, in Kuklica they are subject to considerable anthropogenic pressures and environmental degradation, particularly after its proclamation as a Natural Monument in 2008, when tourist visits to the site significantly increased. Thus, after the primary research at the end of the 1990s [50], the need for permanent monitoring of this sensitive site appears, considering its uniqueness in the country. In the broader region, a similar complex of earth pyramids is Đavolja Varoš near Kuršumlija, Serbia.
This study uses UAV-based inventorying of the earth pyramids in Kuklica in parallel with the machine learning (ML) classification of the land cover of the area. Additionally, the study examines soil erosion and flash flood vulnerability through a comprehensive GIS-based framework that integrates established empirical models with proven local methodologies. This integrated approach provides a cost-effective method for identifying hazard-prone areas and supporting efficient, evidence-based decision-making in hazard management [51].
2. Research Methodology
2.1. Study Area
NM Kuklica is located approximately 10 km northwest of Kratovo in North Macedonia, in the Kriva Reka valley, at an altitude of 400 to 580 m. The site, which stretches at the bottom of two remarkable palaeovolcanic cones, extends 1.1 km in length and 0.5 km in width, covering an area of approximately 0.5 km². The site is easily accessible by an asphalt road, which ends with car parking in front of the Kuklica NM entrance (Figure 1).
The environmental conditions at Kuklica were suitable for creating earth pyramids as “stone dolls” of varying sizes and shapes. The pyramids are carved in the Kriva Reka River terraces of 30 and 45 m which are extensively eroded by short torrential streams [50]. There are two smaller localities of earth pyramids, the East one and the West one. The East one is the most remarkable, traditionally known as “Jolly Wedding”. Here, about 40 earth pyramids are found in the central part and on the sides of a small semi-circular depression with an area of 2 hectares (0.02 km2). The bottom of this depression is nearly flat and covered with trees, shrubs, and a few impressive earth pyramids up to 8.4 m high. On the east side, the depression is bordered by a small hill locally called Zabel, with about 45 smaller pyramids on its sides (Figure 2).
The second (“west”) locality is about 700 m to the west, on the left sides of a highly eroded torrential valley (large gully). The earth pyramids are up to 30 m high, extending at 415-560 m elevation. This site covers an area of about 10 hectares (0.1 km2).
As stated before, through the NM Kuklica, two torrential streams (right tributaries of Kriva Reka River) pass. Because of the overall impact on erosion and flash flood hazards, their catchments (covering a total of 5.97 km2) are also analyzed.
The lithology of the Kuklica region is predominantly characterized by volcanic tuffs, known for their susceptibility to erosive processes. The presence of tuffs covered with a layer of compact andesitic rocks has significantly shaped the unique geomorphological features observed in this area [50]. Such lithology is a result of Paleogene to Neogene volcanism in Kratovo-Zletovo region as a consequence of regional tectonic dislocation on the border between the Serbo-Macedonian and the Vardar tectonic units [2,52].
Morphologically, the area of Kuklica is surrounded by prominent and mostly uncovered palaeovolcanic cones and necks. To the north, above the locality itself, is the hill Dubica (775 m), to the west rises the hill Vidim (825 m), and to the east is Kalugjerica (791 m). The hills are separated by short torrential tributaries of Kriva Reka, whose riverbeds are deeply cut into the bedrock. On the opposite (left) side of Kriva Reka is Ramni Rid (757 m), with a similar rocky appearance to the previously mentioned ones. Such configuration results in steep slopes in the area. Thus, the mean slope of the NM Kuklica is 18.9°, while terrains steeper than 20° cover 44.4%. The southern slopes highly dominate, accounting for 79.0% of the area.
As a result of the geographical position, location, and hilly border from the northern side, the climate of the Kuklica area is warm-continental. The site is open to the south, which results in intense insolation during the year of over 2400 hours. According to the data from the meteorological station in Kumanovo (30 km on the west), the average air temperature for the period from 1991 to 2020 is 12.7°С, with an absolute minimum of -19.2°С and an absolute maximum of 43.8°С. In the researched area, on average, about 535 mm fall annually, mainly in May and October [53]. Because of the local topography, there is a predominance of the east-west wind.
2.2. UAV Recording Methodology and DEM/Orthophoto Production
This study surveyed NM Kuklica using UAV technology to facilitate a detailed inventory and geohazards assessment through a produced DEM and orthophoto imagery. The UAV selected for this task was the low-cost DJI Mini 4 Pro, chosen for its portability, battery life, operational range, camera quality, and sensors selection. A waypoint mission was first established with well-defined parameters such as starting location, altitude, flight path, duration, and camera angle [54]. As the terrain’s elevation varies from 400 to 580 m, the UAV operated at a steady 650 m, resulting in a relative altitude of 70 to 250 m, capturing images at 5-second intervals. A total of 380 12-megapixel images were captured and subsequently inspected for quality. The recorded images were then processed using Agisoft Metashape, generating a 0.1 m-resolution DEM and orthophoto. To enhance model precision, 12 Ground Control Points (GCPs) with precisely measured GPS coordinates were employed in the calibration process, ensuring model accuracy. The DEM and orthophoto were validated against 1 m LiDAR DTM/DSM from the Agency for Real Estate Cadaster of North Macedonia (AREC), showing a horizontal and elevation accuracy of ±0.25 m.
2.3. Data Processing and Landform Inventory
A key step in this research involved processing DEMs and orthophotos to create a landform inventory for NM Kuklica, a region rich in earth pyramids. Given the high number of these formations, this study employed a semi-automatic approach for identifying rock formations. Using SAGA GIS 9.6 software, machine learning (ML) techniques were applied to analyze a 0.1 m DEM and orthophotos derived from drone data. Initially, accurate and repeatedly verified GPS data were used to record the positions of ten characteristic earth pyramids within a small test area (100 x 100 m). Their dimensions were measured with a laser meter and iPhone 14 Pro LiDAR module, and the surrounding land cover was documented also. These data served as training inputs for the ML model (Figure 3).
A portion of the DEM and orthophoto for this test area was then extracted in SAGA. Since pyramids’ height and relative positioning are critical for identification, a Topographic Position Index (TPI) and Terrain Ruggedness Index (TRI) were generated from the test-area DEM. TPI assesses a point’s relative elevation, determining if it lies on a ridge, slope, or valley, calculated as follows [55]:
The TRI, quantifying elevation differences between neighboring cells, follows [56]:
where: x denotes the elevation of surrounding cells, and max and min represent the highest and lowest elevations [56].
These TPI and TRI layers and the orthophoto were inputs for the Artificial Neural Network (ANN) algorithm, chosen for its reliable classification performance in spatial analysis [57].
Following successful classification in the test area, the ANN-based approach was expanded across the NM Kuklica, facilitating the identification of landforms, as well as paths, roads, anthropogenic structures, bare rocks, highly eroded sites etc.
2.4. Methodology for Soil Erosion Assessment
For the erosion rate assessment in the NM Kuklica and the catchments covering this area, the EPM, also known as the Gavrilović method [27], is used. This method is widely applied for assessing soil erosion in the Balkans and beyond, including countries such as Serbia, Croatia, Slovenia, Germany, Italy, Argentina, and North Macedonia [19,58,59,60,61,62,63,64,65,66]. The method estimates the average annual soil loss (Wy), supporting regional erosion management by identifying mean soil loss and sediment yield. The EPM formula is as follows:
where: Wy represents the average annual erosion rate (m³), T is the temperature coefficient, calculated as T = (0.1 ∙ t + 0.1)0.5 with t as the mean annual air temperature, H is the mean annual precipitation (mm), Z is the erosion coefficient (0.1 to 1.5+), and f represents the area (km²).
Wy = T ⋅ H ⋅ π ⋅ √Z³ ⋅ f,
The erosion coefficient Z, integral to the method, incorporates rock and soil erodibility (Y), land cover index (Xa), visible erosion processes (φ), and mean slope (J):
Z = Y ⋅ Xa ⋅ (φ + √J).
Initially, EPM relied on field assessments, but recent adaptations utilize GIS and remote sensing for a more objective analysis [29,63,67,68,69]. In this study, as a basis for the Y coefficient, geological [70] and soil maps [71] were rasterized to 0.5 m resolution, and erodibility values (0.1 to 2.0) were applied according to [27] (see Table 1).
The land cover index (Xa) was derived by machine learning classification of the UAV-based orthophoto image in SAGA GIS with the test polygons through the Artificial Neural Network algorithm (Figure 4). The final classes correspond to [72] classes with values ranging from 0.1 for dense forests to 1.0 for bare rocks (Table 2).
The coefficient of visible erosion processes (φ) was derived using the red spectral band of the UAV-recorded 0.1 m orthophoto calculated as φ=a/255, with values from 0 to 1, where lower values indicate minimal visible erosion and higher values indicate evident erosion [67,68,73].
2.5. Methodology for Flash Floods Assessment
This study used the FFPI analysis to evaluate flash flood vulnerability in the NM Kuklica. FFPI is a widely applied statistical tool aimed at identifying areas with high flash flood susceptibility (e.g., [89–91]. This method quantitatively assesses a region’s vulnerability to flash flooding by utilizing several weighted factors, such as terrain slope, vegetation cover, land use, and soil type.
The Soil Map of North Macedonia (50k scale) [72] lacks sufficient soil detail for the area of Kuklica NM, so lithological characteristics were combined with soil type data. The FFPI model was thus adapted to include four primary weighted parameters: slope, vegetation cover, lithology/soils, and land use. The formula for calculating FFPI is as follows by Smith [92] (2024):
where M represents terrain slope, S stands for lithology/soils, L denotes land use, and V is the vegetation index. The terrain slope (M) was derived from the 0.1-m UAV-based DEM, and processed using QGIS 3.38.3 and SAGA GIS 9.6 software. For systematic assessment, the slope was classified into percentage categories, reclassifying terrain values from 1 (lowest slope) to 10 (highest slope).
FFPI = (M + S + L + V) / 4
Lithology/soils (S) were assessed from the 50k Soil map [71] and 25k Geological Map of North Macedonia, working version [70] where rocks are classified from 1 to 10 based on their erosion susceptibility.
The land use parameter (L) and vegetation index (V) were derived in the same way as the Xa and φ coefficients for EPM (with machine learning and ANN classification), but with values from 1 to 9 according to their potential influence on flash flood risk. Using GIS and Remote Sensing (RS) technologies, the FFPI model integrates raster datasets of key geographic and environmental variables within the study area. The process includes accurately adjusting, categorizing, and merging slope, lithology, land use, and vegetation cover datasets. Each factor is classified based on its potential to increase flash flood risk, allowing the FFPI model to offer a robust, quantitative assessment of flood vulnerability for the Kuklica vicinity.
3. Results
3.1. Landform Inventory
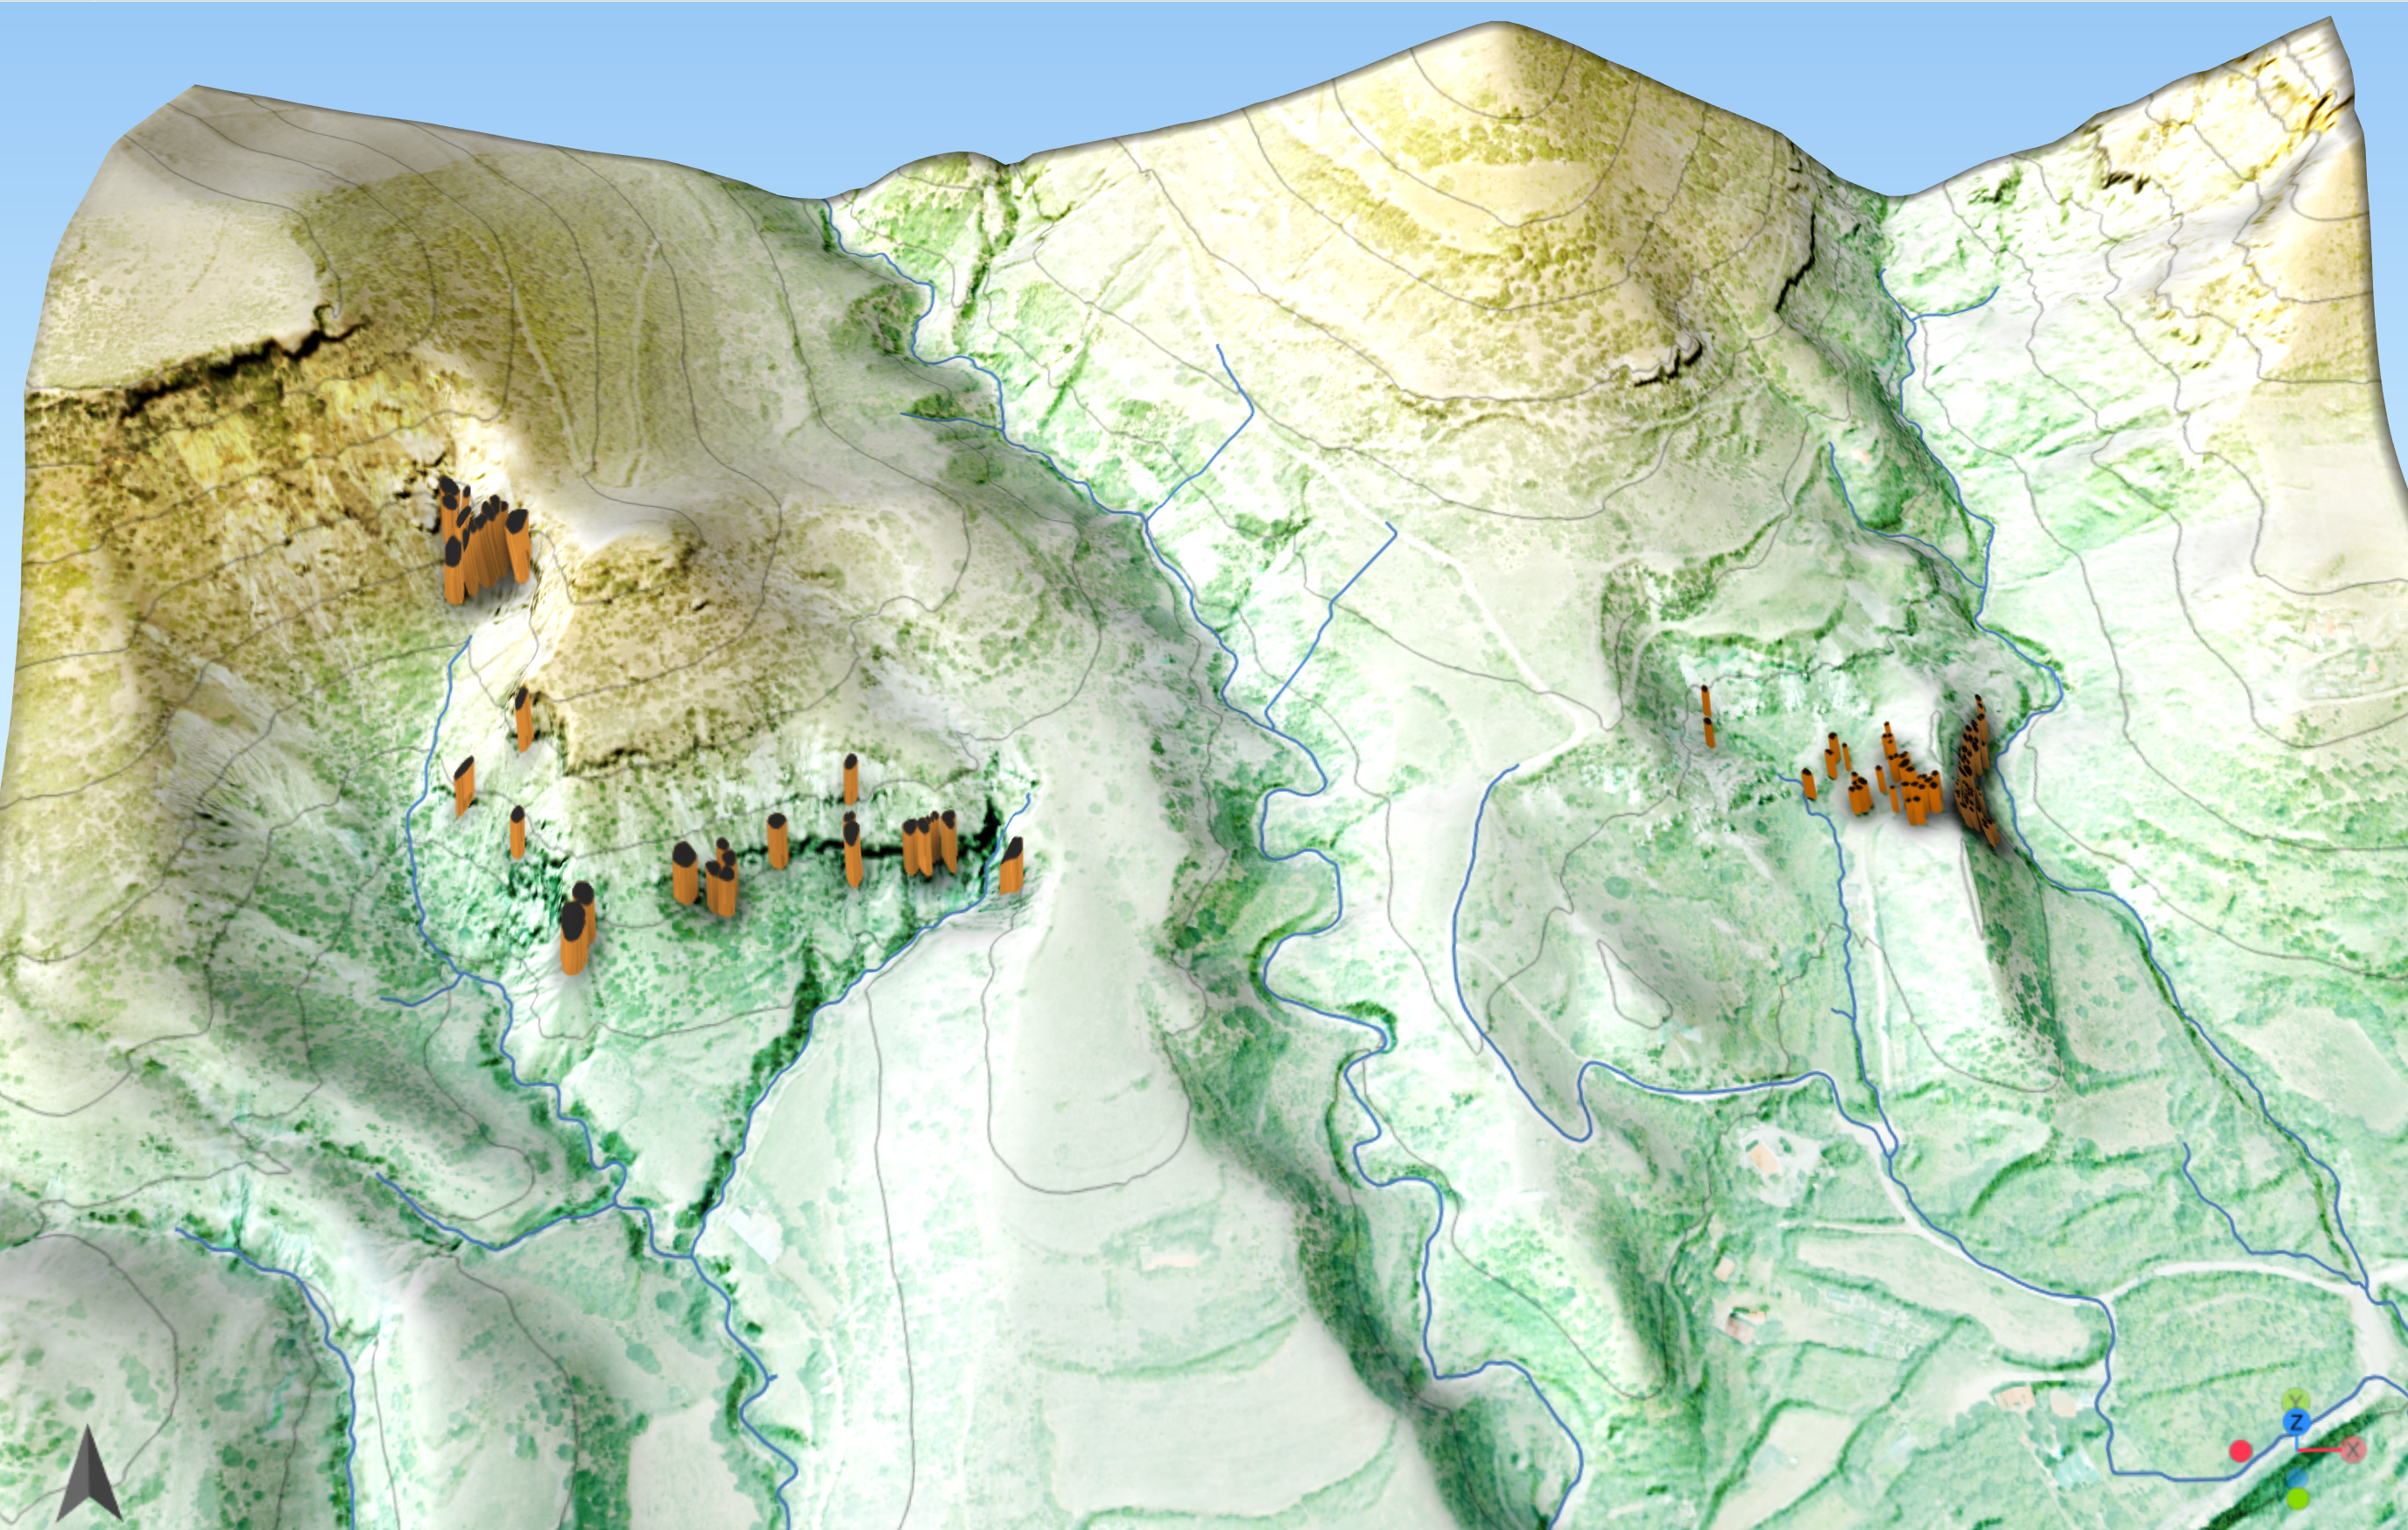
As outlined in the methodology, machine learning classification of UAV-derived DEMs and orthophotos enabled the identification of earth pyramids, pathways, trees, grass, shrubs, anthropogenic objects and other elements at NM Kuklica. However, the automated process was not entirely precise for delineating earth pyramids, especially those in the initial stage of development, mutually connected and without individual patterns. Thus, manual vectorization was conducted over the ML classification (ANN) layer, TPI grid, and orthophoto image as base layers. Also, a textured 3D model in Agisoft Metashape was used for enhanced visualization, landform identification and delineation (Figure 5). This combined approach led to the identification of over 120 earth pyramids across a 0.5 km² area. Identified landforms were recorded in the inventory with details such as ID, name, code, coordinates, dimensions, profile, signs of degradation, and photographs (Figure 6). Most morphometric measurements were derived from the drone-based DEM and orthophoto or with an iPhone 14 Pro LiDAR module and field laser meter.
The morphometric analysis of the earth pyramids shows their vast diversity. The height of the pyramids in the eastern “Jolly Wedding” site is between 1 m (this value is taken as the lowest threshold) to 8.5 m (Code C6 or “Godfather”). The average height of all 86 pyramids located here is 4.1 m. Still, the mean height of the 19 pyramids in the central part of “Jolly Wedding” depression is 4.7 m, while the mean height of the 67 pyramids on the slopes of Zabel is 3.9 m. According to the height, 10 pyramids are higher than 6 m, 8 are between 5 and 6 m, 19 are between 4 and 5 m, 31 are between 2 and 4 m, and 11 are below 2 m.
In the west site, the pyramids are much higher, ranging between 1 m and 30.0 m, with a mean height of 14.7 m. However, half of the 34 pyramids, which are also the highest, are connected in the background (in the initial stage of development), so it is complicated to delineate them as individual forms. Overall, here 8 pyramids are higher than 20 m, another 14 are between 10 and 20 m, and 12 are lower than 10 m.
The mean height of all 120 earth pyramids in Kuklica NM is 7.25 m, and their base elevation is on 420 to 516 m asl.
3.2. Soil Erosion Assessment
According to the map of coefficient Z calculated from EPM, the area of Kuklica has a high mean erosion intensity (Figure 7A), ranging from 0.47 for the entire catchments (wider extent) up to 0.65 for the area of the Natural Monument (Figure 7C). However, there are substantial spatial differences. Thus, the terrains built with andesitic rocks and/or covered with dense forests have low erosion risk with Z below 0.4. Also with a low erosion intensity is the Kriva River alluvial plane, which is generally under agriculture, meadows or forests. On the contrary, the sites with earth pyramids and their immediate surroundings have a high erosion rate with Z values above 1.0 (Table 3).
Table 3 presents different erosion susceptibility zones (according to the coefficient Z) for the Kuklica catchments and the NM. Obviously, in the NM extent, erosion susceptibility is much higher than in the broader catchment area (where they are already high). Thus, in the NM Kuklica, high and very high erosion susceptibility areas cover 43.8% or almost half of the total area. On the contrary, low and very low erosion susceptibility areas cover just 34.1% (in the catchments area, they cover 50.9%).
Because of the high erosion susceptibility of the NM, the human impact must be minimal and carefully planned (in the form of the number of visitors, projected paths and hiking around, construction activities etc.).
High erosion susceptible sites are also characterized by high erosion rates, which in some parts exceed 2000 m3/km2/y, or a topsoil layer of 2 mm per year (Figure 7B, D; Table 4). Because of such high erosion, the “older” pyramids rapidly eroded and changed, while new pyramids gradually appeared in the parent rocks.
According to the low-cost LiDAR measurements based on iPhone 14 Pro and detailed comparisons of the earth pyramid photos taken from the same place for 25 years, the highest erosion rate and fastest morphological changes have earth pyramids on steep slopes. These on flat or gently sloped terrains have subtle, minimal visual, and almost no measurable changes.
3.3. Flash Flood Vulnerability
The slope map generated from the detailed 0.1 m DEM is vital in assessing hydrological processes, as it affects both the timing of runoff and rates of water infiltration. Generally, as slope steepness increases, the rate of infiltration decreases. The study area has an average slope of 18.9 degrees. For analytical purposes, slope values were converted to percentages and categorized, with each class then assigned an FFPI value between 1 and 10. Slopes above 30 degrees received an FFPI rating of 10, indicating high susceptibility to flash flooding.
For the lithology index, data from the preliminary 25k geological map version were utilized, focusing on five main lithological groups: clastic sediments, andesites, tuffs, and breccia [70]. Each unit’s vulnerability to flash flooding was examined and rated, with volcanic tuffs marked by the highest susceptibility coefficient (9), reflecting significant vulnerability to flash flood conditions. Andesitic rocks were assigned the lowest coefficient (1), indicating minimal susceptibility. This index provides insight into how different rock compositions impact infiltration and runoff during heavy rainfall. Andesitic formations, known for their resistance to erosion, are less likely to contribute to flash floods. Conversely, tuffs, breccia, and clastic sediments are more prone to erosion, increasing flood risk under intense rain conditions.
The FFPI analysis underscores those areas with complex agricultural patterns, combined with patches of natural vegetation, are among the most susceptible to flash flooding. In contrast, forested areas have the lowest FFPI scores, indicating a reduced vulnerability to such events. A land use map according to [72] was used to produce and categorize the FFPI land use index for clearer analysis. Using high-resolution UAV imagery at 0.1 m and focusing on the red spectral band allowed us to pinpoint flood-prone areas with greater precision. Additionally, examining the relationship between vegetation cover and erosion rates offered valuable guidance for creating land management strategies and implementing flood mitigation measures. The vegetation index developed for this study has values ranging from 1 to 9.
Through GIS and remote sensing data, we further analyzed the FFPI across the NM Kuklica (illustrated in Figure 8). Our results (presented in Table 5) show that around 40.2% of the region falls under a high flash flood risk, followed by 29.7% at moderate risk. Areas with very high vulnerability to flooding cover 19.4%, mostly concentrated along steep slopes near the earth pyramid formations. The average FFPI value for the study area is 5.8, with a range from 1.7 to 9.5, indicating various levels of flood risk across the landscape.
3.4. Validation of the Results
To validate the model, comparisons were made with flash flood events documented by local communities. Over the last twenty years, both torrential catchments in Kuklica have witnessed recurring flash floods. Field investigations have uncovered substantial fresh sediment deposits in the floodplains of these streams, which correspond with recent flood events that align with the model’s zoning. However, due to the constraints of primary data sources, especially the absence of systematic historical records, the availability of flash flood data for the Receiver Operating Characteristic (ROC) analysis in this study is limited.
Conversely, the critical step in this research was the accuracy assessment of the results. For the earth pyramids morphometry, measurement comparisons of 8 selected pyramids between iPhone LiDAR data, laser meter and UAV-based DEM were made, showing maximal error of +-0.25 m. The error mostly depends on the landform size and shape. However, validating erosion intensity and flash flood susceptibility results is much more complicated. The GIS-based EPM approach used in the study was previously validated in the Upper Bregalnica catchment, comparing the results with the sediment deposition in the Kalimanci reservoir. Nevertheless, that catchment is incomparably larger than Kuklica area. To assess sediment yield and deposition, Ru (sediment retention) and G (sediment yield) values for the Kuklica NM catchments are calculated according to EPM and presented in Table 6.
Aside from high erosion susceptibility (and intensity), the mean annual sediment yield from the catchments in Kuklica area is small in quantity primarily because of the small size of the catchments. Thus, the sediment yield and flash floods have a weak visible terrain impact and are difficult to quantify. Ideally, carefully positioned sediment traps will give us valuable data for the erosion quantity in the NM and the earth pyramids (as in the case of Đavolja Varoš near Kuršumlija, Serbia) [93].
Meanwhile, a good indication of the erosion trends follows after comparing the earliest available high-resolution satellite image of the area (historical imagery in Google Earth Pro) available for 2009 and the UAV-produced orthophoto in 2024. A careful inspection shows that the erosion rate decreased, and some of the well-eroded areas in 2009 are now under pastures.
As for the earth pyramids’ erosion and recent morphological changes, detailed comparisons of the photos taken in the past 30 years are very indicative. They show gradual changes in the pyramids, especially those on steep slopes. However, accurately quantifying the earth pyramid morphological changes is possible only with permanent and careful LiDAR measurements.
4. Discussion
In the last 15 years, globally, new tools, including UAV (unmanned aerial vehicle) and LiDAR (point cloud), are increasingly being used for visual and 3D surveys or monitoring of significant geosites. Since professional LiDAR is still very expensive and difficult to access, small and easily portable UAVs (drones), recently equipped with powerful cameras and additional sensors (proximity, infrared, multispectral, etc.), are increasingly being used. UAV-based orthophotos and digital elevation models can have very high resolution, which enables measurement and analysis of even very small spatial and morphological changes. For now, the biggest problem is obtaining DTM from drone orthophoto images (especially removing vegetation cover). However, that problem can be solved with the progress of software and artificial intelligence (including machine learning and deep learning) and the combination of radar satellite images.
The development of low-cost unmanned systems has enabled numerous precise aerial photogrammetry measurements of the earth’s surface, improving the quantification of the intensity of geomorphological processes. Different level of recording details is needed to determine the intensity of diverse geomorphological processes. When determining the lateral movement of riverbeds, a precision of 5 cm is entirely satisfactory [94,95]. It is similar when determining the coastal displacement in the abrasion process [96]. However, when monitoring linear erosion forms (gullies) or earth pyramids, a better resolution of the images is necessary.
Accordingly, the most precise techniques have been chosen here, following the low budget required for the research. Usually, terrestrial laser scanners cost at least several thousand euros, requiring trained operators and line of sight, only allowing limited scanning positions, and having restricted access in rough terrain. Another reason for designing research in this way, apart from the limited budget, is that although Terrestrial Laser Scanning (TLS) represents a tremendous scientific step forward in geomorphological research, there are still some limitations. There are numerous sources of error within any TLS survey relating to the instrument itself, the properties of the reflecting surface, environmental errors, and the entire workflow required to produce useful topographic data products [97].
The landforms’ identification, inventory, and morphometry were conducted using advanced UAV-based imaging techniques, followed by DEM and orthophoto creation through Agisoft Metashape photogrammetric software. Classification relied on machine learning, using vector polygons as a training area and TPI, TRI, and orthophoto layers as inputs. Our findings indicate that while the ML-produced classification effectively locates earth pyramids, it falls short in precise delineation. Key issues relate to the quality of UAV-derived DEMs and orthophotos. For instance, certain formations are covered with moss and lichen, causing color variations on the orthophoto from light gray to dark green. Shadows from the pyramids, blending with surrounding vegetation, present another challenge. This could be mitigated by conducting drone imaging at midday in summer when shadows are minimal. Additionally, distinguishing landforms from nearby tall vegetation remains challenging with the DEM, but this could be addressed by removing vegetation using machine learning. However, morphometric identification issues persist, particularly in differentiating initial and connected pyramids from exposed rock or gully sides. Side-view (oblique) drone images could help create a more accurate 3D terrain model. Ultimately, precise delineation was achieved through careful manual vectorization using the ML, TPI, and orthophoto layers. Approximately 40 prominent forms and numerous smaller ones were identified. Expanding the training area with more detailed data and experimenting with different machine learning algorithms could enhance automated delineation, benefiting similar landform studies across the region.
In this research, more than 120 earth pyramids across an area of 0.5 km² are delineated, ranging in height from 1-2 m to 21 m. The average height of all 124 pyramids located here is 5.3 m. Morphologically, the most remarkable are the pyramids in the “Jolly Wedding” (east) locality, with 86 identified forms with a mean height of 4.1 m. According to the height, 10 pyramids are higher than 6 m, 8 are between 5 and 6 m, 19 are between 4 and 5 m, 31 are between 2 and 4 m, and 11 are below 2 m. In similar research on the Đavolja Varoš geosite in Serbia, which covers an area of about 4500 m2 in the catchment of the Toplica River, 202 earth figures were scanned and analyzed using Terrestrial laser scanning (TLS) [93]. The highest earth pyramid in this geosite is 15.5 m, and the lowest is 0.8 m. The lithology of the Kuklica region and Đavolja Varoš is similar, with palaeovolcanic cones. In Kuklica, lithology is predominantly characterized by volcanic tuffs, and in Đavolja Varoš, volcanoclastic facies of andesite and dacite/quartz latite. Both lithology units are known for their susceptibility to erosive processes.
Unlike this research, which was carried out using TLS, we used the iPhone 14 Pro LiDAR module to perform test measurements of selected earth pyramids to compare these results with the UAV-based DEM data. As the comparison shows the high accuracy of the measurements from the DEM, the procedure is made for all other earth pyramids. Thus, for the first time, we obtained detailed morphometric values for the Kuklica “Stone Dolls” that can be used for further monitoring. However, the next research will require a UAV with an RTK module or terrestrial lidar for much better precision.
5. Conclusions
This research has laid the necessary base for future research into the erosion processes affecting this highly significant geosite. The research was carried out using low-cost techniques that are easily accessible today.
This study underscored using UAVs to create detailed DEM and orthophoto imagery as a basis for earth pyramid identification, inventory, erosion and flash flood assessment, and monitoring of the Kuklica NM. Morphometric measurements were derived from the drone-based DEM and orthophoto or with an iPhone 14 Pro LiDAR module and field laser meter. The low-cost LiDAR measurements based on iPhone 14 Pro and detailed comparisons of the earth pyramid with laser meter and UAV results created a base level for further monitoring process. In the future, monitoring steps will be realized in different periods using the same equipment and TLS.
In this research, the first attempt was machine learning to perform automatic landform identification and delineation. However, in our study, indicating the earth pyramids’ location was more helpful than their accurate delineation (performed manually). Thus, further procedure improvement is necessary with more detailed training data and testing other machine learning algorithms.
Author Contributions
I.M. conceived the original idea for this study and developed the study design; B.A. made a significant contribution by drafting the introduction; I.M. and B.A. contributed to the analysis and interpreted the data and methodology; S.D. and I.M. drafted the discussion; I.M. made the GIS analyses; I.M. and S.D. composed the conclusions; I.M., B.A. and S.D. critically reviewed the data analysis and contributed to revising and finalizing the manuscript; All authors have read and agreed to the published version of the manuscript.
Data Availability Statement
Data are contained within the article.
Acknowledgments
The authors acknowledge the use of Grammarly Premium and ChatGPT 4.0 in the process of improving the clarity and quality of the English language in this manuscript. The AI tools were used to assist in language enhancement but were not involved in the development of the scientific content. The authors take full responsibility for the originality, validity, and integrity of the manuscript.
Conflicts of Interest
The authors declare no conflicts of interest.
References
- Faccini, F.; Gabellieri, N.; Paliaga, G.; Piana, P.; Angelini, S.; Coratza, P. Geoheritage map of the Portofino Natural Park (Italy). J. Maps 2018, 14, 87–96. [Google Scholar] [CrossRef]
- Aleksova, B.; Vasiljević, D.; Nemeth, K.; Milevski, I. Palaeovolcanic geoheritage from volcano geology perspective within Earth’s geosystems: Geoeducation of the potential geopark Kratovo-Zletovo (North Macedonia). Geoheritage 2024, 16, 54. [Google Scholar] [CrossRef]
- Fuertes-Gutiérrez, I.; Fernandez-Martinez, E. Mapping geosites for geoheritage management: A methodological proposal for the Regional Park of Picos de Europa (León, Spain). Environ. Manag. 2012, 50, 789–806. [Google Scholar] [CrossRef]
- Zouros, N. Assessment, protection, and promotion of geomorphological and geological sites in the Aegean area, Greece. Géomorphologie: Relief Process. Environ. 2005, 3, 227–234. [Google Scholar] [CrossRef]
- Serifoglu Yilmaz, C.; Yilmaz, V.; Güngör, O. Investigating the Performances of Commercial and Non-Commercial Software for Ground Filtering of UAV-Based Point Clouds. Int. J. Remote Sens. 2018, 39, 5016–5042. [Google Scholar] [CrossRef]
- Remondino, F.; Barazzetti, L.; Nex, F.; Scaioni, M.; Sarazzi, D. UAV Photogrammetry for Mapping and 3D Modeling: Current Status and Future Perspectives. Int. Arch. Photogramm. Remote Sens. Spat. Inf. Sci. Retrieved from http://3dom.fbk.eu/sites/3dom.fbk.eu/files/pdf/Remondino_etal_UAV2011.pdf. 2011, 38. [Google Scholar] [CrossRef]
- Greenwood, W.; Zekkos, D.; Lynch, J.; Bateman, J.; Clark, M.K.; Chamlagain, D. UAV-based 3-D characterization of rock masses and rock slides in Nepal. In Proceedings of the 50th US Rock Mechanics Symposium, Houston, TX, USA, 26–29 June 2016; ARMA: American Rock Mechanics Association. [Google Scholar]
- Jiménez-Jiménez, S.I.; Ojeda-Bustamante, W.; Marcial-Pablo, M.d.J.; Enciso, J. Digital terrain models generated with low-cost UAV photogrammetry: Methodology and accuracy. ISPRS Int. J. Geo-Inf. 2021, 10, 285. [Google Scholar] [CrossRef]
- Xiang, J.; Chen, J.; Sofia, G.; Tian, Y.; Tarolli, P. Open-Pit Mine Geomorphic Changes Analysis Using Multi-Temporal UAV Survey. Environ. Earth Sci. 2018, 77, 220. [Google Scholar] [CrossRef]
- Hernandez-Lopez, D.; Felipe-Garcia, B.; Gonzalez-Aguilera, D.; Arias-Perez, B. An automatic approach to UAV flight planning and control for photogrammetric applications. Photogramm. Eng. Remote Sens. 2013, 79, 87–98. [Google Scholar] [CrossRef]
- Chiabrando, F.; Sammartano, G.; Spanò, A. A comparison among different optimization levels in 3D multi-sensor models: A test case in emergency context: 2016 Italian earthquake. ISPRS Int. Arch. Photogramm. Remote Sens. Spat. Inf. Sci. 2017, 42, 155–162. [Google Scholar] [CrossRef]
- Roth, L.; Hund, A.; Aasen, H. PhenoFly Planning Tool: Flight Planning for High-Resolution Optical Remote Sensing with Unmanned Aerial Systems. Plant Methods 2018, 14, 1–21. [Google Scholar] [CrossRef] [PubMed]
- Cabreira, T.M.; Brisolara, L.B.; Ferreira, P.R. Survey on coverage path planning with unmanned aerial vehicles. Drones 2019, 3, 4. [Google Scholar] [CrossRef]
- Manconi, A.; Ziegler, M.; Blöchliger, T.; Wolter, A. Technical note: Optimization of unmanned aerial vehicles flight planning in steep terrains. Int. J. Remote Sens. 2019, 40, 2483–2492. [Google Scholar] [CrossRef]
- Cheng, M.-L.; Matsuoka, M. Extracting three-dimensional (3D) spatial information from sequential oblique unmanned aerial system (UAS) imagery for digital surface modeling. Int. J. Remote Sens. 2020, 42, 1643–1663. [Google Scholar] [CrossRef]
- Zhang, Z. Introduction to Machine Learning: K-Nearest Neighbors. Water 2019, 11, 1824. [Google Scholar] [CrossRef]
- Lingua, A.; Noardo, F.; Spanò, A.; Sanna, S.; Matrone, F. 3D model generation using oblique images acquired by UAV. ISPRS Int. Arch. Photogramm. Remote Sens. Spat. Inf. Sci. 2017, 42, 107–115. [Google Scholar] [CrossRef]
- Dragicević, S.; Filipović, D.; Kostadinov, S.; Ristić, R.; Novković, I.; Zivković, N.; Andjelković, G.; Abolmasov, B.; Secerov, V.; Djurdjić, S. Natural hazard assessment for land-use planning in Serbia. Int. J. Environ. Res. 2011, 5, 371–380. [Google Scholar]
- Blinkov, I.; Kostadinov, S. Applicability of various erosion risk assessment methods for engineering purposes. Proceedings of BALWOIS 2010 Conference, Ohrid, North Macedonia, 25–29 May 2010. [Google Scholar]
- Eckelmann, W.; Baritz, R.; Bialousz, S.; Bielek, P.; Carré, F.; Houšková, B.; Jones, R.J.A.; Kibblewhite, M.G.; Kozak, J.; Le Bas, C.; Tóth, G.; Tóth, T.; Várallyay, G.; Yli Halla, M.; Zupan, M. Common criteria for risk area identification according to soil threats. EUR 22185 EN; Office for Official Publications of the European Communities: Luxembourg, 2006. [Google Scholar]
- Alewell, C.; Borrelli, P.; Meusburger, K.; Panagos, P. Using the USLE: Chances, Challenges and Limitations of Soil Erosion Modelling. Int. Soil Water Conserv. Res. 2019. [Google Scholar] [CrossRef]
- Kirkby, M.; Irvine, B.J.; Jones, R.J.A.; Govers, G.; Cerdan, O. The PESERA Coarse Scale Erosion Model for Europe. I. Model Rationale and Implementation. Eur. J. Soil Sci. 2008, 59, 1293–1306. [Google Scholar]
- Goodrich, D.; Burns, I.S.; Unkrich, C.L.; et al. KINEROS2/AGWA: Model Use, Calibration, and Validation. Trans. ASABE 2012, 55, 1561–1574. [Google Scholar] [CrossRef]
- Hagen, L.J. Evaluation of the Wind Erosion Prediction System (WEPS) Erosion Submodel on Cropland Fields. Environ. Model. Softw. 2004, 19, 171–176. [Google Scholar] [CrossRef]
- Laflen, J.M.; Lane, L.J.; Foster, G.R. WEPP: A New Generation of Erosion Prediction Technology. J. Soil Water Conserv. 1991, 46, 34–38. [Google Scholar]
- Guo, T.; Srivastava, A.; Flanagan, D.C. Improving and Calibrating Channel Erosion Simulation in the Water Erosion Prediction Project (WEPP) Model. J. Environ. Manag. 2021, 291, 112616. [Google Scholar] [CrossRef] [PubMed]
- Gavrilović, S. Engineering of Torrents and Erosion; Journal of Construction: Belgrade, Yugoslavia, 1972. (In Serbian) [Google Scholar]
- Milevski, I. Modeling Soil Erosion Intensity with Software Tools, in the Example of Kumanovo Basin. In Proceedings of the II Congress of Macedonian Geographic Society, Ohrid, Macedonia; 2001; pp. 49–57. [Google Scholar]
- Globevnić, L.; Holjević, D.; Petkovšek, G.; Rubinić, J. Applicability of the Gavrilović Method in Erosion Calculation Using Spatial Data Manipulation Techniques. In Erosion Prediction in Ungauged Basins: Integrating Methods and Techniques; IAHS Publication: Wallingford, UK, 2003; Volume 279, pp. 255–263. [Google Scholar]
- Archer, D.R.; Leesch, F.; Harwood, K. Learning from the Extreme River Tyne Flood in January 2005. Water Environ. J. 2006, 21, 133–141. [Google Scholar] [CrossRef]
- Borga, M.; Boscolo, P.; Zanon, F.; Sangati, M. Hydrometeorological Analysis of the 29 August 2003 Flash Flood in the Eastern Italian Alps. J. Hydrometeorol. 2007, 8, 1049–1067. [Google Scholar] [CrossRef]
- Gaume, E.; Bain, V.; Bernardara, P.; Viglione, A.; et al. A Collation of Data on European Flash Floods. J. Hydrol. 2009, 367, 70–78. [Google Scholar] [CrossRef]
- Pradhan, B. Flood Susceptible Mapping and Risk Area Delineation Using Logistic Regression, GIS, and Remote Sensing. J. Spat. Hydrol. 2009, 9, 1–18. [Google Scholar]
- Giustarini, L.; Chini, M.; Hostache, R.; Pappenberger, F.; Matgen, P. Flood Hazard Mapping Combining Hydrodynamic Modeling and Multi-annual Remote Sensing Data. Remote Sens. 2015, 7, 14200–14226. [Google Scholar] [CrossRef]
- Gigović, L.; Pamučar, D.; Bajić, Z.; Drobnjak, S. Application of GIS-Interval Rough AHP Methodology for Flood Hazard Mapping in Urban Areas. Water 2017, 9, 360. [Google Scholar] [CrossRef]
- Balogun, A.-L.; Matori, A.-N.; Hamid-Mosaku, A.I. A Fuzzy Multi-criteria Decision Support System for Evaluating Subsea Oil Pipeline Routing Criteria in East Malaysia. Environ. Earth Sci. 2015, 74, 4875–4884. [Google Scholar] [CrossRef]
- Tehrany, M.S.; Pradhan, B.; Jebur, M.N. Spatial Prediction of Flood Susceptible Areas Using Rule-Based Decision Tree (DT) and a Novel Ensemble Bivariate and Multivariate Statistical Model in GIS. J. Hydrol. 2013, 504, 69–79. [Google Scholar] [CrossRef]
- Mukerji, A.; Chatterjee, C.; Raghuwanshi, N.S. Flood Forecasting Using ANN, Neuro-fuzzy, and Neuro-GA Models. J. Hydrol. Eng. 2009, 14, 647–652. [Google Scholar] [CrossRef]
- Pulvirenti, L.; Pierdicca, N.; Chini, M.; Guerriero, L. An Algorithm for Operational Flood Mapping from Synthetic Aperture Radar (SAR) Data Using Fuzzy Logic. Nat. Hazards Earth Syst. Sci. 2011, 11, 529–540. [Google Scholar] [CrossRef]
- Tehrany, M.S.; Pradhan, B.; Jebur, M.N. Flood Susceptibility Mapping Using a Novel Ensemble Weights-of-Evidence and Support Vector Machine Models in GIS. J. Hydrol. 2014, 512, 332–343. [Google Scholar] [CrossRef]
- Efthimiou, N.; Lykoudi, E.; Panagoulia, D.; Karavitis, C. Assessment of soil susceptibility to erosion using the EPM and RUSLE models: The case of Venetikos river catchment. Glob. NEST J. 2016, 18, 164–179. [Google Scholar]
- Dragićević, N.; Karleuša, B.; Ožanič, N. A review of the Gavrilovič method (erosion potential method) application. Građevinar J. Croat. Assoc. Civ. Eng. 2016, 68, 715–725. [Google Scholar]
- Bezak, N.; Borrelli, P.; Mikoš, M.; Auflič, M.J.; Panagos, P. Towards multi-model soil erosion modelling: An evaluation of the erosion potential method (EPM) for global soil erosion assessments. CATENA 2024, 234, 107596. [Google Scholar] [CrossRef]
- Aleksova, B.; Lukić, T.; Milevski, I.; Spalević, V.; Marković, S.B. Modeling water erosion and mass movements (wet) by using GIS-based multi-hazard susceptibility assessment approaches: A case study – Kratovska Reka catchment (North Macedonia). Atmosphere 2023, 14, 1139. [Google Scholar] [CrossRef]
- Aleksova, B.; Lukić, T.; Milevski, I.; Puhar, D.; Marković, S.B. Preliminary assessment of geohazards’ impacts on geodiversity in the Kratovska Reka Catchment (North Macedonia). Geosciences 2024, 14, 62. [Google Scholar] [CrossRef]
- Aleksova, B.; Milevski, I.; Dragićević, S.; Lukić, T. GIS-based integrated multi-hazard vulnerability assessment in Makedonska Kamenica municipality, North Macedonia. Atmosphere 2024, 15, 774. [Google Scholar] [CrossRef]
- Milevski, I.; Dragicevic, S.; Radevski, I. GIS and Remote Sensing-based natural hazard modeling of Kriva Reka catchment, Republic of Macedonia. Zeitschrift für Geomorphologie 2017, 58 (Suppl. S3), 213–228. [Google Scholar] [CrossRef]
- Milevski, I. An approach of GIS-based assessment of soil erosion rate on a country level in the case of Macedonia. In Proceedings of the Conference Geobalcanica; Skopje, North Macedonia; 2015; p. 5. [Google Scholar] [CrossRef]
- Petras, J.; Holjevič, D.; Kunstek, D. Implementation of GIS Technology in Gavrilović’s Method for Estimating Soil Erosion Production and Sediment Transport. In Proceedings of the International Conference on Erosion and Torrent Control as a Factor in Sustainable River Basin Management, Belgrade, Serbia, 25–28 September 2007. [Google Scholar]
- Hristov, S.; Karajovanovikj, M. General Geological Map, 100k, Interpreter for the sheet Kratovo K 34 - 69 Belgrade (Sheet 25k for SR Macedonia). Belgrade, Yugoslavia: Professional Fund of the Federal Geological Survey of SFRY, 1969. (In Macedonian).
- Filipovski, G.; Rizovski, R.; Ristevski, P.; Ivović, M. Soil Map of the Republic of Macedonia, 50k. Rome, Italy: FAO; Skopje, North Macedonia: Agricultural Institute-UKIM, 2015. (In Macedonian) [Google Scholar]
- Corine Land Cover 2018. Copernicus Land Monitoring Service. Technical Report. Luxembourg: Office for Official Publications of the European Communities, 2016.
- Milevski, I.; Dragicević, S.; Georgievska, A. GIS and RS-based modeling of potential natural hazard areas in Pehchevo municipality, Republic of Macedonia. J. Geogr. Inst. Jovan Cvijić SASA 2013, 63, 95–107. [Google Scholar] [CrossRef]
- Milevski, I. Factors, forms, assessment and human impact on excess erosion and deposition in upper Bregalnica watershed (Republic of Macedonia). In Human Impact on Landscape; Harnischmachter, S., Loczy, D., Eds. Zeitschrift für Geomorphologie 2011, 55, 77–94. [Google Scholar] [CrossRef]
- Milevski, I.; Aleksova, B.; Lukić, T.; Dragićević, S.; Valjarević, A. Multi-hazard modeling of erosion and landslide susceptibility at the national scale in the example of North Macedonia. Open Geosci. 2024, 16, 20220718. [Google Scholar] [CrossRef]
- Fick, S.E.; Hijmans, R.J. WorldClim 2: New 1-km spatial resolution climate surfaces for global land areas. Int. J. Climatol. 2017, 37, 4302–4315. [Google Scholar] [CrossRef]
- Wan, Z.; Hook, S.; Hulley, G. MOD11A1 MODIS/Terra Land Surface Temperature/Emissivity Daily L3 Global 1km SIN Grid V006. NASA EOSDIS Land Processes DAAC, 2024. [CrossRef]
- Hydro-Meteorological Service of North Macedonia. Meteorological and hydrological data (1991–2020).
- Tošić, R.; Dragićević, S.; Lovrić, N. Assessment of soil erosion and sediment yield changes using erosion potential model – Case study: Republic of Srpska (BiH). Carpathian J. Earth Environ. Sci. 2012, 7, 147–154. [Google Scholar]
- Spalević, V.; Barović, G.; Vujacić, D.; Curović, M.; Behzadfar, M.; Djurović, N. The Impact of Land Use Changes on Soil Erosion in the River Basin of Miocki Potok, Montenegro. Water 2020, 12, 2973. [Google Scholar] [CrossRef]
- Kostadinov, S.; Braunović, S.; Dragićević, S.; Zlatić, M.; Dragović, N.; Rakonjac, N. Effects of Erosion Control Works: Case Study—Grdelica Gorge, the South Morava River (Serbia). Water 2018, 10, 1094. [Google Scholar] [CrossRef]
- Zorn, M.; Komac, B. The Importance of Measuring Erosion Processes on the Example of Slovenia. Hrvatski Geografski Glasnik / Croatian Geographical Bulletin 2011, 73, 19–34. [Google Scholar] [CrossRef]
- Kazimierski, L.D.; Irigoyen, M.; Re, M.; Menendez, A.N.; Spalletti, P.; Brea, J.D. Impact of Climate Change on Sediment Yield from the Upper Plata Basin. Int. J. River Basin Manag. 2013, 11, 411–421. [Google Scholar] [CrossRef]
- Tavares, A.S.; Spalević, V.; Avanzi, J.C.; Alves, D. Modeling of Water Erosion by the Erosion Potential Method in a Pilot Subbasin in Southern Minas Gerais. Semin. Ciências Agrár. Londrina 2019, 40, 555–572. [Google Scholar] [CrossRef]
- Ali, S.; Al-Umary, F.A.; Salar, S.G.; Al-Ansari, N.; Knutsson, S. GIS-Based Soil Erosion Estimation Using EPM Method, Garmiyan Area, Kurdistan Region, Iraq. J. Civ. Eng. Archit. 2016, 10, 291–308. [Google Scholar] [CrossRef]
- Hazbavi, Z.; Azizi, E.; Sharifi, Z.; Alaei, N.; Mostafazadeh, R.; Behzadfar, M. Comprehensive Estimation of Erosion and Sediment Components Using Intero Model in the Koozeh Topraghi Watershed. Environ. Eros. Res. J. 2020, 10, 92–110. [Google Scholar]
- Behzadfar, M.; Tazioli, A.; Vukleic-Shutoska, M.; Simunic, I.; Spalevic, V. Calculation of Sediment Yield in the S1-1 Watershed, Shirindareh Watershed. Iran. J. Agric. Sci. 2014, 60, 207–216. [Google Scholar] [CrossRef]
- Tošić, R.; Dragićević, S.; Lovrić, N.; Milevski, I. Multi-Hazard Assessment Using GIS in Urban Areas: Case Study—Banja Luka Municipality, Bosnia Herzegovina. Bull. Serb. Geogr. Soc. 2013, 93(4), 41–50. [Google Scholar] [CrossRef]
- Minea, G. Assessment of the Flash Flood Potential of Bâsca River Catchment (Romania) Based on Physiographic Factors. Cent. Eur. J. Geosci. 2013, 5(3), 344–353. [Google Scholar] [CrossRef]
- Costache, R.; Pravalie, R.; Mitof, I.; Popescu, C. Flood Vulnerability Assessment in the Low Sector of Saratel Catchment. Case Study: Joseni Village. Carpathian J. Earth Environ. Sci. 2015, 10, 161–169. [Google Scholar]
- Tincu, R.; Lazar, G.; Lazar, I. Modified Flash Flood Potential Index in Order to Estimate Areas with Predisposition to Water Accumulation. Open Geosci. 2018, 10, 593–606. [Google Scholar] [CrossRef]
- Smith, G. Flash Flood Potential: Determining the Hydrologic Response of FFMP Basins to Heavy Rain by Analyzing Their Physiographic Characteristics. Available online: https://www.cbrfc.noaa.gov/papers/ffp_wpap.pdf (accessed on 29 May 2024).
- Tešić, D.; Tomić, T.; Tomic, N.; Markovic, S.; Tadić, E.; Marković, R.; Bačević, N.; Manojlović, M.D. Using LiDAR Technology for Geoheritage Inventory and Modelling: Case Study of Đavolja Varoš Geosite (Serbia). Geoheritage 2024, 16, 41. [Google Scholar] [CrossRef]
- Dragićević, S.; Pripužić, M.; Živković, N.; Novković, I.; Kostadinov, S.; Langović, M.; Milojković, B.; Čvorović, Z. Spatial and Temporal Variability of Bank Erosion during the Period 1930–2016: Case Study—Kolubara River Basin (Serbia). Water 2017, 9(10), 748. [Google Scholar] [CrossRef]
- Dragićević, S.; Stojanović, Z.; Manić, E.; Roksandić, M.; Stepić, M.; Zivković, N.; Zlatić, M.; Kostadinov, S. Economic Consequences of Bank Erosion in the Lower Part of the Kolubara River Basin, Serbia. Environ. Eng. Manag. J. 2017, 16(2), 381–390. [Google Scholar] [CrossRef]
- Luetzenburg, G.; Kroon, A.; Bjørk, A.A. Evaluation of the Apple iPhone 12 Pro LiDAR for an Application in Geosciences. Sci. Rep. 2021, 11, 22221. [Google Scholar] [CrossRef] [PubMed]
- Tilly, N.; Kelterbaum, D.; Zeese, R. Geomorphological Mapping with Terrestrial Laser Scanning and UAV-Based Imaging. ISPRS Arch. Photogramm. Remote Sens. Spat. Inf. Sci. 2016, XLI-B5, 591–597. [Google Scholar] [CrossRef]
Figure 1.
Location of the NM Kuklica and its catchment area.
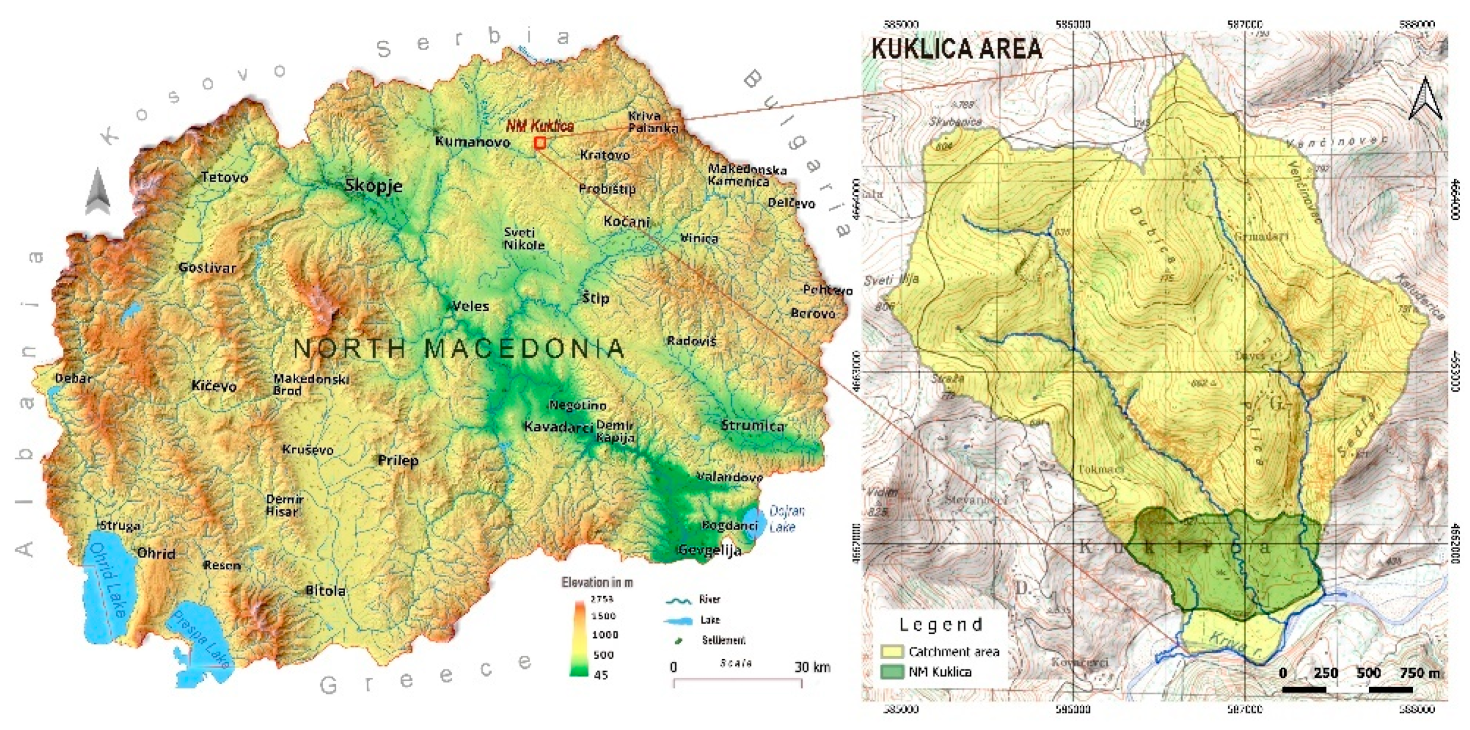
Figure 2.
The East (left) and the West (right) site of earth pyramids in the NM Kuklica.
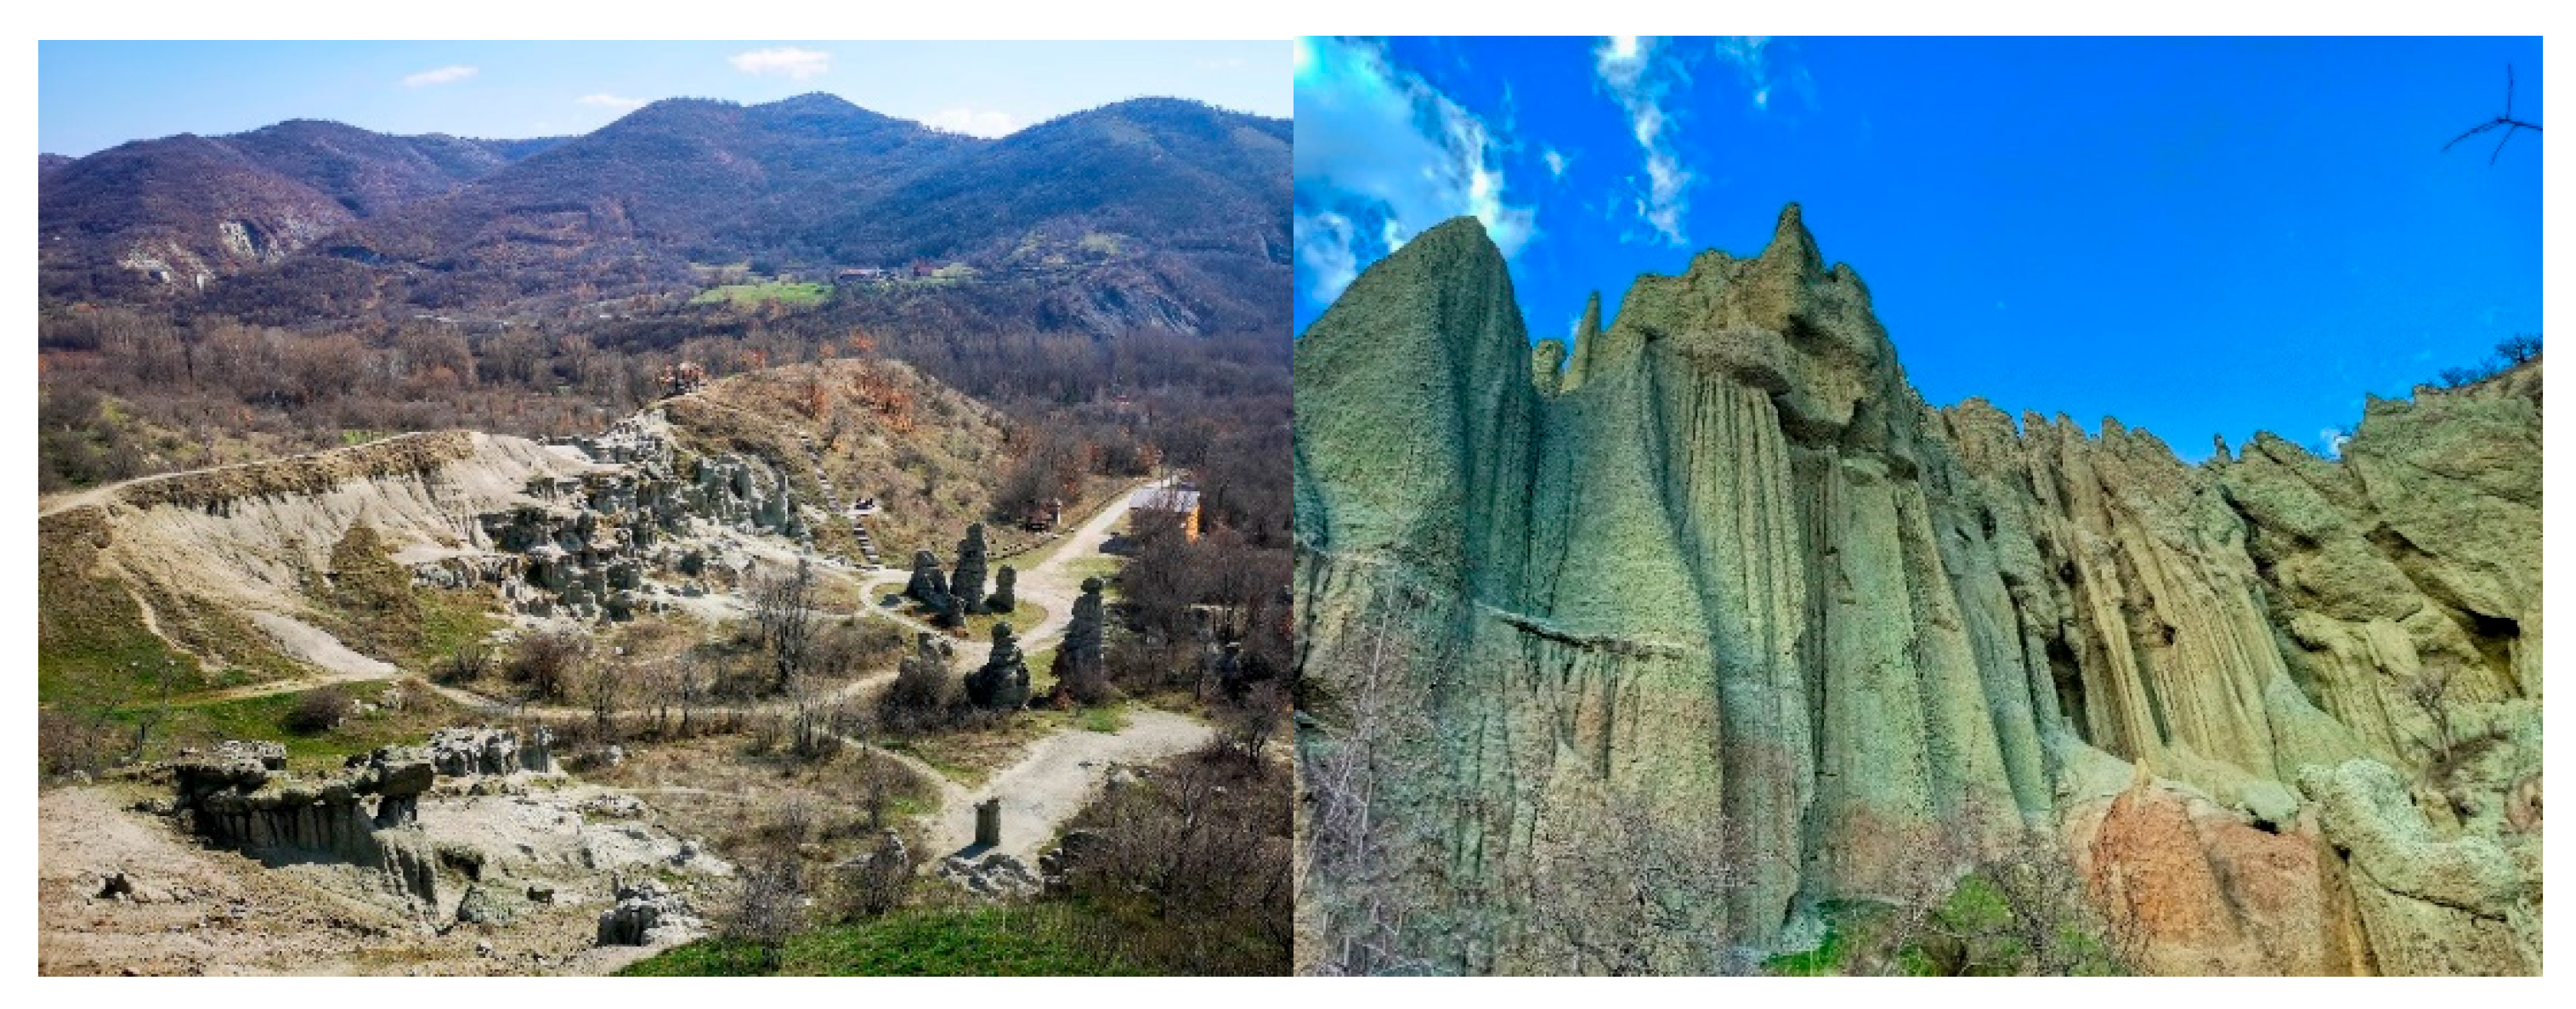
Figure 3.
Test polygons as the input for the machine learning classification (ANN).
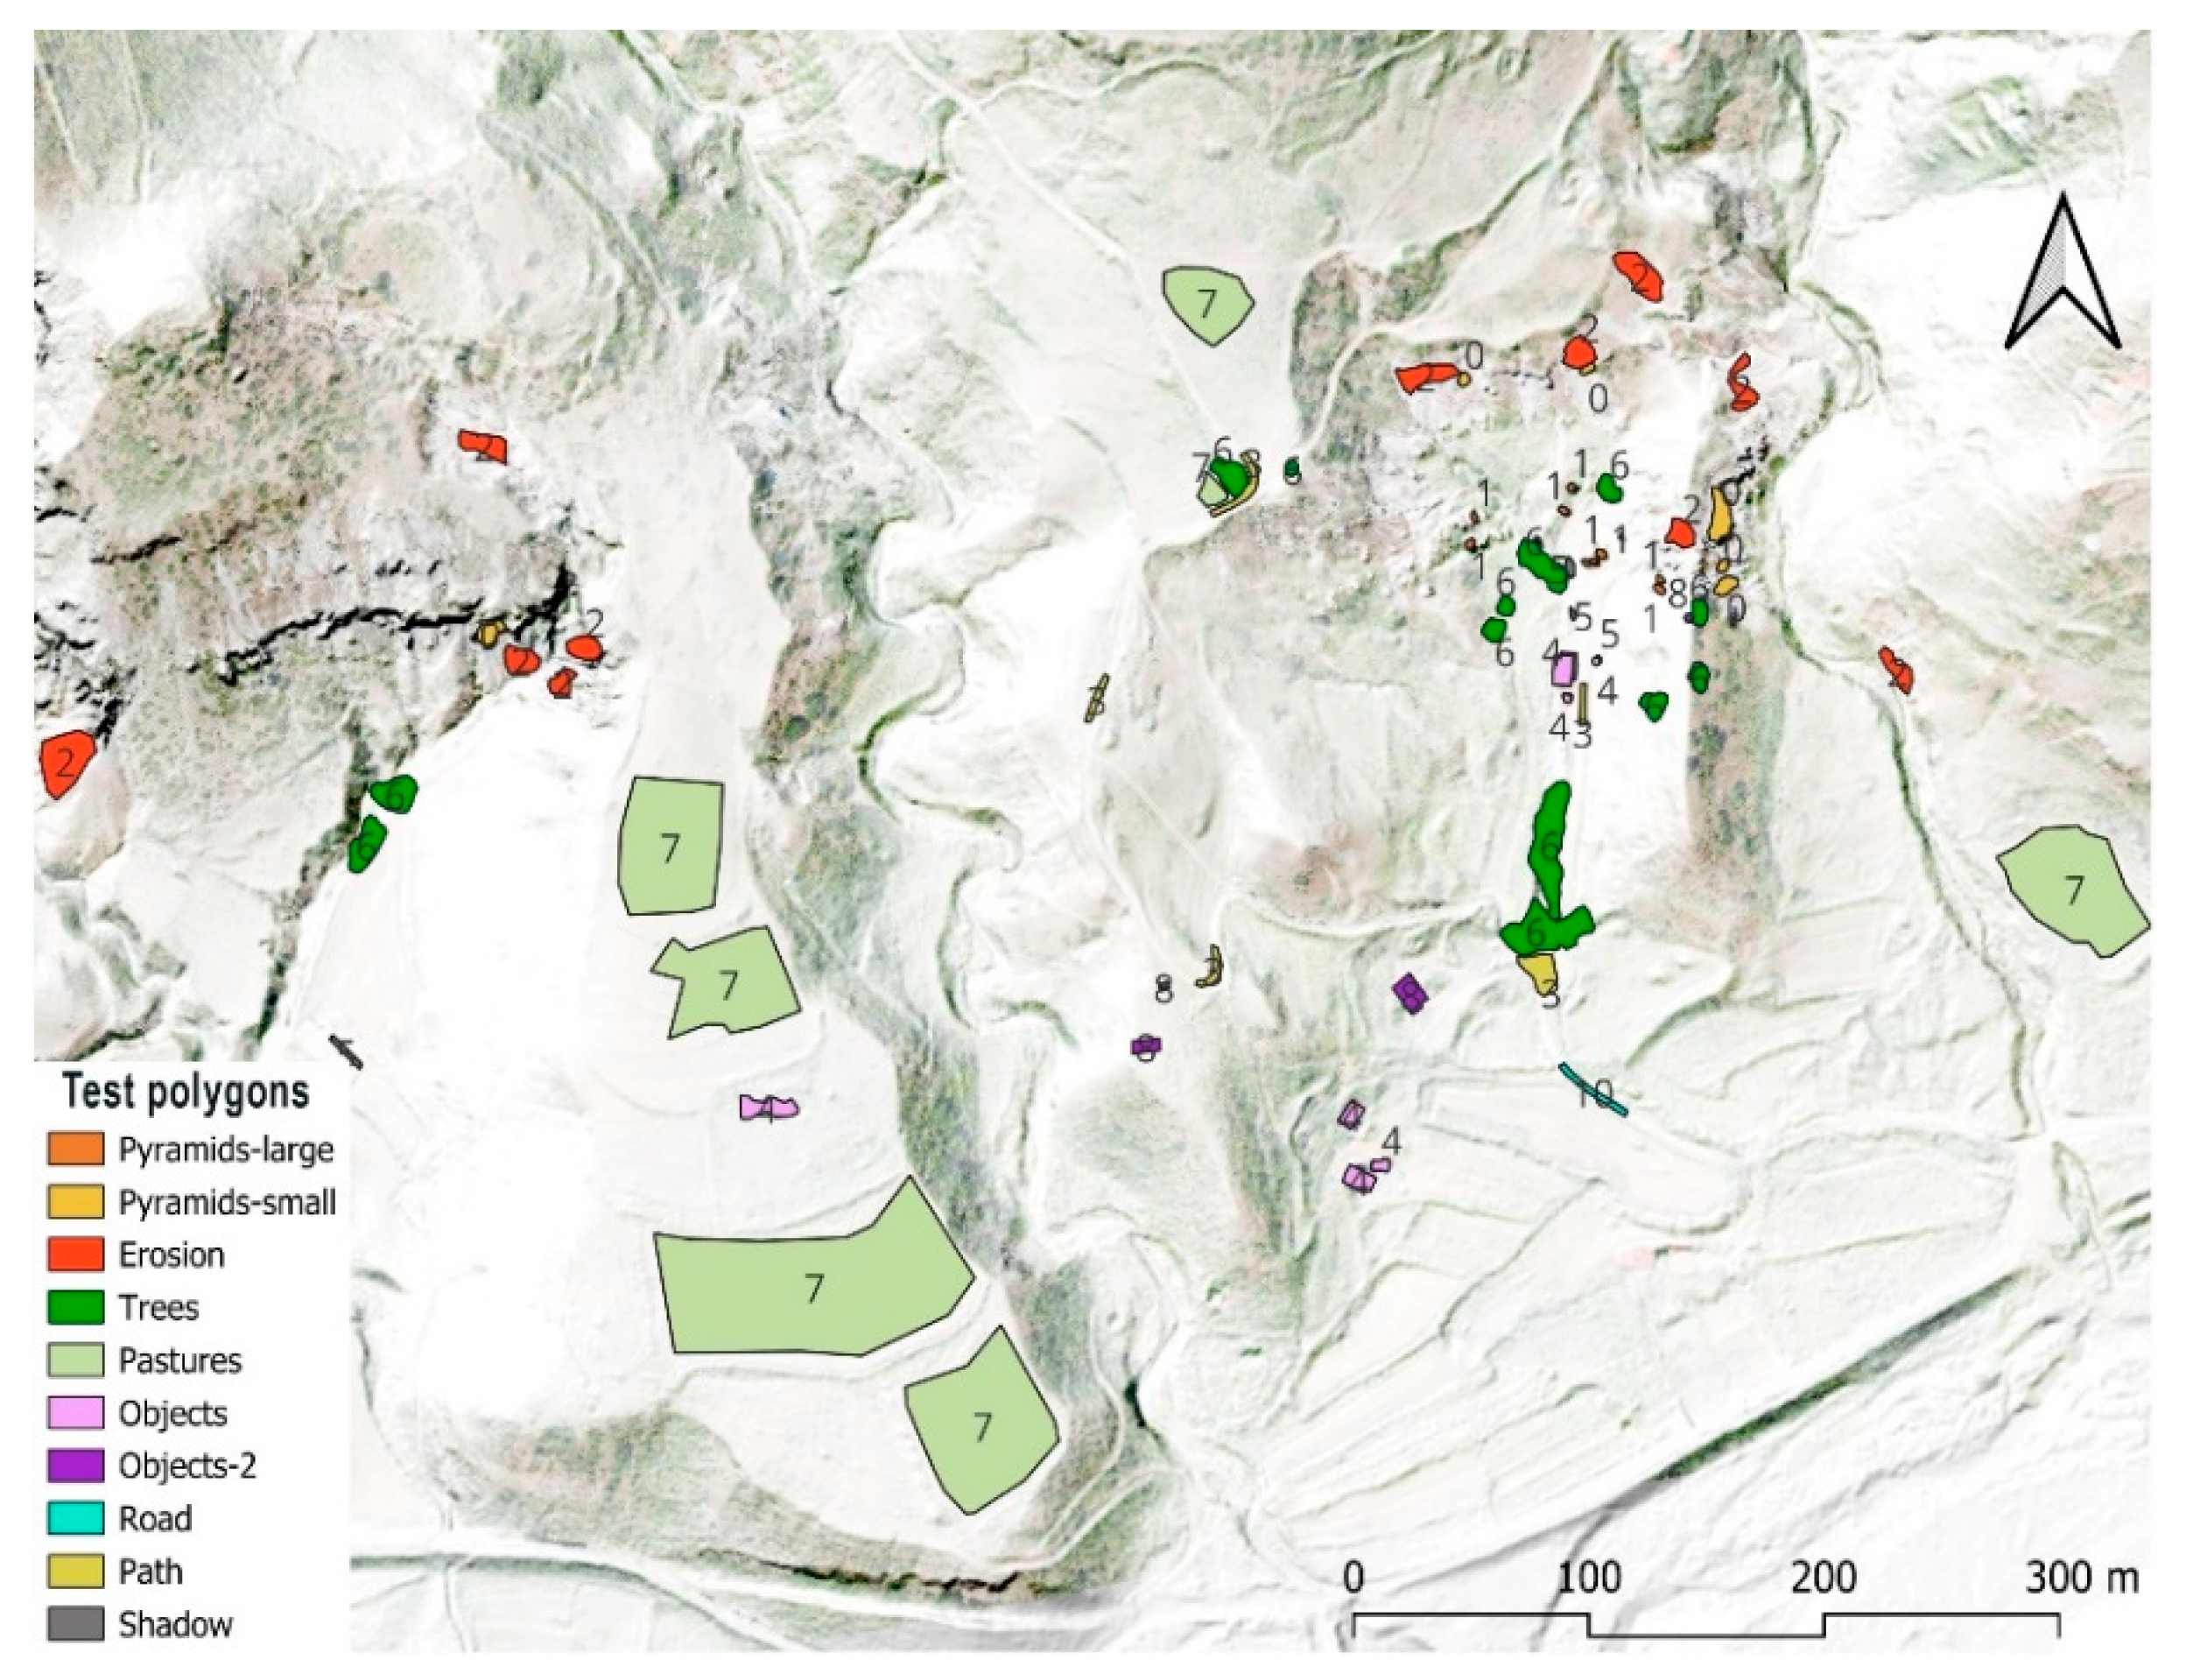
Figure 4.
Machine learning ANN classification of land cover in Kuklica area.
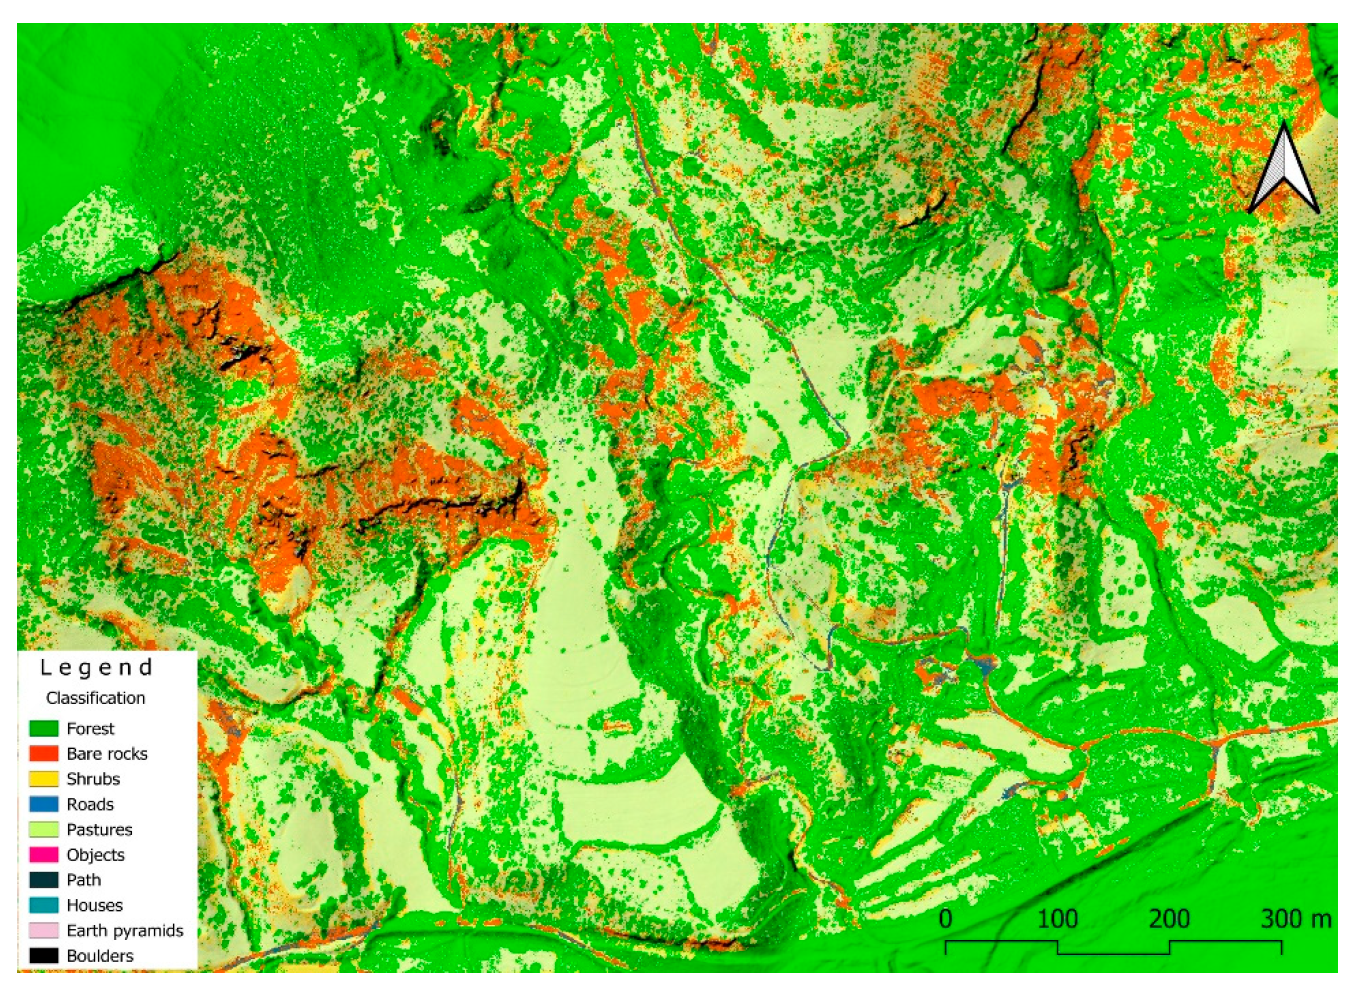
Figure 5.
Identified and delineated earth pyramids in Agisoft Metashape 3D model.
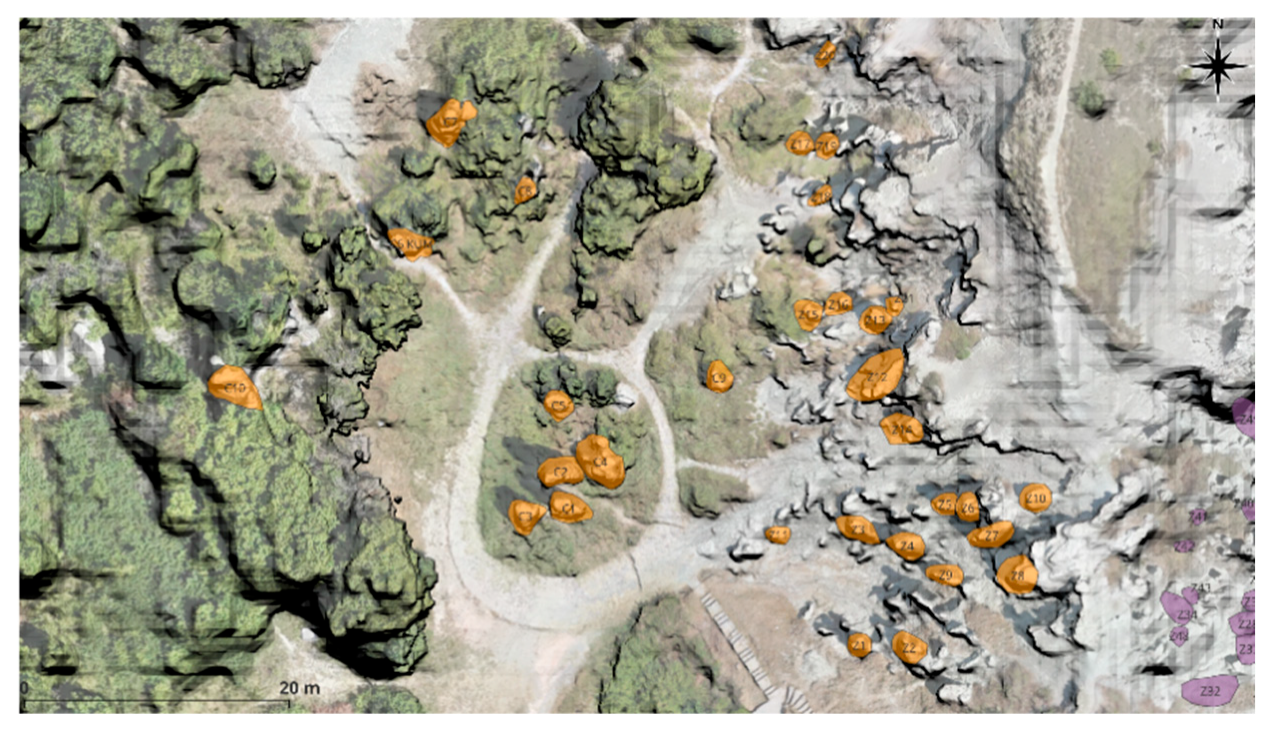
Figure 6.
Inventory of the remarkable earth pyramids in Kuklica. Morphometry is calculated from 0.1 m UAV-based DEM.
Figure 6.
Inventory of the remarkable earth pyramids in Kuklica. Morphometry is calculated from 0.1 m UAV-based DEM.
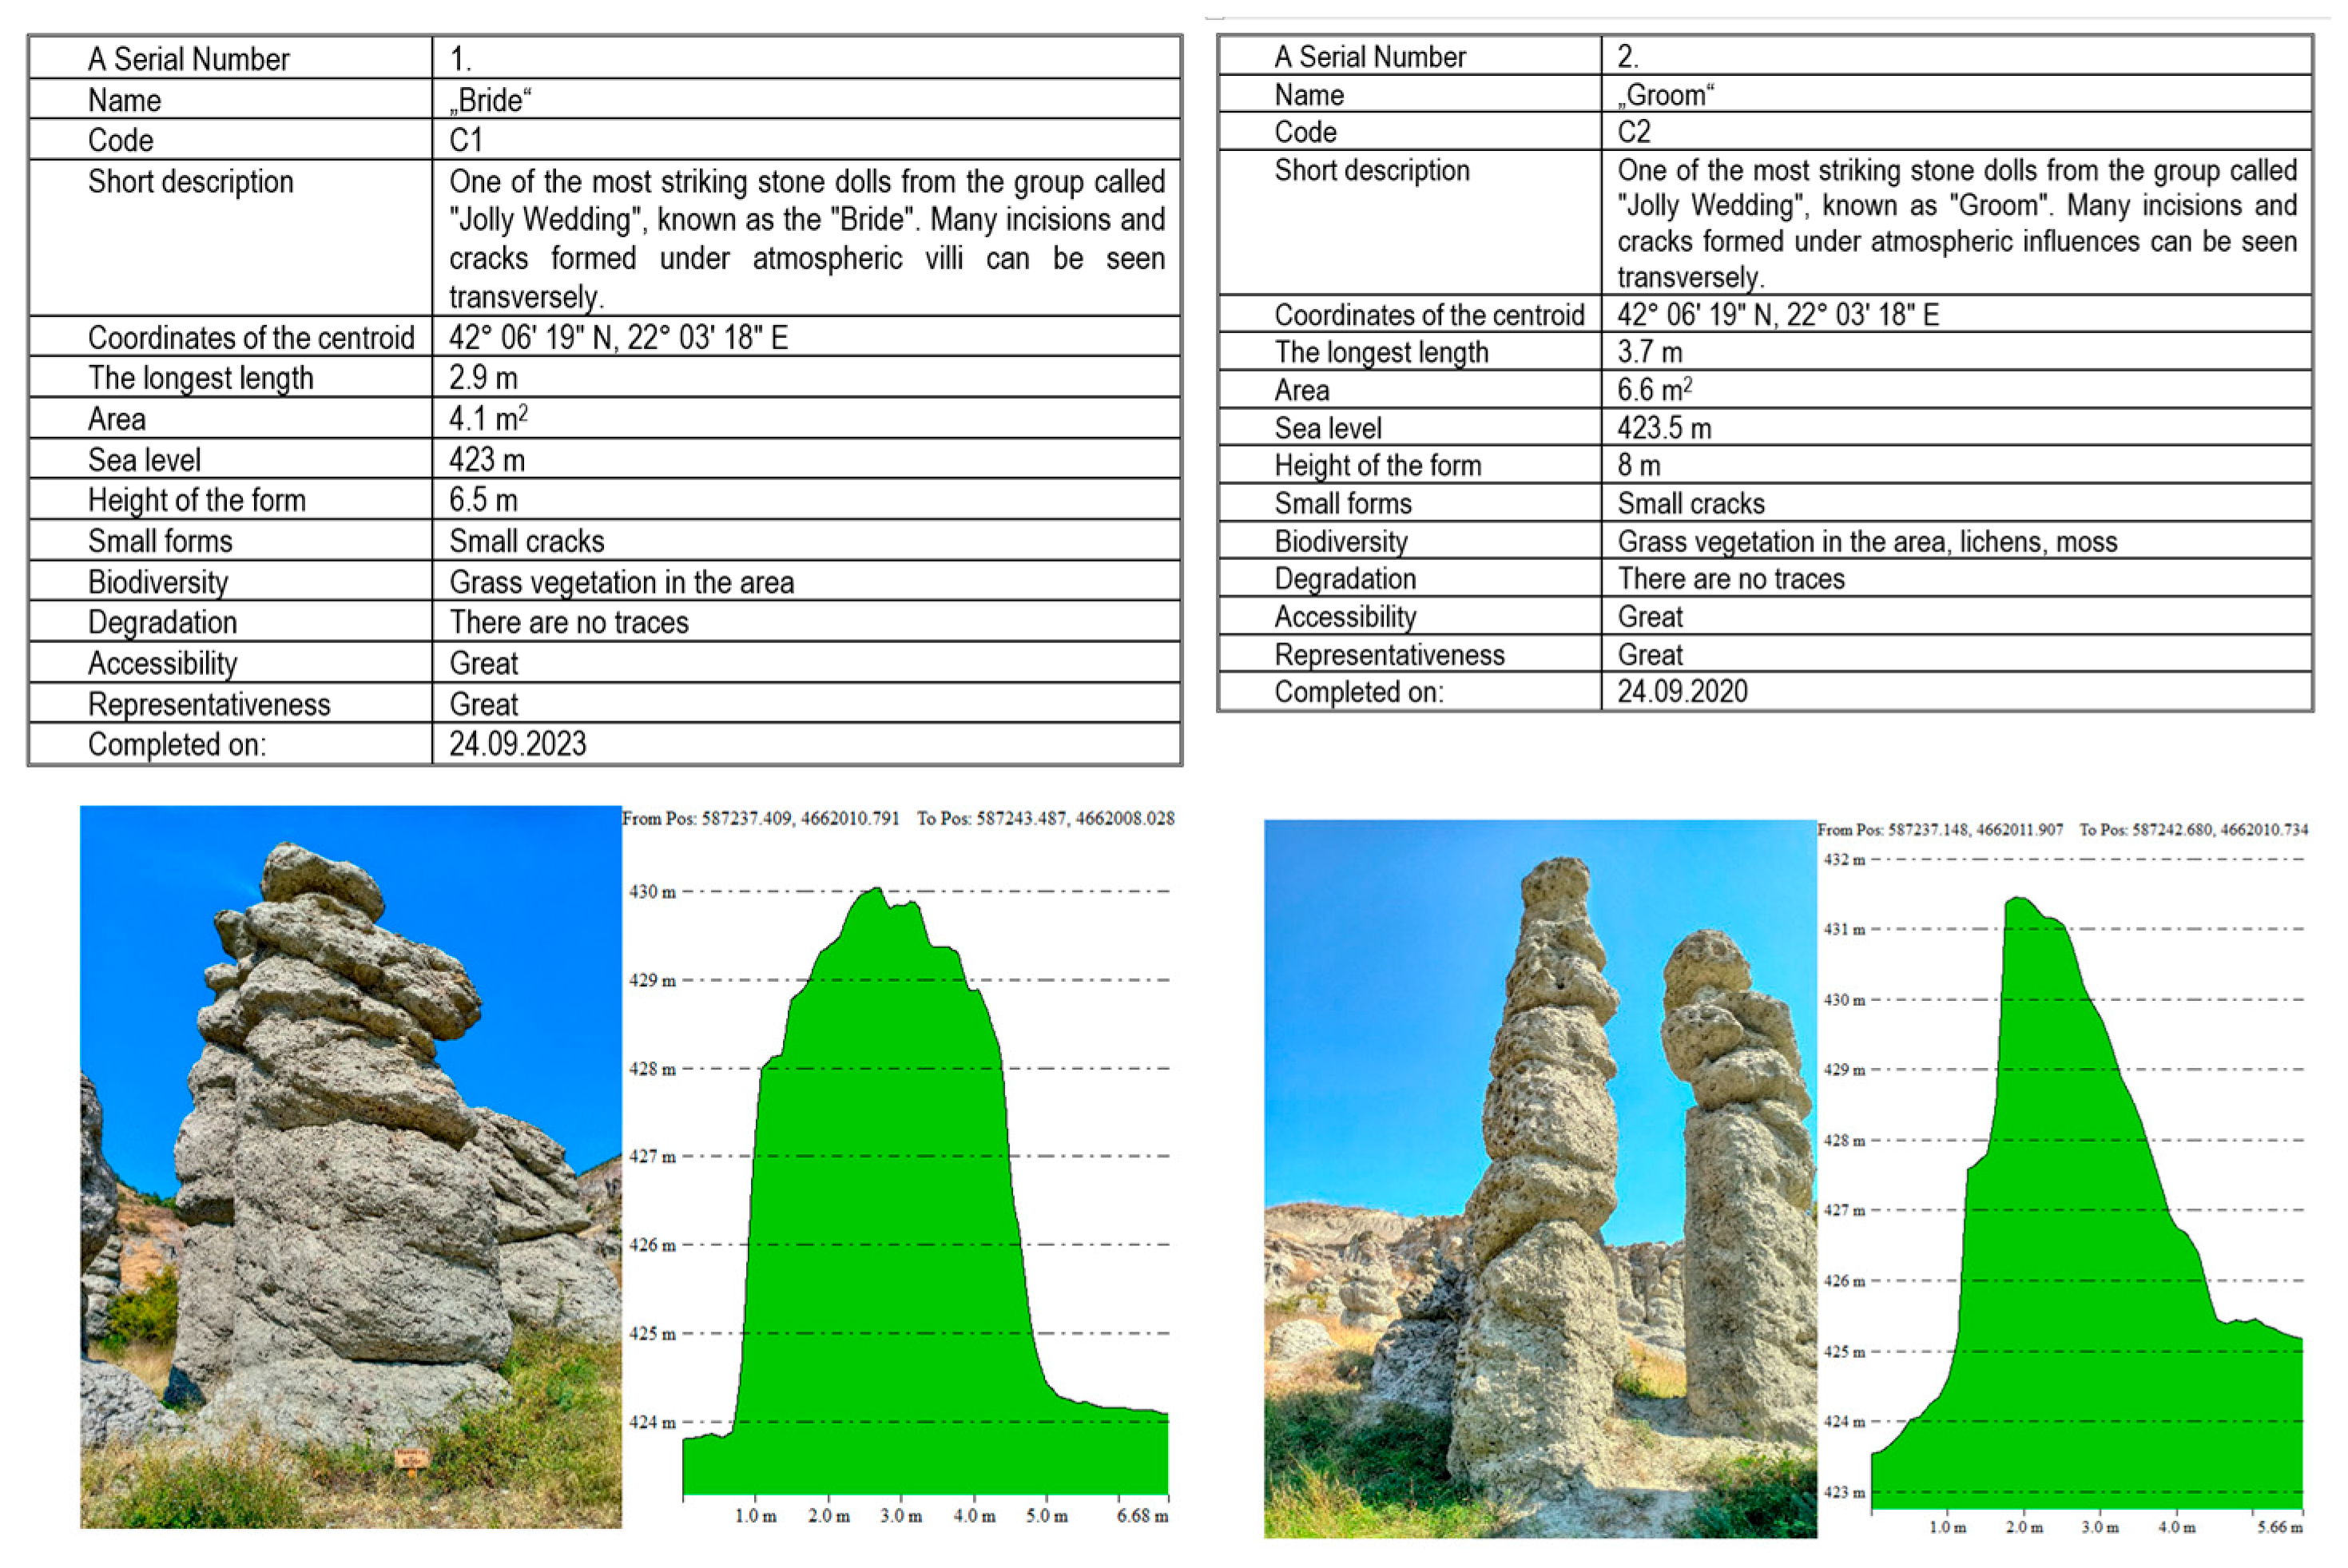
Figure 7.
Erosion susceptibility map (A) and mean annual erosion rate (B) of the Kuklica’s catchment area and corresponding maps of the NM Kuklica (C, D).
Figure 7.
Erosion susceptibility map (A) and mean annual erosion rate (B) of the Kuklica’s catchment area and corresponding maps of the NM Kuklica (C, D).
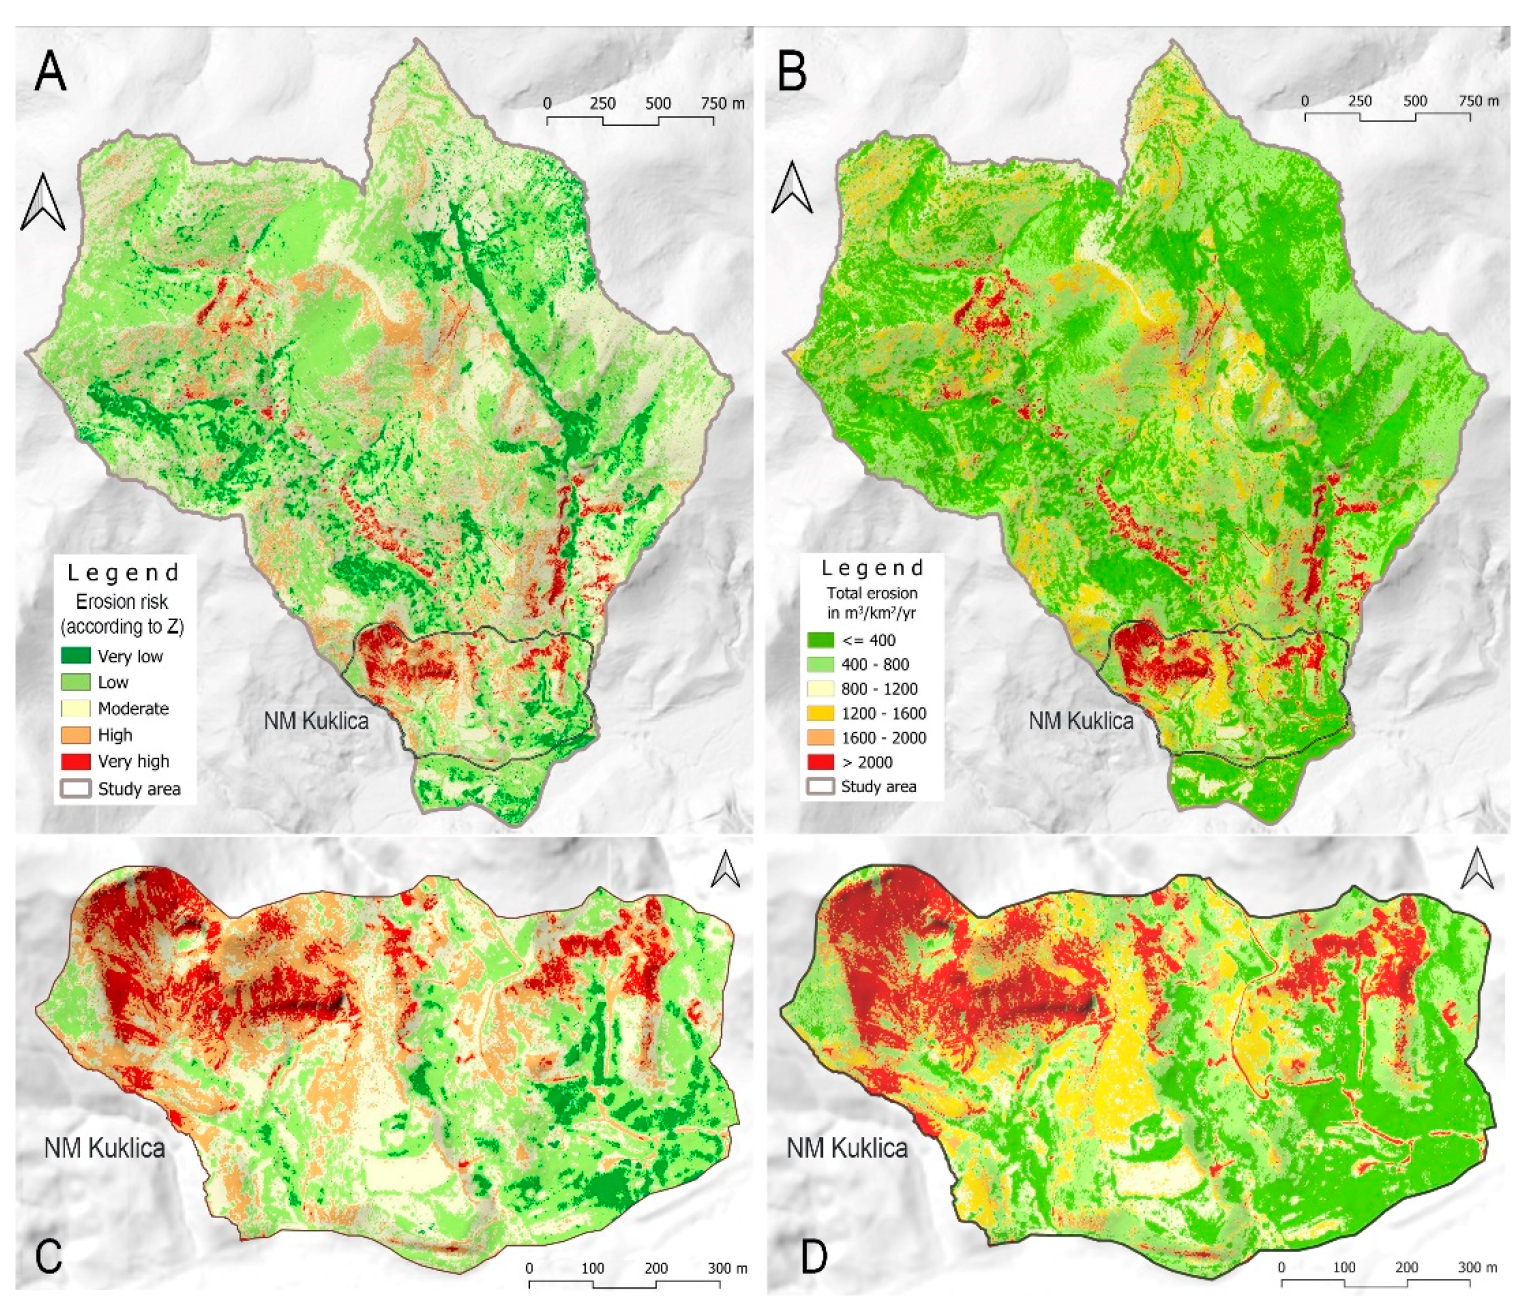
Figure 8.
Flash Flood Potential Index in the Kuklica catchments (A, B) and NM Kuklica (C).
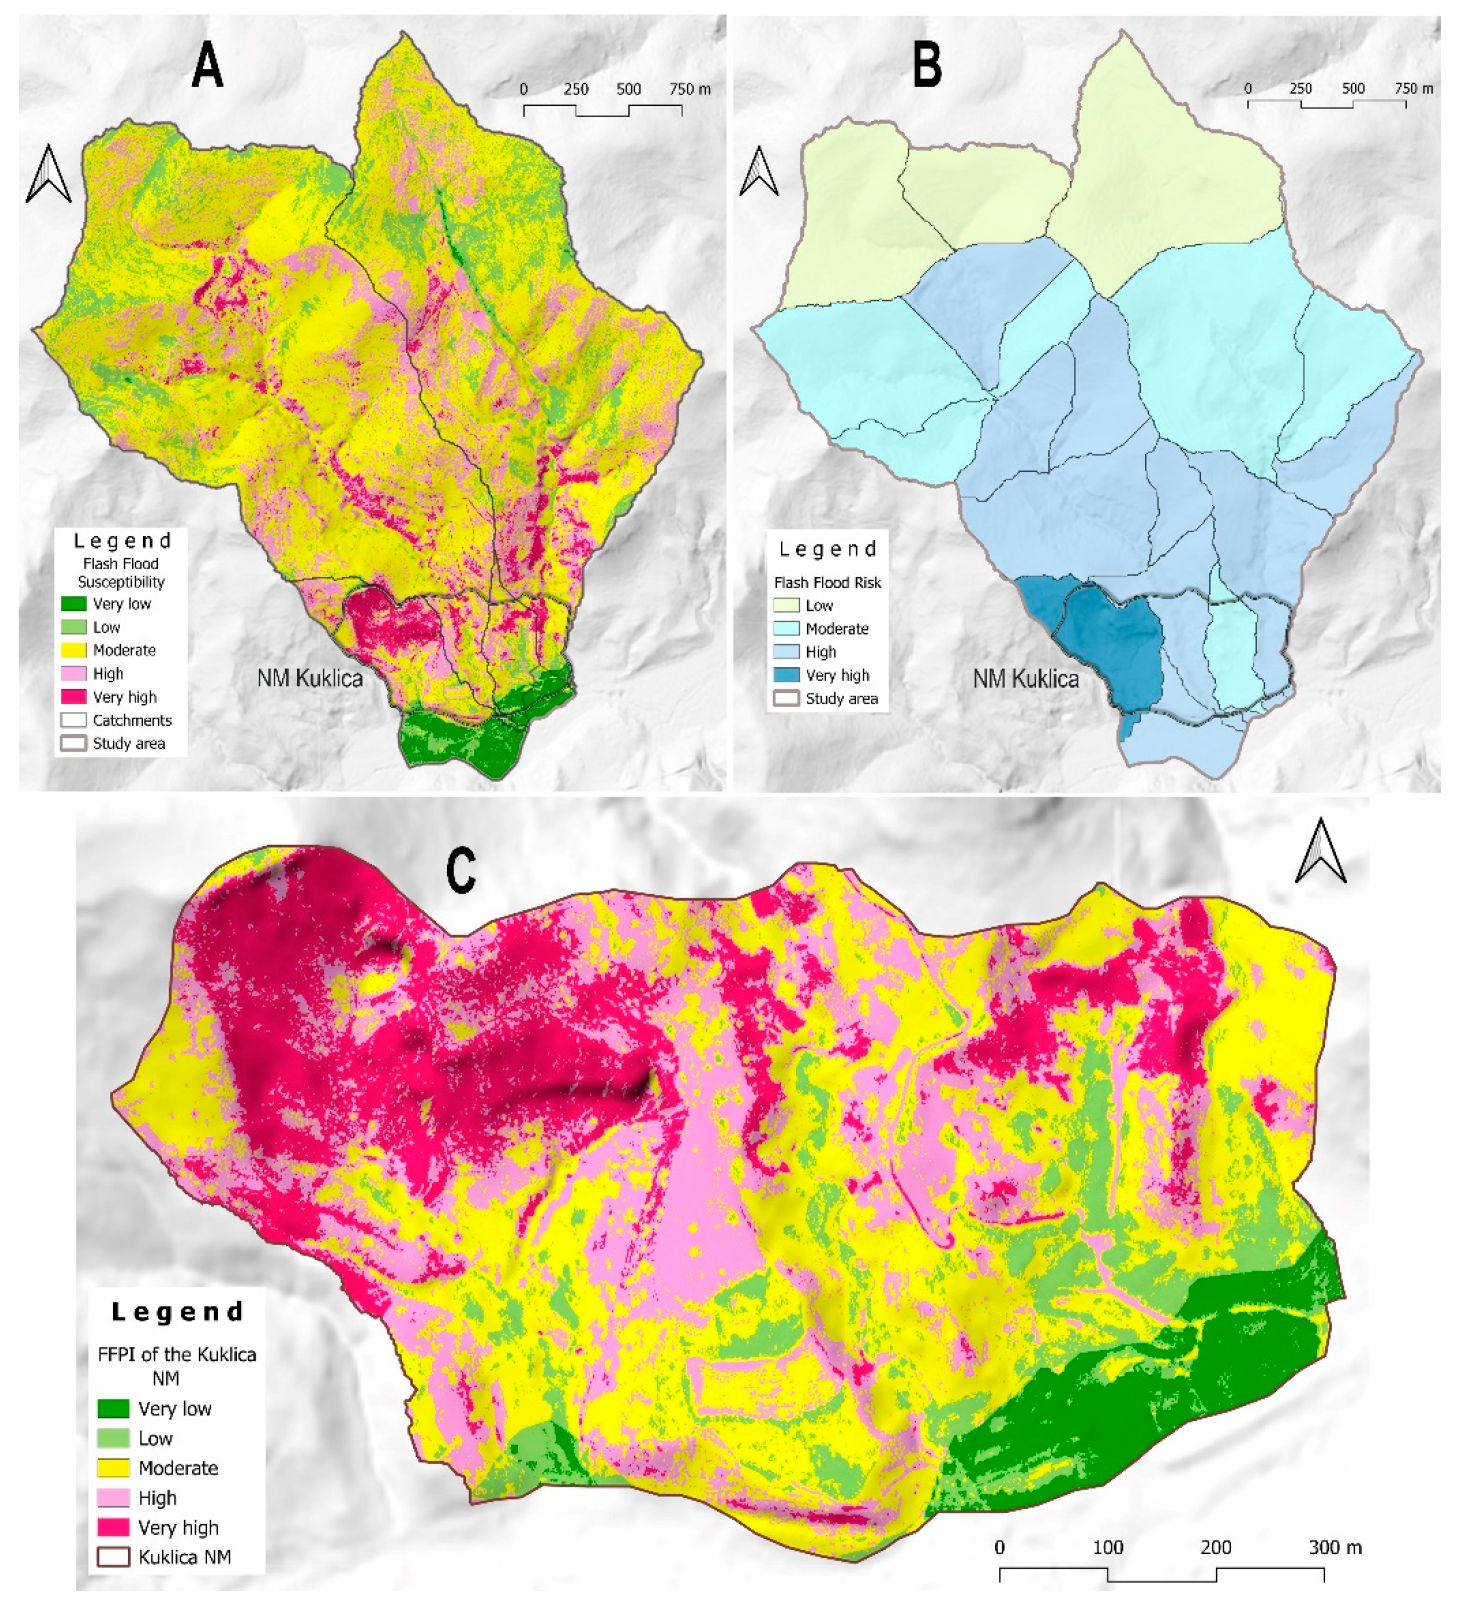

Table 1.
Soil and Rock Erodibility Values (Y) for the Kuklica area.
| Type | Value |
|---|---|
| Compact volcanic rocks | 0.20 |
| Alluvial deposits | 0.50 |
| Vertisol, regosol and leptosol | 0.95 |
| Regosol | 1.20 |
| Tuffs | 1.60 |
| Clastic sediments | 2.00 |
Table 2.
Land Cover Coefficient Values (Xa) for the Kuklica area.
| Type | Value |
|---|---|
| Broad-leaved forest | 0.20 |
| Transitional woodland-shrub | 0.40 |
| Moors and heathland | 0.50 |
| Pastures | 0.50 |
| Land principally occupied by agriculture | 0.55 |
| Non-irrigated arable land | 0.80 |
| Sparsely vegetated areas | 0.90 |
| Bare rocks | 1.00 |
Table 3.
Erosion susceptibility zones according to the coefficient Z for the Kuklica catchments and the NM.
Table 3.
Erosion susceptibility zones according to the coefficient Z for the Kuklica catchments and the NM.
| Class | Z-value | Wid. area % | NM area % |
|---|---|---|---|
| Very high | >1.0 | 4.0 | 17.9 |
| High | 0.7-1.0 | 15.5 | 25.9 |
| Moderate | 0.4-0.7 | 29.6 | 22.0 |
| Low | 0.2-0.4 | 42.4 | 28.9 |
| Very low | 0-0.2 | 8.5 | 5.2 |
Table 4.
The erosion rate according to EPM for the Kuklica catchments and the NM area.
| Class | Value | Area % | Area % |
|---|---|---|---|
| Very low | 0-400 | 36.9 | 24.6 |
| Low | 400-800 | 36.6 | 24.9 |
| Moderate | 800-1200 | 9.3 | 10.9 |
| High | 1200-1600 | 10.6 | 15.8 |
| Very high | 1600-2000 | 3.1 | 8.3 |
Table 5.
Flash flood vulnerability classes area for the Kuklica catchments and NM.
| Class | Value | Wider area % | NM area % |
|---|---|---|---|
| Very low | 0-3.0 | 2.0 | 4.9 |
| Low | 3-4.5 | 5.9 | 5.8 |
| Moderate | 4.5-6.0 | 52.1 | 29.7 |
| High | 6.0-7.5 | 35.6 | 40.2 |
| Very high | >7.5 | 4.4 | 19.4 |
Table 6.
The Ru value and sediment deposition rate according to EPM.
| Catchment | Perimet. (km) | Elev.diff (km) | Length (km) | W (m3/km2/y) | Ru | Gsp (m3/km2/y) |
G (m3/y) |
| West | 11.04 | 0.26 | 3.70 | 654.3 | 0.49 | 320.6 | 748.9 |
| East | 12.48 | 0.25 | 4.50 | 626.9 | 0.49 | 307.2 | 935.7 |
| J.Wedding | 2.58 | 0.03 | 0.84 | 799.5 | 0.11 | 87.9 | 11.2 |
| Zabel | 1.91 | 0.03 | 0.10 | 765.0 | 0.09 | 68.8 | 4.6 |
| West | 3.15 | 0.08 | 0.95 | 1403.6 | 0.19 | 266.7 | 69.6 |
| Total |
Disclaimer/Publisher’s Note: The statements, opinions and data contained in all publications are solely those of the individual author(s) and contributor(s) and not of MDPI and/or the editor(s). MDPI and/or the editor(s) disclaim responsibility for any injury to people or property resulting from any ideas, methods, instructions or products referred to in the content. |
© 2024 by the authors. Licensee MDPI, Basel, Switzerland. This article is an open access article distributed under the terms and conditions of the Creative Commons Attribution (CC BY) license (http://creativecommons.org/licenses/by/4.0/).
Copyright: This open access article is published under a Creative Commons CC BY 4.0 license, which permit the free download, distribution, and reuse, provided that the author and preprint are cited in any reuse.


