
Submitted:
15 August 2024
Posted:
16 August 2024
You are already at the latest version
Abstract
Traditional terrain analysis has relied on Digital Topographic Maps produced by national agencies and Digital Elevation Model (DEM) created using Airborne LiDAR. However, these methods have significant drawbacks, including the difficulty in acquiring data at the desired time and precision, as well as high costs. Recently, advancements and miniaturization in LiDAR technology have enabled its integration with Unmanned Aerial Vehicle (UAV), allowing for the collection of highly precise terrain data. This approach combines the advantages of conventional UAV photogrammetry with the flexibility of obtaining data at specific times and locations, facilitating a wider range of studies. Despite these advancements, the application of UAV LiDAR in terrain analysis remains underexplored. This study aims to assess the utility of UAV LiDAR for terrain analysis by focusing on the doline features within karst landscapes. In this study, we analyzed doline terrain using three types of data: 1:5000 scale digital topographic maps provided by the National Geographic Information Institute (NGII) of Korea, Digital Surface Models (DSM) obtained through UAV photogrammetry, and DEM) acquired via UAV LiDAR surveys. The analysis results indicated that UAV LiDAR provided the most precise three-dimensional spatial information for the entire study site, yielding the most detailed analysis outcomes. These findings suggest that UAV LiDAR can be utilized to represent terrain features with greater precision in the future which is expected to be highly useful not only for generating contours but also for conducting more detailed topographic analyses, such as calculating area and slope of the study sites.
Keywords:
UAV
; LiDAR
; doline
; DEM
1. Introduction
In traditional terrain analysis within South Korea, the 1:5,000 scale digital topographic maps produced by the National Geographic Information Institute (NGII) or publicly available DEM have been primarily utilized. Recently, there has been a surge in research applying UAV for terrain analysis in small areas, leveraging their advantages of faster and more accurate acquisition of location data compared to manned aircraft[1,2,3,4]. UAV surveys generally achieve location data accuracy within ±5cm, meeting the positional accuracy requirements for detailed terrain surveys as stipulated by relevant legalities. Alongside the diverse applications of UAV surveys, LiDAR technology has been gaining attention in the field of spatial information[5,6,7,8]. LiDAR works by emitting numerous laser pulses, measuring the time and intensity of their reflections off targets to obtain three-dimensional positional information. While traditional aerial LiDAR systems have been widely used, recent advancements have enabled the integration of LiDAR equipment with UAV. UAV LiDAR combines the advantages of UAV photogrammetry with the ability to acquire precise elevation data, promising high accuracy and efficiency in terrain analysis[9].
Karst landscapes, known as dolines or sinkholes, are formed through the erosion and deformation of karst and non-karst layers. Dolines have high moisture content and excellent drainage, making them suitable for agricultural land use and providing habitats for wildlife and diverse vegetation. Some doline areas are designated as nature reserves or geological parks for conservation. In South Korea, dolines are found in regions where limestone is prevalent, such as the Sobaek Mountain Range and near the coastline of Samcheok in Gangwon Province. Korean dolines are typically small and shallow, with circular or elliptical shapes. Occasionally, their bottoms are flat and retain water.
LiDAR is highly effective for studying dolines, particularly for identifying small depressions in karst landscapes[10,11]. A study in Slovenia[12] analyzed the characteristics and distribution of dolines across a wide area using LiDAR. In a GIS-based study, researchers detected dolines by mapping multi-layer depth values and classifying depth intervals using DEM, conducting high-precision analyses on the Yucatan Peninsula in Mexico[13]. This study proposed methods for detecting dolines considering sensitivity and precision based on terrain conditions. UAV-based LiDAR is rapidly being applied to terrain research due to its ability to provide high-resolution LiDAR data for various studies. One study[14] explored the differences in altitude measurements using various LiDAR sensors for Digital Terrain Model (DTM) and terrain texture analysis. Another study[15] proposed using UAV LiDAR to analyze road geometry. Additionally, the Terrain-Net project demonstrated the effective filtering of ground surfaces in forest environments using LiDAR data and deep learning techniques[16].
For accurate mapping of doline terrain, there have been studies focusing on automated detection and mapping of sinkholes using high-resolution maps and digital data[17,18]. These approaches demand detailed and precise terrain data for effective analysis of dolines using digital spatial data. UAV offer a cost-effective solution and a new approach to terrain analysis using high-resolution RGB imagery[19,20,21]. Furthermore, UAV-LiDAR enables the creation of high-accuracy DEM with the added advantage of low operational costs and the ability to collect data at desired times. However, research utilizing UAV LiDAR for detailed terrain feature analysis, such as dolines, remains limited. Therefore, this study aims to evaluate the utility of UAV LiDAR data in terrain feature analysis by acquiring, processing, and analyzing such data.
2. Materials and Methods
2.1. Study Site
Danyang(Figure 1), located in South Korea, is geographically bordered by the Baekdudaegan mountain range to the east and south, with the Namhan River running through its center. The northern region of Danyang is characterized by limestone formations, creating a karst landscape with features such as karren, dolines, and numerous lime caves. In karst landscapes, limestone dissolution by groundwater leads to the development of lime caves, while surface dissolution by rainwater results in the formation of dolines. Danyang's geological structures, including faults and folds, add significant geological value to the area.
2.2. LiDAR Point Cloud Acquisituin Strategy
The accuracy of LiDAR surveys depends not only on the payload's return mode and scanning mode settings but also on factors such as the UAV's flight direction, flight speed, and the characteristics of the terrain. A thorough preliminary review is necessary. Based on an assessment of the terrain elevation in the study site using Google Earth, which revealed an elevation difference of approximately 50 to 70 meters(Figure 2), it was classified as a hilly area. Consequently, the flight parameters were set as follows: an altitude of 100 meters, a flight speed of 7.5 m/s, a side overlap of 50%, and a camera angle of –90°.
The return mode was set to penta returns mode. In this mode, the first return provides height information, intermediate returns capture the structure of objects, and the last return provides ground information. Penta returns mode is suitable for areas with dense vegetation due to its stronger laser pulse penetration. The point cloud rate, also known as the sampling rate or pulse frequency, indicates the maximum number of laser beams emitted per unit time. Higher frequencies result in more measurement points and higher accuracy under the same conditions. The field of view (FOV), also known as the scan angle, represents the angle of the laser beams during scanning. In the repeat scanning mode, the FOV is 70°×30°. This mode, although having a narrower scan range, offers higher accuracy and is recommended for high-precision mapping. Table 1 shows the setting of LiDar payload parameters.
2.3. Research Matrials
The data used in this study includes the most recent 1:5,000 scale digital topographic map produced in 2023, obtained from the National Geographic Information Institute of Korea. Additionally, LiDAR data and optical images necessary for the research were acquired directly through UAV (Unmanned Aerial Vehicle) imaging. Figure 3 illustrates the flow of the study.
2.4. Aerial Photography Equipment
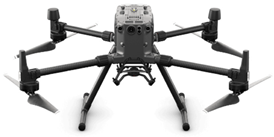
The UAV-based mobile mapping system used in this study is the DJI Matrice 300 RTK with the Zenmuse L2 LiDAR sensor, capable of collecting both LiDAR and imagery data. Table 2 presents a Uav based mobile mapping system.
2.5. Flight Plan
The flight area for the study site was defined, and parameters such as flight altitude, duration, and coverage area were verified(Figure 4). During aerial photography in the flight area, Real Time Kinematic (RTK) surveying was conducted without using Ground Control Points (GCPs). The RTK positioning accuracy of the Matrice 300 is 1 cm + 1 ppm horizontally and 1.5 cm + 1 ppm vertically. The Virtual Reference System (VRS) creates a virtual reference point through network modeling, simulating observations from an arbitrary nearby reference station, and determines precise mobile station positions using RTK with this virtual reference point. RTK-based unmanned aerial photography involves the UAV's GNSS receiver connected via WiFi or unmanned mobile communication networks to a base station or VRS, transmitting calibration data for real-time determination of the UAV's position and attitude using relative positioning techniques.
When connecting the UAV to the Network RTK service provided by the National Geographic Information Institute (NGII) of South Korea, the RTK signal continuously outputs a fixed solution throughout the flight. The station file is automatically saved to the Zenmuse L2's result file. Horizontal datum settings were configured as EPSG:5187, Korea 2000 / East Belt 2010, and the Geoid settings were set to the Korean National Geoid Model (KNGeoid 18).
2.6. Digital Elevation Model Data Processing
In conventional airborne laser scanning, the pixel size of DEM grids is typically 0.5m, and the point density criterion is set at over 50 points per square meter. Horizontal position accuracy is maintained at flight altitude divided by 1,000, while vertical position accuracy ensures a maximum error within 75cm and RMSE within 50cm. The density of the point cloud obtained in this study is 197/㎡, DEM was created from ground data obtained via UAV LiDAR, classified into ground and non-ground points. The pixel size of the DEM was set to 0.25m. Table 3 shows the flighe configuration for LiDAR canning and Figure 5 shows DEM acquired with UAV LiDAR.
2.7. Orthophoto and Digital Surface model Data Processing
Orthophoto and Digital Surface Model (DSM) were generated automatically using UAV aerial photographs and Exterior Orientation (EO) parameters in software. Table 4 shows the flight configuration for photogrammery and Figure 6 is the results of image based mapping.
The pixel size of the DEM, created from LiDAR point cloud data, is 0.25m. For the DEM based on contour data from the 1:5,000 scale digital topographic map with a contour interval of 5m, the grid spacing was set to 5m. Figure 7 shows the three types of data processing results.
3. Results
3.1. Elevation Profile Analysis
We conducted a comparative analysis of the accuracy of three datasets: LiDAR-based DEM, Image-based DSM, and DEM based on digital topographic maps, using elevation profiles derived from the processed data. Firstly, we selected four regions for analysis, including areas with sinkholes and some vegetation cover(Figure 8). To enhance the three-dimensional visual effect and depict changes in shading, we created Shaded Relief Maps (SRMs) based on elevation raster data.
Using the SRMs as reference, we designated cross-section lines passing through sinkholes and vegetation areas in each experimental region(Figure 9). We compared elevation profiles accordingly(Figure 10). In regions A, B, and D, both LiDAR-based DEM and Image-based DSM clearly depicted altitude changes at sinkholes, exhibiting generally similar elevation profile shapes. Upon closer inspection, the elevation profiles from the Image-based DSM appeared slightly more rugged. The DEM based on digital topographic maps did not detect all sinkholes across the entire area and showed gentle elevation profile shapes without significant altitude changes. Examining the elevation profile of region C, the Image-based DSM displayed a dip in the elevation profile, suggesting detection of sinkholes. This dip is attributed to interference from vegetation, resulting in pixels with elevation values of zero, as indicated by the black areas in the SRMs.
3.2. Doline Detection Comparison
For detecting doline depressions, previous methods have utilized elevation differences in DEM[22], while recent studies have explored deep learning approaches[23]. In this study, we employed a Python package proposed by[24] for depression detection. Figure 11 below presents a comparative illustration of doline detection results. Black indicates detections specifically classified as doline outlines, while gray represents detections of general depressions. In comparing doline detection between LiDAR-based DEM and Image-based DSM, the overall positions and shapes of dolines in the study site were similar. However, in some locations, the LiDAR-based DEM identified a single doline where the Image-based DSM detected two separate dolines, or instances where discrepancies occurred with some dolines being missed or additional ones being identified between the datasets.
Upon executing the doline extraction algorithm on the Image-based DSM, a total of 21 depressions were identified. Conversely, the LiDAR-based DEM yielded 13 depressions, while the DEM obtained from digital topographic maps did not extract any. The exploration program allows adjustment of cell size and depth settings; for this study, a depth value of 1 meter and a pixel value of 1,000 were set to detect depressions. Comparing the results between Image-based DSM and LiDAR-based DEM, the Image-based DSM detected 9 out of 21 depressions that were not dolines, while the LiDAR-based DEM had 3 erroneous detections out of 13. The Image-based DSM detected relatively more depressions overall, but it also exhibited a higher error rate in doline detection compared to the LiDAR-based DEM. This outcome suggests that the errors in the Image-based DSM results were primarily due to the detection of depressions caused by vegetation interference.
4. Discussion
This study demonstrated the strengths of UAV LiDAR systems in analyzing the morphology of doline terrain compared to traditional research methods. The research focused on comparing the quality of terrain data produced by UAV LiDAR, photogrammetry technology, and digital topographic maps. Through a case study analyzing the morphology of doline terrain in Danyang, Chungbuk, where limestone formations are prominent in South Korea, the strengths and limitations of UAV LiDAR were evaluated as follows.
Firstly, the evaluation concerns data quality. Initially, the 1:5000 scale digital topographic map produced DEM that provided the coarsest level of terrain detail. Next, point clouds extracted using photogrammetry primarily covered the surface, with lower point density observed in densely vegetated areas. This aligns with previous research indicating that image-based methods yield relatively poorer results in regions with low texture. In the case of Danyang, LiDAR point clouds covered larger areas and offered higher point density compared to image-based point clouds. LiDAR point cloud data could capture points beneath vegetation, enabling more accurate DEM in complex terrains. Analysis of cross-section lines passing through sinkholes and vegetation areas revealed subtle differences in quality among the three datasets.
Secondly, the evaluation focuses on quantitative analysis of doline terrain. Using a doline extraction program, the DEM created from the 1:5000 scale digital topographic map detected zero dolines. In contrast, using image-based DSM, a total of 21 dolines were extracted, while LiDAR-based DEM identified 13 dolines under the same conditions. In the case of image-based DSM, more dolines were erroneously identified due to depressions caused by vegetation interference being mistaken for dolines. The DEM generated using LiDAR provided detailed data sufficient to identify sinkholes within dolines.
Thirdly, the advantage of UAV LiDAR technology is highlighted. Point cloud data acquired through LiDAR boasts exceptionally high spatial resolution. UAV offer the advantage of acquiring accurate surface data even in challenging terrains like mountainous regions and densely vegetated areas. Compared to satellite or airborne LiDAR data, UAV LiDAR provides higher resolution and is less affected by cloud cover during data collection. Additionally, UAV equipped with optical cameras can capture high-resolution aerial RGB images, which are more cost-effective and easier to process compared to using LiDAR sensors alone. Photogrammetry technology excels in general terrain surveys but has limitations in surface analysis due to variations in vegetation type and density. While LiDAR sensors can be mounted on aircraft, the associated costs and maintenance as well as the need to plan data collection around weather conditions pose significant barriers to widespread use. In contrast, UAV LiDAR systems are more cost-effective, accessible, and easier to plan for data acquisition
5. Conclusions
This study demonstrated the advantages of using UAV LiDAR systems for the analysis and detection of doline landforms. It compared UAV LiDAR-based DEM, image-based DSM, and digital topographic map-based DEM in terms of quality, accuracy, and spatial coverage. Each method's strengths and weaknesses were evaluated, highlighting the effectiveness of UAV LiDAR in such geomorphic environments.
UAV LiDAR captures high-resolution data, offering high point density and broader spatial coverage, enabling the generation of more reliable DEM in complex terrain environments. This was confirmed through the case study of doline landforms in Danyang. First, UAV LiDAR can capture ground points beneath vegetation, providing accurate terrain data even in densely vegetated areas. Second, image-based DSM primarily covers the surface, with lower point density in areas of low texture. Third, using a doline detection program, we identified quantitative differences in elevation data produced by the three methods. This underscores the importance of UAV LiDAR for small-scale terrain analysis, such as that of dolines in Korea.
Future research should more broadly investigate the applicability of UAV LiDAR and image-based technologies across diverse terrain environments. It is necessary to explore methods for integrating UAV LiDAR with image-based technologies to create more precise and comprehensive terrain models. This approach can enhance the accuracy and efficiency of analyzing detailed landforms, such as dolines. Finally, developing automated data processing and analysis methods is crucial to improving the efficiency of detecting specialized landforms like dolines.
The findings of this research indicate that UAV LiDAR and image-based technologies are critical tools for analyzing and monitoring doline landforms. By assessing their strengths and limitations in diverse terrain environments, this study has highlighted their potential. Future research should focus on advancing and integrating these technologies to enhance the accuracy and efficiency of detailed landform analyses, including dolines.
References
- Bi, R.; Gan, S.; Yuan, X.; Li, R.; Gao, S.; Yang, M.; Luo, W.; Hu, L. Multi-View Analysis of High-Resolution Geomorphic Features in Complex Mountains Based on UAV–LiDAR and SfM–MVS: A Case Study of the Northern Pit Rim Structure of the Mountains of Lufeng, China. Appl. Sci. 2023, 13, 738. [Google Scholar] [CrossRef]
- Lin, Y.-C.; Cheng, Y.-T.; Zhou, T.; Ravi, R.; Hasheminasab, S.M.; Flatt, J.E.; Troy, C.; Habib, A. Evaluation of UAV LiDAR for Mapping Coastal Environments. Remote Sens. 2019, 11, 2893. [Google Scholar] [CrossRef]
- Borrelli, L.; Conforti, M.; Mercuri, M. Lidar and UAV System Data to Analyse Recent Morphological Changes of a Small Drainage Basin. ISPRS Int. J. Geo-Inf. 2019, 8, 536. [Google Scholar] [CrossRef]
- Šafář, V.; Pot\uučková, M.; Karas, J.; Tlustỳ, J.; Štefanová, E.; Jančovič, M.; Cígler Žofková, D. The Use of UAV in Cadastral Mapping of the Czech Republic. ISPRS Int. J. Geo-Inf. 2021, 10, 380. [Google Scholar] [CrossRef]
- Kadhim, I.; Abed, F.M. The Potential of LiDAR and UAV-Photogrammetric Data Analysis to Interpret Archaeological Sites: A Case Study of Chun Castle in South-West England. ISPRS Int. J. Geo-Inf. 2021, 10, 41. [Google Scholar]
- Kovanič, L.; Topitzer, B.; Pet’ovskỳ, P.; Blišt’an, P.; Gergel’ová, M.B.; Blišt’anová, M. Review of Photogrammetric and Lidar Applications of UAV. Appl. Sci. 2023, 13, 6732. [Google Scholar] [CrossRef]
- Ortiz-Villarejo, A.J.; Gutiérrez Soler, L.-M. A Low-Cost, Easy-Way Workflow for Multi-Scale Archaeological Features Detection Combining Lidar and Aerial Orthophotography. Remote Sens. 2021, 13, 4270. [Google Scholar] [CrossRef]
- Storch, M.; de Lange, N.; Jarmer, T.; Waske, B. Detecting Historical Terrain Anomalies with UAV-LiDAR Data Using Spline-Approximation and Support Vector Machines. IEEE J. Sel. Top. Appl. Earth Obs. Remote Sens. 2023, 16, 3158–3173. [Google Scholar]
- Salach, A.; Bakuła, K.; Pilarska, M.; Ostrowski, W.; Górski, K.; Kurczyński, Z. Accuracy Assessment of Point Clouds from LiDAR and Dense Image Matching Acquired Using the UAV Platform for DTM Creation. ISPRS Int. J. Geo-Inf. 2018, 7, 342. [Google Scholar] [CrossRef]
- Kobal, M.; Bertoncelj, I.; Pirotti, F.; Dakskobler, I.; Kutnar, L. Using Lidar Data to Analyse Sinkhole Characteristics Relevant for Understory Vegetation under Forest Cover—Case Study of a High Karst Area in the Dinaric Mountains. PloS One 2015, 10, e0122070. [Google Scholar]
- Jeanpert, J.; Genthon, P.; Maurizot, P.; Folio, J.; Vendé-Leclerc, M.; Sérino, J.; Join, J.; Iseppi, M. Morphology and Distribution of Dolines on Ultramafic Rocks from Airborne LiDAR Data: The Case of Southern Grande Terre in New Caledonia (SW Pacific). Earth Surf. Process. Landf. 2016, 41, 1854–1868. [Google Scholar] [CrossRef]
- Mihevc, A.; Mihevc, R. MORPHOLOGICAL CHARACTERISTICS AND DISTRIBUTION OF DOLINES IN SLOVENIA, A STUDY OF A LIDAR-BASED DOLINE MAP OF SLOVENIA. Acta Carsologica 2021, 50. [Google Scholar]
- Moreno-Gómez, M.; Liedl, R.; Stefan, C. A New GIS-Based Model for Karst Dolines Mapping Using LiDAR; Application of a Multidepth Threshold Approach in the Yucatan Karst, Mexico. Remote Sens. 2019, 11, 1147. [Google Scholar] [CrossRef]
- Bartmiński, P.; Siłuch, M.; Kociuba, W. The Effectiveness of a UAV-Based LIDAR Survey to Develop Digital Terrain Models and Topographic Texture Analyses. Sensors 2023, 23, 6415. [Google Scholar] [CrossRef] [PubMed]
- Suleymanoglu, B.; Gurturk, M.; Yilmaz, Y.; Soycan, A.; Soycan, M. Comparison of Unmanned Aerial Vehicle-LiDAR and Image-Based Mobile Mapping System for Assessing Road Geometry Parameters via Digital Terrain Models. Transp. Res. Rec. J. Transp. Res. Board 2023, 2677, 617–632. [Google Scholar] [CrossRef]
- Li, B.; Lu, H.; Wang, H.; Qi, J.; Yang, G.; Pang, Y.; Dong, H.; Lian, Y. Terrain-Net: A Highly-Efficient, Parameter-Free, and Easy-to-Use Deep Neural Network for Ground Filtering of UAV LiDAR Data in Forested Environments. Remote Sens. 2022, 14, 5798. [Google Scholar] [CrossRef]
- Ferreira, C.F.; Hussain, Y.; Uagoda, R. A Semi-Automatic Approach for Doline Mapping in Brazilian Covered Karst: The Way Forward to Vulnerability Assessment. Acta Carsologica 2022, 51, 19–31. [Google Scholar]
- Telbisz, T.; Látos, T.; Deák, M.; Székely, B.; Koma, Z.; Standovár, T. The Advantage of Lidar Digital Terrain Models in Doline Morphometry Compared to Topographic Map Based Datasets–Aggtelek Karst (Hungary) as an Example. Acta Carsologica 2016, 45. [Google Scholar]
- Gao, M.; Yang, F.; Wei, H.; Liu, X. Individual Maize Location and Height Estimation in Field from Uav-Borne Lidar and Rgb Images. Remote Sens. 2022, 14, 2292. [Google Scholar] [CrossRef]
- Conforti, M.; Mercuri, M.; Borrelli, L. Morphological Changes Detection of a Large Earthflow Using Archived Images, Lidar-Derived Dtm, and Uav-Based Remote Sensing. Remote Sens. 2020, 13, 120. [Google Scholar]
- Polat, A.; Keskin, İ.; Polat, Ö. Automatic Detection and Mapping of Dolines Using U-Net Model from Orthophoto Images. ISPRS Int. J. Geo-Inf. 2023, 12, 456. [Google Scholar] [CrossRef]
- Wu, Q.; Lane, C.R.; Wang, L.; Vanderhoof, M.K.; Christensen, J.R.; Liu, H. Efficient Delineation of Nested Depression Hierarchy in Digital Elevation Models for Hydrological Analysis Using Level-Set Method. JAWRA J. Am. Water Resour. Assoc. 2019, 55, 354–368. [Google Scholar] [CrossRef]
- Wang, C.; Morgan, G.R.; Morris, J.T. Drone Lidar Deep Learning for Fine-Scale Bare Earth Surface and 3D Marsh Mapping in Intertidal Estuaries. Sustainability 2023, 15, 15823. [Google Scholar] [CrossRef]
- Wu, Q. Lidar: A Python Package for Delineating Nested Surface Depressions from Digital Elevation Data. J. Open Source Softw. 2021, 6, 2965. [Google Scholar] [CrossRef]
Figure 1.
The study site (aerial photos provided the National Geographic Information Institute of Korea).
Figure 1.
The study site (aerial photos provided the National Geographic Information Institute of Korea).
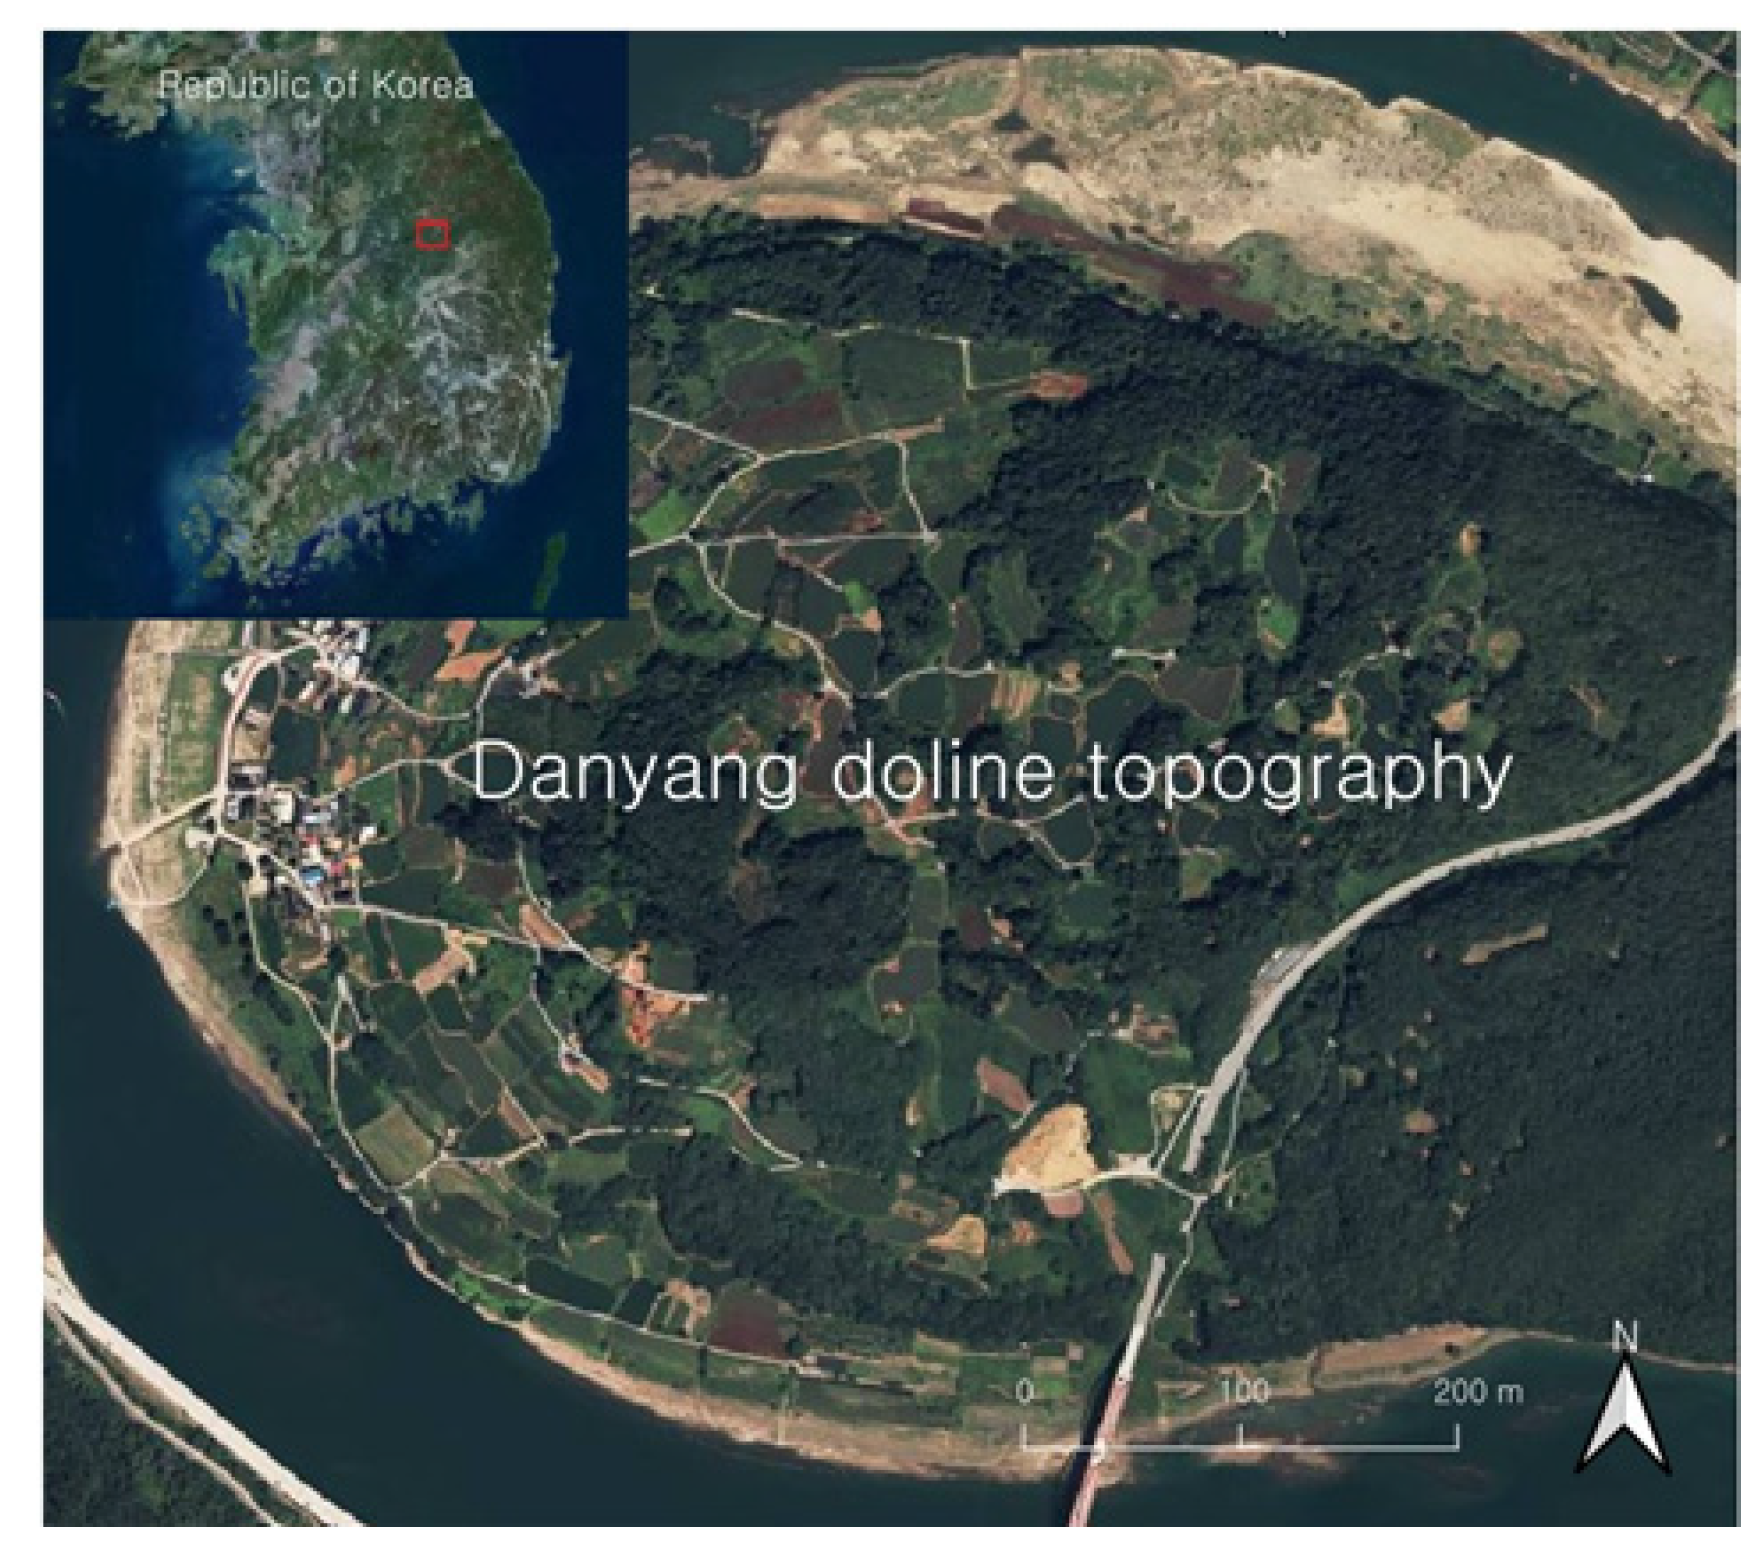
Figure 2.
Elevation profile of the study site confirmed by Google Earth.
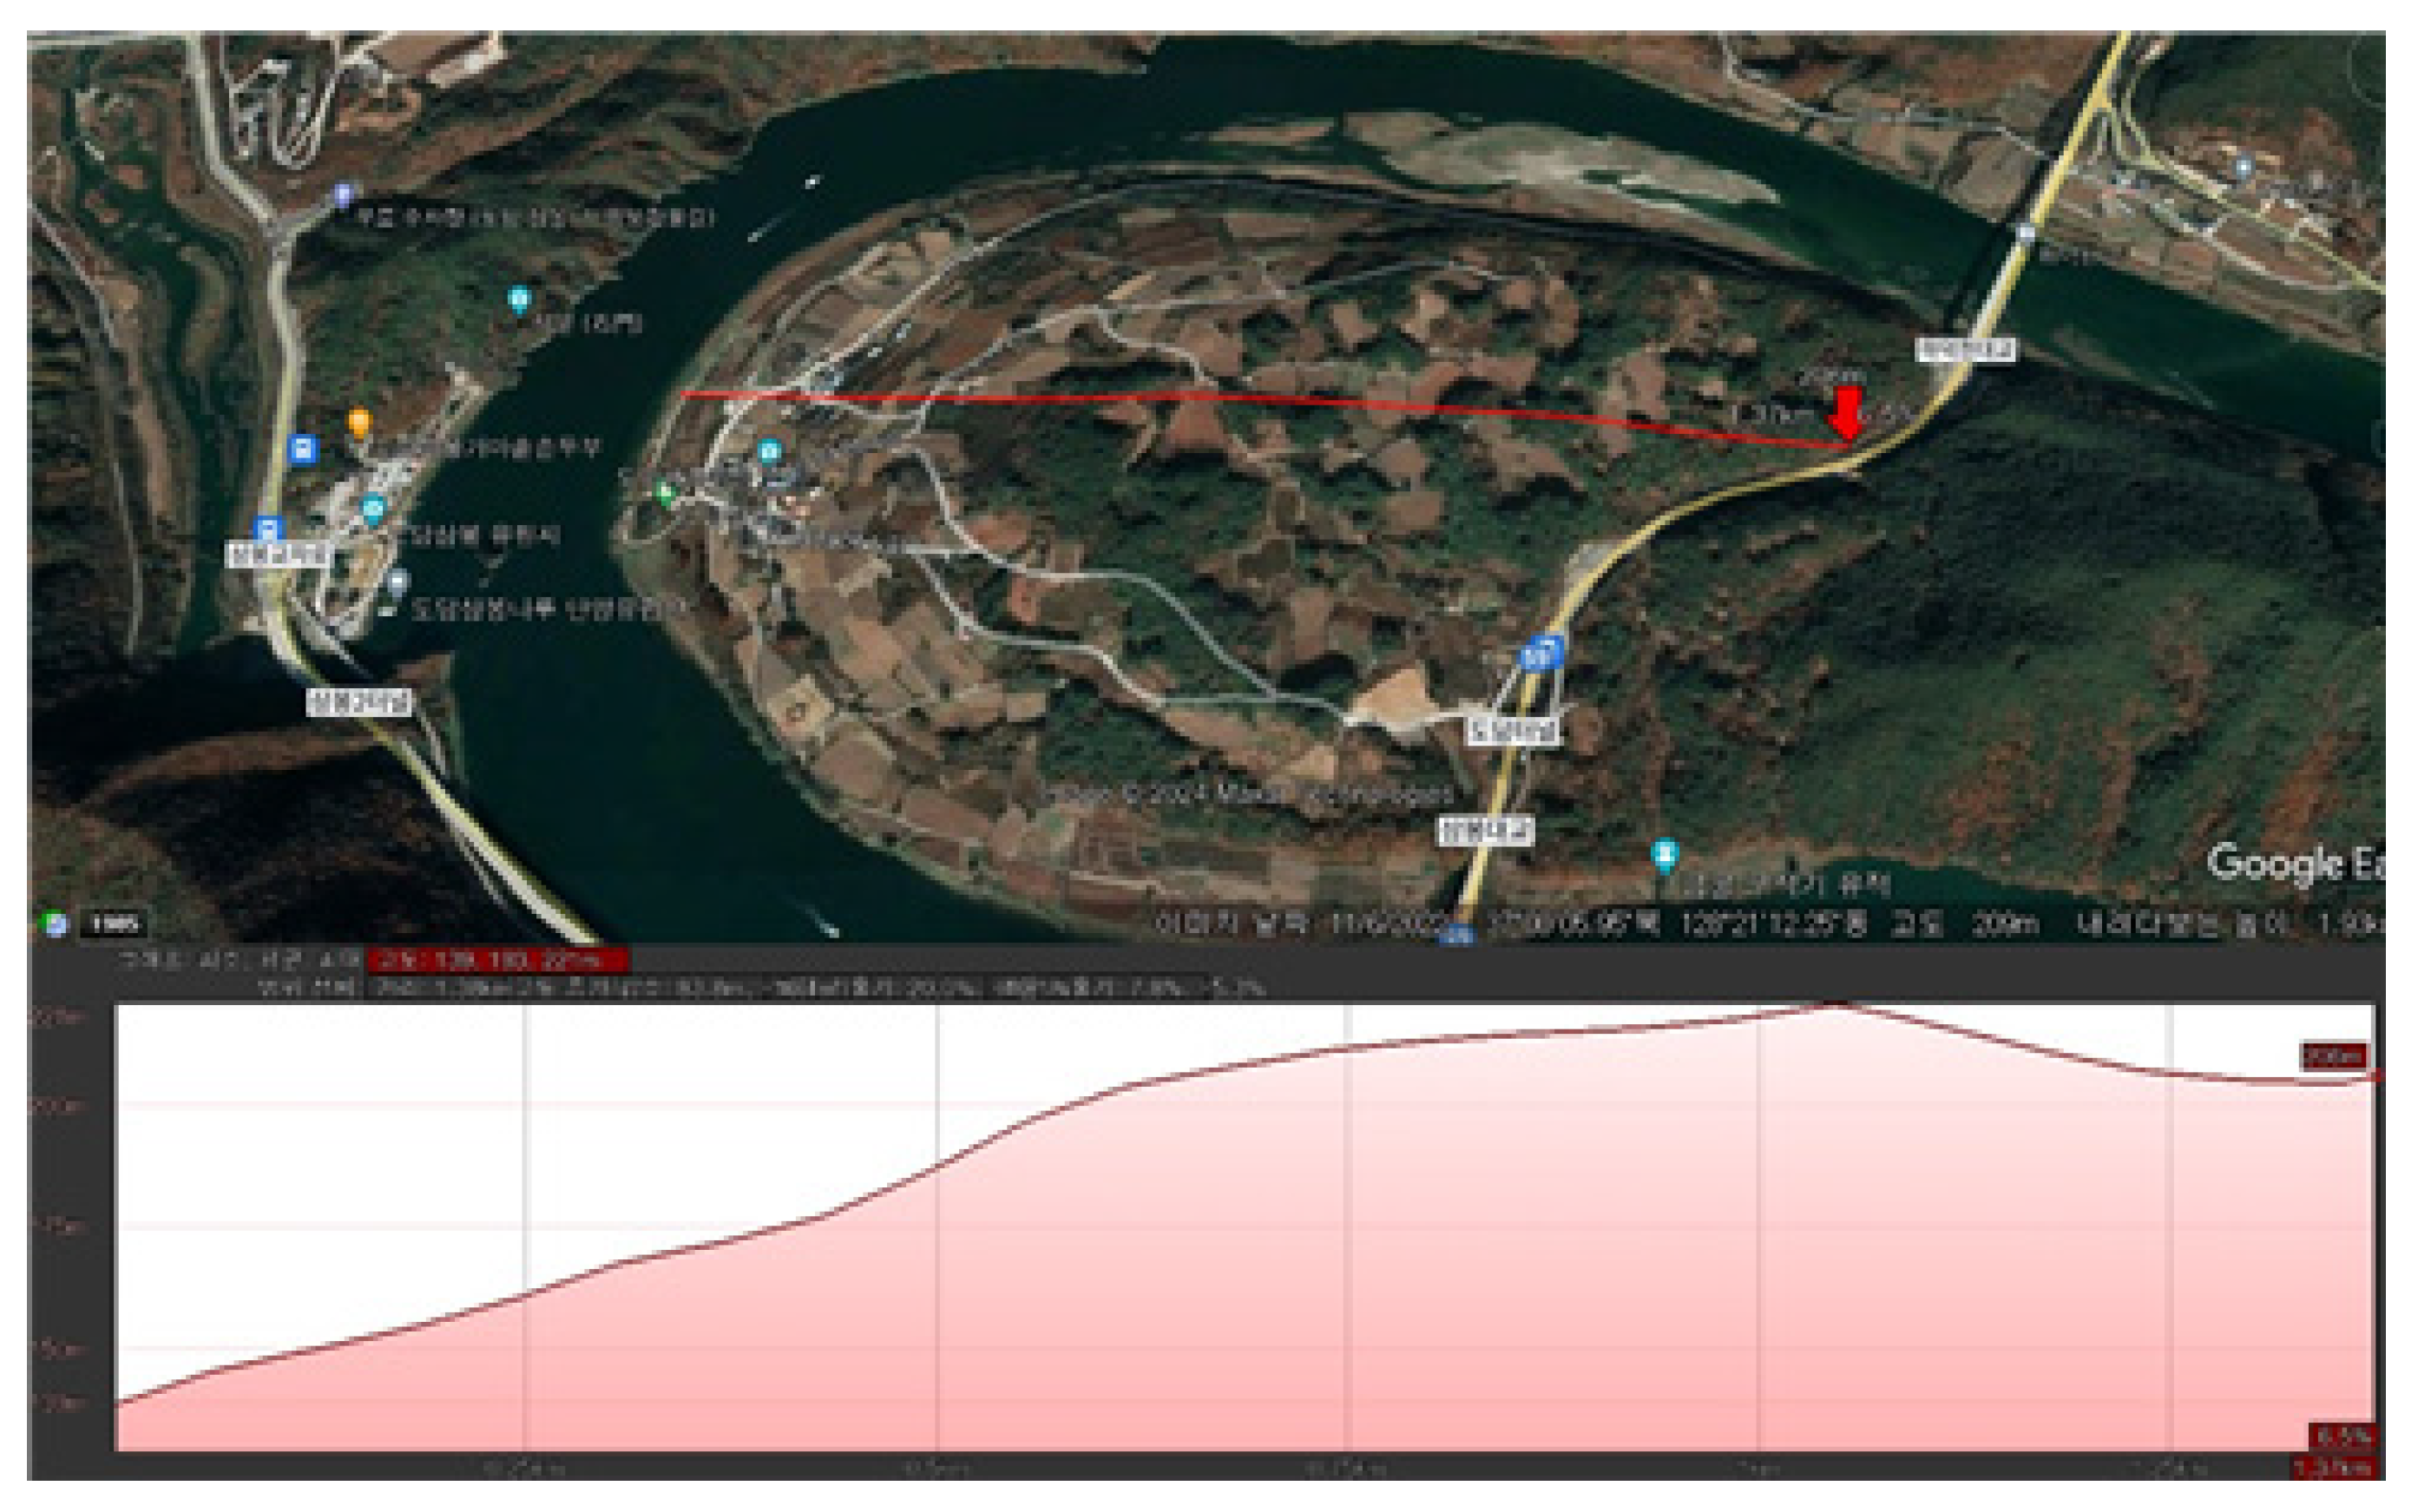
Figure 3.
Research flow chart.
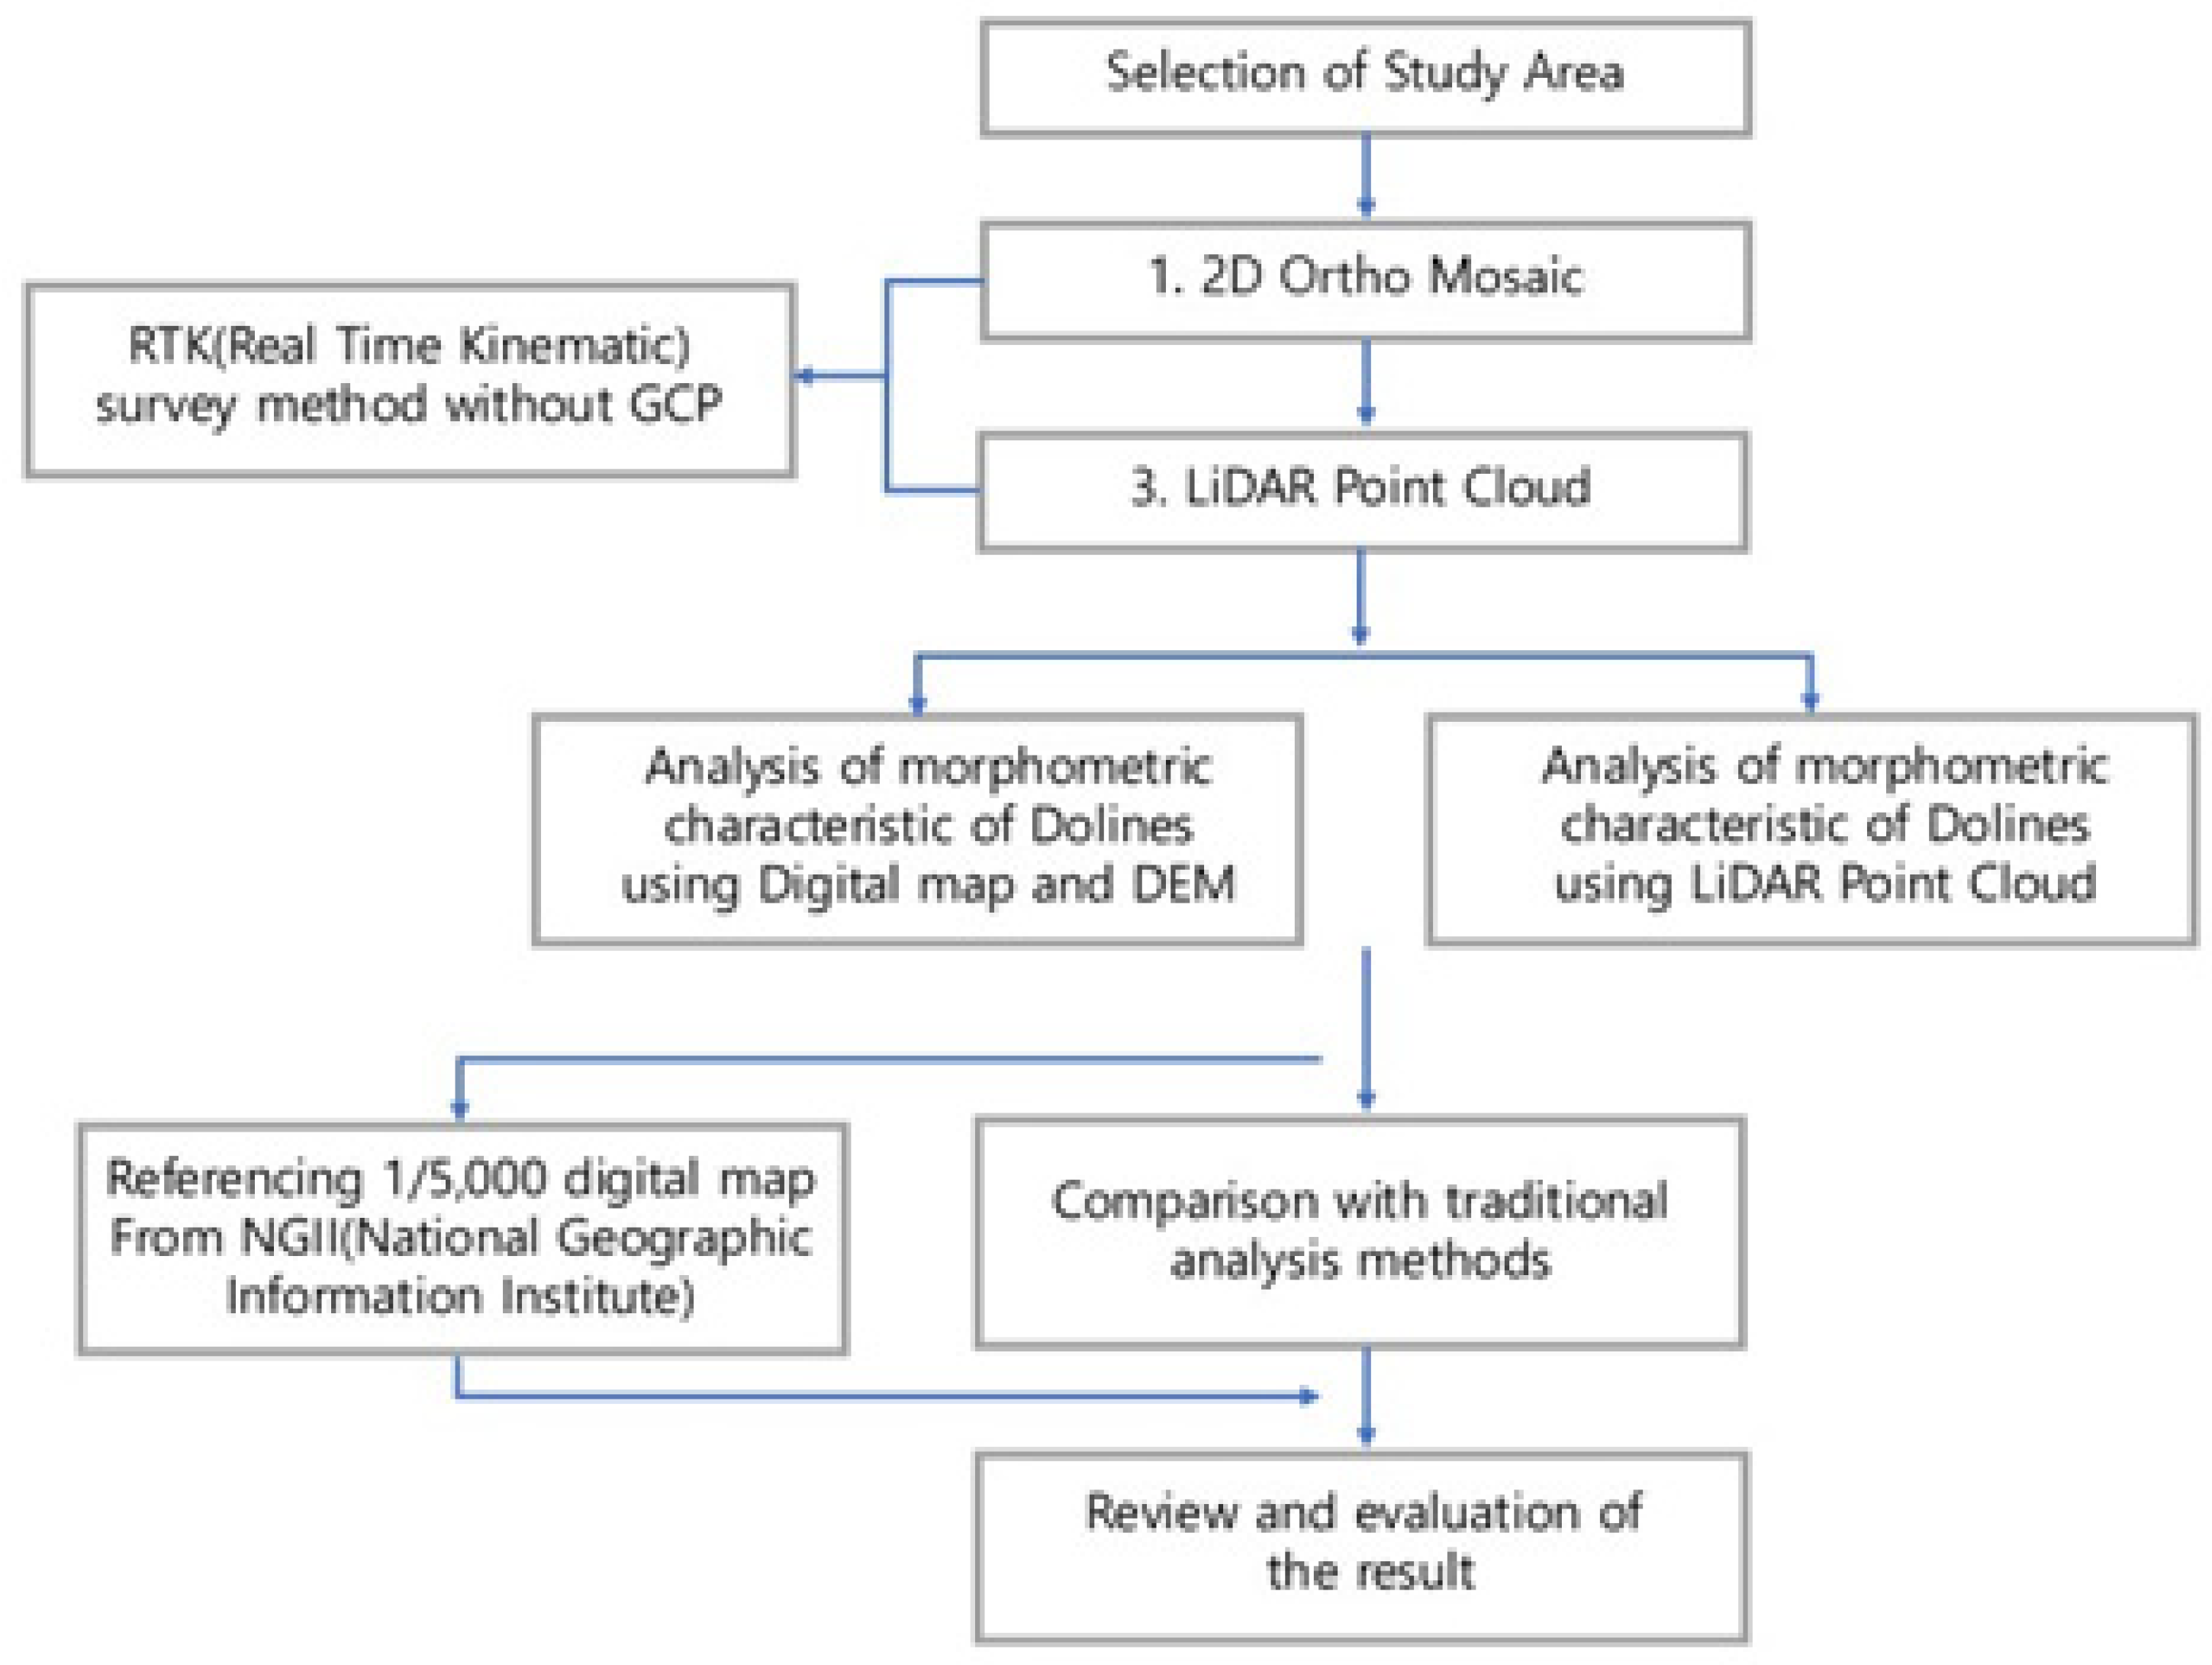
Figure 4.
Flight route of UAV over study site (DJI RC Plus controller screen).
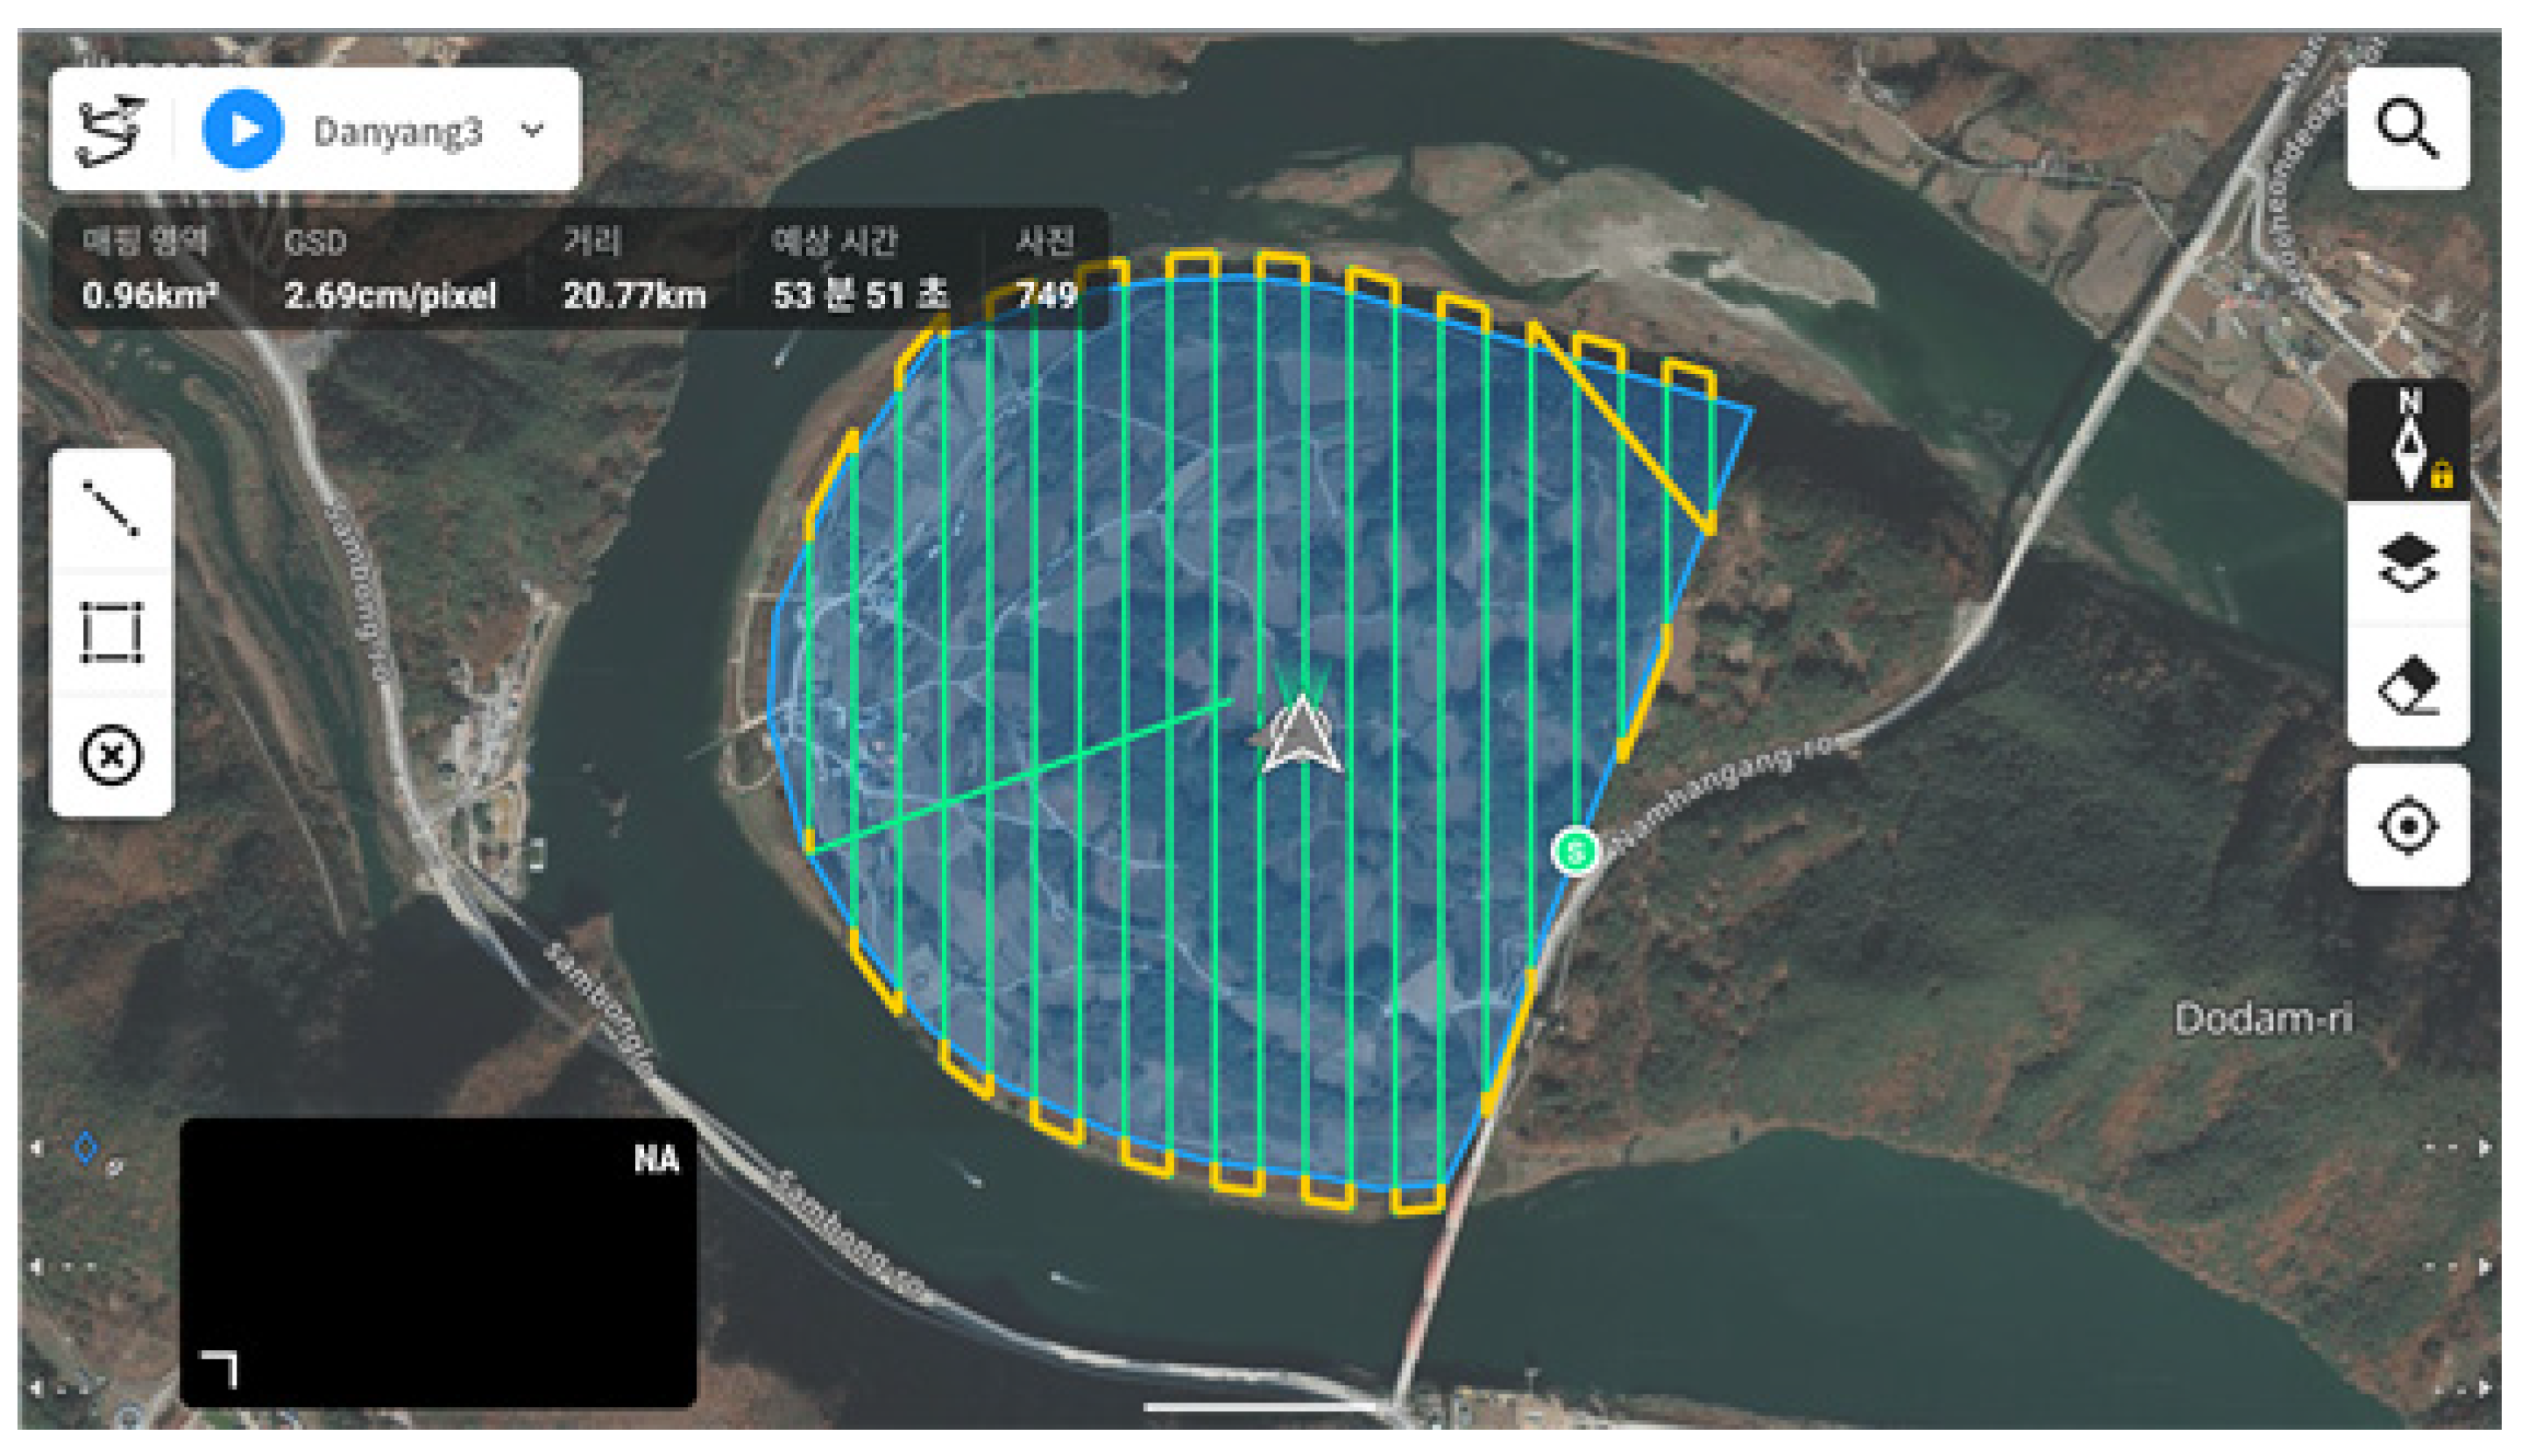
Figure 5.
Digital elevation model acquired with UAV LiDAR (the result of processing in DJI Terra software).
Figure 5.
Digital elevation model acquired with UAV LiDAR (the result of processing in DJI Terra software).
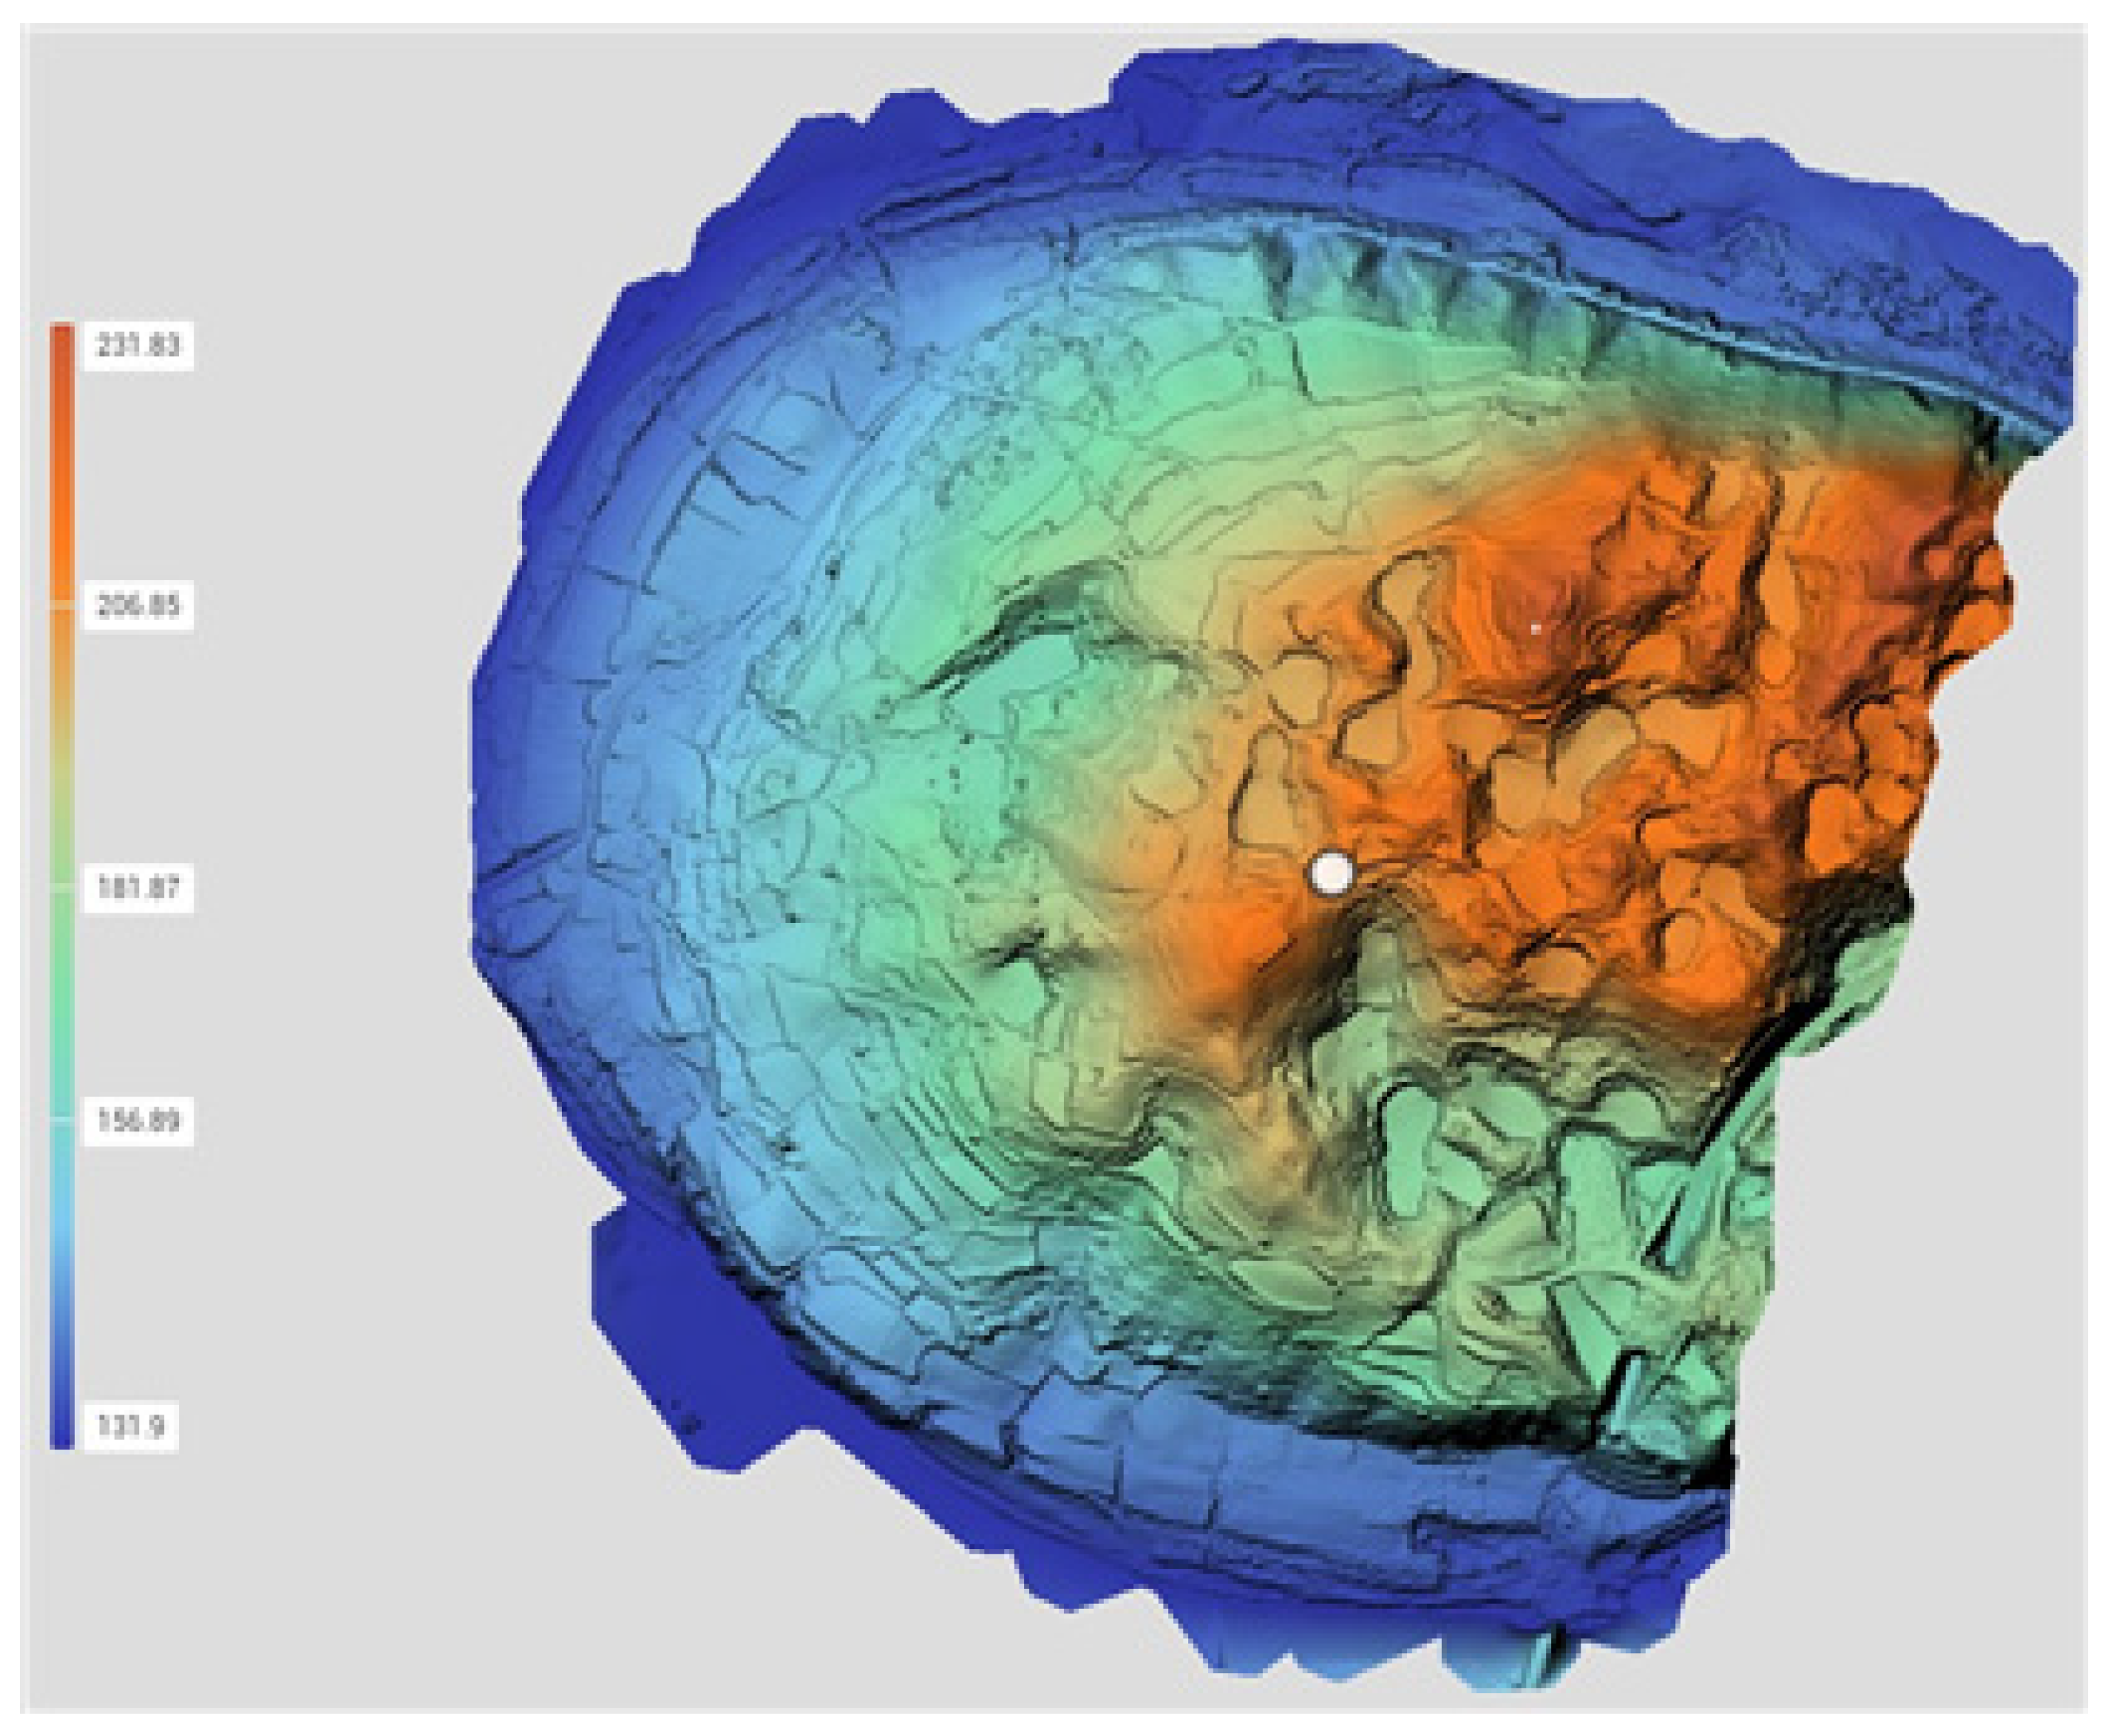
Figure 6.
Image based mapping: (a) Orthophoto; (b) Digital surface model (the result of processing in PIX4D mapper software).
Figure 6.
Image based mapping: (a) Orthophoto; (b) Digital surface model (the result of processing in PIX4D mapper software).
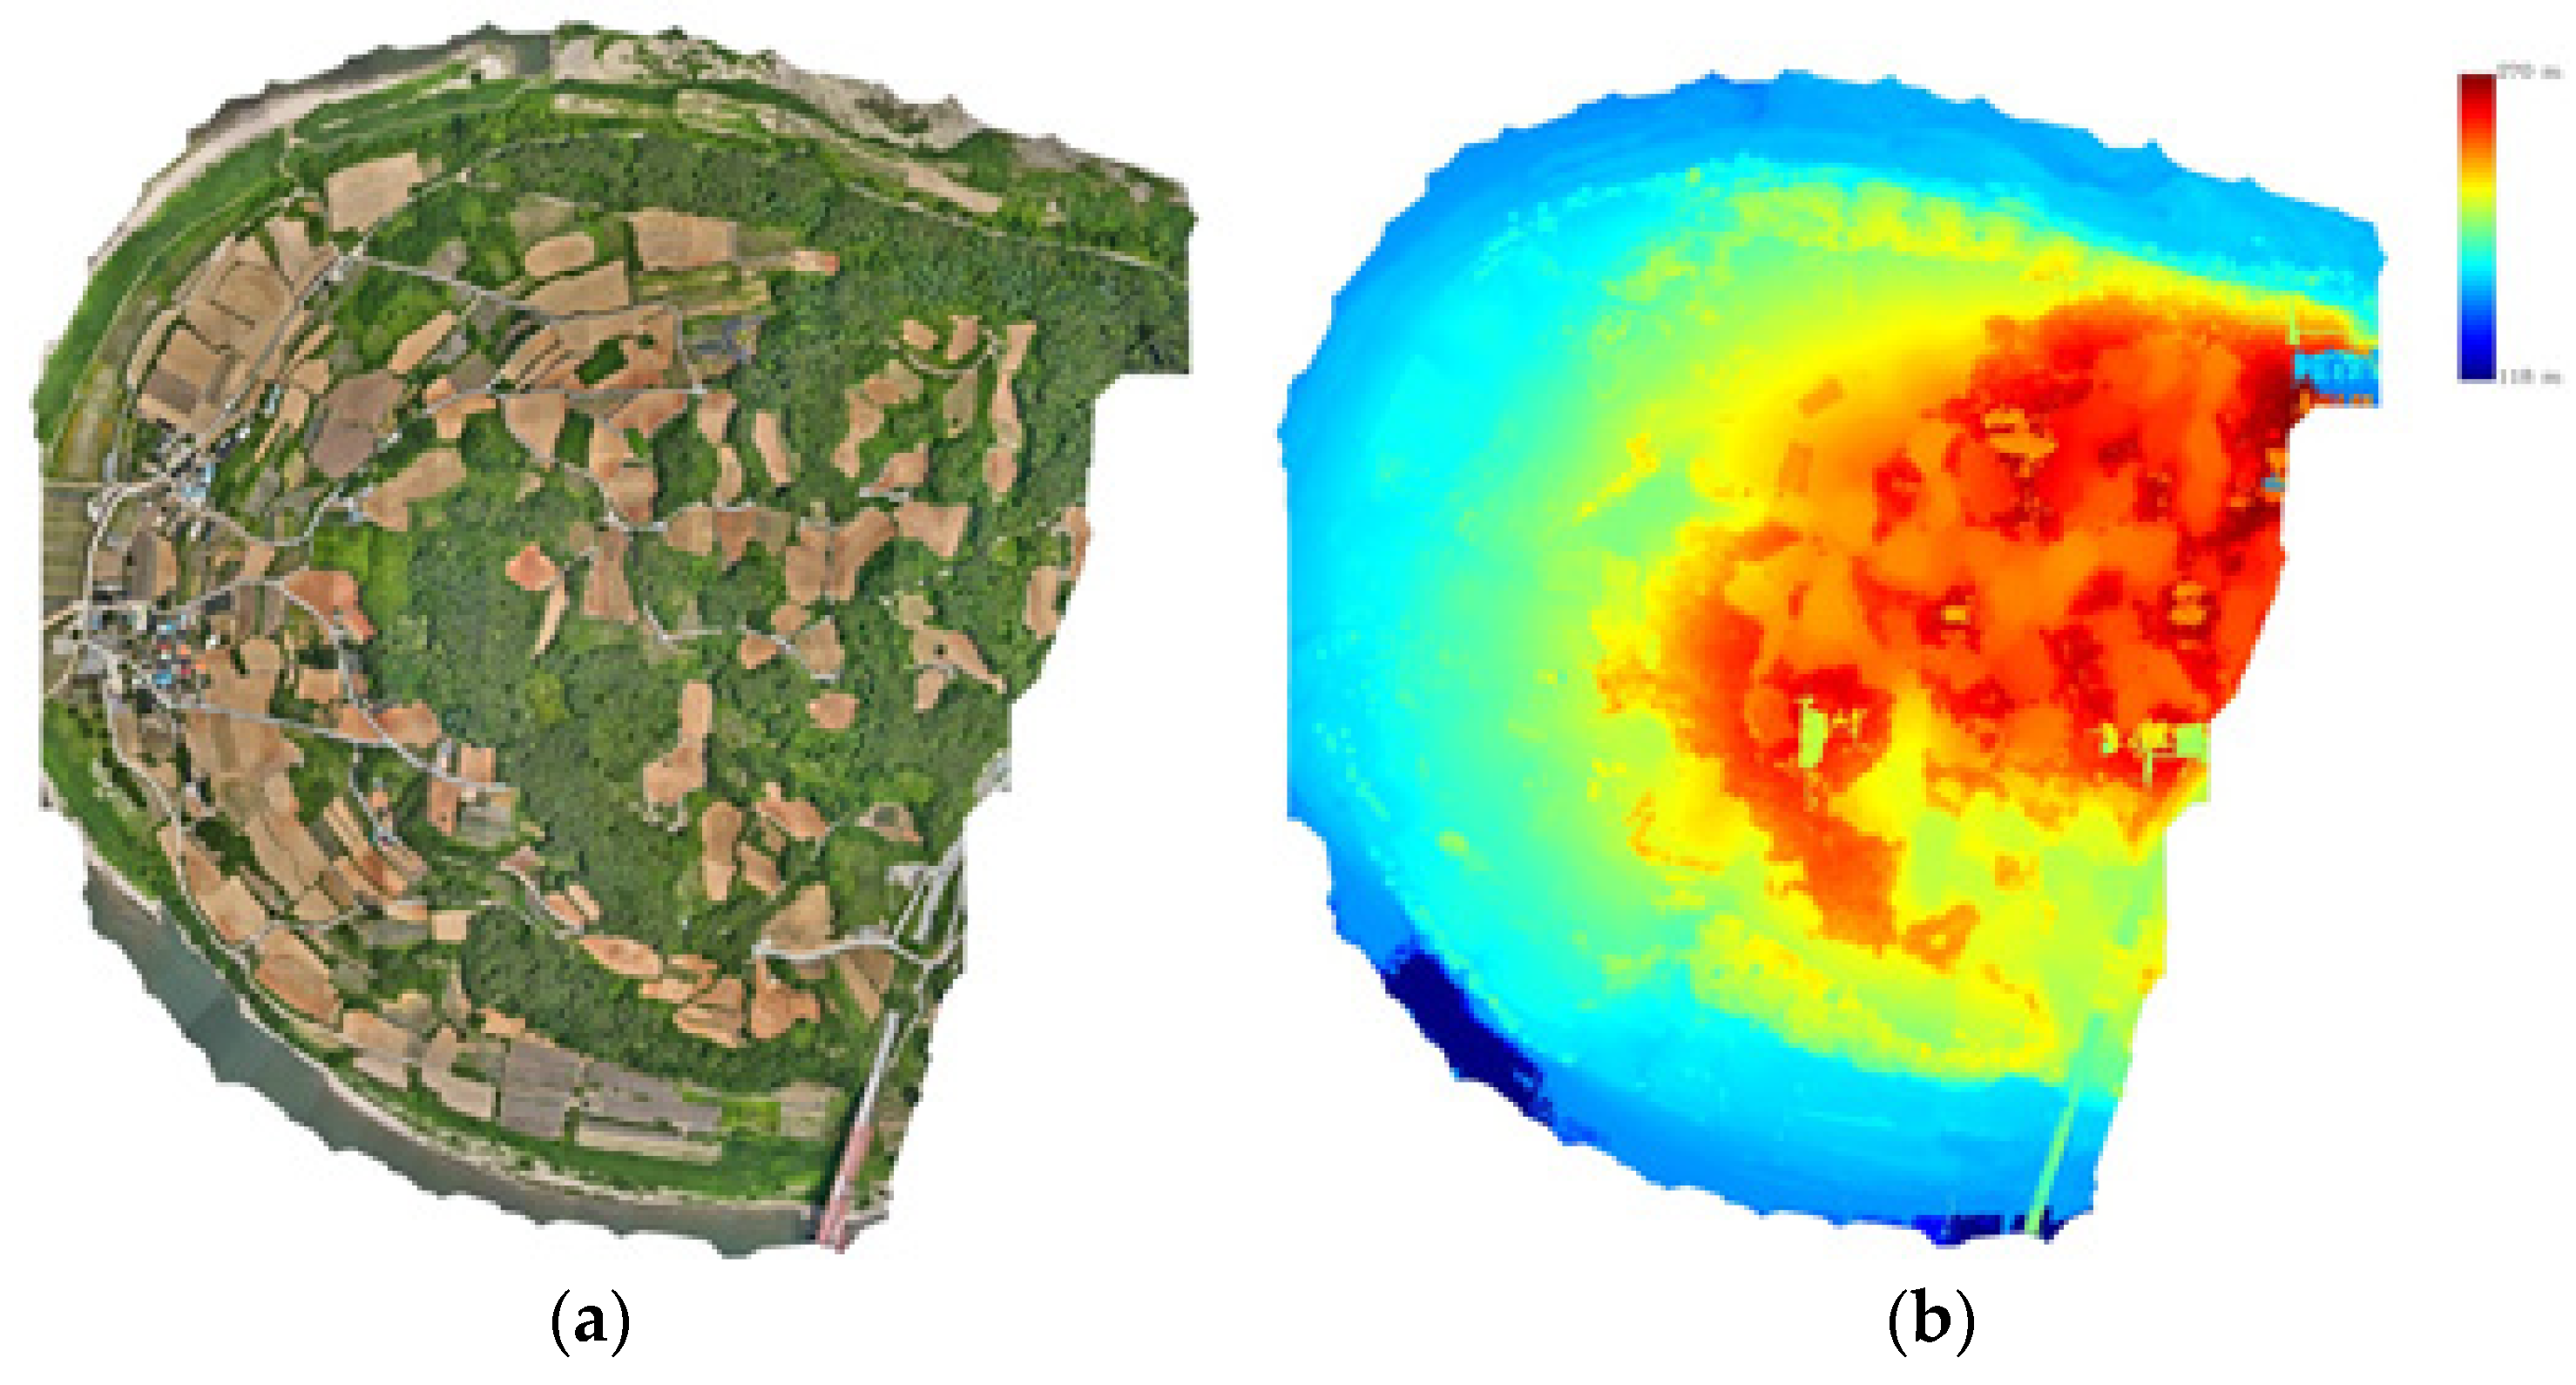
Figure 7.
Types of data processing results: (A) UAV LiDAR based DEM; (B) UAV Images based DSM; (C) Contour-based DEM of 1/5,000 scale digital topographic map.
Figure 7.
Types of data processing results: (A) UAV LiDAR based DEM; (B) UAV Images based DSM; (C) Contour-based DEM of 1/5,000 scale digital topographic map.
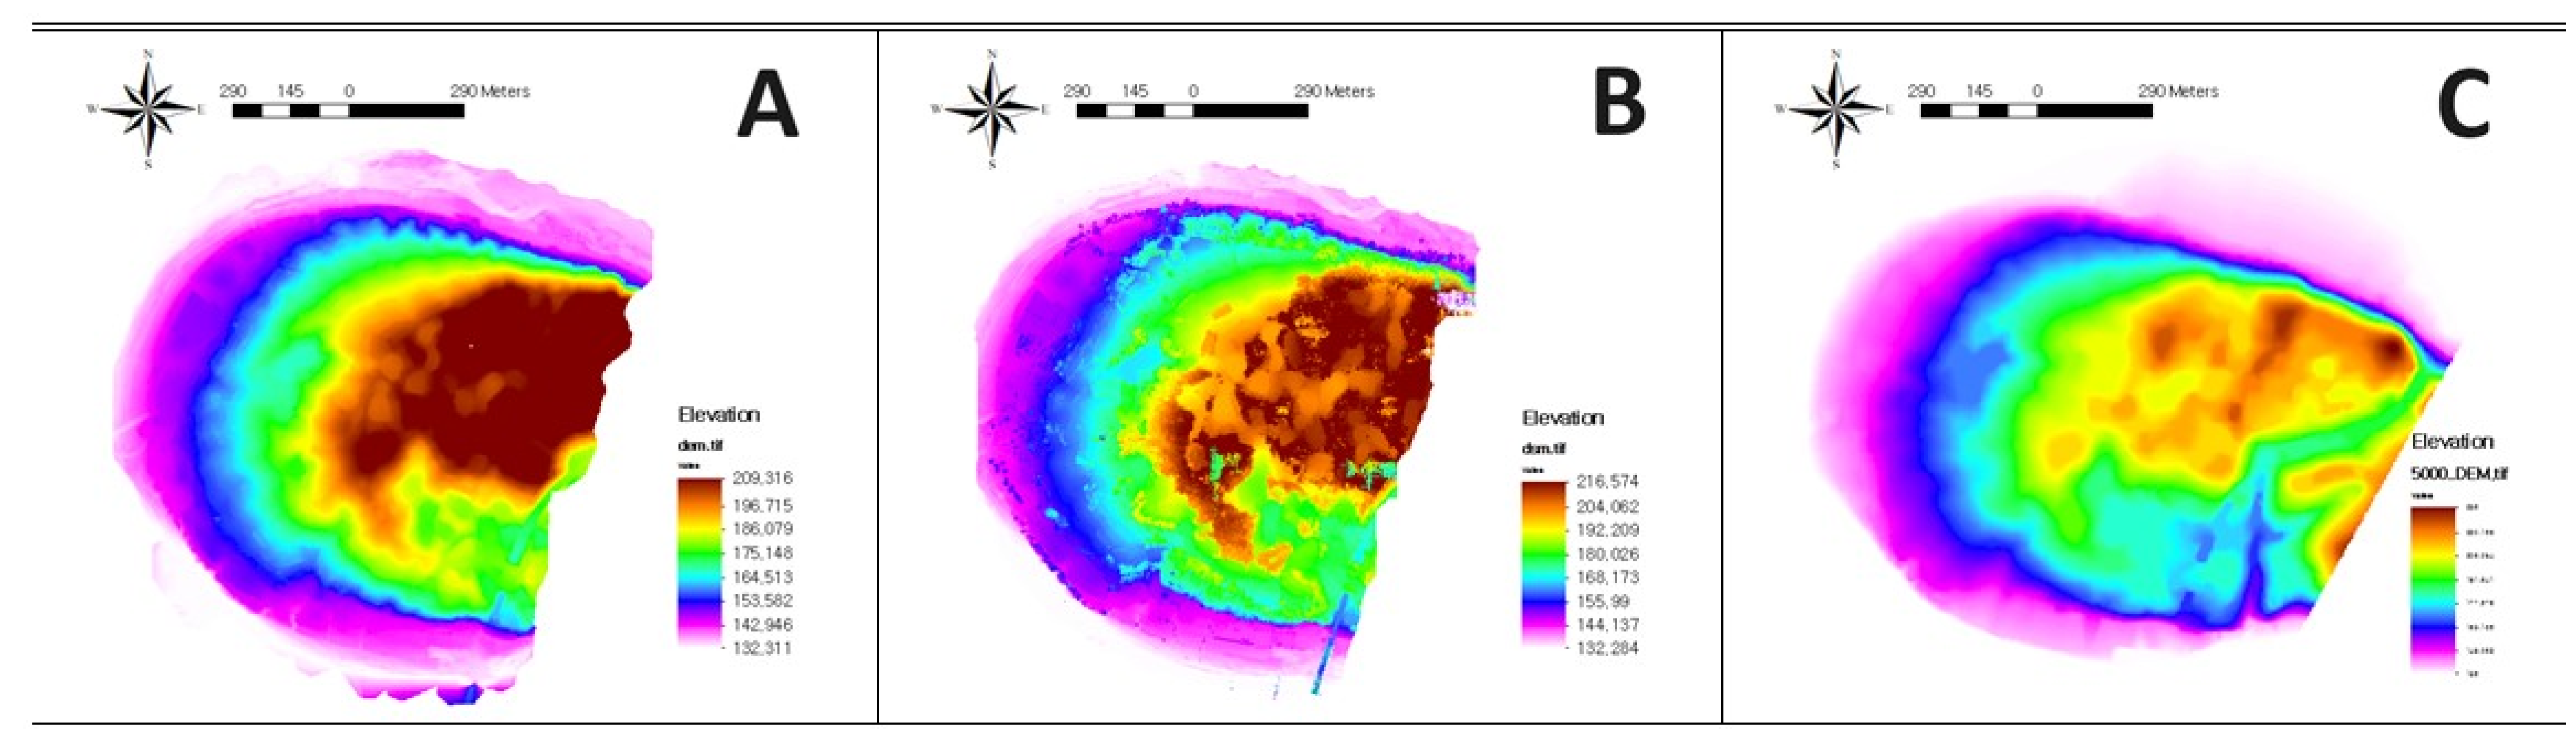
Figure 8.
Experimental areas for elevation profile analysis A, B, C and D.
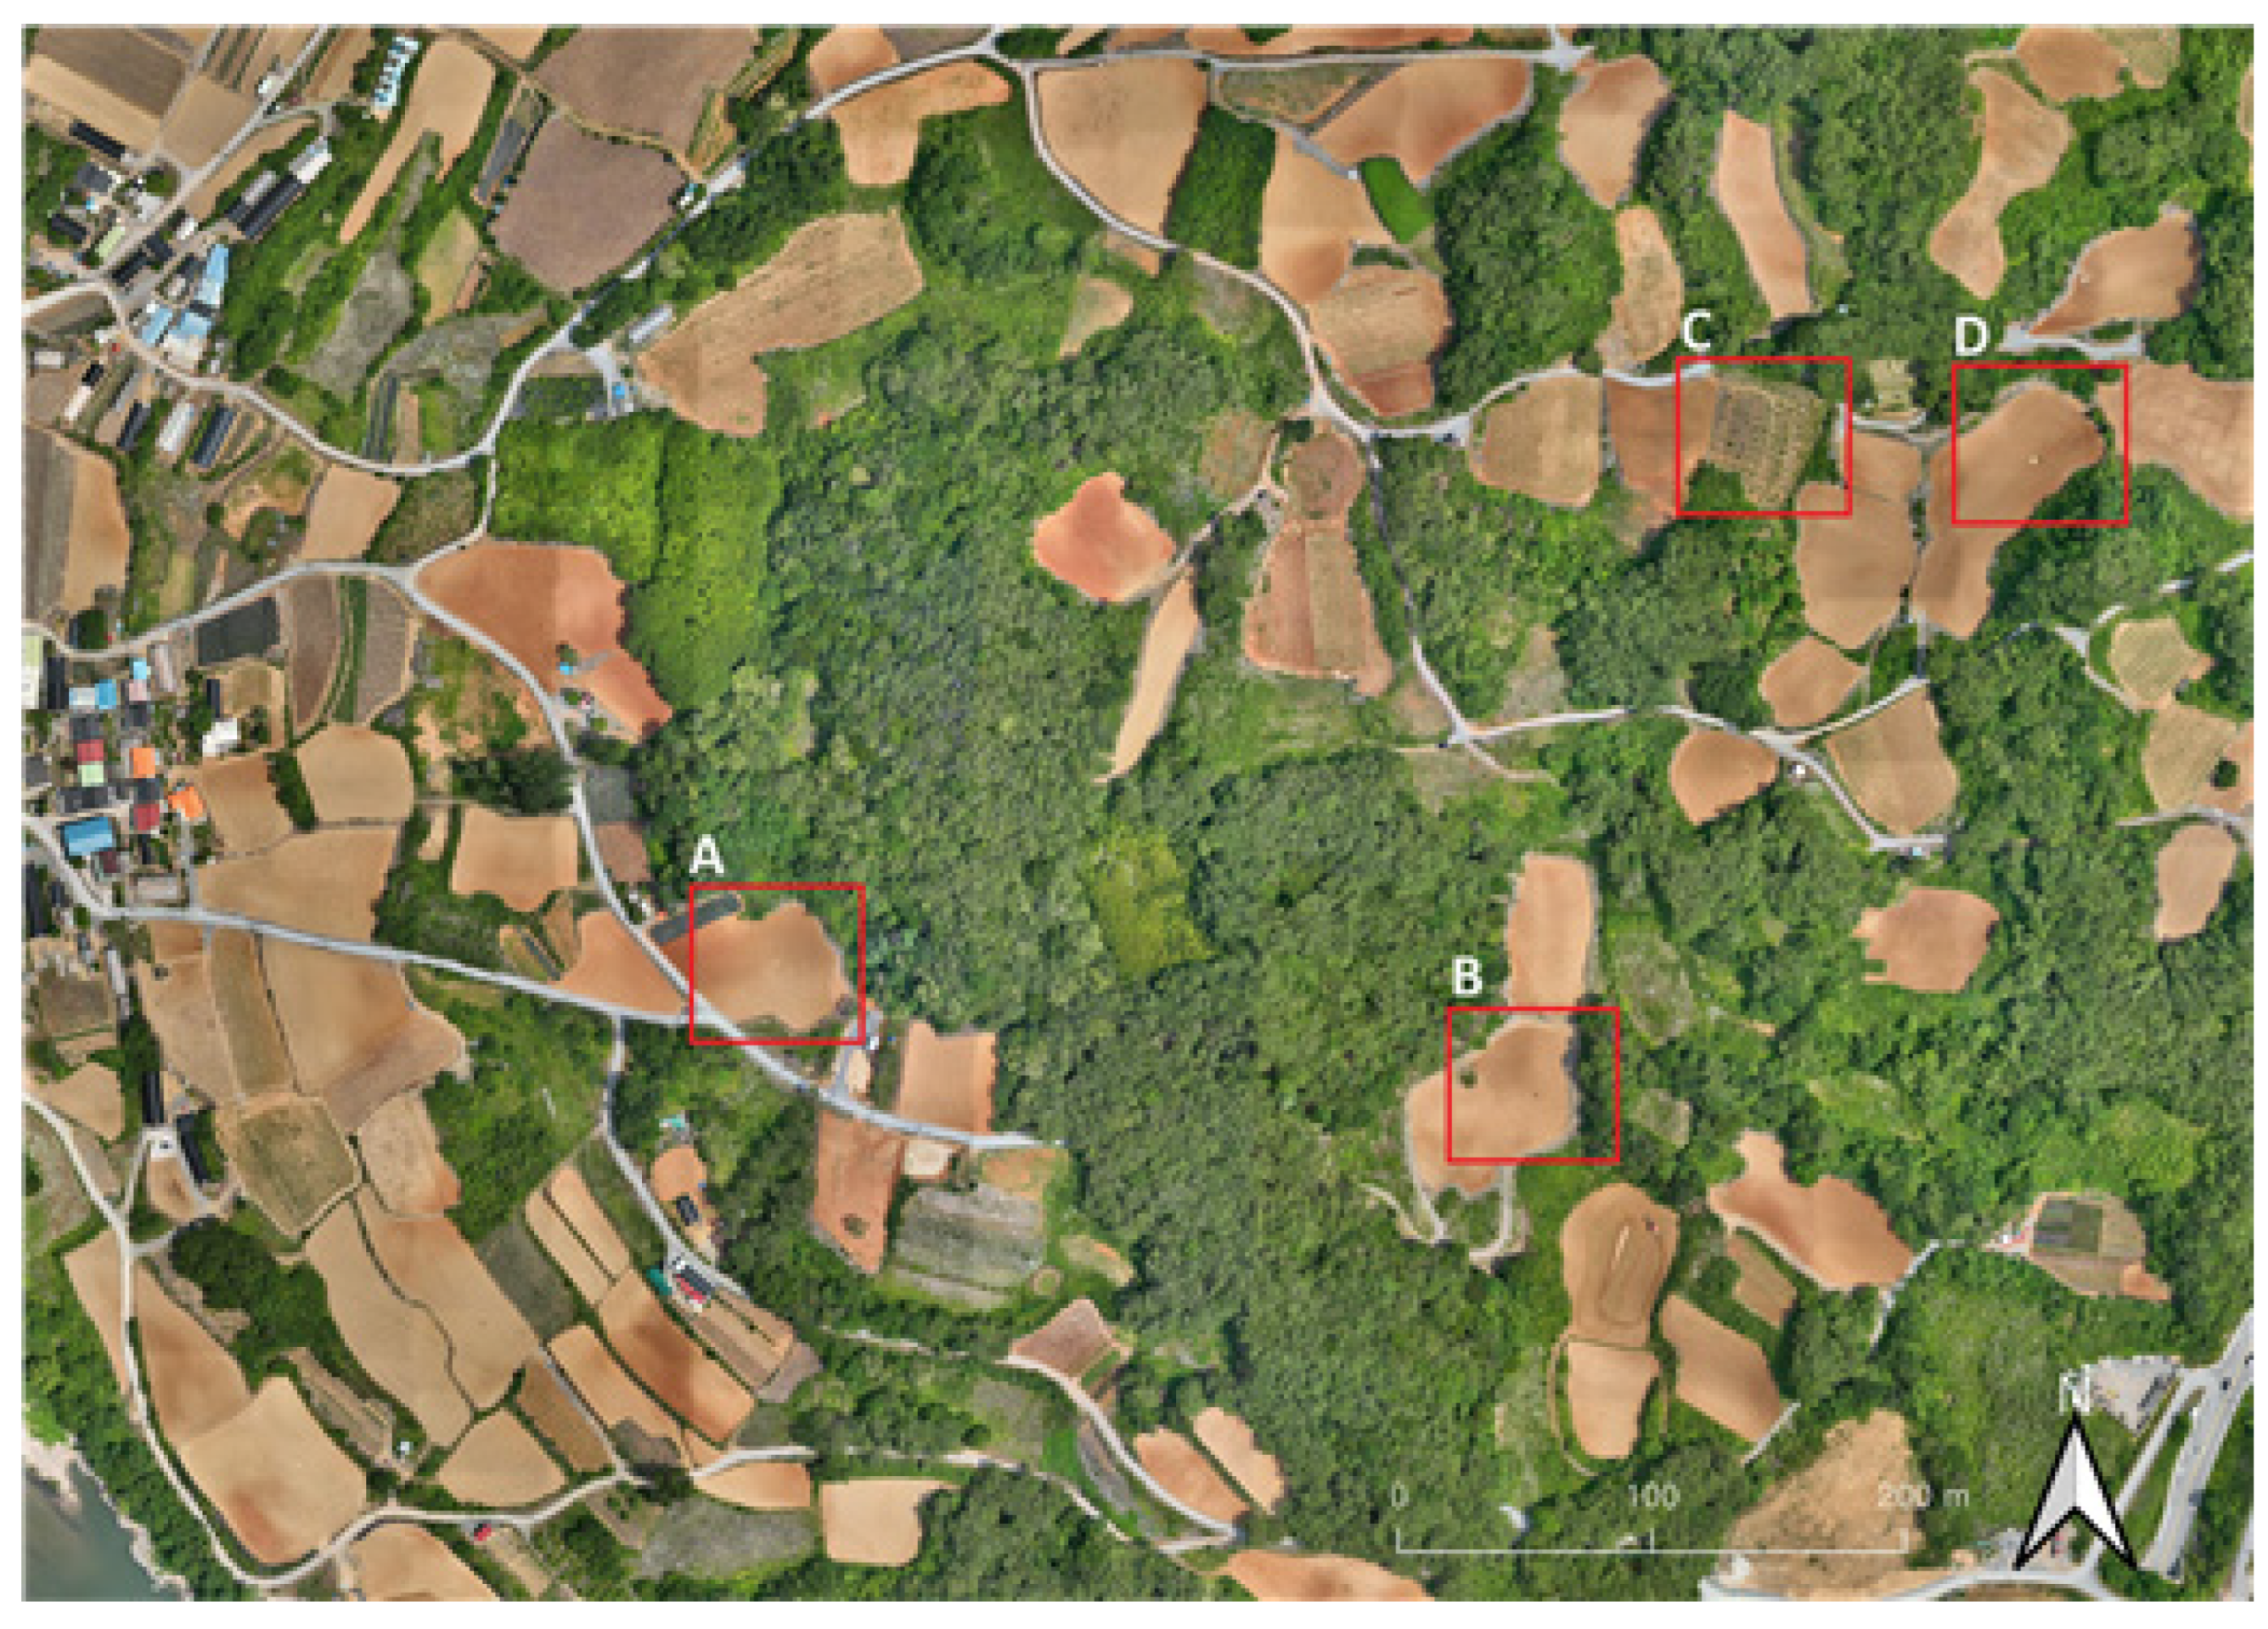
Figure 9.
Cross-section lines for experimental areas: (a) Cross-section line of area A; (b) Cross-section line of area B; (c) Cross-section line of area C; (d) Cross-section line of area D.
Figure 9.
Cross-section lines for experimental areas: (a) Cross-section line of area A; (b) Cross-section line of area B; (c) Cross-section line of area C; (d) Cross-section line of area D.
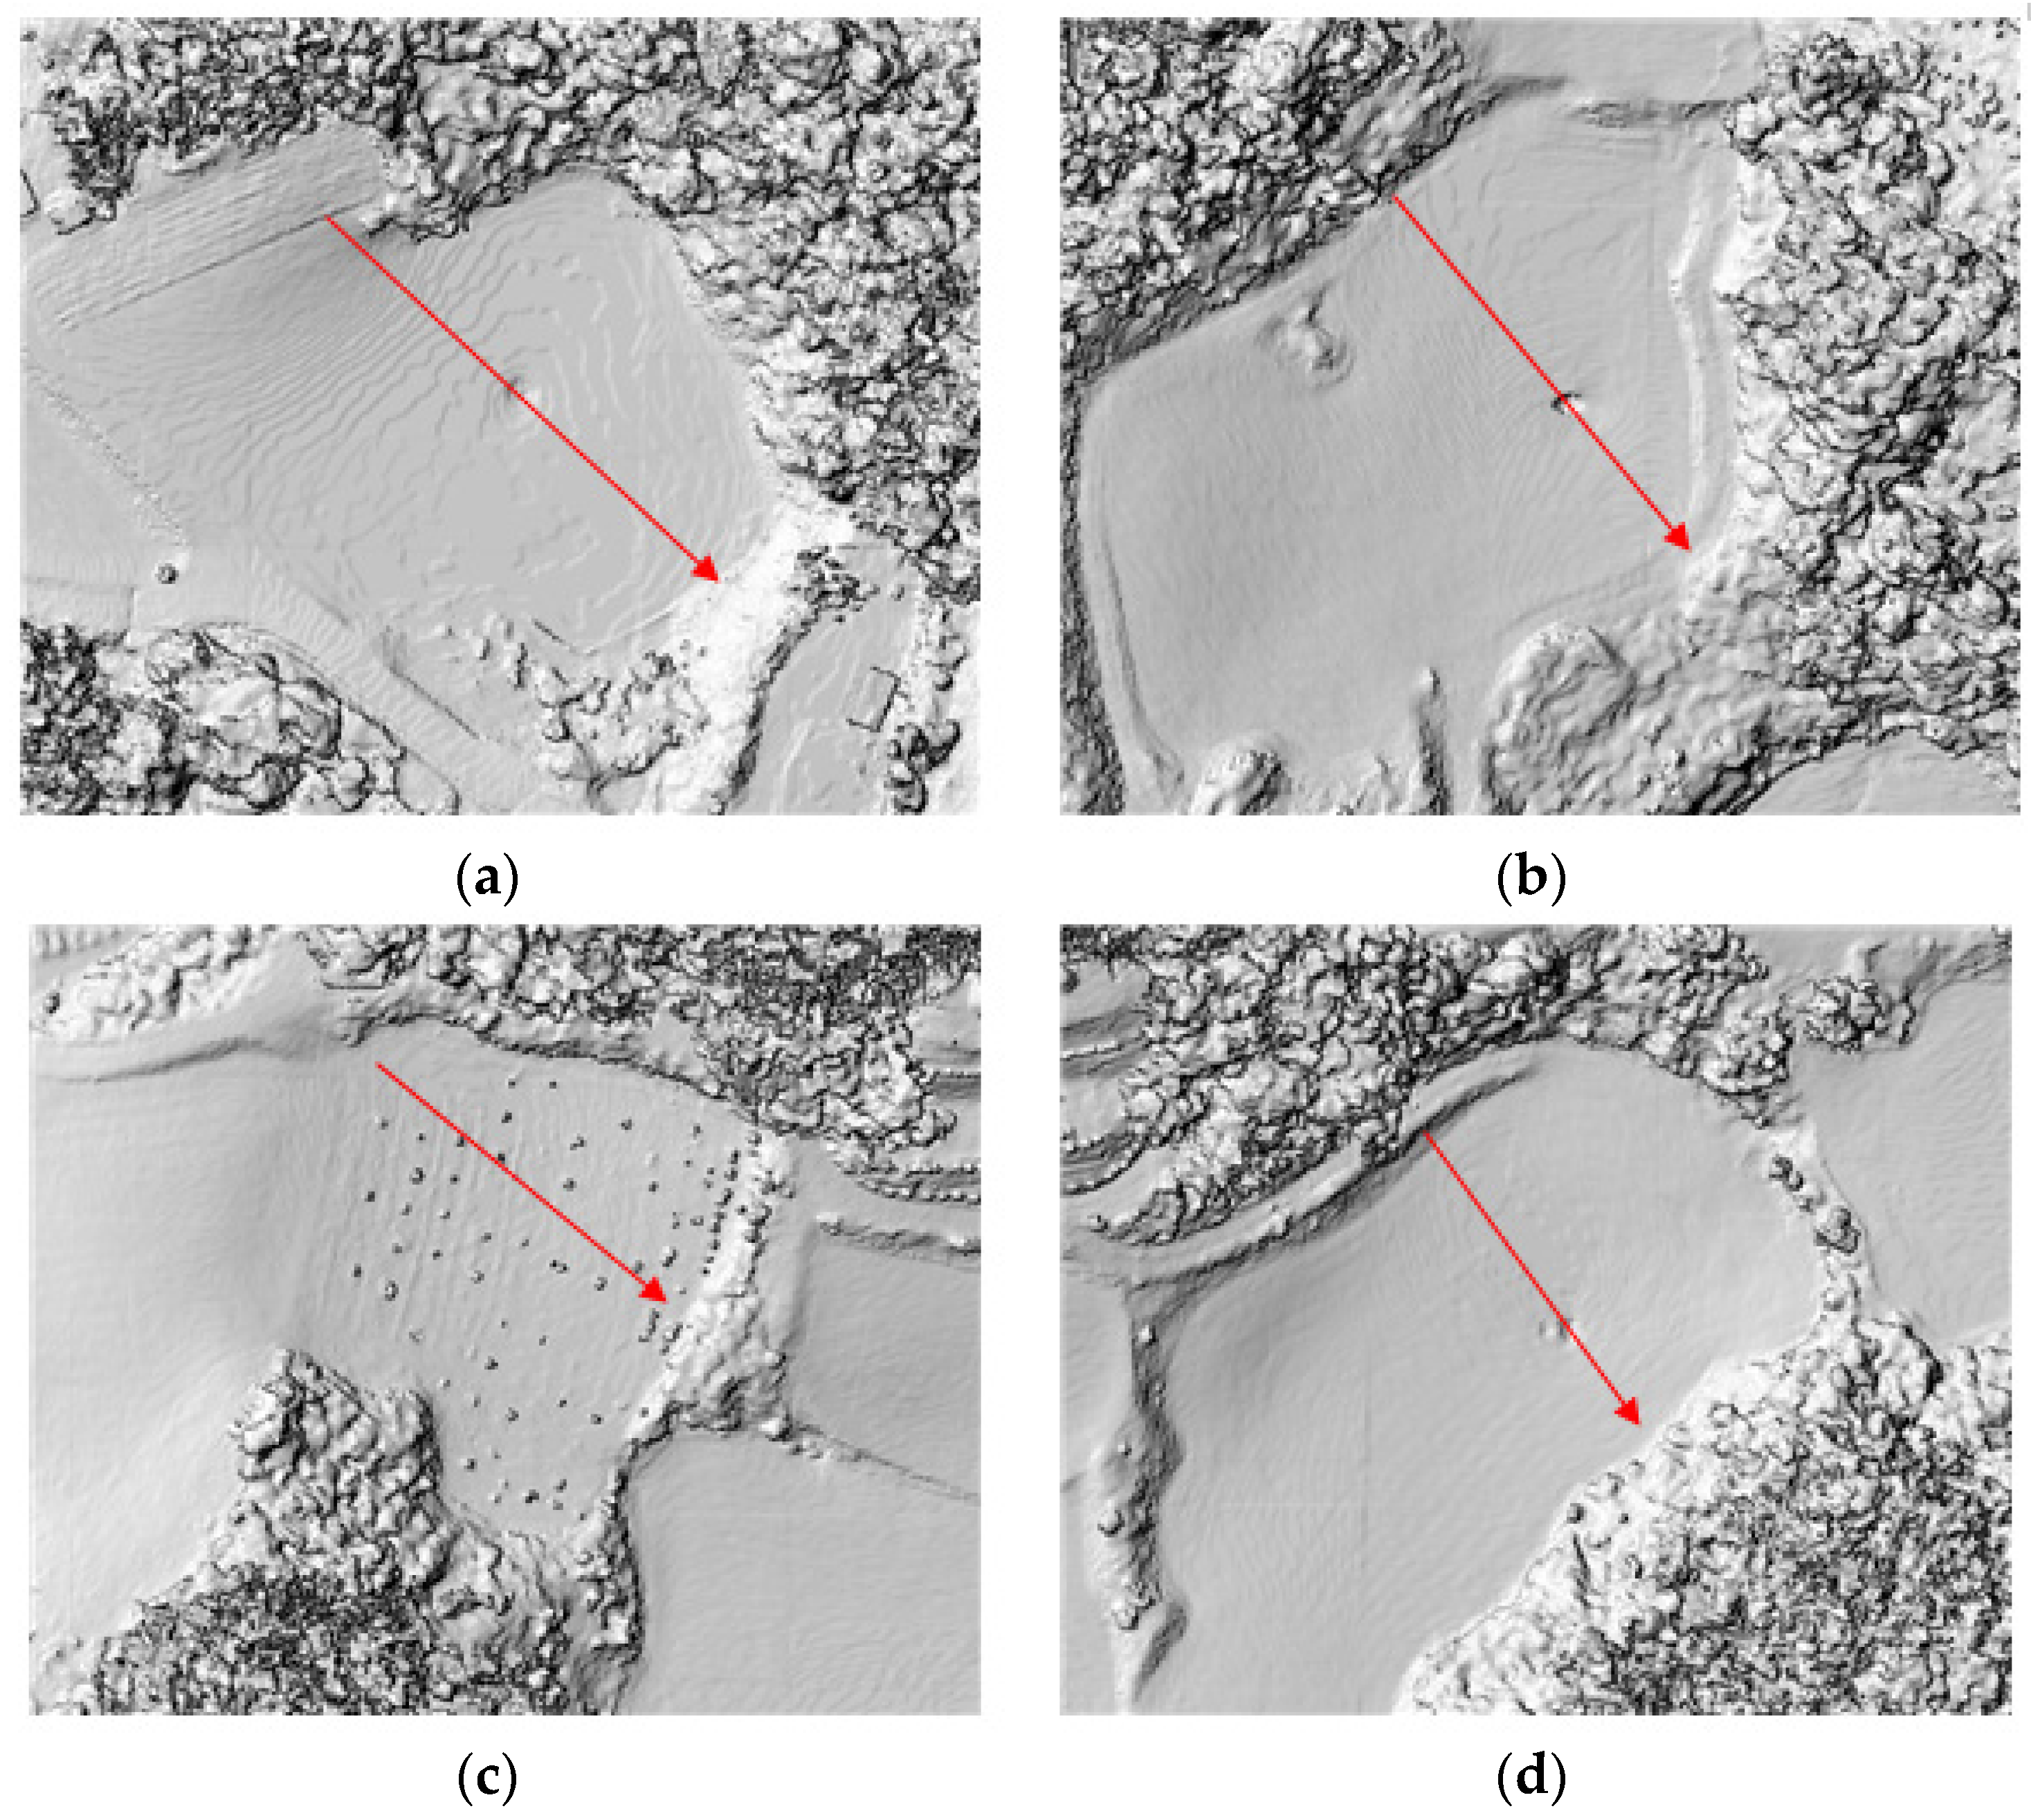
Figure 10.
Comparison of elevation profile A, B, C and D areas.
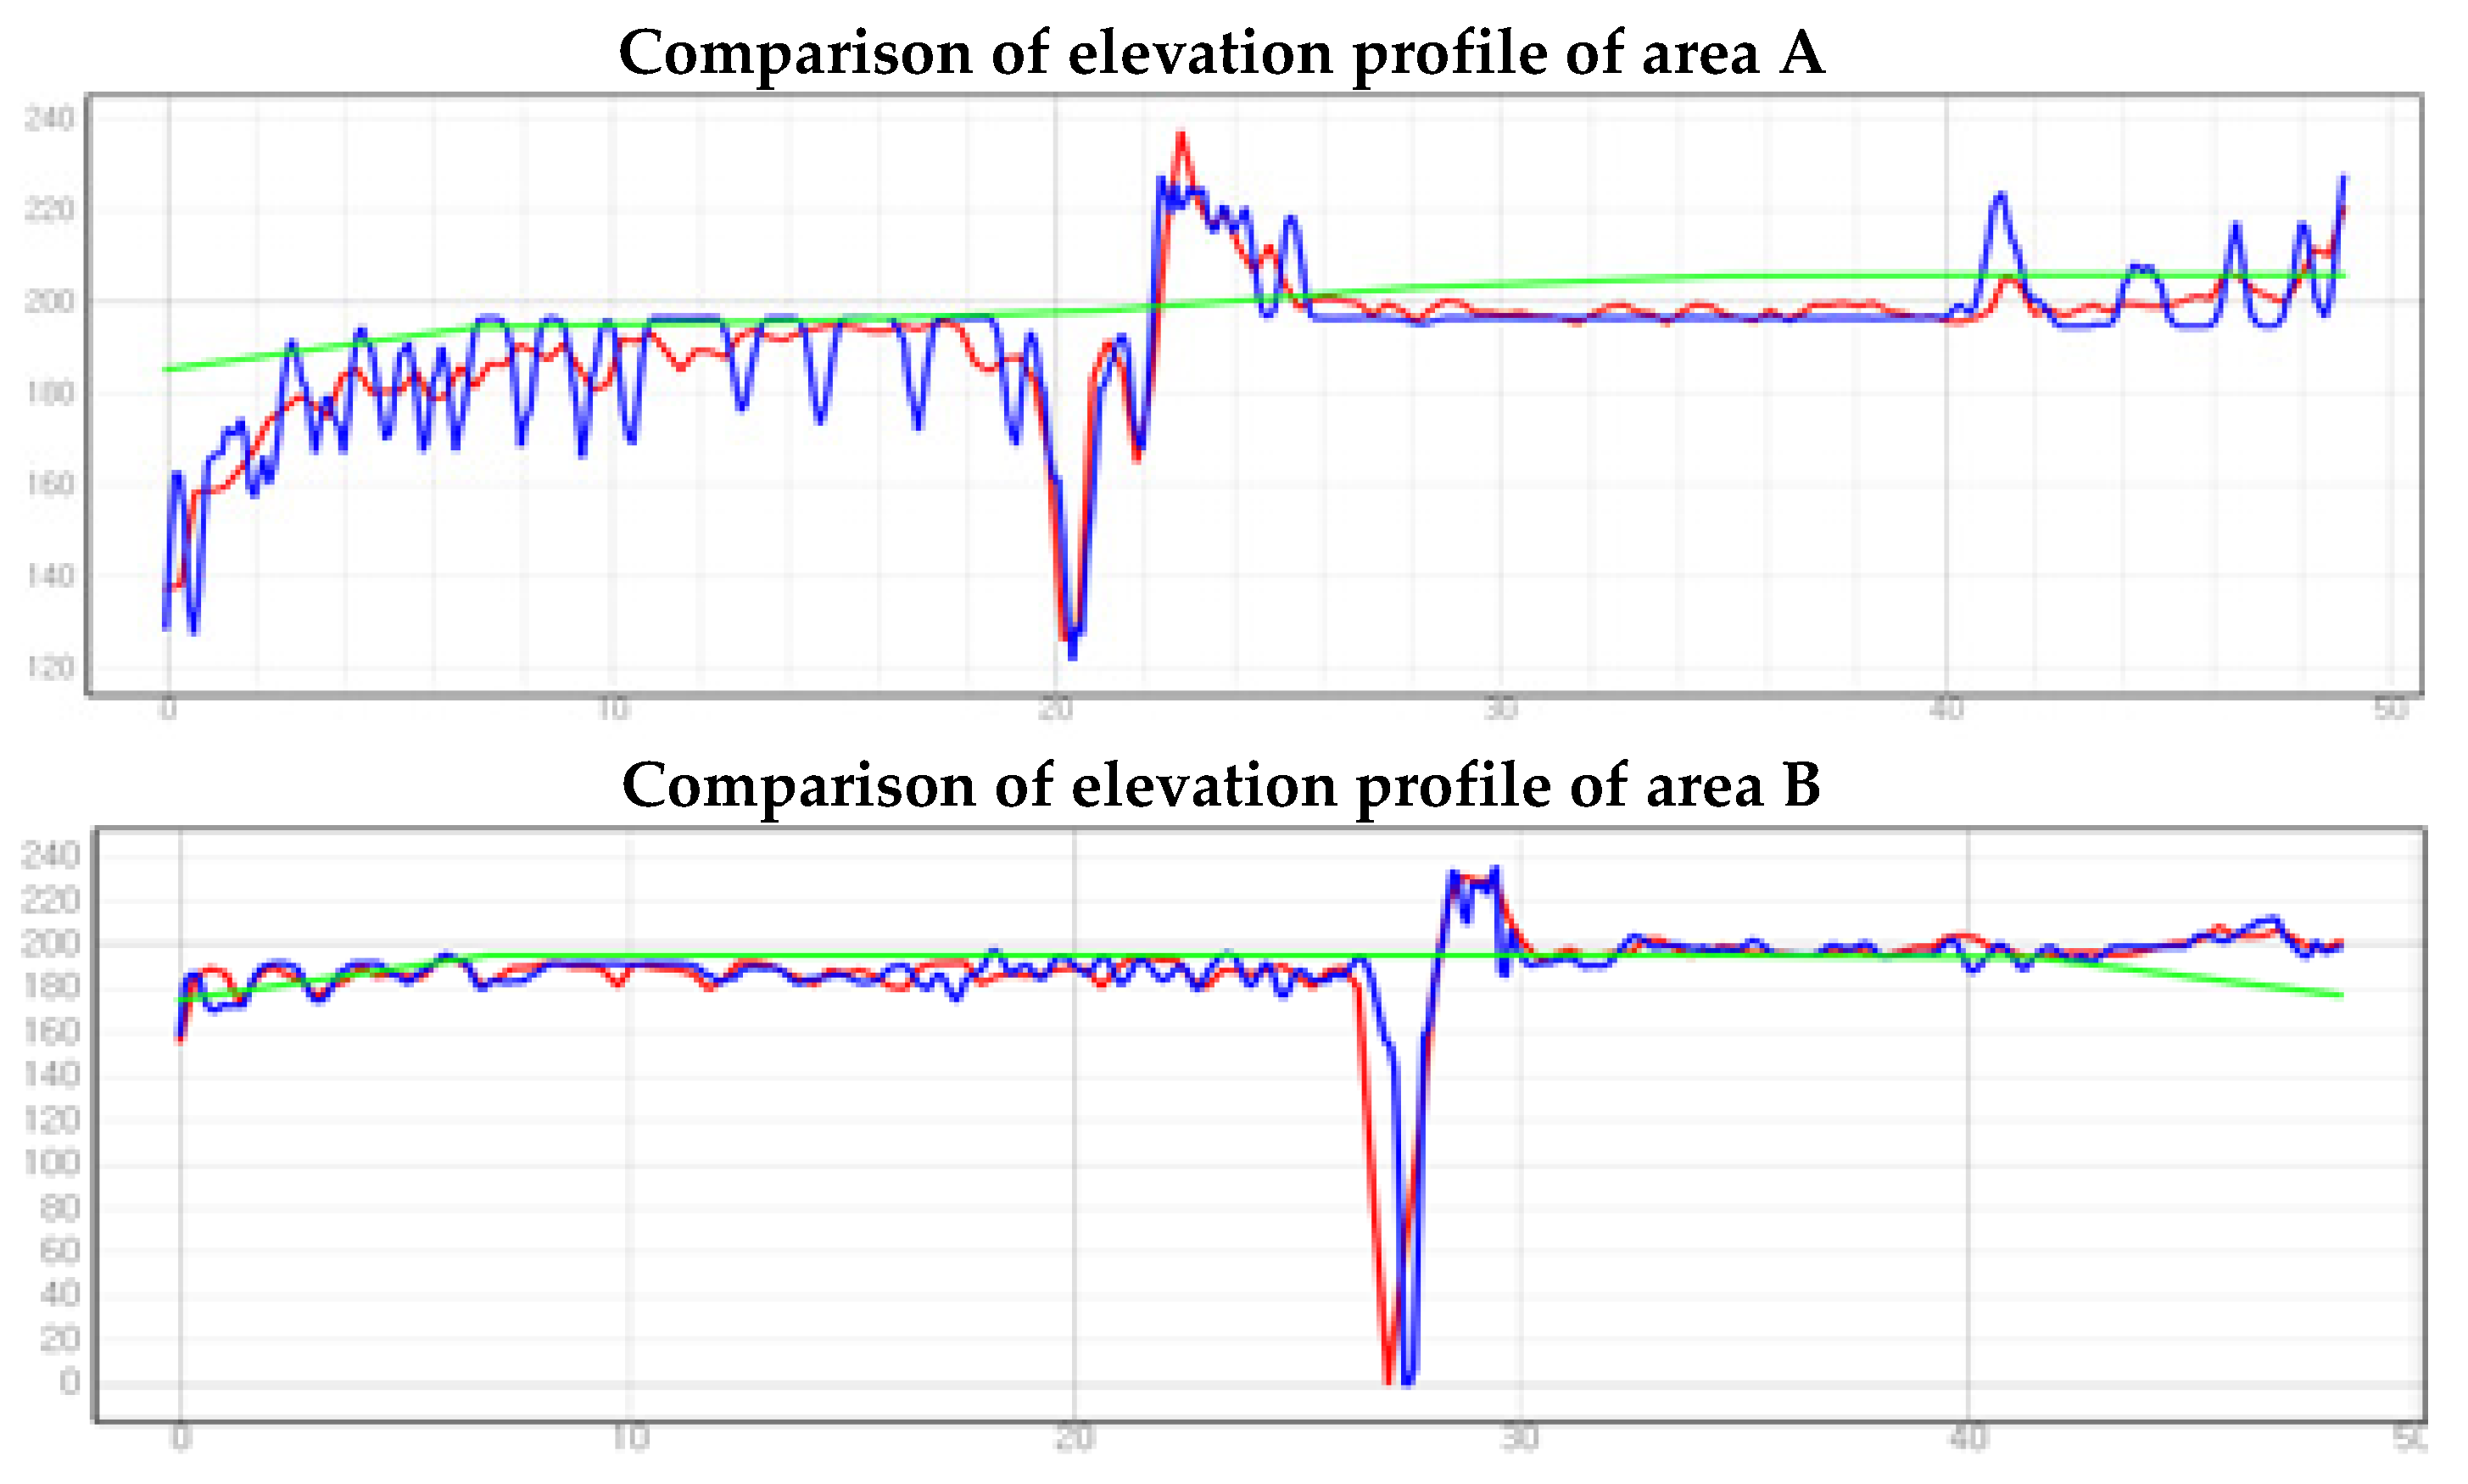
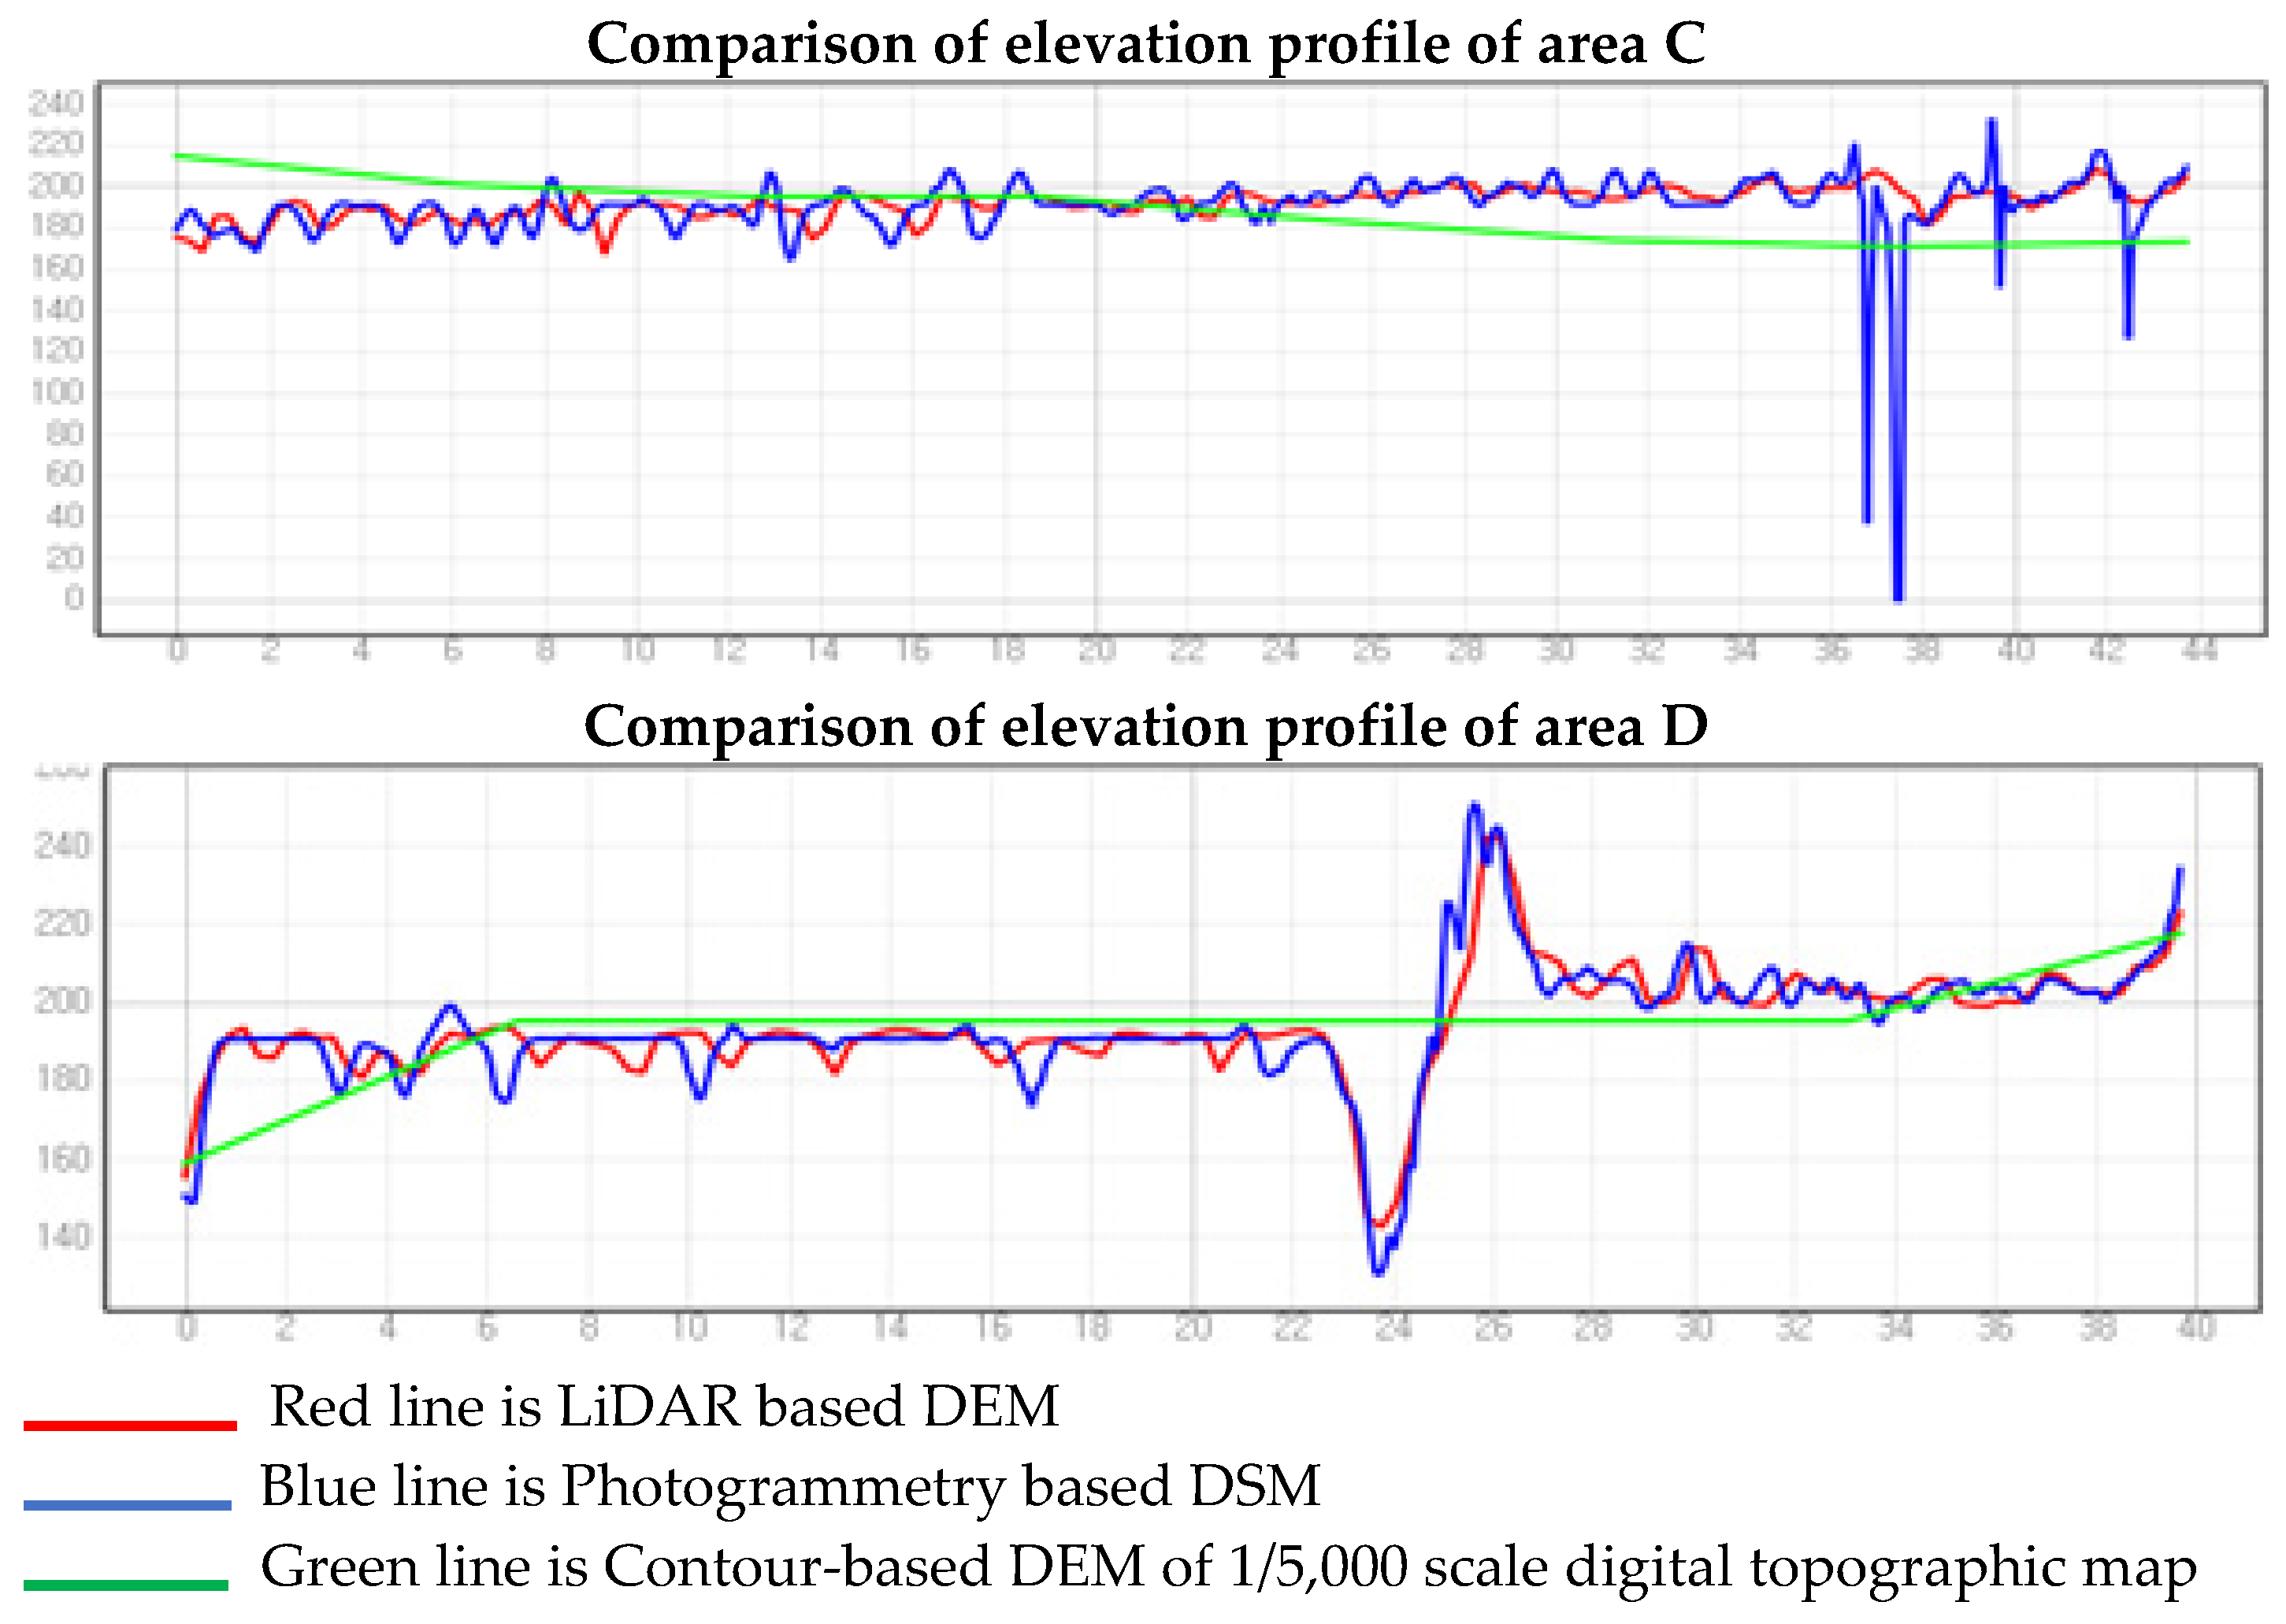
Figure 11.
Comparison of doline delineations on two data types: (a) UAV LiDAR DEM, (b) DSM from photogrammetry and black color: true doline, gray color: false doline.
Figure 11.
Comparison of doline delineations on two data types: (a) UAV LiDAR DEM, (b) DSM from photogrammetry and black color: true doline, gray color: false doline.
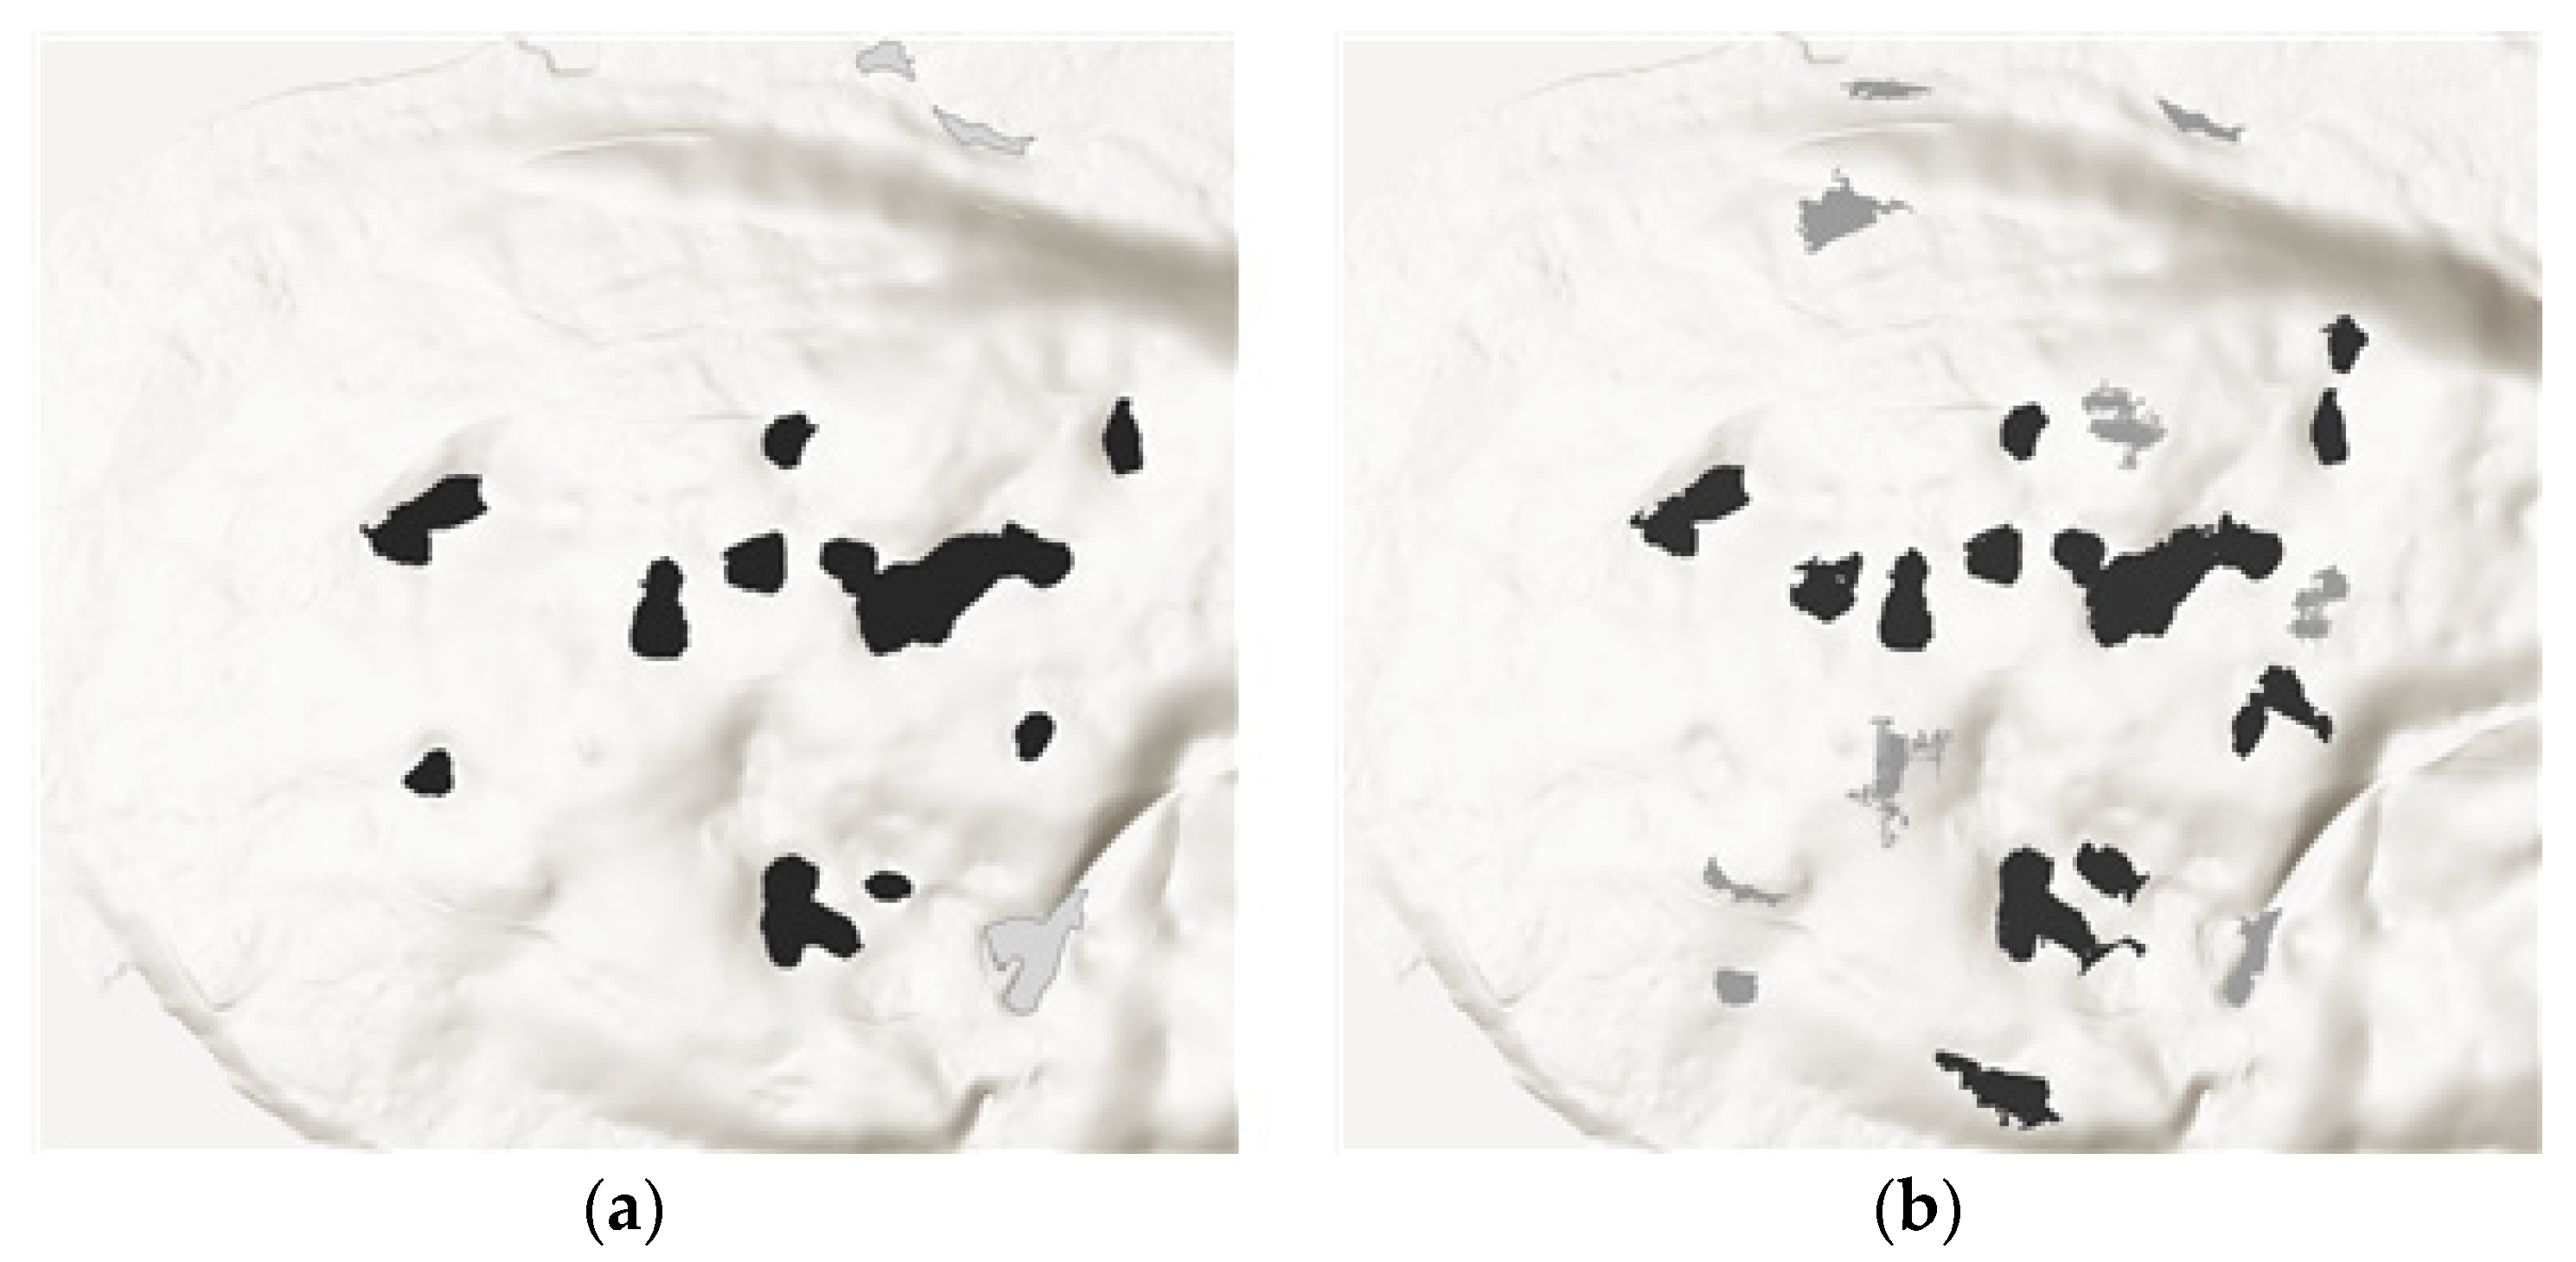

Table 1.
LiDAR payload parameters settings.
| Category | Parameter |
|---|---|
| Return Mode | Penta returns |
| Sampling Rate | 240KHz |
| Scanning Mode | Repetitive |
| Altitude | 80m~150m |
| Side overlap | 50% |
| Camera angle | -90 |
Table 2.
UAV based mobile mapping system.
| Matrice 300 RTK | Zenmuse L2 |
|---|---|
| RTK accuracy H: 0.1m V: 0.15m | Ranging accuracy 2cm@150m |
| Hovering accuracy H:0.1m V:0.1m | Max returns supported 5 |
| Maximum flight time 55min | Min detection range 3m |
| GPS, GLONASS, BeiDou, Galileo | Laser spot size H:4cm V:12cm |
 |
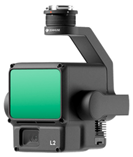 |
Table 3.
Flight configuration for LiDAR scanning in study site.
| Category | Parameter |
|---|---|
| Altitude | Horizontal flight 100m |
| Speed | 7.5 m/s |
| Scanning mode | Repetitive scanning |
| Side overlap ratio | 50% |
| Camera angle | -90 |
Table 4.
Flight configuration for photogrammetry in study site.
| Category | Parameter |
|---|---|
| Date | 2024-06-10 |
| Image quantity | 830 |
| Average flight altitude | 131.09m |
| Area covered | 1.012㎢ |
| Average GSD | 3.92cm/pix |
Disclaimer/Publisher’s Note: The statements, opinions and data contained in all publications are solely those of the individual author(s) and contributor(s) and not of MDPI and/or the editor(s). MDPI and/or the editor(s) disclaim responsibility for any injury to people or property resulting from any ideas, methods, instructions or products referred to in the content. |
© 2024 by the authors. Licensee MDPI, Basel, Switzerland. This article is an open access article distributed under the terms and conditions of the Creative Commons Attribution (CC BY) license (http://creativecommons.org/licenses/by/4.0/).
Copyright: This open access article is published under a Creative Commons CC BY 4.0 license, which permit the free download, distribution, and reuse, provided that the author and preprint are cited in any reuse.


