
Submitted:
08 November 2024
Posted:
08 November 2024
You are already at the latest version
Abstract
Accurate estimation of Digital Elevation Models (DEMs) derived from satellite data is critical for numerous environmental applications. This study evaluates the accuracy and reliability of two satellite-derived elevation models, ALOS World 3D and SRTM DEMs, specifically for their application in hydrological modeling. A comparative analysis with Terrestrial Laser Scanning (TLS) measurements assessed the agreement between these datasets. Results indicate significant correlations between satellite DEMs and TLS measurements, with adjusted R-square values of 0.8478 for ALOS and 0.955 for SRTM. To quantify the average difference, root mean square er-ror (RMSE) values were calculated as 10.43 m for ALOS and 5.65 m for SRTM. Additionally, slope and analyses highlighted terrain characteristics across DEMs. Slope analysis revealed a strong negative correlation between SRTM and TLS slopes (p < 4.47e-10), while no significant correlation was found between ALOS and TLS slopes. Aspect analysis showed significant posi-tive correlations for both ALOS and SRTM with TLS aspect, capturing 30.21% of the variance. These findings demonstrate the accuracy of satellite-derived elevation models in representing terrain features relative to high-resolution terrestrial data.
Keywords:
satellite-derived elevation models
; terrestrial laser scanning (TLS)
; Spatial data validation
; topographic data
1. Introduction
Digital Elevation Models (DEMs) represent a fundamental component of geospatial data, providing critical insights into the Earth's surface topography [15] These models offer a comprehensive view of our planet's terrain, from towering mountains to sprawling valleys and intricate water bodies [6]. The applications of DEMs are far-reaching, spanning from land use planning and natural resource management to environmental modeling [7]. To acquire DEM data, satellite-derived products have become a widely utilized resource due to their large area coverage and spatial resolution capabilities. However, it is crucial to recognize that the accuracy of these satellite-derived products can fluctuate considerably due to several factors [11]. These factors encompass sensor characteristics, atmospheric conditions, and processing algorithms, all of which can influence the quality of the data utilized in hydrological modeling [7].
One notable limitation of satellite sensors is their spatial resolution, coupled with their susceptibility to atmospheric interference [3]. Satellite-based remote sensing relies on capturing reflected or emitted electromagnetic radiation from the Earth's surface.
Nonetheless, this process can be impacted by factors such as cloud cover, atmospheric conditions, and the sensor's spatial resolution [8]. Consequently, the DEM data derived from satellites may exhibit lower accuracy and resolution when compared to ground-based measurements. Despite these inherent limitations, satellite sensors offer a range of invaluable advantages [14]. They provide extensive coverage and repetitive observations, rendering them ideal for large-scale assessments and long-term monitoring efforts. These characteristics make satellite-derived products particularly valuable for the study and monitoring of environmental changes over vast geographical areas.
The Shuttle Radar Topography Mission (SRTM) and the Advanced Land Observation Satellite (ALOS) stand as exemplary instances of satellites that have significantly contributed to the collection of topographic data [4]. The Shuttle Radar Topography Mission (SRTM) was a groundbreaking NASA-led international effort in February 2000 to acquire elevation data of the Earth's surface using synthetic aperture radar (SAR) technology. A specially modified radar system was deployed aboard the Space Shuttle Endeavour for this mission [12]. The SRTM utilized radar instruments, namely the Spaceborne Imaging Radar-C (SIR-C) and the X-band Synthetic Aperture Radar (X-SAR), to transmit radar signals to Earth's surface. SRTM elevation models are widely used in geographic information systems (GIS) and are easily accessible for download, bolstered by support from various software platforms, making them a preferred choice for elevation analysis and mapping in both academic and professional contexts [4].
Another satellite that has played a pivotal role in the collection of topographical data is the Advanced Land Observation Satellite (ALOS). Launched on January 24, 2006, by the Japan Aerospace Exploration Agency (JAXA), ALOS was equipped with an array of sensors and instruments designed to gather comprehensive data on the Earth's surface. These instruments included the Digital Surface Model (DSM), Multi-look Scan-SAR (MSK), Land Surface Temperature (LST), High Dynamic Range (HDR), Original Image (ORI), and Calibrated Radiometric Image (CCI), enabling scientists to capture a wealth of information about the Earth's surface, including elevation data, temperature measurements, and high-quality images [15]. ALOS operated successfully for five years until it encountered an anomaly in power generation, leading to its termination on May 12, 2011, as reported by Short [16]. Nevertheless, approximately 6.5 million scenes of archived data from ALOS remain available, covering the entire globe and serving as a valuable resource for various geospatial applications. ALOS furnished critical information on elevation, captured wide-area images, measured land surface temperatures, and provided images with a broader range of brightness levels [21].
In accordance with Zhang [20], an effective method for enhancing the precision of satellite-derived products involves the integration of Terrestrial LIDAR (Light Detection and Ranging) measurements. TLS technology operates based on the principle of time-of-flight measurement, as explained by Suchocki [18]. The scanner emits a laser beam and measures the time taken for the beam to travel to the scanned object and return to the scanner. Utilizing the speed of light and time-of-flight measurement, the distance between the scanner and the object can be calculated. To scan the object, TLS devices typically incorporate a rotating mirror that directs the laser beam at various angles, allowing the scanner to gather data from multiple viewpoints [18]. The sensor within the scanner assesses the intensity of the laser beam as it reflects off the object, facilitating the creation of a point cloud that represents the object's surface [14]. One of the notable advantages of Terrestrial LIDAR is its ability to capture highly precise and dense data points, enabling detailed representations of vegetation structure [18].
According to Niță [10] Several of the Time-of-Flight Laser Scanning (TLS) laser pulses generated by the LIDAR sensor facilitate the direct quantification of the spatial separation between the sensor and surrounding objects. However, most of these pulses yield singular return data. Most of the terrestrial perspective scanners are returned by the ground, and this can be utilized to derive high-resolution Digital Elevation Models (DEM) that capture intricate topographic features of the Earth's surface [2]. By comparing measurements obtained from LIDAR with satellite-derived products, scientists can identify inconsistencies, refine input data, and enhance the reliability of hydrological simulations [5].
While previous studies have documented the general accuracy of satellite DEMs, specific challenges related to their precision across varied topographic features and environmental conditions remain unaddressed. Additionally, the sources of error and bias inherent to different satellite products have not been comprehensively analyzed. This study addresses these gaps by focusing on precision discrepancies across topographical features and evaluating sources of error using terrestrial LIDAR data as a ground-truth reference.
This research is dedicated to evaluating the precision of satellite-derived Digital Elevation Model (DEM) products through a comparative analysis with terrestrial LIDAR measurements. This study pursues a dual objective: firstly, to assess the accuracy of the satellite-derived products by examining their alignment with terrestrial LIDAR data, and secondly, to identify potential sources of error or bias within the satellite-derived datasets. Additionally, this study seeks to explore the variability in DEM accuracy across different topographical features.
The integration of ground-truth measurements obtained through terrestrial LIDAR serves as a crucial reference point for the validation and calibration of satellite-derived Digital Elevation Model (DEM) data. By systematically identifying and quantifying discrepancies between these datasets, the study enhances the precision of satellite-derived inputs essential for hydrological modeling. This refined approach not only improves landscape representation and model reliability but also supports more accurate predictions and decisions in critical applications such as water resource management, flood forecasting, and ecosystem analysis.
2. Materials and Methods
2.1. Study Area and Data Sources
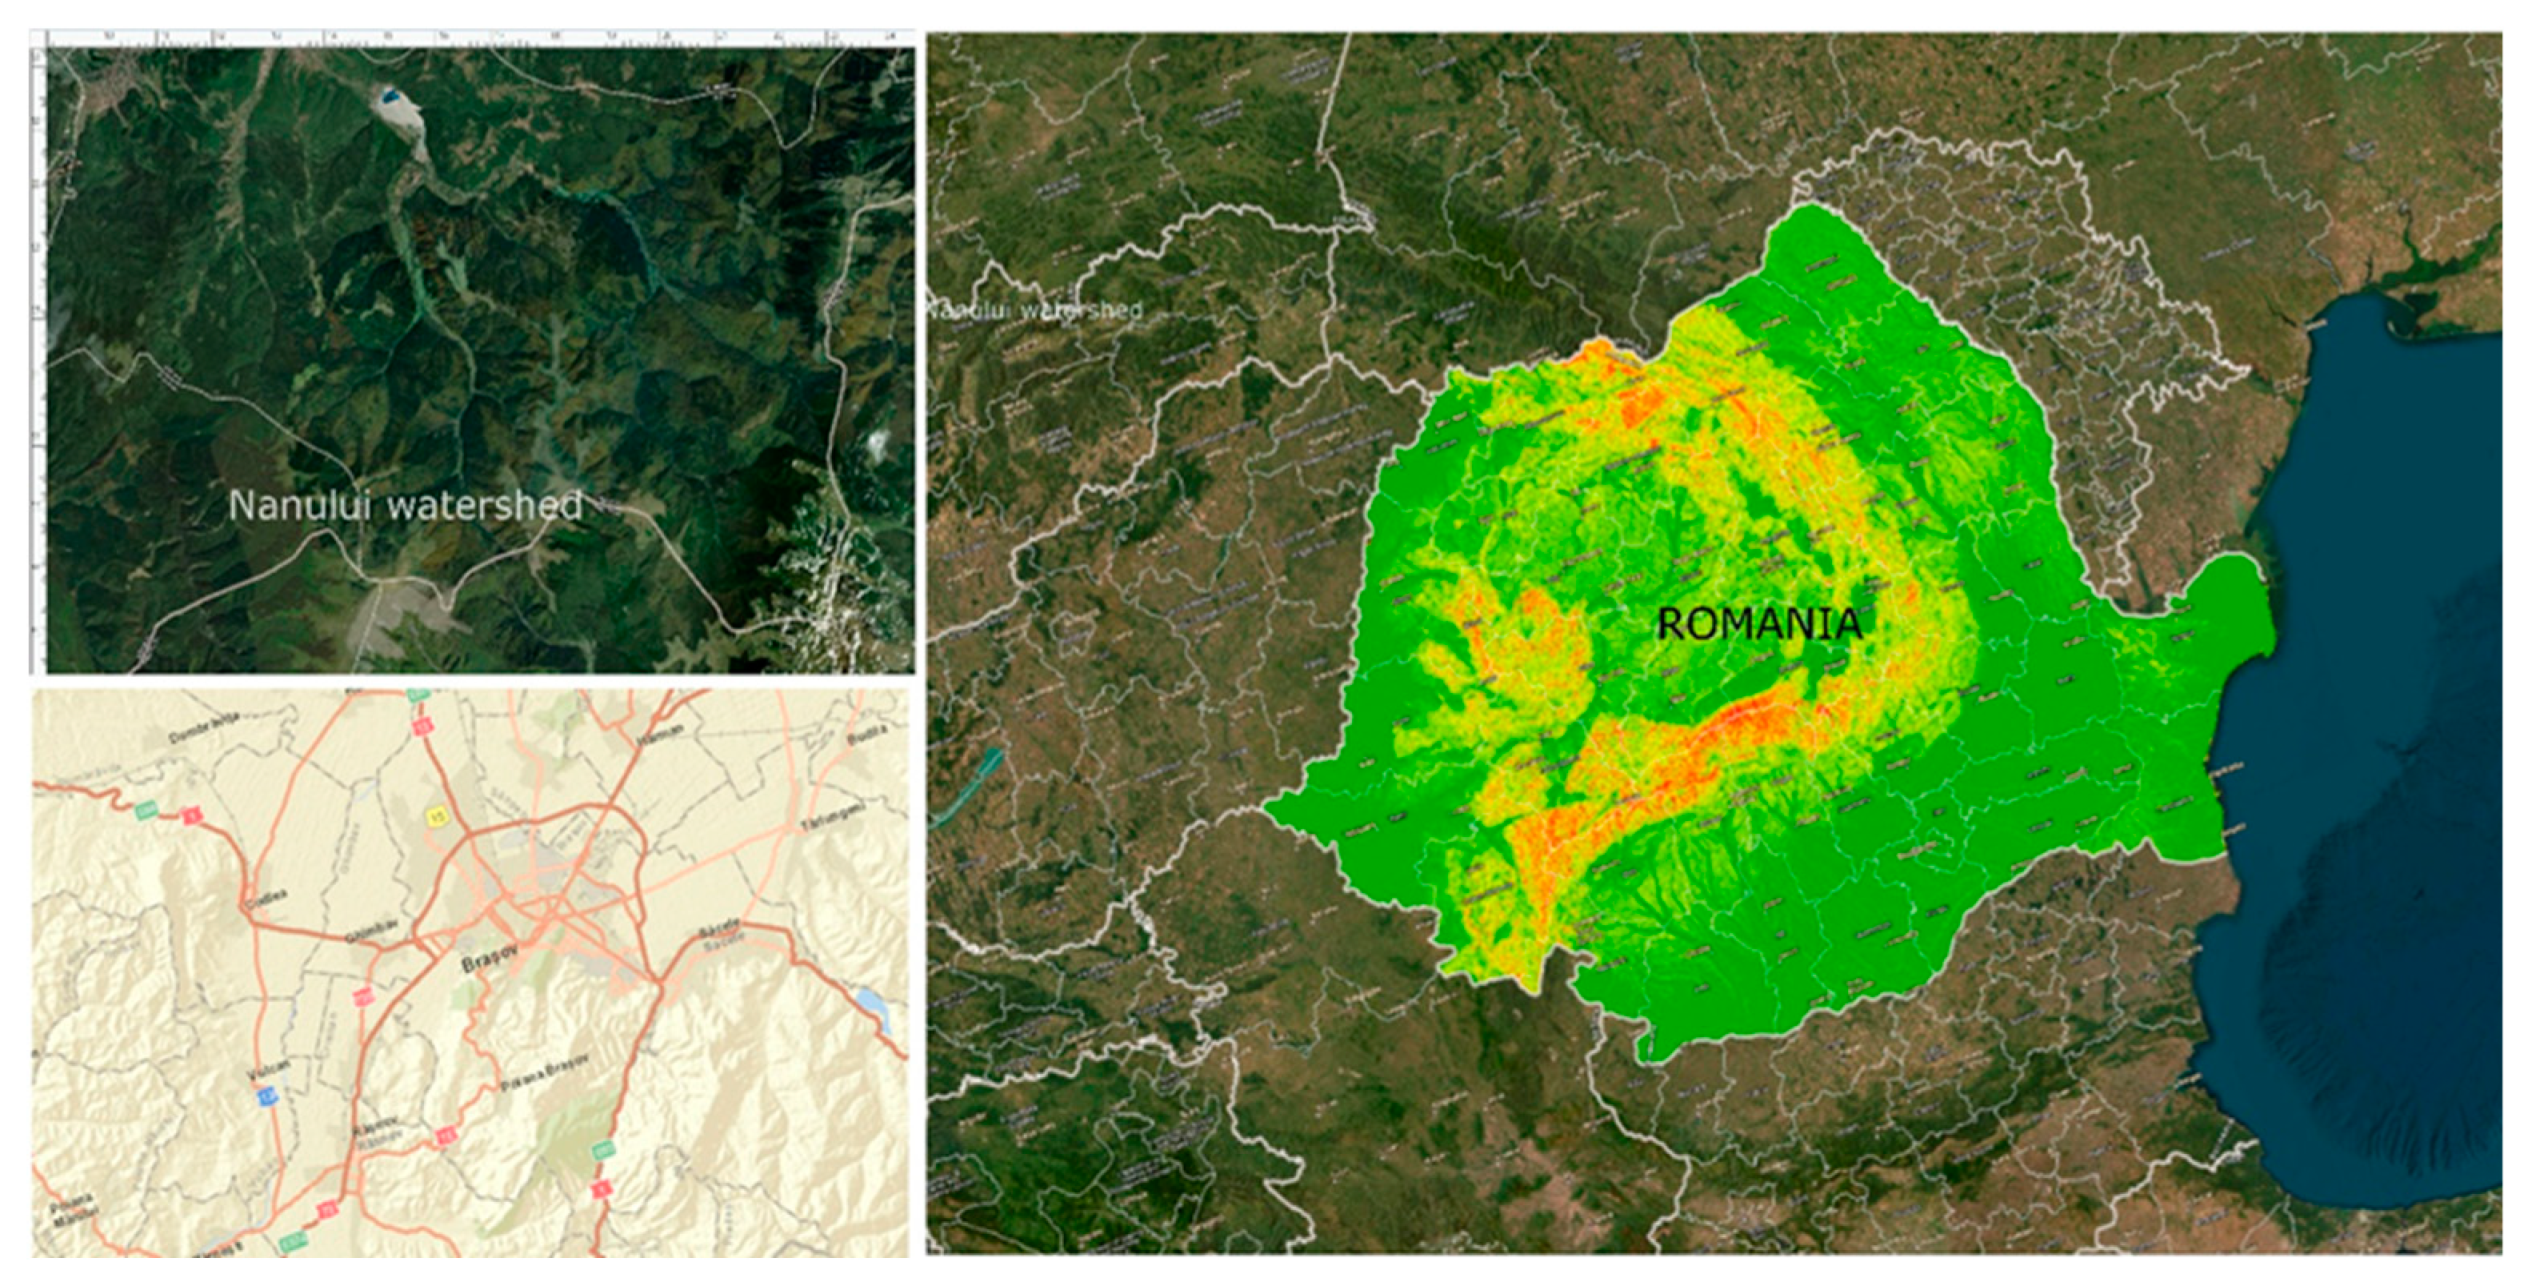
The study area for this research is the Nanului watershed, located in the central part of Romania near the city of Brașov (EPSG 3844). The Nanului watershed is characterized by a densely forested mountainous region, featuring steep hills and narrow valleys. Terrestrial LIDAR measurements were systematically collected across the study area from July to October 2022 using the GeoSLAM Horizon scanner. The scanner operates based on the principle of emitting laser pulses and measuring the time it takes for them to bounce back from objects in the environment. Equipped with a rotating mirror, the scanner scans a full 360-degree field of view, emitting laser pulses in all directions and capturing the reflections with its sensors. As the scanner moves through the environment, it continuously collects and processes data, generating a real-time 3D map using SLAM technology. The terrestrial LIDAR dataset achieved a point density of approximately 1,500 points per square meter, which was used to generate a Digital Elevation Model (DEM with a spatial resolution of 1 meter) using bilinear interpolation method.
Figure 1.
Geographical location of the study area.
2.2. Assessment of Satellite-Derived Terrain Data
In this study, the methodology focused on assessing the accuracy of ALOS World 3D and SRTM Digital Elevation Models (DEMs) in representing terrain features by comparing them with high-resolution Terrestrial Laser Scanning (TLS) data (Figure 2). Both the SRTM and ALOS DEMs were processed at a consistent 30-meter resolution using Google Earth Engine (GEE). After clipping each DEM to the study area, slope analysis was conducted to calculate the slope values for each pixel, offering insights into terrain steepness. To maintain spatial consistency, a pixel size of 10 units was used throughout the analysis. Additionally, aspect analysis was performed on the clipped DEMs within GEE, generating aspect values for each pixel. This aspect layer provided the compass directions of the slopes in degrees, enhancing understanding of the orientation and exposure of landforms and supporting a comprehensive interpretation of surface characteristics.
2.3. Terrain Data Visualization and Grid-Based Analysis
To enhance the visualization of Digital Elevation Model (DEM), slope, and aspect layers, specific parameters were defined. For DEM visualization, minimum and maximum elevation values were set to 0 and 4000, respectively, to accurately represent the elevation range. Slope visualization utilized a range of 0 to 90 for minimum and maximum values, with a color palette transitioning from black to white to effectively represent slope gradients. Aspect visualization employed a range of 0 to 360, covering the full compass circle. Following the outlined data processing and analysis steps, the subsequent phase involved further analysis and extraction of pertinent information from the processed DEM, slope, and aspect layers. Additional software tools, including Grass GIS and QGIS, were employed in this phase.
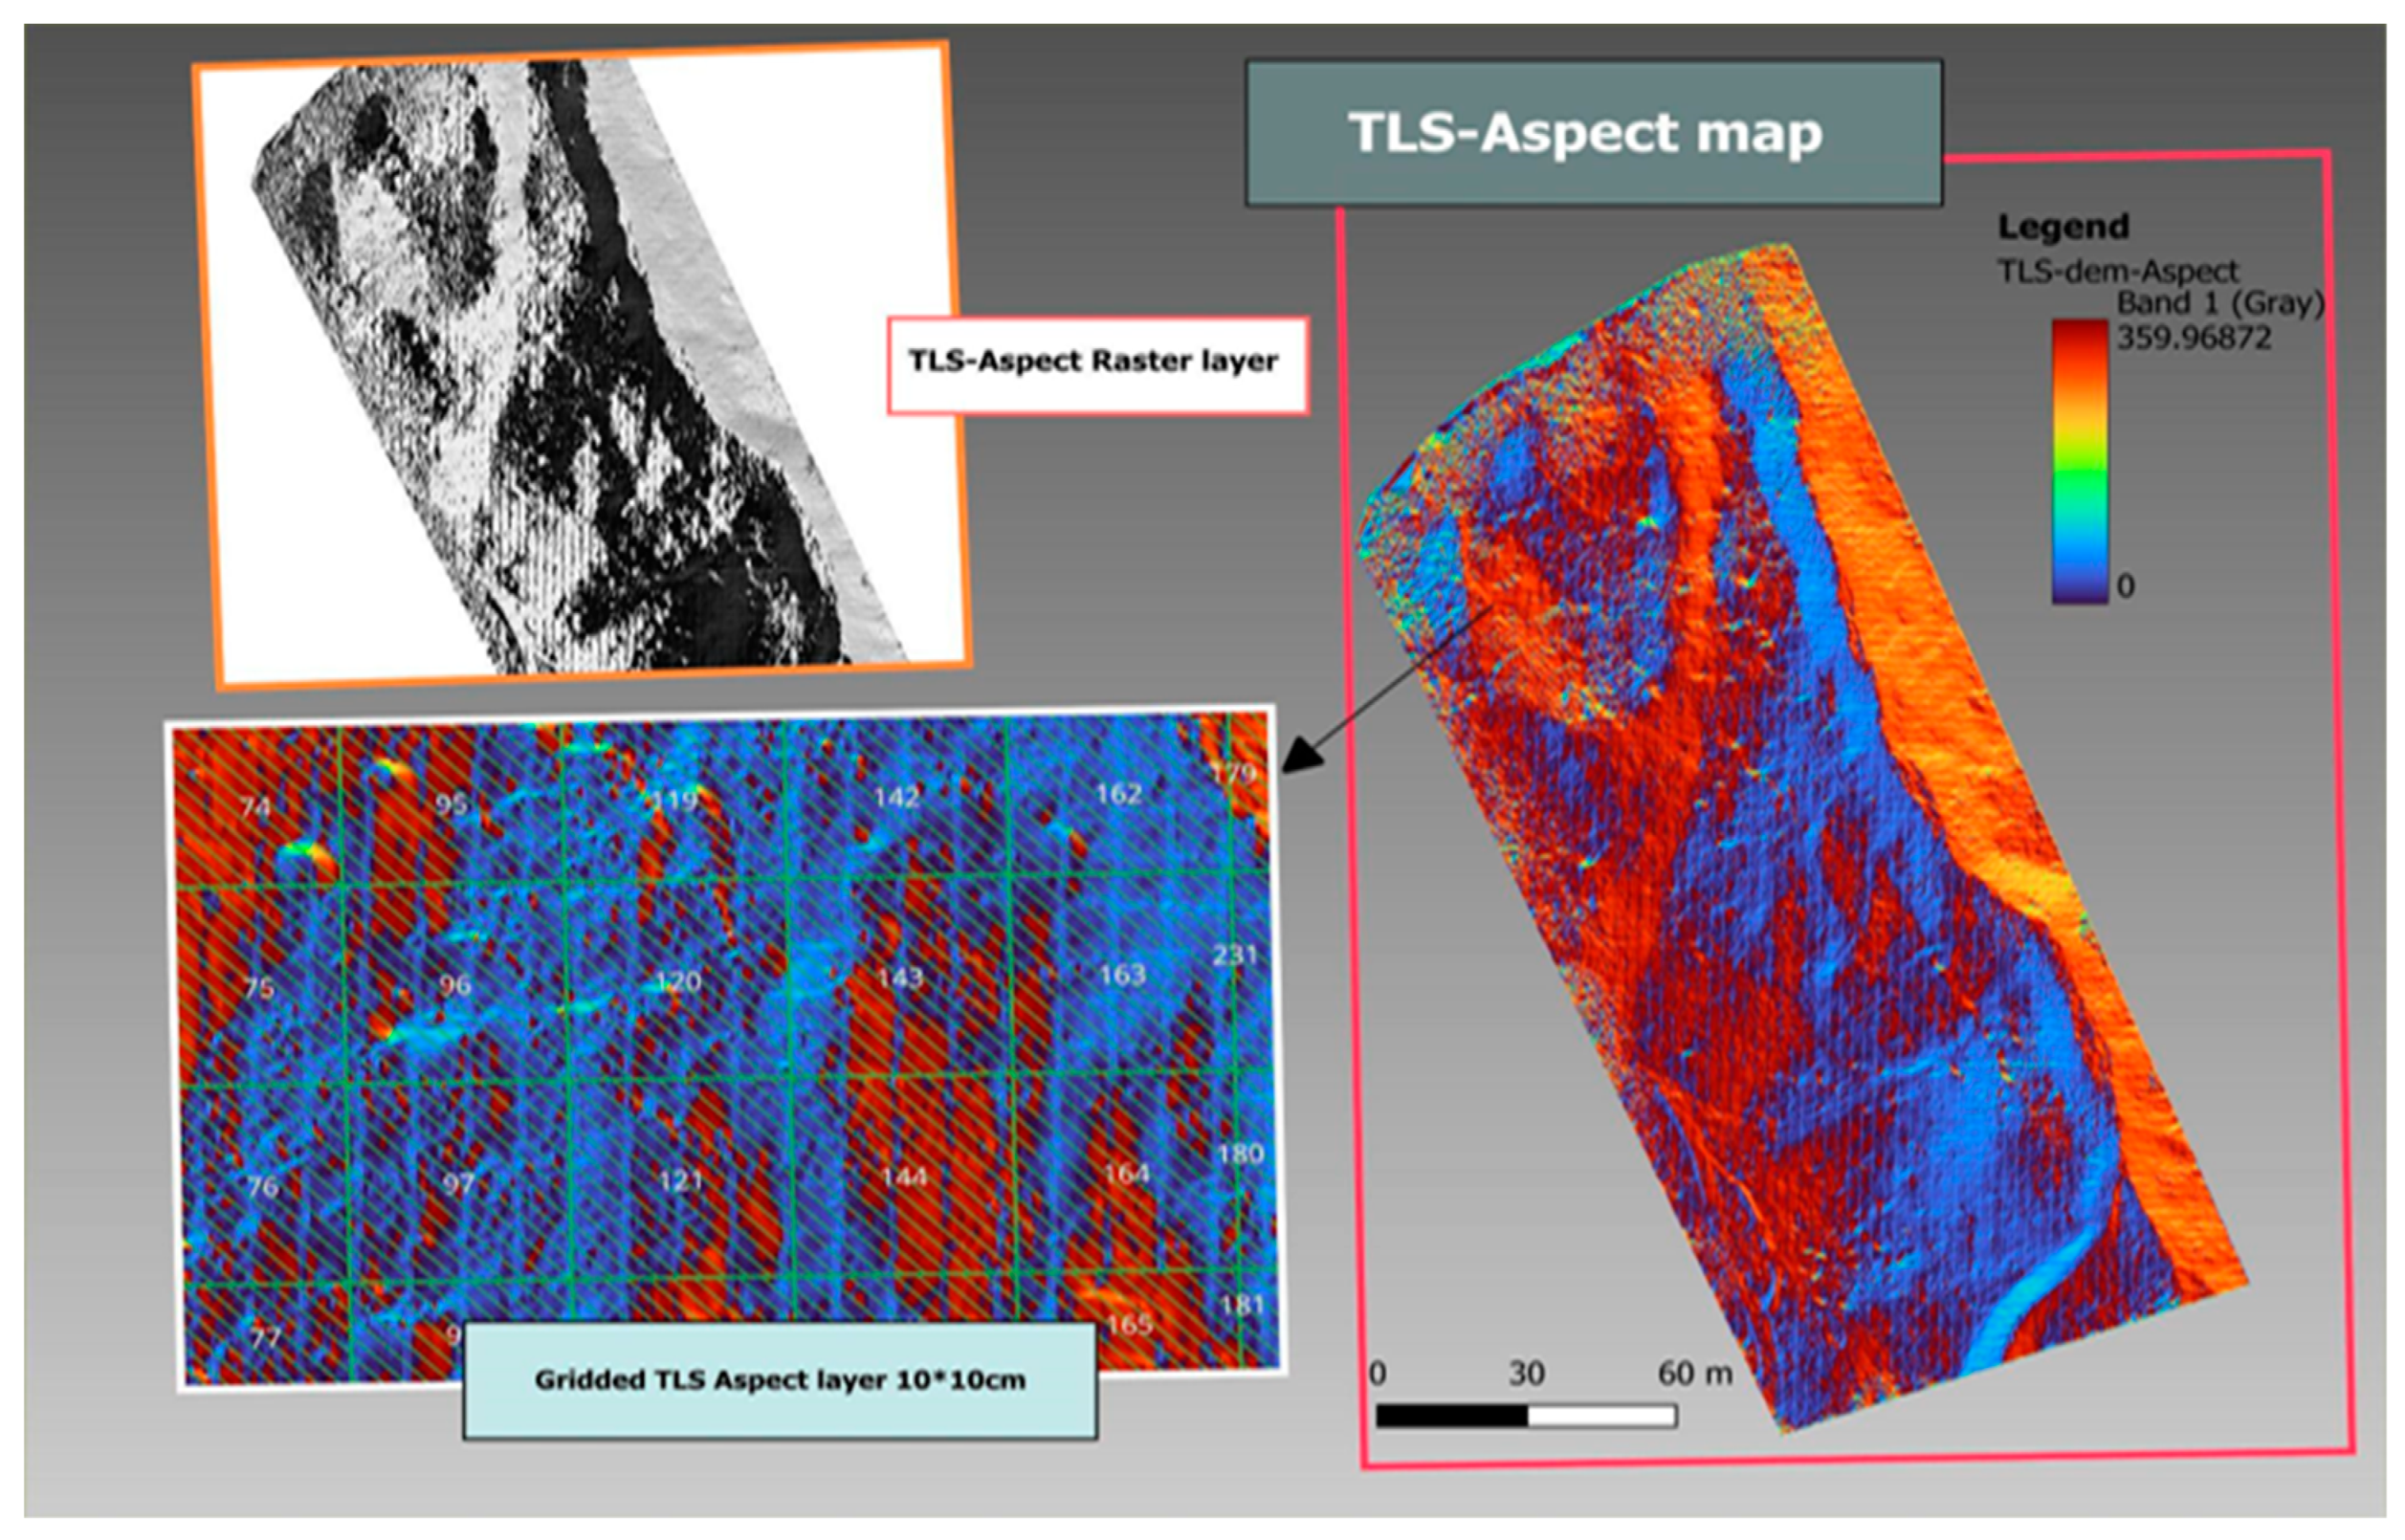
For effective dataset analysis and comparison, a grid-cell-based approach was employed using QGIS. The study area was divided into 231 grid cells, each measuring 10 by 10 units. Within each grid cell, Grass GIS was utilized to estimate slope and aspect values based on TLS point cloud data. The raster's specific projection was considered, and bilinear resampling was applied to the satellite product for accuracy. To compare terrain characteristics across different regions, mean values of TLS, ALOS, and SRTM data were extracted within each grid cell using the "Statistic by Category" functionality (Figure 5), (Figure 6), and (Figure 7). This extraction process provided statistical summaries, including mean, minimum, maximum, and standard deviation, representing general landscape features in each region.
3. Results
3.1. Regression Analysis Highlights
We initiated our investigation by conducting multiple linear regression analyses to establish the relationship between TLS elevation and the elevation values obtained from the SRTM and ALOS datasets. The results were striking both SRTM and ALOS elevation values exhibited a significant relationship with TLS elevation, as confirmed by highly significant p-values (p < 2.2e-16). Moreover, the coefficients for SRTM and ALOS were estimated, further quantifying this relationship. The adjusted R-squared value for the regression model was 0.955, underscoring the strong correlation between the satellite-derived products and TLS measurements. Additionally, the residual standard error was computed to be 5.688 meters, providing insights into the average difference between predicted and actual TLS elevation values.
3.2. Individual Dataset Assessments
To gain a deeper understanding of the individual relationships between TLS elevation and each satellite-derived product (ALOS and SRTM), separate linear regression analyses were performed. These analyses revealed that both ALOS and SRTM exhibited strong relationships with TLS elevations, substantiated by high adjusted R-squared values (0.8471 for ALOS and 0.955 for SRTM). The root mean square error (RMSE) was also calculated, with ALOS yielding 10.4346 and SRTM producing 5.6520. These RMSE values provided valuable insights into the average differences between the satellite-derived products and TLS measurements, further aiding in the assessment of accuracy.
3.3. Comparing Elevation Datasets
In addition to individual assessments, we conducted a comparative analysis of TLS elevation against each satellite-derived product separately (Figure 3). The results were enlightening, indicating significant differences among the three datasets (SRTM, ALOS, and TLS) based on a one-way ANOVA test (F = 30.95, p = 1.35e-13). These findings emphasized notable variations in elevation values among the different datasets.
However, to address the inherent limitations and biases of each individual dataset, we pursued a second analysis by integrating the SRTM and ALOS datasets to enhance spatial coverage and elevation consistency before slope and aspect analyses. This approach mitigated the limitations and biases of each dataset by combining their independent elevation sources, allowing for a more comprehensive and accurate representation of the terrain. Furthermore, the merged DEM offered enhanced precision by filling gaps present in individual datasets and accommodating variations in resolution and terrain coverage, resulting in a more detailed and complete elevation model for comprehensive analysis. This merged dataset provided a statistically significant improvement in terrain representation, as shown by the one-way ANOVA test (F = 22.34, p = 2.76e-06), underscoring the advantages of merging these datasets (Figure 3).
3.4. Statistical Analysis of Slope and Aspect Datasets
Moving beyond elevation, the analysis extended to the comparison of slope measurements. The model equation was defined as
TLS slope = 45.27900 + 0.07717 * ALOS slope - 0.89719 * SRTM slope.
The coefficients for the model revealed that SRTM slope had a significant negative effect on TLS slope (t = -6.52, p = 4.47e-10), highlighting SRTM’s capability to capture broader slope trends, even with coarser resolution, while ALOS slope did not show a statistically significant relationship with TLS slope (t = 0.52, p = 0.603), suggesting limitations in detecting finer-scale terrain variations in steeper regions. The intercept term was estimated to be 45.27900 (p < 2e-16), indicating its significance. The overall model fit was evaluated using the adjusted R-squared value of 0.1513, suggesting that the independent variables explained approximately 15.13% of the variation in TLS slope. The F-statistics of 21.5 with a p-value of 2.803e-09 confirmed the overall significance of the model. Consequently, based on these findings, it can be concluded that SRTM slope is a significant predictor of TLS slope, while ALOS slope does not have a significant relationship with TLS slope in this analysis (Figure 4) (Figure 5).
In terms of aspect, the results revealed that both the ALOS aspect and the SRTM aspect had significant effects on the TLS aspect (Figure 6) (Figure 7). The estimated coefficient for the ALOS aspect was 0.24047, with a t-value of 7.513 and a p-value of 1.30e-12, indicating a strong positive relationship. Similarly, the coefficient for the SRTM aspect was estimated as 0.13403, with a t-value of 3.017 and a p-value of 0.00285, indicating a statistically significant positive relationship. The intercept term had an estimated value of 79.56435, with a t-value of 6.422 and a p-value of 7.72e-10, demonstrating its significance. The overall model fit was assessed using the adjusted R-squared value of 0.3021, indicating that the independent variables explain approximately 30.21% of the variation in the TLS aspect. Furthermore, the F-statistics of 50.79 with a p-value of less than 2.2e-16 confirmed the overall significance of the model.
3.5. Figures and Tables
Figure 8.
Comparison of satellites (SRTM and ALOS) with terrestrial LIDAR measurements (TLS) (a) elevation values; (b) slope values; and (c) aspect values for comparison of each model.
Figure 8.
Comparison of satellites (SRTM and ALOS) with terrestrial LIDAR measurements (TLS) (a) elevation values; (b) slope values; and (c) aspect values for comparison of each model.
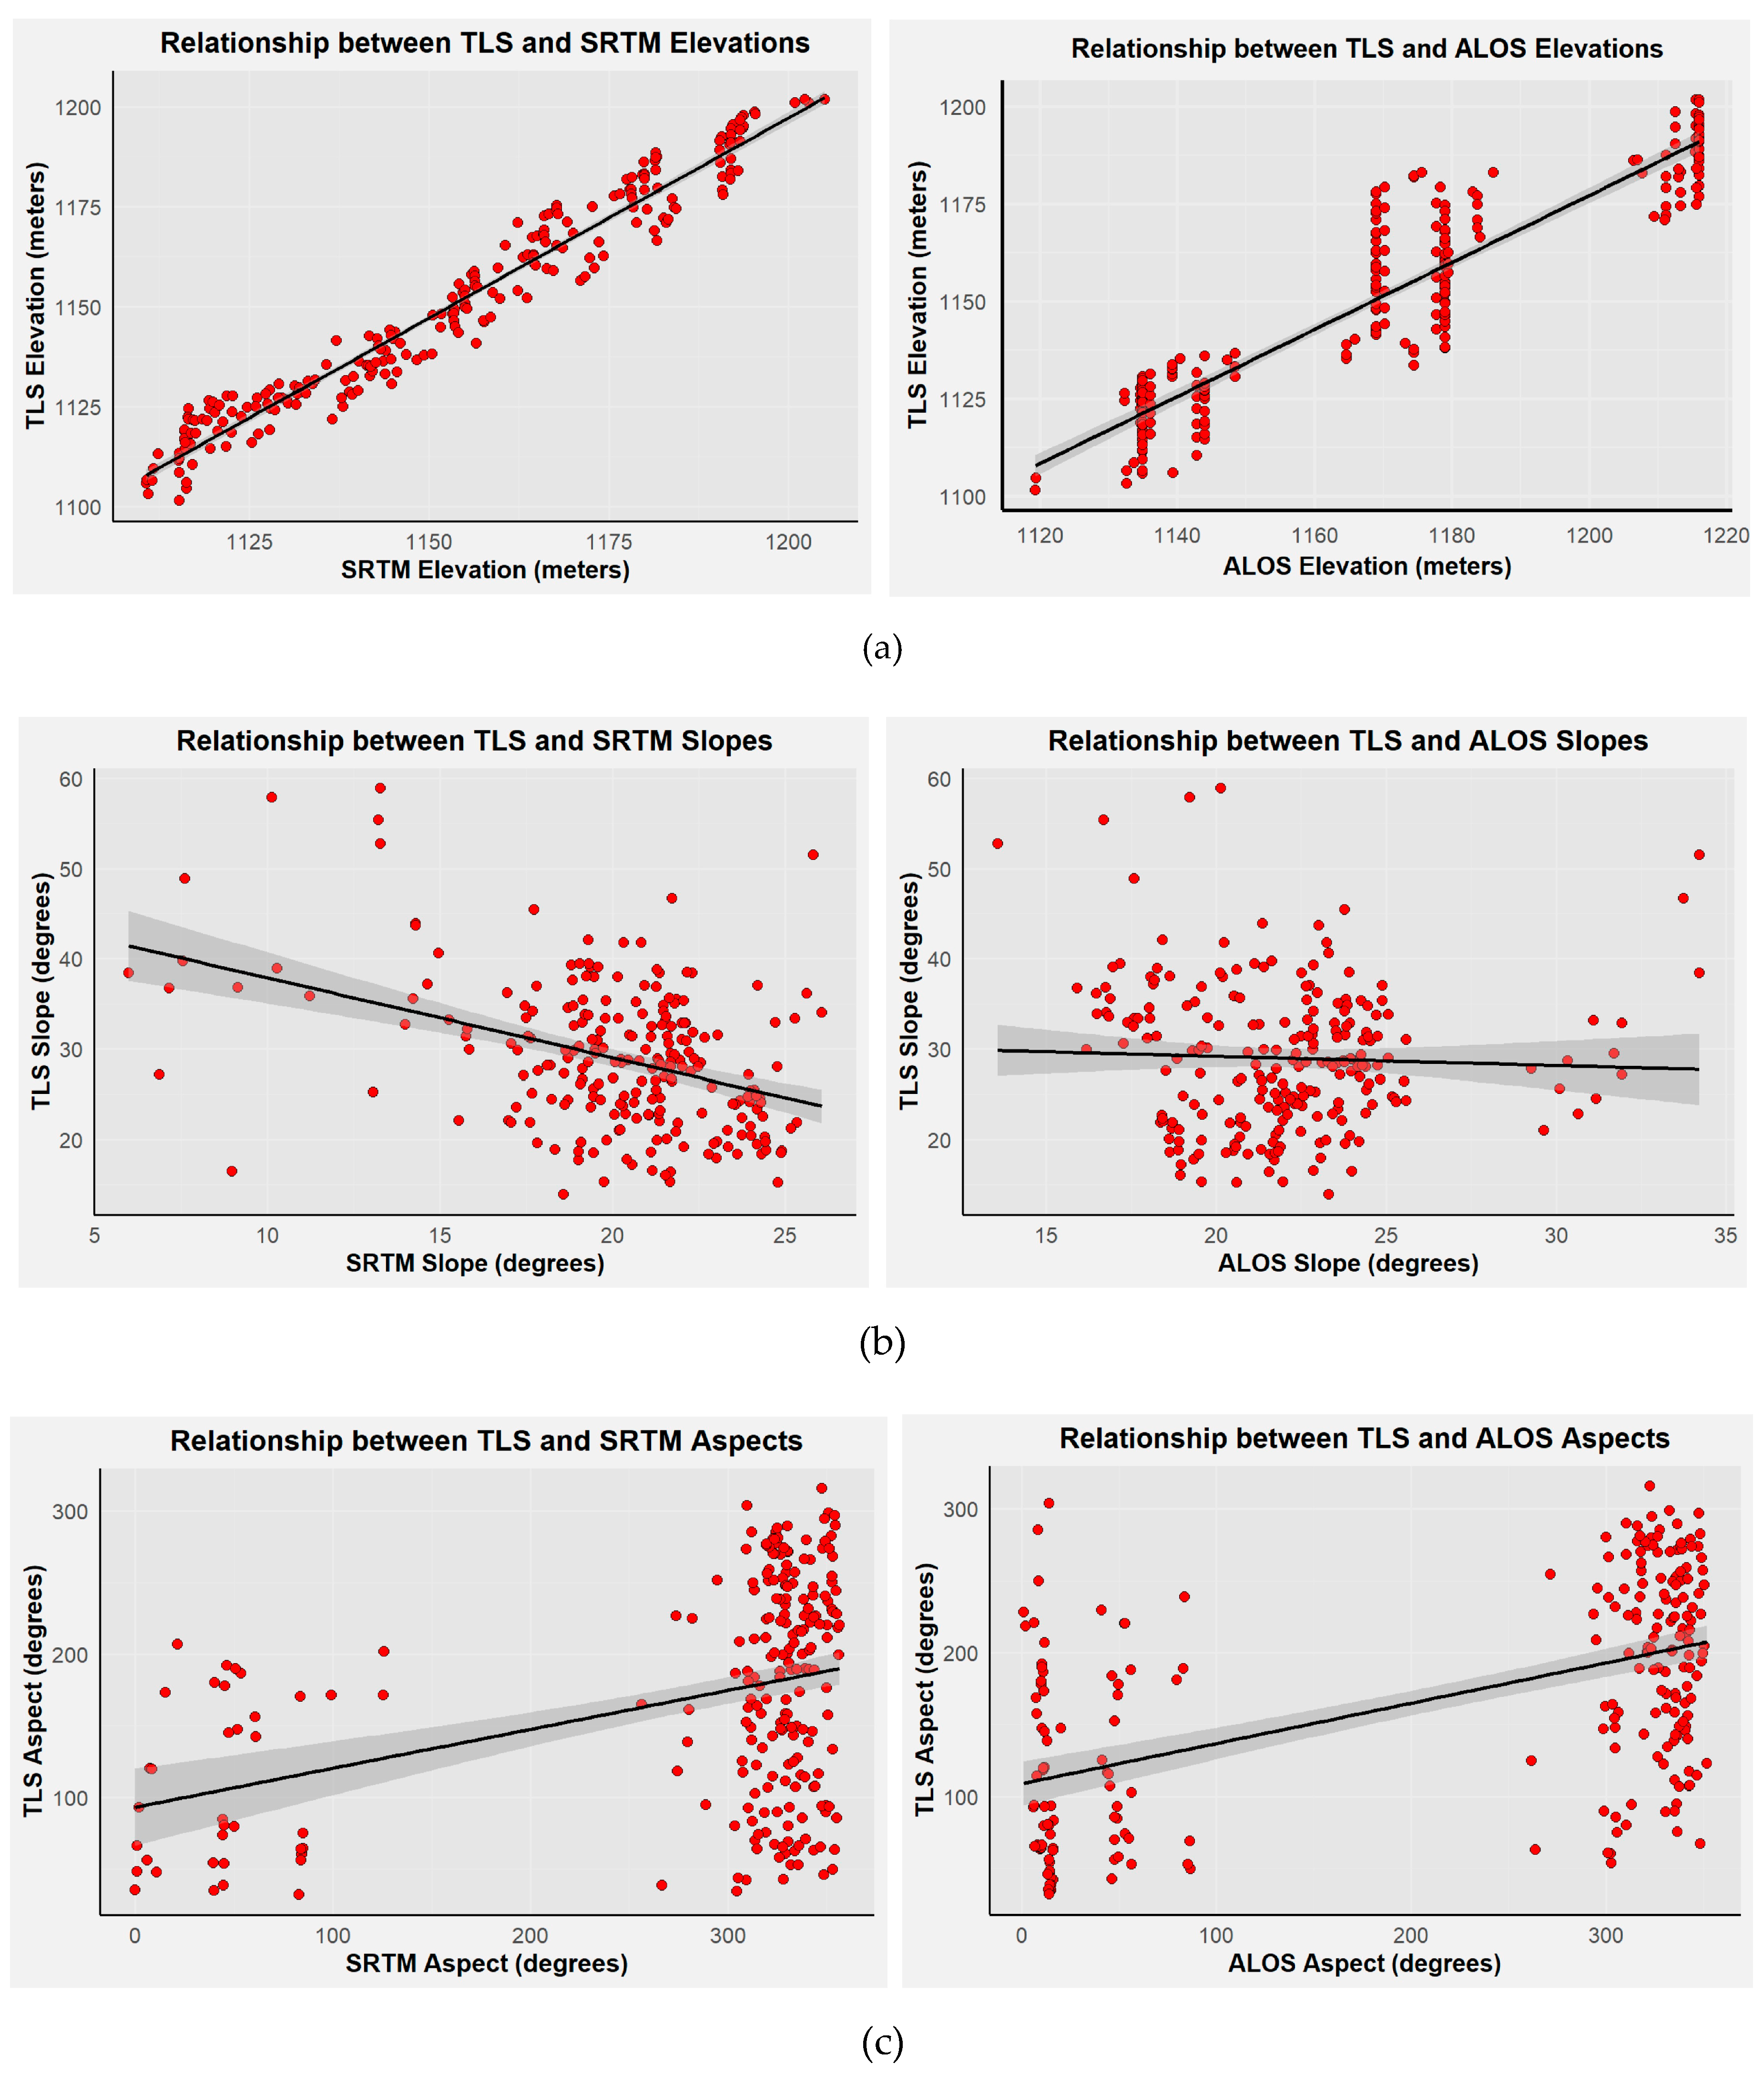

Table 1.
Comparison of Elevation Models: TLS vs SRTM and ALOS.
| Model | R (Multiple R-squared) | P value | RMSE |
|---|---|---|---|
| TLS elevation ~ ALOS elevation | 0.8478 | < 2.2e-16 (*** indicates highly significant) | 10.48 |
| TLS elevation ~ SRTM elevation | 0.955 | < 2.2e-16 (*** indicates highly significant) | 5.688 |
| TLS slope ~ ALOS slope | 0.001771 | 0.5245 (not significant) | 7.991 |
| TLS slope ~ SRTM slope | 0.1576 | 3.823e-10 (*** indicates highly significant) | 7.341 |
| TLS aspect ~ ALOS aspect | 0.2806 | < 2.2e-16 (*** indicates highly significant) | 65.54 |
| TLS aspect ~ SRTM aspect | 0.1369 | 6.586e-09 (*** indicates highly significant) | 71.79 |
Table 2.
Statistical summary of the three models' elevation values.
| Elevation | Min | Max | Range | Sum | Mean | SD | Sum of squares |
|---|---|---|---|---|---|---|---|
| TLS | 1096 | 1207 | 110 | 729085112 | 1150.862 | 27.573 | 481671195 |
| SRTM | 1110 | 1208 | 98 | 561433 | 1155.211 | 27.844 | 376035.17 |
| ALOS | 1115 | 1218 | 103 | 568018 | 1168.761 | 30.516 | 451668.31 |
Table 3.
Statistical summary of the three models' aspect values.
| Aspect | Min | Max | Range | Sum | Mean | SD | Sum of squares |
|---|---|---|---|---|---|---|---|
| TLS | 0 | 359.99 | 359.99 | 11010470 | 175.02 | 144.8 | 1320651,49 |
| SRTM | 0 | 356.97 | 356.97 | 138335 | 284.63 | 108.5 | 5718039.34 |
| ALOS | 0 | 354.18 | 354.18 | 29536672 | 247.19 | 131.6 | 2021837,73 |
Table 4.
Statistical summary of the three models' slope values.
| Aspect | Min | Max | Range | Sum | Mean | SD | Sum of squares |
|---|---|---|---|---|---|---|---|
| TLS | 0.01 | 89.7 | 89.6 | 18494101 | 29.39 | 12.4 | 973378 |
| SRTM | 3.69 | 30.1 | 26.4 | 9951.53 | 20.47 | 4.68 | 10647 |
| ALOS | 0.49 | 45.2 | 44.7 | 10923.47 | 22.47 | 6.57 | 20955 |
4. Discussion
Our study aimed to assess accuracy in satellite Digital Elevation Models (DEMs) by utilizing high-resolution Light Detection and Ranging (LIDAR) data for terrain modeling. Our primary objective was to identify and evaluate discrepancies between satellite-derived elevation data and LIDAR measurements, providing valuable insights into the accuracy of elevation correlation. Through regression analysis, we observed a strong and statistically significant correlation between elevation values derived from SRTM and ALOS datasets in comparison to Terrestrial Laser Scanning (TLS) measurements. The obtained coefficients, featuring highly significant p-values, underscored the reliability of this correlation. In the upcoming sections, we will explore in more detail the accuracy of satellite-derived elevation models, clarifying the significance of the high adjusted R-squared value. Furthermore, we will examine individual relationships, offering comprehensive insights into the accuracy of each satellite-derived product. Our analysis of slope and aspect measurements beyond elevation revealed specific relationships with terrain characteristics. These results lay the groundwork for future research, suggesting paths for a more comprehensive terrain analysis that integrates diverse data sources and explores the potential of data fusion for applications in environmental monitoring and disaster management.
4.1. Elevation Correlation and Accuracy
The results of our regression analysis revealed a significant correlation between elevation values derived from both the SRTM and ALOS datasets and those obtained through TLS measurements. Notably, the estimated coefficients for SRTM and ALOS were 1.012162 and -0.009826, respectively, with highly significant p-values. This empirical evidence underscores the strong relationship between satellite-derived datasets and TLS ground truth measurements. Furthermore, the elevated adjusted R-squared value of 0.955 emphasizes the strength of this correlation, verifying the ability of satellite-derived elevation models to accurately represent the elevation information elucidated by TLS measurements. The residual standard error, measured at 5.688, serves as an average indicator of the deviation between predicted and actual TLS-derived elevation values, offering insights into the accuracy inherent in satellite-derived elevation products.
The results of our regression analysis revealed a significant correlation between elevation values derived from both the SRTM and ALOS datasets and those obtained through TLS measurements. Notably, the estimated coefficients for SRTM and ALOS were 1.012162 and -0.009826, respectively, with highly significant p-values. This empirical evidence underscores the strong relationship between satellite-derived datasets and TLS ground truth measurements. Furthermore, the elevated adjusted R-squared value of 0.955 emphasizes the strength of this correlation, verifying the ability of satellite-derived elevation models to accurately represent the elevation information elucidated by TLS measurements. The residual standard error, measured at 5.688, serves as an average indicator of the deviation between predicted and actual TLS-derived elevation values, offering insights into the accuracy inherent in satellite-derived elevation products.
Furthermore, separate linear regression analyses were conducted to assess the individual relationships between TLS elevation and each satellite-derived product. The regression analysis for ALOS elevation revealed a coefficient estimate of 0.86039, accompanied by a highly significant p-value. Similarly, the regression analysis for SRTM elevation produced a coefficient estimate of 1.00199, also with a highly significant p-value. Both regression models exhibited robust relationships between the satellite-derived elevations and TLS elevations, as exemplified by the substantial adjusted R-squared values (0.8478 for ALOS and 0.9551 for SRTM).
In-depth insights into the accuracy of these relationships were provided by the Root Mean Square Error (RMSE) values. For ALOS elevation, the RMSE value was calculated at 10.4346, quantifying the average discrepancy between the satellite-derived product and TLS measurements. A lower RMSE suggests a higher level of agreement between the datasets, affirming the degree of accuracy achieved. Conversely, for SRTM elevation, the RMSE value was notably lower at 5.6520, indicating a smaller average difference between the satellite-derived model and TLS data, further corroborating the high accuracy of the satellite-derived elevation products.
4.2. Comparison of Slope and Aspect Measurements
Expanding our analysis beyond elevation, we conducted a comparative examination of slope and aspect measurements. The findings uncovered specific relationships: SRTM-derived slope exhibited a noteworthy negative impact on TLS-derived slope, whereas the relationship between ALOS-derived slope and TLS slope did not manifest as statistically significant. The absence of a significant association between the ALOS slope and the TLS slope can be attributed to several potential factors. Firstly, disparities in measurement resolution are a plausible contributor. TLS offers high-resolution measurements that meticulously capture slope characteristics within a confined area surrounding the scanner. It leverages direct laser beam measurements, thus detecting fine-scale terrain intricacies. In contrast, ALOS slope data may originate from satellite imagery at a coarser resolution, potentially resulting in discrepancies between the measured values and contributing to the observed lack of statistical significance.
Moreover, the different sensing methods used for ALOS and TLS slope measurements may lead to variations in measurement accuracy. In our investigation, slope values were obtained through two processes: resampling and applying the slope equation using GIS. The observed variability in measurements can be linked to the inherent differences in these methods. This emphasizes the need to comprehend the intricacies of data acquisition techniques, as they can notably impact measurement accuracy. These distinct sensing approaches could also amplify the disparities in the observed associations. Another factor to consider is the inherent variability in terrain features. ALOS-derived slope data and TLS-derived slope data may encapsulate different aspects of terrain characteristics. TLS primarily focuses on capturing the slope of individual trees or localized terrain features, while ALOS slope data tends to represent larger-scale slope variations. This inherent distinction in scale and underlying terrain features may well account for the observed lack of a significant association between the two variables.
Additionally, the influence of unaccounted-for variables, such as vegetation cover, soil type, and land use, might have exerted an influence on the relationship between the ALOS slope and the TLS slope. It is plausible that these additional factors could have a more pronounced impact on TLS-derived slope measurements, thus contributing to the absence of a statistically significant association with ALOS-derived slope data.
5. Conclusions
Within the framework of our research, a temporal analysis involving multiple instances of satellite data acquisition and terrestrial LIDAR (TLS) measurements emerges as a crucial approach. This method has the potential to provide us with invaluable insights into the dynamic attributes of elevation, slope, and aspect within our study area. By examining the changes in these terrain parameters across different time periods, including seasons, years, or other relevant intervals, we can uncover complex patterns, trends, and fluctuations that might otherwise escape detection. Such temporal analysis can clarify seasonal variations in terrain attributes due to phenomena such as vegetation growth, snow accumulation, or erosional processes. Furthermore, it can aid in identifying long-term trends associated with shifts in land use or geological dynamics. These temporal insights not only enhance the precision of our comparisons but also contribute to a more comprehensive understanding of the underlying processes shaping the landscape, thereby augmenting the value of this approach in our research methodology.
Looking ahead, the incorporation of ancillary data sources, including aerial imagery, hyperspectral data, and geophysical measurements, into the cross-validation process promises to chart a promising trajectory for future terrain analysis research. This integration, alongside TLS and satellite-derived data, holds the potential to augment the validation process substantially, fostering a comprehensive grasp of terrain characteristics. Subsequent investigations can explore the synergistic possibilities arising from the fusion of diverse data types for the cross-validation of terrain attributes encompassing elevation, slope, and aspect. This multifaceted strategy stands to furnish a holistic and exhaustive portrayal of the landscape, thereby illuminating nuanced variations and subtleties that might escape detection when solely reliant on a single data source. Moreover, the integration of hyperspectral data introduces the prospect of an in-depth analysis of terrain attributes within the context of spectral signatures, thus facilitating the identification of specific surface materials and land cover types. Concurrently, the inclusion of geophysical measurements promises valuable insights into subsurface terrain features and geological structures. In essence, future research endeavors can harness the potential of data fusion to elevate the precision and applicability of elevation models, spanning a gamut of applications encompassing environmental monitoring, disaster management, and urban planning.
In conclusion, this study has shed light on the relation between satellite-derived elevation models and TLS measurements, emphasizing their robustness and accuracy. The comparison of slope measurements highlights the complexity of terrain analysis and the need for careful consideration of various factors. While our study has certain limitations, it provides valuable insights applicable to a broader context. Future research can build upon these findings to advance the field of terrain analysis and its applications
Author Contributions
Conceptualization, MDN and AHM.; methodology, MDN; software, MIK; validation, MDN, AHM and MIK; formal analysis, AHM; investigation, AHM; resources, MDN; data curation, MIK; writing—original draft preparation, AHM; writing—review and editing, MDN; visualization, AHM AND MIK; supervision, MDN; project administration, MDN; funding acquisition, MDN. All authors have read and agreed to the published version of the manuscript.
Funding
The APC was funded by Transilvania University of Brasov.
Data Availability Statement
Data are available at request.
Acknowledgments
We gratefully acknowledge the support of the anonymous reviewers who provided valuable comments that greatly improved this paper. This study was not supported by any sponsor or funder.
Conflicts of Interest
The authors declare no conflicts of interest.
References
- Armesto, J.; Ordóñez, C.; Alejano, L.; Arias, P. Terrestrial laser scanning is used to determine the geometry of a granite boulder for stability analysis purposes. Geomorphology 2009, 106(3-4), 271–277. [CrossRef]
- Asner, G.P. Carnegie Airborne Observatory: in-flight fusion of hyperspectral imaging and waveform light detection and ranging for three-dimensional studies of ecosystems. J. Appl. Remote Sens. 2007, 1(1), 013536. [CrossRef]
- Dube, T.; Seaton, D.; Shoko, C.; Mbow, C. Advancements in Earth Observation for Water Resources Monitoring and Management in Africa: A Comprehensive Review. J. Hydrol. 2023, 623, 129738. [CrossRef]
- Farr, T.G.; Rosen, P.A.; Caro, E.; Crippen, R.; Duren, R.; Hensley, S.; Kobrick, M.; Paller, M.; Rodriguez, E.; Roth, L.; Seal, D.; Shaffer, S.; Shimada, J.; Umland, J.; Werner, M.; Oskin, M.; Burbank, D.; Alsdorf, D. The Shuttle Radar Topography Mission. Rev. Geophys. 2007, 45(2). [CrossRef]
- Grau, E.; Durrieu, S.; Fournier, R.A.; Gastellu-Etchegorry, J.-P.; Yin, T. Estimation of 3D vegetation density with Terrestrial Laser Scanning data using voxels: A sensitivity analysis of influencing parameters. Remote Sens. Environ. 2017, 191, 373–388. [CrossRef]
- Guth, P.L.; van Niekerk, A.; Grohmann, C.H.; Muller, J.-P.; Hawker, L.; Florinsky, I.V.; Gesch, D.B., et al. Digital Elevation Models: Terminology and Definitions. Remote Sens. 2021, 13(18), 3581. [CrossRef]
- Kumar, V.; Kumar, G.; Parashar, S.; Choudhury, T.; Kotecha, K. A Comprehensive Examination of Satellite Stereo Triplet Image Matching for Digital Elevation Model (DEM) Generation. In Proceedings of the 2023 IEEE International Conference on ICT in Business, Industry & Government (ICTBIG), 2023, December 8; pp. 1–8. IEEE. [CrossRef]
- Moran, M.S.; Jackson, R.D. Assessing the Spatial Distribution of Evapotranspiration Using Remotely Sensed Inputs. J. Environ. Qual. 1991, 20(4), 725–737. [CrossRef]
- Mutale, B.; Qiang, F. Modeling Future Land Use and Land Cover under Different Scenarios Using Patch-Generating Land Use Simulation Model: A Case Study of Ndola District. Front. Environ. Sci. 2024, 12, 1362666. [CrossRef]
- Niță, M.D. Testing Forestry Digital Twinning Workflow Based on Mobile LiDAR Scanner and AI Platform. Forests 2021, 12(11), 1576. [CrossRef]
- Okolie, C.J.; Smit, J.L. A Systematic Review and Meta-Analysis of Digital Elevation Model (DEM) Fusion: Pre-Processing, Methods and Applications. ISPRS J. Photogramm. Remote Sens. 2022, 188, 1–29. [CrossRef]
- Rabus, B.; Eineder, M.; Roth, A.; Bamler, R. The Shuttle Radar Topography Mission—a New Class of Digital Elevation Models Acquired by Spaceborne Radar. ISPRS J. Photogramm. Remote Sens. 2003, 57(4), 241–262. [CrossRef]
- Remote sensing, hydrological modeling and in situ observations in snow cover research: A review. J. Hydrol. 2018, 561, 573–583. [CrossRef]
- Riquelme, A.; Ferrer, B.; Mas, D. Use of High-Quality and Common Commercial Mirrors for Scanning Close-Range Surfaces Using 3D Laser Scanners: A Laboratory Experiment. Remote Sens. 2017, 9(11), 1152. [CrossRef]
- Sharma, A.; Bagri, D.S. Comparison and Validation of Elevation Data at Selected Ground Control Points and Terrain Derivatives Derived from Different Digital Elevation Models. Remote Sens. Earth Syst. Sci. 2023, 6, 38–59. [CrossRef]
- Short, N.; Brisco, B.; Couture, N.; Pollard, W.H.; Murnaghan, K.; Budkewitsch, P. A comparison of TerraSAR-X, RADARSAT-2, and ALOS-PALSAR interferometry for monitoring permafrost environments, case study from Herschel Island, Canada. Remote Sens. Environ. 2011, 115(12), 3491–3506. [CrossRef]
- Soudarissanane, S.; Lindenbergh, R.; Menenti, M.; Teunissen, P. Scanning geometry: Influencing factor on the quality of terrestrial laser scanning points. ISPRS J. Photogramm. Remote Sens. 2011, 66(4), 389–399. [CrossRef]
- Suchocki, C. Comparison of Time-of-Flight and Phase-Shift TLS Intensity Data for the Diagnostics Measurements of Buildings. Materials 2020, 13(2), 353. [CrossRef]
- Tadono, T.; Ishida, H.; Oda, F.; Naito, S.; Minakawa, K.; Iwamoto, H. Precise Global DEM Generation by ALOS PRISM. ISPRS Ann. Photogramm. Remote Sens. Spatial Inf. Sci. 2014, II-4, 71–76. [CrossRef]
- Zhang, Y.; Hou, J.; Huang, C. Integration of Satellite-Derived and Ground-Based Soil Moisture Observations for a Precipitation Product over the Upper Heihe River Basin, China. Remote Sens. 2022, 14(21), 5355. [CrossRef]
- Zou, L.; Wang, C.; Tang, Y.; Zhang, B.; Zhang, H.; Dong, L. Interferometric SAR Observation of Permafrost Status in the Northern Qinghai-Tibet Plateau by ALOS, ALOS-2, and Sentinel-1 between 2007 and 2021. Remote Sens. 2022, 14(8), 1870. [CrossRef]
Figure 2.
Summary of Data processing and analysis.
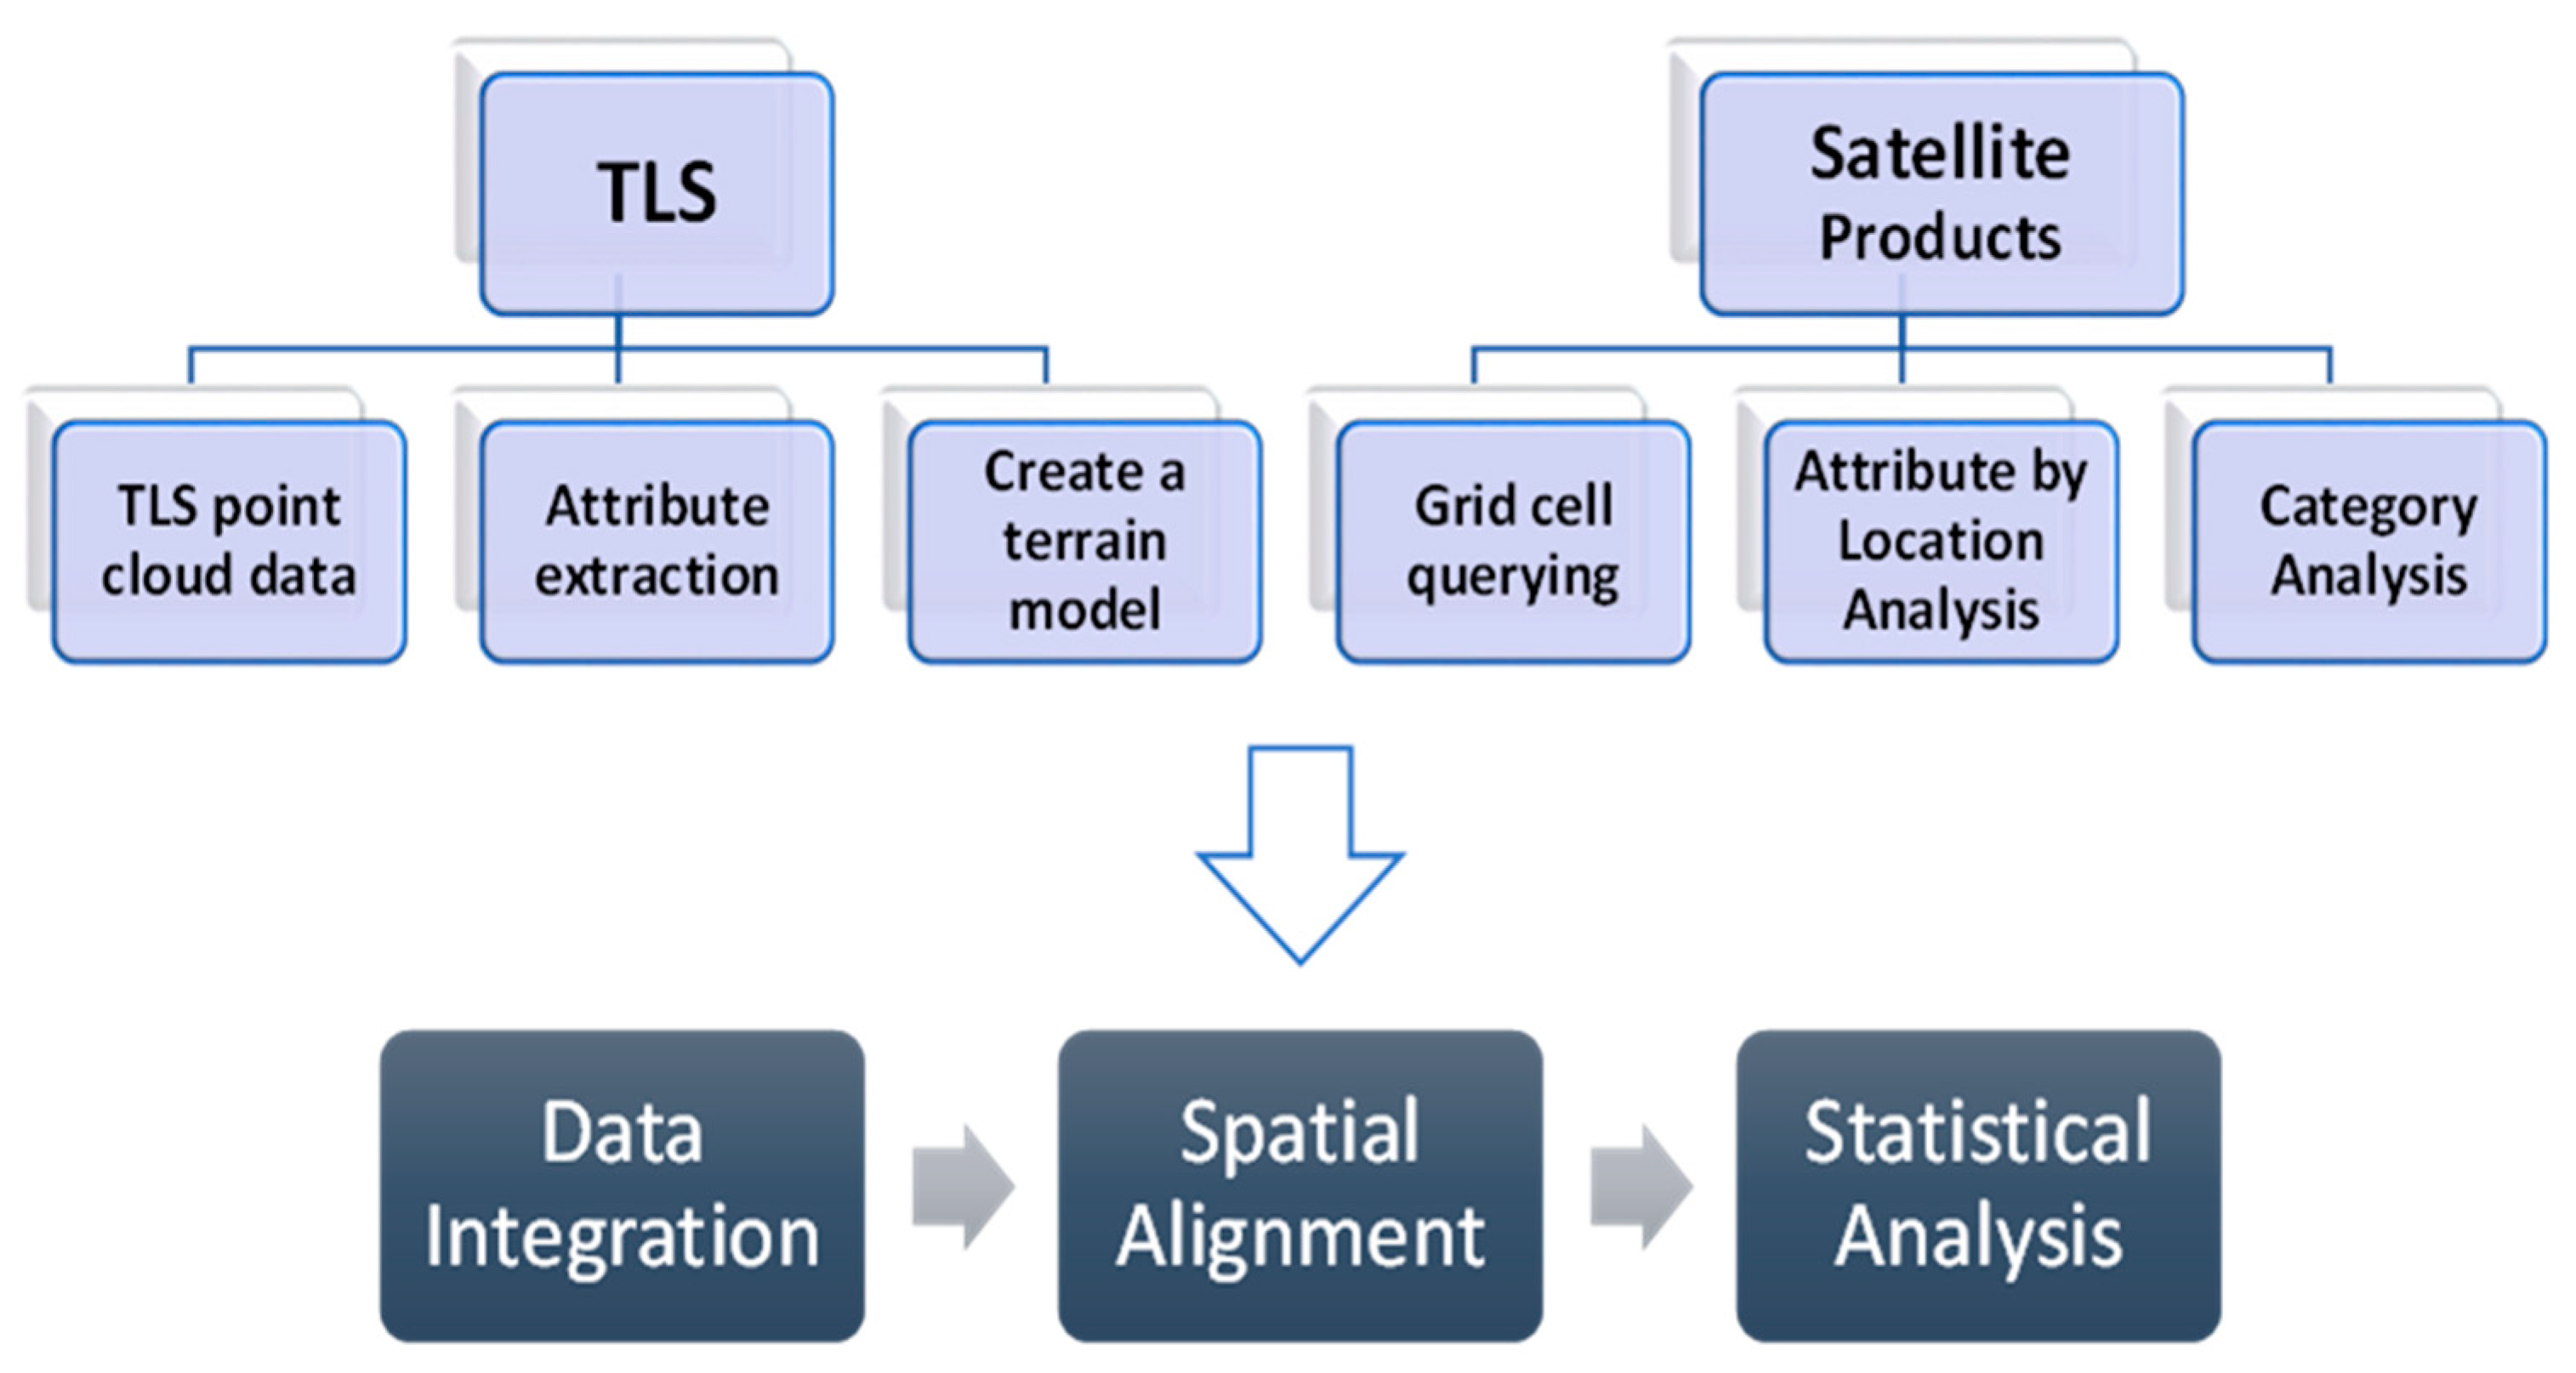
Figure 3.
Analyzing the datasets using a grid-cell-based approach.
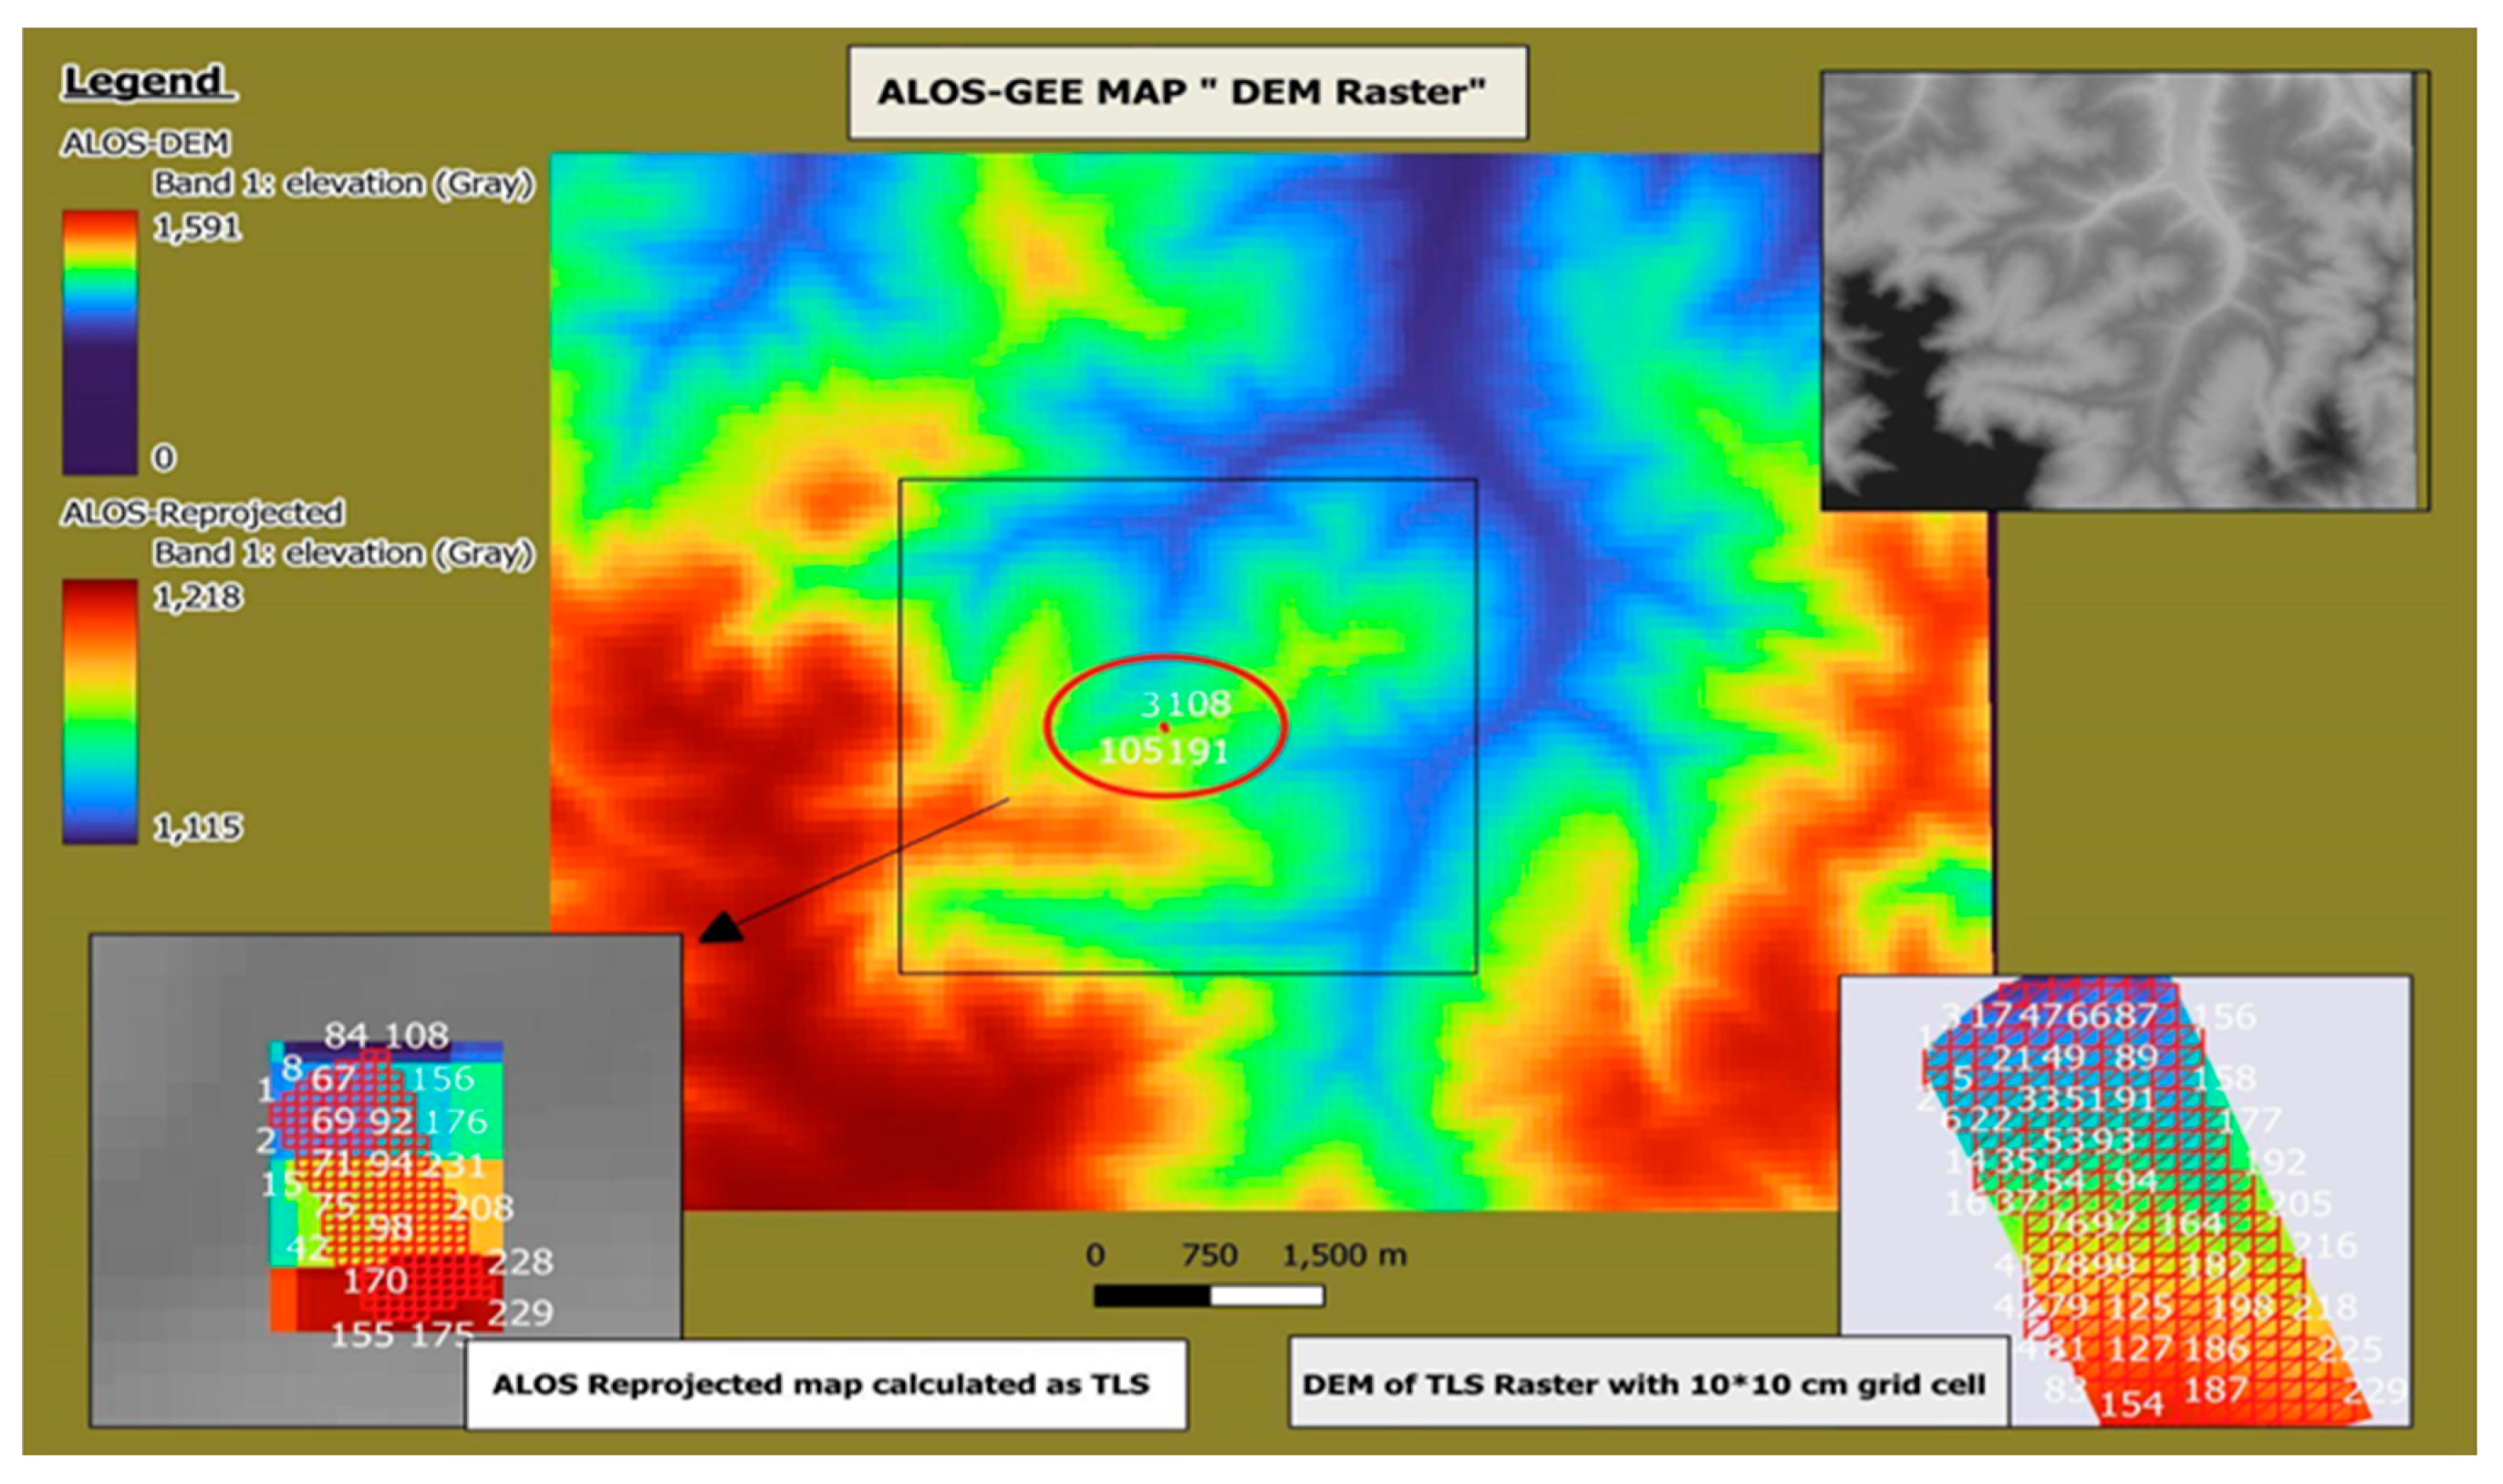
Figure 4.
Slope analysis of the Satellite derived products (ALOS and SRTM).
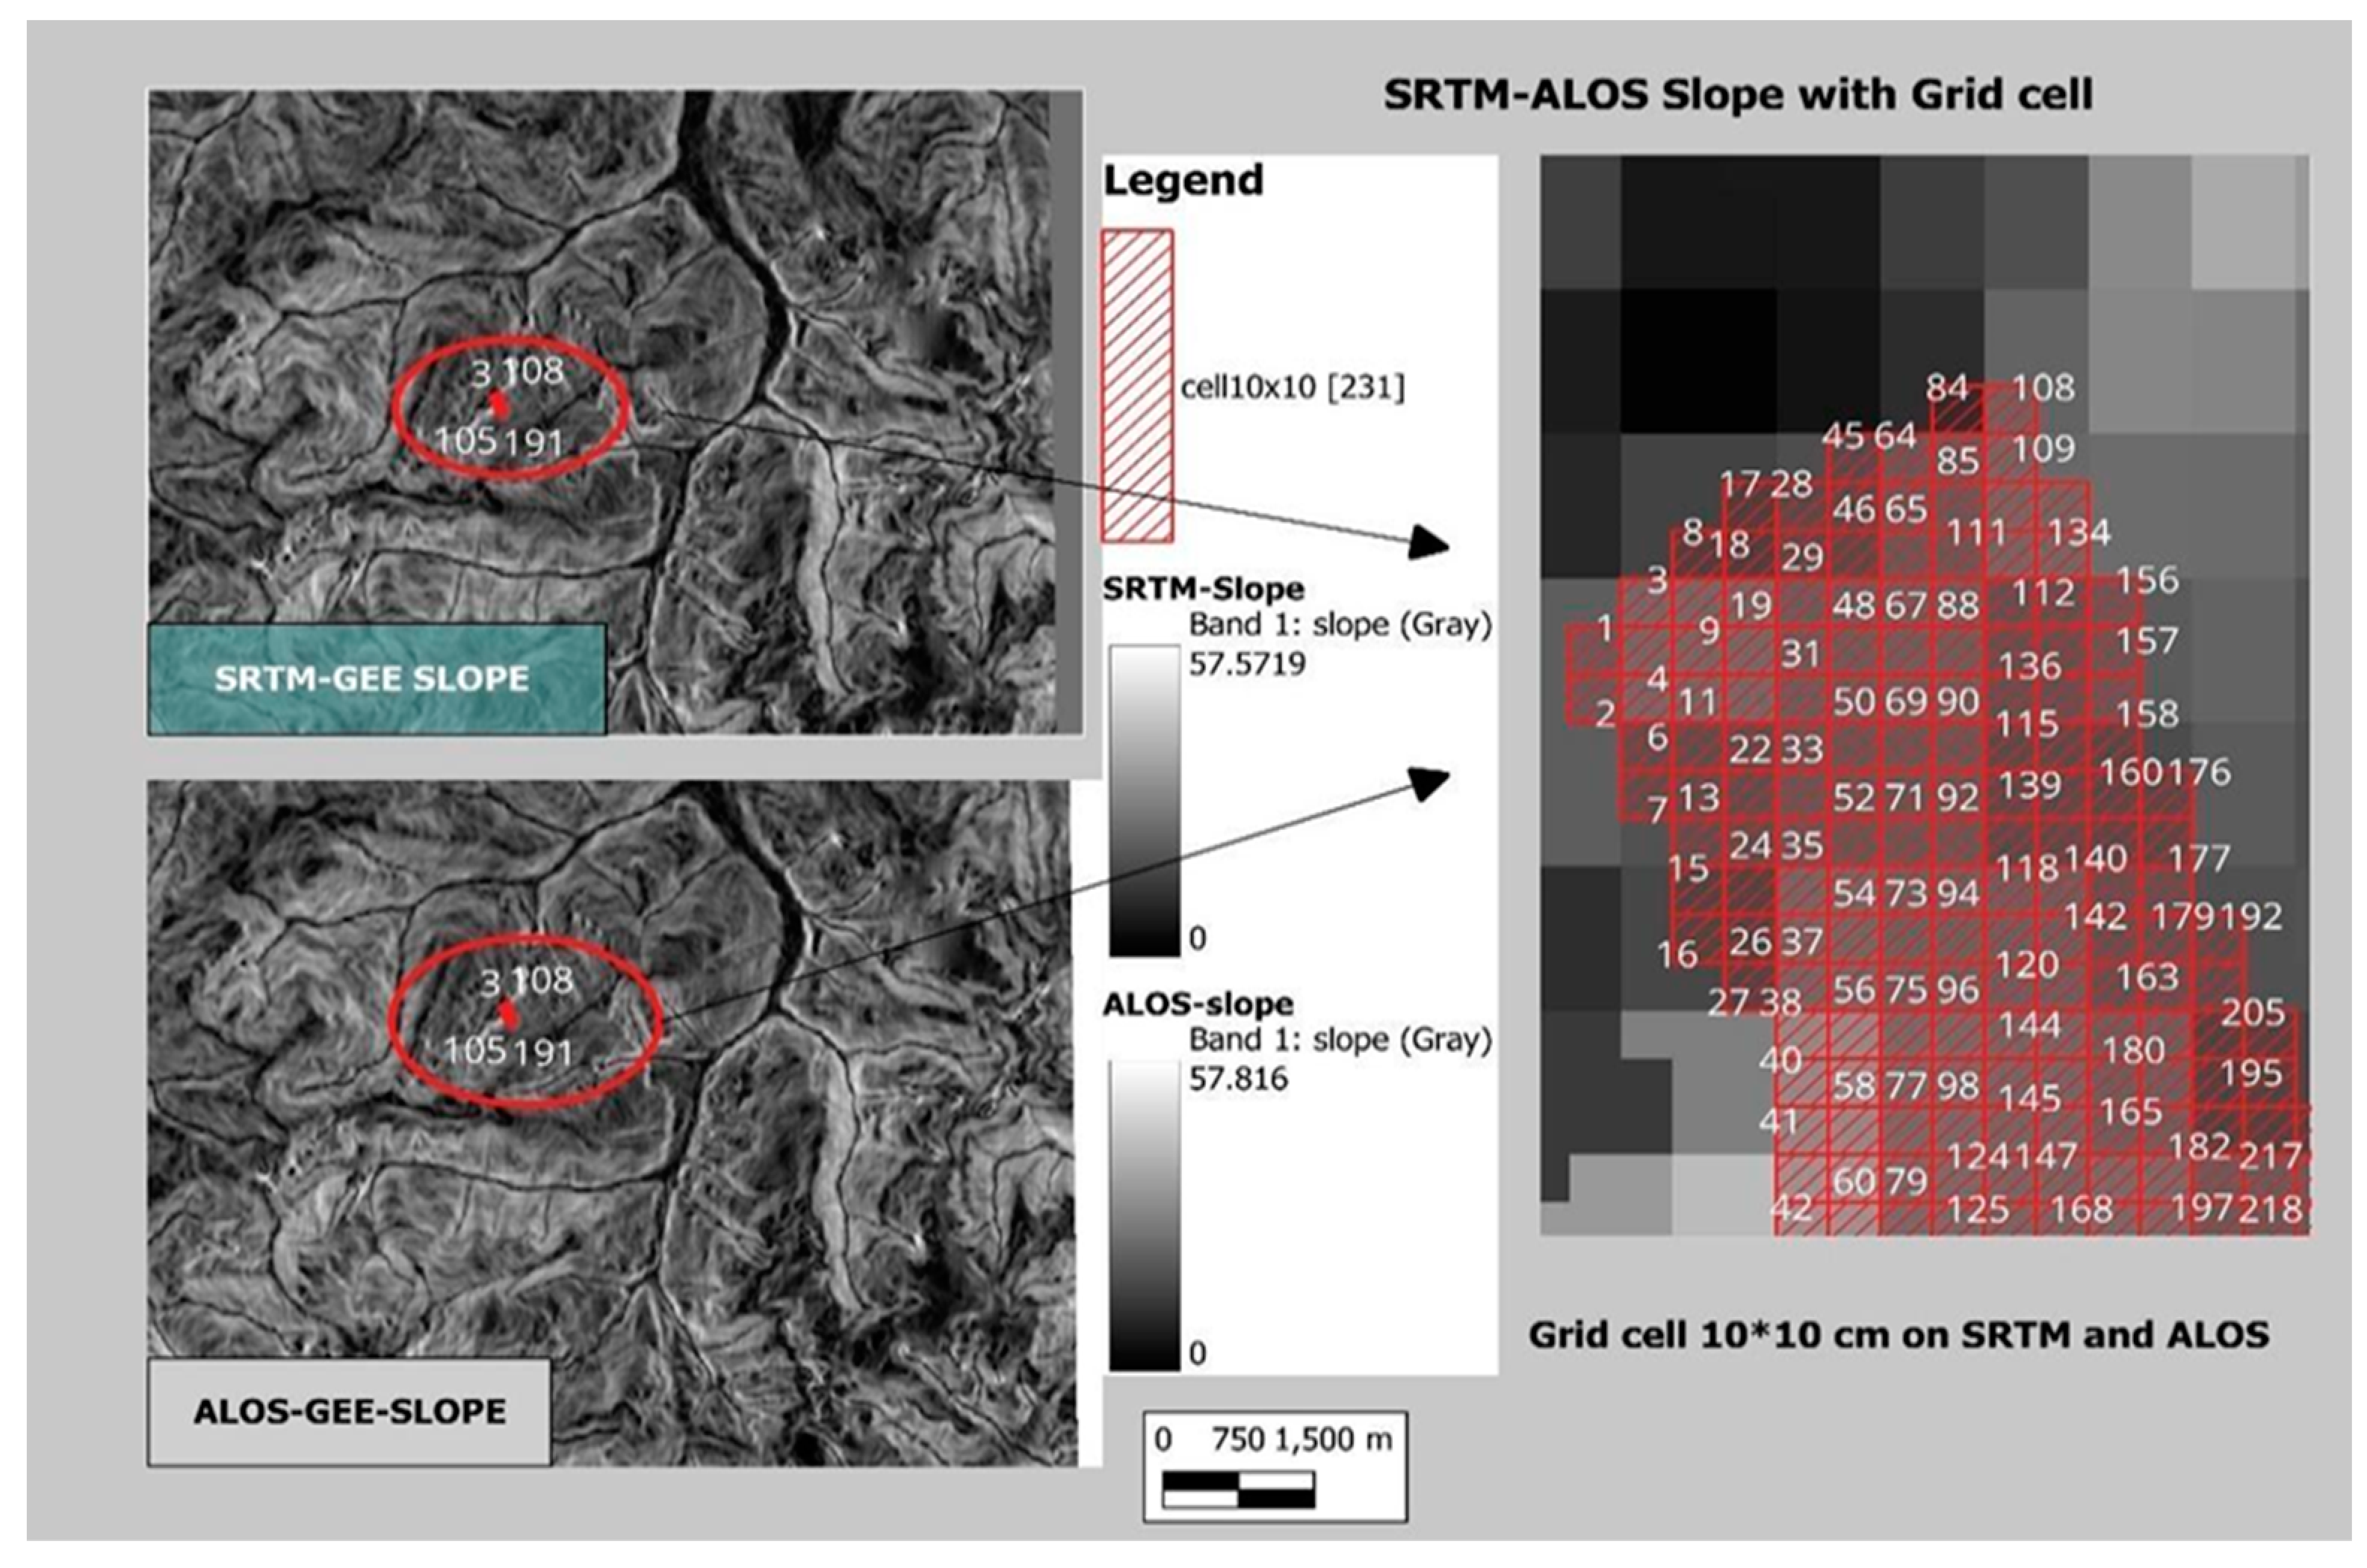
Figure 5.
Analyzing the TLS slope using a grid-cell-based approach.
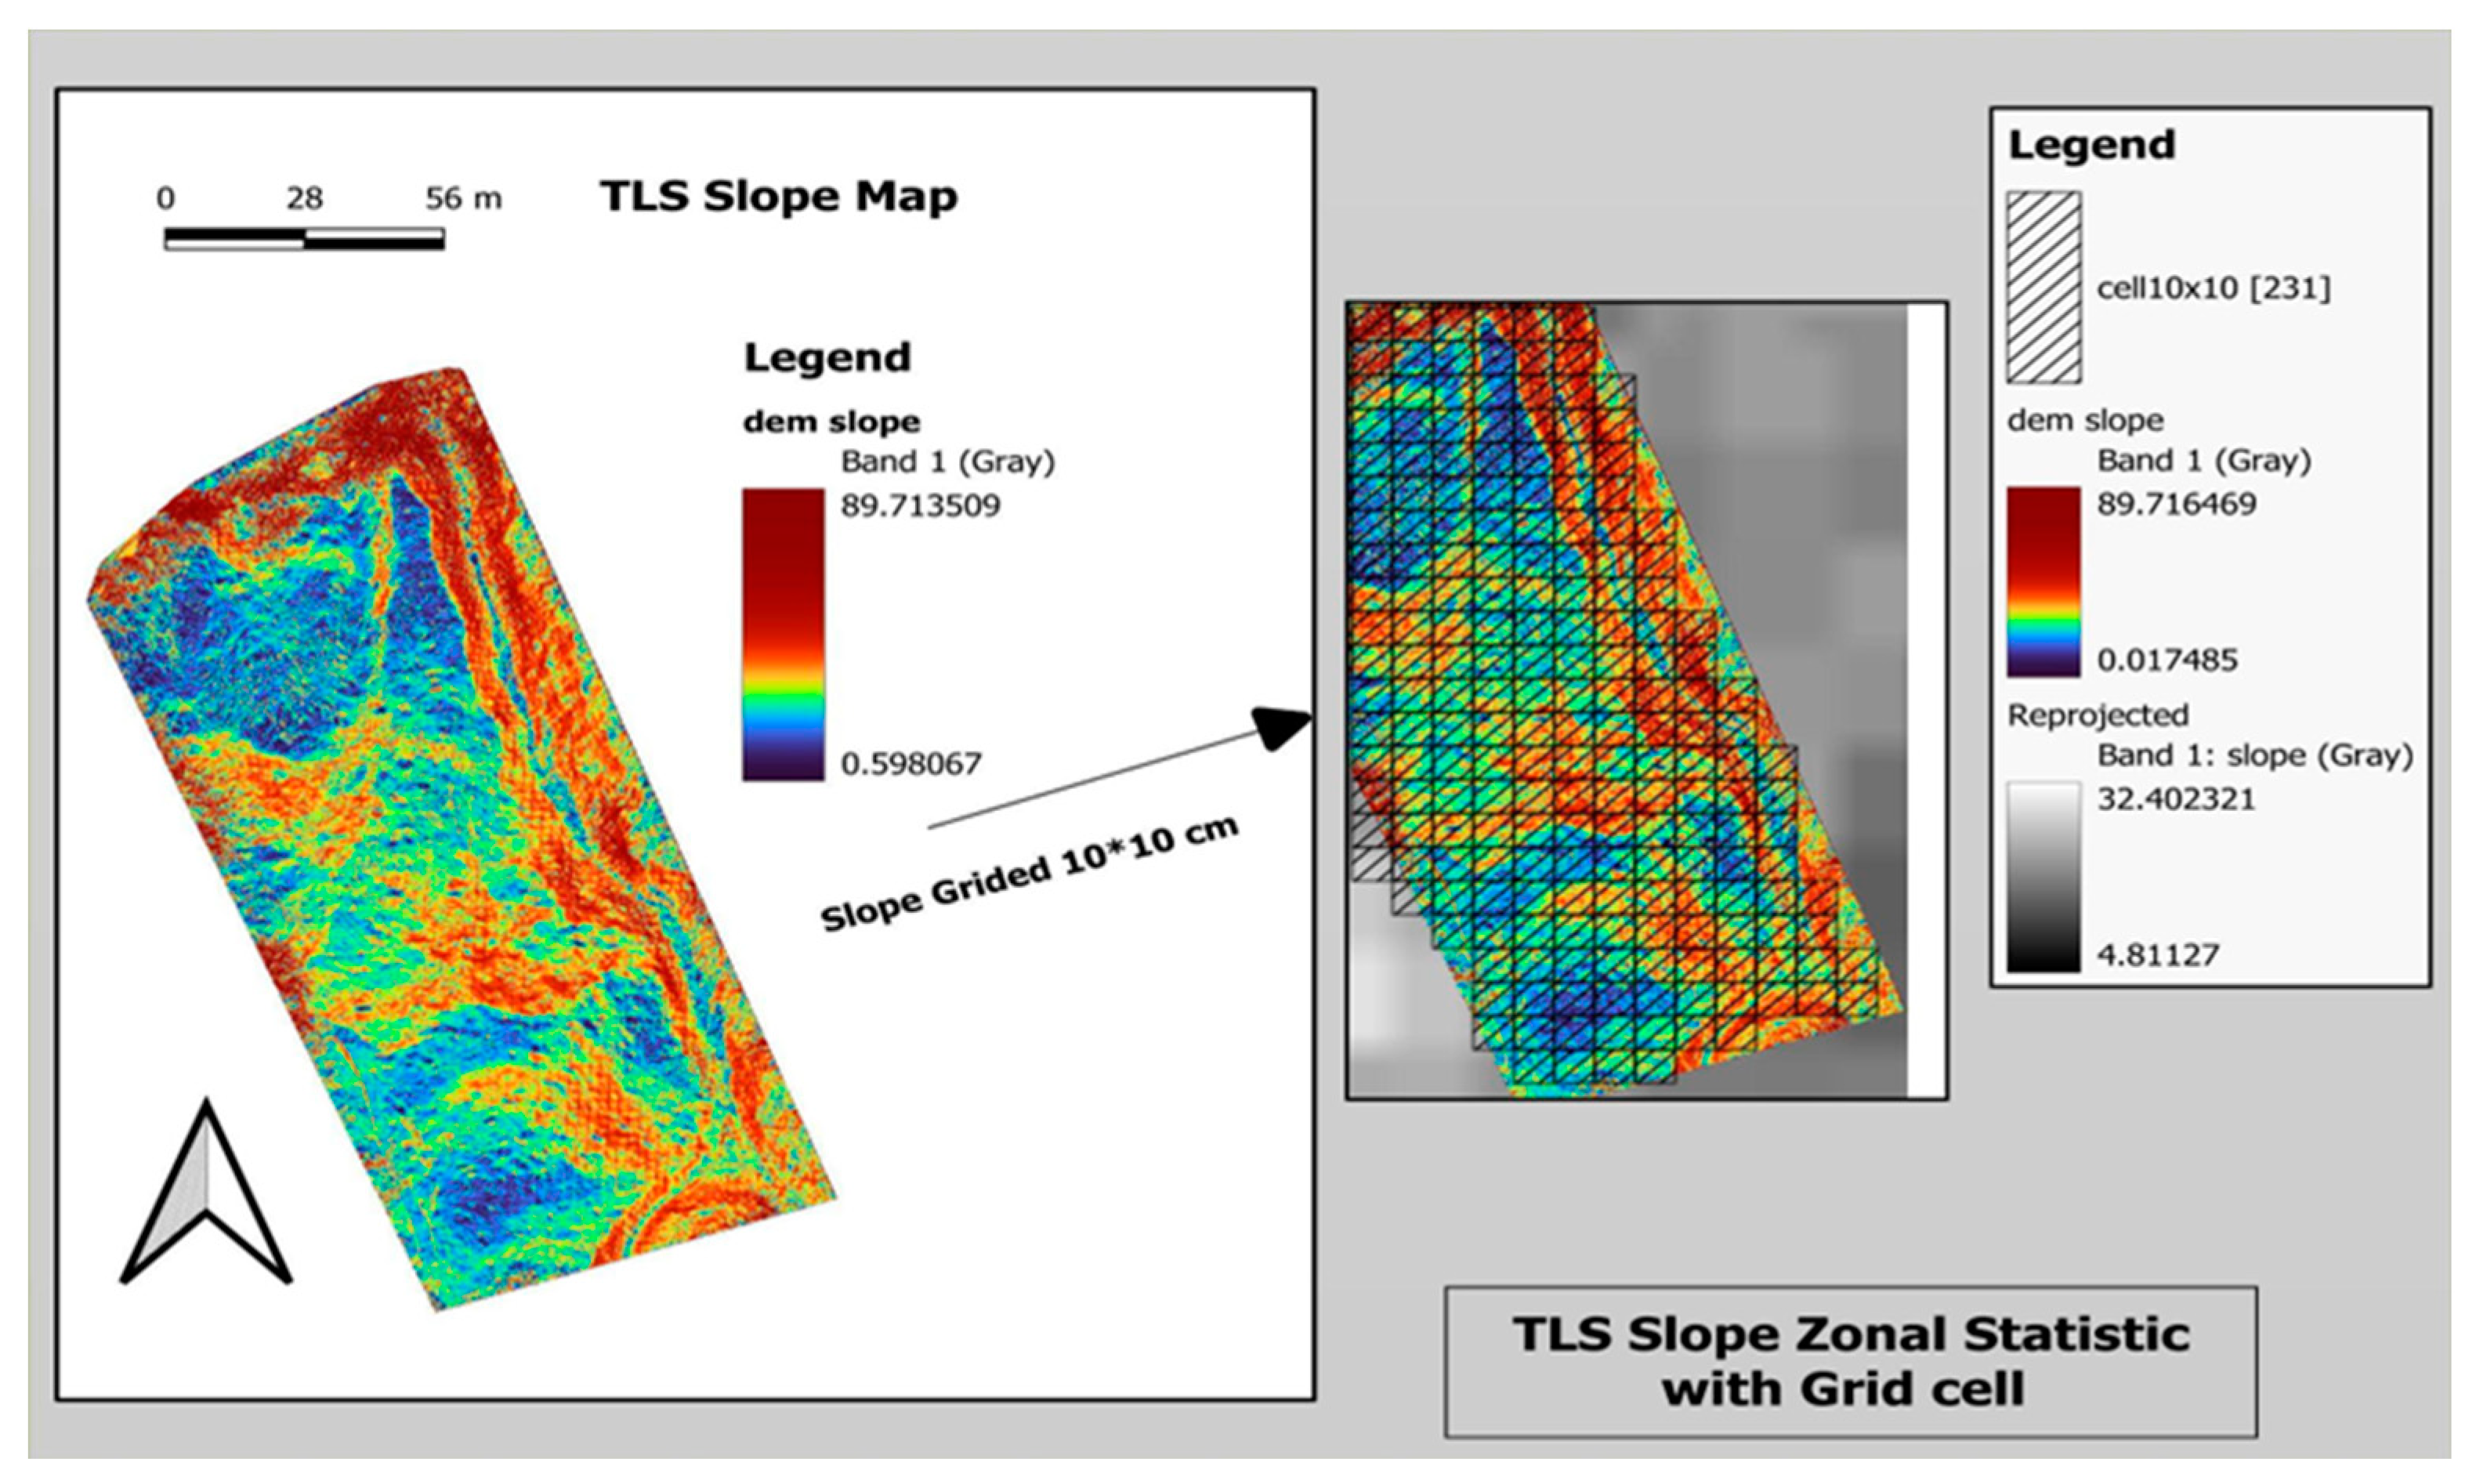
Figure 6.
Aspect analysis of the Satellite derived products (ALOS and SRTM).
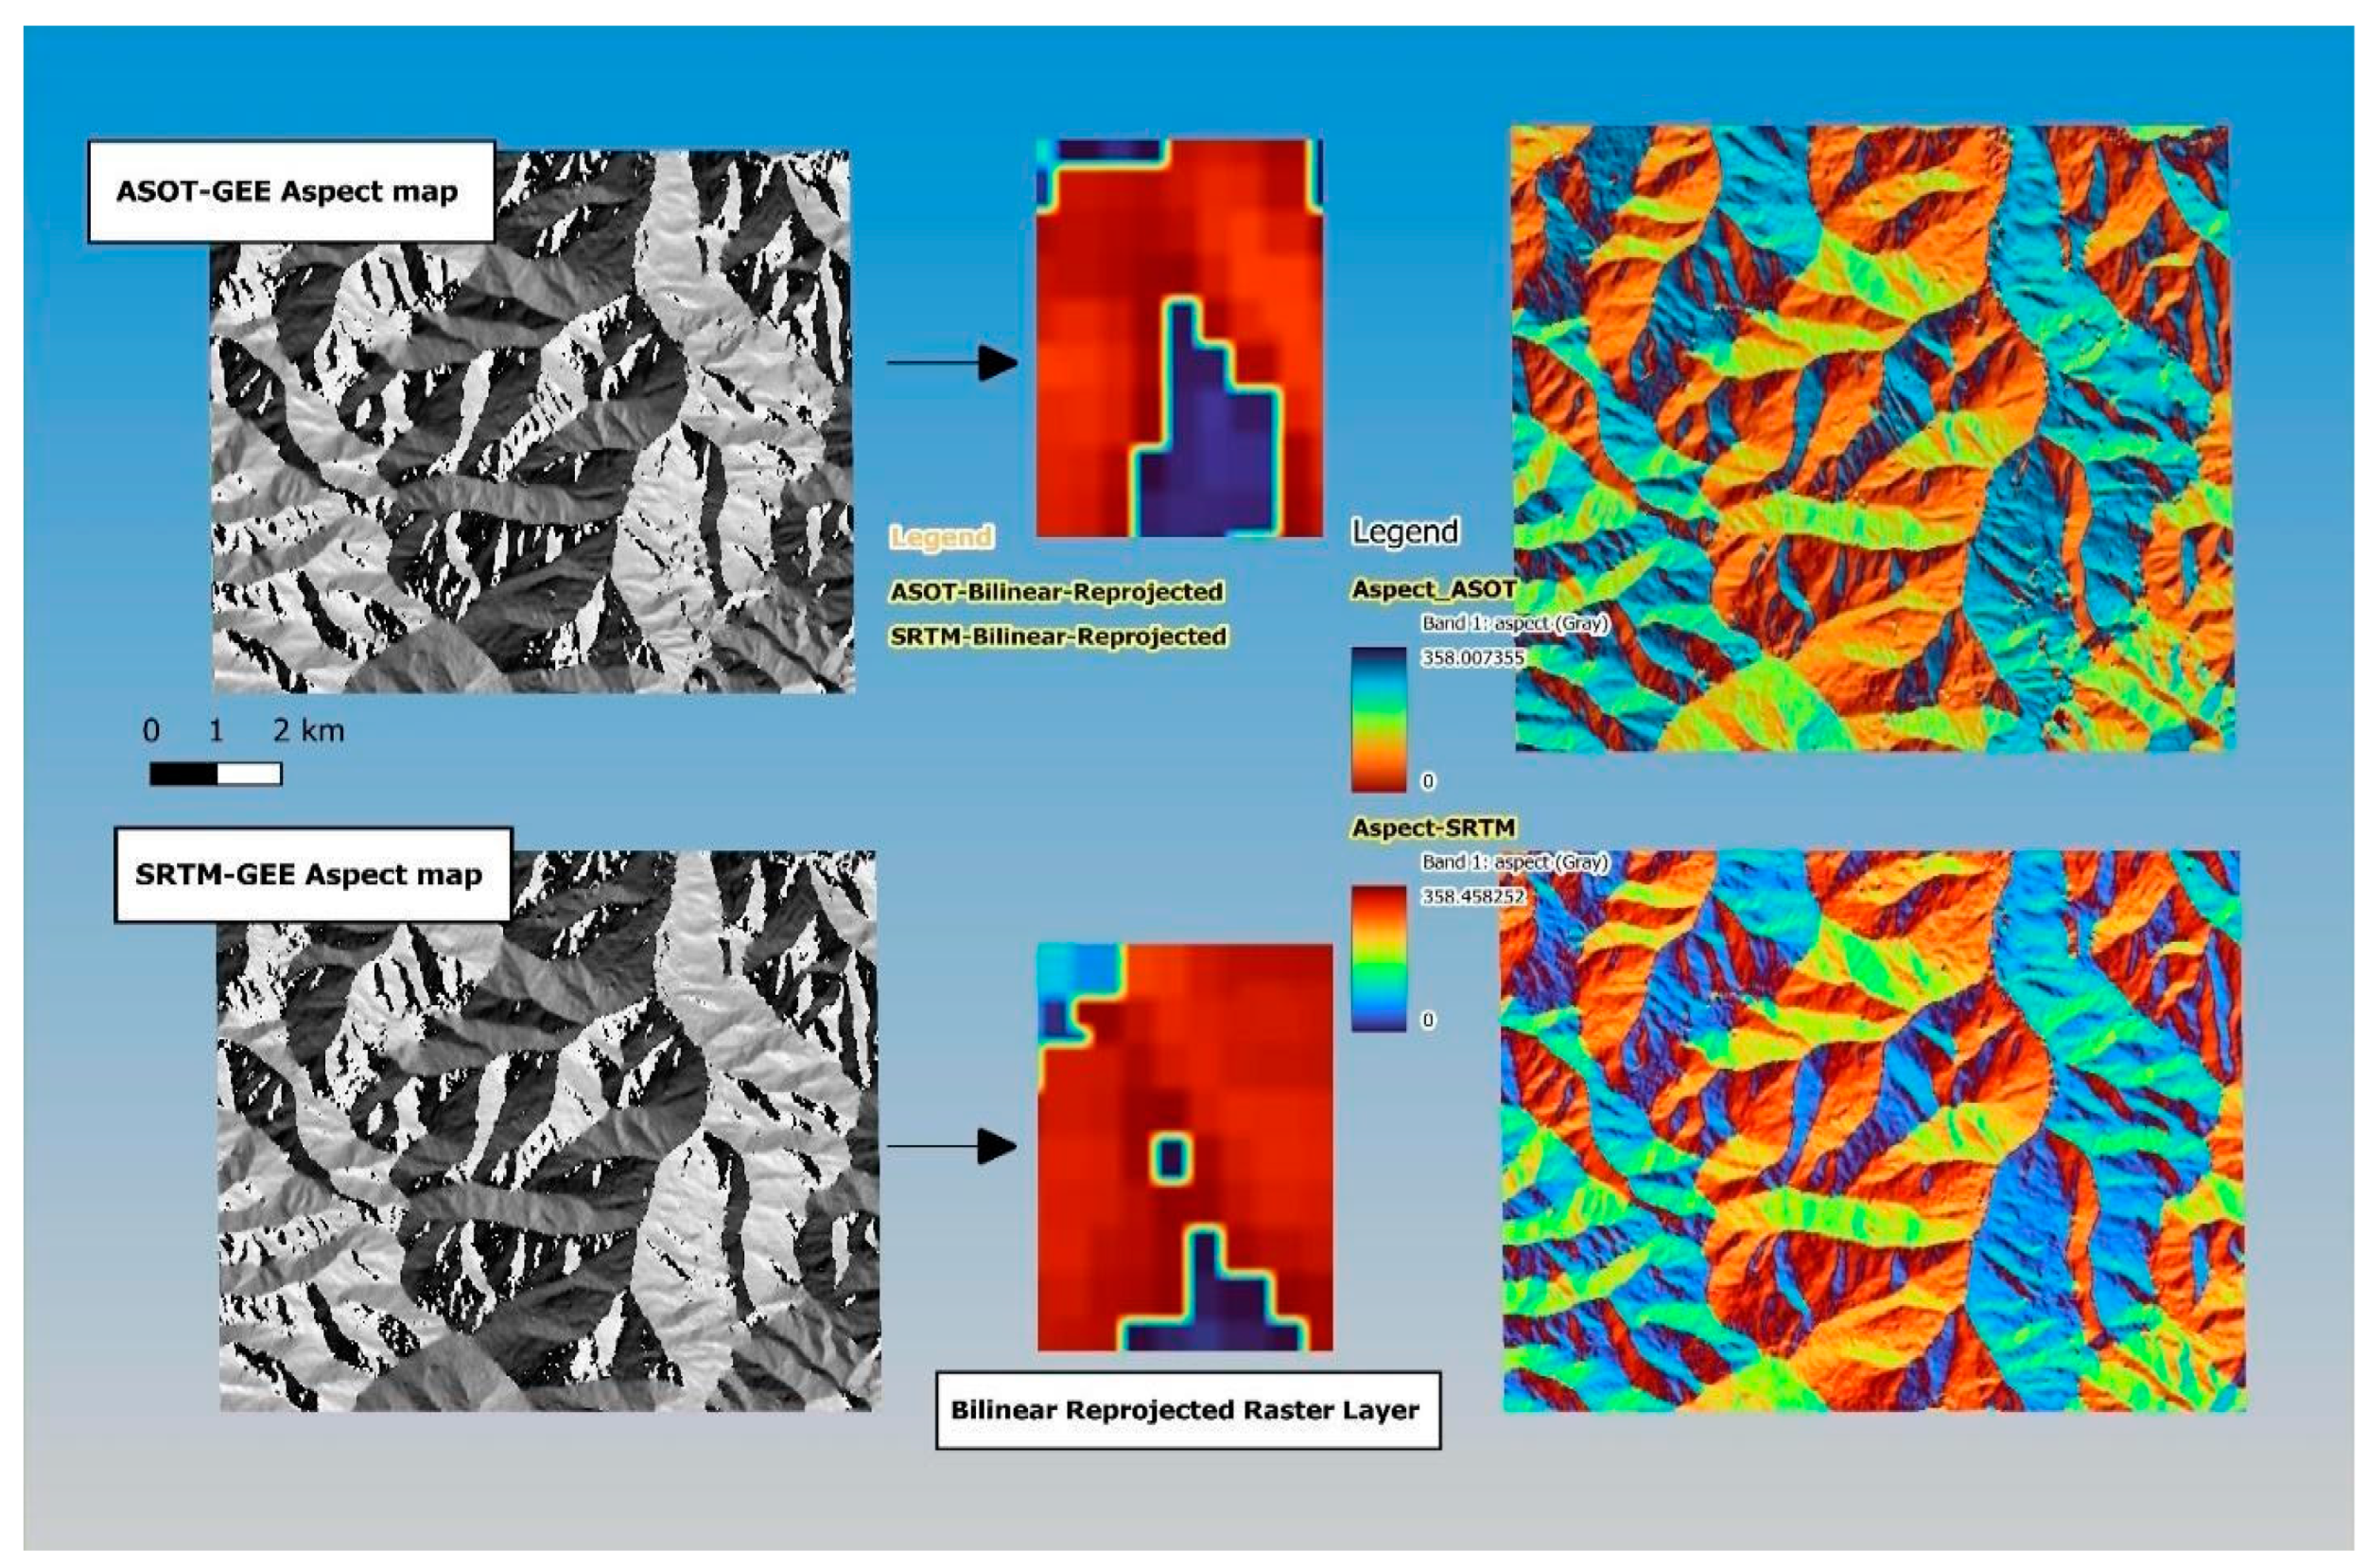
Figure 7.
Analyzing the TLS aspect using a grid-cell-based approach.
Disclaimer/Publisher’s Note: The statements, opinions and data contained in all publications are solely those of the individual author(s) and contributor(s) and not of MDPI and/or the editor(s). MDPI and/or the editor(s) disclaim responsibility for any injury to people or property resulting from any ideas, methods, instructions or products referred to in the content. |
© 2024 by the authors. Licensee MDPI, Basel, Switzerland. This article is an open access article distributed under the terms and conditions of the Creative Commons Attribution (CC BY) license (http://creativecommons.org/licenses/by/4.0/).
Copyright: This open access article is published under a Creative Commons CC BY 4.0 license, which permit the free download, distribution, and reuse, provided that the author and preprint are cited in any reuse.


