
Submitted:
14 May 2025
Posted:
15 May 2025
You are already at the latest version
Abstract
This study proposes a sensor-based infrastructure inspection system for detecting cracks on port quay walls using orthophotos generated from aerial imagery captured by small general-purpose drones. The system incorporates the object detection algorithm YOLOR (You Only Learn One Representation) to accurately identify cracks as narrow as 1 mm, based on visual data acquired through low-cost onboard imaging sensors. To address the challenges of image resolution and scale alignment, two image division techniques—overlapping image tiling and pseudo-altitude slicing—are introduced. The detection system is designed to be low-cost, reproducible, and suitable for direct implementation by local government personnel. Evaluation using real-world inspection data demonstrated that the system achieved detection accuracy comparable to a well-established commercial system. These results confirm the potential of sensor-driven crack detection workflows as a practical alternative for sustainable infrastructure monitoring.
Keywords:
orthophoto
; port quay wall
; crack detection
; deep learning
; small general-purpose drone
1. Introduction
Many infrastructure structures in Japan were constructed during the period of rapid economic growth in the 1950s to 1970s. As a result, a significant number of these structures have already exceeded their 50-year design service life, and infrastructure deterioration has become a serious societal issue. According to a report by the Ministry of Land, Infrastructure, Transport and Tourism (MLIT) of Japan, approximately 43% of port facilities will be more than 50 years old by the year 2030, highlighting the urgent need for strategic countermeasures [1].
In order to safely maintain such aging infrastructure, regular inspections are essential. However, current inspection operations rely heavily on manual labor and visual observation, and the shortage of skilled engineers who can perform these inspections appropriately is a growing concern. In particular, port facilities are exposed to harsh salt-laden environments due to seawater, accelerating the rate of deterioration. Furthermore, these facilities, such as quay walls and coastal levees, often span wide areas, making the introduction of efficient maintenance methods that utilize new technologies a critical and urgent need.
The problem of infrastructure deterioration is not limited to developed nations such as Japan. Many developing countries are beginning to face similar challenges, as infrastructure built in previous decades begins to age without sufficient investment in maintenance and renewal. Gurara et al. [2] highlighted that developing countries, especially those in Asia and Africa, face substantial risks from aging infrastructure due to inadequate resources and lack of regular maintenance protocols. This underscores the global importance of developing sustainable, accessible, and cost-effective infrastructure inspection methods.
To address these global challenges, recent studies have explored the use of advanced technologies such as drones equipped with high-resolution cameras and deep learning techniques for infrastructure inspection. However, existing research primarily utilizes expensive industrial drones and high-cost sensors, posing significant barriers for widespread adoption, especially by local governments and developing regions with limited financial and technical resources.
In contrast, this study introduces a cost-effective and accessible method specifically designed for practical implementation by local government personnel, highlighting its suitability for both developed and developing regions. By combining publicly available datasets with domain-specific training data and employing a YOLO (You Only Look Once) [3]-based object detection algorithm, the proposed system achieves high accuracy in detecting cracks as narrow as 1 mm, despite using low-cost cameras and small general-purpose drones. This approach not only enhances the feasibility of regular and widespread inspections but also contributes significantly to the development of sustainable infrastructure management strategies globally, including regions with resource constraints.
2. Related Work
In infrastructure inspections, identifying cracks on concrete structures is crucial for effective condition monitoring. Thus, numerous studies have been conducted on crack detection methods utilizing image processing, machine learning, and deep learning technologies. Among these methods, convolutional neural networks (CNNs) have shown promising performance for classifying surface defects on concrete structures. Additionally, object detection models such as YOLO, which enable real-time and high-accuracy detection, have also gained increasing popularity. For instance, Shigemura et al. [4] proposed a two-stage high-accuracy surface crack screening method using deep learning-based object recognition. Woo et al. [5] introduced a method for detecting and mapping concrete surface cracks in infrastructure using drone-derived orthophotos and relative positioning information. Sun and Meng [6] developed an efficient, low-cost bridge crack detection method using deep learning and aerial imagery. Kim et al. [7] proposed a drone-based system combining hybrid image processing for accurate concrete crack identification.
However, most existing approaches primarily focus on structures with stringent inspection criteria such as bridges and tunnels, where cracks as narrow as less than 1 mm must be detected. Capturing such fine-scale cracks typically requires expensive industrial drones and sophisticated software, posing significant challenges for direct implementation by local government personnel due to high inspection costs.
On the other hand, inspection standards for port quay walls, the target structures of the present study, are comparatively relaxed. According to the “Inspection and Diagnostic Guidelines for Port Facilities (Part II: Implementation Procedure)” published by Japan’s Ministry of Land, Infrastructure, Transport and Tourism [8], a crack width of 3 mm is set as one inspection threshold. Compared to bridges and tunnels requiring sub-millimeter crack detection capabilities, the inspection criteria for port quay walls allow for various practical approaches, including the use of small general-purpose drones already implemented by local municipalities, enabling more cost-effective inspections.
Although Tsaimou et al. [9] conducted a closely related study that employs drone-derived orthophotos combined with Geographic Information System (GIS) tools to detect cracks on port concrete pavements, the present study goes a step further by specifically aiming to establish a sustainable inspection methodology for port infrastructure maintenance. Utilizing small general-purpose drones currently operated directly by local government personnel and advanced deep learning technologies (YOLOR), this study proposes a highly efficient and practical crack detection system capable of accurately identifying cracks as narrow as 1 mm.
3. Proposed Method
A key technical challenge in drone-based crack inspection lies in the limited resolution of onboard imaging sensors, particularly those integrated into compact, low-cost drone platforms widely adopted by local governments. These sensors typically produce Ground Sample Distances (GSDs) of several millimeters per pixel at safe operating altitudes, making it difficult to reliably detect sub-centimeter cracks. For example, aerial imagery captured at a 10 m altitude using the Autel Robotics EVO II Pro yields a GSD of approximately 2.28 mm/px. While this resolution marginally meets the 3 mm inspection threshold for port quay walls, reliably detecting 1 mm cracks requires additional image processing strategies. To address this issue, we introduce two lightweight preprocessing techniques (overlapping image tiling and pseudo-altitude slicing) that enhance crack detectability without requiring sensor or hardware modifications.
To overcome the technical limitations of image resolution imposed by these low-cost onboard cameras, the proposed system combines deep learning-based image recognition with multiple image processing techniques. This approach enables crack detection performance that satisfies the inspection standards for port quay walls. In this study, we define “small general-purpose drones” as compact, commercially available drones commonly used by local governments, such as the DJI Mavic 3. Our experiments used the Autel Robotics EVO II Pro, which offers comparable performance. This drone, measuring 424 × 354 × 110 mm, is equipped with a built-in camera (sensor width: 13.2 mm, focal length: 10.57 mm). Aerial imagery captured at a 10 m altitude (image width: 5,472 px) achieved a GSD of approximately 2.28 mm/px, as calculated by Equation (3.1). The GSD of the DJI Mavic 3 under the same conditions is approximately 2.66 mm/px.
Given this resolution, cracks approximately 3 mm in width, serving as the inspection criteria benchmark for port quay walls, can theoretically be identified from aerial images taken at a 10 m altitude. However, accurately identifying cracks as narrow as 3 mm requires the capability to detect cracks around 1 mm in width. Therefore, this study sets a target detection width of 1 mm and develops a deep learning-based crack detection model capable of achieving this high accuracy. Furthermore, from a system operation perspective, merely displaying detected cracks on individual aerial photographs without knowing their real-world coordinates poses significant limitations for improving maintenance management efficiency. To overcome this issue, our system design utilizes orthophotos, enabling detected crack locations to be mapped onto real-world coordinates. Figure 1 provides an overview of the proposed crack detection system. The detailed functions corresponding to each step (e.g., image acquisition, orthophoto generation, image division, deep learning-based detection, and result export) will be described in the following sections.
3.1. Automatic Measurement Using Small General-Purpose Drones and Photogrammetric Processing
Port quay walls are subject to various site conditions, such as elevation differences, slopes, and the absence of scaffolding, which can hinder inspection work. Therefore, aerial small general-purpose drones are increasingly used in on-site maintenance operations to improve both efficiency and safety. By utilizing the automatic measurement functions of small general-purpose drones, aerial images with consistent quality can be captured regardless of the operator’s skill, enabling more efficient inspections of wide-ranging port quay walls.
In this study, automatic measurement using small general-purpose drones is employed to capture aerial images of quay walls at a flight altitude of 10 meters. During flight, an overlap rate of approximately 80% is configured so that the photographic coverage of consecutive images overlaps. Ground Control Points (GCP) are also established and Global Navigation Satellite System (GNSS) surveying is conducted, with the placement of aerial targets to improve the positional accuracy of the orthophotos to the centimeter level. The 10-meter flight altitude is selected for several reasons: it allows for the identification of cracks measuring a few millimeters as mentioned in the previous section; flying at lower altitudes would reduce the safety margin relative to nearby structures or buildings; and at lower altitudes, even overlapping photos may lack sufficient common feature points necessary for subsequent photogrammetric processing. Using the full set of aerial images obtained through this automatic measurement process, orthophotos are generated through photogrammetric processing. By leveraging the geographic information embedded in orthophotos, it becomes possible to automatically measure crack dimensions such as length, width, and area, and to compare crack detection results across different time periods to assess changes, which are difficult to accomplish with individual aerial photographs alone. In this study, Agisoft Metashape Pro is used for photogrammetric processing, and orthophotos are generated by applying marker-based corrections using high-accuracy GCPs acquired via GNSS surveying.
3.2. Image Division Techniques
The orthophotos generated in the previous step are too large in size to be directly used for crack detection (e.g., for a 100 × 20 m site, the image resolution reaches 63,747 × 36,319 px). Therefore, it is necessary to divide these images into appropriately sized tiles. Based on preliminary experiments, it was found that the optimal performance was achieved when the tile size matched the size of the training data used in the deep learning model. Hence, a tile size of 256 × 256 px was adopted. To further enhance detection performance, two division methods were introduced: overlapping image tiling and pseudo-altitude slicing. Overlapping image tiling mitigates the risk of missing cracks that appear along tile boundaries by allowing adjacent tiles to partially overlap. Figure 2 shows an example with a 50% overlap. This technique has been widely used in patch-based deep learning models for crack detection, as it significantly improves the model’s ability to localize cracks near edges [10].
Next, to address the issue where cracks in 256 × 256 px tiles differ in scale from the training data, leading to reduced detection performance, a pseudo-altitude slicing method was developed. While prior studies have explored multiscale feature fusion approaches within neural network architectures to improve crack detection robustness [11,12], this study introduces a data preprocessing method that achieves similar multiscale representation without requiring network-level modifications. This technique simulates images captured at different flight altitudes by adjusting the scale of cracks within each tile. Similar in spirit to multiscale feature fusion techniques proposed in previous studies [13], this method enhances the model’s ability to generalize across varying crack scales. In this method, the tile size is recalculated using Equation (3.2), which incorporates Ground Sample Distance (GSD):
For example, using orthophotos generated from aerial images captured at 10 m altitude, the tile size can be changed from 256 × 256 px to 128 × 128 px to replicate the crack scale observed at 5 m altitude. In the case of the EVO II Pro used in this study, the GSD at 5 m altitude is 0.11 cm/px, the original tile size is 256 px, and the GSD at 10 m altitude is 0.23 cm/px. Using Equation (3.2), the calculated tile size for simulating 5 m altitude becomes 128 px.
Figure 3 illustrates the effectiveness of the pseudo-altitude slicing method. Image (a) simulates a 5 m altitude observation using a 128 × 128 px tile derived from a 10 m orthophoto, while image (b) is an actual 5 m altitude capture at 256 × 256 px. Although their image sharpness differs, the proportion of crack area within these images is similar, confirming the effectiveness of the scale adjustment through pseudo-altitude slicing. In contrast, image (c), derived directly from a 10 m orthophoto without scale adjustment (256 × 256 px), exhibits a significantly different crack scale, highlighting the necessity of scale alignment for effective crack detection. The detailed quantitative evaluation of these image division techniques is presented in Section 4.
3.3. Crack Detection Model Using Deep Learning
In deep learning, constructing a high-accuracy detection model requires a large amount of training data. However, relying solely on the original dataset prepared in this study (294 image sets) was insufficient for training a robust model. Therefore, we additionally utilized the publicly available dataset SDNET2018 [14] to supplement the training data. Previous literature reviews, such as that by Kaveh and Alhajj [15], have emphasized that combining publicly available datasets with additional, task-specific data significantly enhances a model’s generalization capabilities and practical applicability in diverse structural inspection contexts.
SDNET2018 is an image dataset intended for training, validation, and benchmarking of AI algorithms for concrete crack detection. The SDNET2018 dataset includes 56,092 images, each with a resolution of 256 × 256 px, depicting concrete bridge decks, walls, and pavements with and without cracks. The dataset contains cracks ranging in width from 0.06 mm to 25 mm, and also includes various image conditions such as shadows, surface roughness, scaling, edges, holes, and background debris. SDNET2018 has been widely adopted in recent studies for training and evaluating concrete crack detection models. For instance, Fang et al. [16] utilized SDNET2018 to develop a hybrid approach combining deep belief networks and an improved fish swarm optimization algorithm, demonstrating its applicability for optimizing model performance under various crack conditions.
In this study, 2,300 images resembling cracks typically found on port quay walls were manually selected from the SDNET2018 dataset and annotated to form an extended dataset for training. The use of SDNET2018 not only increases the volume of training data but also enables the crack detection model to handle various types of cracks not present in the original dataset, thereby improving the model’s generalization capability. The evaluation of the prepared dataset is discussed in detail in Section 4.
Semantic segmentation approaches, such as U-Net [17], are effective in capturing detailed spatial patterns of cracks but typically require considerable computational resources and longer inference times. In contrast, this study adopted a YOLO-based object detection approach, specifically YOLOR (You Only Learn One Representation) [18], to maintain practical accuracy while significantly improving inference speed, making it more suitable for real-world inspection scenarios. The practical effectiveness of YOLOR in detection tasks has been verified by previous research. For example, Guzmán-Torres et al. [19] successfully applied YOLOR for real-time vehicle detection and tracking in urban traffic environments, confirming its robustness under diverse real-world conditions.
In the developed crack detection process, orthophoto tiles obtained through the image division methods (described in Section 3.2) are individually analyzed to identify and localize cracks. The deep learning model was implemented using the PyTorch framework, and the detected cracks are visualized as bounding boxes (Figure 4). To facilitate practical inspection management, the system assigns geographic coordinates calculated from orthophotos to each detected crack, and outputs this information in JavaScript Object Notation (JSON) format. This structured data enables tracking crack progression over time by comparing inspection results across multiple periods using GIS. Additionally, this method lays the groundwork for future enhancements, such as automatically calculating the total length of cracks and assessing the structural health of each inspection unit, thus contributing to the quantitative evaluation of port quay wall conditions.
The integration of geographic information with AI-based detection results significantly improves capabilities for spatiotemporal analysis and infrastructure management. Similar benefits have been demonstrated in recent geospatial AI studies that mapped risks such as flood exposure in national road networks, highlighting the broader applicability and utility of location-aware detection systems [20].
4. Result
In this chapter, we first evaluate the effectiveness of the training datasets and image division techniques prepared in this study. Based on these evaluations, we identify the dataset and division strategy that deliver the highest detection performance. Next, to assess the practical applicability of the developed system, we conduct a comparative analysis against a well-established commercial system. This involves comparing the results from conventional visual inspections with those obtained from the detection system to determine how accurately the system can detect cracks with a target width of 1 mm, which is the main focus of this study.
As evaluation metrics, we use precision, which indicates the accuracy of the detected results, and recall, which measures how comprehensively cracks are detected. Precision and recall are calculated using Equations (4.1) and (4.2), respectively, and ground truth crack labels prepared based on visual inspection.
For the evaluation of training datasets and the overlapping image tiling method, aerial images captured at flight altitudes of 5 m, 10 m, 15 m, and 20 m were used to assess the influence of flight altitude on detection performance. For evaluating the pseudo-altitude slicing method, orthophotos generated from aerial images taken at a flight altitude of 10 m were utilized.
4.1. Comparative Evaluation Using Different Datasets
In this study, two types of training datasets were used for YOLOR model training: an original dataset (294 image sets) [21] created from aerial images obtained independently, and the publicly available dataset SDNET2018 (2,300 image sets). In this section, three types of object detection models were trained using (1) the original dataset only, (2) SDNET2018 only, and (3) a combination of both datasets, to determine which dataset configuration yields the best performance. Since deep learning inference results may vary depending on the model, five models were trained for each dataset configuration. For each model, precision and recall were calculated and then averaged. The results are shown in Figure 5.
For evaluation, aerial images captured at altitudes of 5 m, 10 m, 15 m, and 20 m at three test sites were used. The precision results show that, across all altitudes and in overall averages, the combination of the original dataset and SDNET2018 yielded the highest scores, while the original dataset alone produced the lowest scores. The average difference in precision between these two configurations was approximately 10%. On the other hand, in terms of recall, the original + SDNET2018 configuration showed the highest recall at 5 m altitude, but at other altitudes, the original-only configuration yielded the highest recall. However, the differences in recall were relatively small compared to the precision gap: 1.7% at 10 m, 4.2% at 15 m, 2.2% at 20 m, and 1.5% in the overall average. Although the 4.2% difference at 15 m is somewhat larger, the overall average difference in recall remains around 1.5%. Considering the 10% gap in precision, the combination of the original and SDNET2018 datasets is considered the most balanced and optimal for constructing a robust crack detection model, achieving a precision of 81.5% and a recall of 62.9%.
4.2. Performance Evaluation of the Overlapping Image Tiling Method
This section evaluates the effectiveness of the overlapping image tiling method. Five models trained using the combined dataset of original + SDNET2018 (as selected in the previous section) were used to calculate the average precision and recall with and without the overlapping tiling method, in order to verify its effectiveness. In terms of precision, there was a slight decrease of about 1% at a flight altitude of 10 m when overlapping was applied, but no significant improvement was observed. On the other hand, recall showed an improvement of more than 20% at all altitudes compared to the non-overlapping condition. Notably, at an altitude of 5 m, recall improved to over 80% (Figure 6). Comparing detection results with and without overlapping, cracks that had previously been missed without overlapping were successfully detected when overlapping was introduced. A detailed look at the divided image tiles where missed detections occurred shows that the cracks were located at the boundaries of the images. Through the use of overlapping tiles, these cracks were brought closer to the center of the tile, which allowed them to be detected successfully. From these results, it can be concluded that the overlapping image tiling method significantly reduces missed detections caused by tile boundaries and provides stable detection performance regardless of flight altitude. On average, recall improved by more than 20% across all altitudes, quantitatively demonstrating the effectiveness of the method.
4.3. Performance Evaluation of the Pseudo-Altitude Slicing Method
In this section, we evaluate the pseudo-altitude slicing method, which adjusts the scale of cracks within tiled images to improve recall. For this verification, orthophotos of port quay walls generated from aerial images captured at an actual flight altitude of 10 m were cropped at the test sites, and precision and recall were calculated. Based on the actual flight altitude of 10 m, pseudo altitudes of 5 m and 15 m were simulated. Four combinations were evaluated: (1) 10 m only, (2) pseudo 5 m + 10 m, (3) 10 m + pseudo 15 m, and (4) pseudo 5 m + 10 m + pseudo 15 m. The tile sizes were set to 128 px for pseudo 5 m, 256 px for 10 m, and 384 px for pseudo 15 m. Each tile size was calculated using Equation (3.2) based on the corresponding pseudo-altitude setting.
Figure 7 shows the precision and recall results for the four altitude combinations at three test sites. In terms of precision, the combination of pseudo altitudes produced varied results depending on the test site, and no consistent improvement was observed. However, recall tended to improve overall when combining pseudo altitudes. For example, Figure 8 illustrates a crack (highlighted in red) that was not detected in the aerial image at 10 m altitude (green bounding box) but was successfully detected using the pseudo 5 m image (red bounding box). To ensure a fair comparison, concrete joints, which are not actual cracks, were excluded from the evaluation by applying masks. The white-shaded areas in the figure indicate these masked regions. This result suggests that the crack could not be detected in the 10 m image due to a mismatch in scale with the training data, whereas adjusting the tile size using the pseudo-altitude slicing method enabled successful detection. Compared to using 10 m images alone, the combination with pseudo 5 m images improved the overall average recall by approximately 6%. This improvement is attributed to the pseudo-altitude slicing method making it easier for the crack scale in the images to match that of the training data. In particular, the ability to detect previously missed narrow cracks is expected to contribute significantly to preventing oversights in practical applications.
While recall improved across all combinations, visual inspection suggests that the higher recall observed at pseudo 15 m may be attributed to the presence of larger bounding boxes rather than genuine improvements in detection accuracy. Therefore, in this evaluation, the effectiveness of the pseudo 5 m setting was confirmed, whereas the benefit of the pseudo 15 m setting remains inconclusive without further detailed analysis. Although the introduction of pseudo-altitude slicing led to a slight decrease in precision, its impact was relatively minor. Given the nature of crack inspection tasks, missed detections are generally more critical than false positives. Based on these results, the combination of pseudo 5 m and 10 m imagery appears to contribute most effectively to enhancing recall performance.
Figure 8 provides a visual example illustrating this improvement. The red-shaded area indicates the actual crack location, while the white-shaded area represents the masked region excluded from evaluation. The red bounding box shows the detection result obtained using the pseudo 5 m image tile, whereas the green bounding box shows the result using the 10 m image tile. The figure demonstrates that the pseudo 5 m approach enables more accurate detection in cases where the 10 m image fails to capture fine cracks, validating the effectiveness of pseudo-altitude slicing in practical scenarios.
4.4. Benchmark Comparison with a Commercial System
In the previous sections, the effectiveness of the developed image division techniques and datasets was evaluated using the performance metrics defined in this study, namely precision and recall. In this section, we benchmark the crack detection system developed in this study against a well-established commercial system to assess its current level of practicality. The benchmark evaluation was conducted at the same three test sites as before. At each site, cracks of varying widths, which were recorded through visual inspection, were assigned ID numbers. The presence or absence of detection for each crack was compared between the two systems. Note that the performance metrics from previous sections were not used here because our system outputs detected cracks as rectangular bounding boxes, whereas the commercial system visualizes crack areas by coloring them. Due to this fundamental difference in output format, the metrics used earlier are not suitable for direct comparison in this benchmark. As for the results from the three test sites, the developed system showed more false positives due to vegetation and other noise, but the crack detection rate was comparable to that of the commercial system, confirming near-equal performance. For instance, at one of the test sites shown in Figure 9, differences were observed in detection results for cracks #4 (width 1 mm), #9 (width over 5 mm), and #13 (width 0.5 mm), as shown in Table 1. Cracks #4 and #9 were partially missed by our system but fully detected by the commercial system. On the other hand, crack #13 was partially detected by our system but missed entirely by the commercial system. These results demonstrate that our system is capable of detecting certain cracks that the commercial system fails to detect. Moreover, all cracks with a width of 1 mm, excluding #4, were successfully detected, indicating that the developed system meets the target detection performance for 1 mm cracks set in this study. Further analysis of false positives and missed detections revealed that the primary sources of errors were vegetation and minor debris. Introducing a secondary classification stage to filter these false detections is expected to substantially improve overall precision, as discussed in Section 5.
From a system perspective beyond detection accuracy, the workflow of the commercial system is similar to what our study aims to achieve. However, being a commercial product, its technical specifications are not publicly available. Moreover, it requires high-performance and costly image acquisition equipment to guarantee its performance. It also imposes limitations on image size and the number of images that can be processed. Additionally, the detection results produced by the commercial system do not contain geographic information, making it difficult to apply the results in practical scenarios. In contrast, our system leverages open-source tools, and many implementation details and use cases are publicly available. There are no restrictions on image size or quantity, and the output includes geographic coordinates, enabling easy time-series analysis and integration with other geospatial data for advanced analysis. These aspects demonstrate the advantages of our system over commercial alternatives.
5. Conclusions
This study aimed to develop a sustainable inspection method for port infrastructure by utilizing small general-purpose drones operated by local government personnel in direct inspection scenarios, combined with deep learning technologies. To address the technical limitation of image resolution due to low-cost onboard cameras, the system integrated deep learning-based image recognition with advanced image division techniques, achieving performance that meets the crack inspection criteria for port quay walls.
To evaluate the practicality of the developed crack detection system, a performance comparison was conducted with a commercial system. Although the proposed system demonstrated comparable detection rates, it revealed a challenge in reduced precision due to false positives. To mitigate this issue, future work will incorporate a two-stage detection approach by adding a classification model after initial detection. Similar two-stage frameworks have proven effective in prior deep learning-based crack detection studies, distinguishing true cracks from non-structural elements such as stains or debris [22,23]. Furthermore, future evaluations will include additional metrics such as the F1-score and Intersection over Union (IoU) to offer a more comprehensive assessment of system performance beyond accuracy and recall.
To enhance the reproducibility and practical utility of the proposed system, key components of the detection code and processing modules will be publicly released on GitHub. Additionally, the original annotated dataset comprising 294 drone-captured crack images is already available at: https://github.com/omu-geolab/CrackImageDatasetForDeepLearning. These publicly accessible resources are expected to support further research and encourage the adoption of advanced inspection methodologies, particularly by local governments and infrastructure managers in regions with limited technical resources.
Since the current system remains a prototype, the next phase of development will focus on enhancing its practical deployability. A lightweight, platform-independent implementation will be created, featuring a user-friendly, web-based interface designed specifically for on-site inspections. This approach aims to enable non-technical personnel, such as local government staff, to easily upload orthophotos and receive real-time crack detection results without the need for specialized computing resources. Pilot deployments and usability assessments will be conducted in collaboration with municipal agencies to ensure that the system seamlessly integrates into existing inspection workflows and effectively meets operational needs.
Author Contributions
Conceptualization, Daiki Komi, Daisuke Yoshida and Tomohito Kameyama; methodology, Daiki Komi and Daisuke Yoshida; software, Daiki Komi, Daisuke Yoshida and Tomohito Kameyama; investigation, Daiki Komi, Daisuke Yoshida and Tomohito Kameyama; writing—original draft preparation, Daiki Komi; writing—review and editing, Daisuke Yoshida; visualization, Daiki Komi and Tomohito Kameyama; supervision, Daisuke Yoshida; project administration, Daisuke Yoshida; funding acquisition, Daisuke Yoshida.
Funding
This research was supported by JSPS KAKENHI Grant Number JP23K11339 and the JST Co-Creation Field Formation Support Program JPMJPF2115.
Data Availability Statement
The original data of crack image dataset for deep learning presented in the study are openly available in GitHub at [https://github.com/omu-geolab/CrackImageDatasetForDeepLearning].
Acknowledgments
The authors would like to express their sincere gratitude to the Osaka Ports and Harbors Bureau for providing access to experimental sites and inspection data. Additionally, the GNSS correction data service was generously supported by Terasat Japan Co., Ltd.
Conflicts of Interest
The funders had no role in the design of the study.
Abbreviations
The following abbreviations are used in this manuscript:
| CNN | Convolutional Neural Networks |
| GCP | Ground Control Point |
| GIS | Geographic Information System |
| GNSS | Global Navigation Satellite System |
| GSD | Ground Sample Distances |
| IoU | Intersection over Union |
| JSON | JavaScript Object Notation |
| MLIT | the Ministry of Land, Infrastructure, Transport and Tourism |
| YOLO | You Only Look Once |
| YOLOR | You Only Learn One Representation |
References
- Ministry of Land, Infrastructure, Transport and Tourism (MLIT). Current Status and Future of Aging Infrastructure. Available online: https://www.mlit.go.jp/sogoseisaku/maintenance/02research/02_01.html (accessed on 13 May 2025).
- Gurara, D.; Klyuev, V.; Mwase, N.; Presbitero, A.; Xu, X.C. Trends and Challenges in Infrastructure Investment in Low-Income Developing Countries. IMF Working Paper 2017. https://www.imf.org/en/Publications/WP/Issues/2017/11/07/Trends-and-Challenges-in-Infrastructure- Investment-in-Low-Income-Developing-Countries-45339 (accessed on 13 May 2025).
- Redmon, J.; Divvala, S.; Girshick, R.; Farhadi, A. You Only Look Once: Unified, Real-Time Object Detection. arXiv arXiv:1506.02640, 2016.
- Shigemura, T.; Nomura, Y. A Two-Step Screening System for Surface Crack Using Object Detection and Recognition Technique Based on Deep Learning. J. Soc. Mater. Sci. Jpn. 2020, 69, 218–225. [Google Scholar] [CrossRef]
- Woo, H.-J.; Seo, D.-M.; Kim, M.-S.; Park, M.-S.; Hong, W.-H.; Baek, S.-C. Localization of Cracks in Concrete Structures Using an Unmanned Aerial Vehicle. Sensors 2022, 22, 6711. [Google Scholar] [CrossRef] [PubMed]
- Sun, C.; Meng, X.; Efficient, Low-Cost Bridge Cracking Detection and Quantification Using Deep Learning and UAV Images. Transportation Consortium of South-Central States 2021. Available online: https://rosap.ntl.bts.gov/view/dot/61825 (accessed on 13 May 2025).
- Kim, H.; Lee, J.; Ahn, E.; Cho, S.; Shin, M.; Sim, S.H. Concrete Crack Identification Using a UAV Incorporating Hybrid Image Processing. Sensors 2017, 17(9), 2052. [Google Scholar] [CrossRef] [PubMed]
- Ministry of Land, Infrastructure, Transport and Tourism (MLIT). Inspection and Diagnosis Guidelines for Port Facilities [Part 2: Implementation Manual]. 2014. Available online: https://www.mlit.go.jp/kowan/content/001734486.pdf (accessed on 13 May 2025).
- Tsaimou, E.; Kounoudes, A.; Skarlatos, D. Crack Detection and Mapping on Port Concrete Pavements Using UAV-Based Orthophotos and GIS Tools. Clean Energy and Sustainability 2024. [CrossRef]
- Hamishebahar, Y.; Guan, H.; So, S.; Jo, J. A Comprehensive Review of Deep Learning-Based Crack Detection Approaches. Appl. Sci. 2022, 12, 1374. [Google Scholar] [CrossRef]
- Ju, X.; Zhao, X.; Qian, S. TransMF: Transformer-Based Multi-Scale Fusion Model for Crack Detection. Mathematics 2022, 10, 2354. [Google Scholar] [CrossRef]
- Ashraf, A.; Sophian, A.; Bawono, A.A. Crack Detection, Classification, and Segmentation on Road Pavement Material Using Multi-Scale Feature Aggregation and Transformer-Based Attention Mechanisms. Constr. Mater. 2024, 4, 655–675. [Google Scholar] [CrossRef]
- Yang, Y.; Yuan, S.; Wu, C.; Li, J.; Yu, Z. Multi-scale Feature Fusion for Pavement Crack Detection Based on Transformer. Math. Biosci. Eng. 2023, 20, 10568–10585. [Google Scholar] [CrossRef] [PubMed]
- Dorafshan, S.; Thomas, R.J.; Maguire, M. SDNET2018: An Annotated Image Dataset for Non-Contact Concrete Crack Detection Using Deep Convolutional Neural Networks. Data in Brief 2018, 21, 1664–1668. [Google Scholar] [CrossRef] [PubMed]
- Kaveh, A.; Alhajj, R. Recent advances in crack detection technologies for structures: a survey of 2022–2023 literature. Frontiers in Built Environment 2024, 10. [Google Scholar] [CrossRef]
- Fang, Z.; Wang, X.; Gao, J.; Yang, Y.; Chen, J. Optimizing Concrete Crack Detection: An Echo State Network Approach with Improved Fish Migration Optimization. Sci. Rep. 2025, 15, 40. [Google Scholar] [CrossRef] [PubMed]
- Ronneberger, O.; Fischer, P.; Brox, T. , U-Net: Convolutional Networks for Biomedical Image Segmentation. Proceedings of the International Conference on Medical Image Computing and Computer-Assisted Intervention (MICCAI), Munich, Germany, 5–9 October 2015; Navab, N., Hornegger, J., Wells, W.M., Frangi, A.F., Eds.; Lecture Notes in Computer Science, Volume 9351, pp. 234–241. Springer: Cham, 2015. [Google Scholar] [CrossRef]
- Wang, C.-Y.; Yeh, I.-H.; Liao, H.-Y.M. You Only Learn One Representation: Unified Network for Multiple Tasks. arXiv arXiv:2105.04206. https://arxiv.org/abs/2105.04206, 2021.
- Guzmán-Torres, J.A.; Domínguez-Mota, F.J.; Tinoco-Guerrero, G.; García-Chiquito, M.C.; Tinoco-Ruíz, J.G. Efficacy Evaluation of You Only Learn One Representation (YOLOR) Algorithm in Detecting, Tracking, and Counting Vehicular Traffic in Real-World Scenarios. AI 2024, 5, 1594–1613. [Google Scholar] [CrossRef]
- Rezvani, S.M.H.S.; Silva, M.J.; Almeida, N. Mapping Geospatial AI Flood Risk in National Road Networks. ISPRS Int. J. Geo-Inf. 2023, 13, 323. [Google Scholar] [CrossRef]
- Yoshida, D. Crack Image Dataset for Deep Learning. 2025. Available online: https://github.com/omu-geolab/CrackImageDatasetForDeepLearning (accessed on 13 May 2025).
- Mishra, M.; Jain, V.; Singh, S.K.; Maity, D. Two-Stage Method Based on the You Only Look Once Framework and Image Segmentation for Crack Detection in Concrete Structures. Arch. Struct. Constr. 2022, 3, 321–335. [Google Scholar] [CrossRef]
- Sorilla, J.; Chu, T.S.C.; Chua, A.Y. A UAV Based Concrete Crack Detection and Segmentation Using 2-Stage Convolutional Network with Transfer Learning. HighTech Innov. J. 2024, 5, Article 852. Available online: https://hightechjournal.org/index.php/HIJ/article/view/852 (accessed on 13 May 2025). [CrossRef]
Figure 1.
Flowchart of the crack detection system.
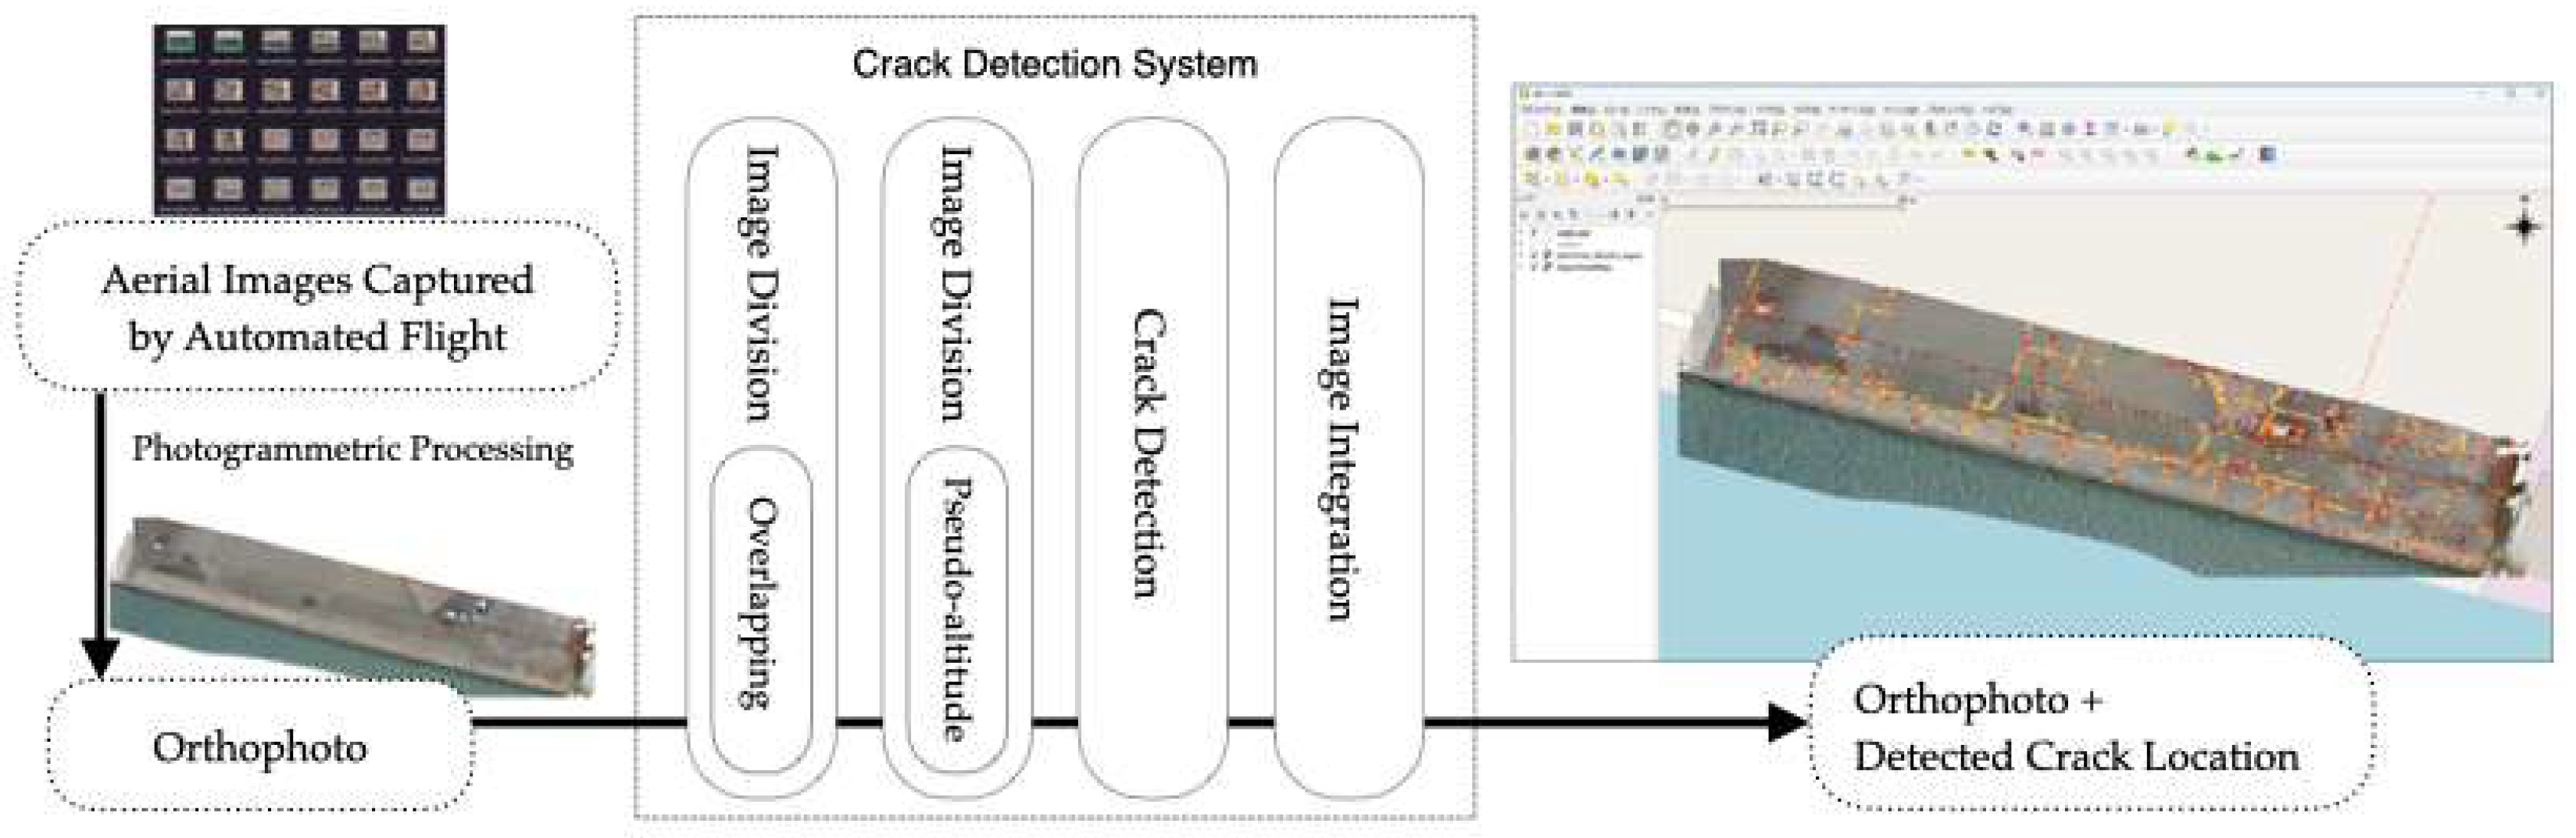
Figure 2.
Example of image tiling using overlapping method (50% overlap).

Figure 3.
Orthophoto tiles generated from the same location under different tile size configurations: (a) pseudo-altitude 5 m (generated from 10 m orthophoto, 128 × 128 px); (b) actual altitude 5 m, 256 × 256 px; (c) actual altitude 10 m, 256 × 256 px.
Figure 3.
Orthophoto tiles generated from the same location under different tile size configurations: (a) pseudo-altitude 5 m (generated from 10 m orthophoto, 128 × 128 px); (b) actual altitude 5 m, 256 × 256 px; (c) actual altitude 10 m, 256 × 256 px.
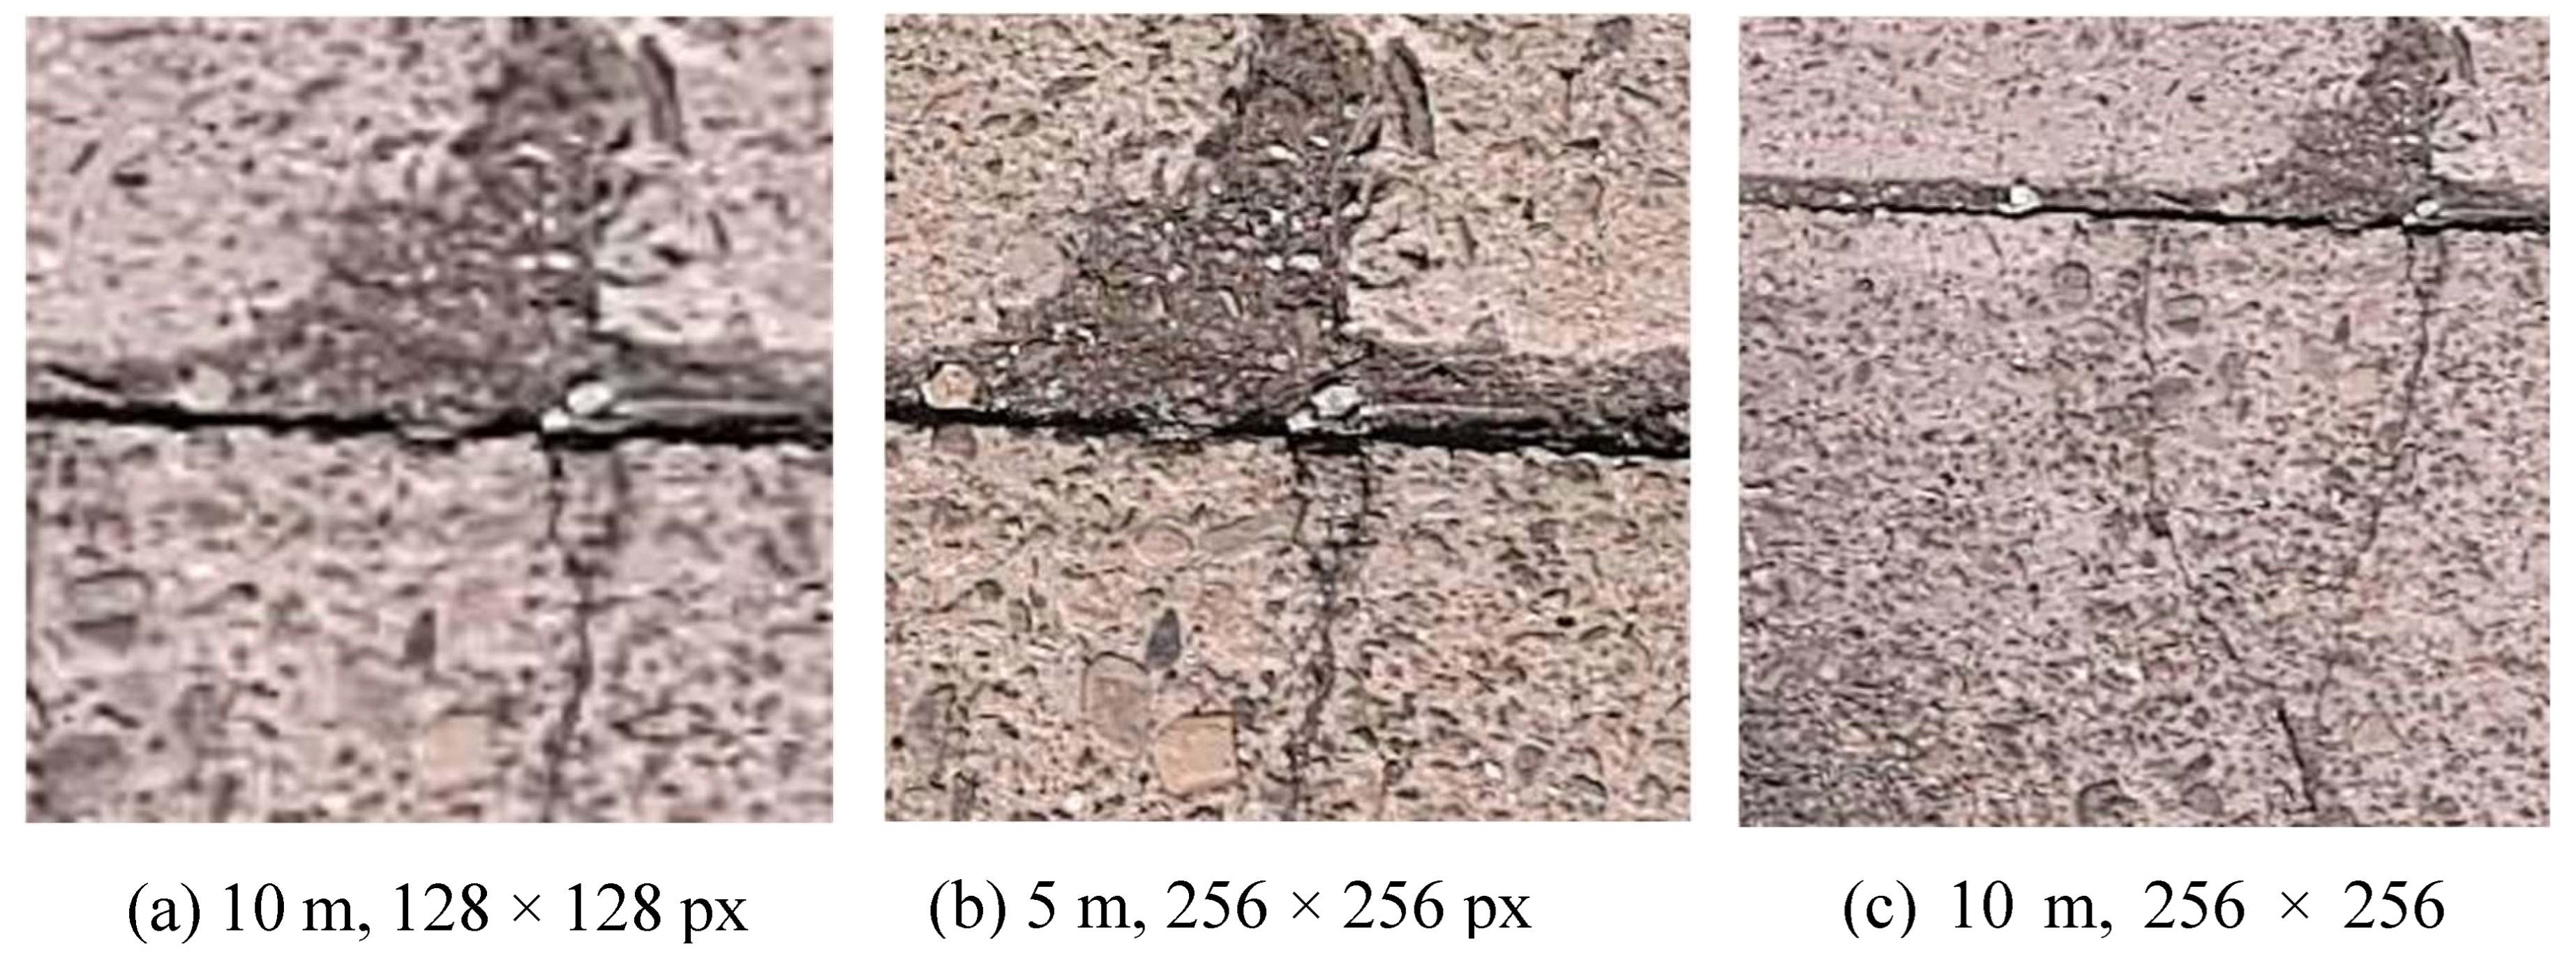
Figure 4.
Detection results displayed on the orthophoto. Red boxes: cracks detected by the system.
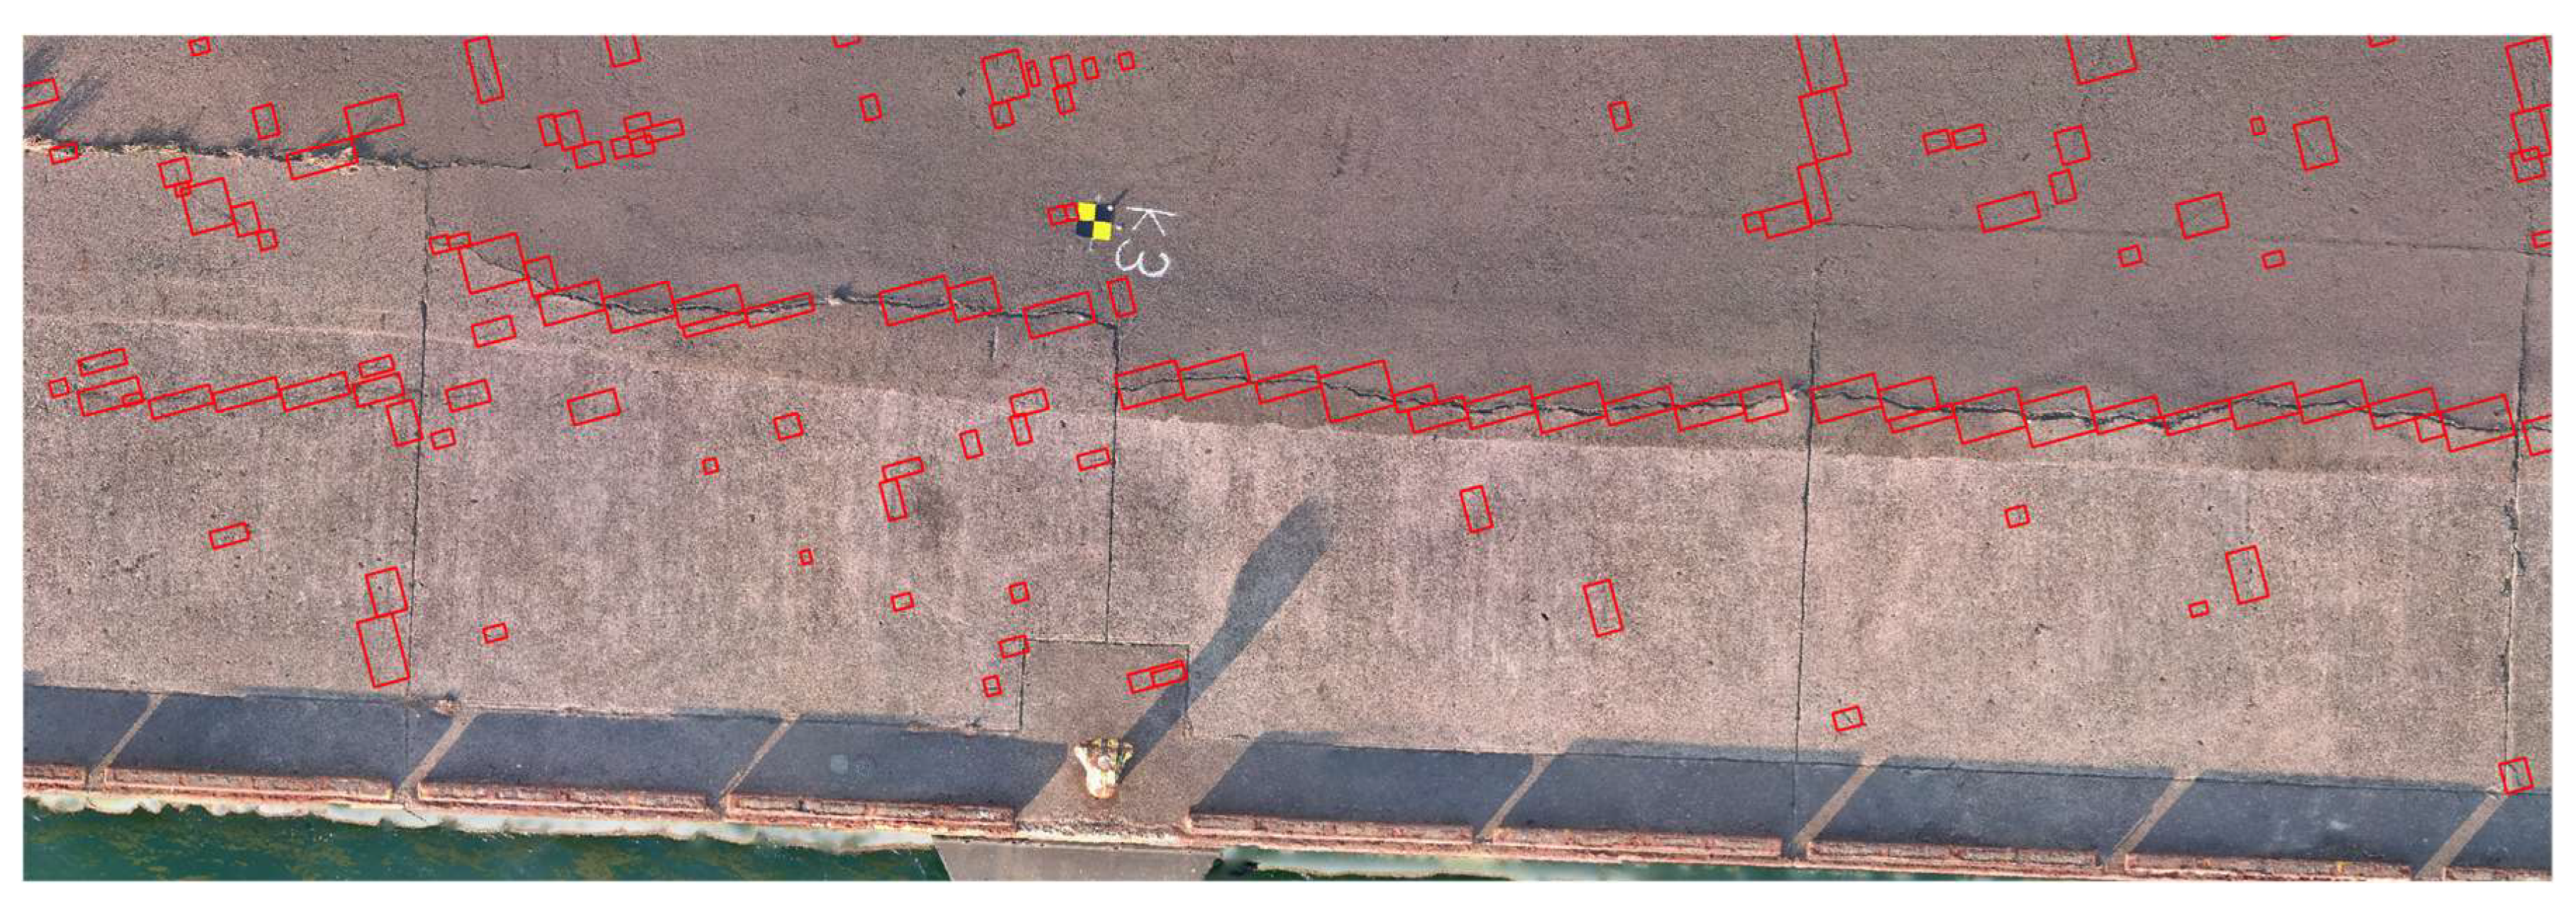
Figure 5.
Precision and recall results for each dataset.
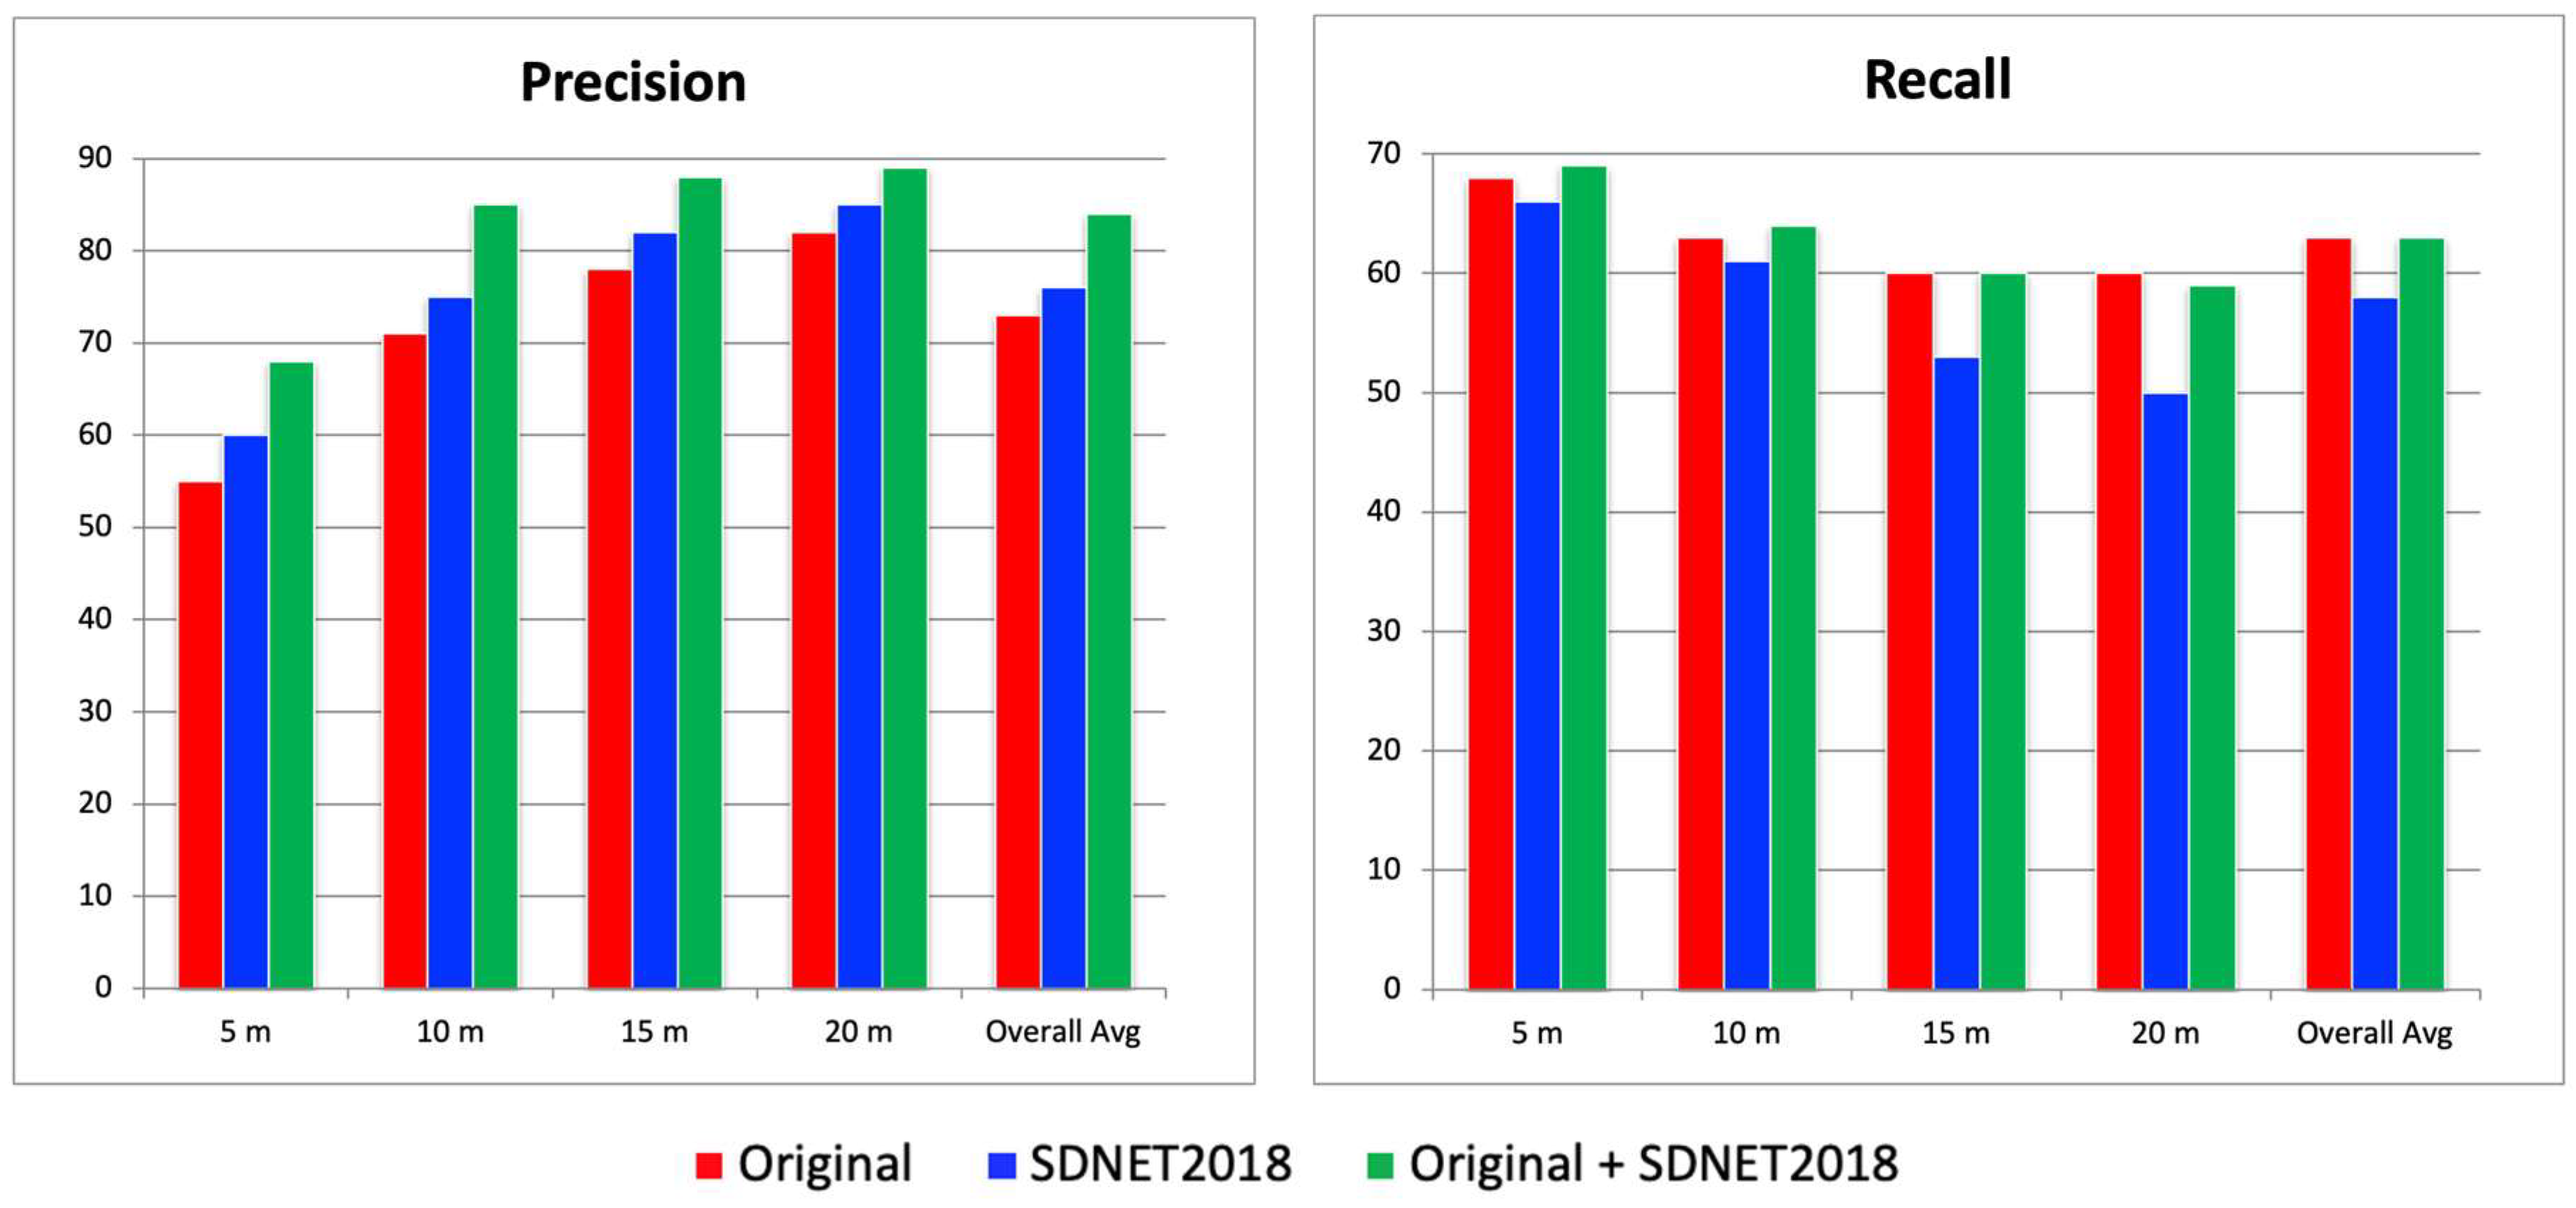
Figure 6.
Precision and recall results from the overlapping image tiling method.
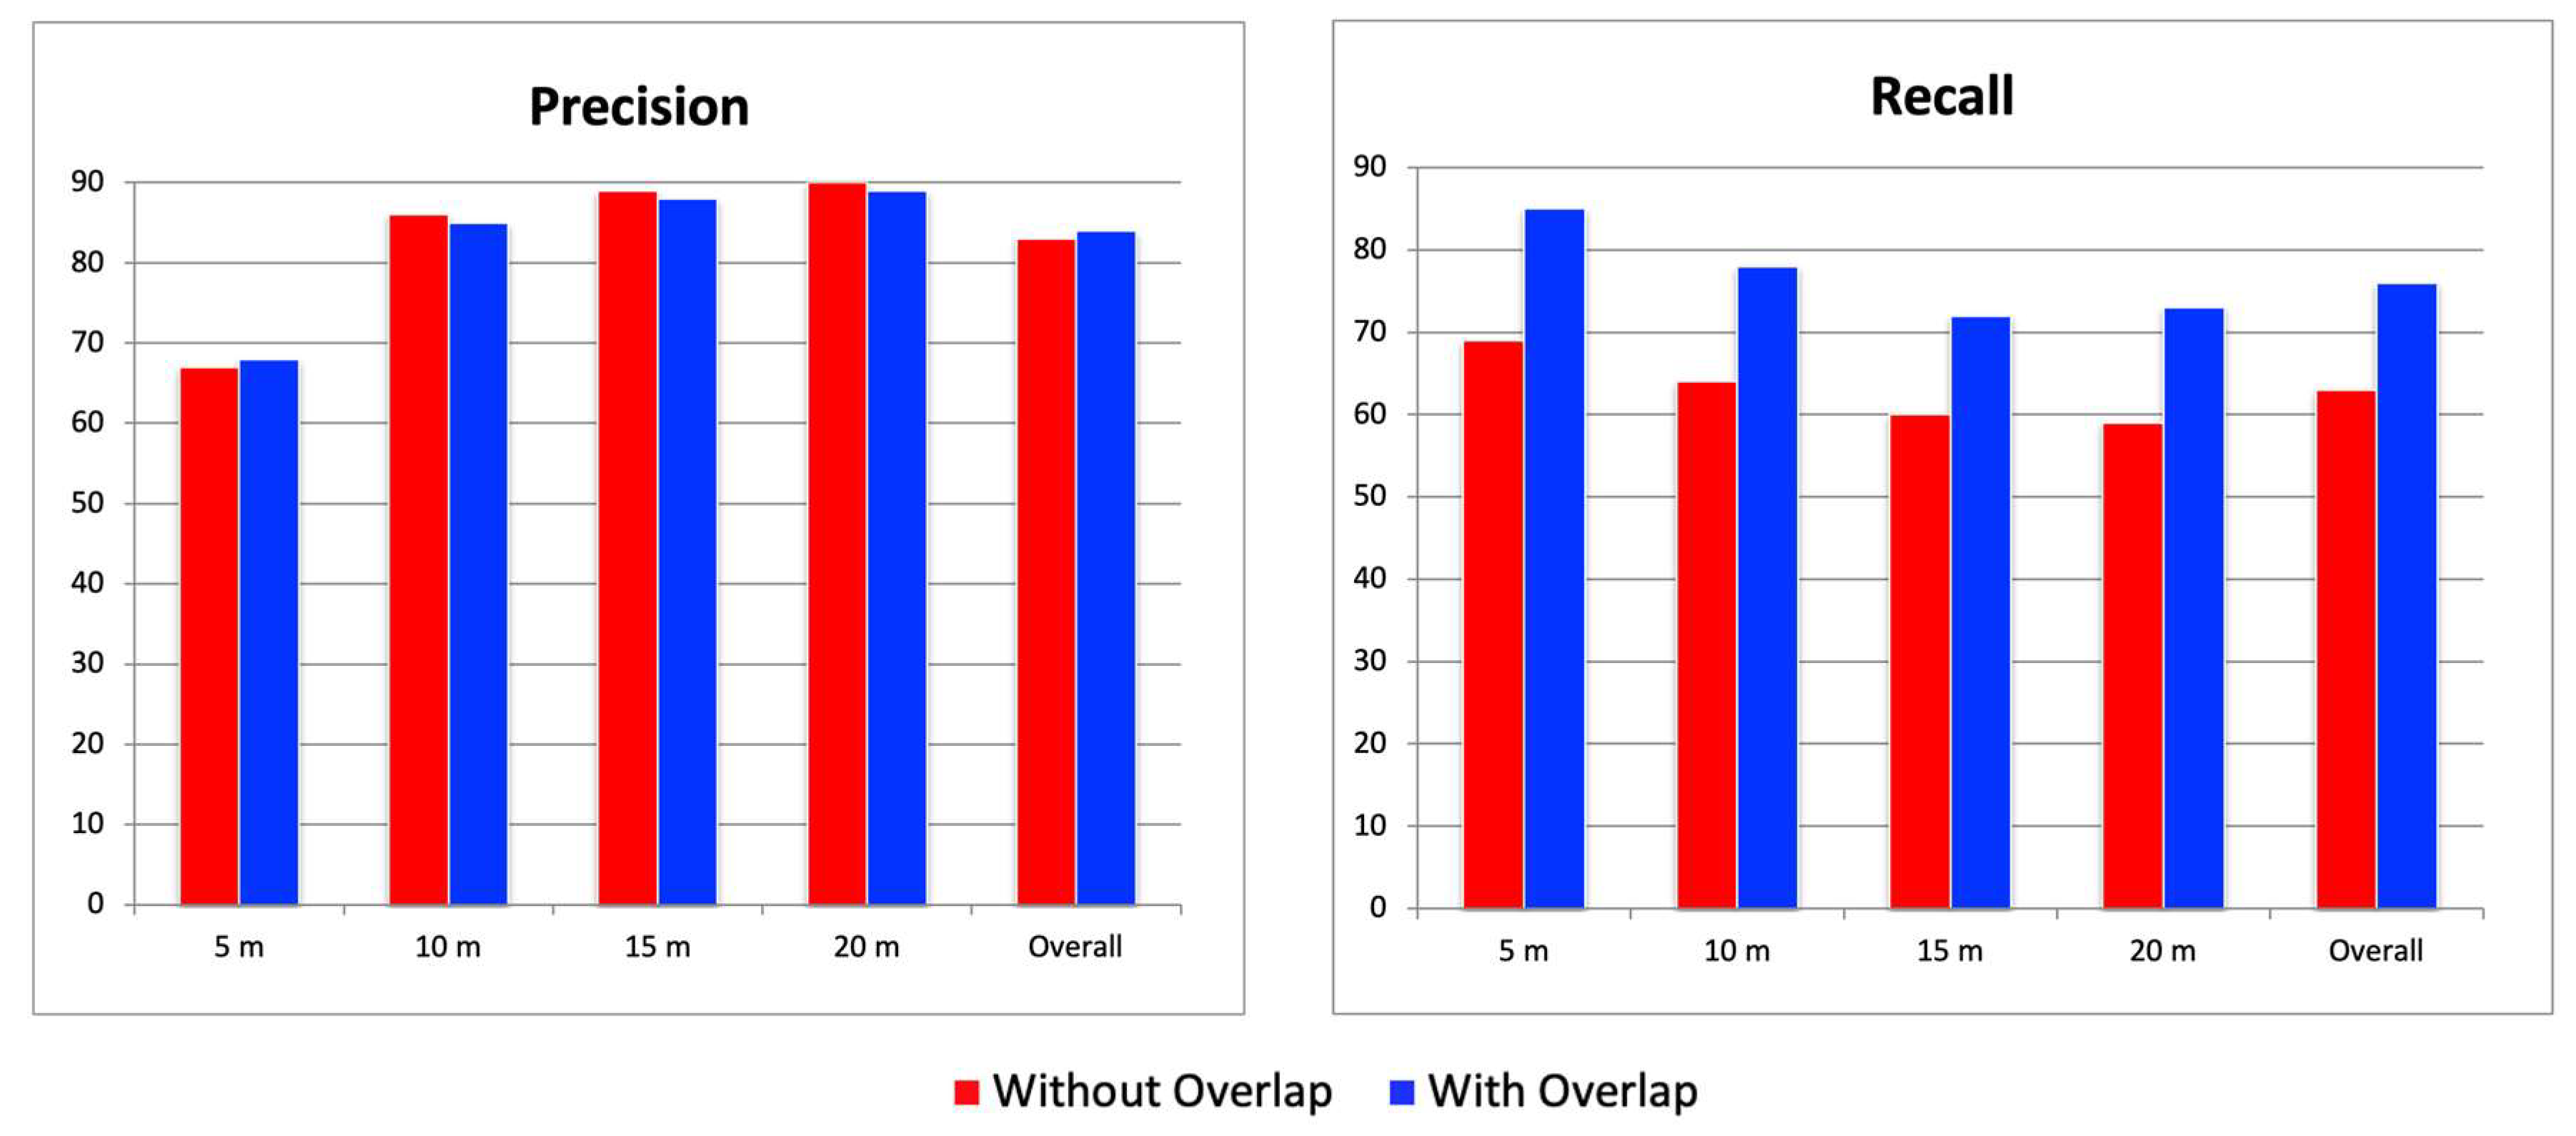
Figure 7.
Results of the pseudo-altitude slicing method. Red bars represent precision, while blue bars represent recall at different tile configurations.
Figure 7.
Results of the pseudo-altitude slicing method. Red bars represent precision, while blue bars represent recall at different tile configurations.
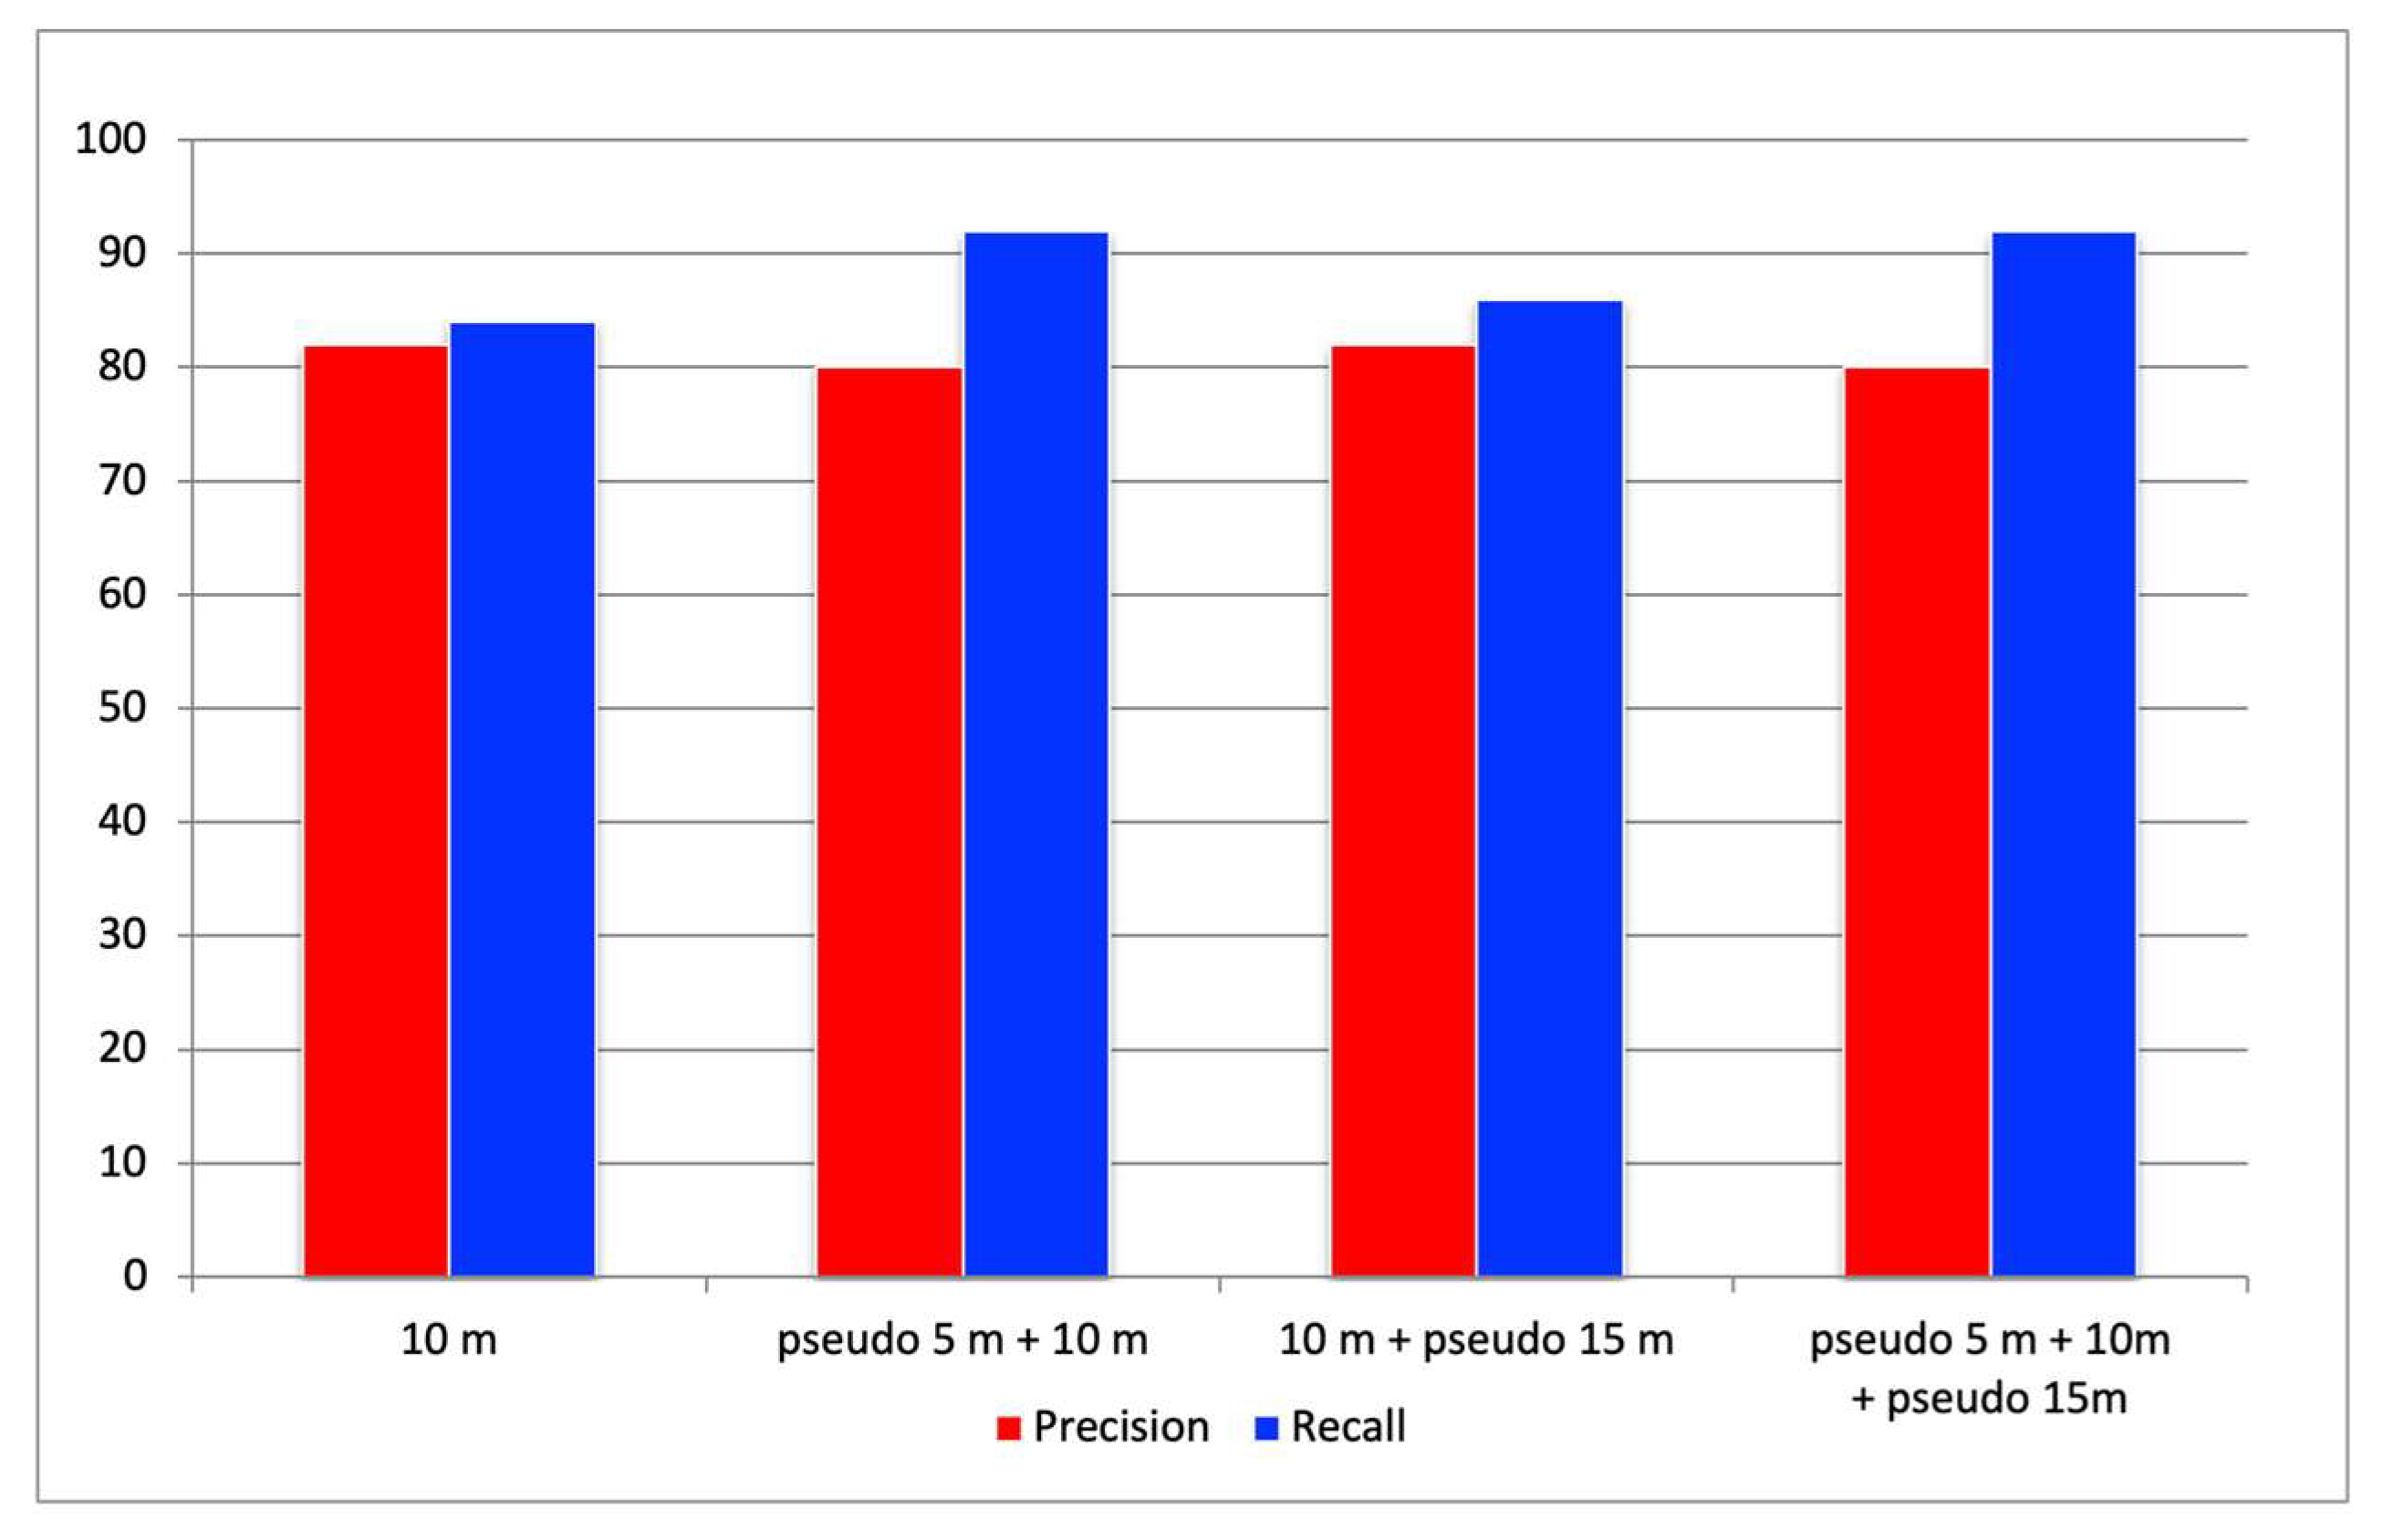
Figure 8.
Detection results using pseudo-altitude slicing. Red: ground-truth cracks; white: masked areas; red boxes: detections from pseudo 5 m tiles; green boxes: detections from 10 m tiles.
Figure 8.
Detection results using pseudo-altitude slicing. Red: ground-truth cracks; white: masked areas; red boxes: detections from pseudo 5 m tiles; green boxes: detections from 10 m tiles.
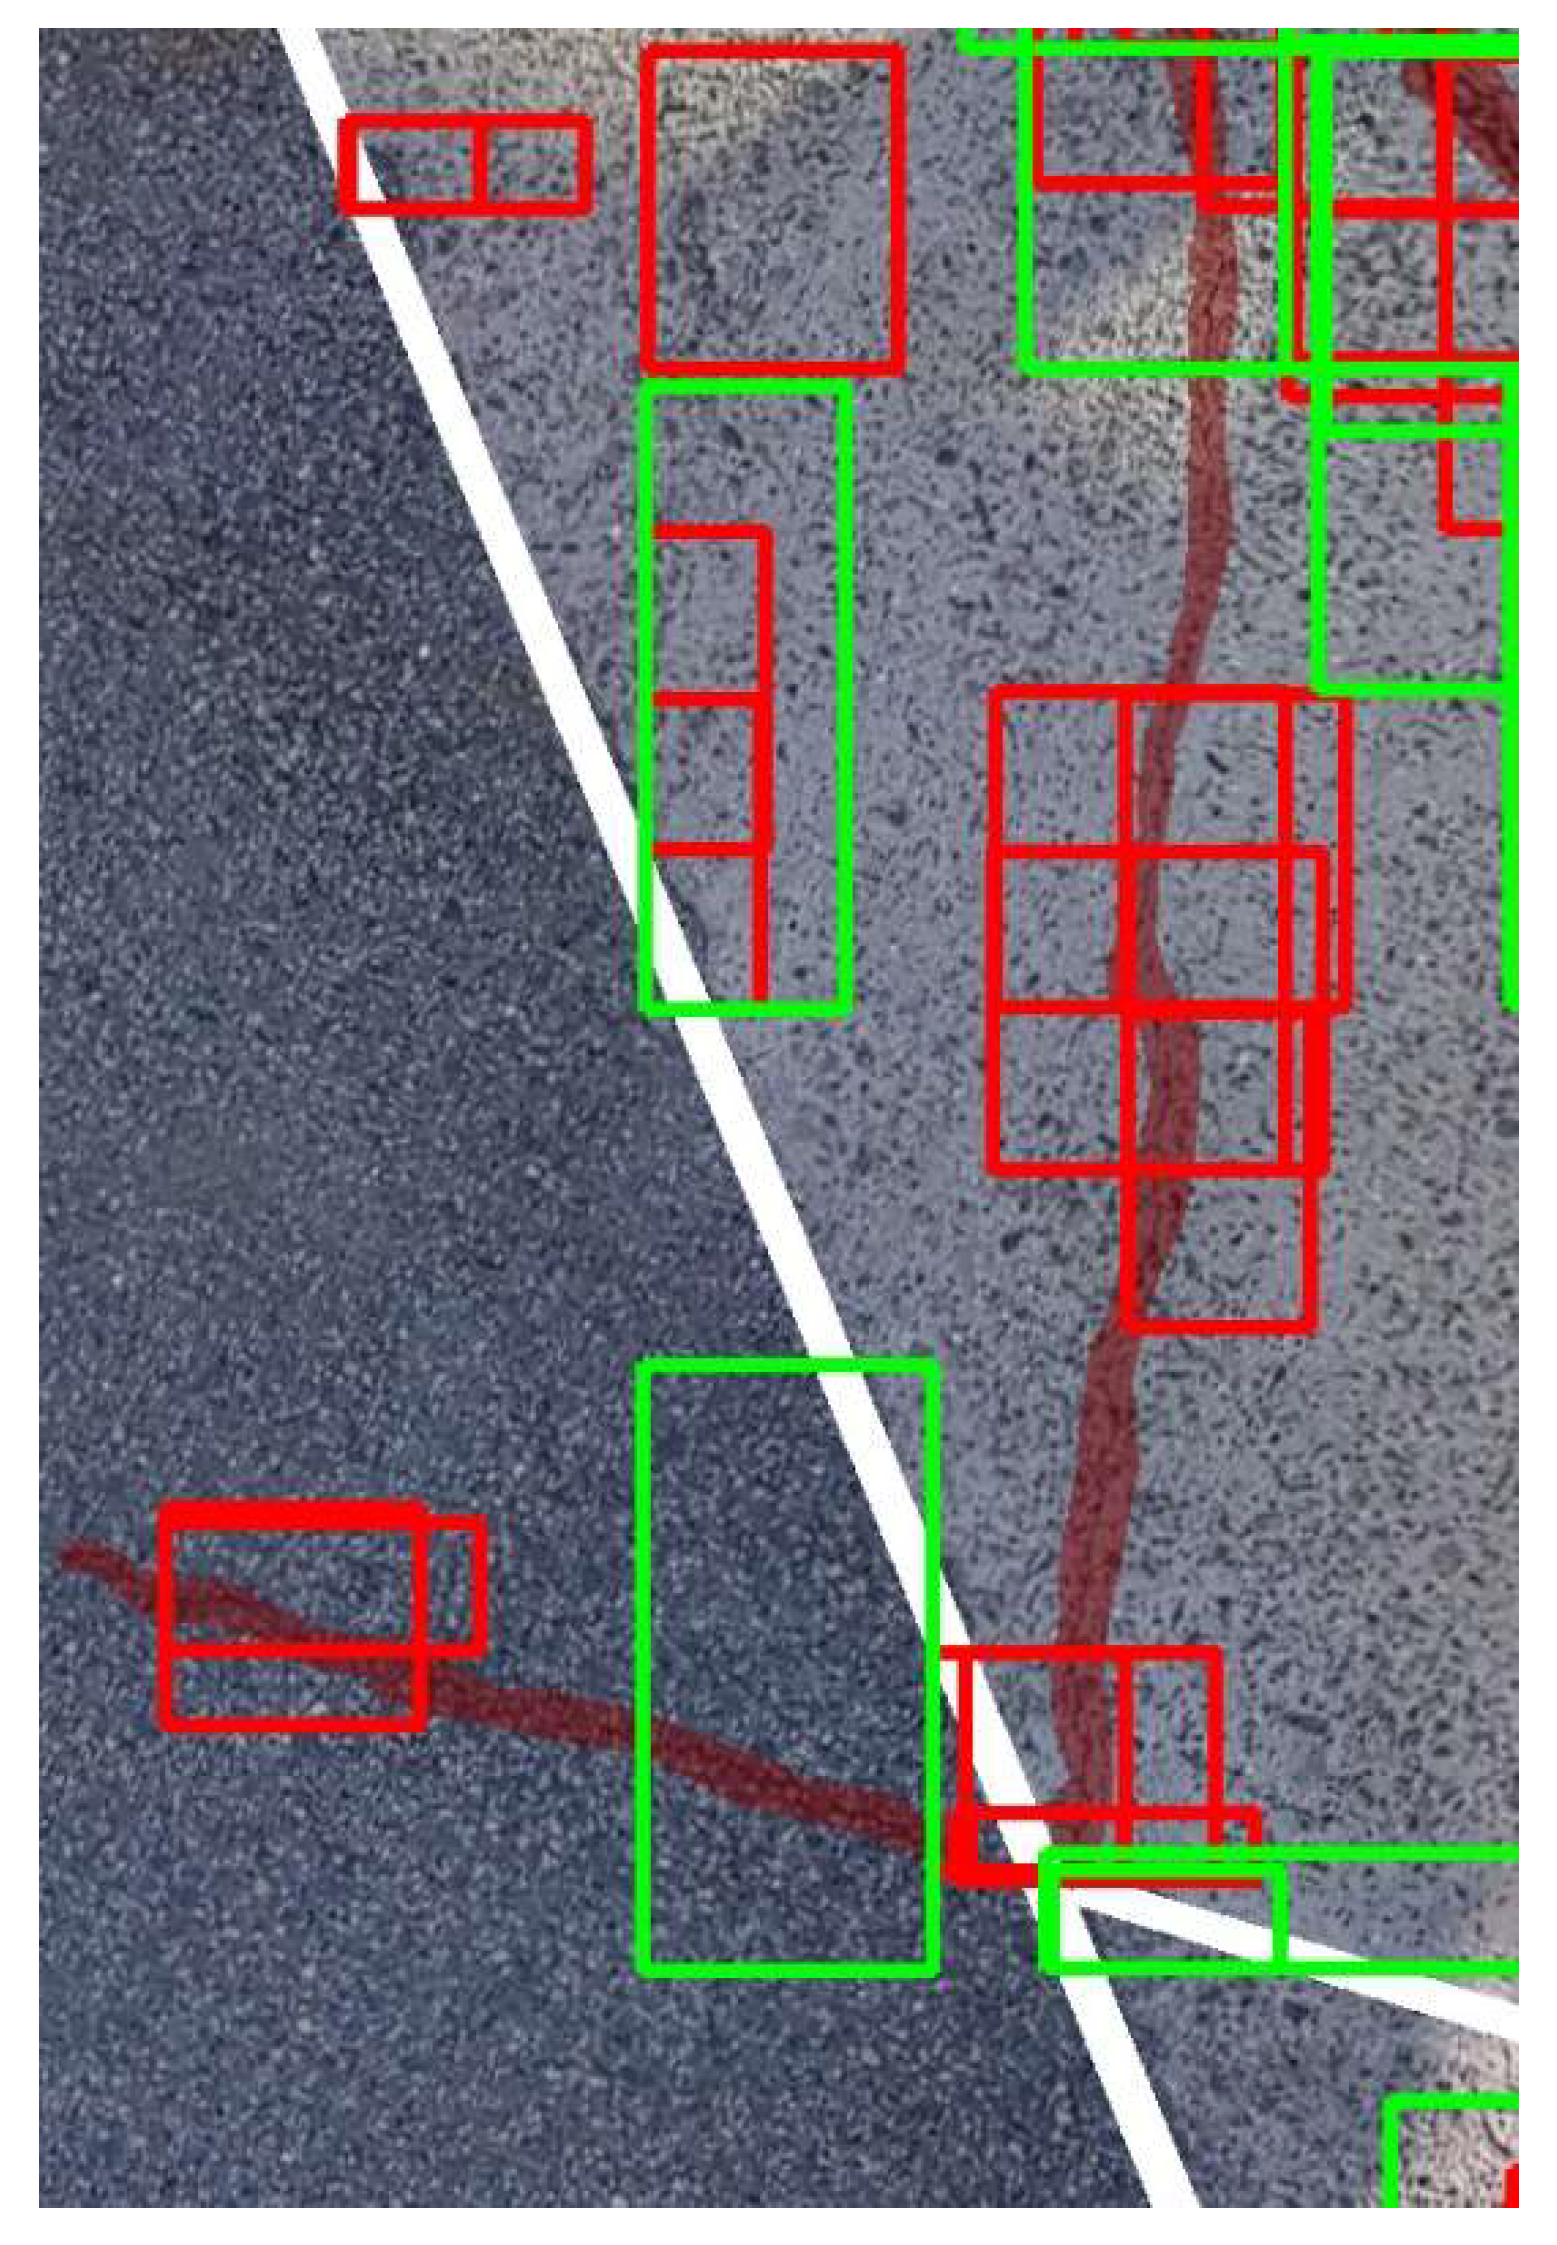
Figure 9.
Labeled image of cracks at the test site. Red: ground-truth cracks; white: masked areas; numbers denote crack IDs.
Figure 9.
Labeled image of cracks at the test site. Red: ground-truth cracks; white: masked areas; numbers denote crack IDs.
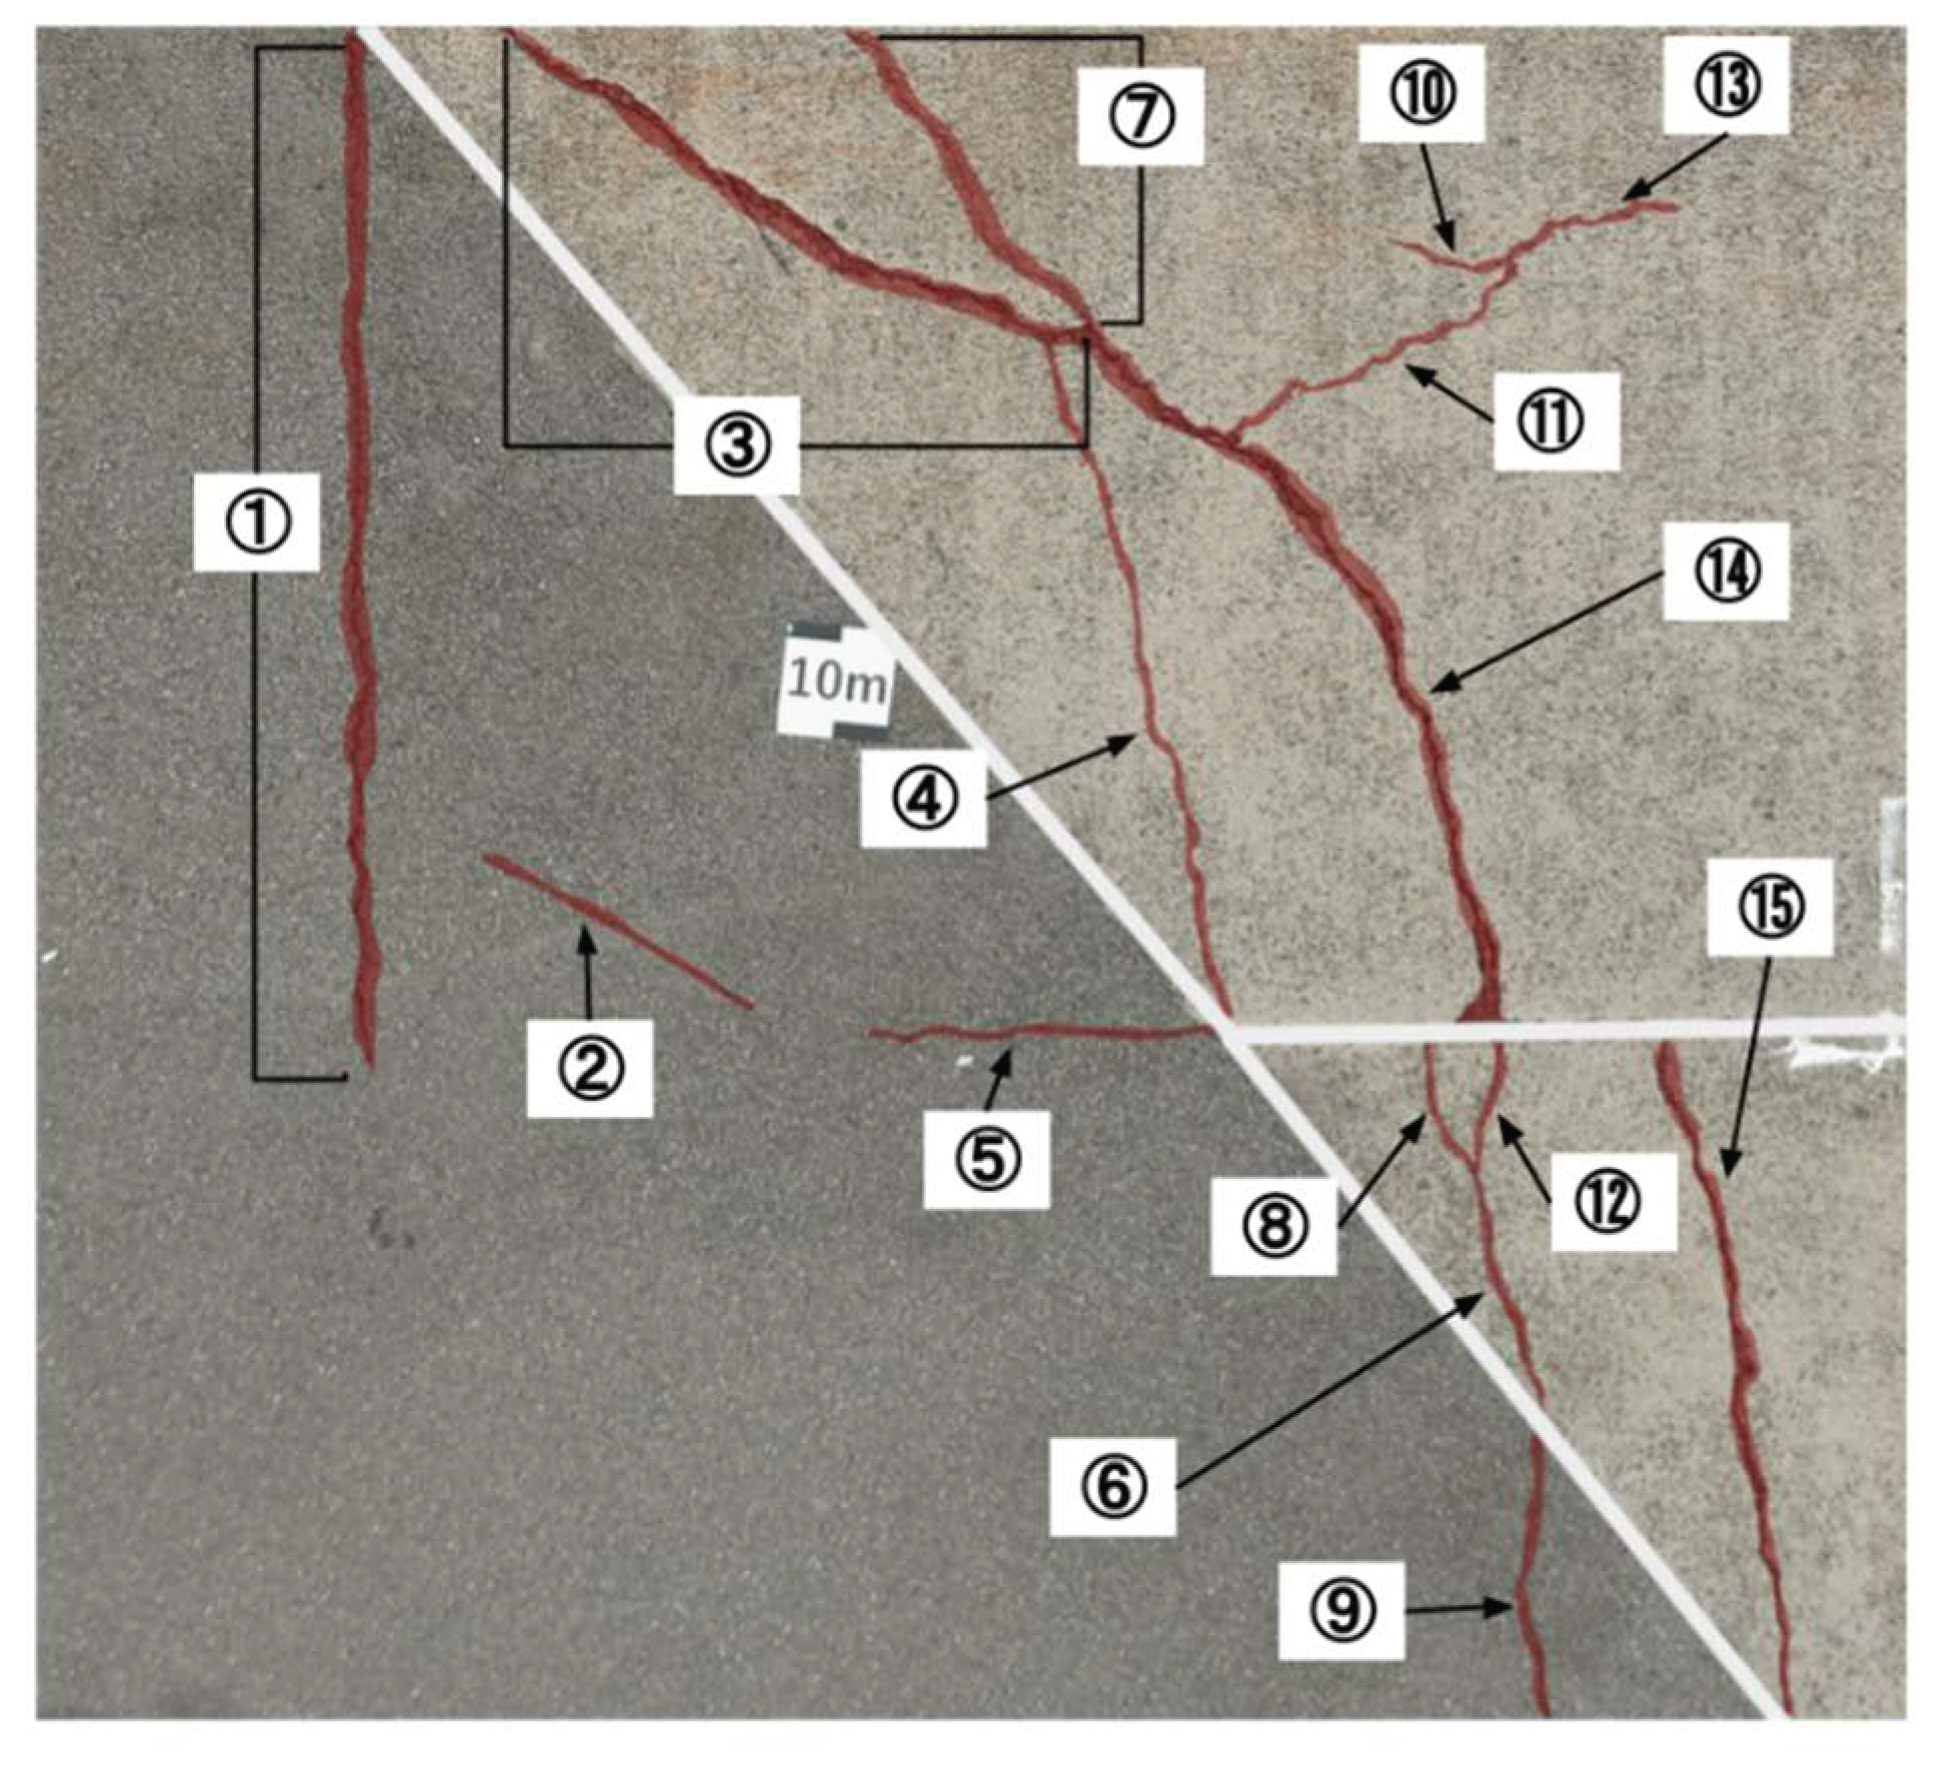

Table 1.
Comparison of detection results at the test site. ◯: Fully detected; △: Partially detected; ✕ Not detected.
Table 1.
Comparison of detection results at the test site. ◯: Fully detected; △: Partially detected; ✕ Not detected.
| ID | Crack Width [mm] | Proposed System | Commercial System |
|---|---|---|---|
| ① | ≥5 | ◯ | ◯ |
| ② | ≥5 | △ | △ |
| ③ | ≥5 | ◯ | ◯ |
| ④ | 1 | △ | ◯ |
| ⑤ | 2 | △ | △ |
| ⑥ | ≥5 | ◯ | ◯ |
| ⑦ | 3 | ◯ | ◯ |
| ⑧ | 1 | ◯ | ◯ |
| ⑨ | ≥5 | △ | ◯ |
| ⑩ | 0.4 | ◯ | ◯ |
| ⑪ | 0.8 | △ | △ |
| ⑫ | 2 | ◯ | ◯ |
| ⑬ | 0.5 | △ | ✕ |
| ⑭ | ≥5 | ◯ | ◯ |
| ⑮ | ≥5 | ◯ | ◯ |
Disclaimer/Publisher’s Note: The statements, opinions and data contained in all publications are solely those of the individual author(s) and contributor(s) and not of MDPI and/or the editor(s). MDPI and/or the editor(s) disclaim responsibility for any injury to people or property resulting from any ideas, methods, instructions or products referred to in the content. |
© 2025 by the authors. Licensee MDPI, Basel, Switzerland. This article is an open access article distributed under the terms and conditions of the Creative Commons Attribution (CC BY) license (http://creativecommons.org/licenses/by/4.0/).
Copyright: This open access article is published under a Creative Commons CC BY 4.0 license, which permit the free download, distribution, and reuse, provided that the author and preprint are cited in any reuse.


