
Submitted:
30 October 2025
Posted:
31 October 2025
You are already at the latest version
Abstract
For many historic engineering structures, including early 20th-century truss bridges, no comprehensive technical documentation has survived, making them highly vulnerable to irreversible loss. This study addresses this challenge by developing and testing a non-invasive, UAV-based photogrammetric methodology for the comprehensive documentation of the Niestępowo railway viaduct in northern Poland. A dense geodetic control network was established using GNSS and total station measurements, providing a metrically verified reference framework for 3D reconstruction. Two photogrammetric software platforms—Bentley ContextCapture and Agisoft Metashape—were employed and comparatively evaluated in terms of processing workflow, accuracy, and model fidelity. To ensure methodological robustness, both tools were used for cross-validation of the generated 3D models and for the comparative assessment of their dimensional consistency against archival documentation. The results confirm that both platforms can produce highly accurate, photorealistic 3D models suitable for engineering inventory and heritage preservation, with Agisoft Metashape yielding slightly higher geometric precision, while Bentley ContextCapture ensured superior automation for large datasets. The generated 3D models reproduced details such as rivets, cracks, and corrosion marks with millimeter-level accuracy. The presented workflow demonstrates the potential of UAV photogrammetry as a reliable and scalable method for safeguarding cultural and technical heritage. By enabling the creation of metrically precise digital archives of historic bridges, the methodology supports future conservation, monitoring, and restoration efforts—preserving not only physical form but also the historical and engineering legacy of these structures.
Keywords:
bridges
; photogrammetry
; reconstruction
; historic objects
; digital twin
; 3D modelling
1. Introduction
Photogrammetry, defined as the science of acquiring reliable metric data from photographs, has a longstanding history of application in surveying, mapping, and documentation. Conventional aerial and terrestrial photogrammetric approaches, although well established, are often associated with substantial operational costs and logistic complexity. Over the past decade, the advent of low-altitude unmanned aerial vehicle (UAV) photogrammetry, typically employing Structure-from-Motion (SfM) Multi-View Stereo (MVS) techniques, has substantially broadened the practical scope of this field by enabling flexible, high-resolution, and cost-effective data acquisition workflows [1,2,3].
Contemporary applications of UAV-based photogrammetry now extend beyond classic topographic surveys, encompassing domains such as coastal monitoring [2], assessment of erosion processes [3]debris-flow tracking [4], and high-precision mapping of engineering structures [5,6].Comparative studies, for example [7], have confirmed that UAV photogrammetry can achieve results comparable to terrestrial laser scanning (TLS), albeit sometimes with limitations regarding point density. The accuracy of UAV-derived outputs is closely linked to the optimal configuration of ground control points (GCPs), as demonstrated in recent research by Cho et al. [8].
In the context of cultural heritage preservation, photogrammetry plays an increasingly important role in the documentation and monitoring of historic structures, including bridges, viaducts, and other infrastructural monuments. Steel truss bridges, many of which were built during the late 19th and early 20th centuries, are not only valuable engineering artifacts but also significant cultural assets. Their documentation contributes to heritage protection by enabling accurate records of geometry, material condition, and long-term change detection [9,10]. Recent studies emphasise the role of UAV photogrammetry in monitoring temporal changes in the state of preservation of heritage structures (Nocerino et al. [11]).
Engineering heritage structures – such as steel truss viaducts, arch and masonry Bridges – are characterized by complex geometries, difficult-to-access components, and progressive material deterioration, all of which present unique documentation challenges. UAV photogrammetry addresses many of these issues by enabling fast, non-invasive, and detailed documentation of such assets. Tang et al. [12] illustrated that strategic oblique imaging notably enhances the fidelity of 3D reconstructions of railway bridges, while Ioli et al. [13] utilised UAV photogrammetry for crack detection on concrete structures, achieving millimetre-level measurement precision. Other studies establish UAV photogrammetry as a reliable, though sometimes less dense, alternative to TLS in digital twin generation for infrastructure monitoring, and highlight its role in rapid seismic risk assessments [14], structural monitoring [15] and in bridging gaps within combined UAV–TLS methodologies [16].
The method is also exploited within aquatic and hydraulic contexts, such as mapping submerged infrastructure and simulating hydraulic impacts [2]. These collective advancements reaffirm UAV photogrammetry as both a robust and versatile instrument for the digital documentation of heritage bridges and similar assets.
Data products generated from UAV photogrammetry – dense point clouds and photorealistic 3D meshes – are increasingly embedded in digital twin workflows, advancing efforts in heritage conservation, structural defect detection, and infrastructure condition monitoring. Mohammadi et al. [17] underscore the growing potential for multi-scale deterioration assessment through photogrammetrically derived digital twins, while Mousavi et al. [18] review digital twin integrations in bridge management, stressing the centrality of UAV-acquired data.
The field is also witnessing a trend toward automation, as shown by Yasit et al. [15], who linked UAV-based digital twins with algorithmic crack detection for predictive bridge maintenance. The synergy of UAV photogrammetry and GIS further streamlines workflows for bridge risk assessment [19], while multi-temporal surveys are now effectively deployed for change detection in both geomorphological and structural contexts [4].
Despite these technological advances, various practical challenges persist. The capture of fine construction details, such as rivets or corrosion spots, demands exceptionally high spatial resolution and robust georeferencing strategies [8,12]. Occlusions, particularly under decks or within truss interiors, continue to impede model completeness [12,16]. TLS still provides denser point clouds, but UAV photogrammetry offers superior accessibility and cost-efficiency, as shown in comparative studies [7,14]. Workflow standardisation, e.g., selection of image overlap and GCP strategy, remains an evolving area [6,8] . Furthermore, multi-epoch change detection imposes technical and analytical demands on processing pipelines [17], and the increasing scale of datasets strains existing computational resources [5].
The aim of this work is to expand the growing body of literature on the digital documentation of engineering heritage objects by providing methodological advances as well as actionable insights for practice and further research. In particular, this study demonstrates how UAV photogrammetry can be combined with precise geodetic surveying and advanced 3D reconstruction algorithms to document a historic steel truss viaduct. Unlike previous studies focusing primarily on qualitative heritage documentation, this work integrates UAV photogrammetry with precise geodetic control and comparative reconstruction parameters to quantitatively assess modeling accuracy in a complex steel truss viaduct. The comparison of different platforms and computational parameters contributes to a deeper understanding of how modelling accuracy is affected by data acquisition and processing strategies. From a scientific perspective, the research also advances knowledge on the optimisation of tie-point distribution in repetitive structural geometries – an issue well recognised in SfM algorithms [10,11].
2. Materials and Methods
2.1. Bridge Description
The bridge under consideration was selected due to the favorable topographic conditions for conducting a photogrammetric survey, the availability of archival documentation, and the historical significance of the span. Furthermore, an additional factor justifying the selection of the analyzed structure for the study was the uniform coating applied over the entire surface, free from contaminants (such as corrosion or graffiti), and finished in a non-reflective color minimizing light scattering.
The first crossing over the Radunia River was built in 1911 as part of the construction of the Kokoszki–Stara Piła railway line (Figure 1). However, the historic span was destroyed during World War II. The bridge was rebuilt in 1952. The facility is a living witness to the local history of engineering reconstructions, thus constituting an important element of the local cultural landscape. In its current state, the structure has undergone renovation completed in 2023 as part of the Kartuzy Bypass project, an investment aimed at improving passenger transport in the Pomerania region (Figure 2). The renovation works included strengthening the existing structure, replacing the track deck, and cleaning, anti-corrosion protection, and painting of the steel surfaces [20].
The bridge crosses the Radunia River and a municipal road In the setting of the structure, there are arable fields and wastelands. The load-bearing system consists of a single-span steel truss with a top deck, following the static scheme of a simply supported beam. The total width of the span is 5.70 m, and the total length of the structure is 59.00 m. The truss girders have a theoretical span of 58.00 m. The upper and lower chords of the trusses are connected by diagonals and verticals arranged in a “W” configuration. The main load-bearing element of the structure is the upper chord, which supports the deck structure. The truss girder height at mid-span (measured at the chord axes) is 8.04 m. The truss was constructed from plate girder sections connected together with rivets. The upper chords are open box sections composed of L-profiles and plates. The verticals and diagonals were made from rolled I-beams reinforced with riveted plate overlays. The cross-sections of the vertical and horizontal bracings consist of L-profiles connected together.
The railway track deck was constructed as an open deck system. The structure is supported on monolithic abutments. The steel superstructure of the bridge was made of St3SX steel (PN-88/H-84020), while the deck structure and the reinforcements added during the renovation in the form of overlays were made using S355 steel (PN-EN 1993-2:2006). The geometry of the truss girder and the cross-section are shown in the Figure 3.
The bridge’s configuration and material characteristics provide an appropriate experimental framework for assessing the accuracy and reliability of UAV photogrammetry in the documentation of historic engineering structures.
2.2. Theoretical Foundations of Photogrammetry
Photogrammetry is a scientific and technical discipline concerned with the derivation of precise quantitative information about physical objects and the environment through the process of recording, measuring, and interpreting photographic images and other forms of electromagnetic radiation [22,23,24].
In engineering applications, the primary objective of photogrammetry is to reconstruct the three-dimensional geometry of an object from a series of photographs. This process is fundamentally based on triangulation, a principle that utilizes multiple images of an object captured from different viewpoints to determine the 3D position of corresponding points. The 3D spatial coordinates (X,Y,Z) of the specific point can be calculated by leveraging its corresponding two-dimensional (2D) image coordinates and the known camera pose (position and orientation) at the moment of capture.
Modern photogrammetry employs digital sensors, including those integrated into Unmanned Aerial Vehicles (UAVs), in conjunction with advanced computational methods to generate accurate and high-precision 3D models. This process involves a structured workflow, encompassing key stages such as image acquisition, camera calibration, the identification of homologous points across multiple images, and the subsequent reconstruction of the spatial model.
A fundamental aspect of photogrammetry involves the geometric relationship that that establishes a correspondence between two-dimensional (2D) image coordinates and three-dimensional (3D) spatial coordinates. This relationship is governed by the collinearity equation, which mathematically describes the projection of a 3D object point onto a 2D image plane using a rotation matrix and a translation vector to define the camera's pose.
The variables in the equation are defined as follows:
- f: The focal length, representing the distance from the camera's perspective center to the image plane.
- : The coordinates of the camera's perspective center in the object coordinate system, defining the camera's position in 3D space.
- R: The rotation matrix, a 3x3 matrix that specifies the camera's orientation or attitude relative to the object coordinate system.
Digital photogrammetry relies on precise geometric transformations. As illustrated in Figure 4, the process maps a physical object point, P, defined within the object coordinate system [X, Y, Z], onto a corresponding image point, P’, located on the image (or sensor) coordinate system . This mapping is defined by the projection center O and the camera coordinate system . The point where the camera's optical axis intersects the image plane is known as the principal point, H [25].
To move from a single 2D image plane to a fully determined 3D model, stereoscopic photogrammetry is employed, utilizing at least two images captured from different perspectives. The setup of an image pair is commonly represented as shown in Figure 4. The fundamental principle governing this 3D reconstruction is epipolar geometry, which significantly reduces the search space for corresponding points between two images, as detailed in Figure 5.
As shown in Figure 6, the key elements of this geometry involve two projection centers, O′ and O′′, and a 3D object point P. These three points define the epipolar plane E(P). This plane intersects the two image planes (E′ and E′′) to form the epipolar lines, l′(P) and l′′(P). The epipoles, E′ and E′′, are the images of the other camera's projection center, and the line connecting the two projection centers, b′=O′O′′, is called the baseline. All epipolar planes, such as E(P) and one induced by a different point R, pivot around the baseline, forming a pencil of planes. Crucially, the image P′ in the first camera is guaranteed to have its corresponding point, P′′, lie only along the epipolar line l′′(P) in the second image. This constraint is vital because, as the illustration shows, a single image point P′ could correspond to any 3D point (like P or Q) along its projecting line [25].
A variety of data processing methods are employed in photogrammetry, with the choice of technique dependent on the specific application and required accuracy [16]:
- Direct Linear Transformation (DLT): This is a non-iterative method that establishes a direct linear relationship to convert 2D image coordinates to 3D spatial coordinates. While it simplifies the computation by not requiring explicit knowledge of internal camera parameters, it necessitates a sufficient number of precisely located control points and is generally less robust than iterative methods.
- Bundle Adjustment: Widely considered the state-of-the-art technique, this method simultaneously refines the network of camera poses (position and orientation) and the 3D coordinates of all reconstructed points. By optimizing all parameters in a single, large-scale least-squares adjustment, it effectively handles redundant observations and provides a statistically rigorous estimation of the results accuracy. However, its high computational complexity requires significant time and processing power for large datasets.
- Self-Calibration: This approach is typically integrated into the bundle adjustment process to correct for internal camera parameters, such as focal length, principal point location, and lens distortion. Its effectiveness is contingent upon a robust network geometry, a sufficient number of corresponding points, and the validity of the assumed error model. This method minimizes the need for a separate, pre-processing camera calibration step.
In addition to its traditional engineering and surveying applications, photogrammetry is increasingly recognized as a state-of-the-art, non-contact, and non-destructive diagnostic tool within the field of artwork conservation. The integration of high computing power for photogrammetric processing allows conservators to gather unprecedented detail about the artwork, which is essential for preserving human culture. Specifically, the technique is leveraged to generate highly accurate 3D models of paintings, murals, and artifacts, providing critical data on surface topology—including the precise location and extent of deformations, cracks, or material deficiencies. The resulting models serve as an indispensable tool for pre- and post-intervention documentation, supporting the diagnostic phase and enabling conservators to select and apply the most appropriate restoration and preservation procedures with high confidence and precision [26].
2.3. Advantages and Limitations of Photogrammetry
Photogrammetry is a recognized and widely adopted measurement technology for the documentation, analysis, and reconstruction of objects across diverse fields, including cultural heritage and civil engineering [27,28,29,30,31].
The primary advantages of photogrammetry can be summarized as follows (Figure 7):
- High Accuracy: The method facilitates the generation of precise 3D models with high geometric fidelity, which is particularly critical for the detailed documentation of historical sites and artifacts [32].
- Non-Invasiveness: As a non-contact measurement technique, photogrammetry is an ideal solution for documenting fragile or delicate objects without the risk of physical damage [29].
- Versatility and Scalability: The technology is highly adaptable, enabling its application to objects of varying scales, from small artifacts to large-scale architectural structures. The integration of Unmanned Aerial Vehicles (UAVs) further extends its utility by allowing access to hard-to-reach areas [28,33].
- Integration: Photogrammetric data can be seamlessly integrated with other technologies, such as 3D printing, to create physical replicas for educational purposes or conservation efforts [34].
Despite its numerous benefits, photogrammetry has several limitations that can affect the quality and accuracy of the final results [25].
- Lighting and Image Quality: The technique relies heavily on clear images with good lighting and sharp contrast. Poor lighting, reflections, or motion blur can introduce significant errors and compromise the accuracy of the 3D model.
- Calibration: For precise spatial measurements, the cameras used must be accurately calibrated. Errors in camera calibration can lead to inaccuracies in the final 3D model, as the geometric relationship between the camera and the object is incorrectly defined.
- Image Geometry: The process can be challenged by complex objects or environments with hidden or obscured areas. Difficulty in acquiring images from appropriate perspectives can result in incomplete or distorted models.
- Computational Intensity: The processing of large datasets of high-resolution images is computationally demanding. It requires significant processing power and time, which can be a major constraint for large-scale projects.
- Object Properties: The method is less effective on objects with smooth, monochrome, or transparent surfaces (such as polished metal or glass). These surfaces lack the distinct feature points necessary for accurate image matching, which is a fundamental step in the photogrammetry workflow.
It is important to note that ongoing technological advancements, particularly in digital photogrammetry and computational power, are continuously helping to mitigate many of these limitations.
2.4. Geodetic Control Network Establishment
The first stage of the geodetic work involved establishing a measurement control network in the vicinity of the bridge using a high-precision Leica GS07 GNSS receiver. Six control points were stabilized on wooden stakes and designated with identifiers ranging from 1001 to 1006. These points were selected to ensure good visibility both to the structure and between one another, allowing their subsequent use as a stable reference base. By employing satellite positioning techniques, all control points were tied to the national horizontal coordinate system PL-2000 and the vertical reference system PL-EVRF2007-NH, thus providing a reliable geodetic framework for the entire project.
After the external control network had been firmly established, the electronic total station Leica TS03 was set up and aligned. The accuracy of the total station measurements, depending on the current setup and orientation, is up to approximately 5 mm for linear (horizontal) measurements and 3 mm for height (vertical) measurements. Two convenient instrument positions were chosen—on the northern and southern sides of the bridge—offering full visibility to both the control points and the surveyed structure. Precise leveling of the instrument, along with accurate orientation measurements, ensured that the measurement setup was fully integrated with the previously established control network.
The main stage of the survey focused on the detailed measurement of characteristic points on the bridge structure. From two independent total station positions, the spatial coordinates of all significant and easily identifiable elements were recorded, facilitating their subsequent recognition and marking in the photographs. These elements included rivet heads, joints between structural elements, truss nodes, and pre-attached photogrammetric targets. The targets were printed on A4 sheets and fixed in accessible locations. This approach enabled precise measurement of the targets and their accurate identification in photogrammetry software such as Bentley ContextCapture [30] and Agisoft Metashape [30]. Each point's spatial position was recorded multiple times to allow for accuracy verification and error elimination arising from minor misalignment of the total station's crosshairs. In total, 41 points were measured and assigned coordinates in the PL-2000 horizontal coordinate system and PL-EVRF2007-NH vertical reference system. These points were labeled from 1 to 41 and were instrumental in orienting all photographs within 3D space.
For the georeferencing of the photogrammetric models, 6 Ground Control Points (GCPs) were stabilized for the primary GNSS network, alongside 41 measurement points established directly on the object. This extensive number of control points, strategically distributed both around the object and across its surfaces, was selected to ensure a robust and comprehensive scale definition and to effectively eliminate geometric distortions that can occur in large-scale or complex structures. The objective was to provide sufficient geometric constraints for the photogrammetric block's Bundle Block Adjustment (BBA), which is crucial for achieving high geometric fidelity across the final 3D model.
The rigorous field procedures involved multiple readings for each point to verify measurement precision. The quality of the established network was confirmed by low resultant errors. The mean errors achieved were very low, specifically approximately ±2mm for linear measurements and ±5mm for height measurements within the GNSS and tachymetric measurements. This low level of uncertainty in the control point coordinates is vital, as these precise coordinates were subsequently used to georeference the final 3D models within the processing software, namely Bentley ContextCapture and Agisoft Metashape.
The appropriate number and optimal distribution of control points are fundamental to ensuring high accuracy of the final 3D model. The more points are precisely surveyed and evenly spread across the structure, the better the model's distortion error is corrected.
Additionally, the Leica GS07 GNSS receiver was used to survey points located at the top of the embankment and on the structure itself, specifically in locations that were easily accessible with a surveying rod. In this phase, photogrammetric targets were distributed on the ground to ensure even coverage of the entire surveyed area. A total of 7 such ground control points were established and labeled FOT1 through FOT7. The mean errors for GNSS measurements are 2 cm for linear (horizontal) measurement and 3 cm for height (vertical) measurement. The accuracy of GNSS measurements primarily depends on satellite geometry (GDOP), atmospheric disturbances, or receiver quality.
In parallel with the measurement work, situational sketches were produced manually. These drawings included the location of each measured point, its identifier, and a brief description. This documentation proved invaluable both during the fieldwork and in the later data processing phase, enabling quick and unambiguous identification of individual structural elements.
The collected survey data — point coordinates combined with their corresponding sketch documentation — provided a solid foundation for further design and analytical work. The precise geometric representation of the structure, referenced to the national spatial reference systems, constitutes a key element in the process of creating a metrically accurate 3D model of the historic structure.
2.5. UAV Data Acquisition and Processing
A simultaneous photogrammetric flight was conducted using three unmanned aerial platforms: DJI Phantom 4 Pro, DJI Mavic 2 Pro, and DJI Mini 3 Pro (Figure 11). All three drones operated concurrently.
The DJI Phantom 4 Pro has a take-off weight of 1,388 grams. It is equipped with a camera featuring a 1-inch CMOS sensor and an image resolution of 20 megapixels (MP). The drone offers an adjustable aperture ranging from f/2.8 to f/11 and includes both a mechanical and electronic shutter. Its maximum flight time is 30 minutes, it has 5-directional obstacle detection, and its maximum transmission range (CE standard) is 3.5 km. The DJI Mavic 2 Pro is lighter, weighing 907 grams, and utilizes a 1-inch CMOS (Hasselblad) sensor, which also provides an image resolution of 20 MP. Similar to the Phantom 4 Pro, it has an adjustable aperture from f/2.8 to f/11. Its maximum flight time is 31 minutes, it features a more advanced 6-directional obstacle detection system, and its transmission range (CE) is significantly greater at 8 km. It uses an electronic shutter only. The DJI Mini 3 Pro is the lightest model, with a take-off weight of just 249 grams. Despite its smaller size, it offers the highest image resolution—48 MP—thanks to its 1/1.3-inch CMOS sensor. It features a fixed, bright aperture of f/1.7 and uses an electronic shutter. It provides the longest maximum flight time at 34 minutes and achieves a transmission range (CE) of 8 km. Obstacle detection is 3-directional. All these specifications are presented in Table 1. The provided table details key photogrammetric parameters for three UAV models: DJI Phantom 4 Pro, DJI Mavic 2 Pro, and DJI Mini 3 Pro, alongside their calculated Ground Sample Distance (GSD) in cm/px. The GSD, a measure of ground resolution, is universally calculated using the formula:
where H is the flight altitude and f is the focal length.
Crucially, this GSD calculation assumes a pure nadir view (camera looking straight down, perpendicular to the ground). This is the standard scenario for photogrammetric mapping where distortion must be minimized; GSD increases (resolution worsens) as the camera angle deviates from nadir. The consistency of the presented GSD values (0.82 cm/px, 0.70 cm/px, and 1.09 cm/px) confirms they were all derived from a constant, typical photogrammetric flight altitude of 30 meters. The DJI Mavic 2 Pro achieves the lowest and thus best GSD of 0.70 cm/px, primarily due to its 10.3 mm focal length and large 13.2 mm sensor, offering the highest ground resolution. The DJI Phantom 4 Pro has a slightly worse GSD of 0.82 cm/px because of its shorter 8.8 mm focal length. The DJI Mini 3 Pro yields the largest, and thus poorest, GSD of 1.09 cm/px, resulting from its smaller 9.8 mm sensor and shortest 6.7 mm focal length, indicating the lowest spatial resolution among the three models under ideal nadir flight conditions at 30 m.
Unmanned aerial vehicle (UAV) flights were conducted in two vertical planes oriented perpendicularly to each other: parallel to the railway track, on both sides of the structure, and perpendicularly, through crosswise passes. Visual data acquisition also included flights at varying angles, with the camera oriented both perpendicularly to the object and with approximately 45-degree rotations to the left and right. The top-down (upper grid) flights were carried out at a constant altitude of 30 meters above the object, while the lateral (vertical) flights were conducted at a variable height ranging from 3 to 7 meters due to terrain obstacles. This flight pattern and the variety of camera angles are crucial as they enable a complete and detailed documentation of the structure. This is primarily essential for creating precise 3D models using photogrammetry, since for the software to create an accurate three-dimensional model, it needs data from multiple perspectives, including side and top views, as well as the oblique shots provided by the 45-degree camera rotations. Without this variety of shots, the 3D model would have gaps and distortions. Additionally, these flights are critical for a detailed visual inspection as they allow for a thorough examination of every part of the structure, even those difficult to access, and the change in camera angle helps detect minor damage, such as cracks or rust, that may be invisible from a perpendicular perspective.
Additionally, to obtain comprehensive documentation, automated flights were performed above the structure along a pre-defined flight path arranged in a grid pattern, in accordance with standard photogrammetric procedures. The remaining lateral flights were conducted manually (Figure 12). To ensure the accuracy and proper real-world positioning of the resulting 3D model, the UAV images were linked to a network of ground control points. This was achieved through a process called georeferencing, which assigns precise coordinates to the 3D model. First, the ground control points were accurately measured on-site using a total station to obtain their exact coordinates in the PL-2000 coordinate system (section 6). The drone, meanwhile, recorded the approximate geographical coordinates of each image. By identifying these same points in both the survey data and the drone's images, a coordinate transformation was performed in the processing software. This process aligned the geometrically correct model with the precise ground control points, resulting in a highly accurate final product.
2.5. 3D Model Creation Methodology
Recent years have seen a significant increase in the application of photogrammetry, leading to the development of numerous software solutions. The selection of an appropriate package is critical, as it must be suited to the specific requirements of the project, such as the scale of the dataset, the required accuracy, and the object's geometry, to efficiently achieve the desired outcomes. For this study, two software packages with different characteristics were chosen for comparison.
Bentley ContextCapture was selected for its capability to handle large volumes of imagery and generate high-resolution 3D models. Its automated processing workflows are designed for managing complex projects, making it suitable for large-scale engineering and documentation tasks.
For comparison, Agisoft Metashape was chosen as a widely available and cost-effective solution. While it offers flexible parameter control for the users, creating an accurate model, especially of objects with repetitive geometric patterns (such as trusses), demands significant user expertise and processing time to manually correct potential automatic processing errors.
Both programs were deliberately selected to address complementary needs: Bentley ContextCapture efficiently processes large, relatively uniform datasets, whereas Agisoft Metashape offers greater user control when handling complex, repetitive truss geometry. Using both packages in parallel provides internal cross-validation, enhancing the robustness of the workflow and increasing confidence in the accuracy and completeness of the digital record of the heritage asset.
The block diagram presented on Figure 13 shows a comprehensive methodology for the photogrammetric documentation of structures. The process begins with preliminary planning, including object selection, equipment preparation, and flight plan development. Fieldwork is then executed, involving UAV flights and the measurement of ground control points. The core of the workflow encompasses data processing in specialized software, leading to the generation of accurate 3D models through aerotriangulation and reconstruction. The procedure concludes with result verification, analysis, and the preparation of final documentation, underscoring the method's significance for heritage protection.
3. Results
3.1. Results of the Bentley Model
Photogrammetric 3D reconstruction of the Niestępowo Bridge performed in Bentley ContextCapture resulted in a high-resolution 3D model accurately representing the geometry of the structure (Figure 14). The model successfully captured both the overall truss configuration and the fine surface details, including riveted joints, deck plates, and texture variations of the materials, as shown in Figure 15, Figure 16, Figure 17 and Figure 18.
A total of 4,369 photographs were used for model generation. The software automatically selected and aligned the images, identifying 53 tie points across the dataset. Their non-uniform spatial distribution, particularly in the mid-span region, led to minor local discrepancies in the alignment of the truss elements.
The final model achieved a high level of geometric completeness and surface continuity. The reconstruction was performed at the highest available quality settings, and the full processing time amounted to approximately 10 days on a high-performance workstation. Due to the sequential nature of the software’s workflow, any interruption or misalignment required restarting the entire reconstruction process.
Overall, the Bentley ContextCapture model provided a reliable and detailed digital representation of the bridge, serving as a reference for the subsequent comparative analysis presented in Section 4.1.
3.2. Results of the Agisoft Metashape Model
Despite locally visible inaccuracies, the 3D model generated in Agisoft Metashape demonstrates high global accuracy and provides good representation of details such as joints, gusset plates, and bridge fittings across the entire structure. The primary limitation in model generation was the insufficient number of tie points, particularly at mid-span, where the repetition of elements in the images was significant and the number of distinctive features available to be used as tie points was too low.
Agisoft Metashape enables the generation of models with high global accuracy, as clearly illustrated in Figure 19, Figure 20 and Figure 21. Moreover, the model reproduces defects in the protective coating, cracks, and surface moisture on the wooden elements of the structure. However, achieving this level of global accuracy comes at the cost of high hardware requirements. The database containing the 3D model of a single span occupies 261 GB of disk space, and the computation of the point cloud and 3D model based on 10,212 photographs required 4 days of processing.
The dimensions obtained from the photogrammetric survey and the creation of the 3D model were extracted in the software with an accuracy of up to 1 cm, which allows for the comparison of the global geometry of the truss. The following measurements of the geometry of the bridge span in Niestępowo, derived from the developed 3D model, are presented in the images (Figure 22 and Figure 23).
A cross-section of the railway track was also generated as part of the rail gauge measurement. The measurement accuracy in the case of determining the width in the cross-section was 1 mm. The diagram below presents the cross-section of the railway track, including the measured rail gauge as well as the height of the bridge railing (Figure 24).
4. Discussion
4.1. Comparison of Photogrammetry 3D Models
This case study, focusing on the documentation of the historic viaduct in Niestępowo, underscores the vital role of digital preservation for endangered cultural heritage. For structures like this truss bridge, which often lack any original technical documentation, creating a precise record is an urgent and critical task. This project deliberately evaluated a methodology reliant solely on UAV technology to address this need. This case study is not only technical but also methodological, as it provides a replicable workflow for documenting other endangered truss bridges.
To compare both models obtained from the photogrammetric survey processing, Table 2 presents the basic parameters of the generated 3D models, along with a tabular summary of the strengths and weaknesses of using both software solutions.
As shown, in the case of the model developed in Agisoft, the computation and 3D model generation process is significantly faster than in Bentley ContextCapture; however, Agisoft requires greater disk space utilization. Another notable difference lies in the higher capability for intermediate verification during model generation in Agisoft. The user of this software can assess the accuracy of the developing model already at the image alignment stage, whereas in Bentley ContextCapture such verification is possible only after the full 3D model has been generated.
Both models guarantee high accuracy of results. Although both 3D models can be used for inventory purposes, differences between them are noticeable.
The first visible difference can be observed in generated texture on the surface of the railway ballast as well as on the chequered plates serving as fire protection plates along the entire length of the structure. In the case of the 3D model generated with Bentley ContextCapture (b), the texture and details are more distinct than in the model developed in Agisoft Metashape (a). Figure 25 shows that Bentley ContextShape preserves surface texture more effectively than Agisoft Metashape.
The most significant difference can be seen when comparing the entire solid of the structure. Bentley ContextCapture (d) showed considerable difficulties in creating the point cloud in the middle part of the span, where in both cases there are gaps in point cloud generation. However, in the case of Agisoft Metashape (c), the point cloud creation in the central part of the bridge resulted in smaller discrepancies than with Bentley ContextCapture. This effect results from the higher density of the point cloud, leading to a more accurate and detailed reconstruction achieved with Agisoft Metashape (Figure 26).
The Table 3 presents a comparison of the basic structural dimensions given in the generated in both programs. Although differences between generated models are visible, indicating an advantage of Agisoft Metashape, both programs guarantee high accuracy of the 3D model. archival documentation of the object with the dimensions obtained from the 3D models.
As can be seen in the Table 3, the relative error between all compared dimensions is below 2%. The largest observable deviations, unfavorable to Bentley ContextCapture, occur in the total span dimension of the 3D model. This difference results from the variation in the number and uneven distribution of tie points, as shown in Table 3, where the quantity of tie points is limited by the software itself.
Results shown in the Table 3 demonstrate the great potential and possibilities of using close range photogrammetry for the inventory of historical bridge structures and shows immense potential of implementing photogrammetry for this purpose. This method also enables systematic monitoring and archiving of structural changes over the entire service life, while providing the capability to analyze the progression of deterioration processes (including the propagation of corrosion products, the rate of structural degradation, and the emergence of visible defects indicative of more severe failures).
4.2. Challenges of Photogrammetric Post-Processing
A key planning consideration was the selection of photogrammetric software. Programs like Bentley ContextCapture and Agisoft Metashape employ distinct modeling methodologies. The former excels with large-scale projects involving repetitive structures, while the latter is more adept at processing complex, atypical objects that require manual fine-tuning. The choice also hinges on user expertise. Agisoft Metashape demands a more hands-on approach and a deeper understanding of the processing steps, but this closer oversight allows for earlier problem identification. In contrast, Bentley ContextCapture offers a more intuitive interface with integrated utilities to expedite the workflow. While both programs successfully generated the 3D model, Agisoft Metashape produced a more accurate overall representation of the structure.
The mission to comprehensively document the viaduct resulted in a massive dataset of 10,272 images, which presented significant computational challenges. The aerotriangulation process alone required a minimum of 24 hours on high-performance hardware. To manage this, a rigorous data reduction strategy was implemented, discarding out-of-focus, poorly exposed, or off-target images. This quality-based selection refined the dataset to 9,274 images. Since this still far exceeded the minimum required for adequate representation, the 10% reduction did not compromise the final model's accuracy but successfully cut processing time to 16 hours, highlighting the importance of strategic data collection for large-scale projects.
The methodology intentionally omitted supplementary terrestrial photographs to test the standalone capability of UAV technology. The consequence of this choice was a prolonged processing time due to manual corrections and some geometric simplifications in occluded areas, particularly on the bridge's underside. However, this approach proves highly applicable for surveys in inaccessible locations. For future projects where the accurate depiction of every element is paramount, supplementing aerial data with terrestrial imagery is recommended.
For complex truss bridges, the automatic identification of matching points across photographs is a fundamental challenge. In this project, meticulous field documentation—including marked photo targets and precise sketches supplemented with close-range photos—proved invaluable. These comprehensive sketches prevented identification errors and significantly accelerated the office-based processing, confirming that robust field work is a cornerstone of efficient digital modeling.
Finally, the visual similarity of the truss's repetitive spans posed a significant obstacle for automated algorithms. While 53 tie points were manually placed on unique features, this number—combined with their uneven distribution due to limited access—was insufficient to fully separate all spans, leading to local inaccuracies. For future documentation of similar structures, it is recommended to at least double the number of manually placed points or, where possible, use unique coded targets on each span to guide the software effectively.
5. Conclusions
The presented study demonstrates that the integration of UAV-based photogrammetry with precise geodetic referencing offers an effective, non-invasive, and scientifically robust method for documenting historic engineering structures. The case of the Niestępowo Bridge, a century-old truss viaduct, illustrates how advanced digital techniques can safeguard cultural and technological heritage by creating an accurate, metrically verified 3D record of a structure that once existed only in archival fragments.
The comparative analysis of two photogrammetric platforms—Bentley ContextCapture and Agisoft Metashape—proved that both can deliver high-fidelity models suitable for engineering inventory, yet with distinct advantages. Bentley ContextCapture provides an efficient and automated workflow for large-scale datasets, while Agisoft Metashape, though more hardware-demanding, ensures greater control over model accuracy and detail reconstruction. Together, they form a complementary toolkit that enables the generation of precise and visually realistic 3D representations even for geometrically complex truss bridges.
Beyond the technical findings, this research emphasizes the broader significance of digital photogrammetry as a bridge between engineering science and cultural heritage conservation. Each 3D model produced represents more than a geometric dataset—it is a digital preservation of human creativity, craftsmanship, and historical engineering knowledge. By implementing such methodologies systematically, it becomes possible to build a digital archive of endangered bridges and other infrastructural monuments, ensuring that their design and form remain accessible to future generations even if the physical structures are lost.
The methodology developed in this study—based solely on UAV photogrammetry and refined through rigorous geodetic control—has proven its capacity to deliver reliable, metrically consistent documentation. This approach can be replicated for similar heritage structures, especially those located in inaccessible or environmentally sensitive areas, where non-contact measurement is essential.
Finally, the study demonstrates that modern photogrammetry is not merely a documentation tool but an act of cultural preservation, allowing engineers and researchers to merge technological precision with a deep responsibility toward history. Continuing the development of such integrative methodologies will strengthen our ability to document, interpret, and protect the legacy of historic engineering for generations to come.
Author Contributions
Conceptualization, A.B.; supervision, A.B.; project administration, A.B., D.KU.; funding acquisition, A.B.; methodology, A.B., K.M.J., T.C., D.KU., D.KS., H.N., P.W.; software selection, A.B., K.M.J., D.K., P.R.; validation, A.B., K.M.J.; formal analysis, A.B.; geodetic surveying, A.B., K.M.J., D.KS., P.W.; geodetic data processing, K.M.J.; 3D model creation in Bentley ContextCapture, D.KU.; 3D model creation in Agisoft Metashape, P.R.; geodetic data analysis, D.KS., H.N; results comparison, P.W.; writing—original draft preparation, T.C., D.KU., D.KS., H.N., P.R., P.W., P.S.; writing—review and editing, A.B., K.M.J.; writing—final version preparation, A.B., T.C., D.KU., D.KS., H.N., P.R., P.W., P.S. All authors have read and agreed to the published version of the manuscript.
Funding
Financial support of these studies from Gdańsk University of Technology by the DEC-9/2022/IDUB/III.4.3/Pu grant under the Plutonium - ‘Excellence Initiative - Research University’ program is gratefully acknowledged.
Institutional Review Board Statement
Not applicable
Informed Consent Statement
Not applicable
Data Availability Statement
The data presented in this study are available on request from the corresponding author.
Conflicts of Interest
The authors declare no conflicts of interest. The funders had no role in the design of the study; in the collection, analyses, or interpretation of data; in the writing of the manuscript; or in the decision to publish the results.
Abbreviations
The following abbreviations are used in this manuscript:
| 3D | Three-Dimensional |
| BBA | Bundle Block Adjustment |
| CMOS | Complementary Metal-Oxide-Semiconductor |
| DLT | Direct Linear Transformatio |
| GCP | Ground Control Points |
| GDOP | Geometric Dilution Of Precision |
| GIS | Geographic Information System |
| GNSS | Global Navigation Satellite System |
| LD | Linear Dichroism |
| MP | Megapixel |
| MVS | Multi-View Stereo |
| PL-2000 | Coordinate System 2000 |
| PL-EVRF2007-NH | European Vertical Reference Frame 2007 for Poland, Normal Heig |
| SF | Structure-from-Motion |
| TLS | Terrestrial Laser Scanning |
| UAV | Unmanned Aerial Vehicle |
Appendix A
Summary of coordinates in the PL-2000 plane coordinate system and the PL-EVRF2007-NH height system, including points measured with a total station on the structure, points measured with GNSS, as well as the established control network.

| Number | X | Y | Z |
| 1 | 6021882,57 | 6528774,50 | 119,61 |
| 2 | 6021881,19 | 6528769,42 | 121,01 |
| 3 | 6021881,67 | 6528771,98 | 119,62 |
| 4 | 6021893,00 | 6528777,25 | 119,68 |
| 5 | 6021906,64 | 6528783,58 | 119,71 |
| 6 | 6021880,77 | 6528770,77 | 113,57 |
| 7 | 6021888,56 | 6528774,62 | 111,67 |
| 8 | 6021892,52 | 6528779,14 | 119,67 |
| 9 | 6021892,83 | 6528781,68 | 121,11 |
| 10 | 6021918,70 | 6528792,41 | 113,68 |
| 11 | 6021868,77 | 6528763,73 | 119,94 |
| 12 | 6021874,67 | 6528767,64 | 117,97 |
| 13 | 6021874,60 | 6528766,36 | 120,98 |
| 14 | 6021892,31 | 6528780,11 | 111,96 |
| 15 | 6021894,87 | 6528777,07 | 111,95 |
| 16 | 6021901,41 | 6528780,11 | 111,55 |
| 17 | 6021914,47 | 6528786,17 | 112,57 |
| 18 | 6021875,79 | 6528772,43 | 115,05 |
| 19 | 6021876,26 | 6528772,62 | 118,42 |
| 20 | 6021926,84 | 6528792,25 | 116,86 |
| 21 | 6021925,66 | 6528795,59 | 118,07 |
| 22 | 6021922,65 | 6528794,19 | 115,07 |
| 23 | 6021895,32 | 6528777,76 | 110,78 |
| 24 | 6021901,73 | 6528780,73 | 110,56 |
| 25 | 6021887,31 | 6528777,30 | 111,67 |
| 26 | 6021894,08 | 6528780,46 | 110,78 |
| 27 | 6021900,47 | 6528783,22 | 110,57 |
| 28 | 6021881,50 | 6528775,08 | 113,21 |
| 29 | 6021878,88 | 6528769,62 | 114,53 |
| 30 | 6021882,75 | 6528771,42 | 113,34 |
| 31 | 6021881,30 | 6528770,77 | 115,12 |
| 32 | 6021902,66 | 6528786,15 | 122,62 |
| 33 | 6021899,45 | 6528782,99 | 110,78 |
| 34 | 6021876,82 | 6528772,55 | 118,19 |
| 35 | 6021883,24 | 6528775,60 | 118,31 |
| 36 | 6021889,76 | 6528778,59 | 118,37 |
| 37 | 6021896,30 | 6528781,64 | 118,43 |
| 38 | 6021902,90 | 6528784,67 | 118,44 |
| 39 | 6021909,52 | 6528787,75 | 118,44 |
| 40 | 6021879,74 | 6528773,83 | 113,67 |
| 41 | 6021892,90 | 6528779,94 | 111,10 |
| FOT1 | 6021862,81 | 6528760,64 | 119,18 |
| FOT2 | 6021858,10 | 6528766,58 | 119,34 |
| FOT3 | 6021947,79 | 6528800,58 | 119,83 |
| FOT4 | 6021944,60 | 6528805,21 | 119,95 |
| FOT5 | 6021925,66 | 6528793,42 | 120,37 |
| FOT6 | 6021903,92 | 6528783,32 | 120,31 |
| FOT7 | 6021885,55 | 6528774,84 | 120,25 |
| 1001 | 6021806,63 | 6528799,75 | 103,35 |
| 1002 | 6021893,54 | 6528779,18 | 103,22 |
| 1003 | 6021863,78 | 6528705,30 | 103,67 |
| 1004 | 6021923,10 | 6528734,32 | 103,70 |
| 1005 | 6021920,75 | 6528799,78 | 112,65 |
References
- Geyik, M.; Tarı, U.; Özcan, O.; Sunal, G.; Yaltırak, C. A new technique mapping submerged beachrocks using low-altitude UAV photogrammetry, the Altınova region, northern coast of the Sea of Marmara (NW Türkiye). Quat. Int. 2024, 712, 109579. [CrossRef]
- Casella, E.; et al. Study of wave runup using numerical models and low-altitude aerial photogrammetry: A tool for coastal management. Estuar. Coast. Shelf Sci. 2014, 149, 160–167. [CrossRef]
- Wang, Q.; et al. Optimizing UAV-SfM photogrammetry for efficient monitoring of gully erosion in high-relief terrains. Measurement 2025, 256, 118154. [CrossRef]
- Dahal, S.; Imaizumi, F.; Takayama, S. Spatio-temporal distribution of boulders along a debris-flow torrent assessed by UAV photogrammetry. Geomorphology 2025, 480, 109757. [CrossRef]
- Sestras, P.; et al. Land surveying with UAV photogrammetry and LiDAR for optimal building planning. Autom. Constr. 2025, 173, 106092. [CrossRef]
- Wu, S.; Feng, L.; Zhang, X.; Yin, C.; Quan, L.; Tian, B. Optimizing overlap percentage for enhanced accuracy A and efficiency in oblique photogrammetry building 3D modeling. Constr. Build. Mater. 2025, 489, 142382.. [CrossRef]
- Gruszczyński, W.; Matwij, W.; Ćwiąkała, P. Comparison of low-altitude UAV photogrammetry with terrestrial laser scanning as data-source methods for terrain covered in low vegetation. ISPRS J. Photogramm. Remote Sens. 2017, 126, 168–179. [CrossRef]
- Cho, J.; Jeong, S.; Lee, B. Optimal ground control point layout for UAV photogrammetry in high precision 3D mapping. Measurement 2025, 118343. [CrossRef]
- Pepe, M.; Costantino, D. UAV photogrammetry and 3D modelling of complex architecture for maintenance purposes: The case study of the masonry bridge on the Sele River, Italy. Period. Polytech. Civ. Eng. 2021, 65(1), 191–203. [CrossRef]
- Remondino, F. Heritage recording and 3D modeling with photogrammetry and 3D scanning. Remote Sens. 2011, 3(6), 1104–1138. [CrossRef]
- Nocerino, E.; Menna, F.; Remondino, F.; Saleri, R. Accuracy and block deformation analysis in automatic UAV and terrestrial photogrammetry—Lesson learnt. ISPRS Ann. Photogramm. Remote Sens. Spatial Inf. Sci. 2013, II-5/W1, 203–208. [CrossRef]
- Tang, Z.; Peng, Y.; Li, J.; Li, Z. UAV 3D modeling and application based on railroad bridge inspection. Buildings 2024, 14(1). [CrossRef]
- Ioli, F.; Pinto, A.; Pinto, L. UAV photogrammetry for metric evaluation of concrete bridge cracks. ISPRS Arch. 2022, XLIII-B2, 1025–1032. [CrossRef]
- Wang, X.; Demartino, C.; Narazaki, Y.; Monti, G.; Spencer, B.F. Rapid seismic risk assessment of Bridges Rusing UAV aerial photogrammetry. Eng. Struct. 2023, 279, 115589. [CrossRef]
- Yiğit, A.Y.; Uysal, M. Virtual reality visualisation of automatic crack detection for bridge inspection from 3D digital twin generated by UAV photogrammetry. Measurement 2025, 242, 115931. [CrossRef]
- Castellani, M.; Meoni, A.; Garcia-Macias, E.; Antonini, F.; Ubertini, F. UAV photogrammetry and laser Canning of bridges: A new methodology and its application to a case study. Procedia Struct. Integr. 2024, 193–200. [CrossRef]
- Mohammadi, M.; Rashidi, M.; Mousavi, V.; Karami, A.; Yu, Y.; Samali, B. Quality evaluation of digital twins generated based on UAV photogrammetry and TLS: Bridge case study. Remote Sens. 2021, 13(17), 3499. [CrossRef]
- Mousavi, V.; Rashidi, M.; Mohammadi, M.; Samali, B. Evolution of digital twin frameworks in bridge management: Review and future directions. Remote Sens. 2024, 16(11), 1887. [CrossRef]
- Jürgen, H.; Michał, W.; Oliver, S. Use of unmanned aerial vehicle photogrammetry to obtain topographical information to improve bridge risk assessment. J. Infrastruct. Syst. 2018, 24(1), 04017041. [CrossRef]
- Dudek, M.; Lachowicz, Ł. Przegląd specjalny mostu kolejowego w km 17+106 w ramach zadania pn. „Przygotowanie linii kolejowych nr 234 na odcinku Kokoszki—Stara Piła oraz nr 229 na odcinku Stara Piła— Glincz jako trasy objazdowej na czas realizacji projektu „Prace na alternatywnym ciągu transportowym Bydgoszcz—Trójmiasto, etap I”.
- Szukaj w archiwach. Available online: https://www.szukajwarchiwach.gov.pl/jednostka/-/jednostka/37485097 (accessed on 13 October 2025).
- Bunsch, E.; Sitnik, R. Kryteria doboru techniki 3D do dokumentacji obiektów dziedzictwa kulturowego. Narodowy Instytut Muzealnictwa i Ochrony Zbiorów (NIMOZ): Warszawa, Polska, 2014.
- Bernasik, J.; Mikrut, S. Fotogrametria inżynieryjna. Akademia Górniczo-Hutnicza: Kraków, Polska, 2007.
- Hans, F. Fotogrametria w zastosowaniu do pomiarów zabytków w Austrii. 1967.
- Hellwich, O. Photogrammetric methods. In Encyclopedia of GIS; Shekhar, S.; Xiong, H.; Zhou, X., Eds.; Springer: Cham, Switzerland, 2017; pp. 1574–1580. [CrossRef]
- Borg, B.; Dunn, M.; Ang, A.; Villis, C. The application of state-of-the-art technologies to support artwork conservation: Literature review. J. Cult. Herit. 2020, 43, 1–12. [CrossRef]
- Tommasi, C.; Achille, C.; Fassi, F. From point cloud to BIM: A modelling challenge in the cultural heritage field. ISPRS Arch. 2016, XLI-B5, 429–436. [CrossRef]
- Kersten, T.P.; Lindstaedt, M. Image-based low-cost systems for automatic 3D recording and modelling of archaeological finds and objects. In Progress in Cultural Heritage Preservation; Ioannides, M.; Fritsch, D.; Leissner, J.; Davies, R.; Remondino, F.; Caffo, R., Eds.; Springer: Berlin, Heidelberg, Germany, 2012; pp. 1–10. [CrossRef]
- Afaq, S.; Jain, S.K.; Sharma, N.; Sharma, S. Comparative assessment of 2D photogrammetry versus direct anthropometry in nasal measurements. Eur. J. Clin. Exp. Med. 2025, 23(2), 307–315.. [CrossRef]
- Kingsland, K. Comparative analysis of digital photogrammetry software for cultural heritage. Digit. Appl. Archaeol. Cult. Herit. 2020, 18, e00157. [CrossRef]
- Cabral, R.; et al. Railway bridge geometry assessment supported by cutting-edge reality capture technologies and 3D as-designed models. Infrastructures 2023, 8(7), 114. [CrossRef]
- Remondino, F.; El-Hakim, S. Image-based 3D modelling: A review. Photogramm. Rec. 2006, 21(115), 269–291. [CrossRef]
- Wallace, L.; Lucieer, A.; Watson, C.; Turner, D. Development of a UAV-LiDAR system with application to forest inventory. Remote Sens. 2012, 4(6), 1519–1543. [CrossRef]
- Balletti, C.; Ballarin, M.; Vernier, P. Replicas in cultural heritage: 3D printing and the museum experience. I SPRS Arch. 2018, XLII-2, 55–62. [CrossRef]
Figure 1.
Archival side plan of the Niestepowo Bridge [21].
Figure 1.
Archival side plan of the Niestepowo Bridge [21].
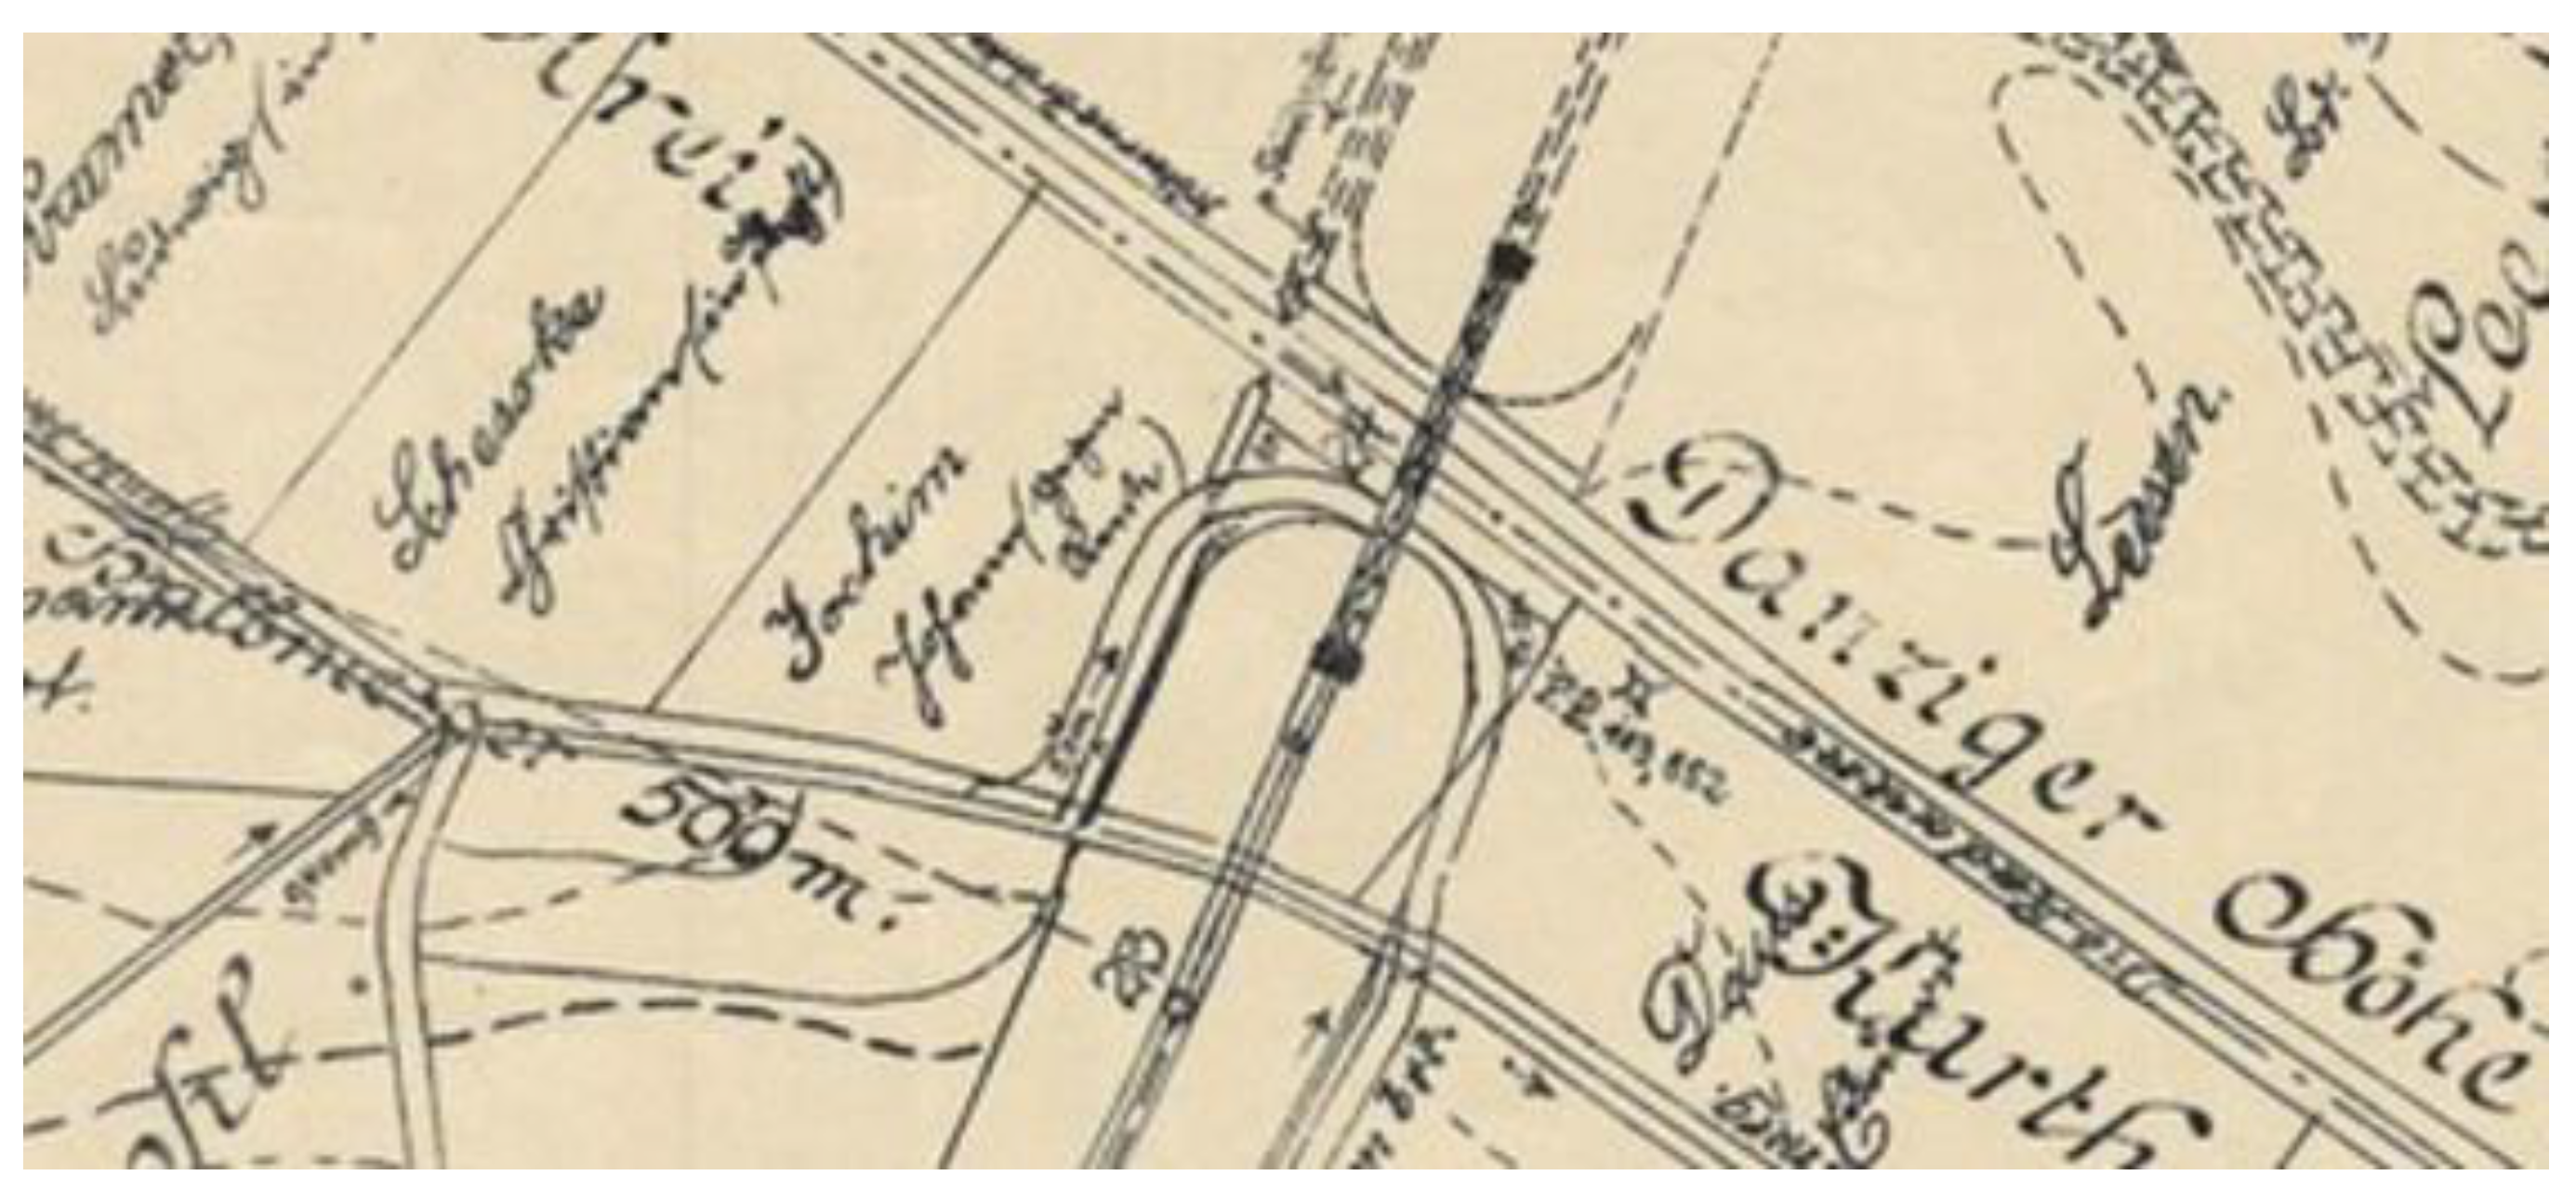
Figure 2.
Overall view of the Niestepowo Bridge.
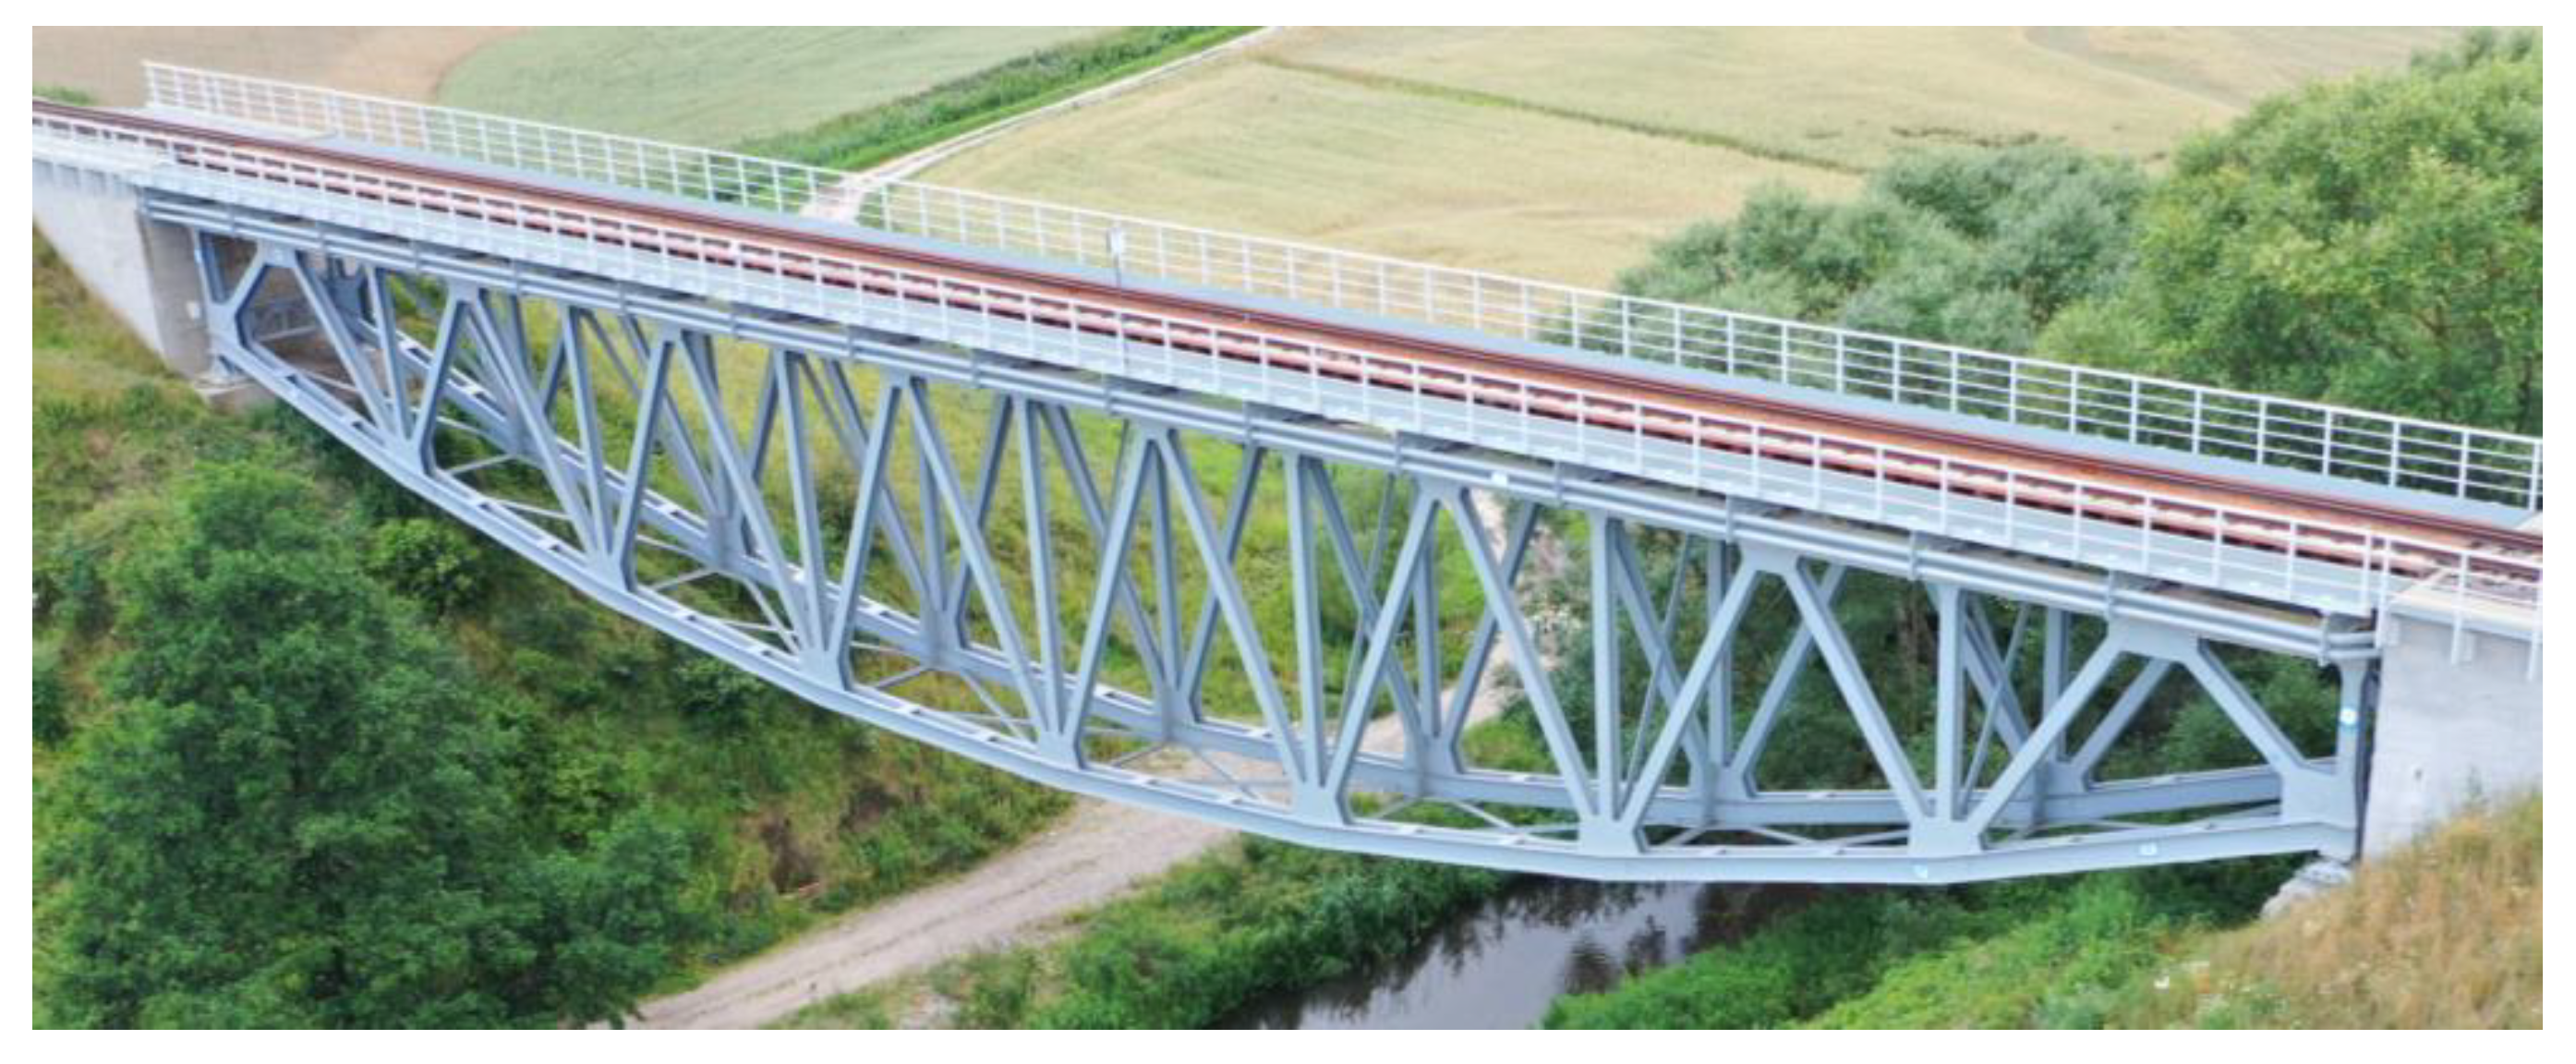
Figure 3.
Geometry of the Niestepowo Bridge a) cross-section of the Niestepowo Bridge; b) Side view of truss girder geometry.
Figure 3.
Geometry of the Niestepowo Bridge a) cross-section of the Niestepowo Bridge; b) Side view of truss girder geometry.
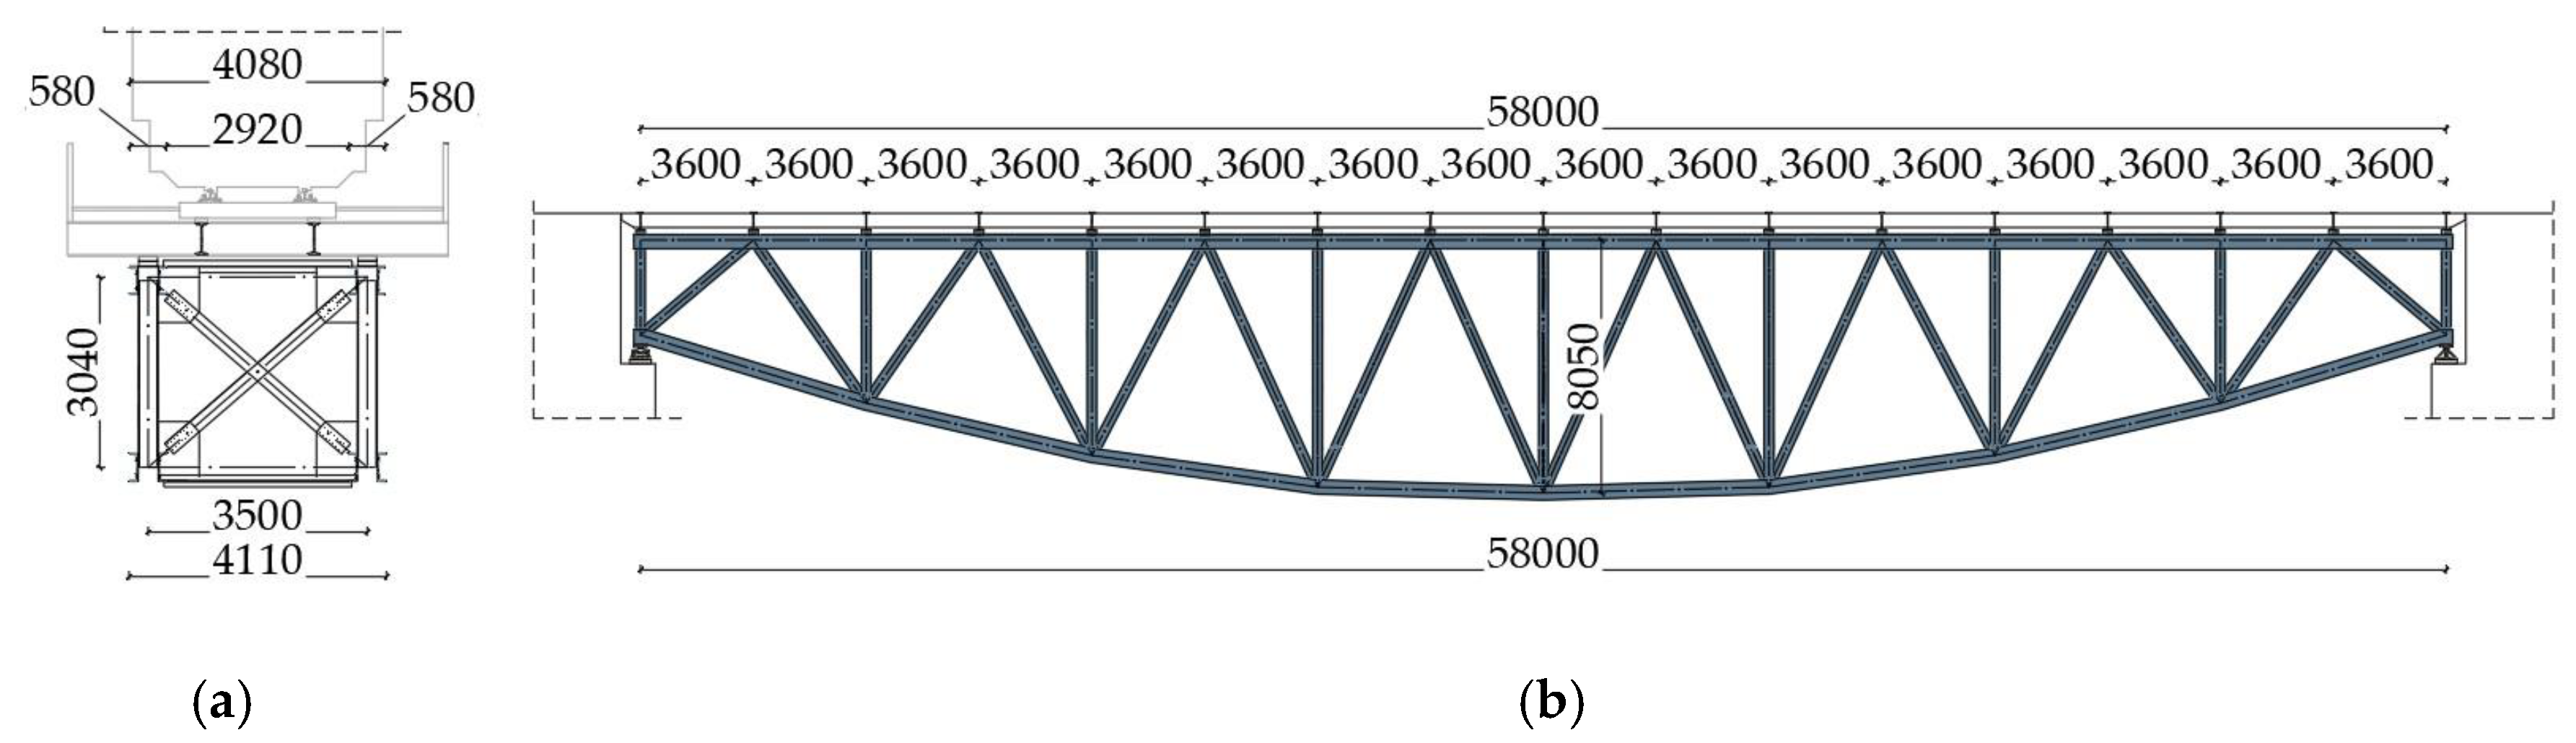
Figure 4.
Geometric relationship between the object, camera, and image planes in digital photogrammetry [25].
Figure 4.
Geometric relationship between the object, camera, and image planes in digital photogrammetry [25].
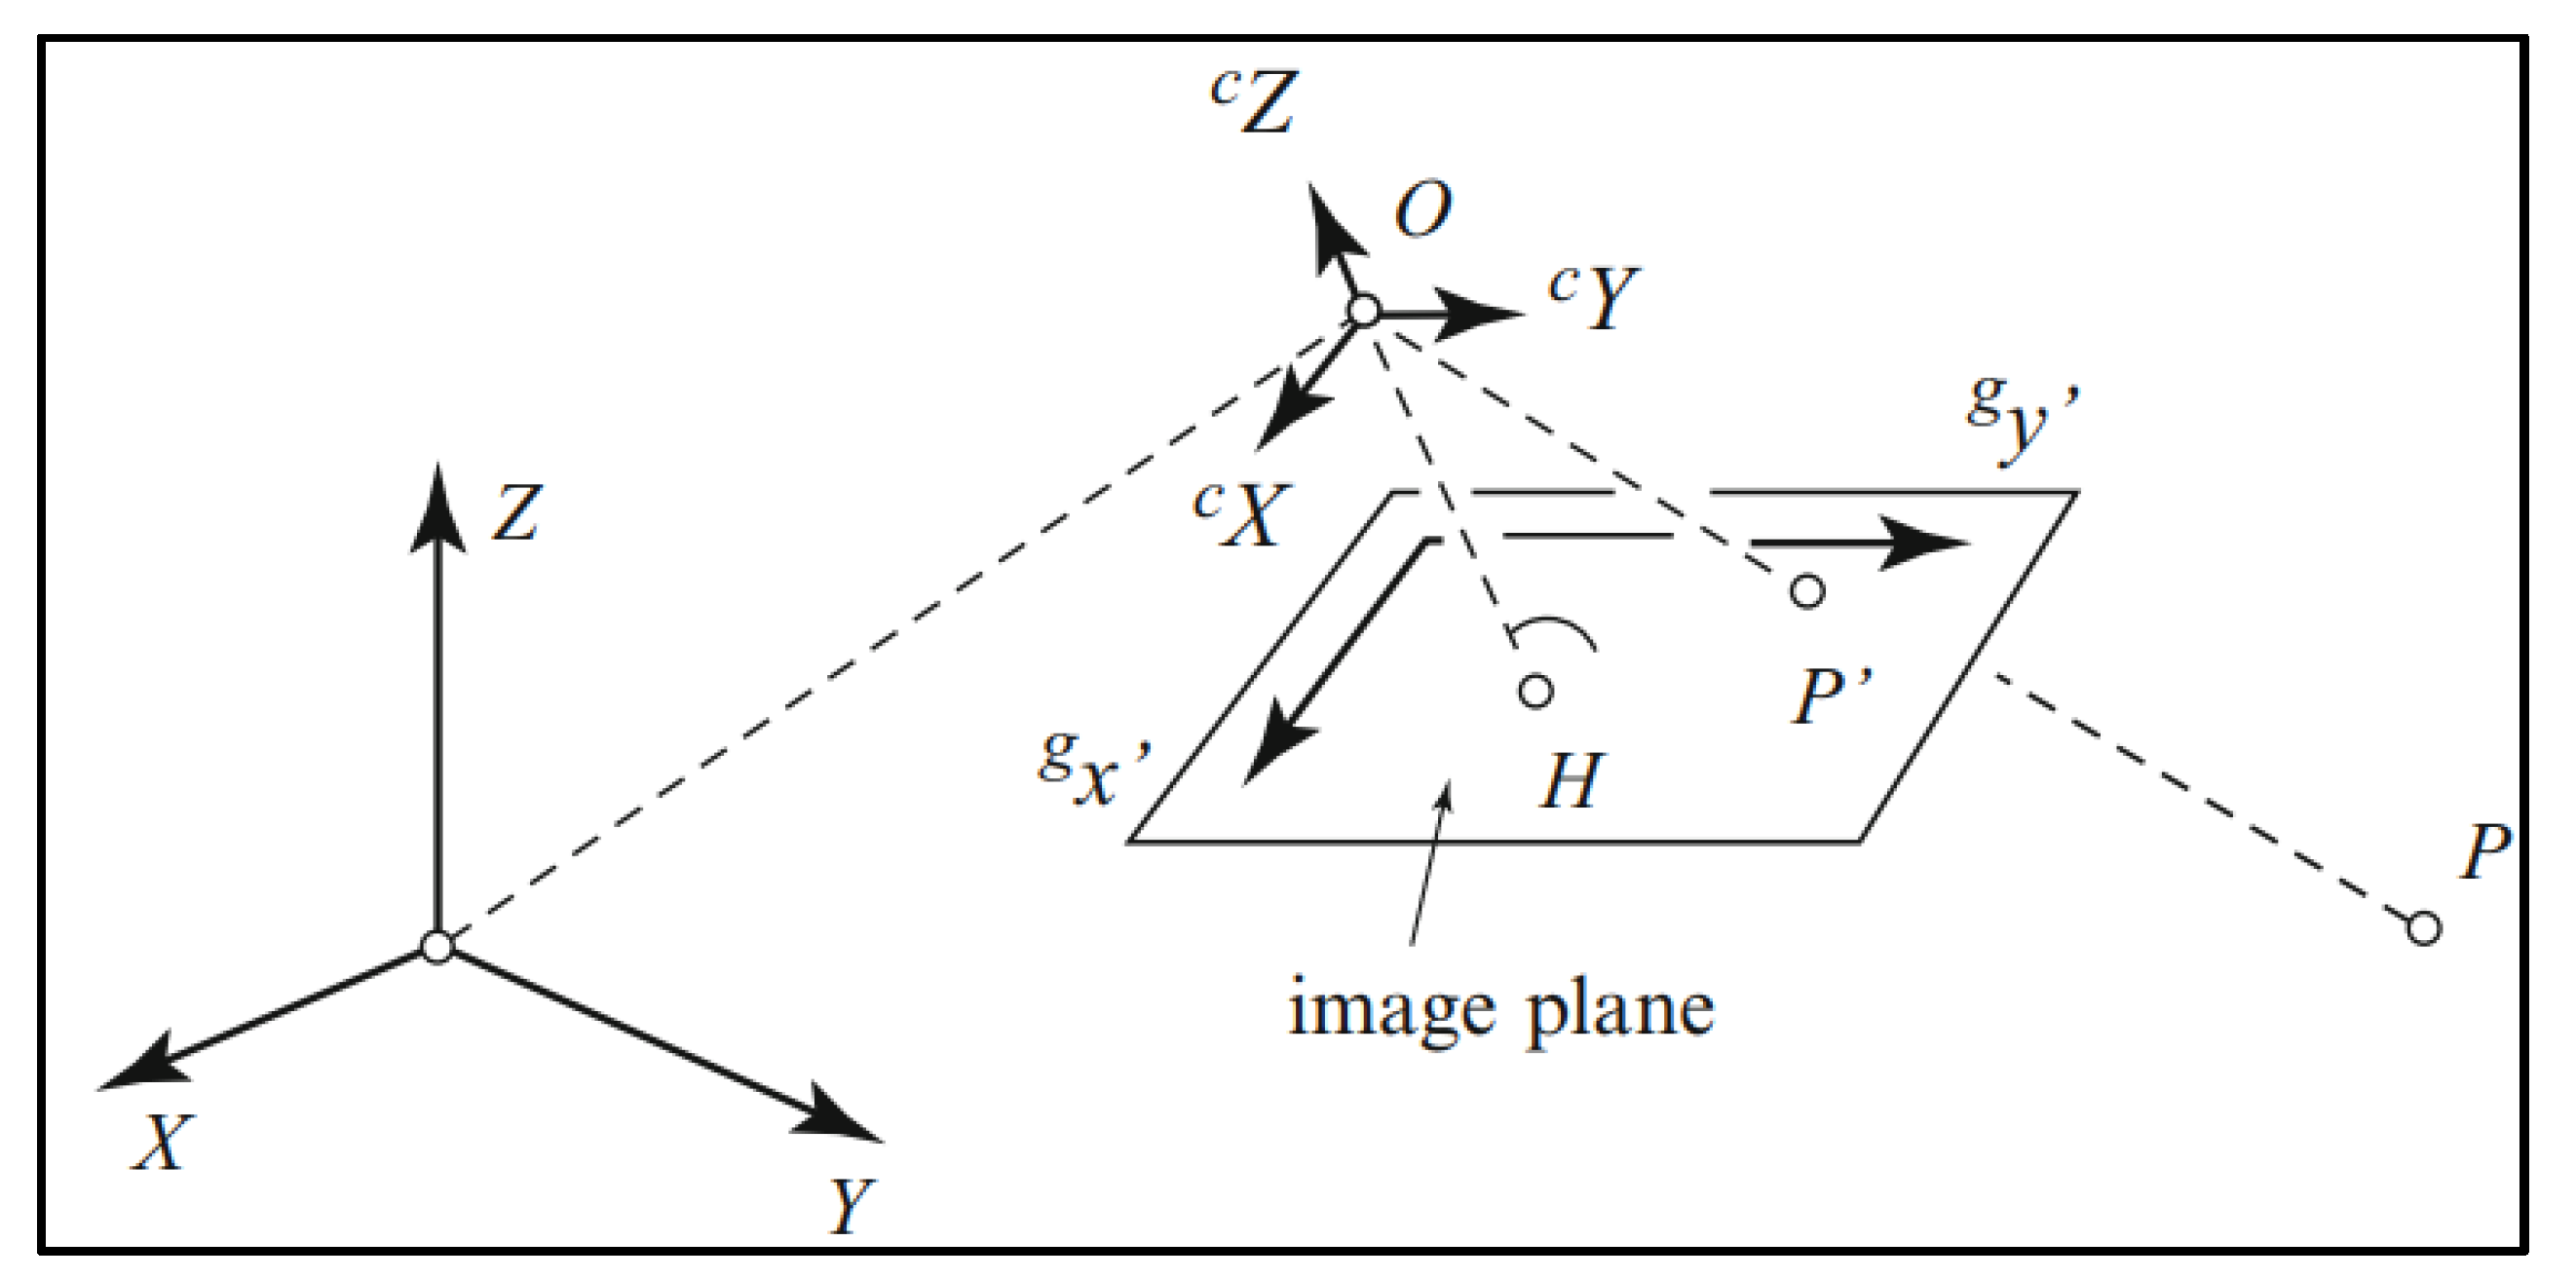
Figure 5.
Geometry of an image pair (McGlone 2004) [25].
Figure 5.
Geometry of an image pair (McGlone 2004) [25].
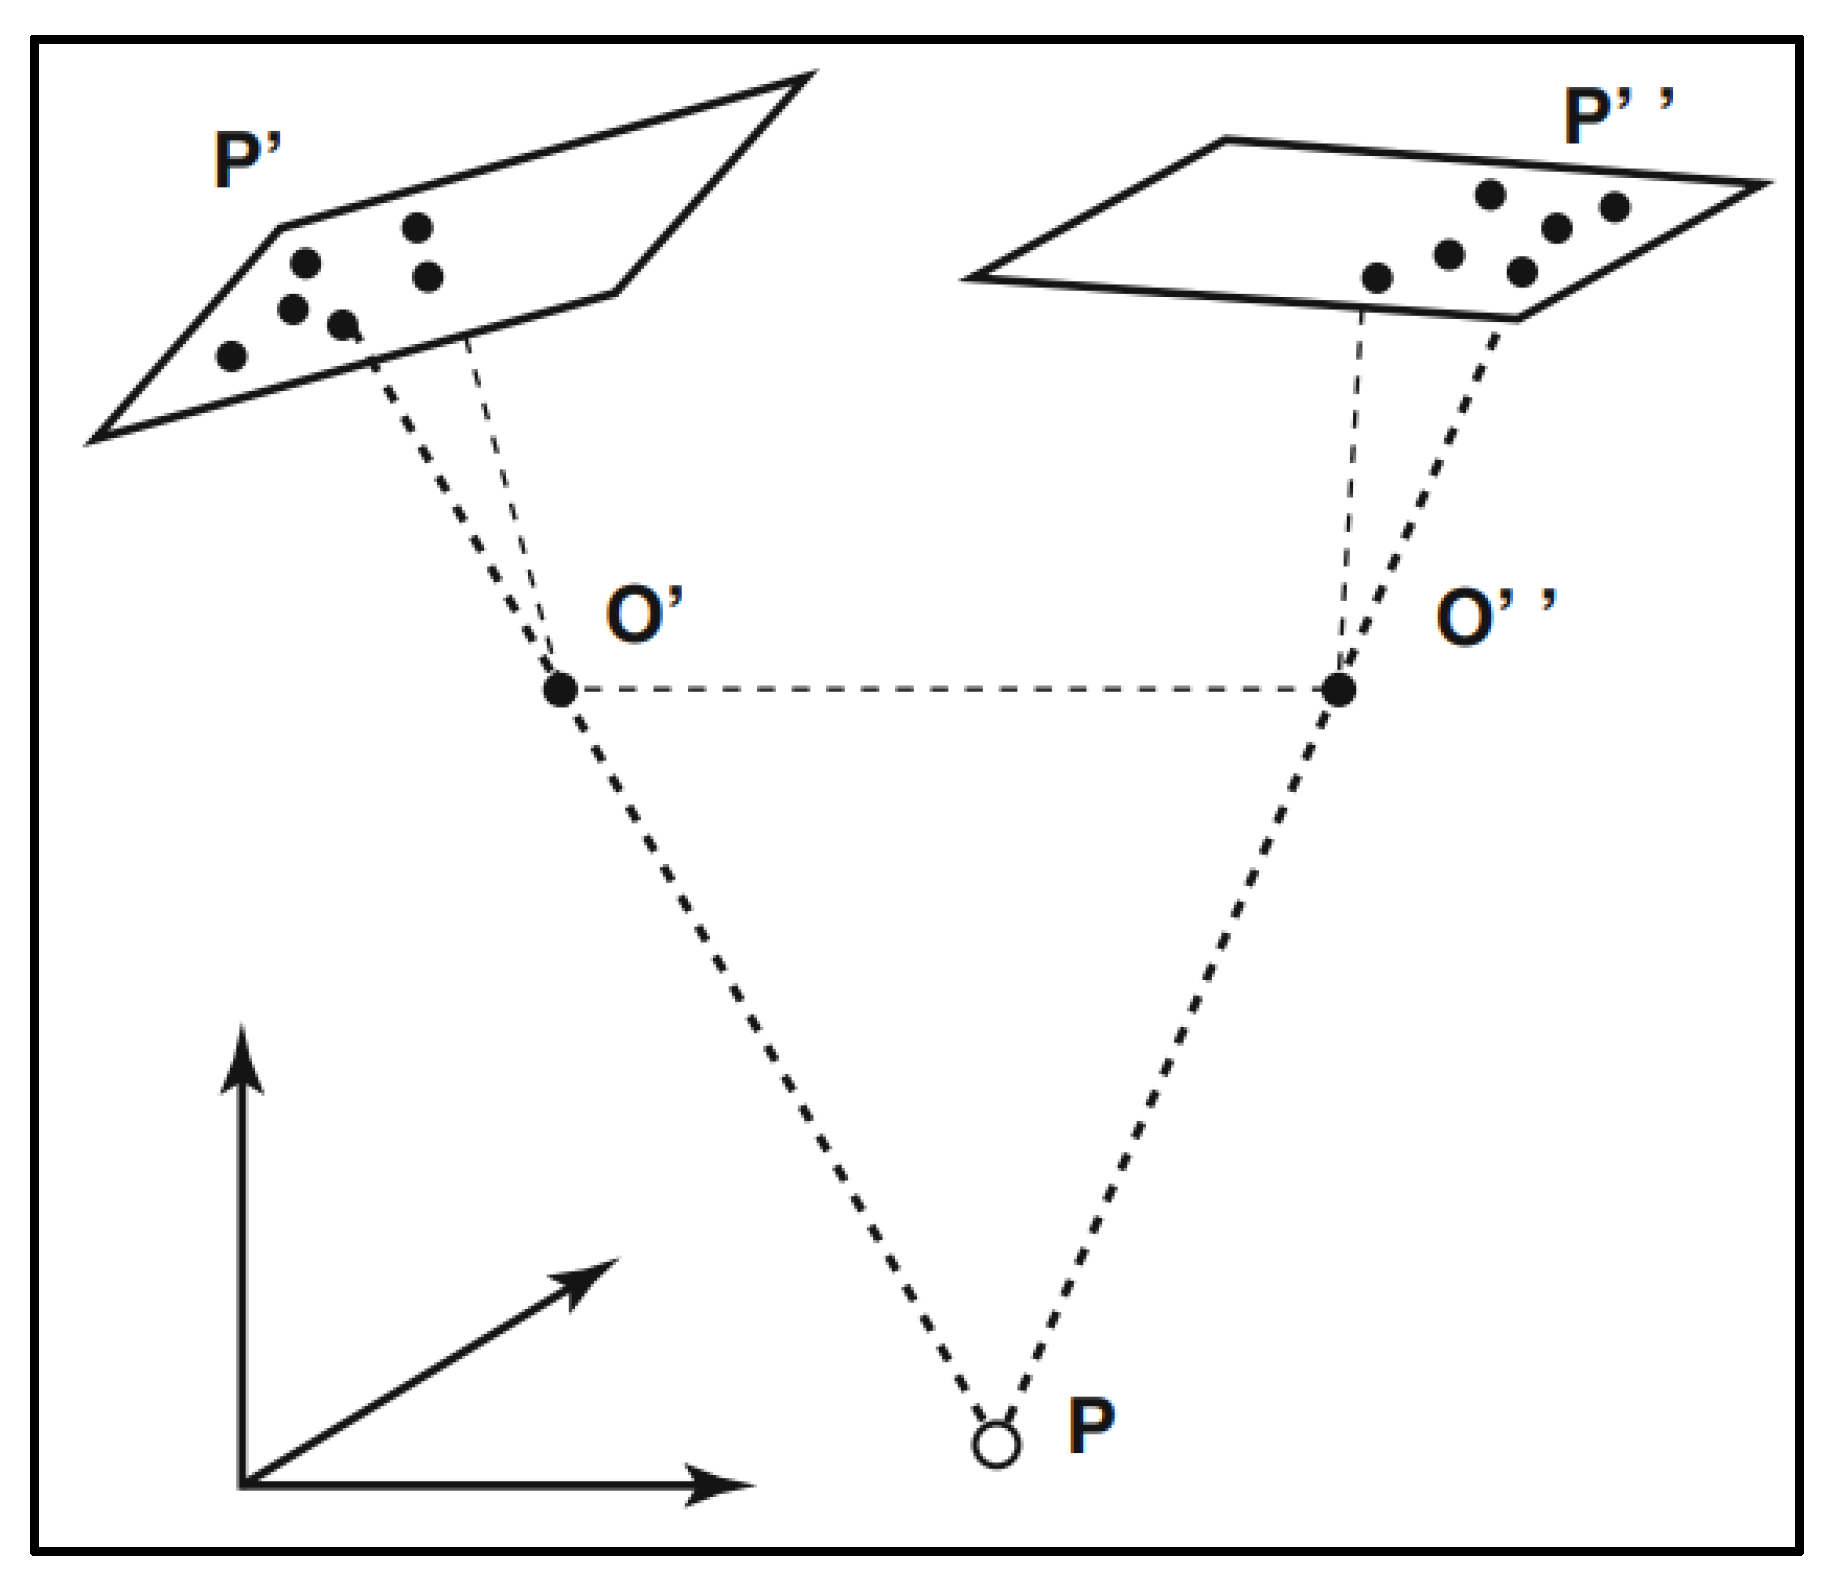
Figure 6.
Elements of epipolar geometry in stereoscopic photogrammetry [25].
Figure 6.
Elements of epipolar geometry in stereoscopic photogrammetry [25].
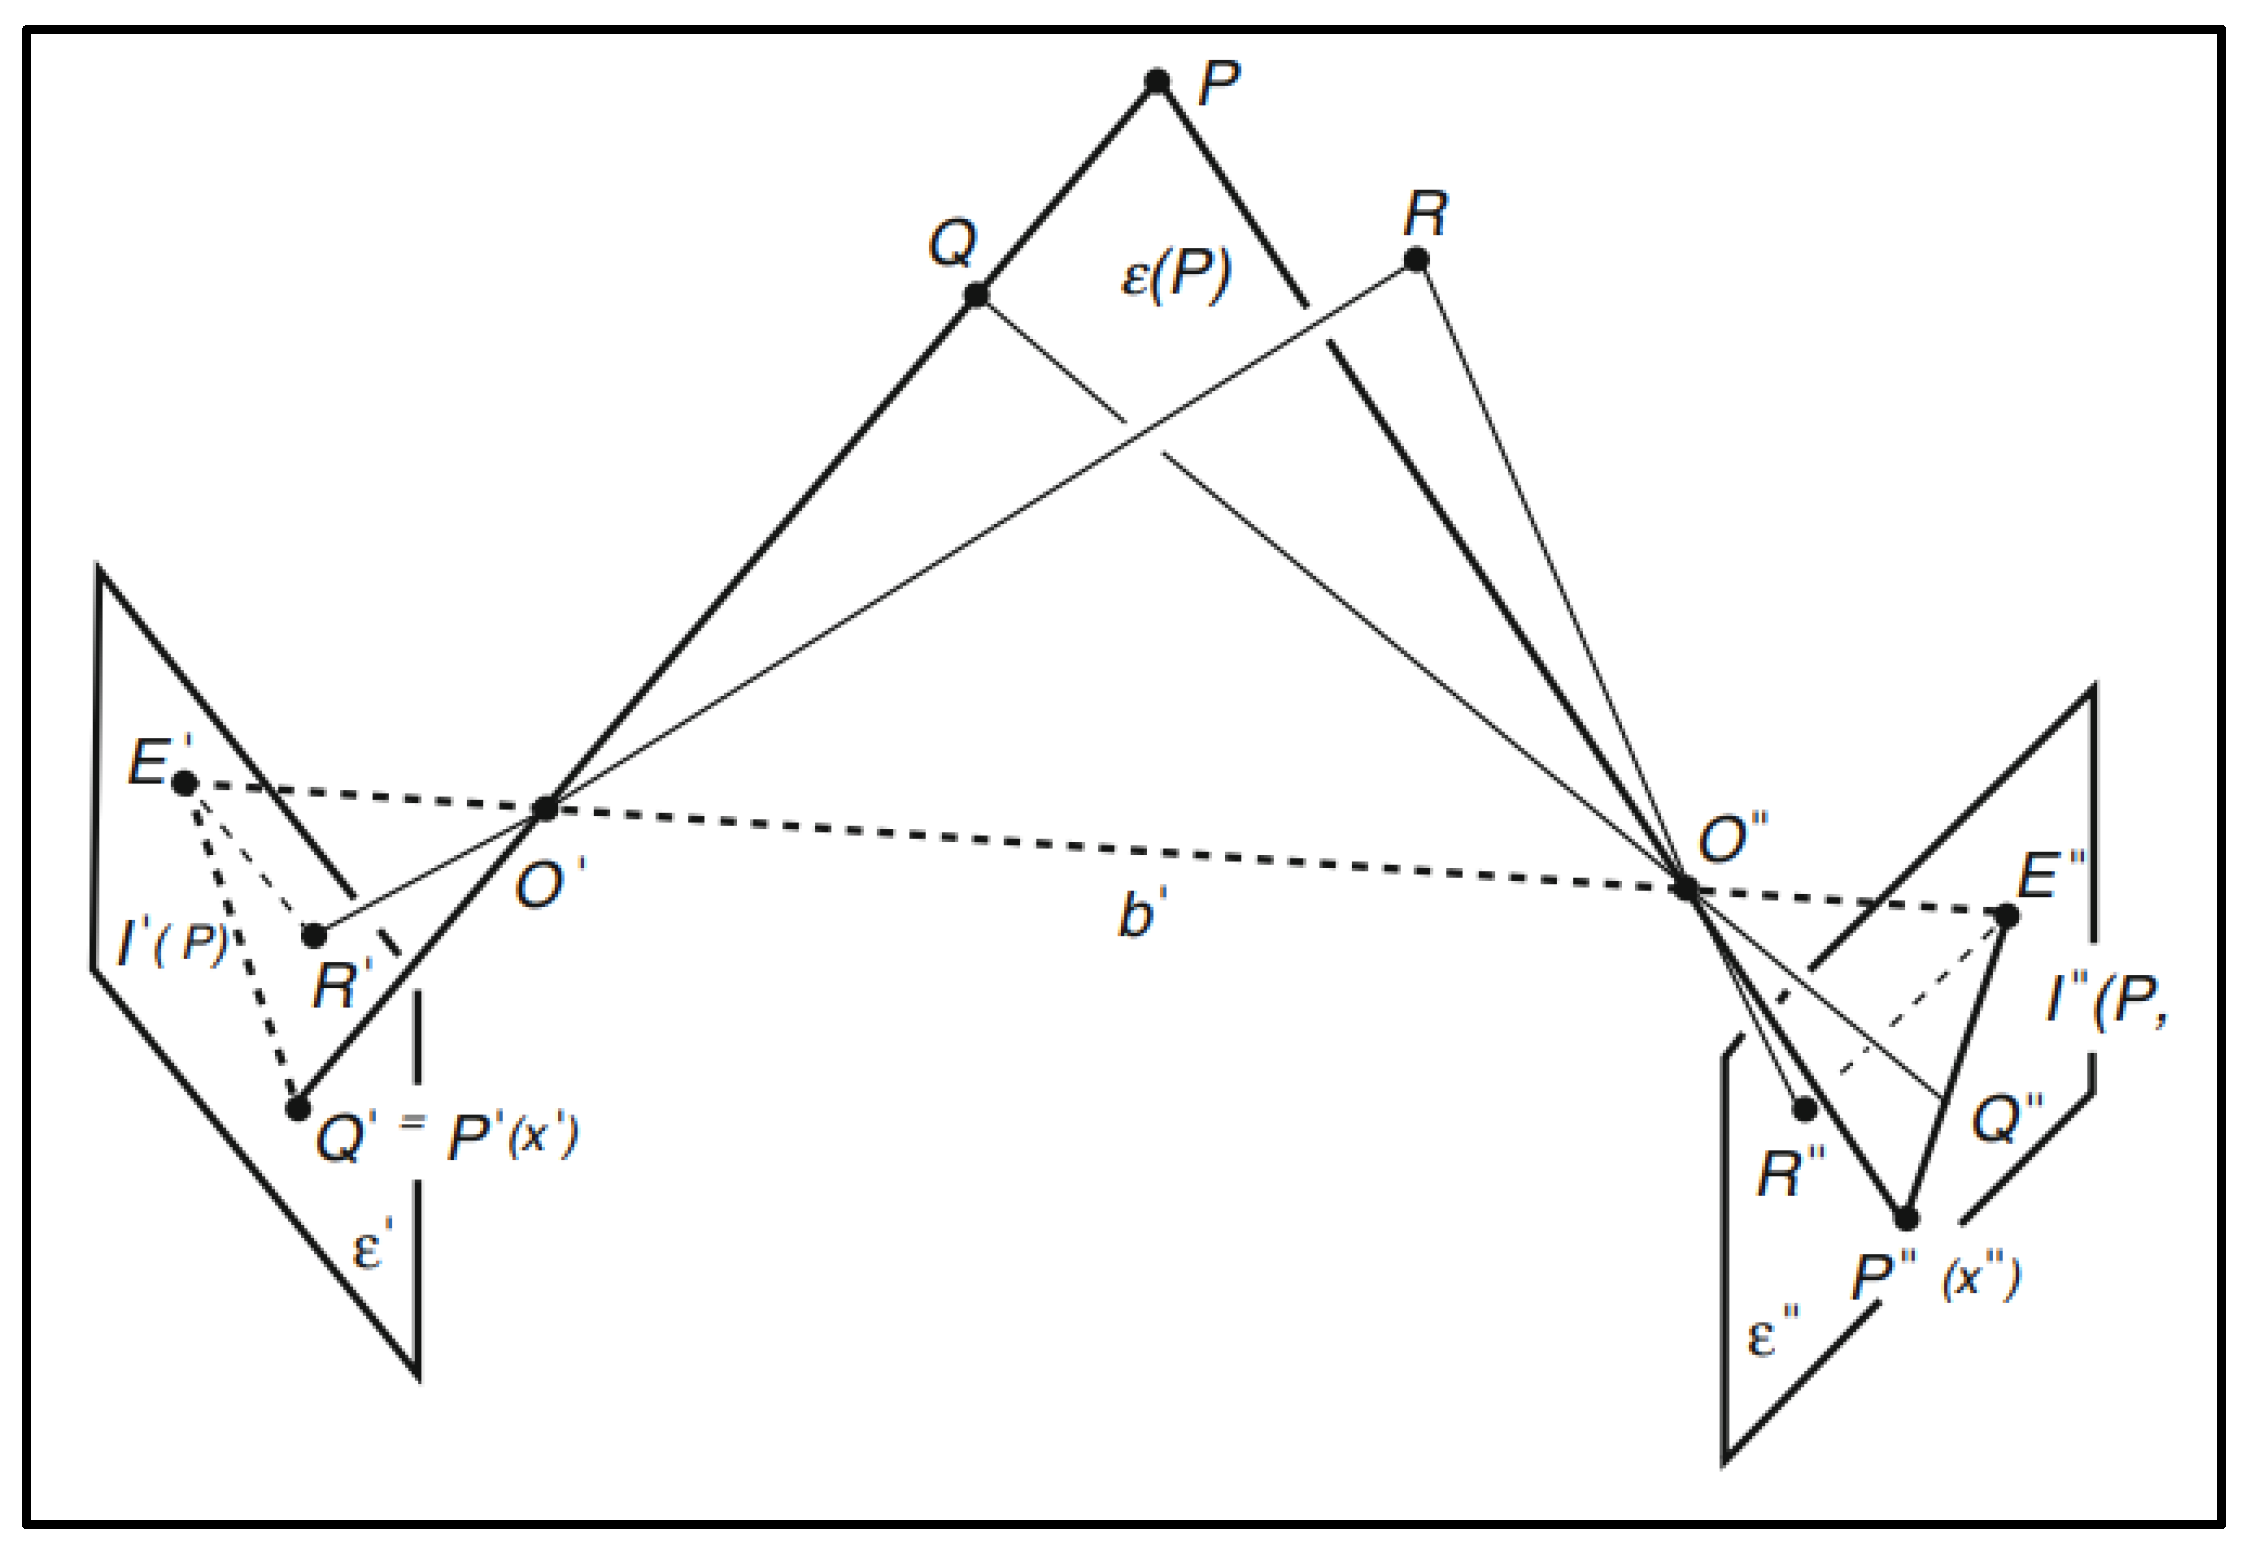
Figure 7.
Advantages and limitations of photogrammetry.
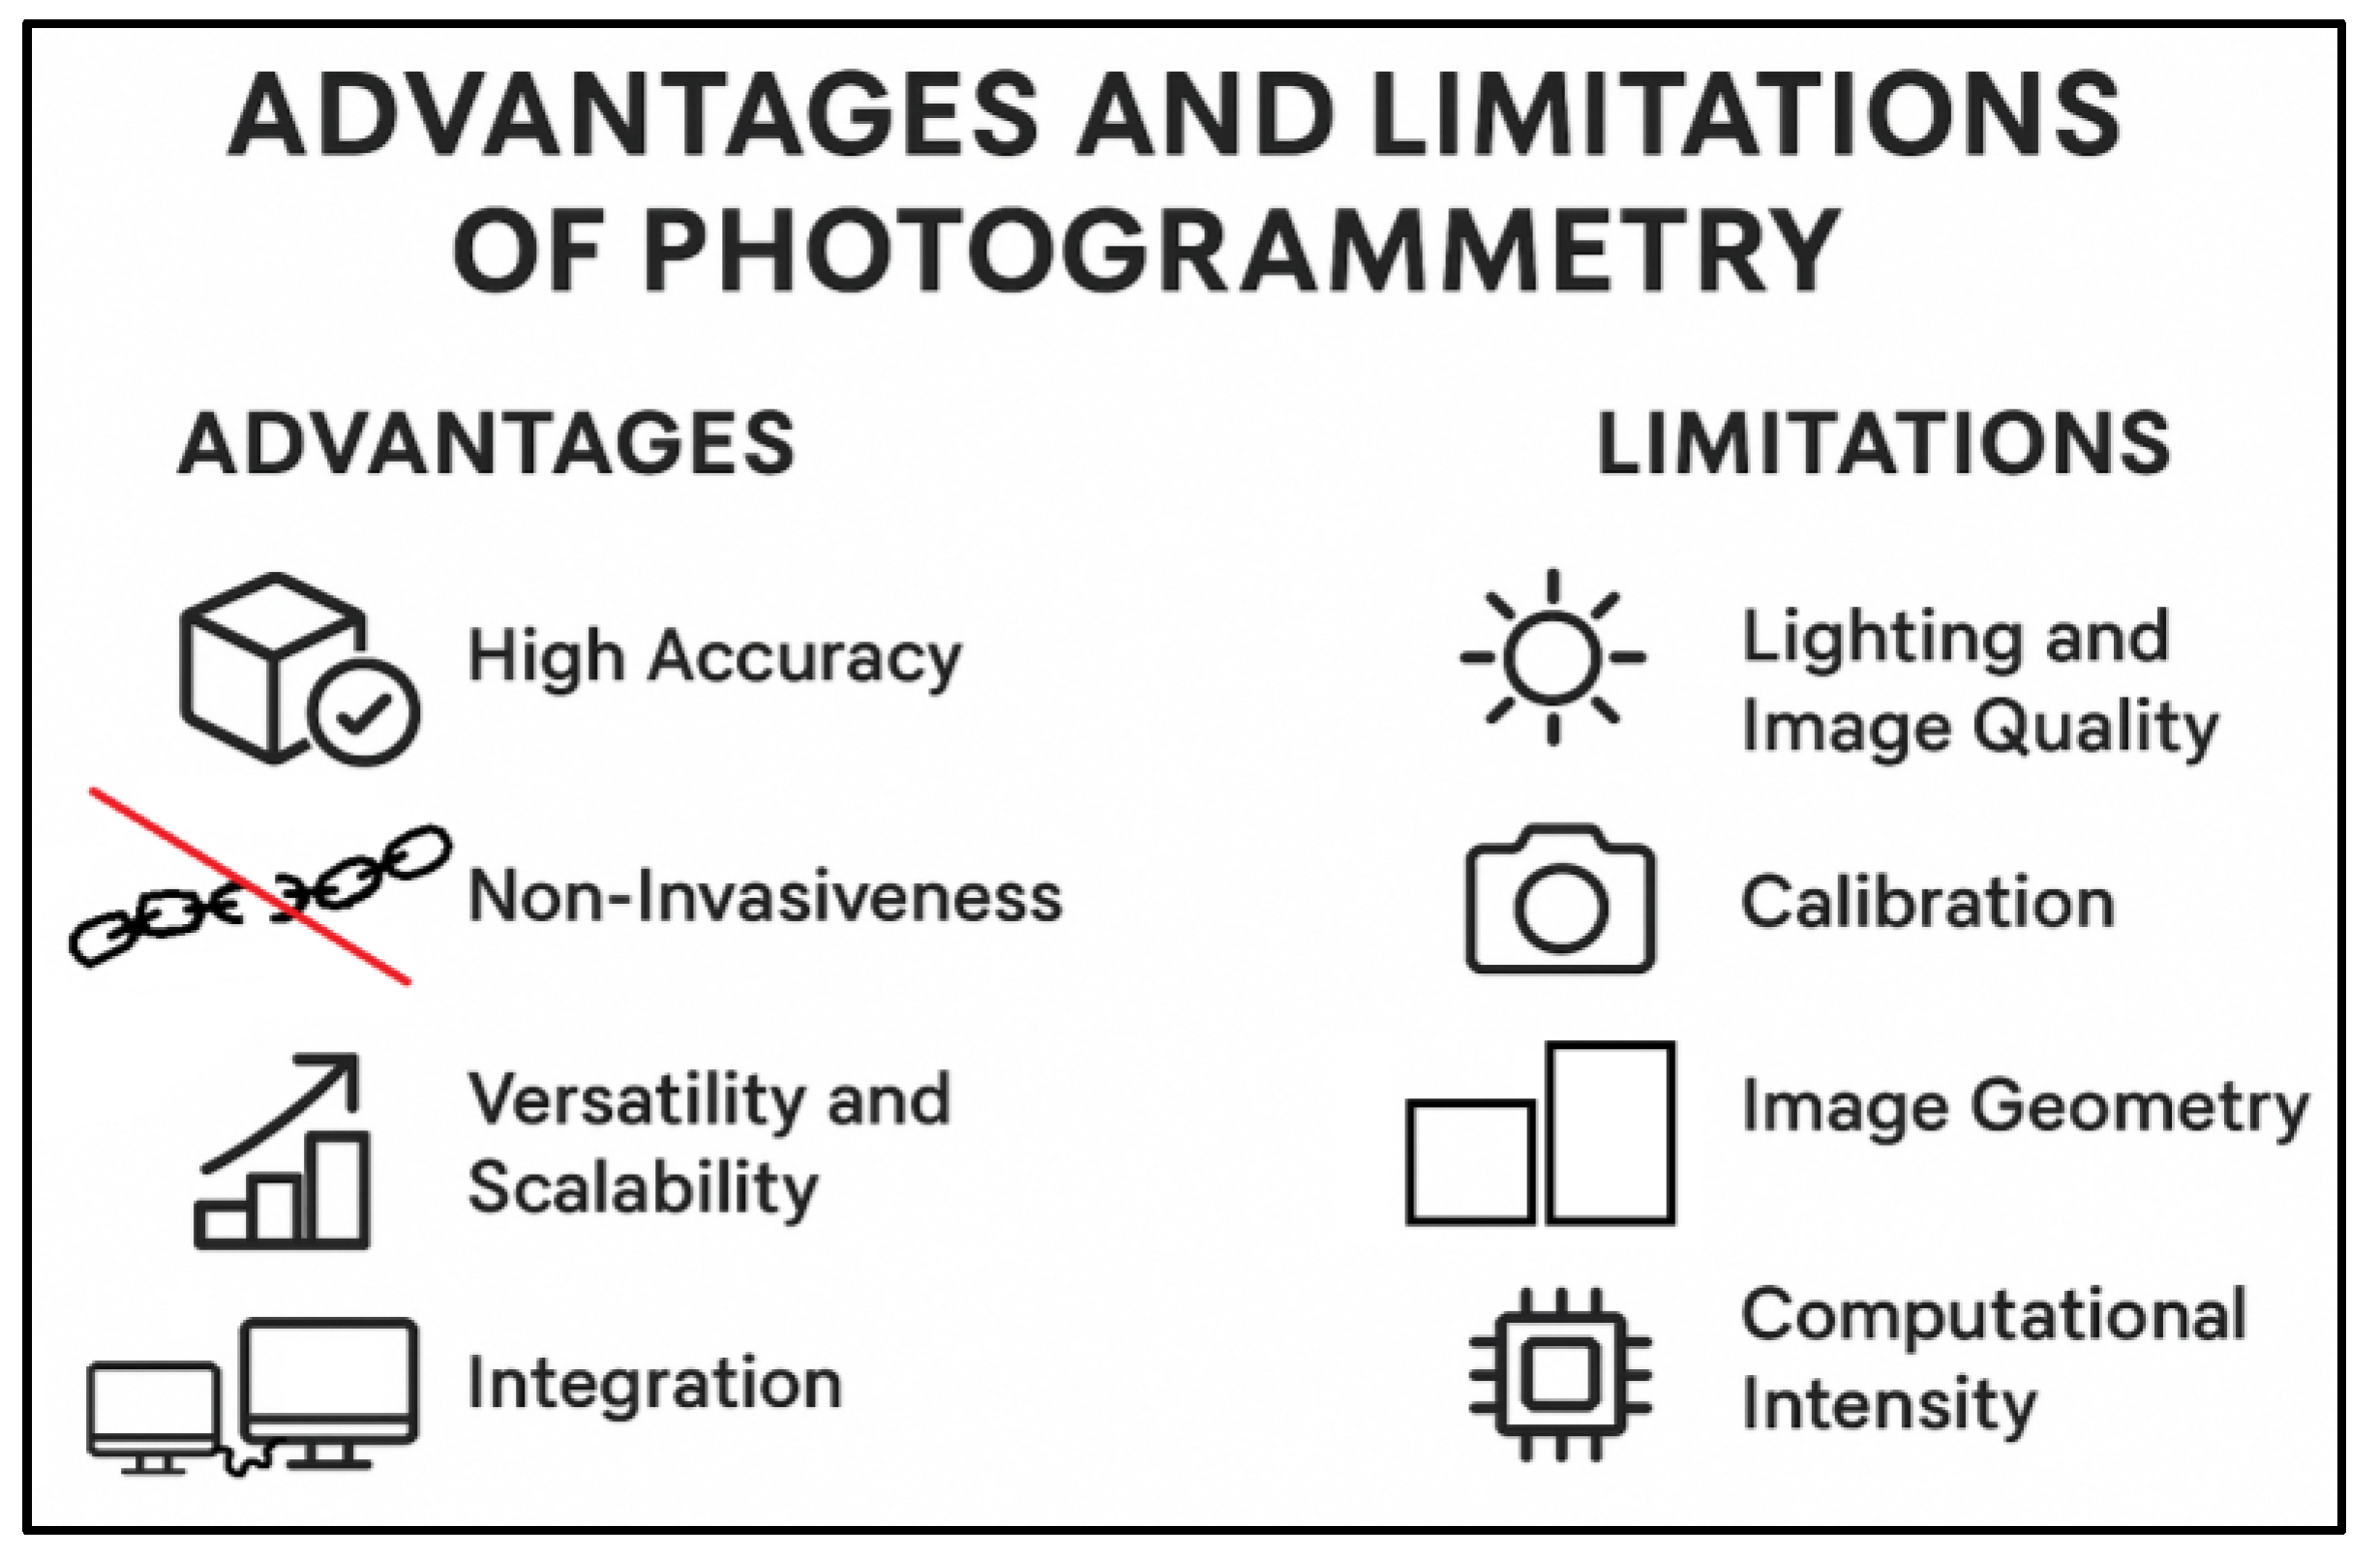
Figure 8.
Sketch of control points in a top view.
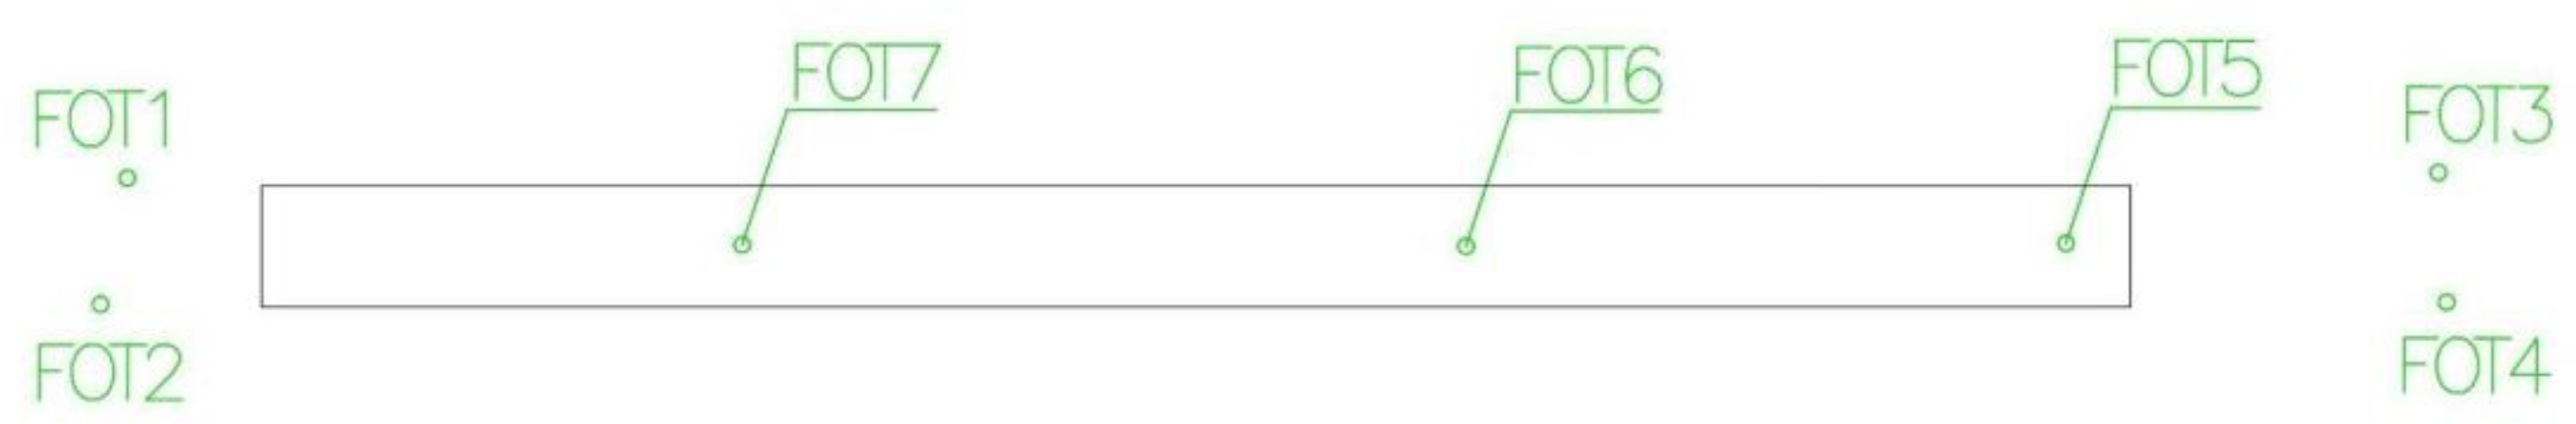
Figure 9.
North side sketch of the points measured with a total station.
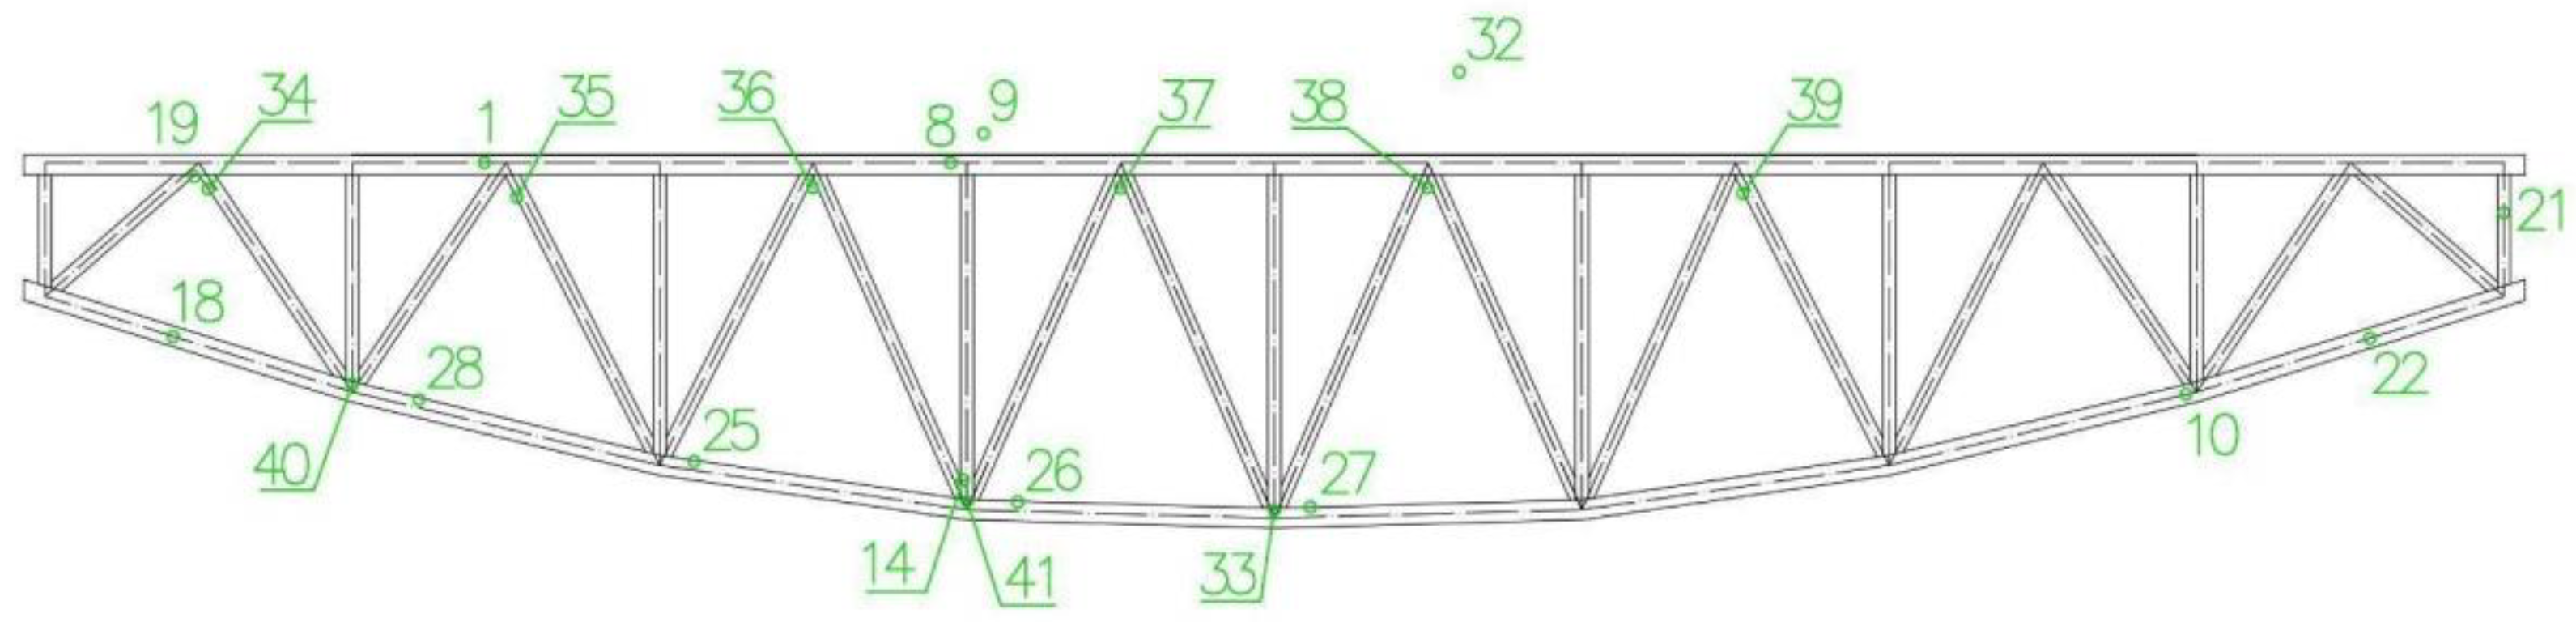
Figure 10.
South side sketch of the points measured with a total station.
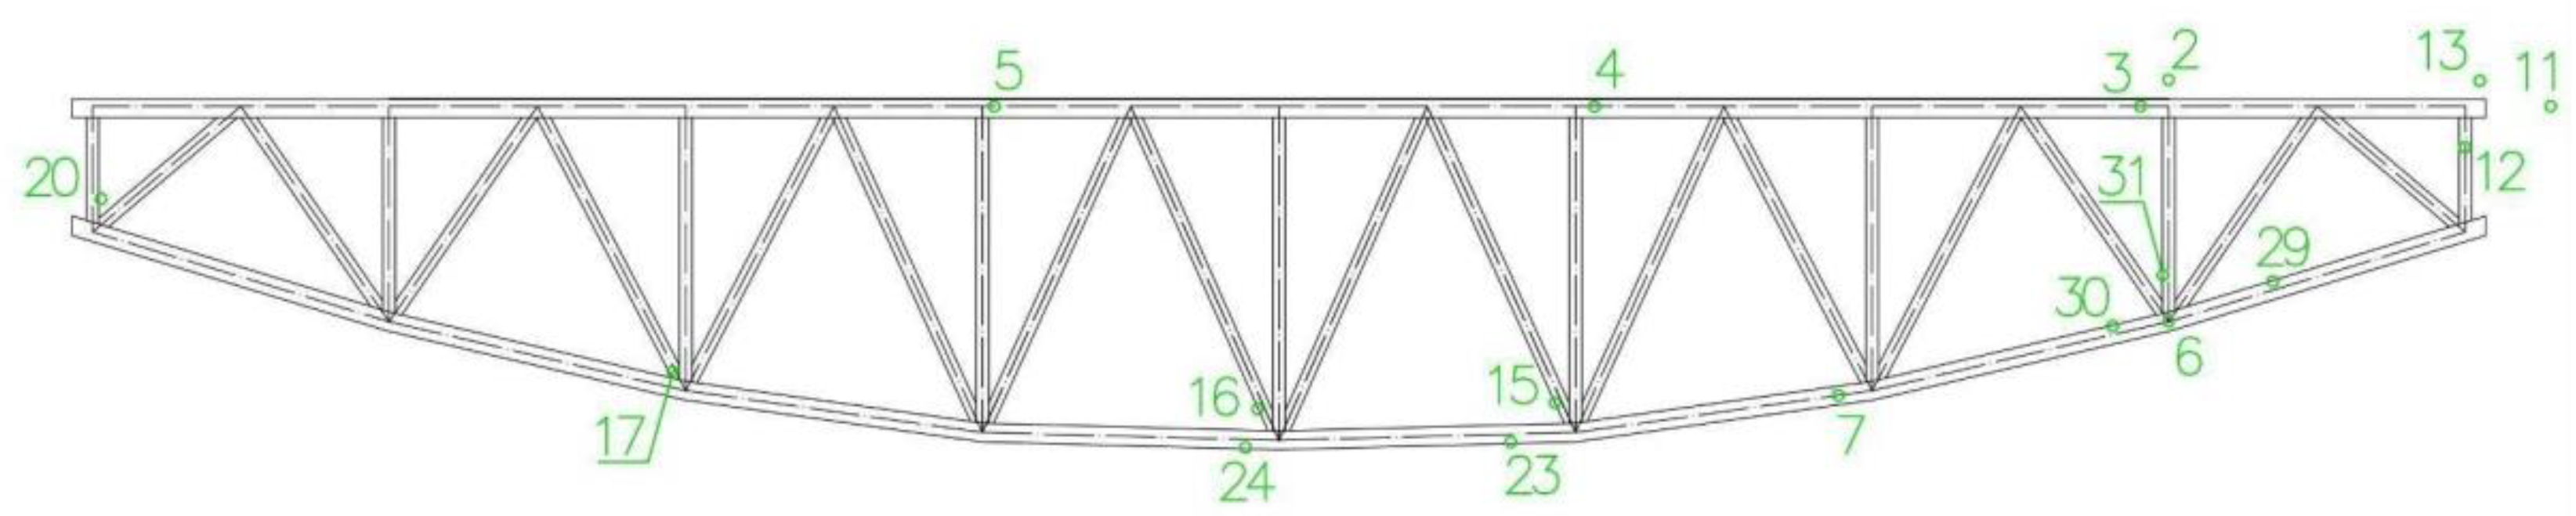
Figure 11.
Examples of DJI drones used in photogrammetry: the DJI Phantom 4 Pro, DJI Mavic 2 Pro, and DJI Mini 3 Pro.
Figure 11.
Examples of DJI drones used in photogrammetry: the DJI Phantom 4 Pro, DJI Mavic 2 Pro, and DJI Mini 3 Pro.
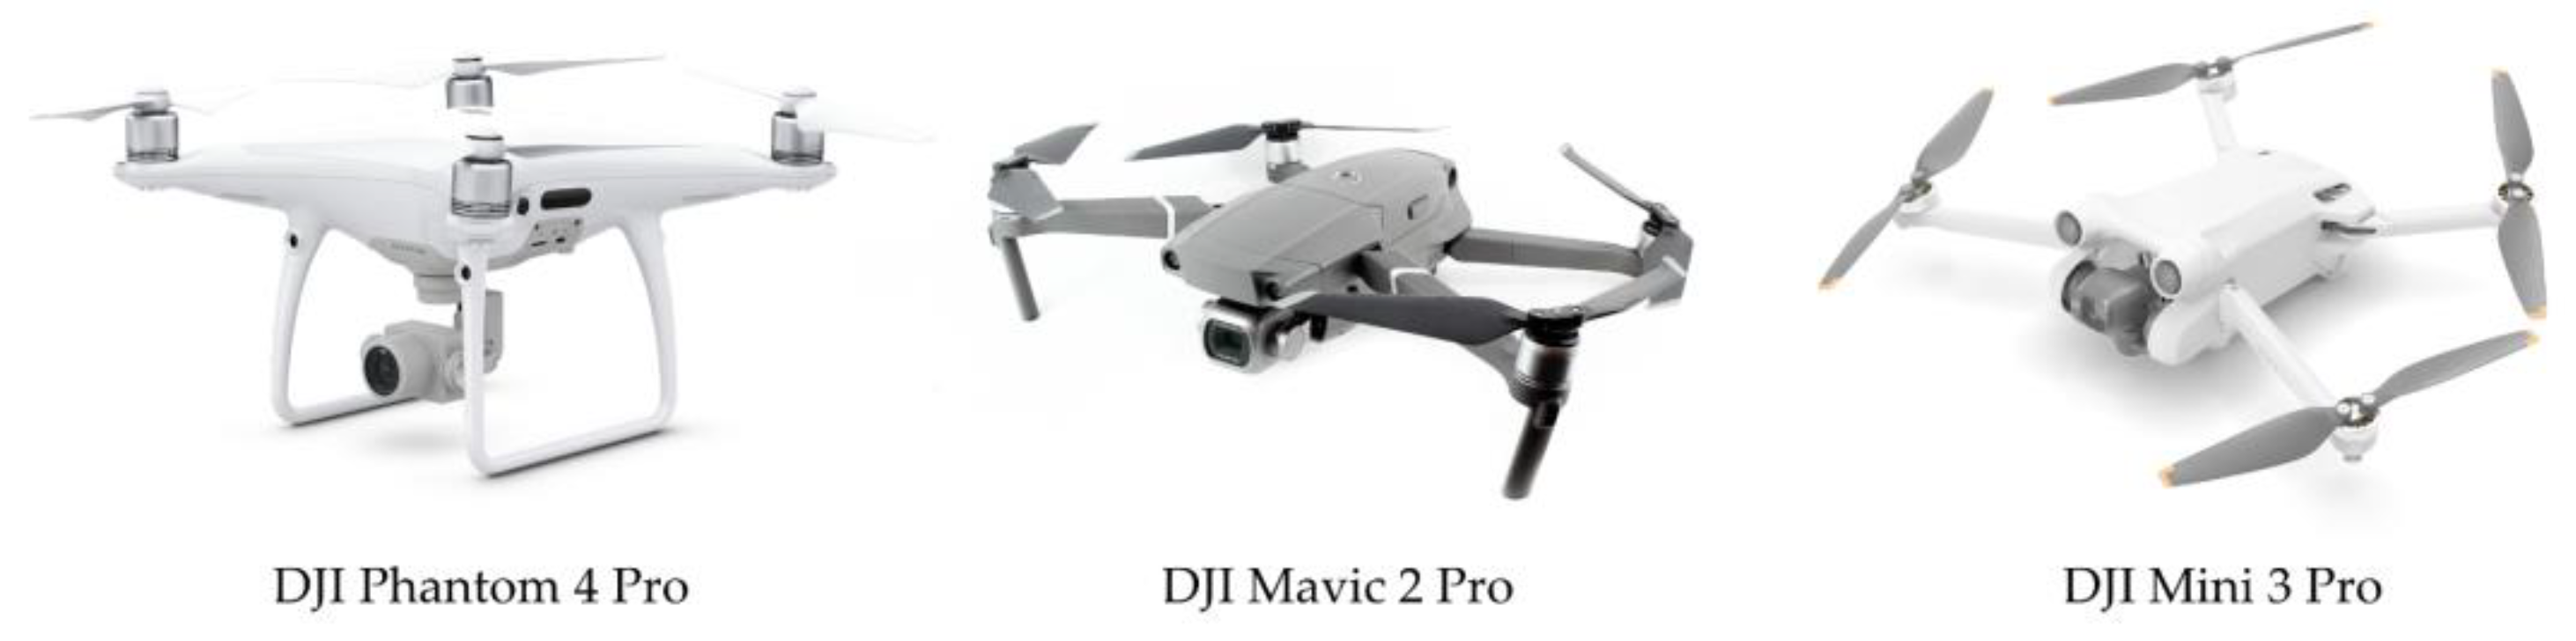
Figure 12.
Schematic of UAV flight patterns and camera orientations used for photogrammetric documentation.
Figure 12.
Schematic of UAV flight patterns and camera orientations used for photogrammetric documentation.
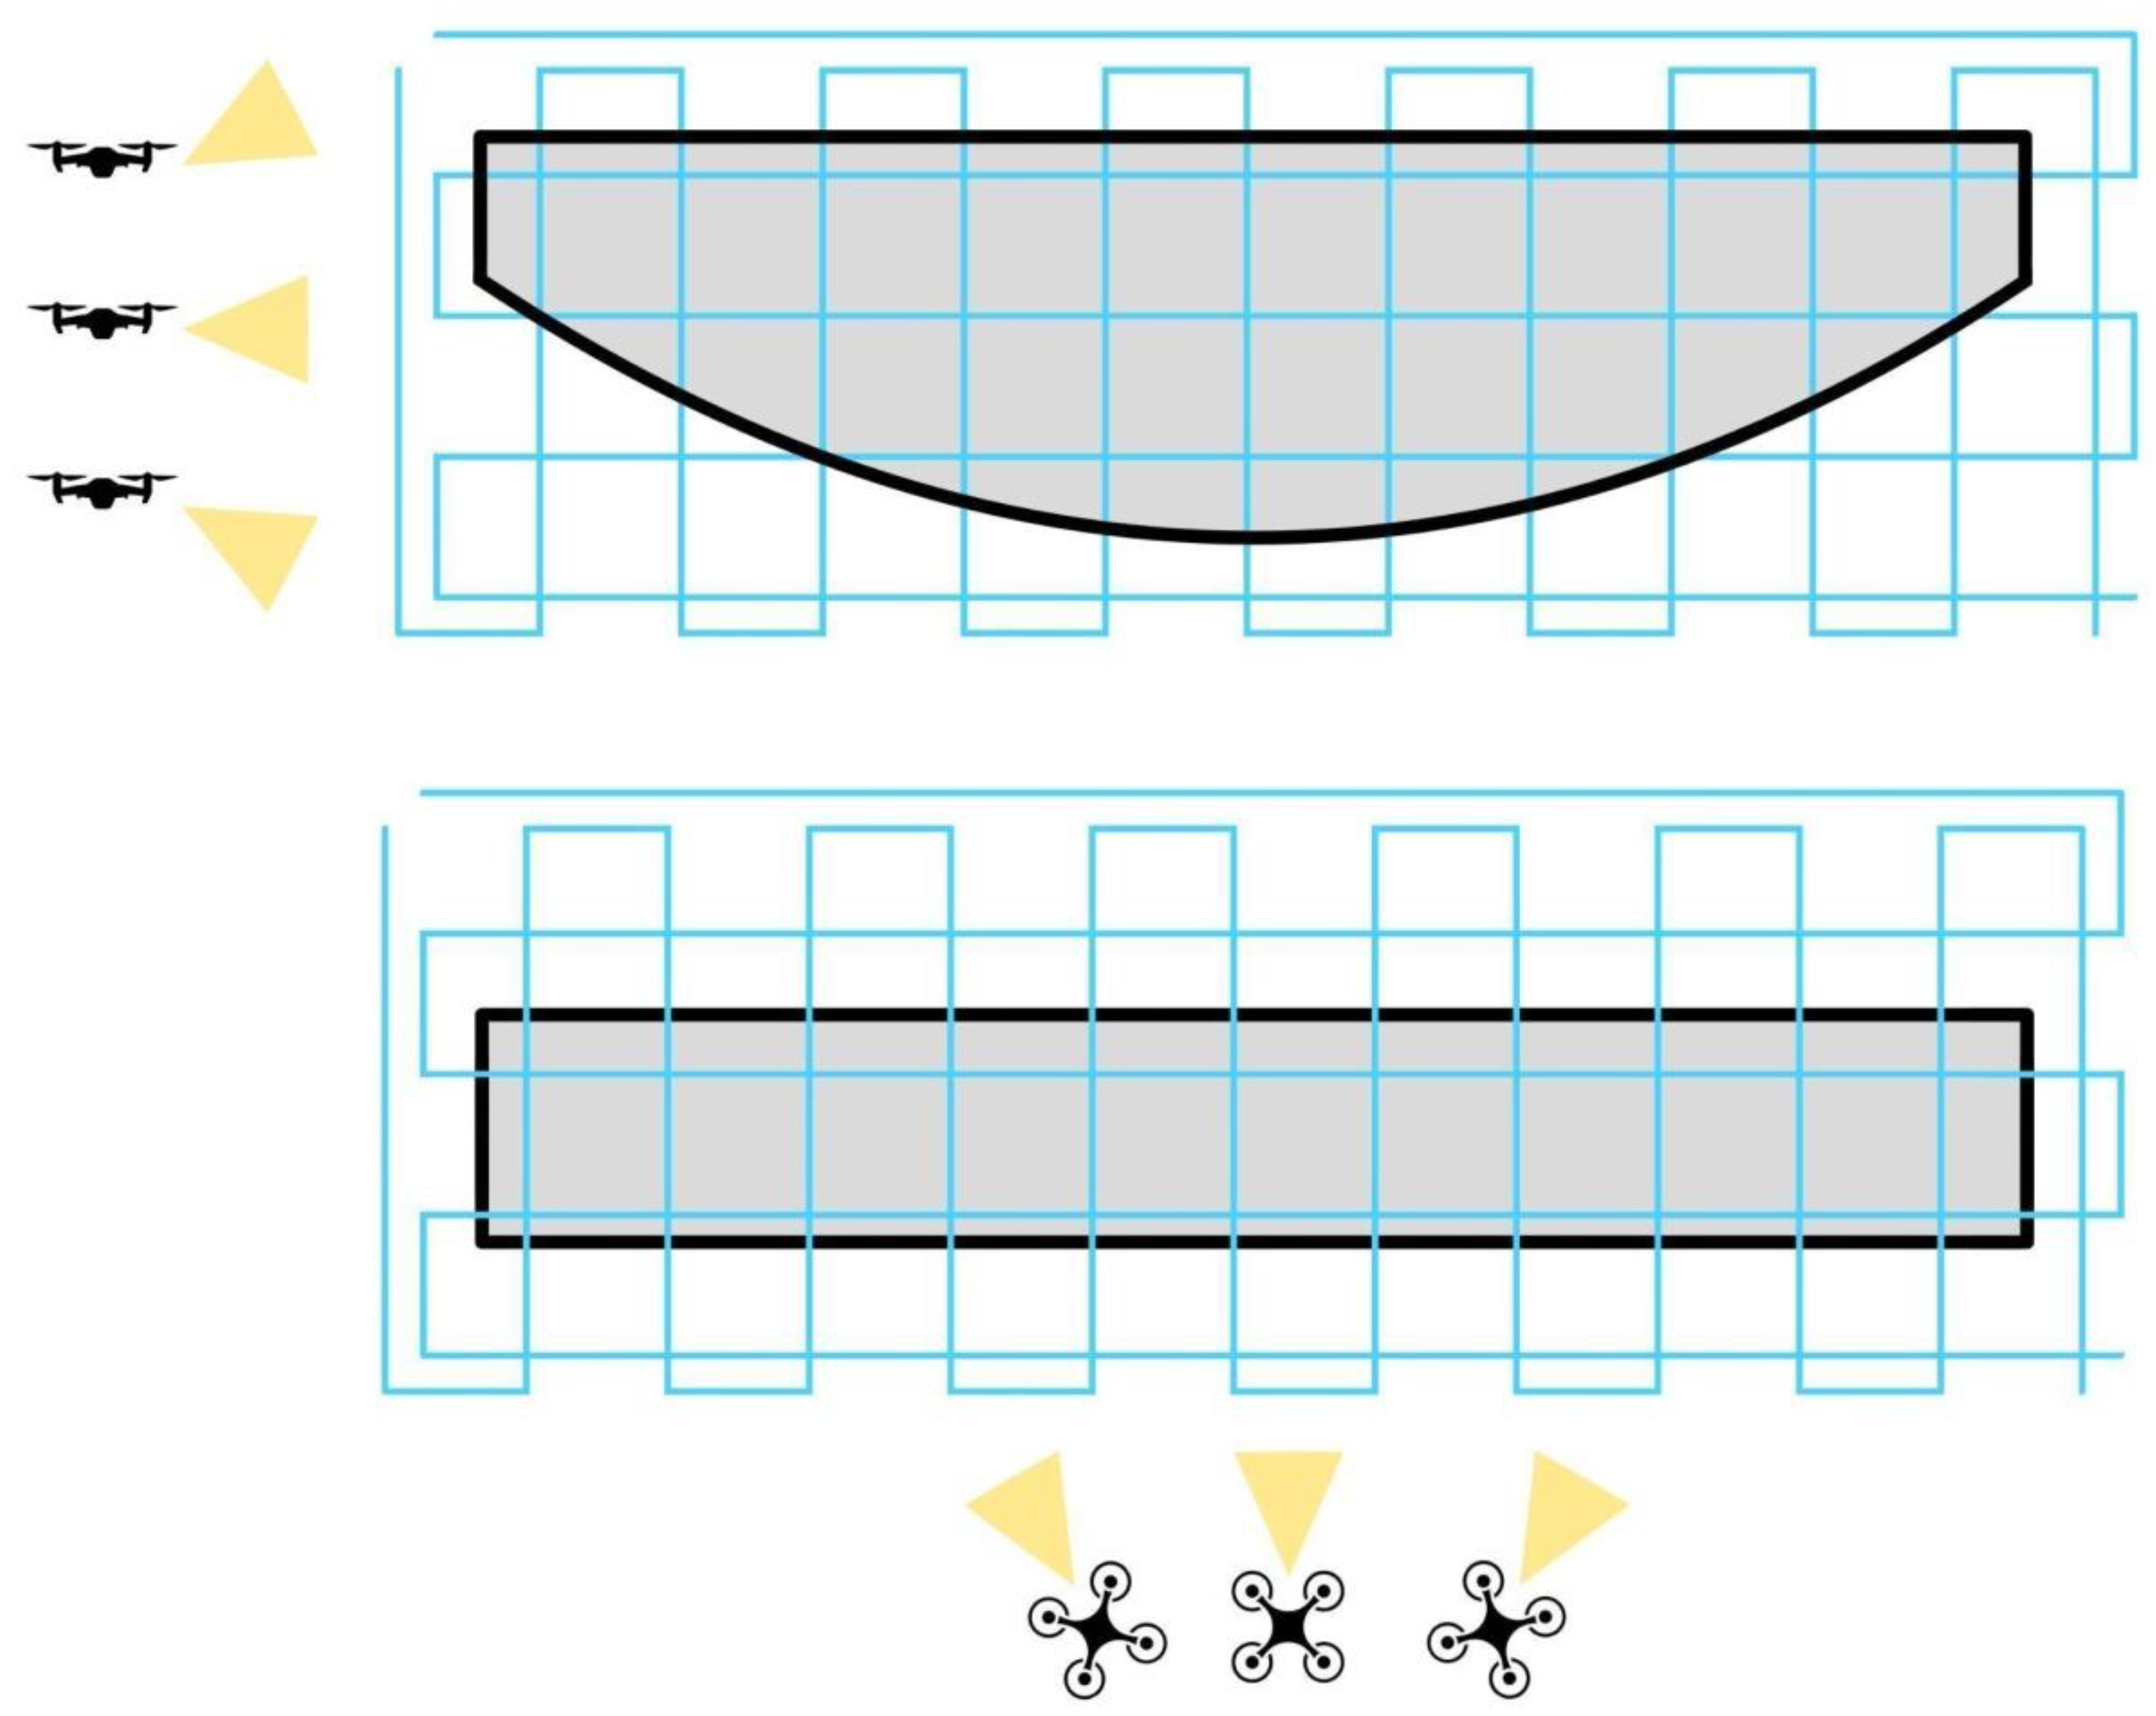
Figure 13.
Workflow of the photogrammetric documentation process, from preliminary analysis to final validation and heritage assessment.
Figure 13.
Workflow of the photogrammetric documentation process, from preliminary analysis to final validation and heritage assessment.
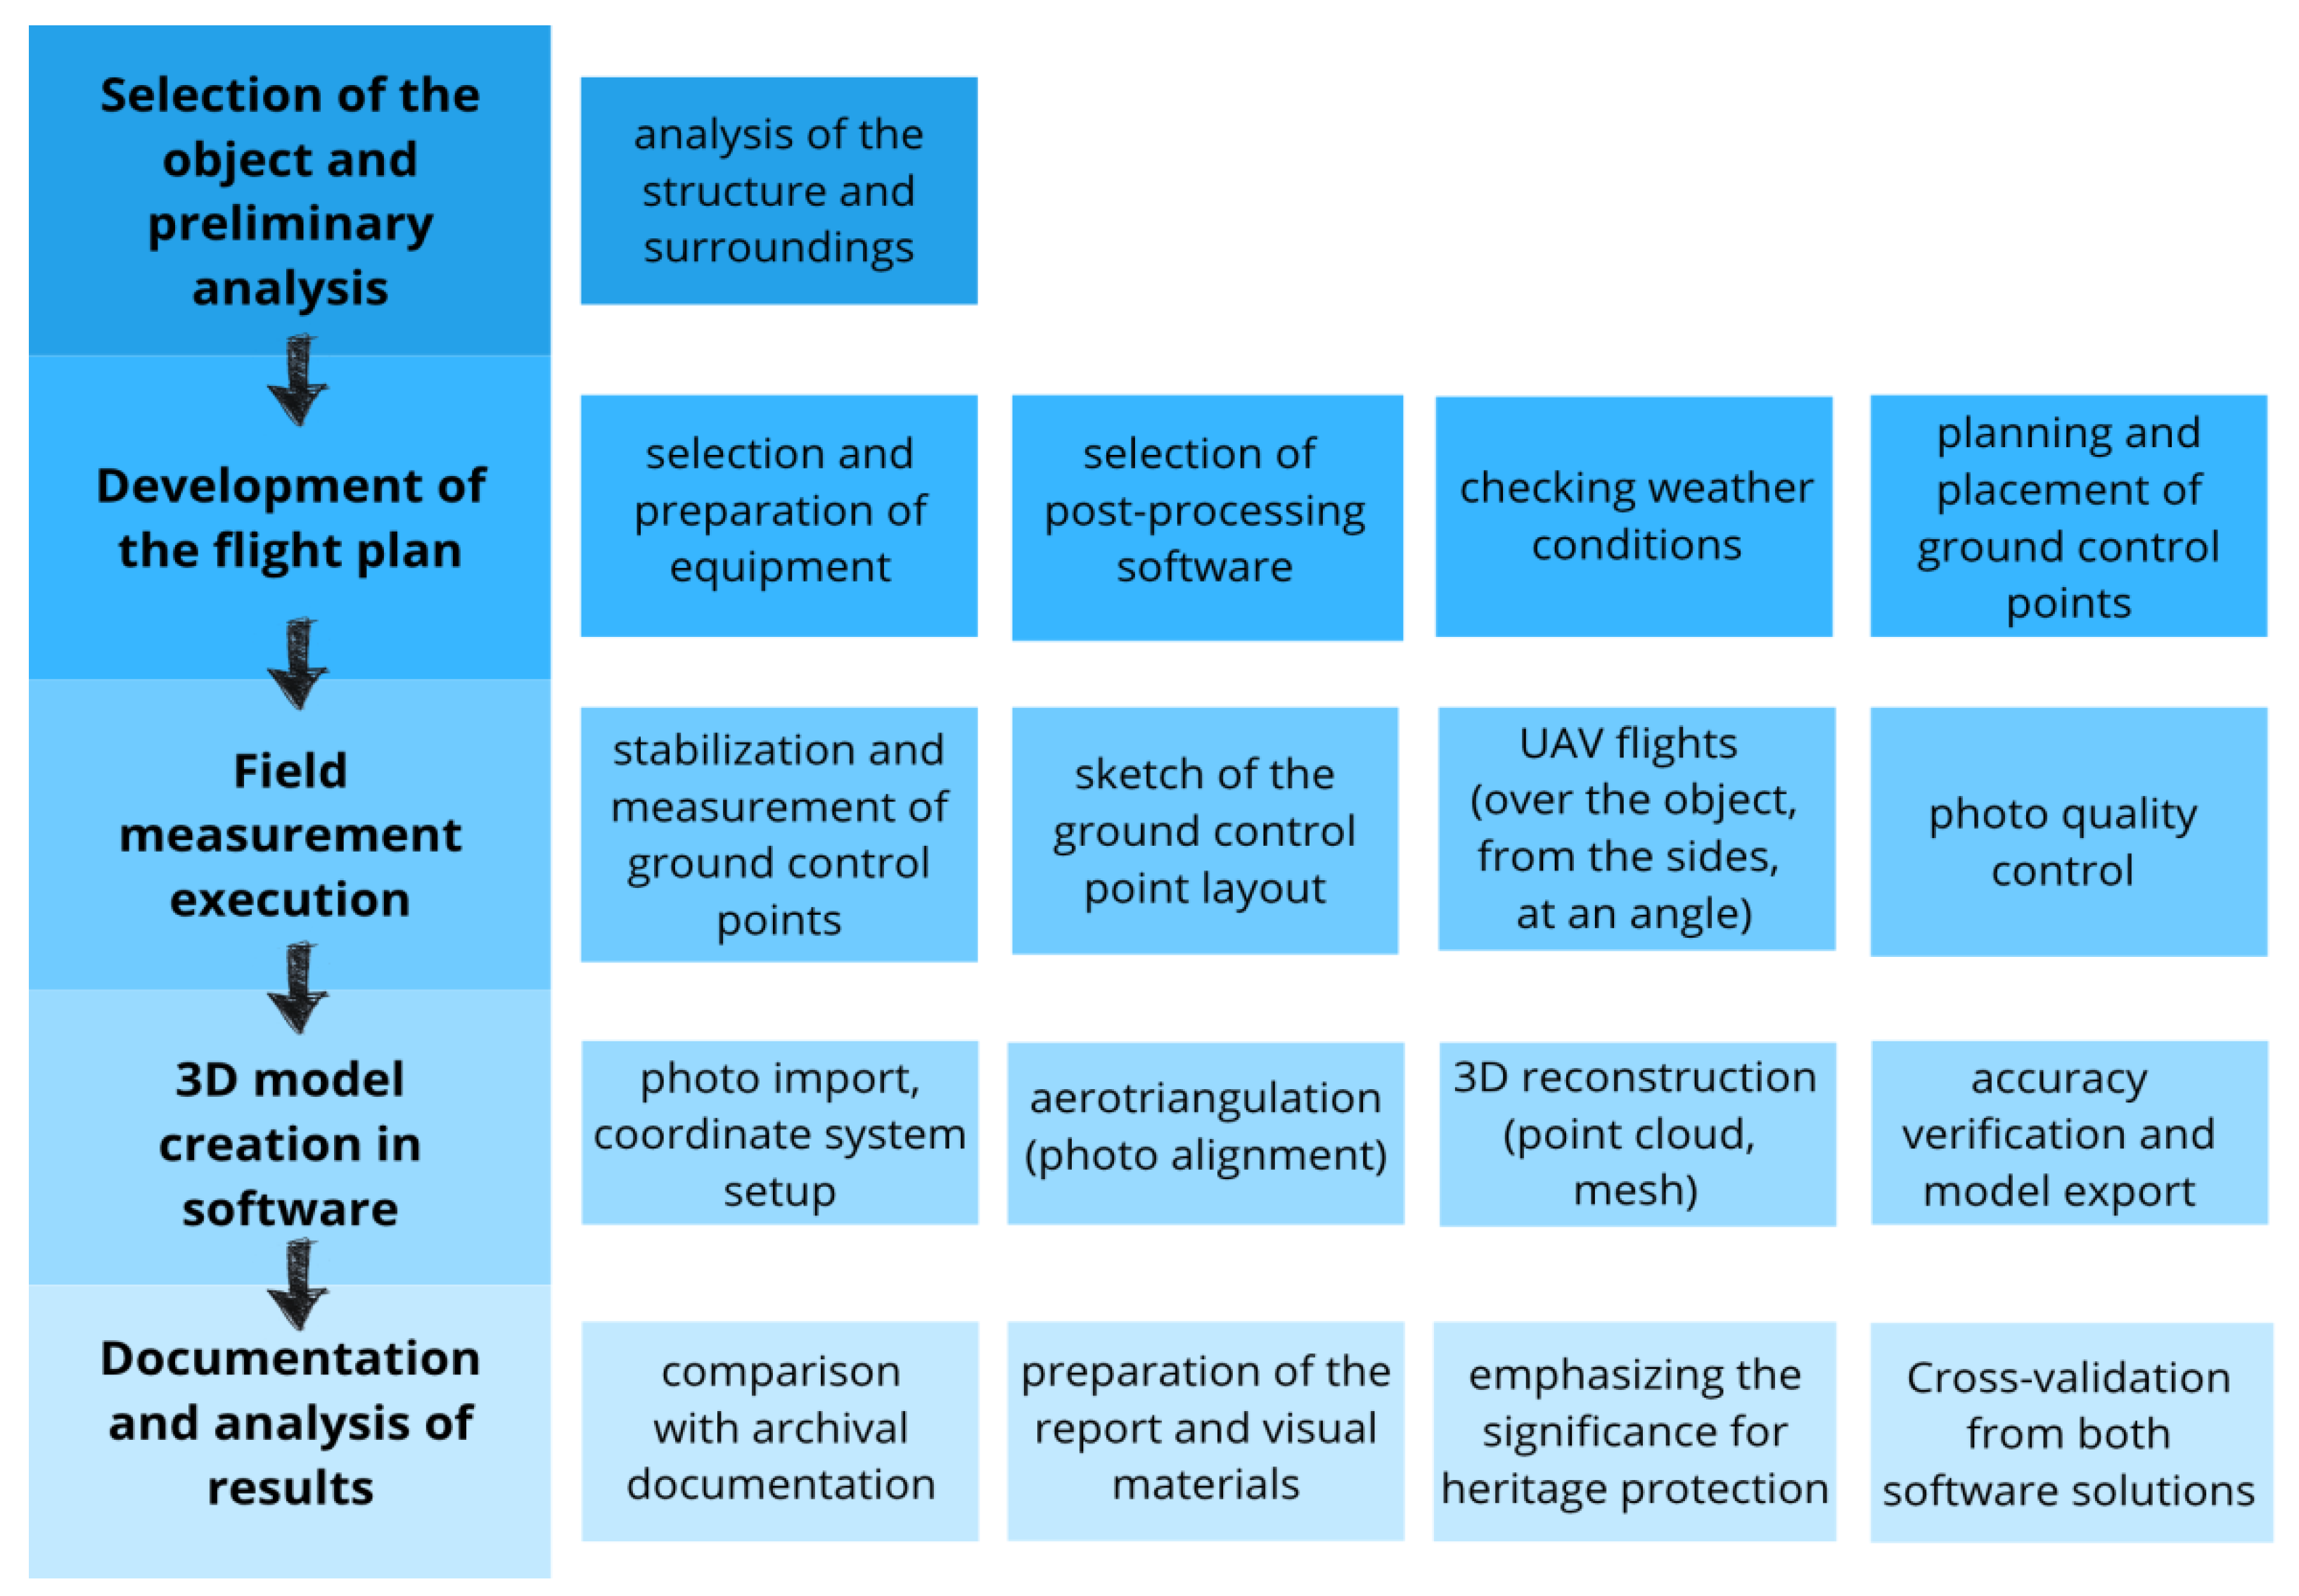
Figure 14.
Side view of the Niestepowo bridge, Bentley 3D model.
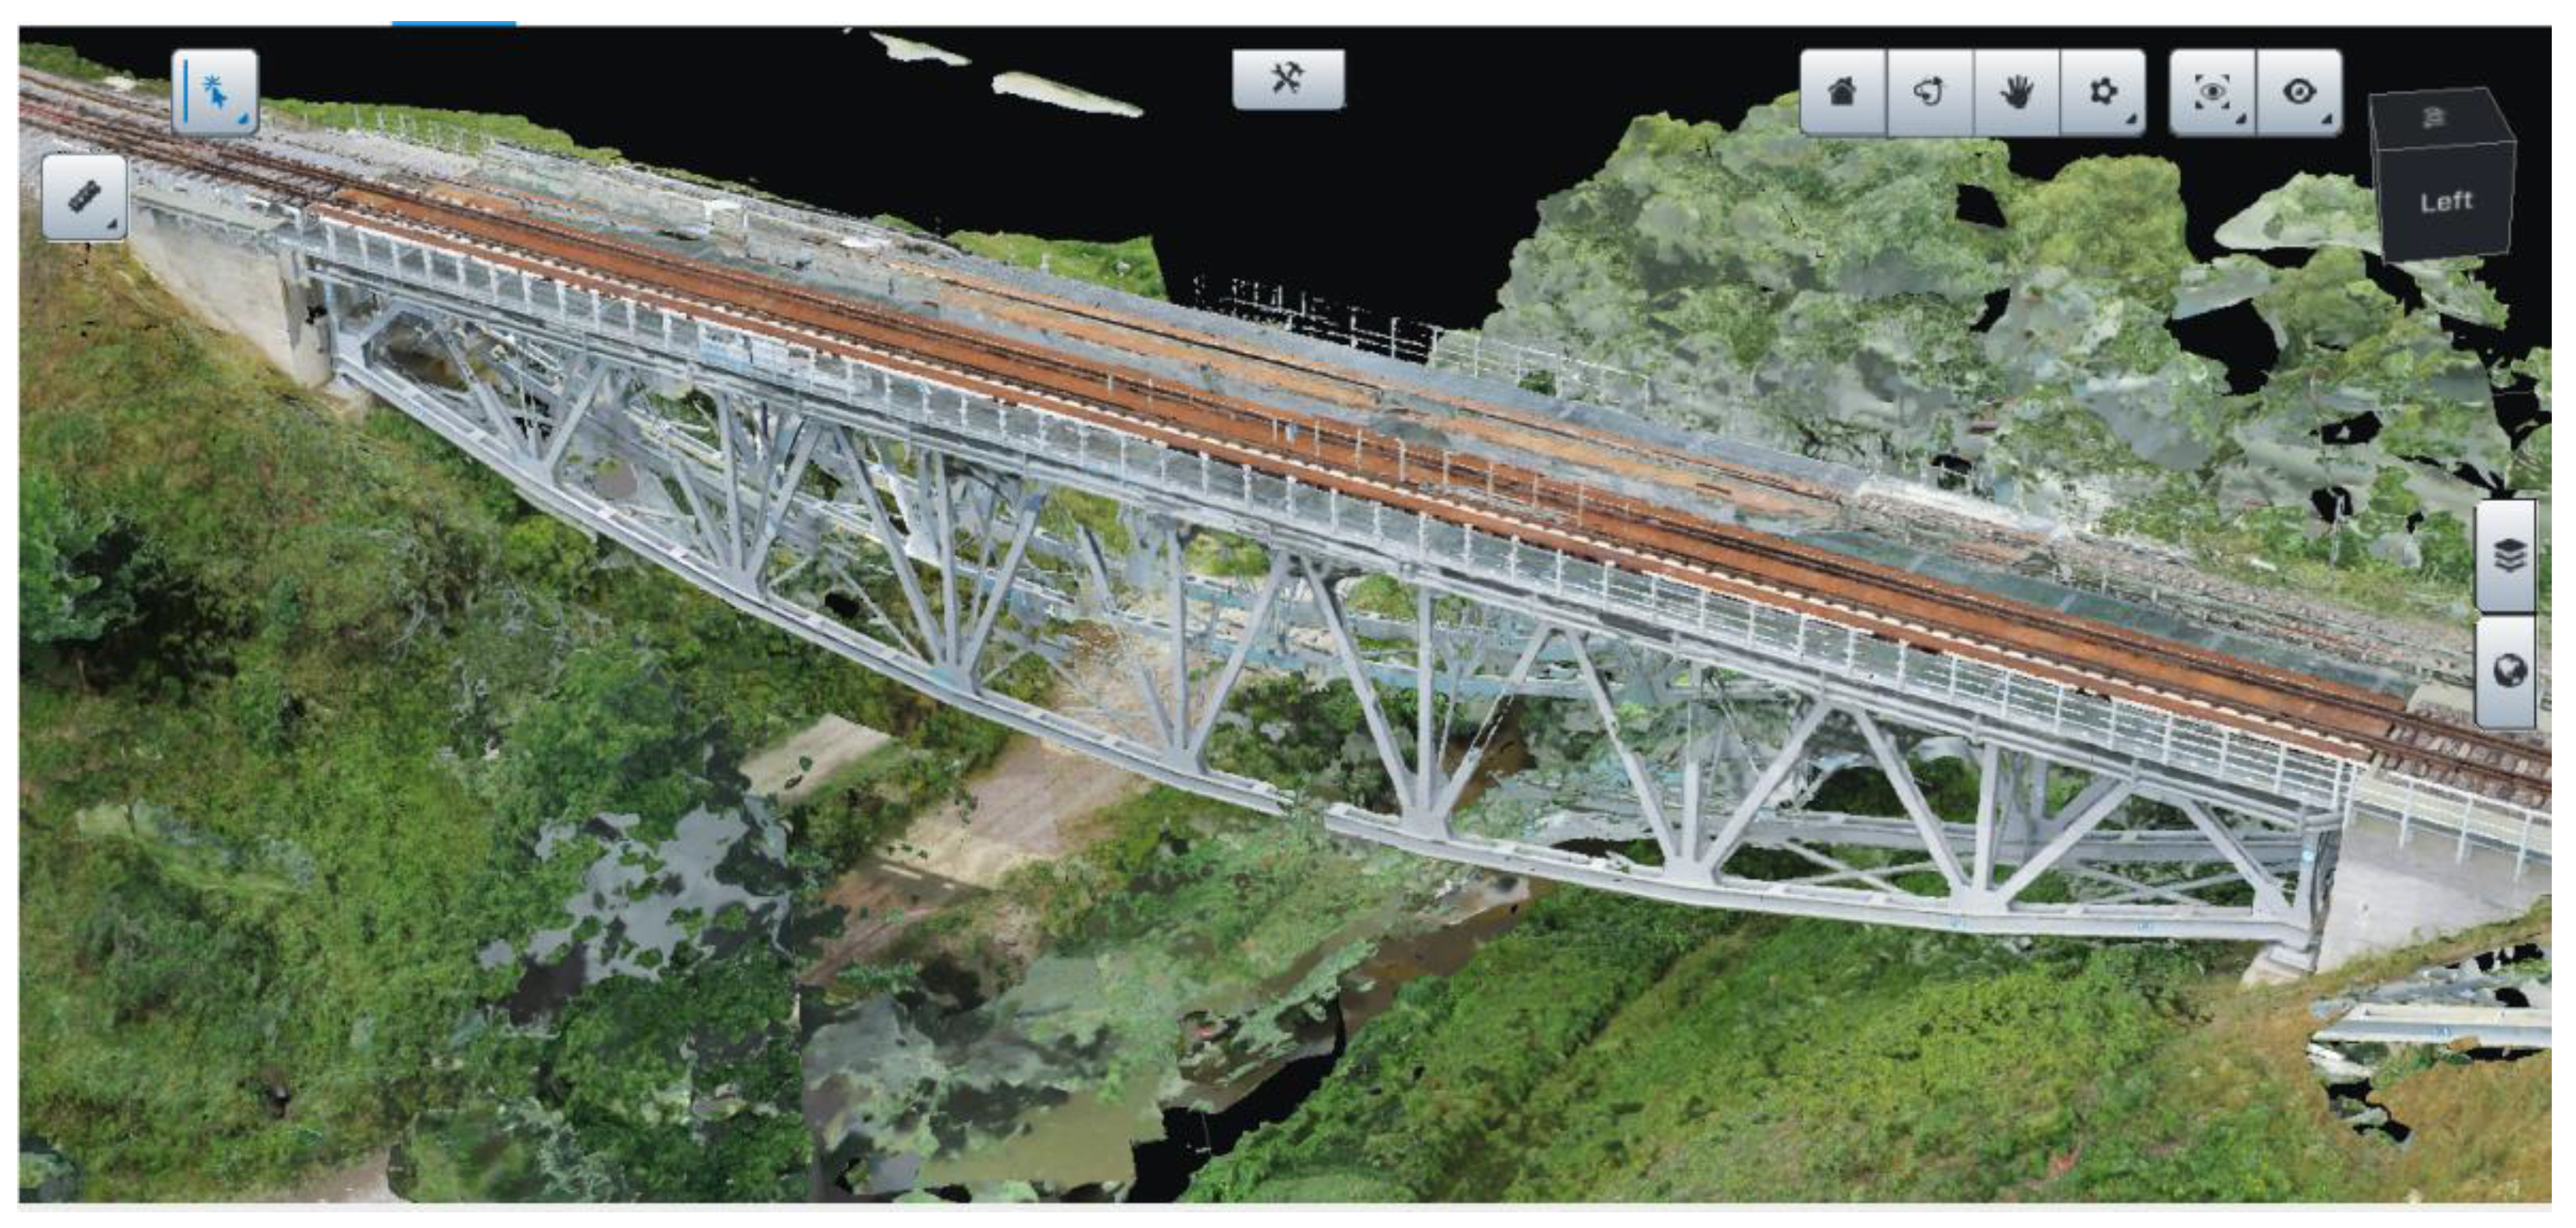
Figure 15.
Detail view of the railway structure, Bentley 3D model: (a) on the bridge; (b) at the approaches to the bridge.
Figure 15.
Detail view of the railway structure, Bentley 3D model: (a) on the bridge; (b) at the approaches to the bridge.
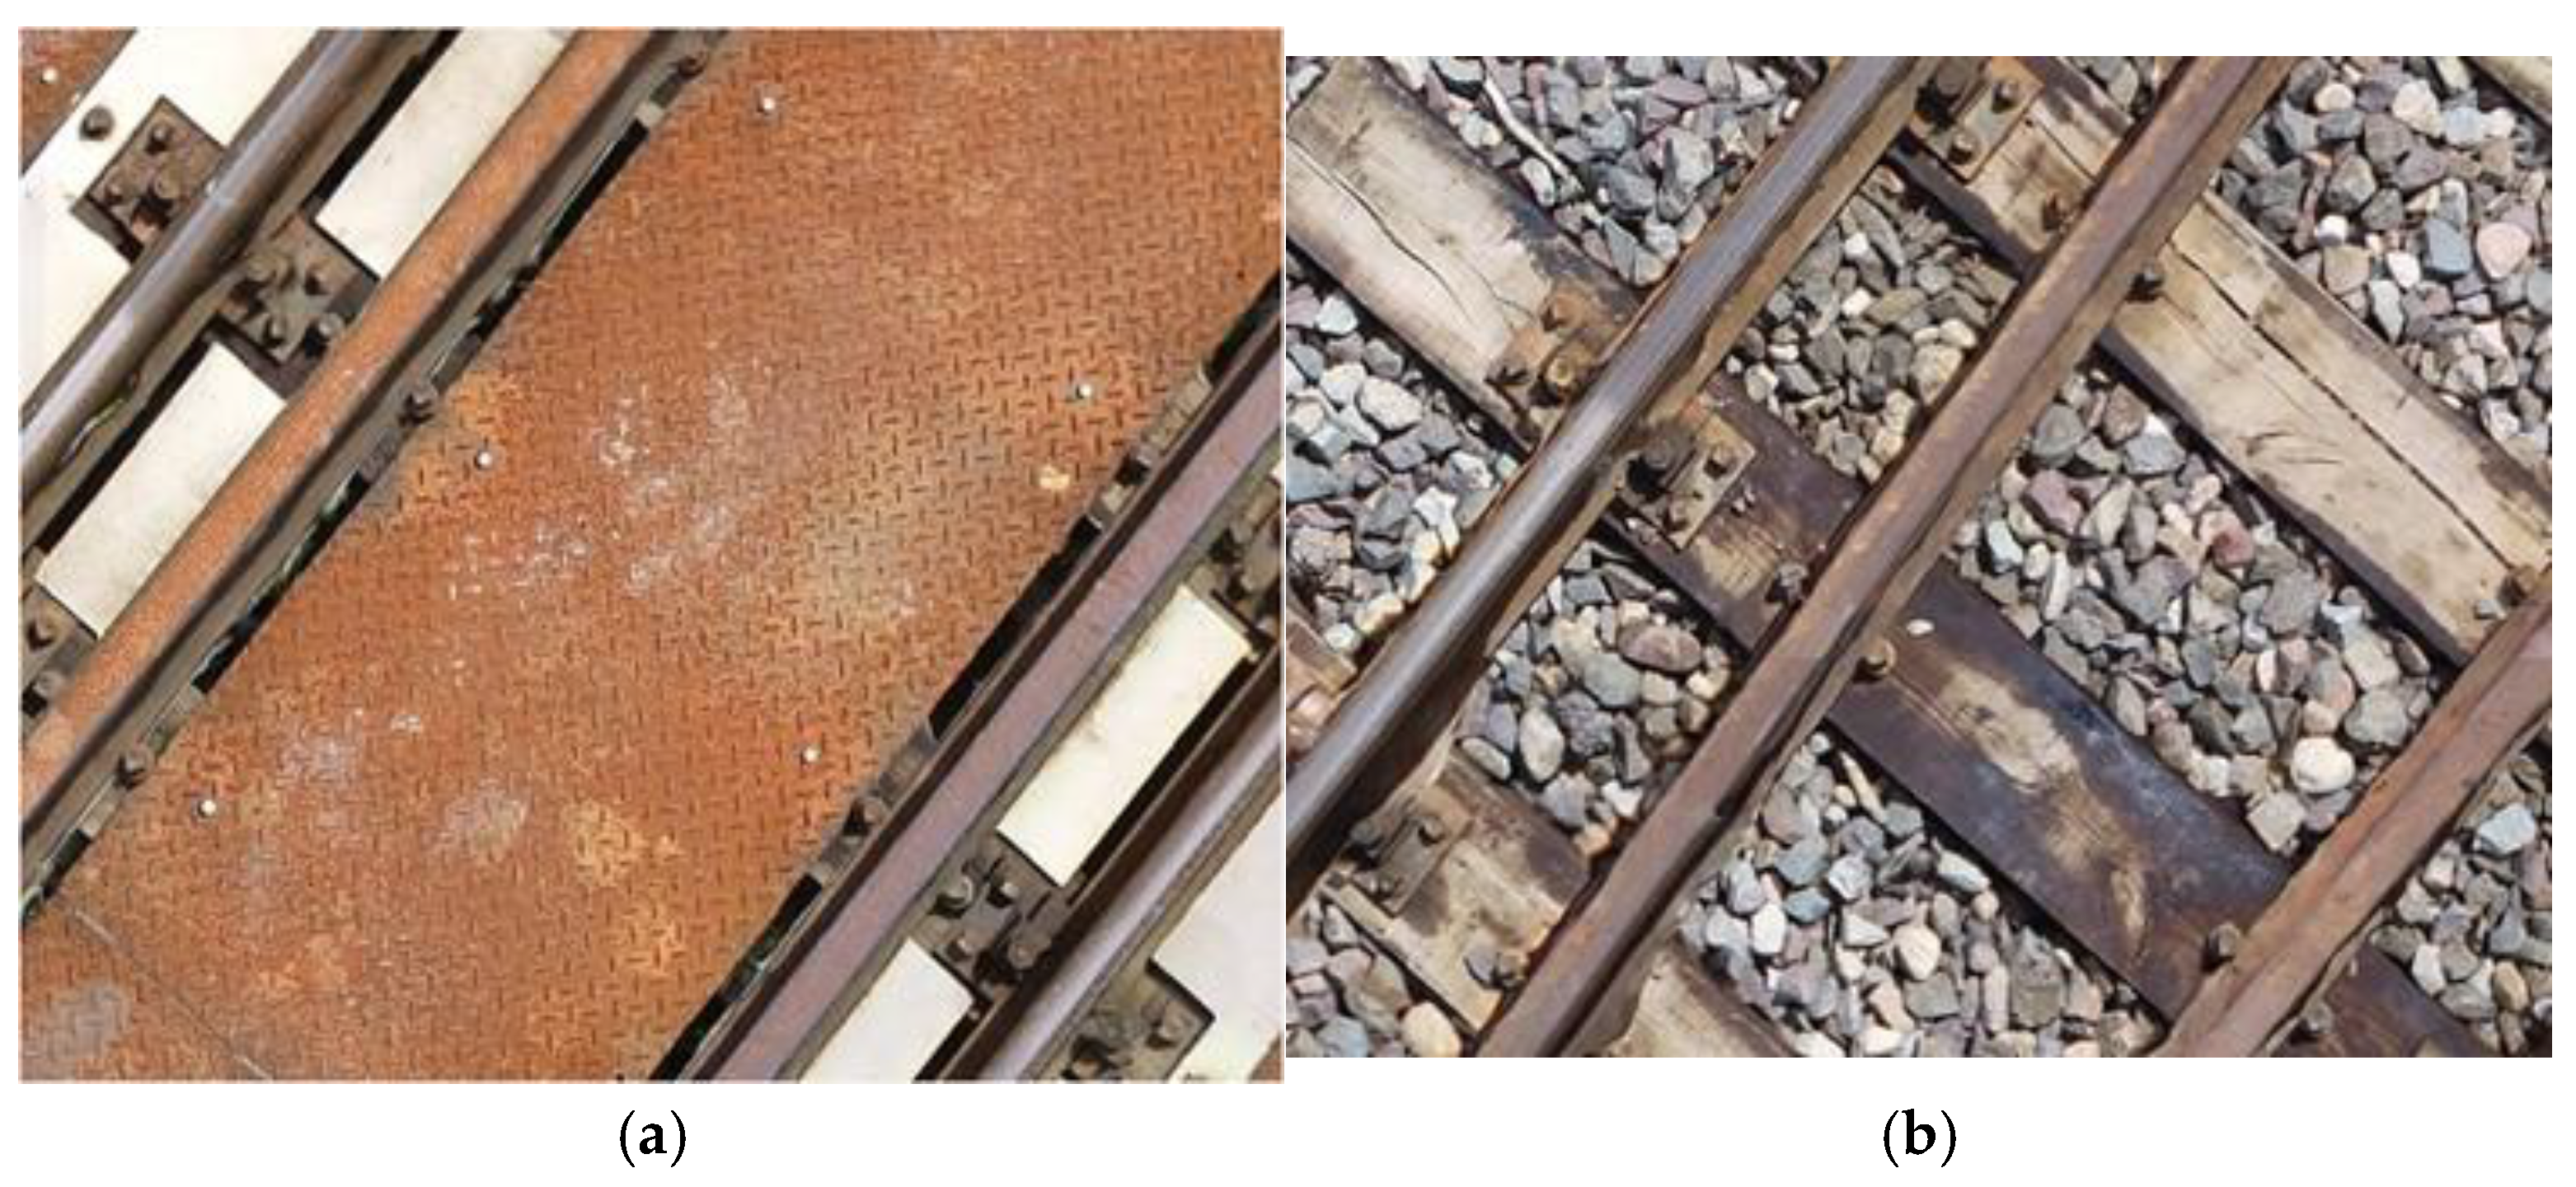
Figure 16.
Detail view on the truss joint of the Niestepowo Bridge, Bentley 3D model.
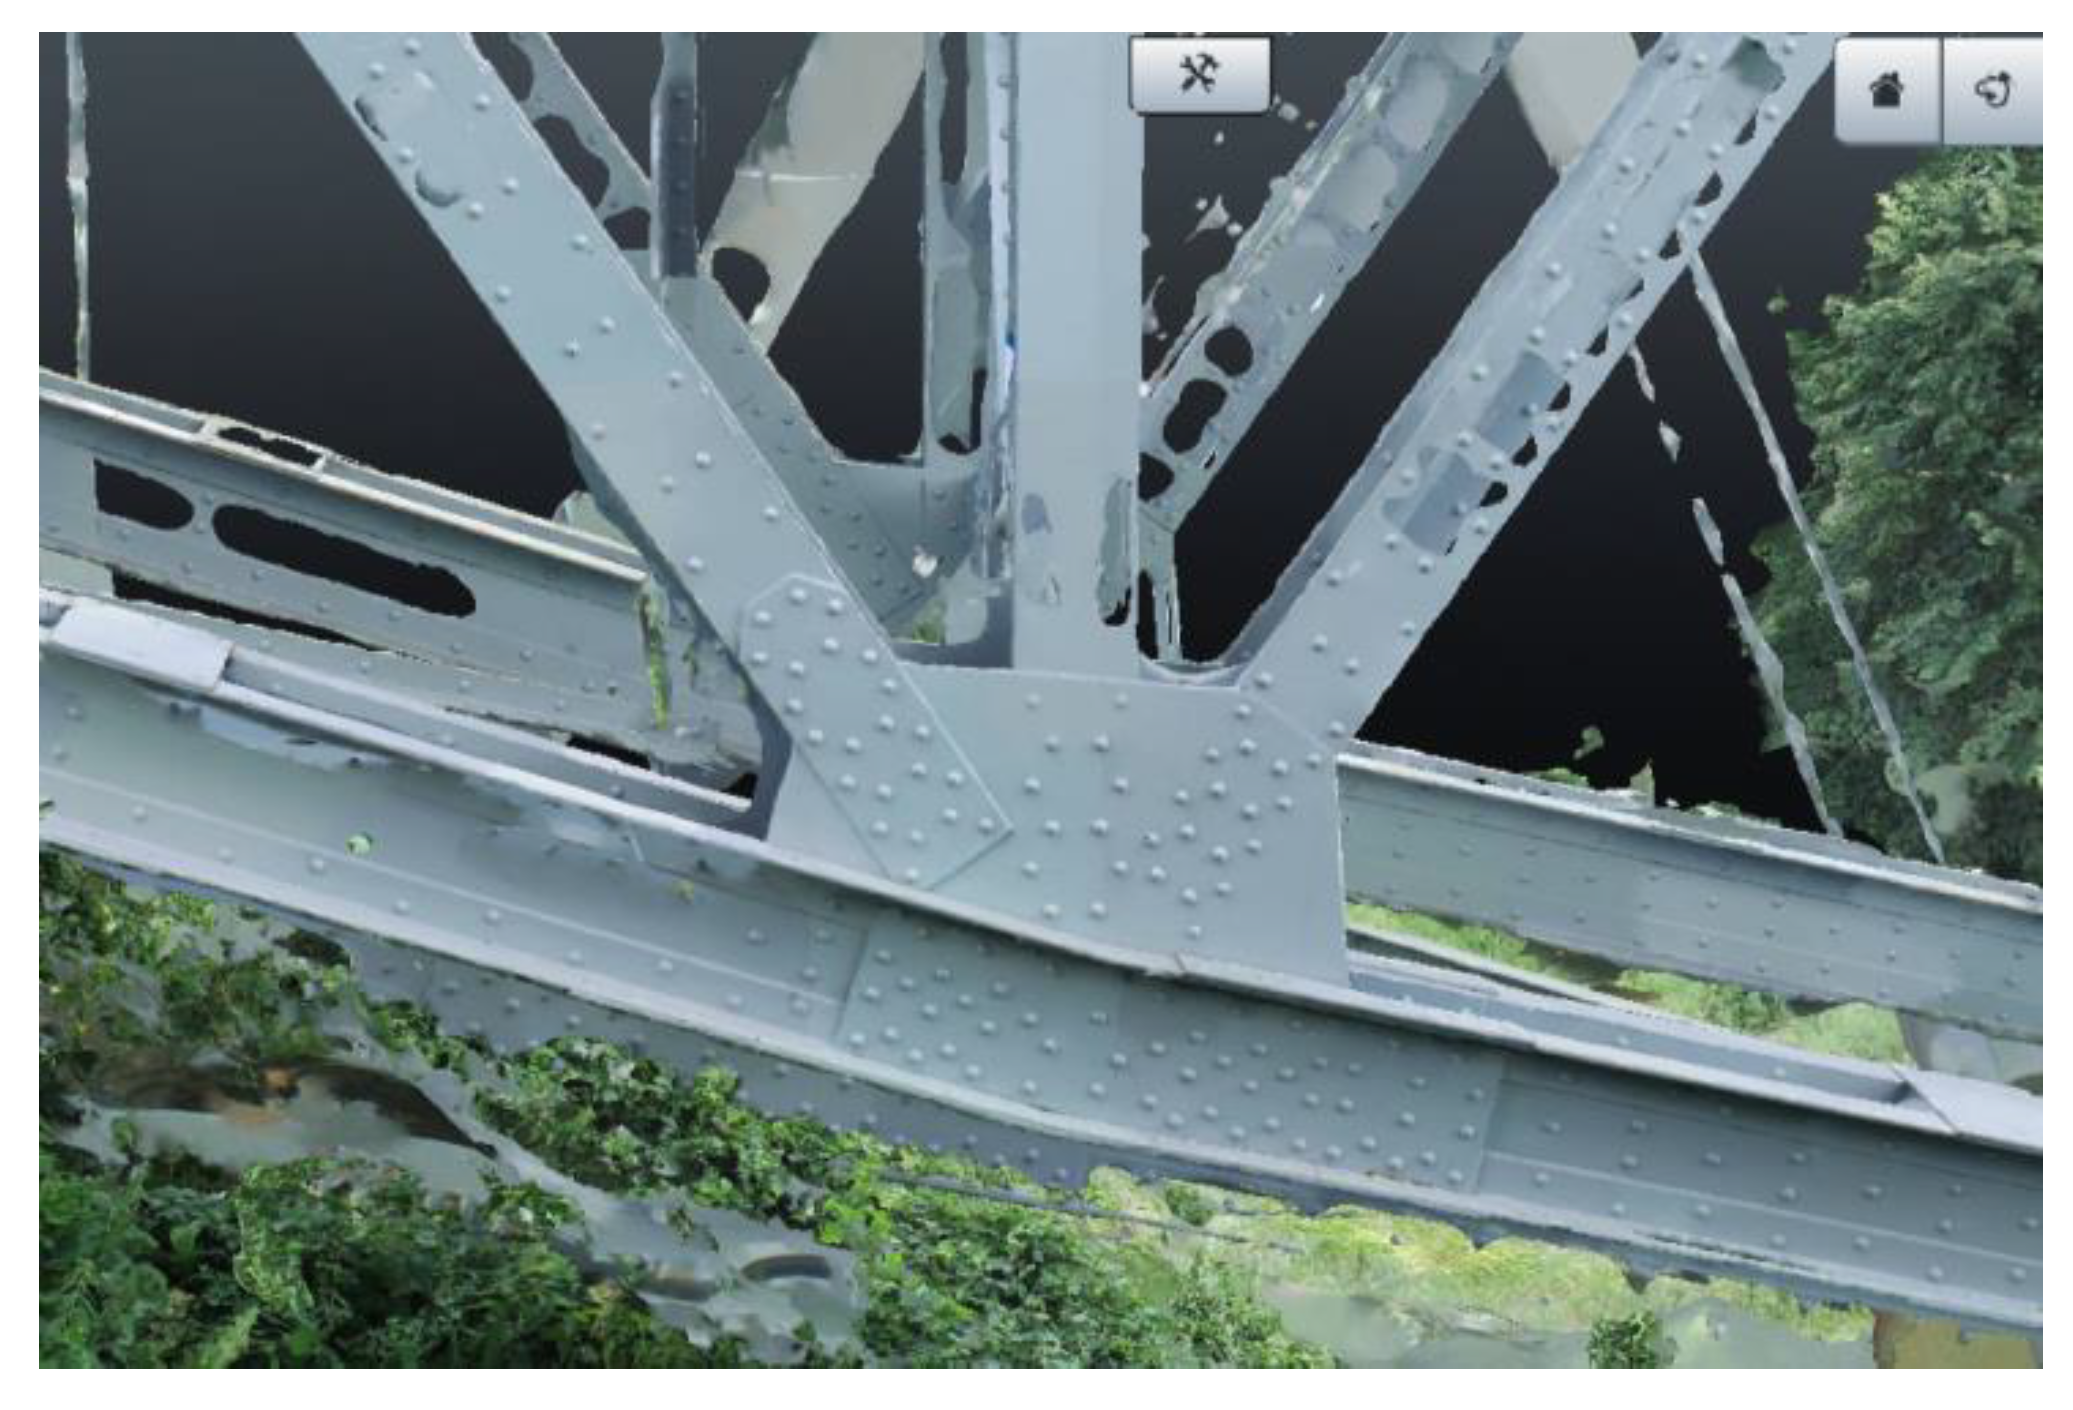
Figure 17.
Bentley 3D model measurement of the bridge span.
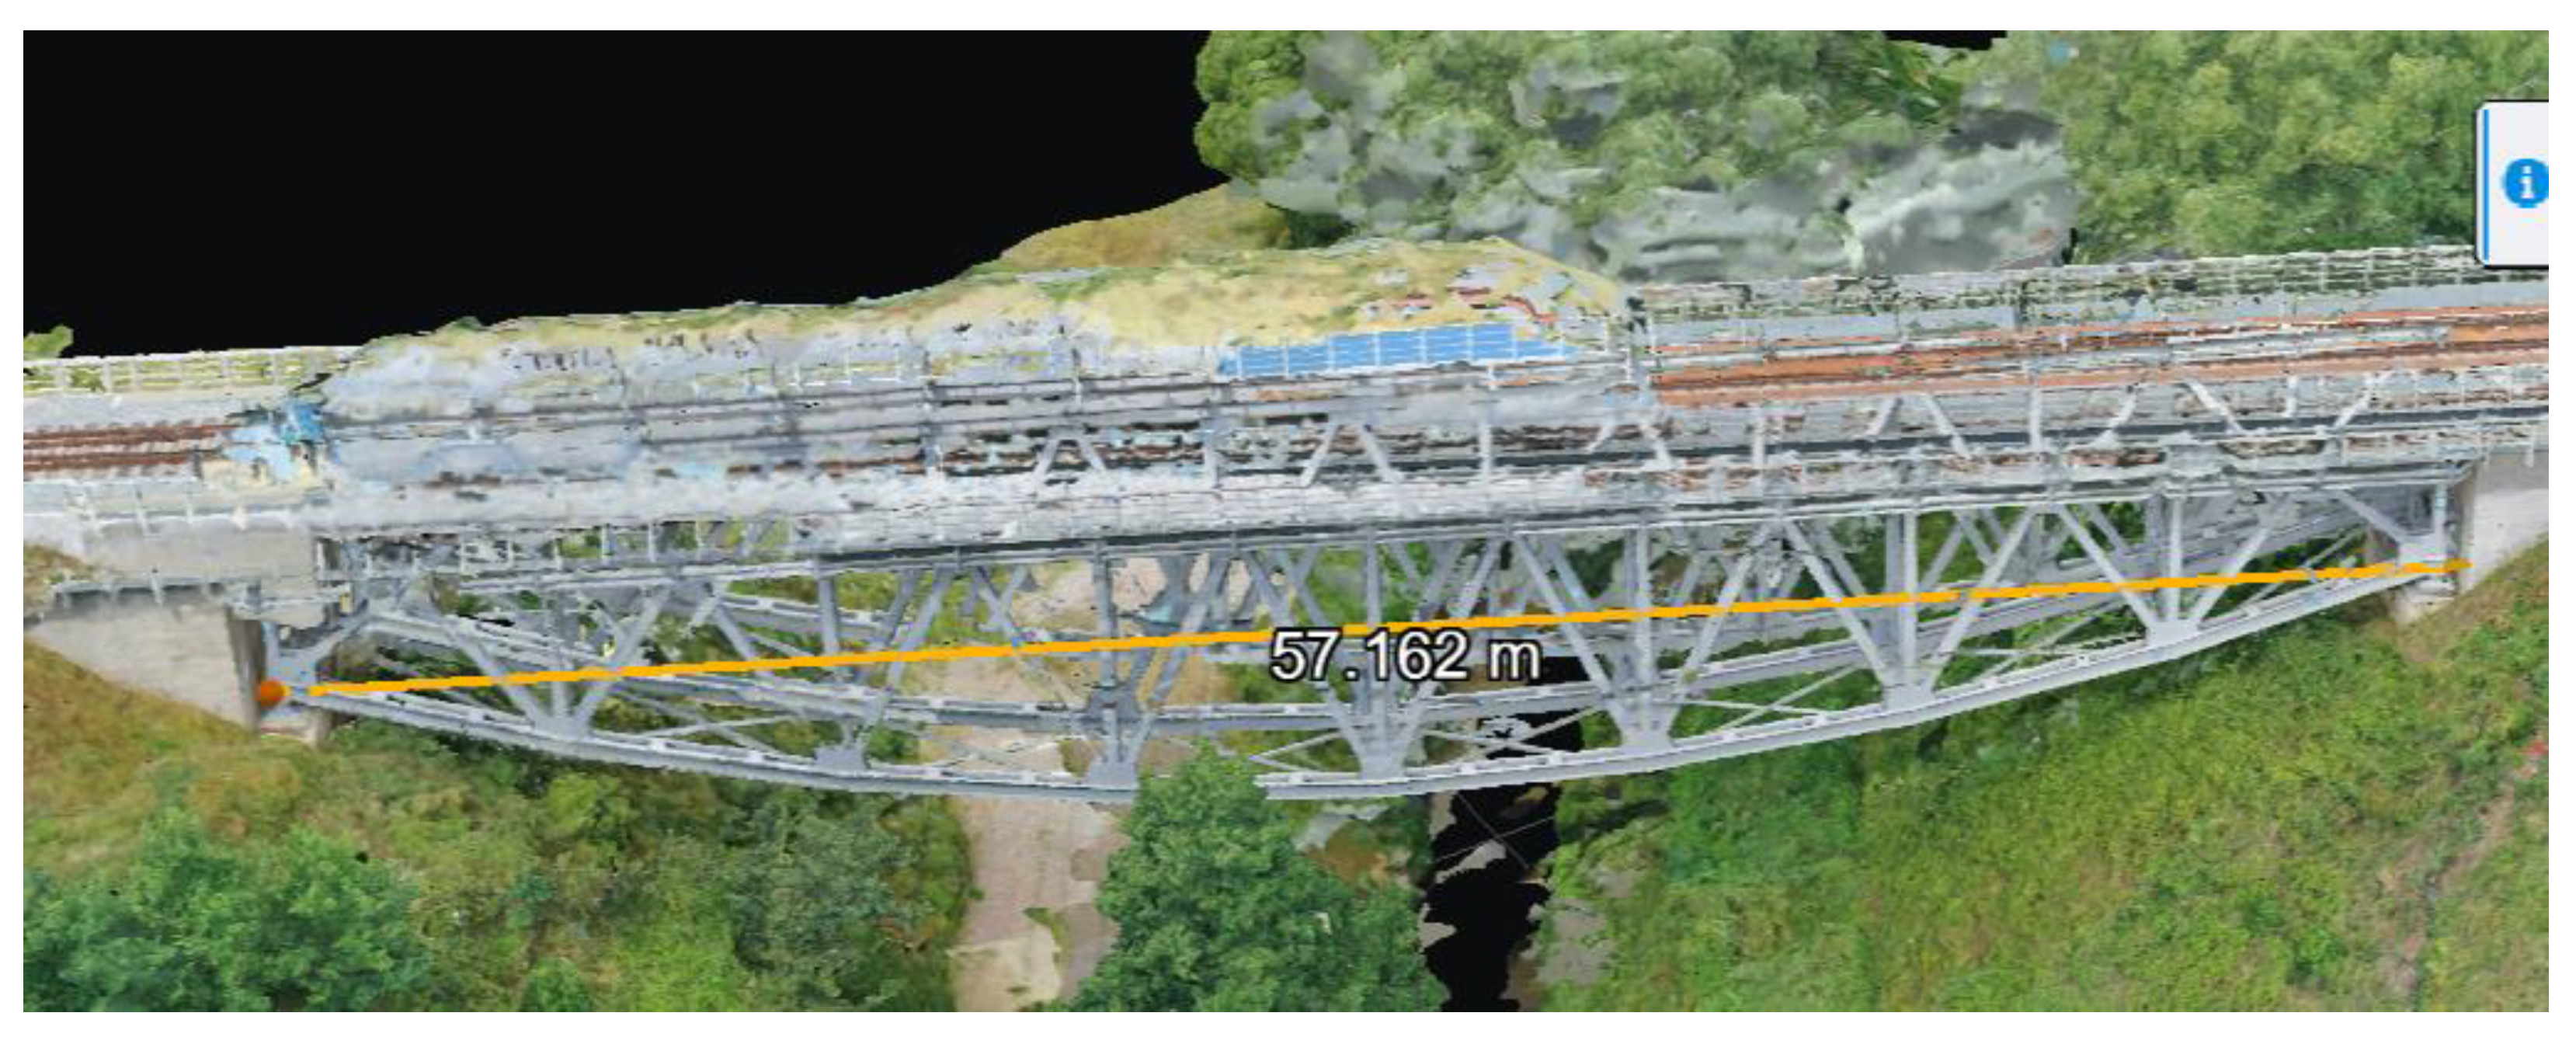
Figure 18.
Bentley 3D model measurement of the crossbeams spacing.
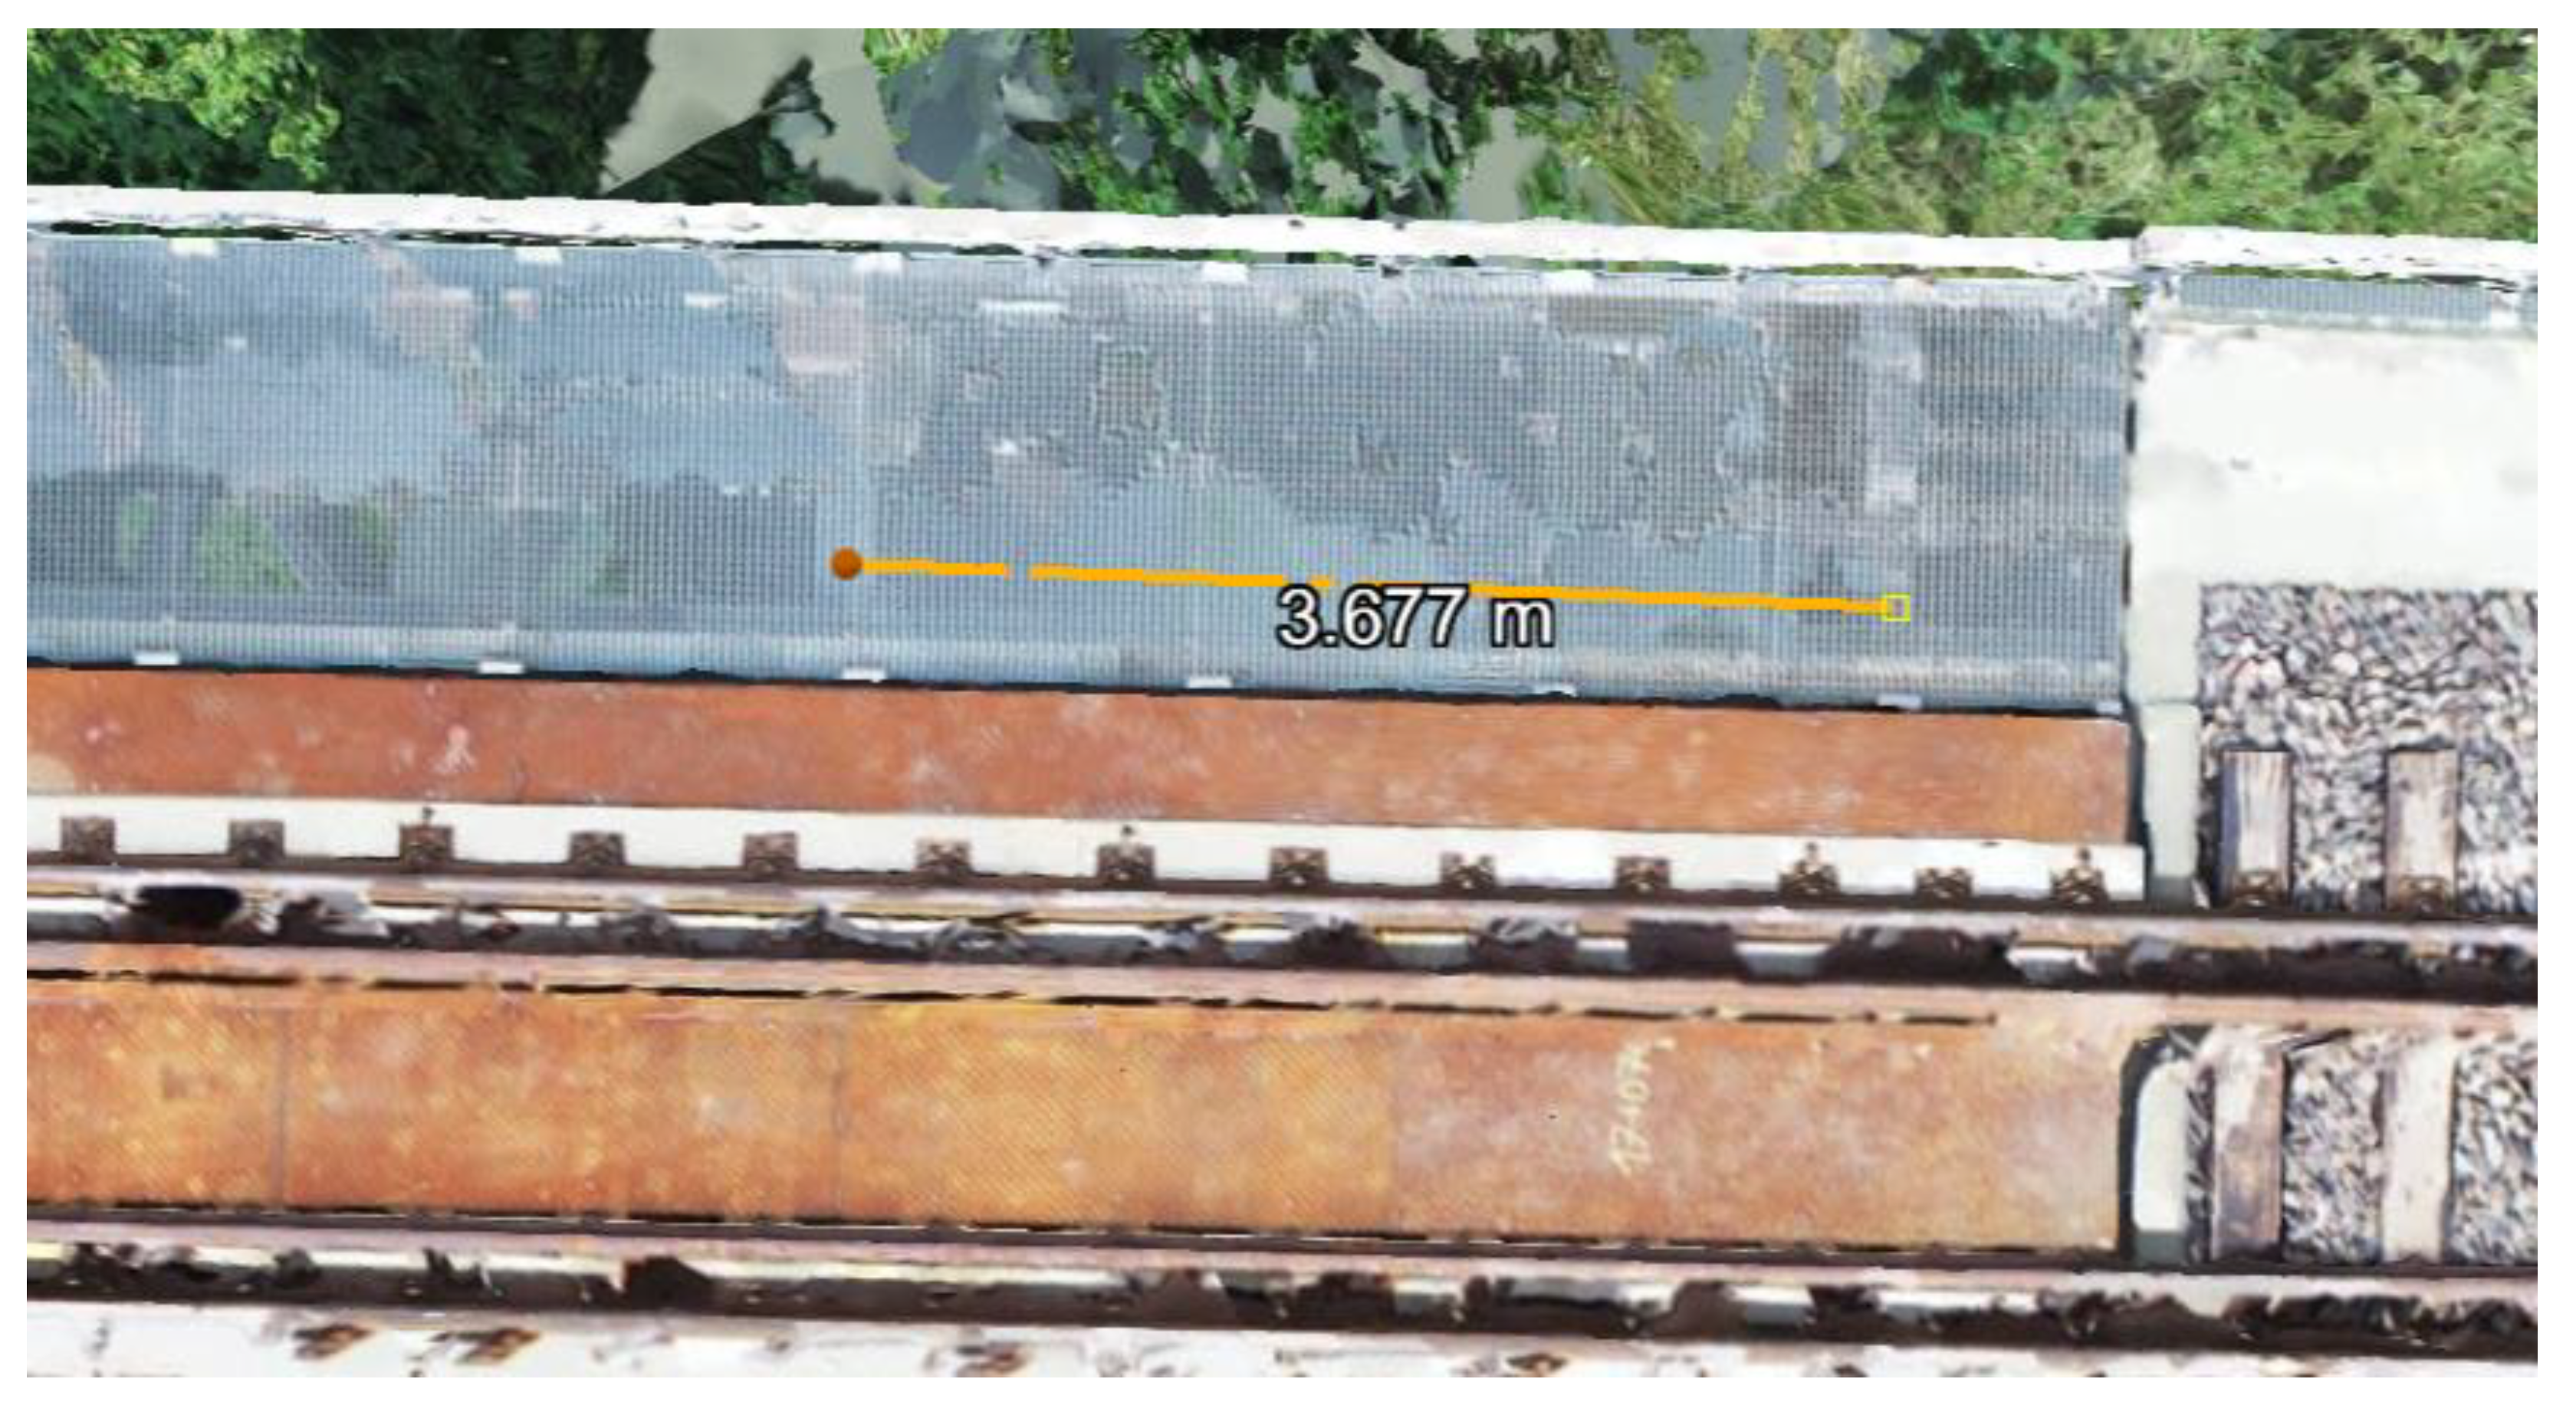
Figure 19.
Side view of the Niestepowo bridge, Agisoft 3D model.
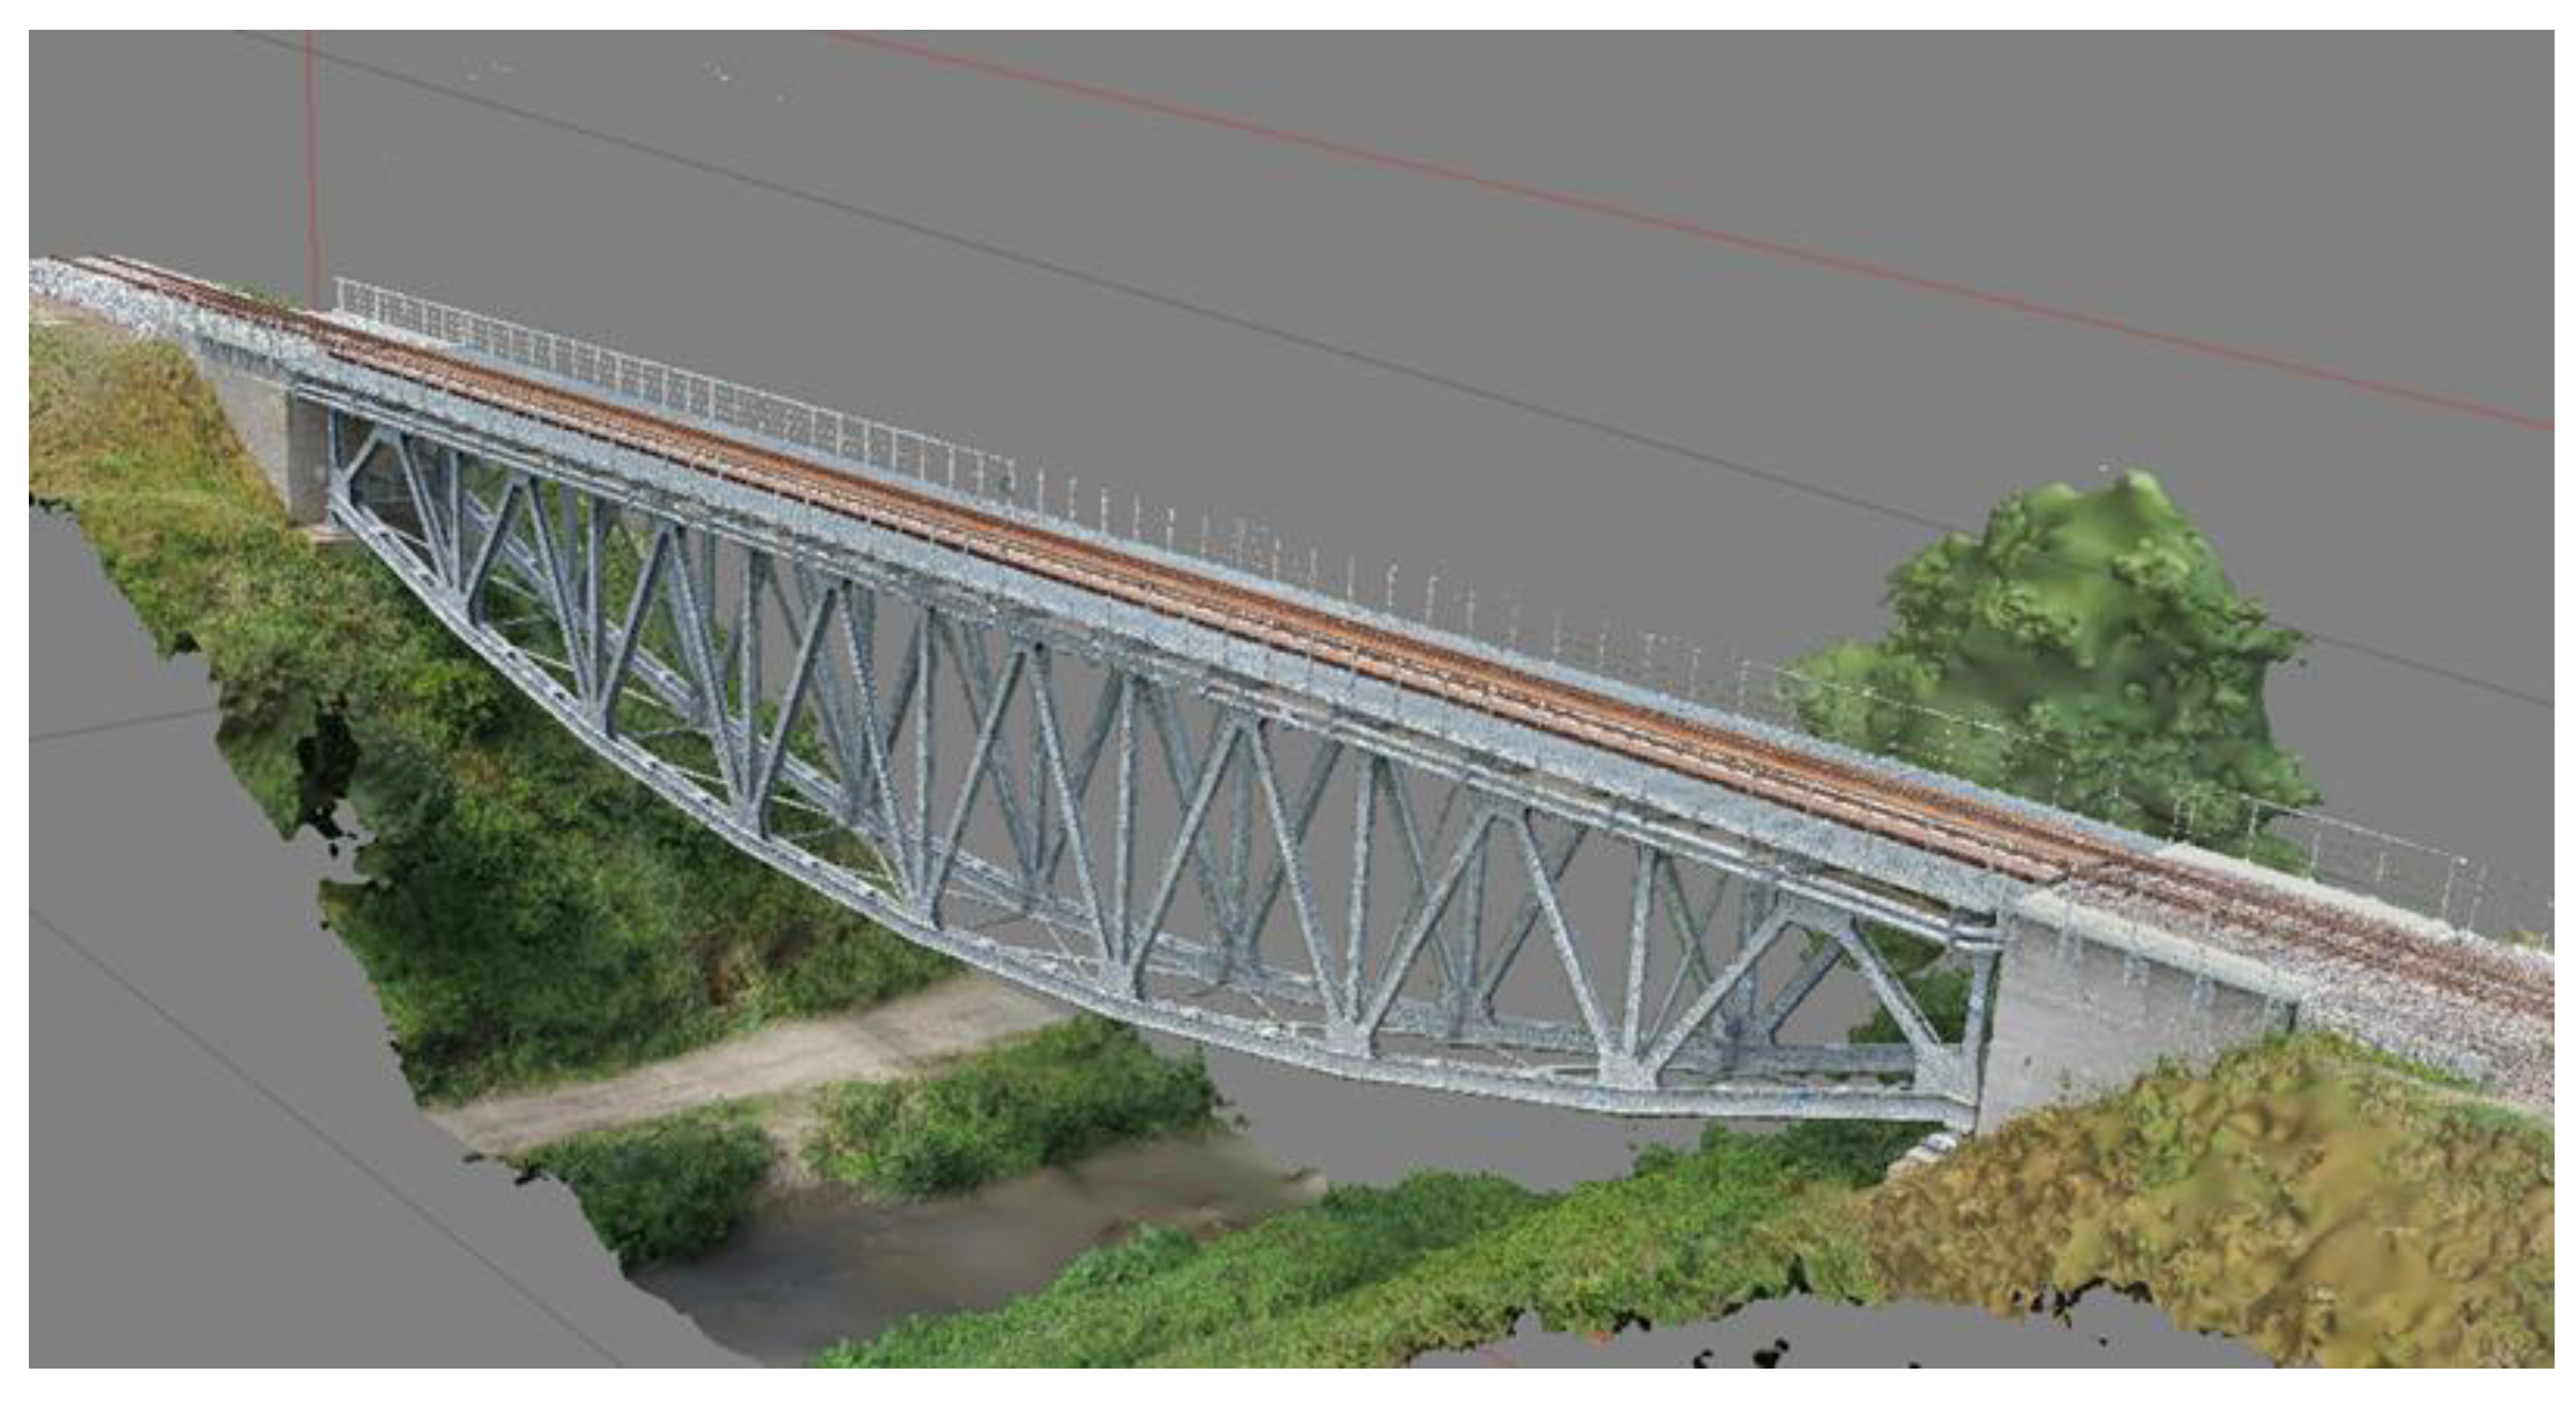
Figure 20.
Detail view of the railway structure Agisoft 3D model: (a) on the bridge; (b) at the approaches to the bridge..
Figure 20.
Detail view of the railway structure Agisoft 3D model: (a) on the bridge; (b) at the approaches to the bridge..
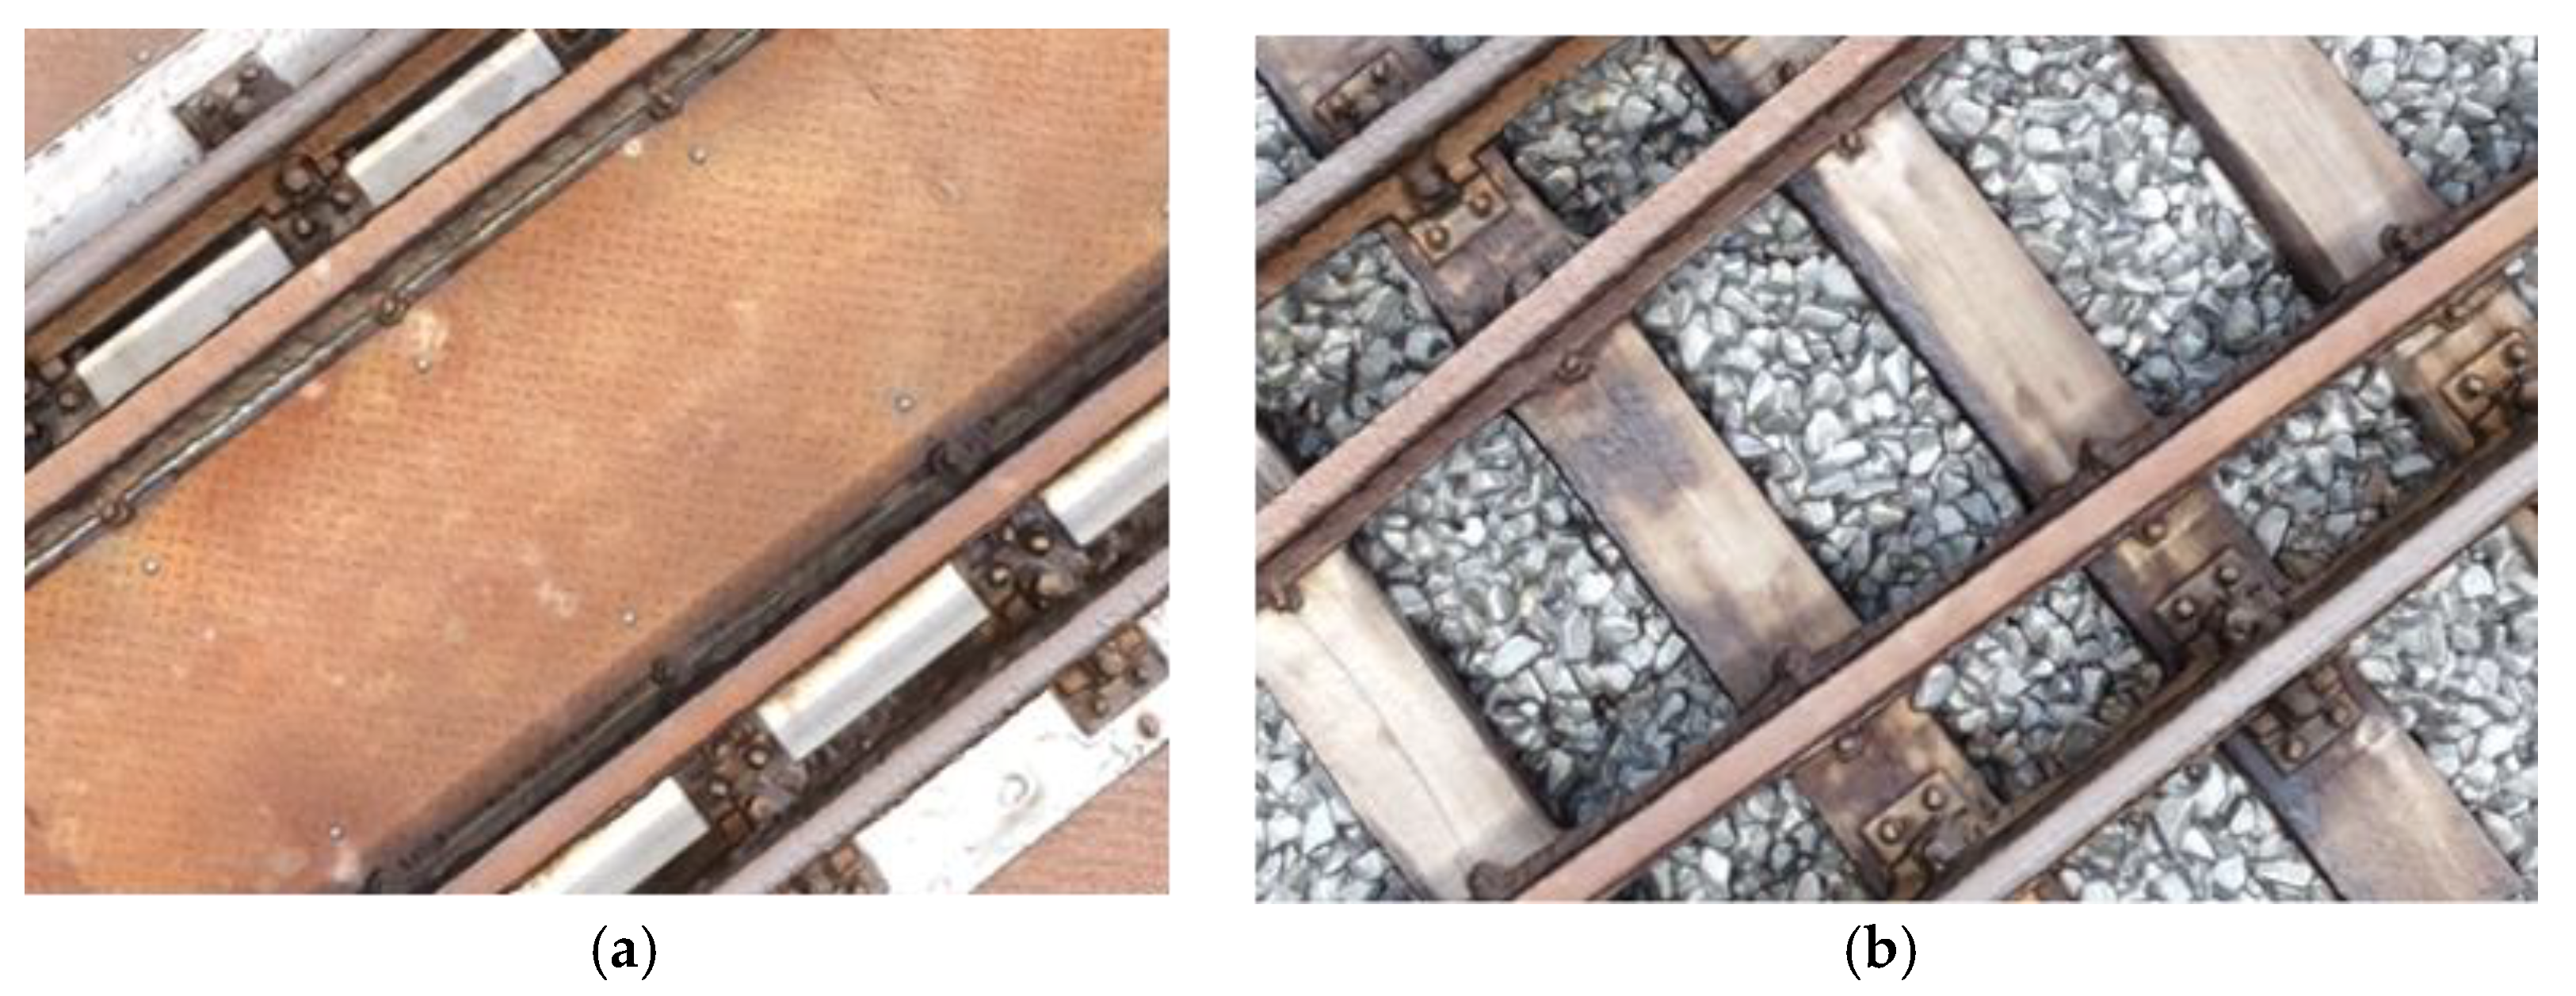
Figure 21.
Detail view on the truss joint of the Niestepowo Bridge, Agisoft 3D model.
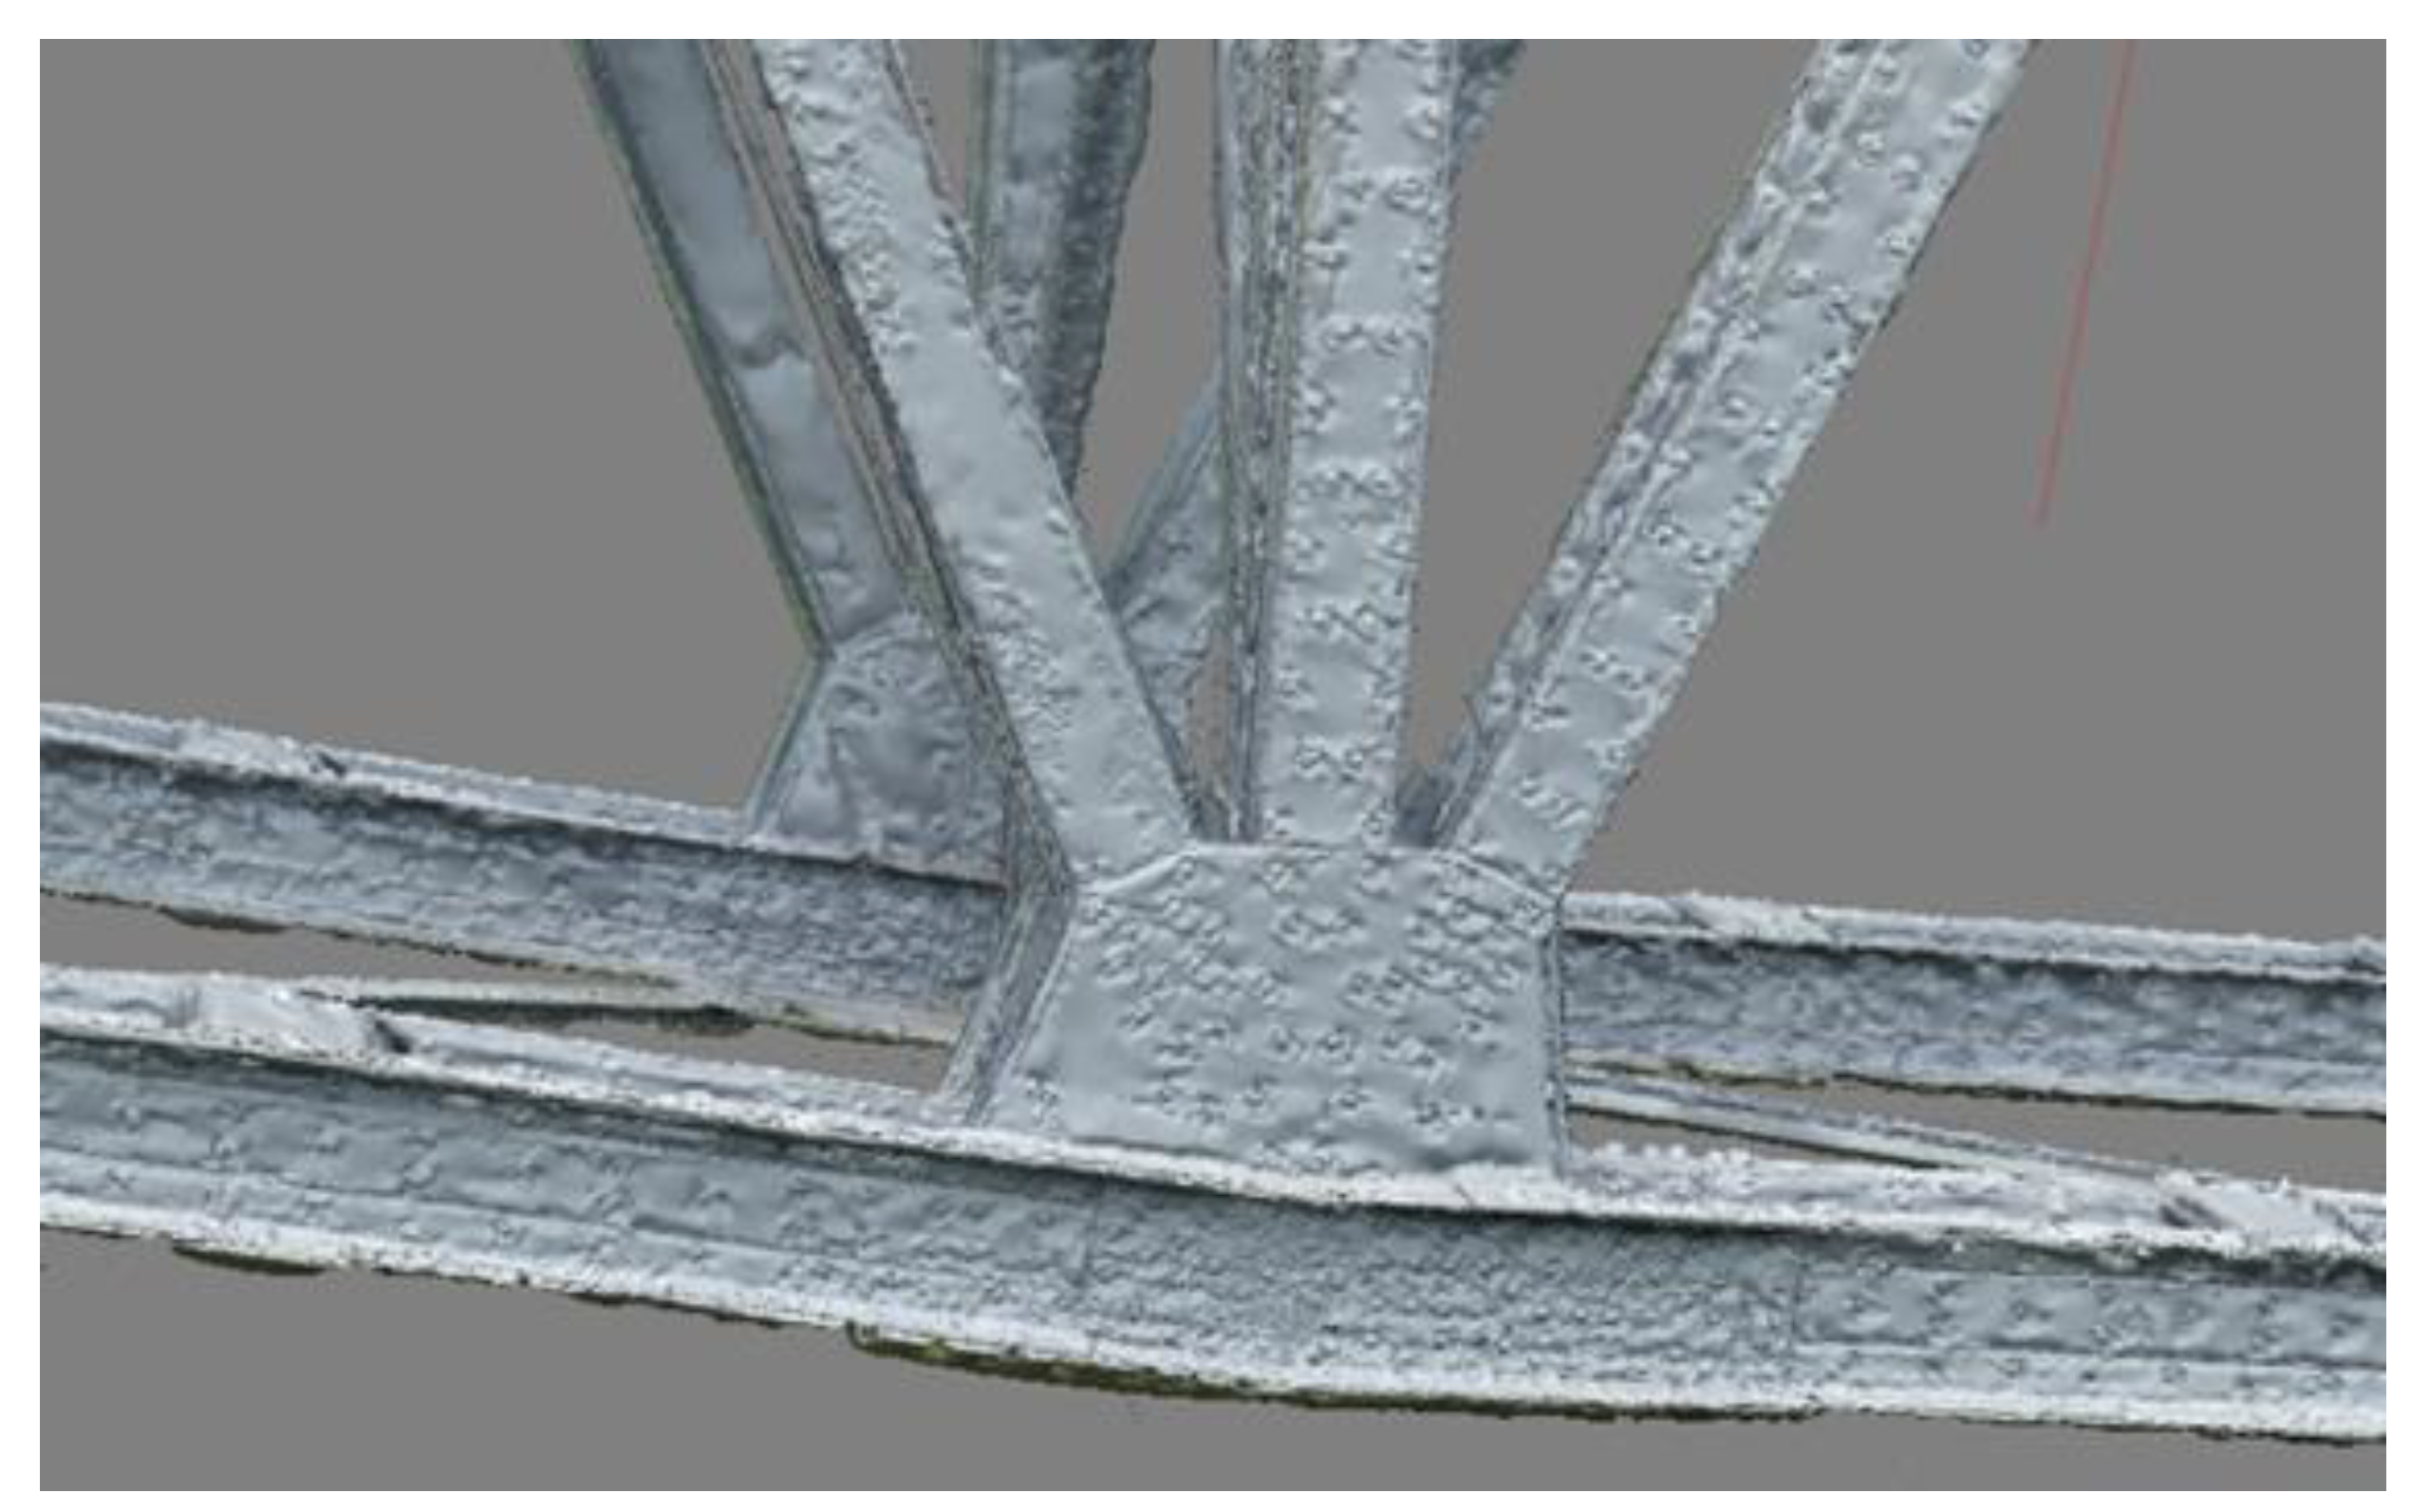
Figure 22.
Agisoft 3D model measurement of the bridge span.
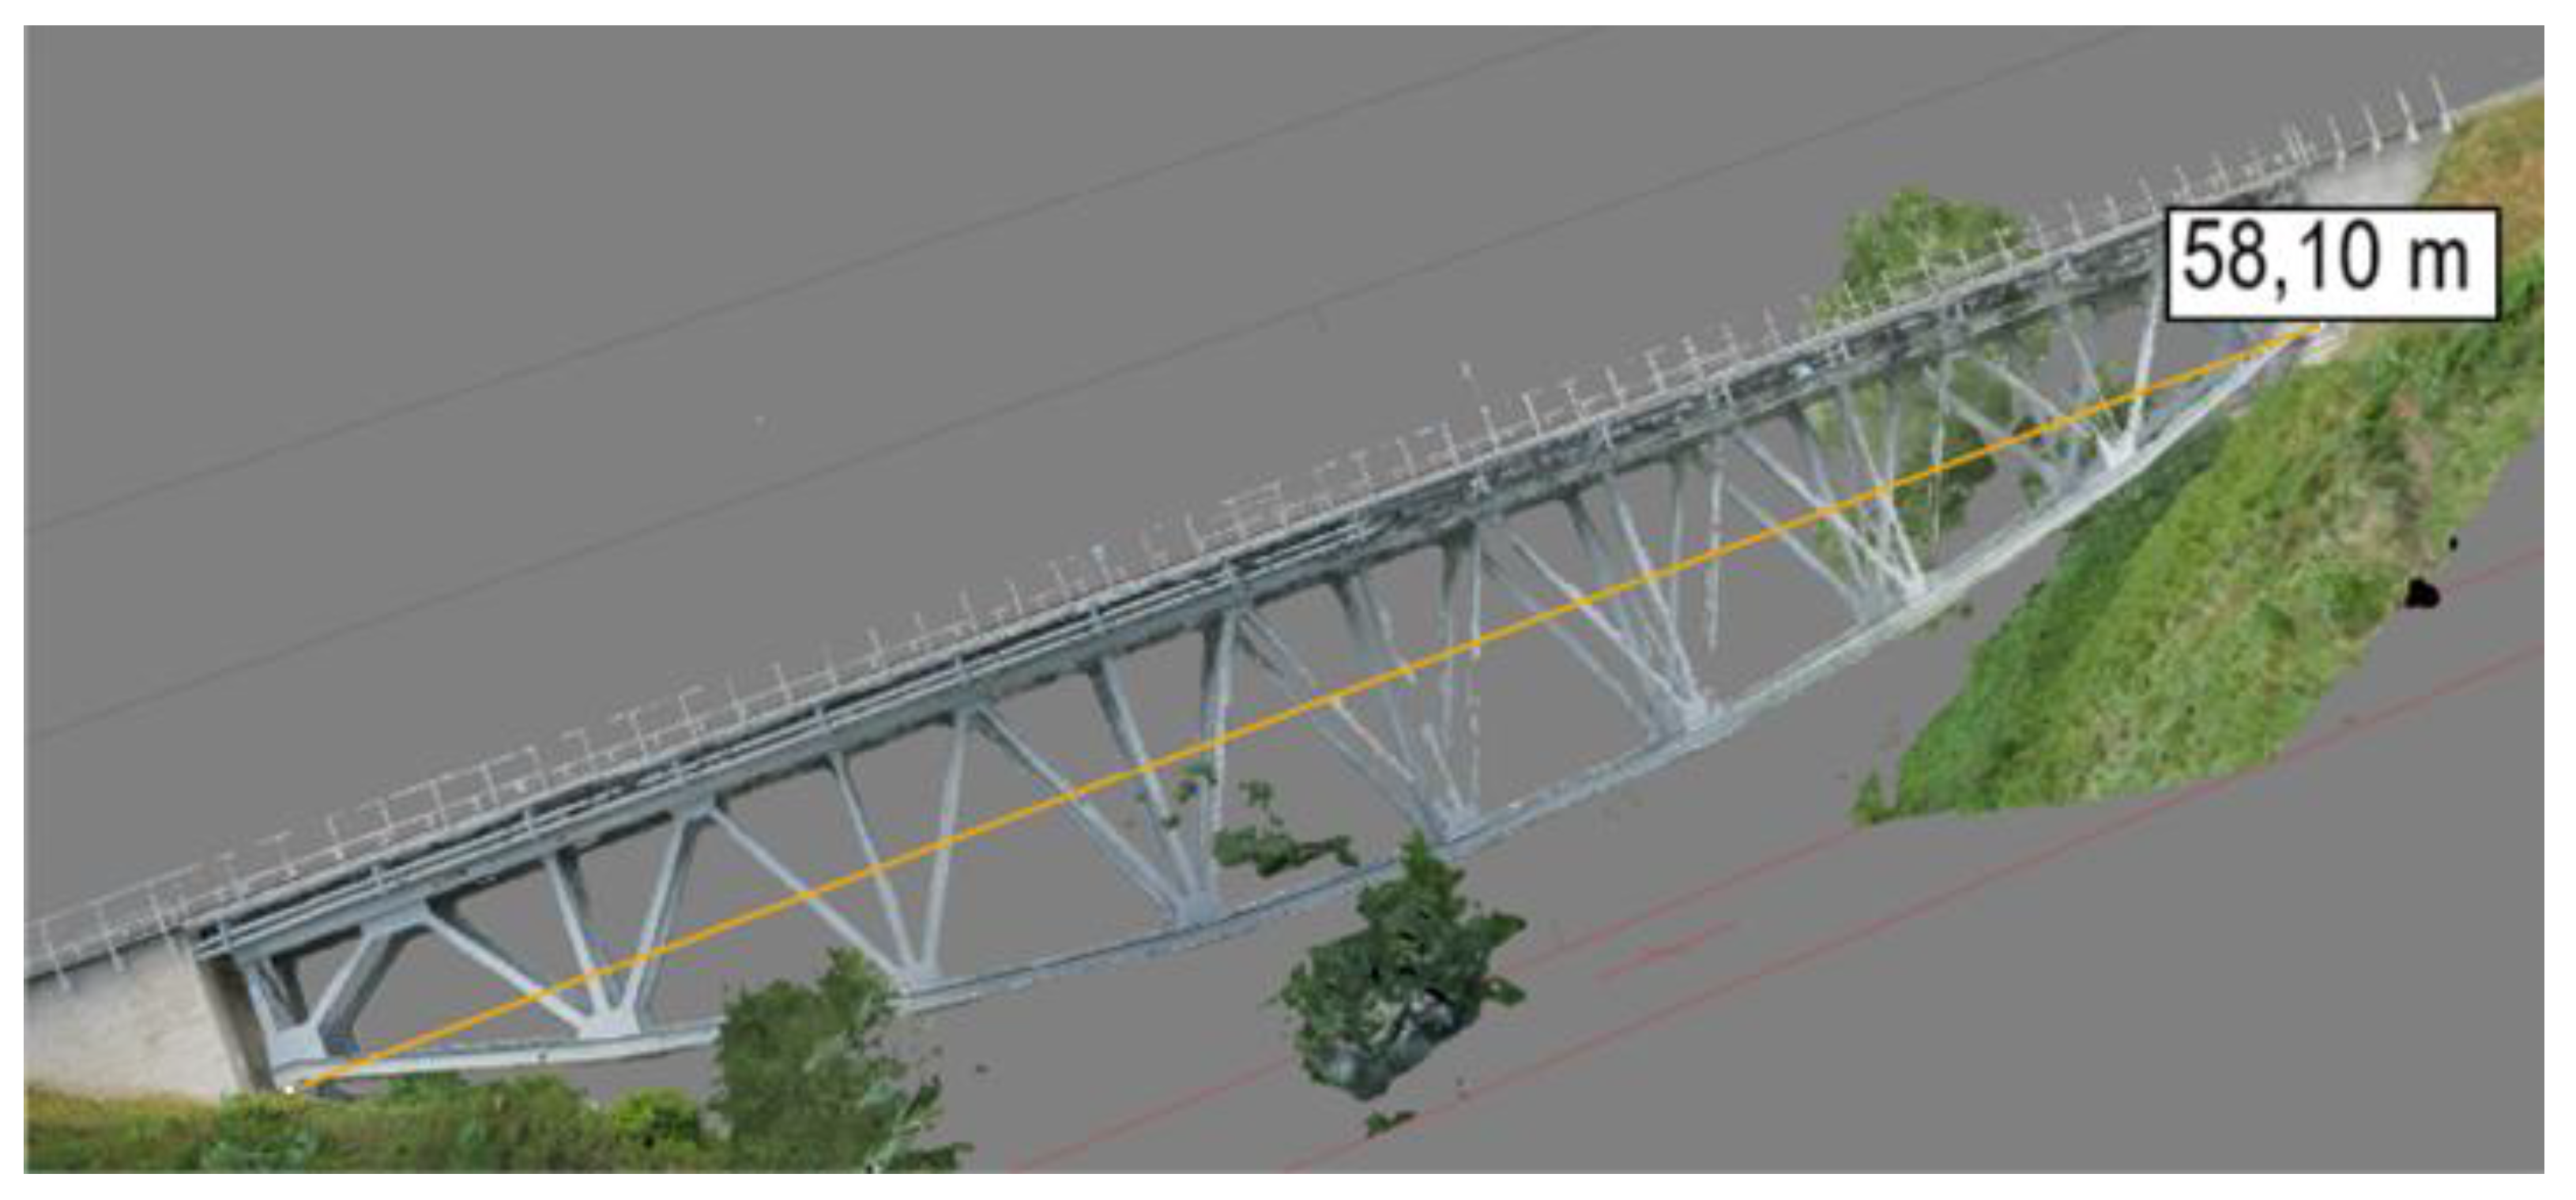
Figure 23.
Agisoft 3D model measurement of the crossbeams spacing.
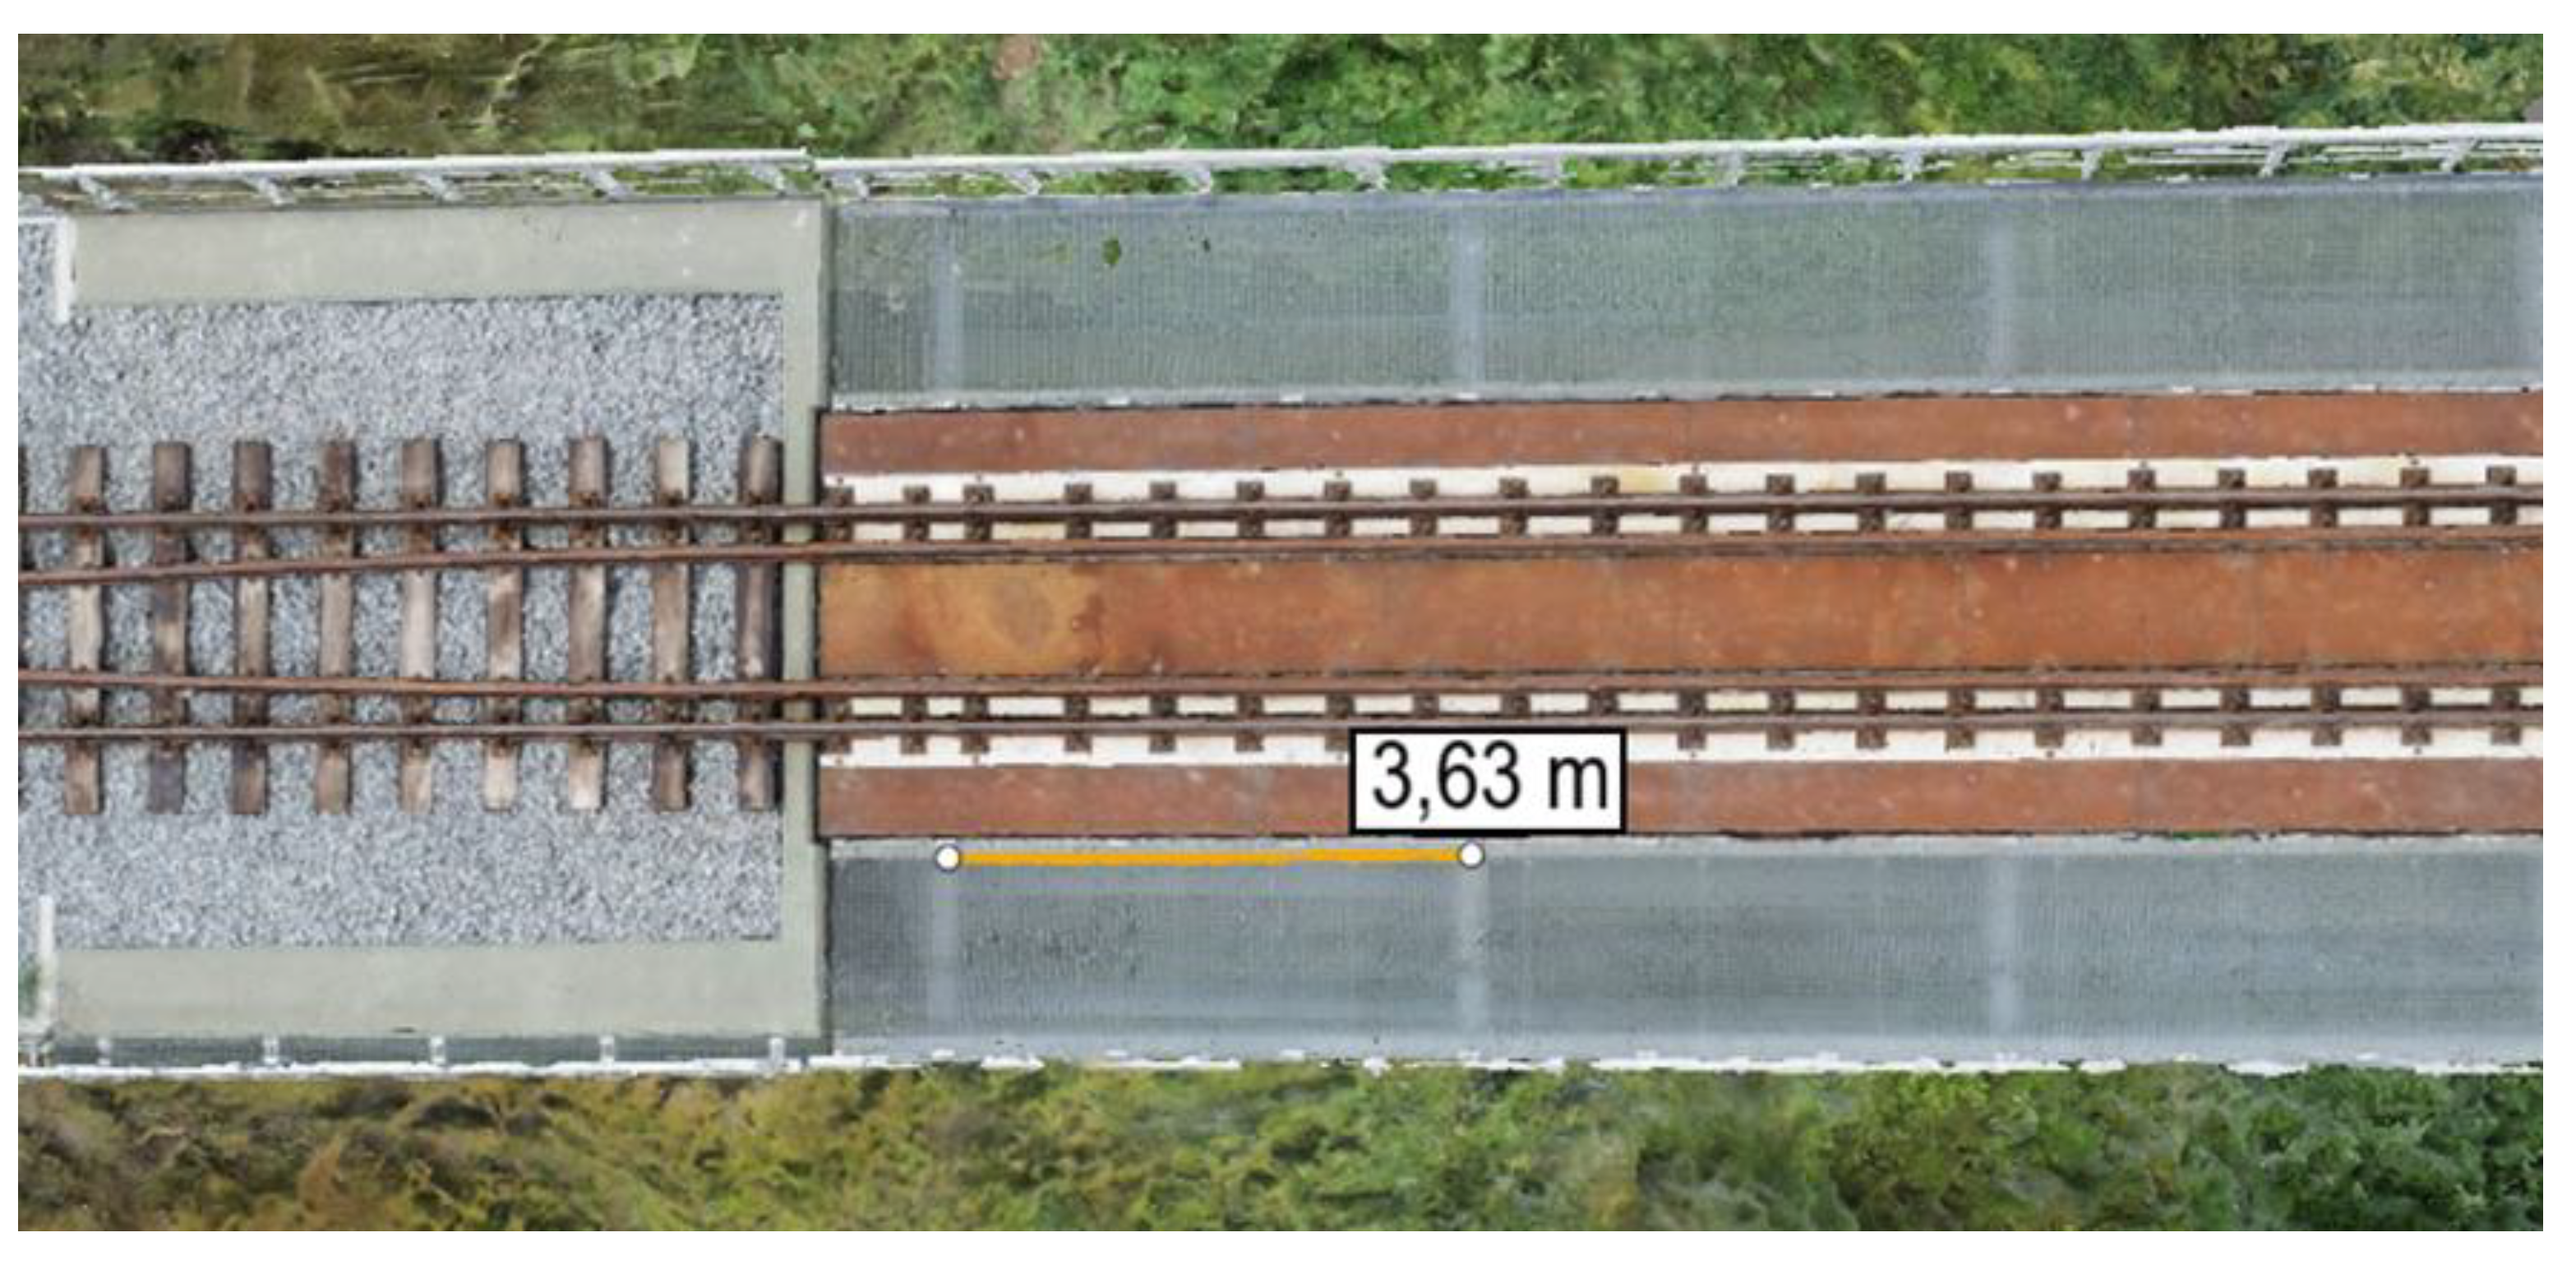
Figure 24.
Cross-sections of the railway track 3D model: (a) rail gauge; (b) height of the bridge railing.
Figure 24.
Cross-sections of the railway track 3D model: (a) rail gauge; (b) height of the bridge railing.
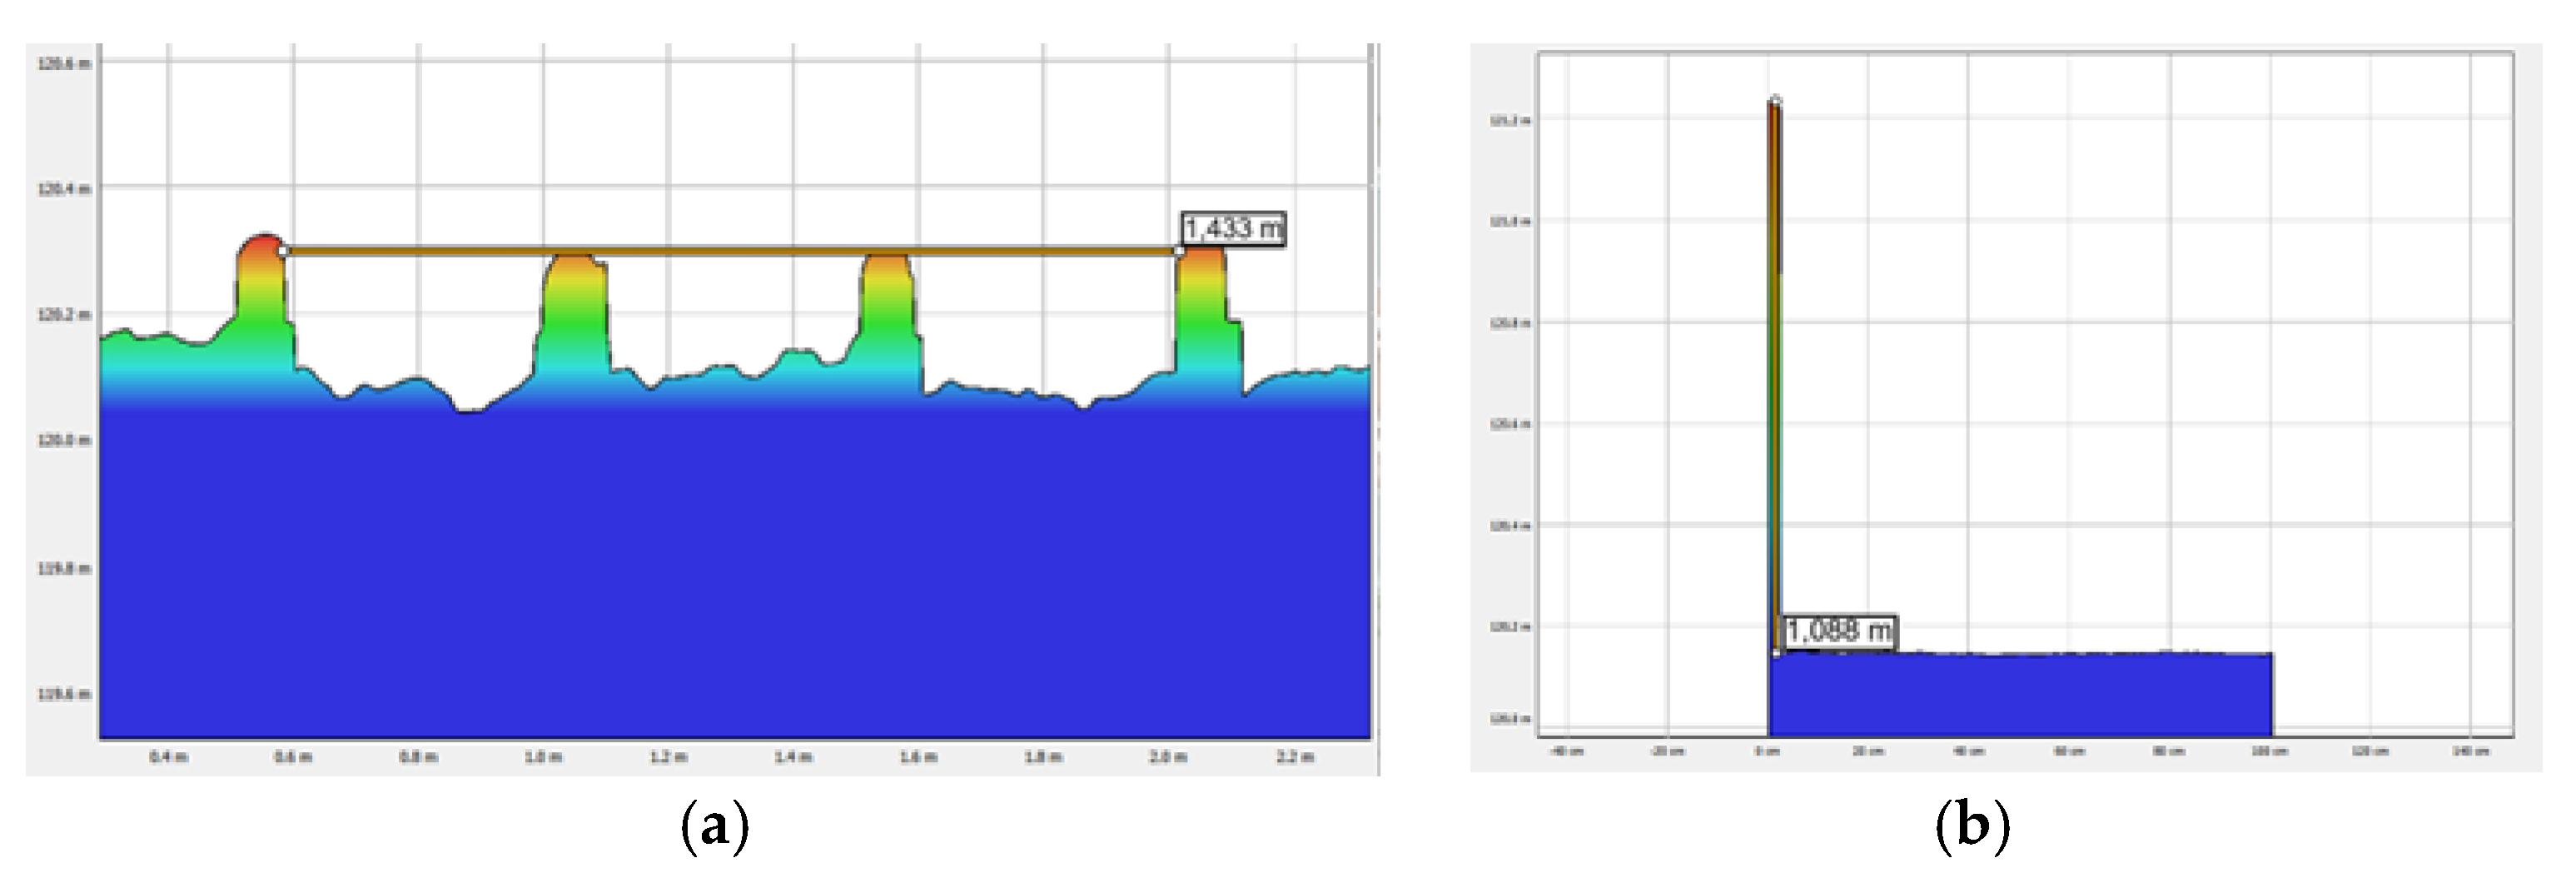
Figure 25.
Detail views on the 3D model of the railway structure texture: (a) generated in Agisoft Metashape; (b) generated in Bentley ContextCapture.
Figure 25.
Detail views on the 3D model of the railway structure texture: (a) generated in Agisoft Metashape; (b) generated in Bentley ContextCapture.
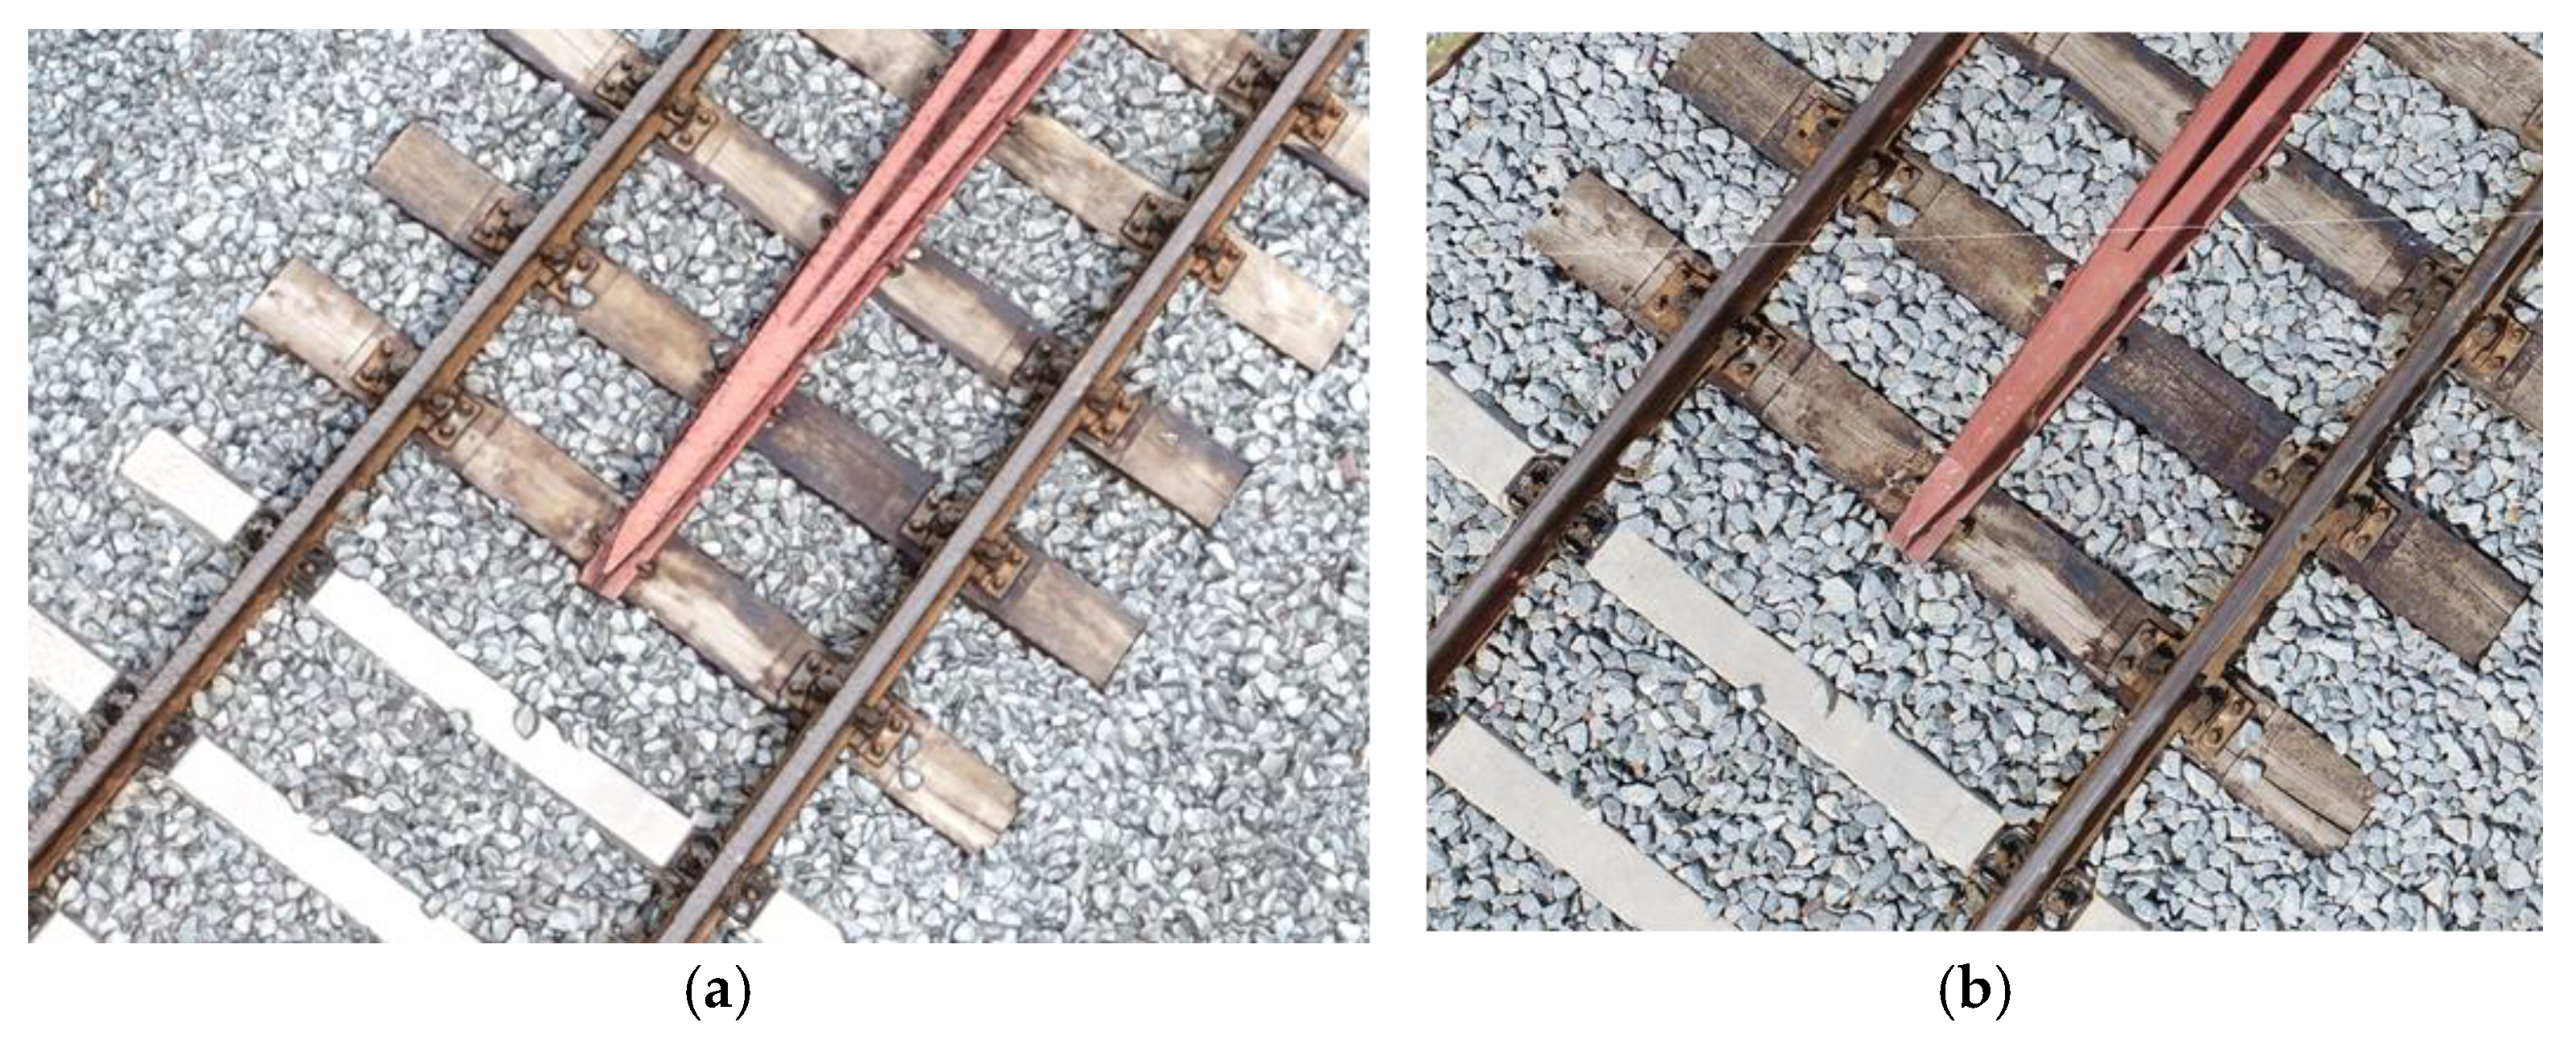
Figure 26.
Detail views on the 3D model of the truss joint: (a) generated in Agisoft Metashape; (b) generated in Bentley ContextCapture.
Figure 26.
Detail views on the 3D model of the truss joint: (a) generated in Agisoft Metashape; (b) generated in Bentley ContextCapture.
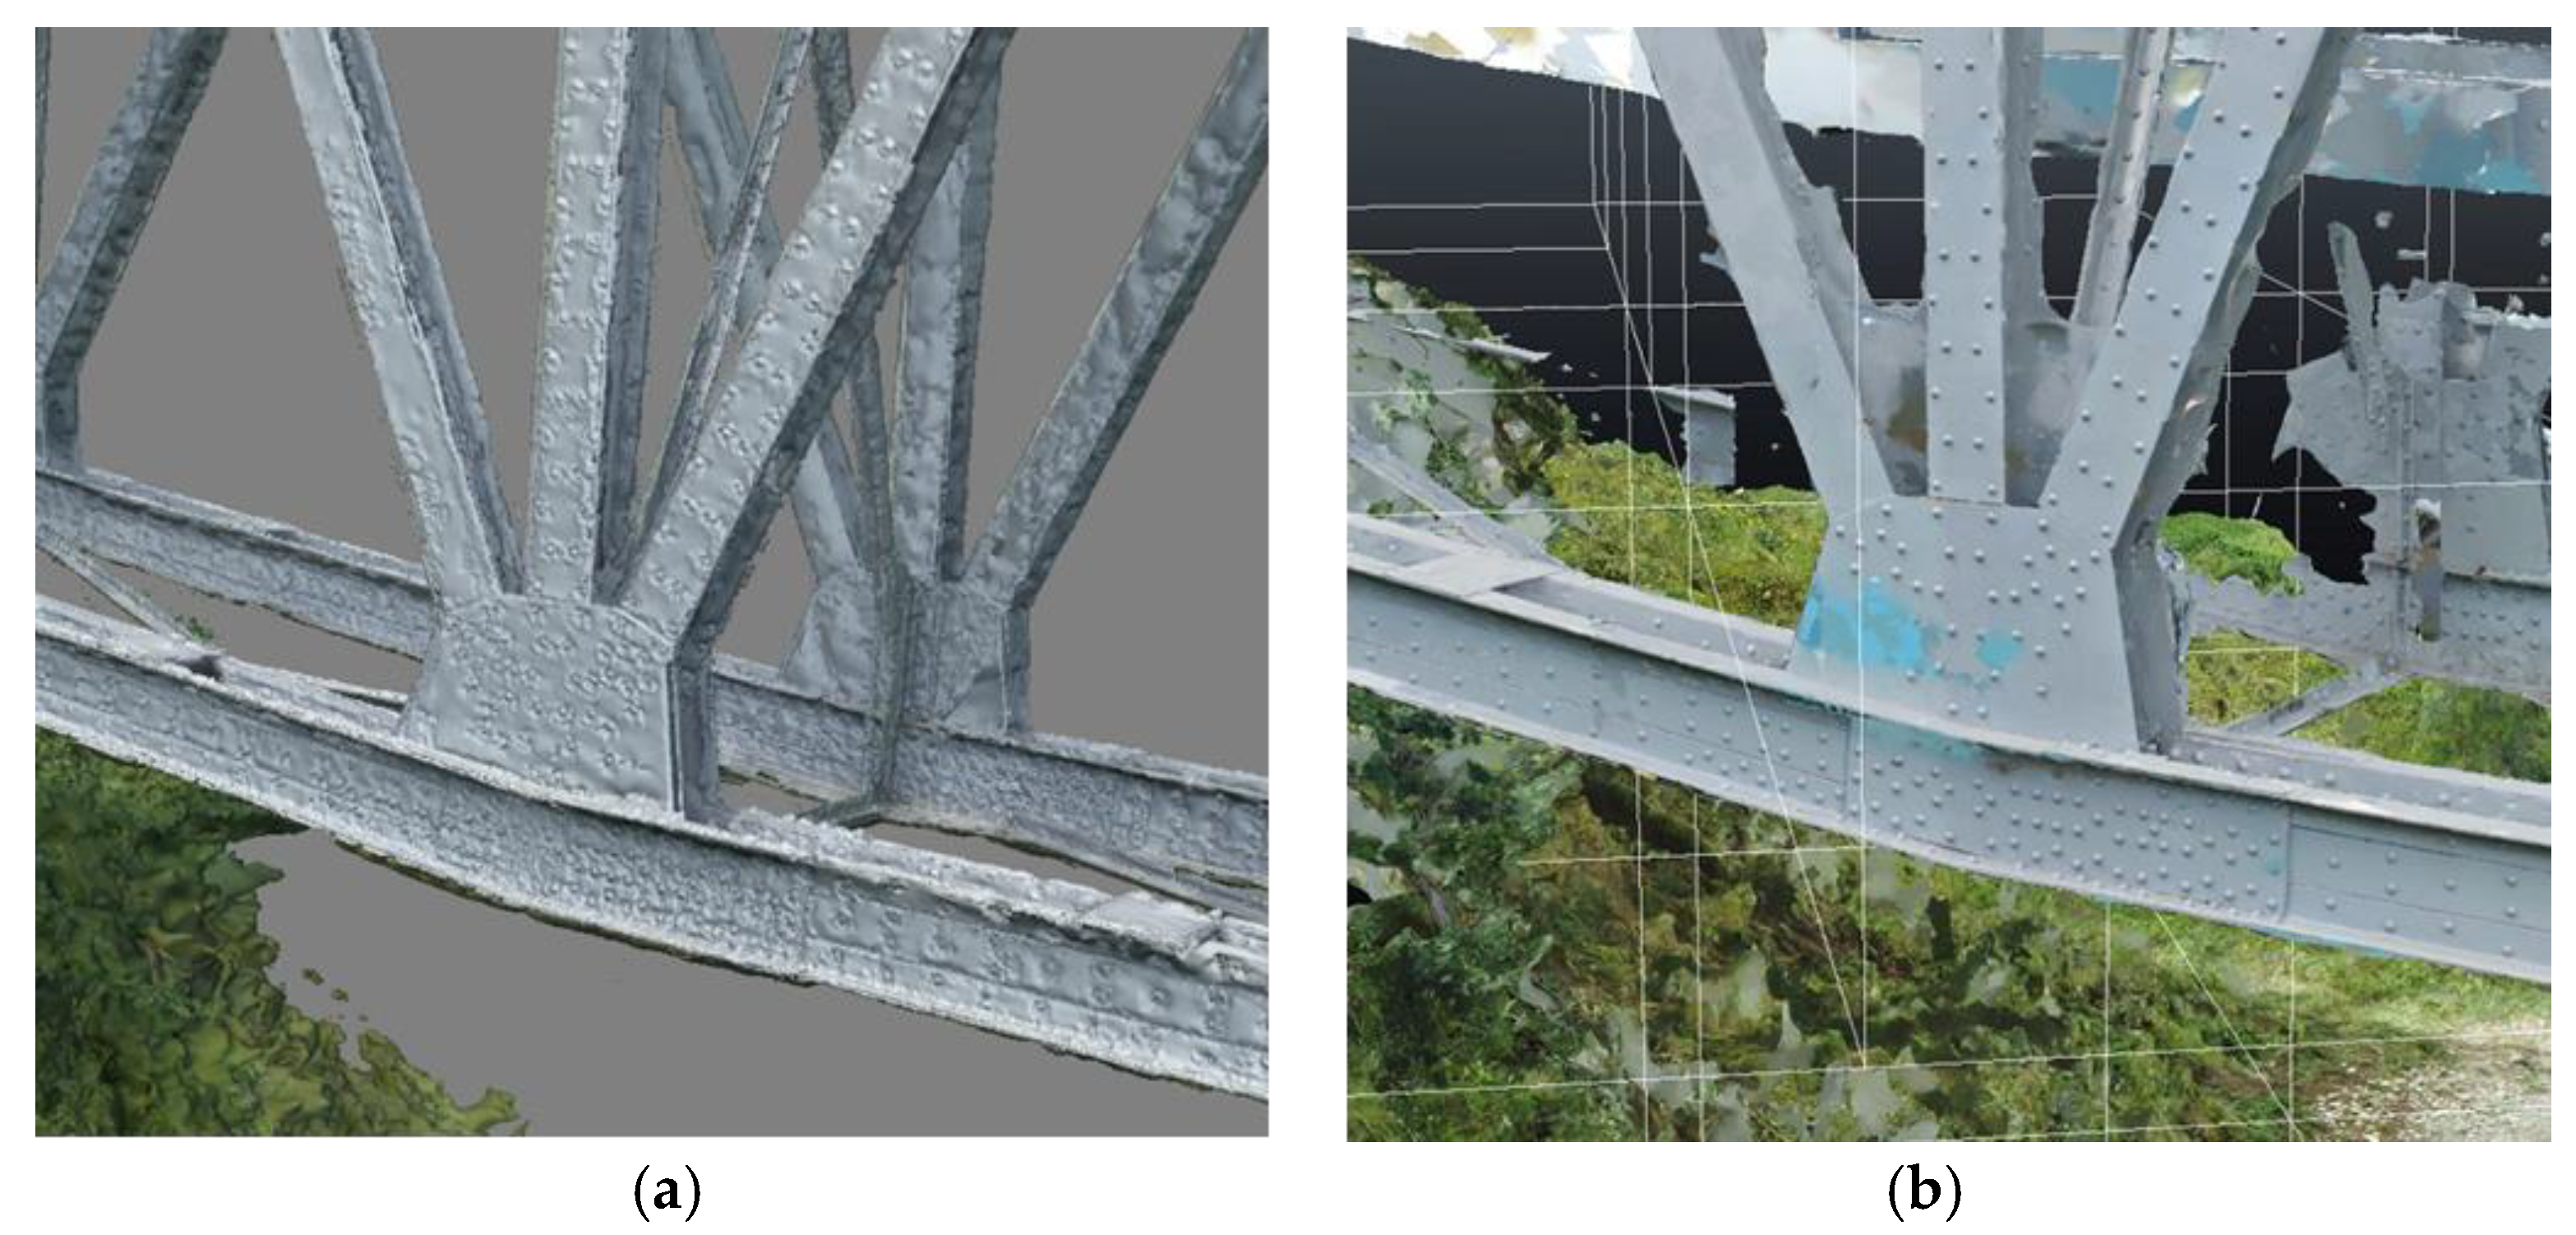
Table 1.
Parameters of the geometric resolution GSD of selected drone models a flight altitude of 30 m.
Table 1.
Parameters of the geometric resolution GSD of selected drone models a flight altitude of 30 m.
| UAV | Sensor width | Width in pixel | Focal length | Pixel size | GSD |
| DJI Phantom 4 Pro | 13.2 mm | 5472 px | 8.8 mm | 0.002412 mm | 0.82 cm/px |
| DJI Mavic 2 Pro | 13.2 mm | 5472 px | 10.3 mm | 0.002412 mm | 0.70 cm/px |
| DJI Mini 3 pro | 9.8 mm | 4032 px | 6.7 mm | 0.002430 mm | 1.09 cm/px |
Table 2.
Comparison of software workflow stages.
| Parameter | Bentley ContextCapture | Agisoft Metashape |
| Number of input images | 4 369 | 11 212 |
| Processing time | 10 days | 4 days |
| Tie points used | 53 | 78 |
| Texture quality | Very high | High |
| Strenghts | Robust automation, photorealistic texture | User control, detailed crack detection |
| Limitations | Long processing time alignment errors |
Hardware demanding repetitive geometry challenges |
Table 3.
Comparison of the basic structural dimensions.
| Element | Archival Records | Bentley ContextCapture | Agisoft Metashape | ||
| [m] | [m] | Δ [%] | [m] | Δ [%] | |
| Theoretical span Lt= | 58,00 | 57,16 | 1,45 % | 58,10 | 0,17% |
| Spacing crossbeams bc= | 3,60 | 3,68 | 2,22 % | 3,63 | 0,74 % |
| Height of the truss girder hg= | 8,04 | 8,09 | 0,50 % | 8,21 | 1,99 % |
| Track gauge gt= | 1,435 | 1,446 | 0,77 % | 1,433 | 0,14 % |
| Railing height hr= | 1,10 | 1,09 | 1,27 % | 1,09 | 1,27 % |
Disclaimer/Publisher’s Note: The statements, opinions and data contained in all publications are solely those of the individual author(s) and contributor(s) and not of MDPI and/or the editor(s). MDPI and/or the editor(s) disclaim responsibility for any injury to people or property resulting from any ideas, methods, instructions or products referred to in the content. |
© 2025 by the authors. Licensee MDPI, Basel, Switzerland. This article is an open access article distributed under the terms and conditions of the Creative Commons Attribution (CC BY) license (http://creativecommons.org/licenses/by/4.0/).
Copyright: This open access article is published under a Creative Commons CC BY 4.0 license, which permit the free download, distribution, and reuse, provided that the author and preprint are cited in any reuse.


