
Submitted:
02 December 2025
Posted:
03 December 2025
You are already at the latest version
Abstract
At 6 rice paddy sites in 4 prefectures of Japan, we analyzed the contribution of biological N2 fixation (BNF) and ratoon rice growth to soil N fertility, combining 2-year field monitoring and simulation by the biogeochemistry model DNDC-Rice. Across the sites and years, ratoon rice was found to accumulate up to 30 kg N ha-1 without fertilization and irrigation after main rice harvest. Applying a newly built BNF model calibrated against literature data, BNF at the 6 sites were estimated to be 33-63 kg N ha-1 yr-1. Based on the simulations by DNDC-Rice under the locally typical managements, we estimated the contribution of BNF and ratoon rice to soil N fertility, being varied due to the climate, soil properties and management, as follows: (a) BNF and ratoon rice contributed 4-33% and 3-23% of N supply from soil during main rice season, respectively. (b) Contribution to main rice N uptake was 3-29% from BNF, whereas 6% or less from ratoon rice. (c) Although major part of N gain by BNF was being lost by denitrification and N leaching, BNF was contributing 88-349 kg N ha-1 (1.5-6.6%) of the organic N pool in 0-30cm soil layer. Ratoon rice was working to save N loss by reducing N leaching, consequently contributing 14-183 kg N ha-1 (0.2-3.3%) of the soil N pool. We suppose this is the first analysis that quantified the contribution of BNF and ratoon rice growth to paddy soil fertility.
Keywords:
biological N2 fixation
; DNDC-Rice model
; paddy rice
; ratoon rice
; soil fertility
1. Introduction
Paddy rice typically demands around 100 kg N ha-1 crop-1 or even more, but N fertilizer application on paddy rice is usually less than the expected N uptake. According to a study on N balance in Japanese farmlands[1], for example, average N fertilization to rice paddies in Tsukuba city in 1997 was 15% less than average N uptake by rice plant. Indigenous N supply from paddy soil is often referred to as “soil N fertility”. As N supply to rice directly influences its yield and quality, N fertilization should be deliberately designed weighing soil N fertility. Presumably, part of soil N fertility is attributed to N from previously applied crop residues and other organic matters such as composts and green manures. Another important N source that contributes to soil N fertility is biological N2 fixation (BNF). According to a recent review[2], non-symbiotic BNF in rice, which was estimated by the means of 15N2 feeding, 15N dilution or N balance, ranged 4-51 kg N ha-1 crop-1.
Another natural process that potentially influences paddy soil N fertility is growth of ratoon rice. In recent rice ratooning experiments conducted in southwestern Japan (33°12′ N, 130°30′ E), the total grain yield of main and ratoon rice reached 14.4 t ha-1 in a year, when the main rice was harvested at the normal time leaving tall (50 cm) stubbles[3]. Even though economic or industrial production of ratoon rice is still limited in Japan, it is pretty common to see natural growth of ratoon rice, particularly in central Japan and south, when the field is left unplowed after harvest. Thus, it is credible that N uptake and C fixation by ratoon rice is making some contribution to N and C cycling in rice paddy soils.
If we want to quantify the contributions of BNF and ratoon rice to N and C cycling in rice paddy soils, an idealistic way is to experimentally eliminate BNF and ratoon rice from a rice paddy and compare the soils with/without BNF and ratoon rice. In reality, however, it will be difficult to completely inhibit these biological processes (BNF and ratoon rice growth) without causing any artifact, especially for a duration long enough (perhaps several years or even more) to observe significant changes in the N and C status of paddy soil. An alternative way to such real field experiments is simulation experiments that apply a numerical model to compute N and C cycling in rice paddies under hypothetical conditions with/without BNF and ratoon rice.
DNDC-Rice is a process-based biogeochemistry model developed especially for simulating N and C cycling in rice paddy ecosystems[4,5,6,7,8,9,10,11]. In this study, we added the DNDC-Rice model new components of BNF and ratoon rice growth which were calibrated with data from literature and field monitoring on rice paddies. Then, DNDC-Rice was applied to simulate the N and C cycling at the 6 monitoring sites for 2 years under hypothetical conditions with/without BNF and ratoon rice, in order to analyze what contributions BNF and ratoon rice make to the N fertility of rice paddy soils.
2. Materials and Methods
2.1. Monitoring Sites and Experimental Treatments
Table 1 gives a brief description of the 6 monitoring sites located in 4 prefectures of Japan. These 6 sites were chosen to represent, as much as possible, the regional variation of rice paddies in Japan as well as the typical paddy soil types in respective regions. The experiments in this project were designed primarily for testing reduction of chemical fertilizer usage with application of organic materials. The experimental treatments for the years 2023 and 2024 are summarized in Table 2 and Table 3, respectively. Paddy rice was successively cultivated for the last 10 years or longer at each site except the SH5 site, where rice-rice-wheat-soybean (4 crops in 3 years) rotation was carried out for the last 21 years, and the crop cultivated in 2023 was rice after soybean. At each site, seedlings of locally major cultivars of Japonica rice were transplanted in spring and harvested in autumn. Each site, except the HO2 site, had both the CT (control) and OM (organic materials) plots. The CT plot followed the locally typical farming management for 10 years or longer, with or without the crop residues returned to the soil. In the OM plot, on the other hand, a kind of compost was applied to reduce the application rate of chemical fertilizer as compared to the CT plot. Additional plots were RN (reduced N fertilizer application without compost) and 0N (no N application) at the HO1 site, OMED (organic materials with extended midseason drainage) at the AO3 site, RS (rice straw applied instead of compost), 0N and OMDT (organic materials with deep tillage in every second year) at the NI4 site.
Depending on the sites, some of these treatments were started in 2023 or 2024. At the AO3 site in 2023, also, 2 cultivars (Masshigura and Harewatari) were cultivated under each treatment, and consequently the result of field soil incubation was identical for these 2 cultivars.
2.2. Field Soil Incubation for Measuring Soil N Supply
Soon after puddling or transplanting, wet soil was sampled from the plow layer (with a thickness of 13-15 cm), homogenized removing coarse organic matters such as fresh plant residues, then filled into cylindrical PE containers (ϕ75 mm ×91 mm). Each container filled with the wet soil was tightly closed with a screw lid, placed back into middle of the plow layer, and incubated during the rice growing season. Periodically, the PE containers were collected for analysis as follows: after removing 2-cm thick uppermost layer, the wet soil was homogenized and extracted with 1 M KCl solution to determine NH4+ content. Soil N supply was determined as the increase in soil NH4+ from the start of incubation. As fresh plant residues had been mostly removed prior to soil incubation, soil N supply measured this way presumably excluded N mineralization and/or immobilization caused by decomposition of fresh residues.
2.3. Measurements of Main Rice and Ratoon Rice Growth
At each site, as mentioned earlier, seedlings of locally major Japonica rice cultivar were transplanted and cultivated following locally typical management, except the experimental treatments of organic matter and fertilizer application. Periodically until maturity, stems, leaves and panicles (if present) were sampled and measured for dry weight, total C and N content.
As harvest of ratoon rice was not intended at any monitoring site, no fertilizers nor irrigation were applied after harvest of main rice. Thirteen to 72 days after harvest, depending on the sites, treatments and years, ratoon rice was sampled from 4-10 hills per replicate, and analyzed for total dry weight, total C and N content. Data acquired this way were analyzed to build and calibrate a ratoon rice growth model as described in the Appendix.
2.4. Meteorological Data Acquisition
To run the DNDC-Rice model as well as to analyze the main and ratoon rice growth, we acquired daily meteorological data (maximum and minimum air temperatures, precipitation, solar radiation, wind speed and relative humidity) at the latitude/longitude of each site from the Agro-Meteorological Grid Square Data, NARO (https://amu.rd.naro.go.jp/). As this system does not provide wind speed and relative humidity before 1988, wind speed of 2.0 m sec-1 and relative humidity of 70% were substituted for the lacking data, respectively.
2.5. Brief Description of the DNDC-Rice Model
DNDC-Rice simulates plant growth and soil processes at daily time step depending on input data on meteorology, soil properties, and farming managements. It was developed modifying the original DNDC model [12,13,14] especially on redox processes in rice paddy soils and production and emission of CH4.
In this study, further modifications and additions were made to DNDC-Rice in order to analyze the effects of BNF and ratoon rice growth on N dynamics in paddy soils under different conditions. BNF was assumed to be done by photosynthetic autotrophs on paddy surface, and the parameters in newly built BNF sub-model were calibrated according to literature data on BNF measured at a Japanese rice paddy site[15]. Another sub-model was built to simulate ratoon rice growth depending on the air temperature and soil N availability after main rice harvest and calibrated based on the site-specific monitoring data in this study. Decomposition (mineralization) of composts was simulated dividing them into 2 groups responding to their decomposing rate. Details of the construction, modification and calibration of DNDC-Rice are described in the Appendix.
2.6. Application of the DNDC-Rice Model
To analyze the contributions of BNF and ratoon rice growth to paddy soil N fertility in this study, DNDC-Rice was applied on each plot under following 3 settings: including BNF and ratoon rice growth (S1), excluding ratoon rice growth (S2), and excluding both BNF and ratoon rice growth (S3).
At all sites except the SH5 site, simulation was started from the year 2001. At the SH5 site, simulation was started from 2002 in order to repeat the 3-year cycle (rice-rice-wheat-soybean) 7 times until 2022. Up to 2022, farming managements (including fertilizer and compost application) were set the same as those in 2023, except for the plots where new treatment began in 2023 or 2024. Nitrogen input with precipitation and irrigation was estimated assuming N concentration of 0.5 ppm (0.25 ppm each for NH4-N and NO3-N) in precipitation and irrigation water.
Soil properties of the control plot (Table 1) were used as the initial values for all plots at each site. When measured soil data were not available, the average for relevant Soil Series Group or Soil Group was retrieved from the SolphyJ database [16] or a previous publication[17].
As mentioned before, most fresh plant residues were removed from the soil samples prior to the field incubation experiment. Such a specific condition was reproduced in the simulation by numerically setting all plant residues to zero, just on the beginning of field incubation in 2023 and 2024, only at the specific depth of soil (5cm) where soil N supply was compared between the observation and the simulation.
2.7. Statistical Analysis
On the results of field experiments, we tested the statistical significance of treatment effects on main rice growth, ratoon rice growth and soil N supply at respective sites. For this purpose, unpaired Student's t-test was performed between the relevant variables observed in the control plot and each treatment plot, applying the TTEST function of Microsoft Excel. Accuracy of model prediction was evaluated calculating the bias, correlation coefficient (r) and root mean square error (RMSE).
3. Results and Discussion on the Field Monitoring
3.1. Observed Rice Growth Under Various Conditions
Table 4 and Table 5 summarize observed results of main rice growth and soil N supply in field incubation for 2023 and 2024, respectively. When replicate data were available, the result of t-test on the difference between the control and each treatment at each site is shown on the right-hand side of the S.D. (**, * and ns indicate P<0.01, P<0.05 and no significance, respectively).
TDD10 (sum of daily mean air temperature over 10 ℃) from transplanting to harvest was less than 1300 ℃ days at the northernmost site (HO1) but was close to or over 1600 ℃ days at the other sites.
At the HO1 site, reduction in N fertilizer application by 5-10 kg N ha-1 (OM and RN plots) did not significantly affect grain yield nor N uptake, though complete elimination of N fertilizer (0N plot) apparently decreased grain yield and aboveground N uptake in 2023.
At the AO3 site, application of chicken manure compost in 2023 and swine manure compost in 2024 (coupled with reduction in N fertilizer application) did not significantly change grain yield in either cultivar (OM1 and OM2 plots), while the chicken manure compost significantly increased aboveground N uptake in the cultivar Harewatari (OM2 plot in 2023). On the other hand, 7-day longer midseason drainage in 2024 (OM2ED plot) significantly decreased grain yield.
At the NI4 site in 2023, successive application of rice straw compost or rice straw (OM1, OM1DT and RS plots) increased N uptake, though statistical significance was not found. Nonetheless, application of rice straw compost combined with biennial deeper tillage (OM1DT plot) significantly increased grain yield in 2023. In the plot without N application for more than 20 years (0N plot), grain yield was significantly reduced in 2023, but the rice plant absorbed more than 60 kg N ha-1 in both years, indicating the potential of soil N fertility.
At the SH5 site in 2023, successive application of cattle manure compost (OM plot) significantly increased main rice N uptake, though observed increase in grain yield was not statistically significant. At the SH6 site in 2024, observed increase in grain yield and N uptake due to cattle manure compost (OM plot) was less than 7% as compared to the control.
Across all the sites, treatments and years, grain yield of rice was found to be highly correlated (r = 0.847, n = 30) to aboveground N uptake.
3.2. Soil N Supply Measured by Field Soil Incubation
The period of field soil incubation mostly matched the main rice growing period except at the HO1 and HO2 sites, where field soil incubation was terminated after 70 days because of technical reasons. Despite the shorter incubation period and relatively low air temperature, peat soil of the HO1-CT plot supplied 60-70 mg N kg-1, which was nearly double that from the gley soil of nearby site (HO2-CT). Two-year application of rice straw compost to the HO1-OM plot did not significantly change soil N supply as compared to the control (HO1-CT plot).
Comparing the control plots of all sites, the soil of AO3-CT plot showed the highest N supply in both years. This is presumably because (a) this site received successive application of rice straw, and (b) the incubation period at this site was relatively long. It is notable that the first application of chicken manure compost in 2023 (AO3-OM plot) increased N supply by more than 50 mg N kg-1 as compared to the control (AO3-CT plot). Considering the application rate of chicken manure compost (ca. 60 mg N kg-1 soil), approximately 80% of the N in chicken manure compost was presumably mineralized during the incubation period. Also, the application of swine manure compost in 2024 (AO3-OM plot) significantly increased soil N supply.
No replicates were prepared in the field soil incubation experiment at the NI4 site. In the NI4-OM1 plot, nonetheless, successive application of rice straw compost increased soil N supply by 21-28 mg N kg-1 as compared to the control. First application of chicken manure compost to the NI4-OM2 plot in 2024 increased soil N supply by 16 mg N kg-1. It is noteworthy that soil of the NI4-0N plot, which received no N application for more than 20 years, supplied more than 60 mg N kg-1 during the rice growing season of both years supporting growth of rice.
At the SH5 site in 2023, successive application of cattle manure compost (SH5-OM plot) nearly doubled observed soil N supply as compared to the control (SH5-CT plot). First application of cattle manure compost to the SH6-OM plot in 2024 significantly increased soil N supply by 11 mg N kg-1 (21%) as compared to the control (SH6-CT plot).
3.3. Ratoon Rice Growth Observed Under Various Conditions
Table 6 and Table 7 summarize ratoon rice growth observed in 2023 and 2024, respectively. When replicate data were available, the result of t-test on the difference between the control and each treatment at each site is shown on the right-hand side of the S.D. (**, * and ns indicate P<0.01, P<0.05 and no significance, respectively).
TDD10 for the ratoon rice growth period ranged 38.8-950.8 ℃ days among the sites for the 2 years. Across the sites, treatments and years, dry weight, N and C of ratoon rice were correlated to TDD10 with r = 0.814 (n = 29), r = 0.743 (n = 29) and r = 0.852 (n = 21), respectively. The average of C/N ratio of ratoon rice measured at 3 sites was 30.3 g g-1 and 26.1 g g-1 in 2023 and 2024, respectively. As the result of t-test performed on available data, significant treatment effects on these variables were found only at the AO3 site.
Ratoon rice at the SH5 site in 2023 grew for the longest period and accumulated more than 30 kg N ha-1. Ratoon rice dry weight observed at this site (2.1-2.5 t ha-1) was comparable to that observed in the rice ratooning experiments in southwestern Japan when the main rice was harvested leaving short (20cm) stubbles [3].
Although ratoon rice at the AO3 site grew for the shortest period among the 4 sites in 2023, its dry weight and N were comparable to or higher than those observed at the HO1 site. Given the fact that N content in main rice straw at the AO3 site in 2023 (59-86 kg N ha-1) was almost double that at the HO1 site (30-35 kg N ha-1), above finding suggests that C and N remaining in the main rice stubbles enhanced the growth of ratoon rice, as reported in literature[19,20]. Recently, Nakano et al. [21] found that nonstructural carbohydrate content in the stubble regulates grain yield of ratoon rice in southwestern Japan.
4. Analyses Applying the DNDC-Rice Model
4.1. Simulated Biological N2 Fixation
As shown in Table 8 and Table 9, simulated BNF in 2023 and 2024 ranged 33-63 kg N ha-1 yr-1, depending mostly on the irradiance at paddy surface for flooded period (r > 0.99). Simulated BNF in the NI4-0N plot (63 kg N ha-1 yr-1) was higher than published values of seasonal N fixation observed in Japanese paddy soils, e. g. 45 kg N ha-1 [15] and 35.5 kg N ha-1[22], and similar to observed N uptake (63 kg N ha-1) by the main rice in this plot without N fertilization. Other possible N sources, namely atmospheric deposition and irrigation water, were not monitored in this study. According to an analysis of long-term N deposition at 7 locations in Japan[23], nevertheless, average N deposition for the period of 2003-2018 was 11.5 kg N ha-1 yr-1. As for N input with irrigation water to rice paddies, a likely estimate is 15 kg N ha-1 yr-1[24]. Comparing with these estimates of different N sources, BNF is suggested to be a major N source for the NI4-0N plot.
Applying metagenomic analyses, Masuda et al. [25,26,27] recently found that Nitrogenase genes (nif) in paddy soil samples were derived predominantly from diazotrophic Fe-reducing bacteria such as Anaeromyxobacter and Geobacter, and proposed that these bacteria primarily drive N2 fixation in paddy soils. It deserves attention that their findings do not agree previous ones such as (a) N2 fixation in a paddy soil was accompanied by CO2 fixation (C/N = ca. 6.0) indicating that N2 fixers were autotrophs [15] and (b) N2 fixation in a paddy soil was almost completely inhibited by shutting out the light, indicating that N2 fixers were photosynthetic microorganisms[28]. It is difficult to conclude here what microorganisms are the primary N2 fixers in paddy soils. As mentioned earlier, this study constructed the BNF model assuming photosynthetic autotrophs as the N2 fixers. However, as the DNDC-Rice model includes an algorithm to explicitly calculate soil Fe reduction[4], it can be modified to couple soil Fe reduction and N2 fixation when necessary.
4.2. Simulation of Soil N Supply
Figure 1 compares soil N supply measured in the field incubation and simulated by the DNDC-Rice model for 2023 and 2024 under the 3 settings. As done earlier, the result of t-test on observed difference between the treatments and control is shown above the bar (**, * and ns indicate P<0.01, P<0.05 and no significance, respectively).
In the simulation with BNF and ratoon rice growth (S1), simulated soil N supply showed a high correlation with the observation (r = 0.85), though holding a negative bias (-14.2 mg N kg-1) with the RMSE of 21.1 mg N kg-1. The northernmost sites (HO1 and HO2) were large error sources: soil N supply at these sites was underestimated by 22-55 mg N kg-1. Excluding these 2 sites, the correlation between the simulated (S1) and observed soil N supply was raised to r = 0.91, and the bias was narrowed to -8.2 mg N kg-1, with the RMSE of 12.6 mg N kg-1.
Depending on the conditions at each experiment site, different organic materials were applied for different number of years: rice straw compost for 2 years (HO1 site), chicken manure compost and swine manure compost for 1 year each (AO3 site), rice straw and rice straw compost for successive years and chicken manure compost for 1 year (NI4 site), cattle manure compost for successive years (SH5 site), cattle manure compost for 1 year (SH6 site). Figure 2 compares observed and simulated N supply due to organic material application, quantified as the difference between the OM/RS and CT plots. Due to the above-mentioned variations in experimental conditions, observed N supply from organic material application ranged 0-63 mg N kg-1, and DNDC-Rice well predicted them except for the chicken manure compost applied at the AO3 site in 2023: excluding this sample, the RMSE was lowered from 11.4 (n = 10) to 6.3 (n = 9) mg N kg-1.
4.3. Contribution of BNF and Ratoon Rice to Soil N Supply
In the simulation excluding ratoon rice growth (S2), soil N supply decreased (as compared to S1) by 8.3 and 9.4 mg N kg-1 as the average for 2023 and 2024, respectively. By excluding both BNF and ratoon rice growth (S3), it further decreased by 16.0 and 15.2 mg N kg-1 for 2023 and 2024, respectively. These results suggest that BNF and ratoon rice are making substantial contributions to N supply from rice paddy soils.
Contribution of BNF to soil N supply, quantified as the difference between S2 and S3, was in the range 2-29 mg N kg-1 across the sites, plots and years. It was high (19-29 mg N kg-1) at the NI4 site, reflecting the high BNF at this site (Table 8 and Table 9). On the other hand, contribution of BNF at the SH5 site was the lowest level (2-3 mg N kg-1), presumably because (a) BNF occurred only in 2 rice seasons out of the 3-year rotation cycle, and (b) relatively high air temperature during non-rice season (autumn, winter and spring) at this site enhanced N mineralization outside the rice season. As compared to soil N supply observed at the control plots, relative contribution of BNF to soil N supply was estimated as 9-33% at the single rice cropping sites, and 4% at the paddy-upland rotation site (SH5).
Contribution of ratoon rice to soil N supply, quantified as the difference between S1 and S2, was in the range 1-20 mg N kg-1. It was relatively small at the northern sites (HO1, HO2 and AO3) where growth of ratoon rice was limited due to low air temperature after main rice harvest. At the southern sites (SH5 and SH6), on the other hand, ratoon biomass was larger than that at the NI4 site, but its contribution to soil N supply was smaller than that at the NI4 site. Similarly to the case of BNF, plausible reasons are (a) ratoon rice grew only after 2 rice seasons out of the 3-year rotation cycle, and (b) at the SH5 and SH6 sites, ratoon rice was plowed into the soil in October or early November, and relatively high temperature during non-rice season (autumn, winter and spring) at these sites enhanced N mineralization outside the rice season. As compared to soil N supply observed at the control plots, relative contribution of ratoon rice to soil N supply was estimated as 3-23% at the 6 sites.
4.4. Contribution of BNF and Ratoon Rice to Main Rice N Uptake
Figure 3 compares main rice N uptake in 2023 and 2024 observed and simulated by DNDC-Rice under the 3 settings. In this study, we employed a relatively simple rice growth model based on effective temperature sum, using the same parameter set for all cultivars, except the TDD10max for the cultivar Nanatsuboshi. Nevertheless, the simulation including BNF and ratoon rice growth (S1) reasonably reproduced the variation in N uptake (r = 0.70, RMSE = 16.0 kg N ha-1, bias = 3.1 kg N ha-1).
Quantified as the difference between S2 and S3, BNF contributed 3-49 kg N ha-1 of main rice N uptake, reflecting the contribution of BNF to soil N supply (Fig. 1). In the NI4-0N plot, where no N was applied for more than 20 years, BNF accounted for 49 kg N ha-1 of N uptake in both years. At the paddy-upland rotation site (SH5), on the other hand, contribution of BNF to N uptake was only 3-4 kg N ha-1. As compared to the observed N uptake in the control plots at single rice cropping sites, BNF contributed 9-29% of main rice N uptake, similarly to the contribution to soil N supply. When compared to the N gain by BNF in the control plots (34-59 kg N ha-1), on the other hand, N allocated to main rice was less than 50% of the N gain by BNF.
Quantified as the difference between S1 and S2, contribution of ratoon rice to main rice N uptake was 0-5 kg N ha-1 across all sites, plots and years. As compared to the observed N uptake in the control plots, the relative contribution of ratoon rice was 0-6%, which is lower than its contribution to soil N supply (3-23%). This can be attributed to the relatively high C/N ratio (ca. 30) of ratoon rice. The N and C cycling of ratoon rice (N uptake, CO2 fixation and production of organic N) worked to raise organic N content of the soil. However, when ratoon rice was plowed into soil prior to the next main rice season, decomposition of ratoon biomass induced N immobilization, competing with N uptake by main rice.
4.5. Effects of BNF and Ratoon Rice on N Loss from Rice Paddies
Next, we analyzed how BNF and ratoon rice influence N loss from rice paddies. Figure 4 shows N loss due to denitrification and N leaching from the 0-50cm soil profile of control plot at each site simulated under the 3 settings (S1, S2 and S3).
Quantified as the difference between S2 and S3, BNF increased N loss by 20-45 kg N ha-1 yr-1, indicating that major part of the N gain by BNF was lost due to denitrification and leaching. At the HO1 and HO2 sites, BNF increased N loss mainly due to denitrification, because relatively high soil pH (6.64) at these sites favored denitrification (N2 emissions accounted for most of the denitrification). When the input of soil pH was lowered to 5.6 on trial, simulated denitrification from the HO1-CT plot in 2024 was reduced to 2.2 kg N ha-1 yr-1, increasing N leaching by ca. 20 kg N ha-1 yr-1 in turn. In the AO3-CT and NI4-CT plots with soil pH of 5.7 and 5.5, respectively, BNF increased N loss mostly due to N leaching.
Ratoon rice gains no N, but it worked to save N loss. At the NI4, SH5 and SH6 sites, where ratoon rice grew relatively large, it reduced N leaching and saved N loss by 7-11 kg N ha-1 yr-1, quantified as the difference between S1 and S2. As there was no difference in N input between the S1 and S2 simulations, these results suggest that ratoon rice is working to raise soil N pool by saving N loss due to leaching.
4.6. Contribution of BNF and Ratoon Rice to Soil N Pool
Table 10 shows organic N pool in 0-30cm soil layer of each plot simulated with BNF and ratoon rice (S1), with BNF (S2), and without BNF and ratoon rice (S3). In Table 10, we left out some plots where new treatments began in 2023 or 2024 (namely HO1-OM, HO1-RN, HO1-0N, AO3-OM, NI4-OM2, and SH6-OM), because these plots had been identical to respective CT plots until 2023 or 2024, and consequently had virtually the same N pool as respective CT plots. The soil N pool of the SH6-CT plot is as of the end of 2024, while the others are as of the end of 2023.
Quantified as the difference between S2 and S3, contribution of BNF to the organic N pool under the locally typical managements (CT plots) was 88-349 kg N ha-1, and equivalent to 1.5-6.6% of that pool. Although major part of the N gain by BNF was lost due to denitrification and N leaching (Figure 4), it was still contributing to N pool of the paddy soils. The contribution of BNF was relatively small at the southern sites (SH5 and SH6), presumably because of the paddy-upland rotation (SH5 site) and/or the warmer climate that enhanced soil N mineralization throughout the year. With respect to treatment effects within respective sites, relative contribution of BNF was lower in the plots successively receiving organic matter application (NI4-OM1, NI4-OM1DT, NI4-RS, SH5-OM), and higher in the plot receiving no N application (NI4-0N).
Quantified as the difference between S1 and S2, ratoon rice was contributing 14-183 kg N ha-1 (0.2-3.3%) to the soil organic N pool under the locally typical managements. While ratoon rice gained no N, it did contribute to building the organic N pool through uptake and immobilization of inorganic N. The contribution of ratoon rice was relatively small at the northernmost sites (HO1 and HO2) where growth of ratoon rice was limited due to the lower air temperature. Under the locally typical managements, combined contribution of BNF and ratoon rice to the soil organic N pool was 2.0-9.9%. Excluding the peat soil at the HO1 site, which had indigenously high C and N contents, the combined contribution of BNF and ratoon rice was 4.5-9.9%.
5. Conclusions
Through combining field monitoring and model simulations, we analyzed the contributions of biological N2 fixation (BNF) and ratoon rice growth to soil N fertility at 6 rice paddy sites in Japan. For this purpose, the DNDC-Rice model was equipped with newly constructed sub-models of BNF and ratoon rice growth, which were calibrated against literature data or the site-specific monitoring data.
Applying the BNF model calibrated against the literature data, BNF at the 6 sites for the 2 years were estimated to be 33-63 kg N ha-1 yr-1. In the 2-year monitoring, ratoon rice accumulated up to 30 kg N ha-1 without fertilization and irrigation, depending mainly on the air temperature after the harvest of main rice.
According to the simulations under locally typical managements, BNF and ratoon rice contributed 4-33% and 3-23% of N supply from the soil, respectively, during the main rice season. With respect to N uptake in the main rice, BNF contributed 3-29% of it, but the contribution of ratoon rice was 6% or less, presumably because of N immobilization induced by decomposition of ratoon rice of previous season. Contribution of BNF to soil N supply as well as main rice N uptake was the lowest at the paddy-upland rotation site.
Under the locally typical managements, BNF was contributing 0.8-7.5% of the organic N pool in 0-30cm soil layer. Ratoon rice was working to save N loss by reducing N leaching, contributing 0.2-3.3% of the soil organic N pool. Combined together, the contribution of BNF and ratoon rice to soil organic N pool was estimated to be 238 kg N ha-1 (2.0%) for a peat soil, and 253-526 kg N ha-1 (4.5-9.9%) for the other soils.
Above analyses are inevitably influenced by the uncertainties in simulations. The ratoon rice growth model was calibrated against the site-specific monitoring data, but the BNF model was calibrated against one set of literature data only. Therefore, the BNF model may need further calibration and validation to assure these results, although the agreement between measured and simulated soil N supply supports the relevance of simulated N2 fixation.
The analyses in this study were limited to the 6 sites in 4 prefectures, while there are 47 prefectures in Japan, and over 200 soil series groups are recognized under its rice paddies according to the SolphyJ database [16]. Thus, we presented the results of case studies that do not represent the statistical average or range over the total rice paddies in Japan. For analyses of wider scale, further works will be required to improve and validate the models’ applicability.
Author Contributions
Conceptualization, T.F.; methodology, T.F.; software, T.F.; investigation, S.K., Y.O., N.T., M.K., R.H., H.H., R.K. and K.O.; data curation, S.K., Y.O., N.T., M.K., R.H., H.H., R.K. and K.O.; writing—original draft preparation, T.F.; writing—review and editing, T.T. and N.K.; project administration, Y.T.; funding acquisition, Y.T. All authors have read and agreed to the published version of the manuscript.
Funding
This research was supported by the Research and implementation promotion program through open innovation grants (JPJ011937) from the Project of the Bio-oriented Technology Research Advancement Institution (BRAIN).
Data Availability Statement
Full data from the field monitoring in 2023 and 2024 (main rice and ratoon rice growth as well as soil N supply during the field incubation) are available as the Supplementary Material.
Conflicts of Interest
The authors declare that the research was conducted in the absence of any commercial or financial relationships that could be construed as a potential conflict of interest.
Abbreviations
The following abbreviations are used in this manuscript:
| BNF | Biological Nitrogen (N2) Fixation |
Appendix A. Construction, Modification and Calibration of the DNDC-Rice Model
Appendix A.1. Modeling of SOC Decomposition
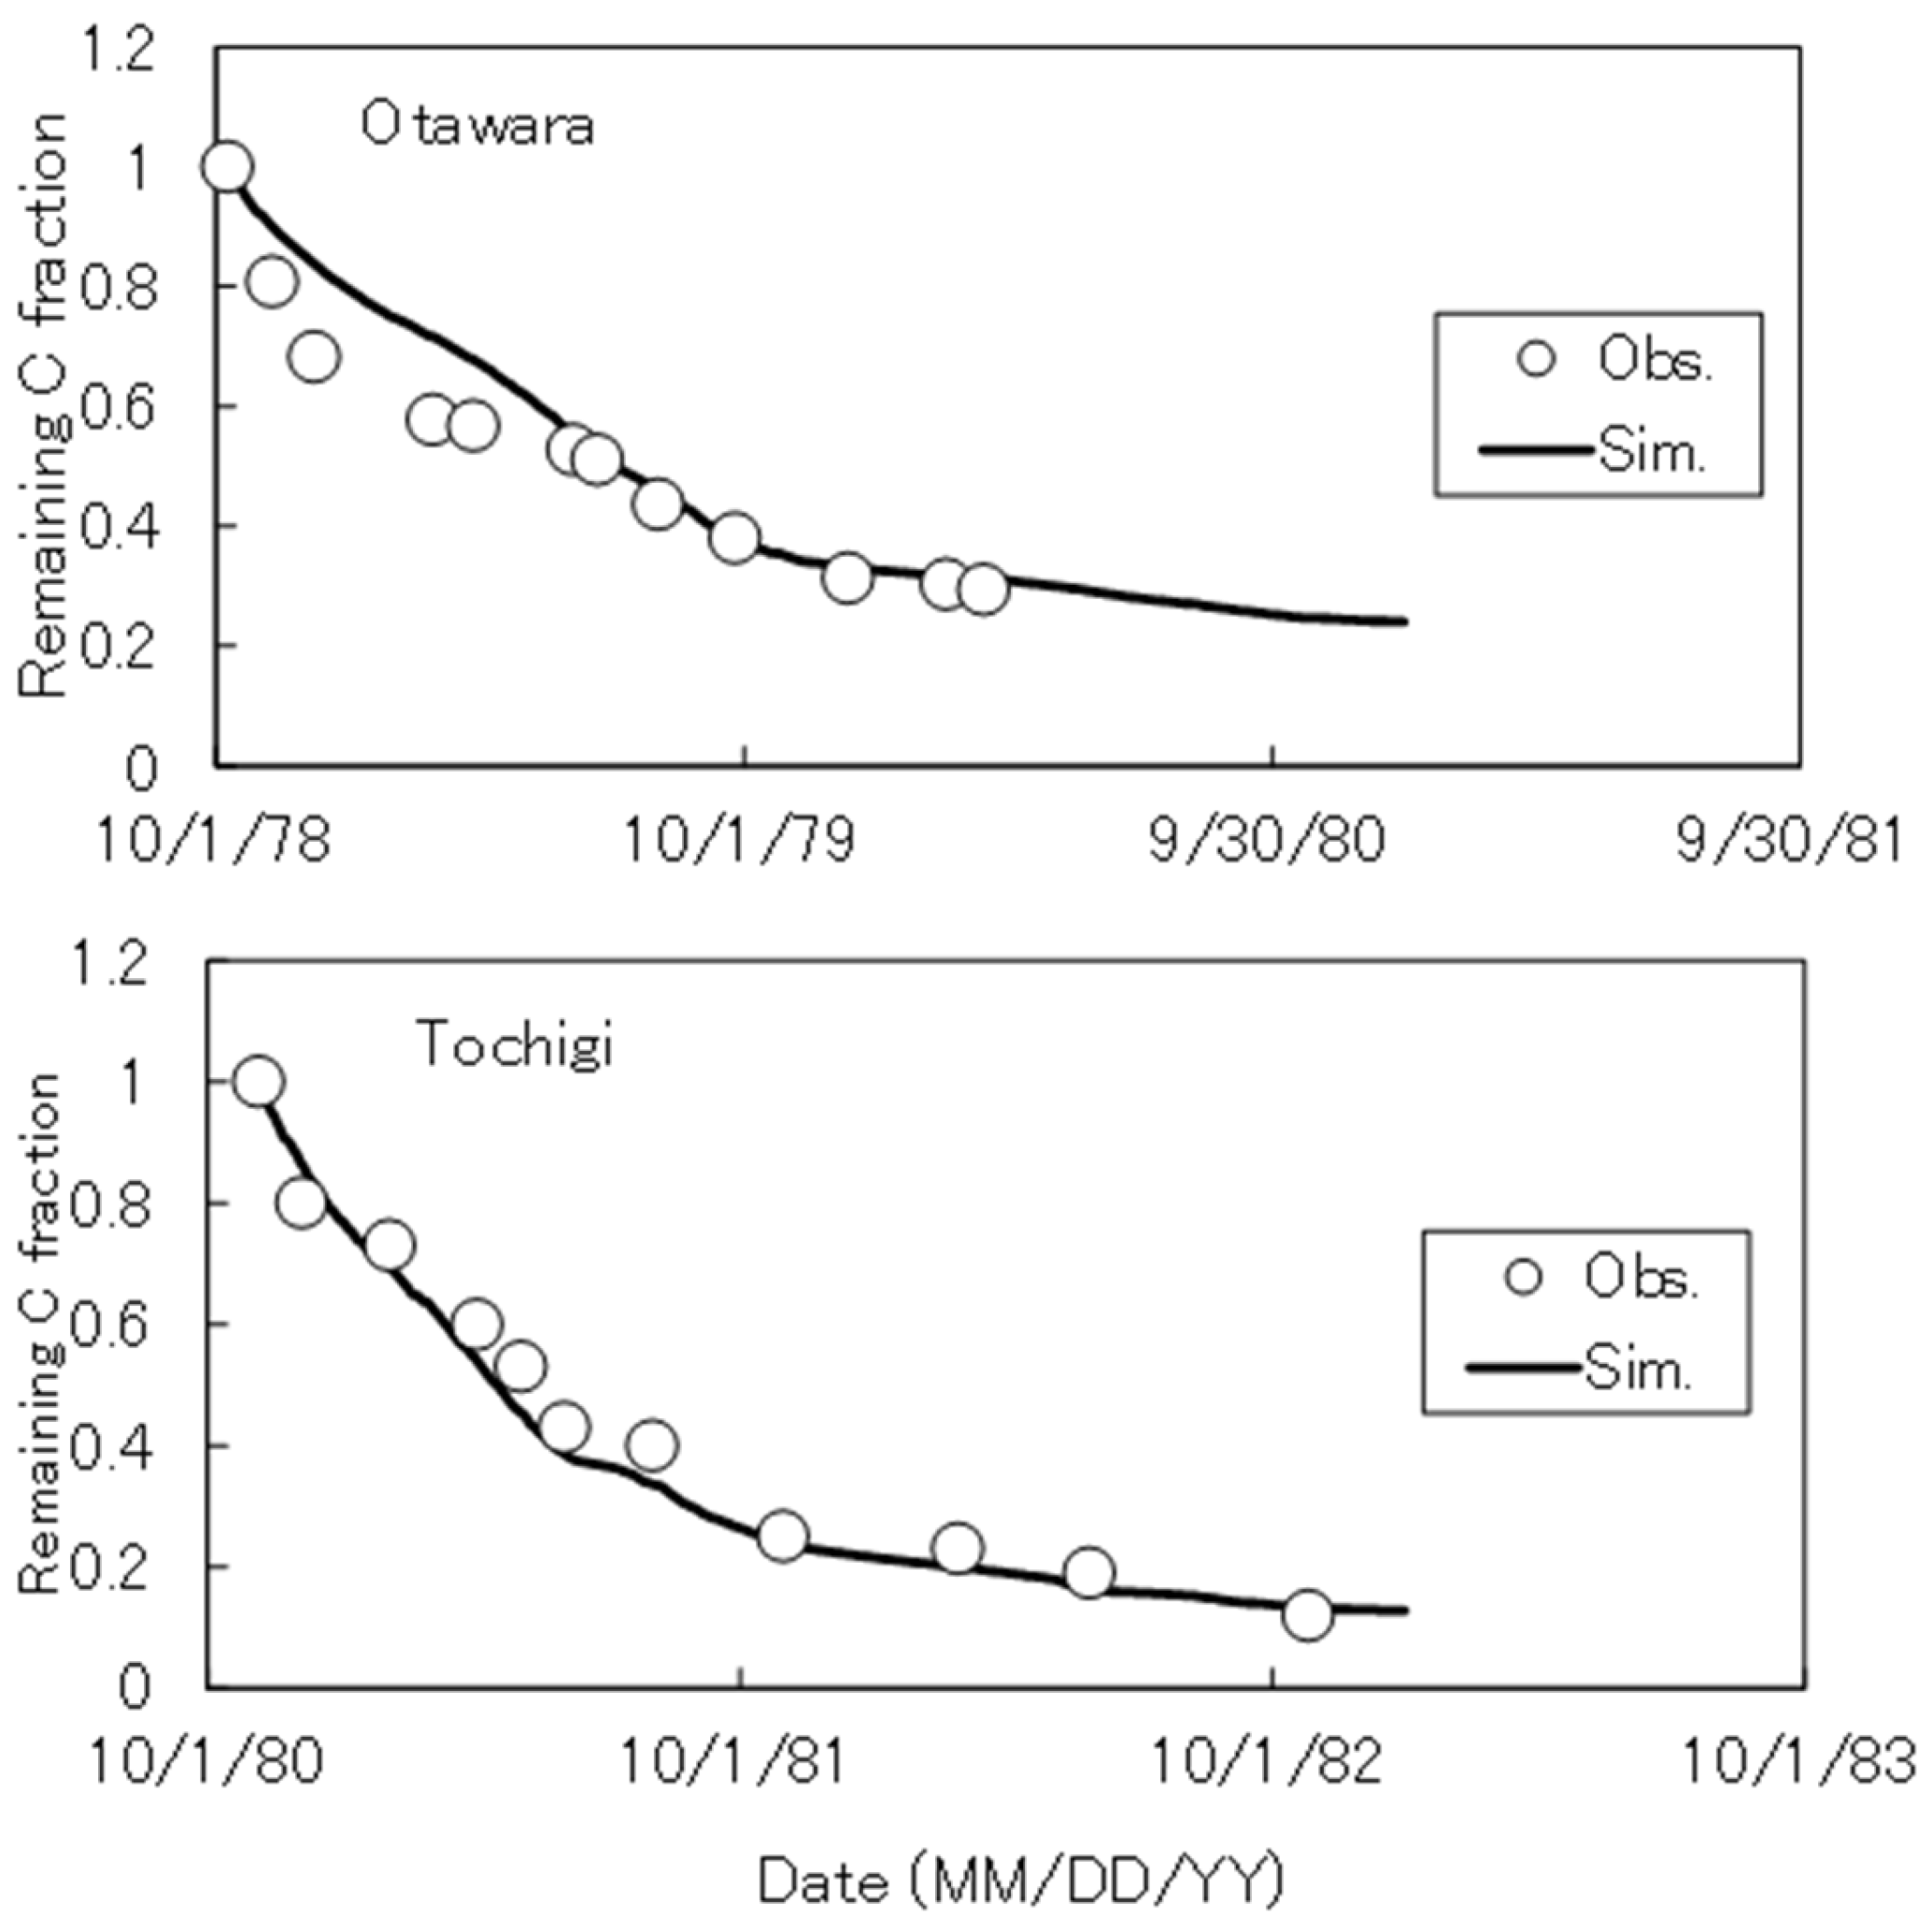
Similarly to the original DNDC model, DNDC-Rice divides soil organic matters into 4 pools with specific C/N ratios and decomposition rates (i.e. plant residues, microbial biomass, humads, and passive humus), including labile and resistant components within the pools (Fig. S1). This scheme follows the NCSOIL model[29], and the individual parameters were partly revised or added in this study and earlier works[4]. As shown in Fig. S1, decomposed organic C is assumed to turn into CO2, dissolved organic C (DOC) or next organic C pools at a fixed ratio. Depending on the N balance between the previous and new C pools, net N mineralization or immobilization occurs. Table S1 shows the C/N ratio and the specific decomposition rate (SDR) of each organic C pool, and Table S2 summarizes the functions to simulate organic C decomposition. As shown in Fig. S2, the SDR of labile and resistant residues were calibrated to reproduce published data of rice straw decomposition monitored at 2 paddy sites in central Japan[30,31].
Figure A1.
Schematic diagram of decomposition of soil organic matters in DNDC-Rice. Figures in the diagram indicate the ratio to partition decomposed organic C.
Figure A1.
Schematic diagram of decomposition of soil organic matters in DNDC-Rice. Figures in the diagram indicate the ratio to partition decomposed organic C.
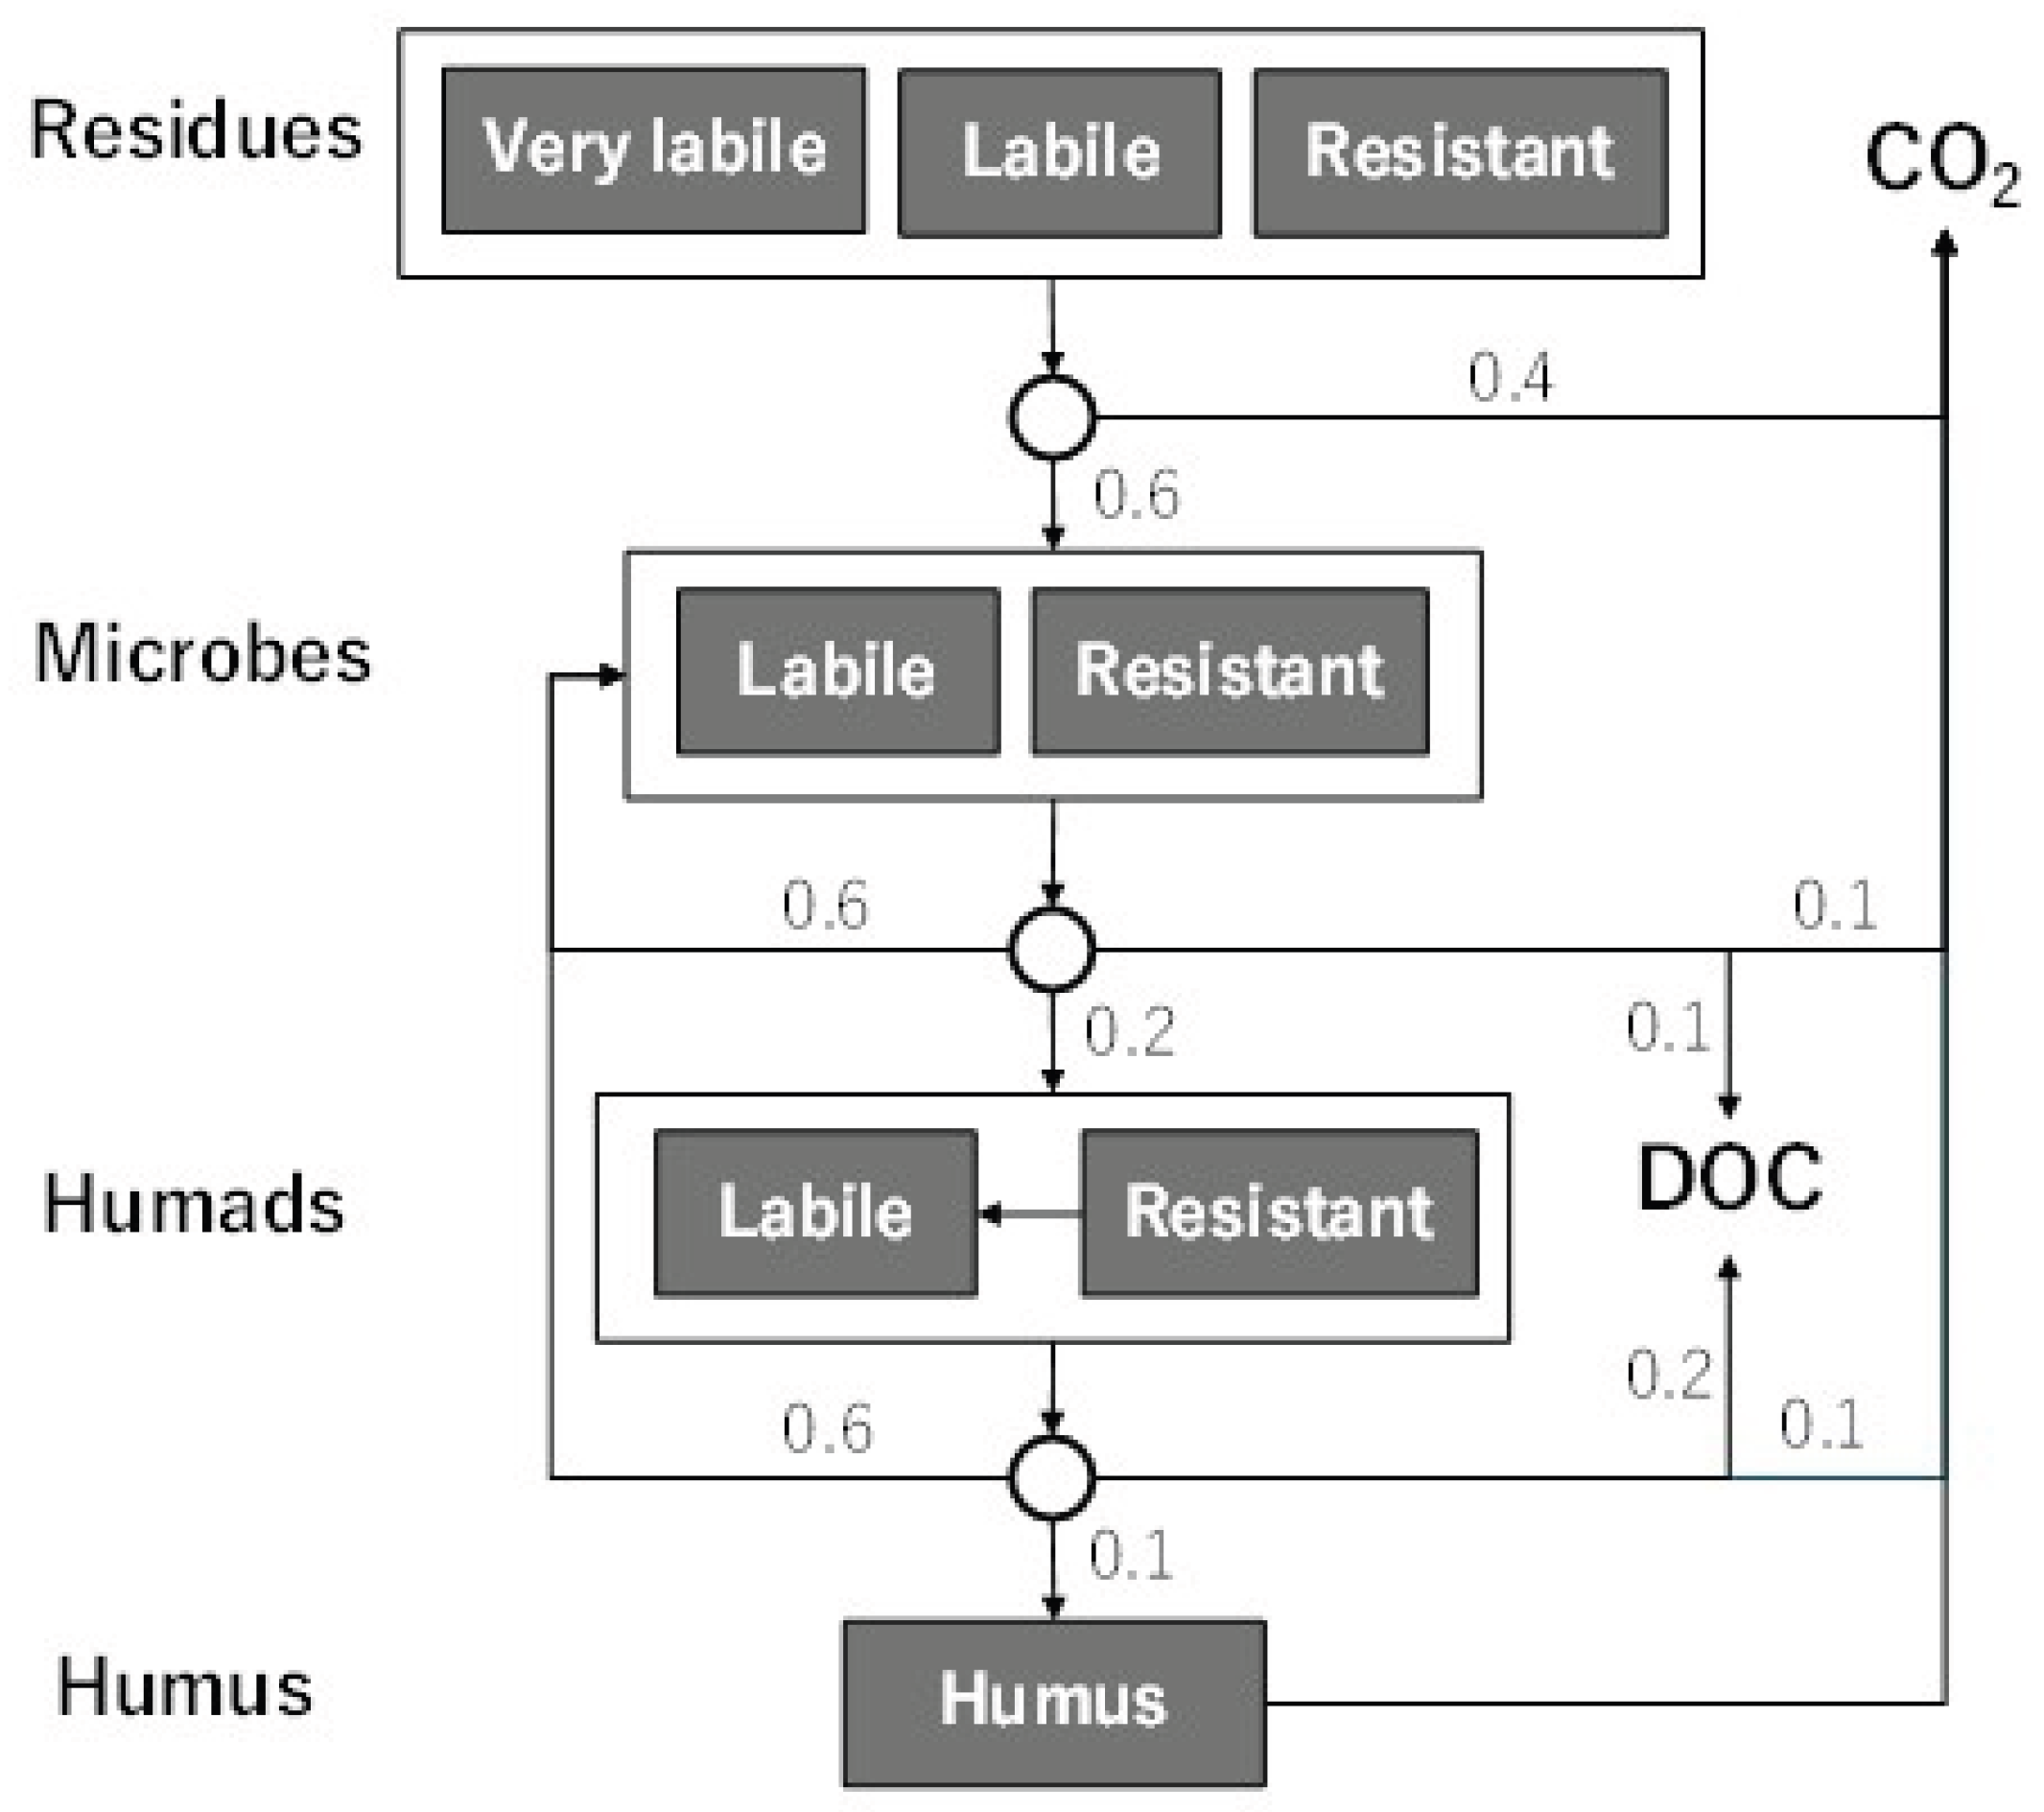

Table A1.
C/N ratio and the specific decomposition rate (SDR) of the soil C pools in DNDC-Rice.
| Pool | C/N | SDR (day-1) | |
| Residues | Very labile | 5 | 0.375 |
| Labile | 60 | 0.105 | |
| Resistant | 200 | 0.00675 | |
| Microbial biomass | Labile | 6 | 0.594 |
| Resistant | 6 | 0.072 | |
| Humads | Labile | 6 | 0.288 |
| Resistant | 6 | 0.0108 | |
| Humus | 11.3 | 0.000274 | |
| SDR values in italics were adjusted in this study. | |||
Table A2.
Functions to simulate organic C decomposition.
| Function | Equation | Reference |
| Decomposition of C pools | ||
|
fT = effect of soil temperature fM = effect of soil moisture fN = effect of N deficiency fO2 = effect of O2 concentration ftill = effect of tillage |
[4] | |
| (for residues) | [32] | |
| clay = soil clay content (%) |
Figure A2.
Observed and simulated rice straw decomposition at 2 paddy sites in Japan.
Appendix A.2. Modeling of Compost Decomposition
Considering the mineralization of different types of composts applied in the field experiments, we divided composts into 2 groups: slower decomposing ones (cattle manure and rice straw composts) and faster decomposing ones (chicken manure and swine manure composts), then constructed different functions to estimate their organic C compositions (Table A3).
As shown in Fig. A3, organic C composition of cattle manure and rice straw composts was estimated from the C/N ratio, based on published data of chemical analyses of cattle manure composts [33] and rice straw composts[34]. From these analyses, we derived the total fiber content (mainly hemicellulose, cellulose and lignin) as well as the hemicellulose and cellulose content in the compost samples. Comparing with the organic C pools in the DNDC-Rice model, we recognized hemicellulose and cellulose as the labile residue, and lignin as the resistant residue. The non-fibrous fraction of compost was regarded as the microbial biomass and humads.
The labile residue fraction in compost was approximated by a logarithmic function fitted to the measured hemicellulose and cellulose fraction (Fig. A3). Then, remaining C in the compost was partitioned into the resistant residue (C/N = 200) and the non-fibrous fractions (C/N = 6) according to the compost’s C/N ratio. As no measured data were available to further partition the non-fibrous fraction, it was provisionally assumed to consist of 50% microbial biomass and 50% humads.
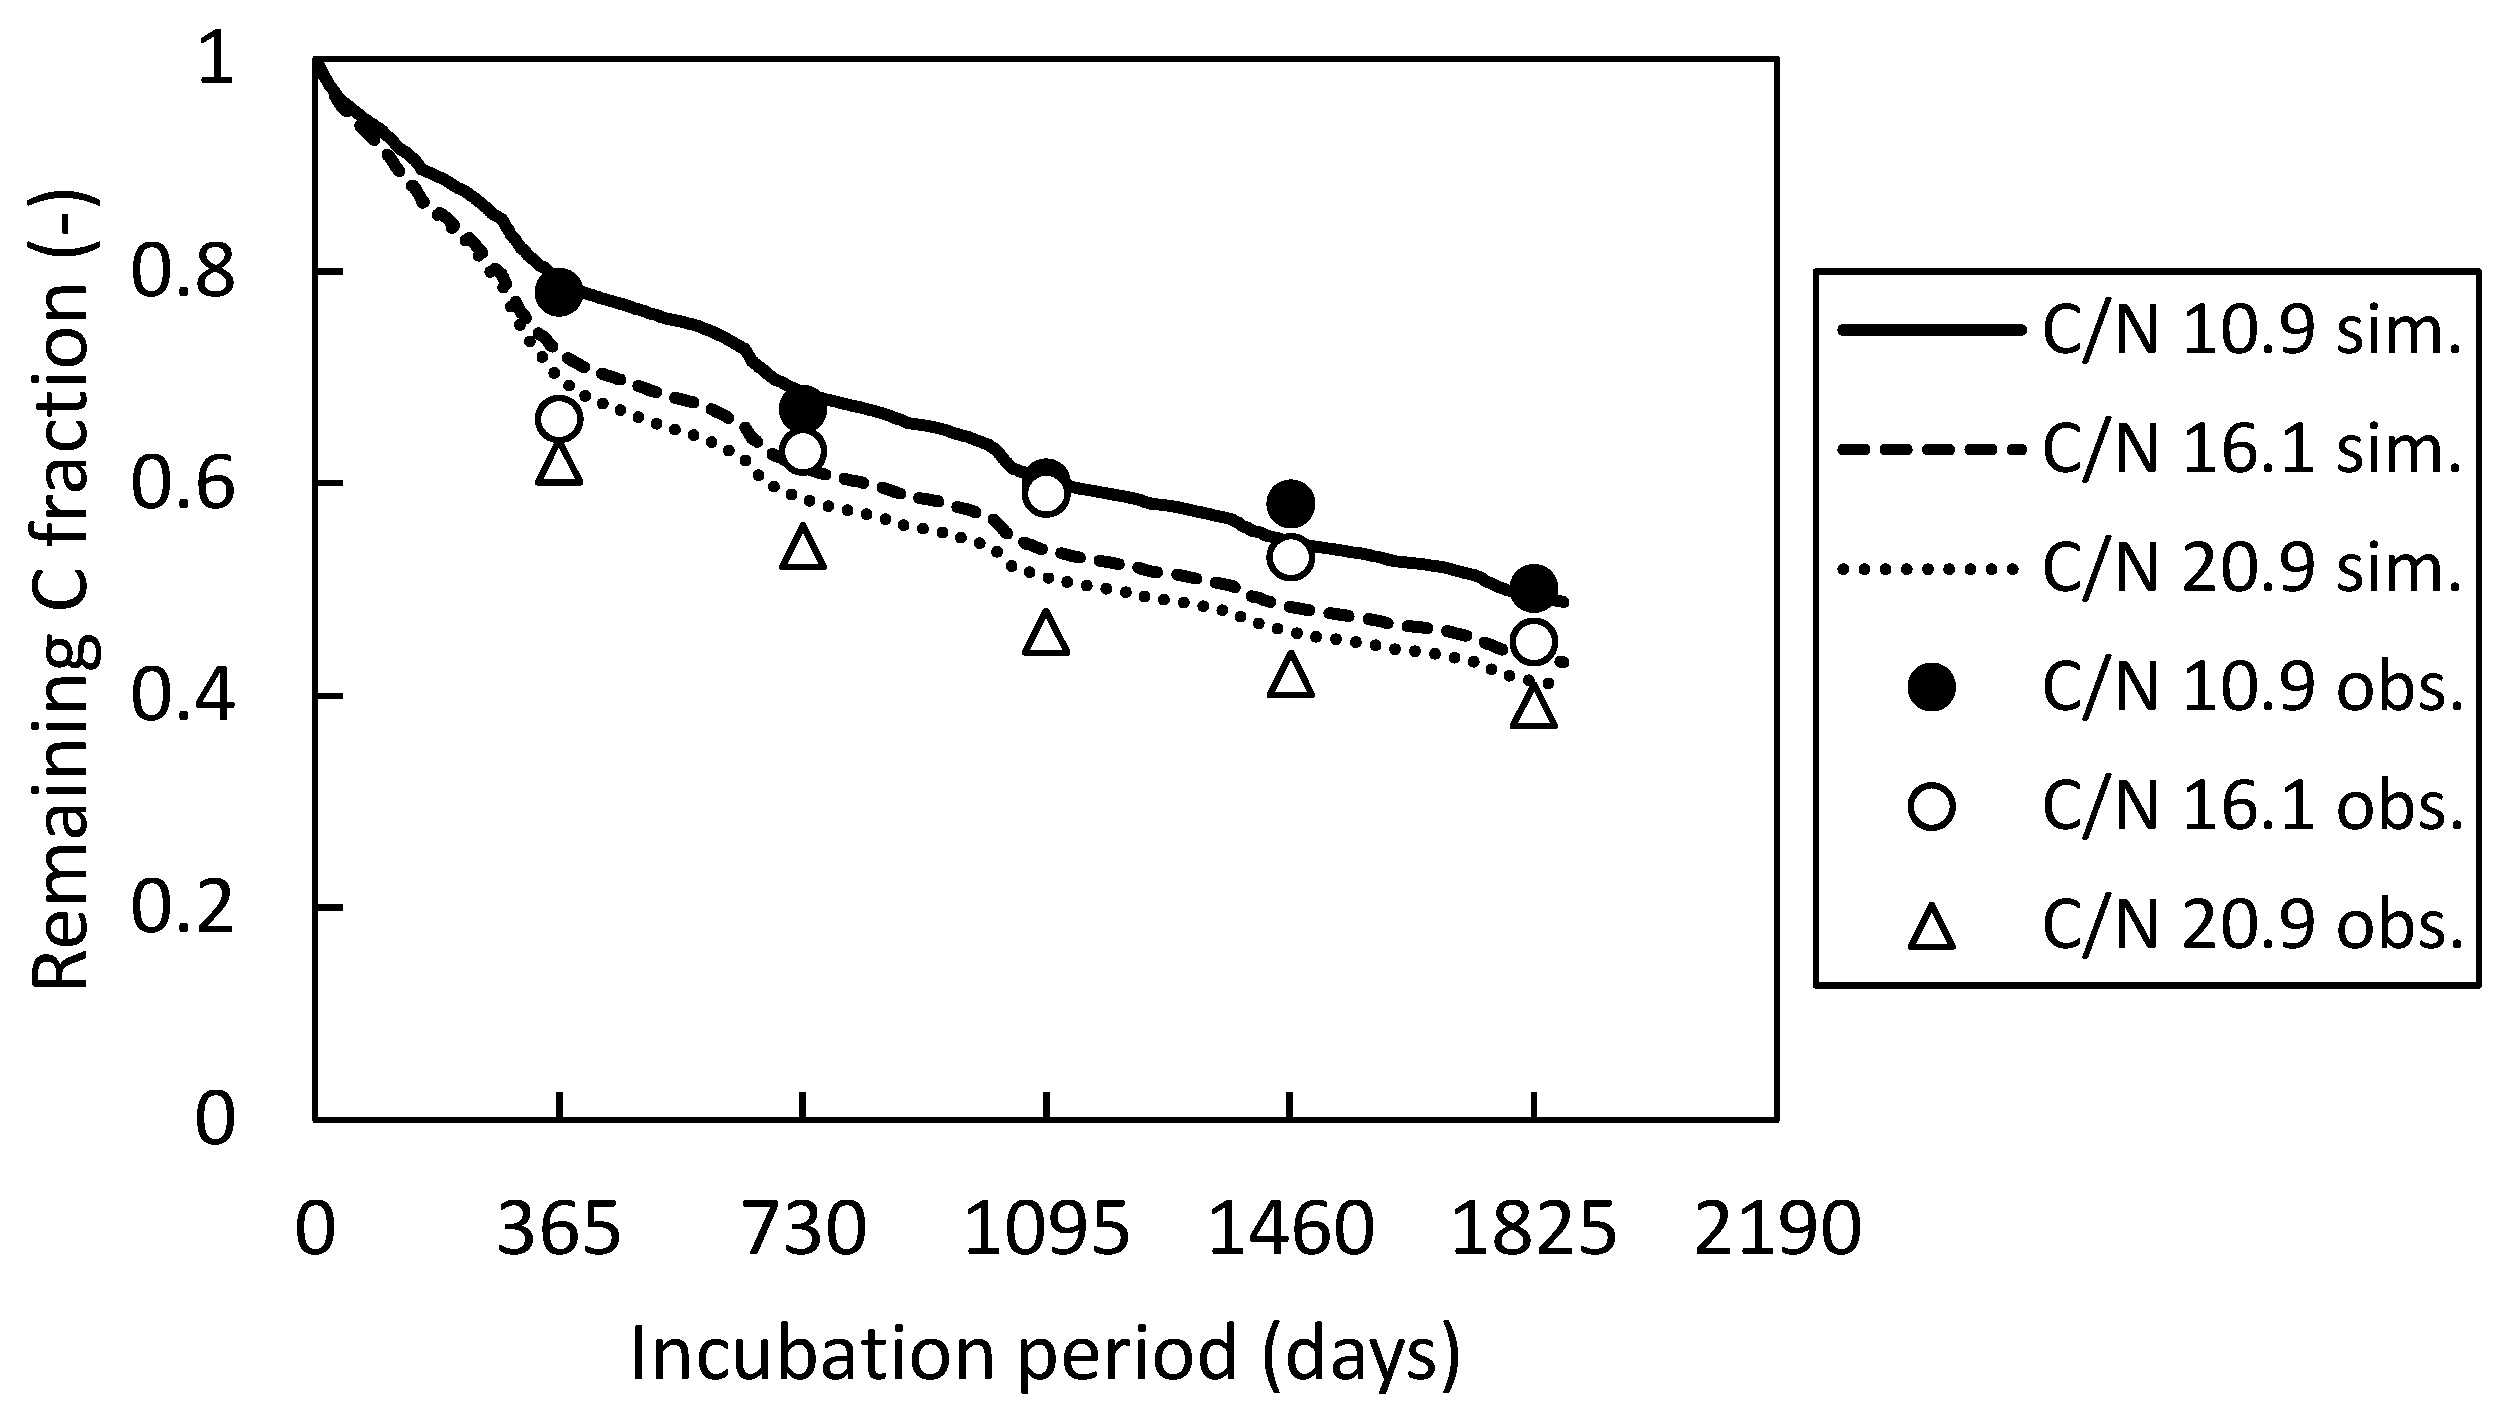
As shown in Fig. A4, the SDRs of humads and microbial biomass were adjusted by a single factor (keeping the original ratios between them) to reproduce the 5-year (1976-1981) decomposition data of 3 samples of rice straw compost with different C/N ratios published in a governmental report [35]. The RMSE of remaining C fraction after 5 years was 0.016 g g-1.
To reproduce the fast mineralization of chicken manure and swine manure composts, on the other hand, they were provisionally assumed to consist of very labile (C/N = 5) and labile (C/N = 60) residues, and partitioned into these 2 fractions according to their C/N ratio.
Table A3.
Functions to partition compost into organic C fractions.
| Variable | Equation |
| Compost C/N ratio | 6≦x≦40 |
| Cattle manure or straw compost | |
| Labile residue fraction | |
| Non-fibrous fraction | |
|
r0 = N/C ratio of compost (1/x) r1 = N/C ratio of non-fibrous fraction (1/6) r2 = N/C ratio of resistant residue fraction (1/200) r3 = N/C ratio of labile residue fraction (1/60) | |
| Resistant residue fraction | |
| Humads and microbial biomass fractions | |
| Chicken or swine manure compost | |
| Labile residue fraction | |
|
r0 = N/C ratio of compost (1/x) r3 = N/C ratio of labile residue fraction (1/60) r4 = N/C ratio of very labile residue fraction (1/5) | |
| Vary labile residue fraction |
Figure A3.
Relationships between the C/N ratio and organic C fractions of cattle manure compost (CaMC) and rice straw compost (RSC) samples. The functions for labile residue and total residues were fitted to these data.
Figure A3.
Relationships between the C/N ratio and organic C fractions of cattle manure compost (CaMC) and rice straw compost (RSC) samples. The functions for labile residue and total residues were fitted to these data.
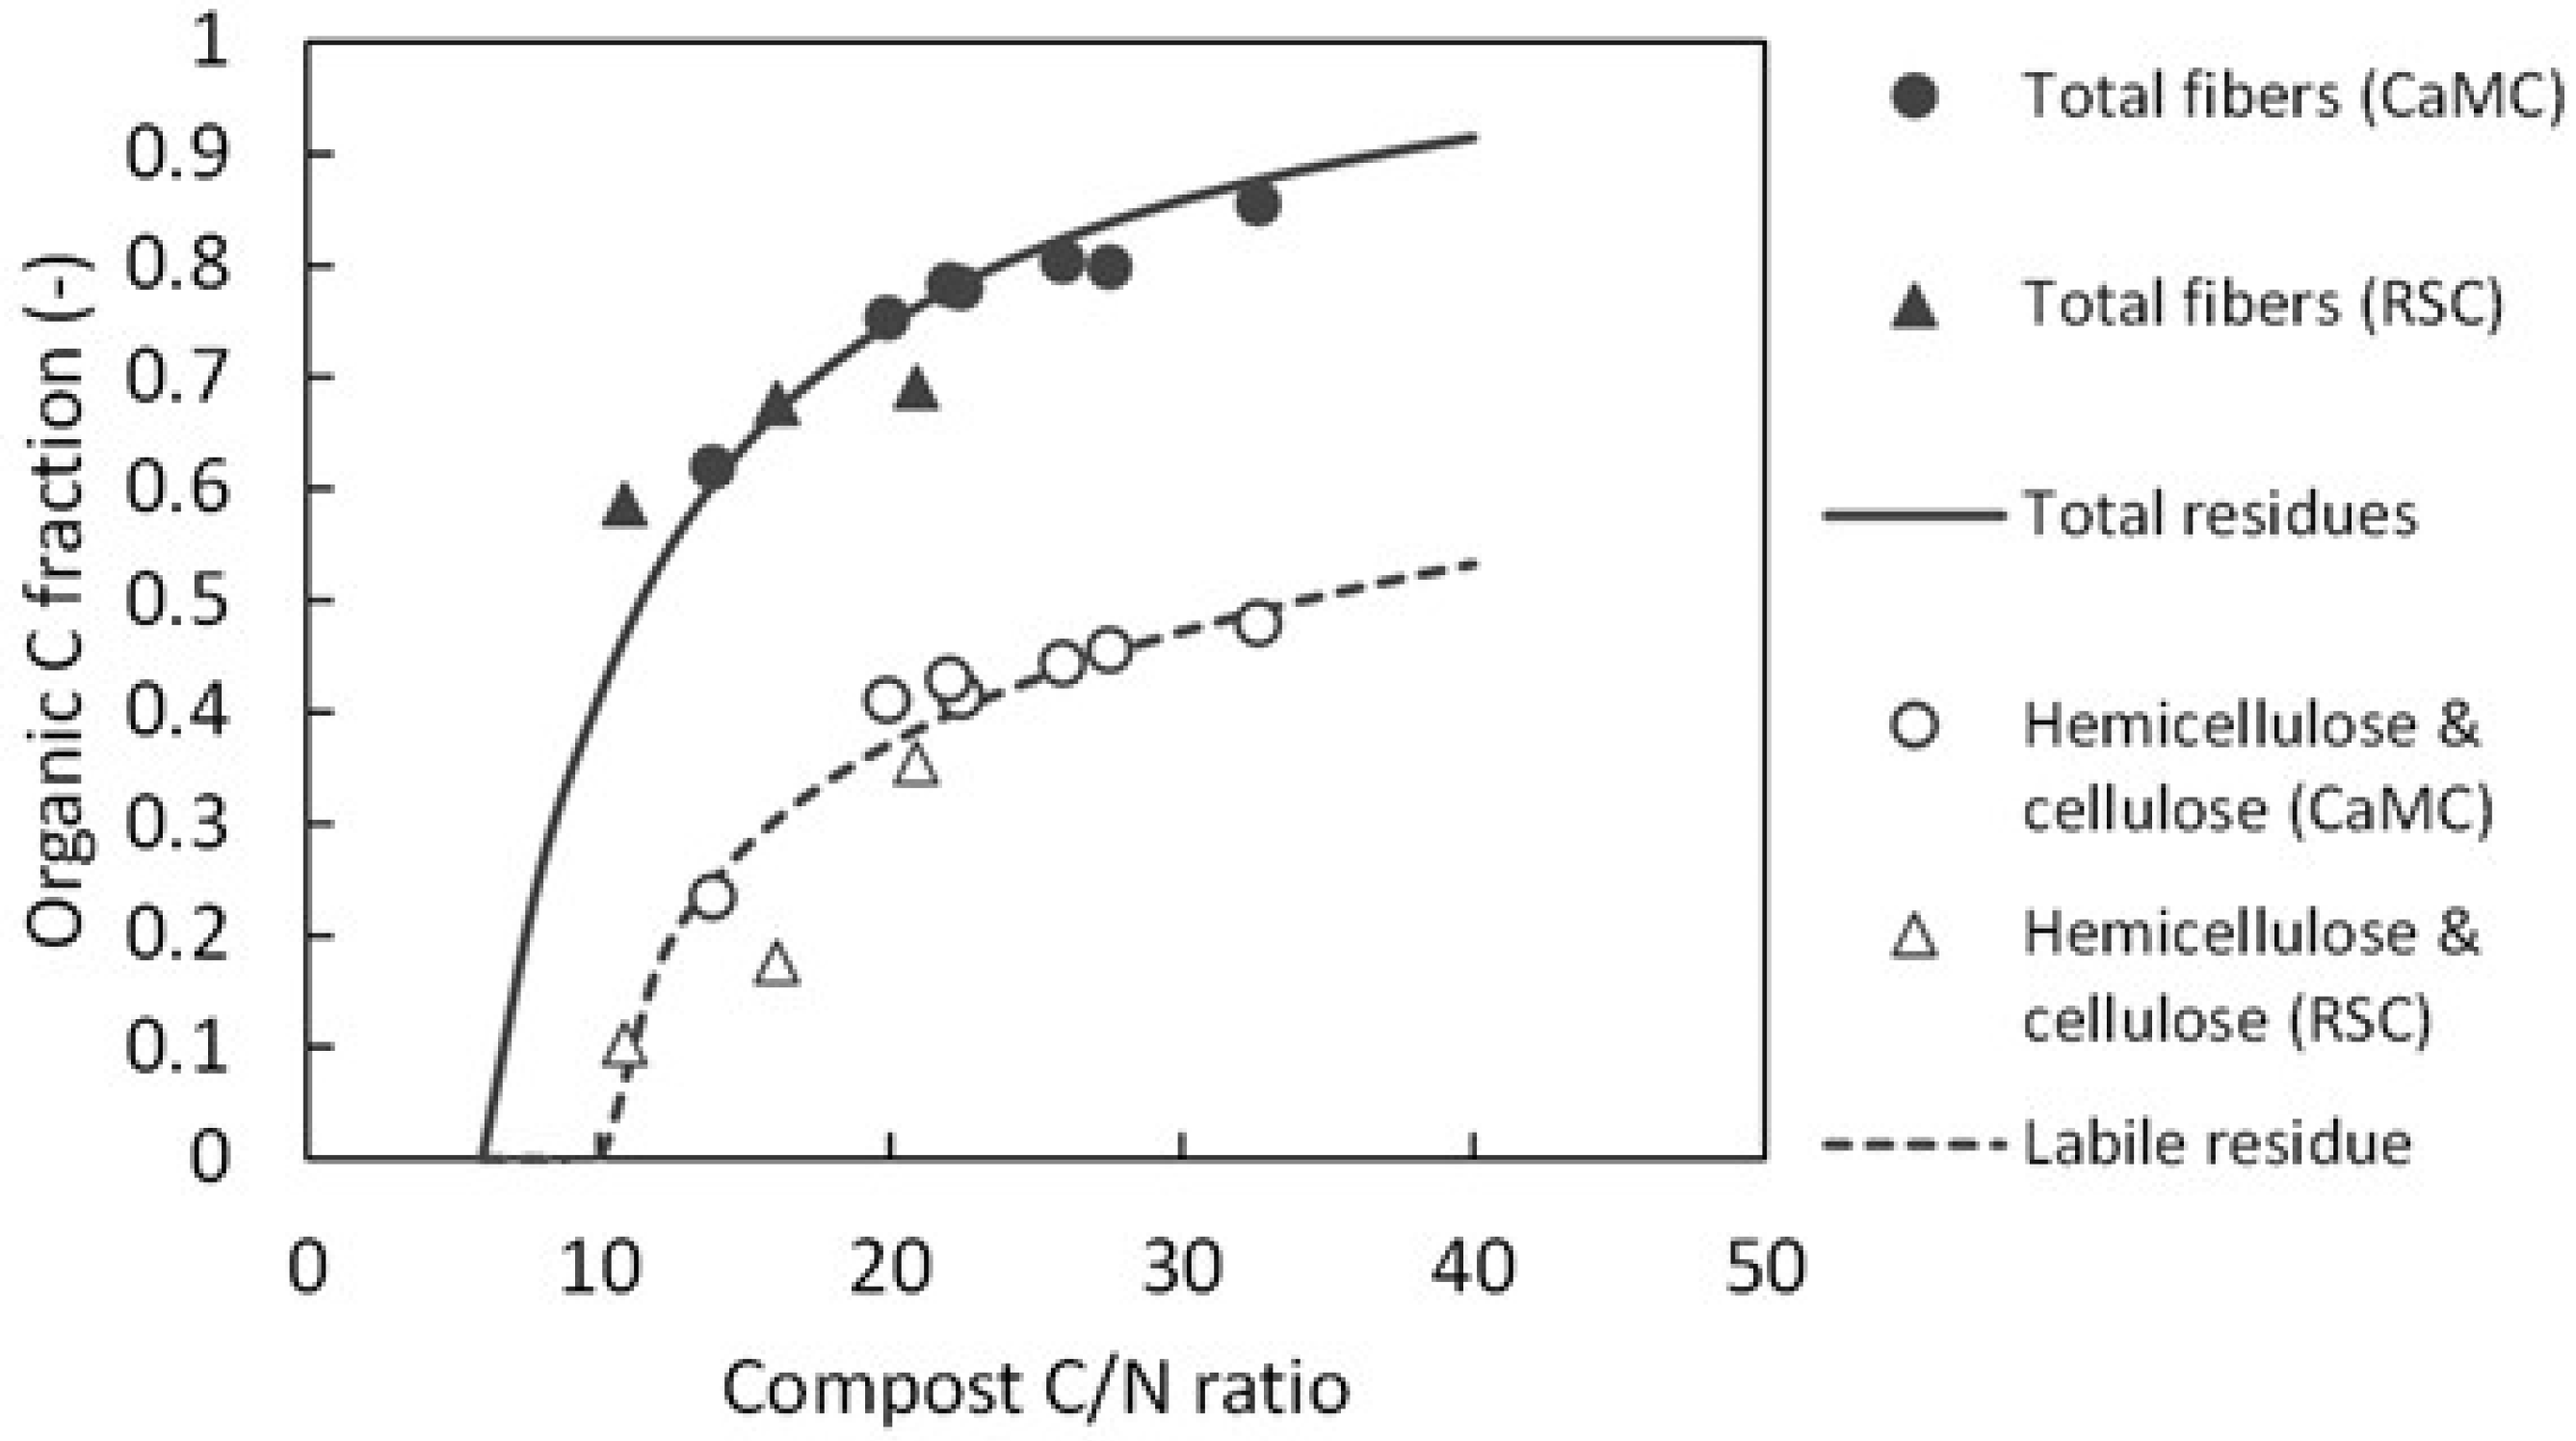
Figure A4.
Decomposition of rice straw composts with different C/N ratios observed at a paddy site in Japan and simulated by the DNDC-Rice model.
Figure A4.
Decomposition of rice straw composts with different C/N ratios observed at a paddy site in Japan and simulated by the DNDC-Rice model.
Appendix A.3. Modeling of Biological N2 Fixation
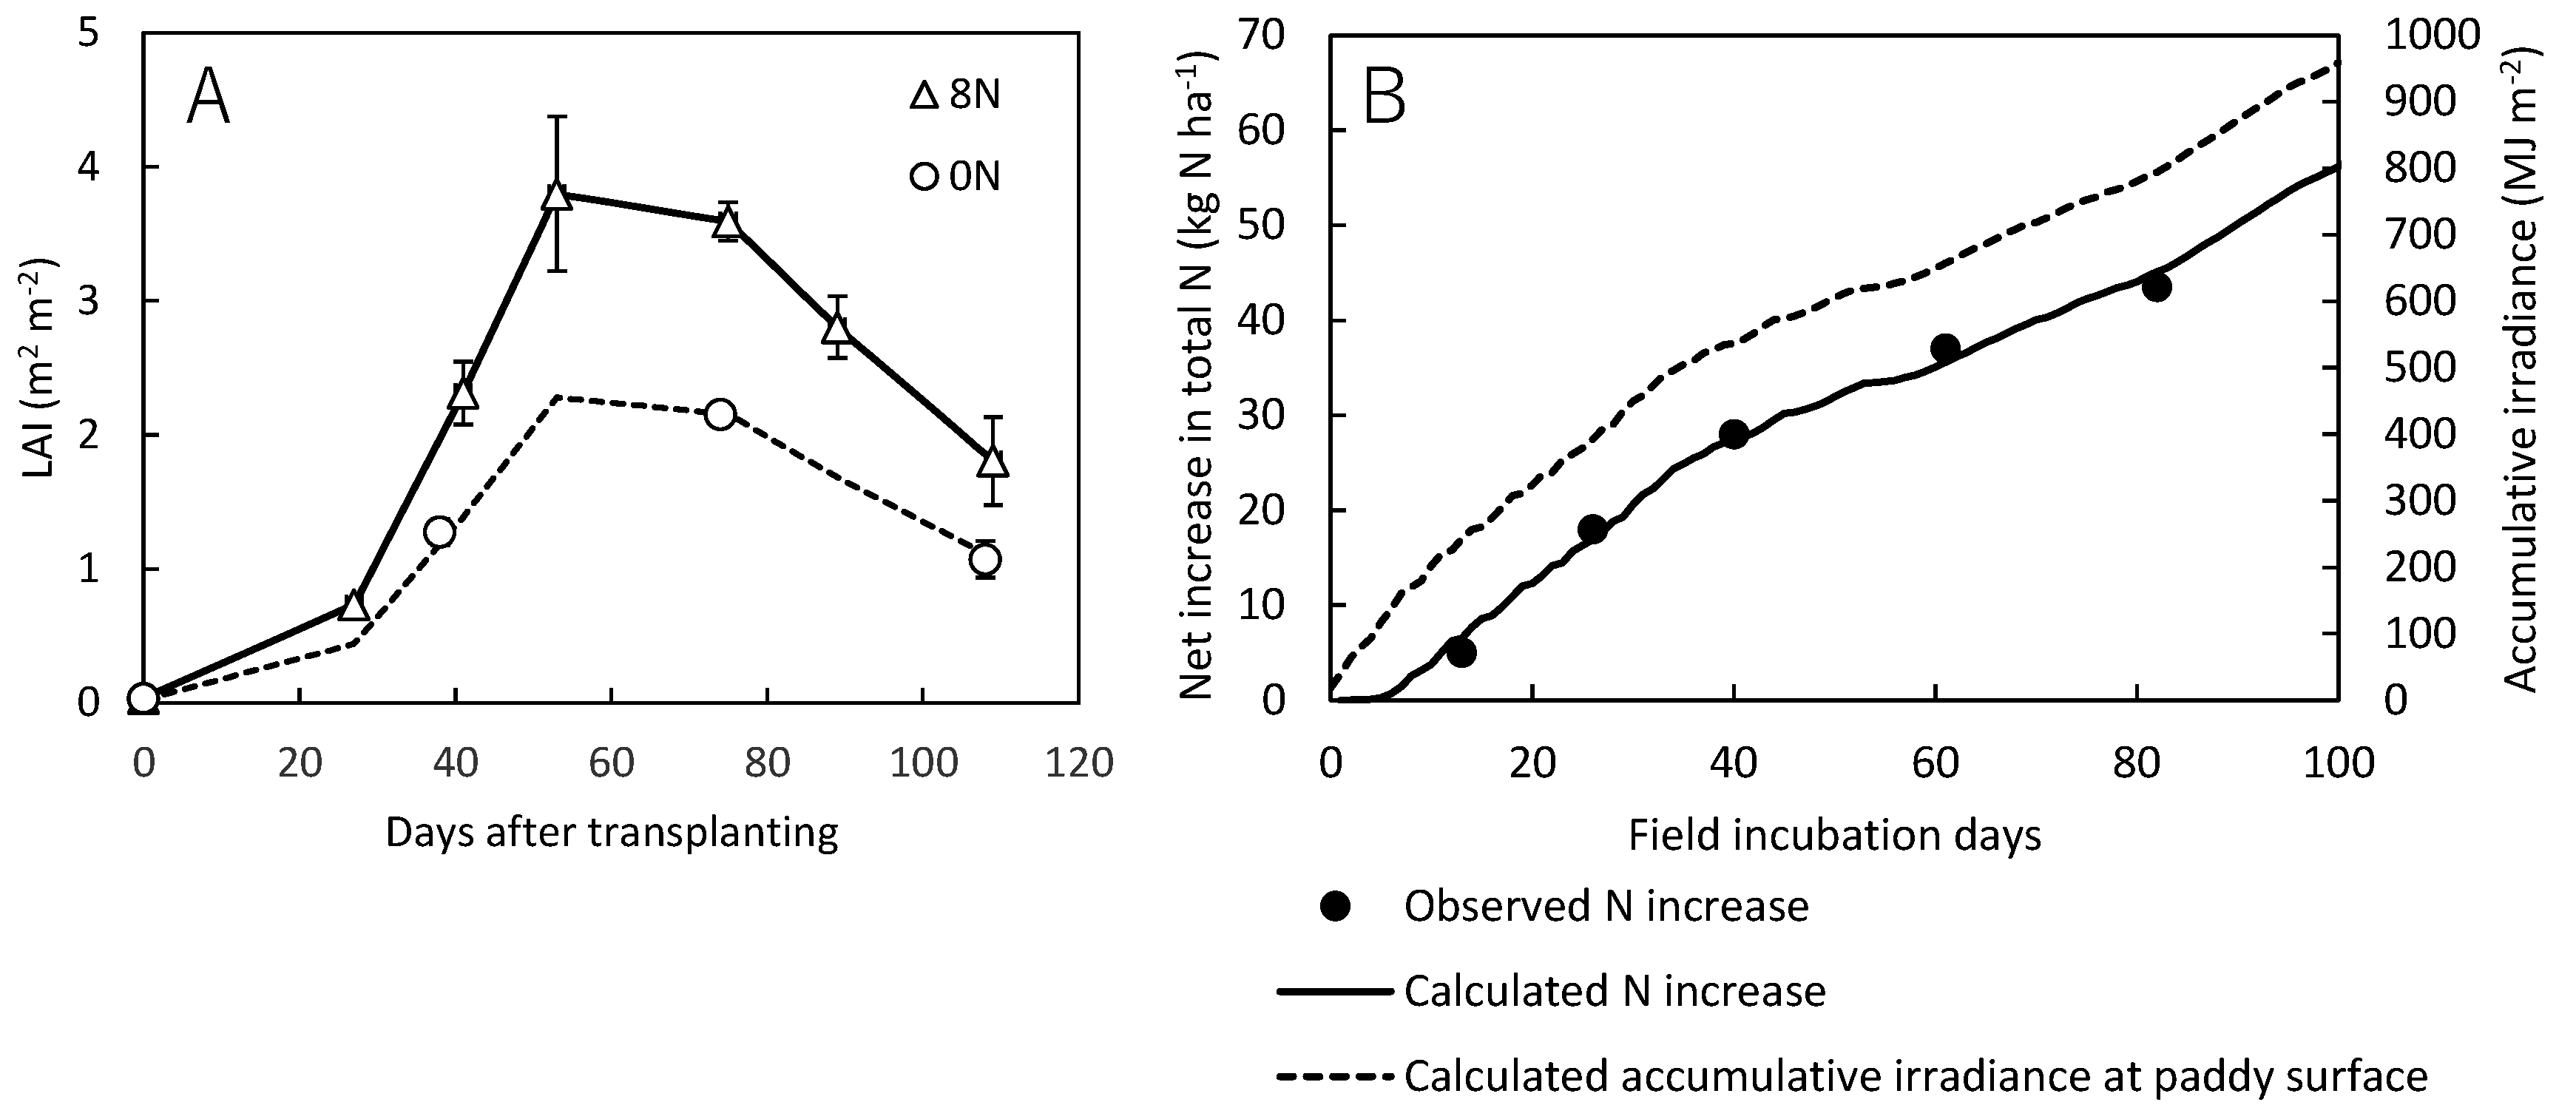
To simulate BNF in paddy soils, this study hypothetically assumed photosynthetic autotrophs as the N fixers that grow only under flooded conditions fixing N2 and CO2 at a constant ratio depending on light energy. Table A4 shows parameters, variables and equations of the BNF model developed in this study, where N2 fixation rate by unit mass of N2 fixers is determined by light energy available for unit mass of N2 fixers. Irradiance at paddy surface, which is required to calculate N2 fixation, is not usually measured or provided in meteorological databases open to the public. To run the BNF model, therefore, irradiance at paddy surface was calculated from the solar radiation and the leaf area index (LAI) according to Hasegawa[36].
Two parameters of the BNF model (VNmax and KN) were optimized to reproduce net N2 fixation observed by Hayashi et al. [15]on a paddy soil in Tsukubamirai, Japan. They conducted field incubation of submerged soil columns (62 mm in inner diameter) at the plot without N fertilizer application (0N plot) of the study site equipped with a free-air CO2 enrichment (FACE) facility. The change in total N of the uppermost 1 cm soil layer was measured for 82 days in rice growing season. Although they measured N2 fixation under both ambient and elevated CO2 concentration (913 ppm in average), this study employed only the data (average of 4 replicates) under ambient CO2 for the model calibration, thus presently not accounting for the effect of elevated CO2 on BNF.
At the same site, solar radiation was measured for the entire rice growing season of 2012[37]. After the transplanting in 2012, LAI of the rice cultivar Koshihikari was measured 6 times in the plot with fertilization of 8 g N m-2 (8N plot), but only 3 times in the 0N plot where N fixation was measured. To get LAI data as precise as possible, therefore, we interpolated LAI in the 0N plot by scaling that in the 8N plot by a factor of 0.6 (Fig. A5A). Based on the solar radiation and LAI in the 0N plot, irradiance at paddy surface was calculated for the rice growing season. For the 82 days of soil column incubation (May 28 to August 18), irradiance at paddy surface summed up to 794 MJ m-2 (Fig. A5B), whereas sum of solar radiation was 1513 MJ m-2. With these inputs of irradiance at paddy surface, VNmax and KN were optimized by the Downhill Simplex method [38] to minimize the root mean squared error (RMSE) of calculated N2 fixation, resulting in R2 of 0.991 (Fig. A5B).
The calibrated BNF model was built into DNDC-Rice model to calculate BNF during flooded period, based on input of solar radiation and simulated LAI. The C/N ratio of N2 fixers biomass was assumed to be 6.0 g g-1, referring to the ratio of total C increase to total N increase observed in the field soil incubation[15].
Table A4.
Functions to simulate biological N2 fixation in paddy soil.
| Function/variable/parameter | Unit | Equation | Reference |
| Maximum specific N fixation rate | g N g-1 N day-1 | VNmax =3.346 (optimized) | |
| Specific irradiance saturation constant | 10MJ g-1 N day-1 | KN =48.09 (optimized) | |
| Initial N of living N fixers | kg N ha-1 | NF0 = 0.0001 (fixed) | |
| Decay rate constant of living N fixers | day-1 | β = 0.01 (fixed) | |
| Solar radiation | MJ m-2 day-1 | I0 (Variable) | |
| Leaf area index | m2 m-2 | F (Variable) | |
| Irradiance at paddy surface | MJ m-2 day-1 | [36] | |
| k = 0.55 (fixed) | |||
| N of living N fixers | kg N ha-1 | NF (variable) | |
| Specific irradiance per N of living N fixers | 10MJ g-1 N day-1 | ||
| N fixation rate | kg N ha-1 day-1 | ||
| Daily change in N of living N fixers | kg N ha-1 day-1 |
Figure A5.
LAI of the rice cultivar Koshihikari in the 8N and 0N plots at the Tsukubamirai site in 2012. LAI in the 0N plot was fitted by scaling the LAI measured in the 8N plot (A). Observed and calculated total N increase (N2 fixation) during the soil incubation experiment in the 0N plot at the Tsukubamirai site in 2012. Calculated accumulative irradiance at the paddy surface is shown as well (B).
Appendix A.4. Modeling of Nitrification and Denitrification
To simulate nitrification in paddy soils, DNDC-Rice assumes autotrophic aerobic nitrification of dissolved NH3 [39,40]. Table A5 summarizes the functions to simulate nitrification. Hourly nitrification rate depends on temperature, pH, NH4+ concentration, soil O2, and nitrifiers biomass. In the nitrification process, fixed portion of nitrified N is assumed to be lost as NO and N2O.
When NH4+ has been oxidized to NO3-, it can be denitrified under anaerobic conditions. The denitrification model in DNDC-Rice (Table A6) follows that in DNDC [12,14] except that DNDC-Rice quantitatively tracks electron transfer in each reduction and oxidation process as described by Fumoto et al.[4]. The hourly specific growth rate of NOx denitrifiers is determined depending on NOx concentration, DOC concentration, temperature, and pH. Then, the model calculates the hourly rates of NOx reduction and DOC consumption required for growth and maintenance of denitrifiers biomass. To simulate emissions of NO, N2O and N2 from soil to atmosphere, hourly emission coefficient is calculated based on the clay content and air-filled porosity in the soil (Table A7).
Table A5.
Functions to simulate nitrification in soils.
| Function/variable/parameter | Unit | Equation | Reference |
| Temperature factor | -[12,14 | [14] | |
| Affinity constant for dissolved NH3 | mol L-1 | KNH3 = 26.0×10⁻⁶ | [39] |
| Dissolved NH3 concentration | mol L-1 | ||
| Maximum nitrification rate specific to nitrifiers biomass | g N g-1 C h-1 | μNIT = 1.68 | [41] |
| Nitrifiers biomass in soil | kg C kg-1 | BNIT (variable) | |
| Nitrification rate in soil | kg N kg-1 h-1 | ||
| [O2] = O2 concentration in soil water (mol L-1) [O2]max = O2 concentration in equilibrium with atmosphere (mol L-1) | |||
| Growth yield of nitrifiers | g C g-1 N | YNIT = 0.095 | [40] |
| Nitrifiers death rate | kg C kg-1 h-1 | [14] | |
| Net growth rate of nitrifiers biomass | kg C kg-1 h-1 | ||
| N/C ratio in nitrifiers | g N g-1 C | 0.29 | [12] |
| NH4 uptake for nitrifiers growth | kg N kg-1 h-1 | ||
| Nitrification-induced NO production | kg N kg-1 h-1 | 0.0025 fT RNIT | [14] |
| Nitrification-induced N2O production | kg N kg-1 h-1 | 0.0024 RNIT | [14] |
Table A6.
Functions to simulate denitrification in soils.
| Function/variable/parameter | Unit | Equation |
| Effect of temperature | - | |
| Effect of pH on NOx reduction | - | for NO3- |
| for NO2- and NO | ||
| for N2O | ||
| Effect of NOx concentration (kg N m-3) |
- | |
| Effect of DOC concentration (kg C m-3) |
- | |
| Maximum specific growth rate of denitrifiers on NOx | h-1 |
mNO3 = 0.67, m NO2 = 0.67, m NO = 0.34, m N2O = 0.34 |
| Specific growth rate of denitrifiers on NOx | h-1 | |
| Growth yield of denitrifiers on NOx | g C g-1 N | YNO3 = 0.401, YNO2 = 0.428, YNO = 0.151, YN2O = 0.151 |
| Growth yield of denitrifiers on DOC | g C g-1 C | YDOC = 0.503 |
| Maintenance coefficient of denitrifiers on NOx | g N g-1 C h-1 | MNO3 = 0.09, MNO2 = 0.0349, MNO = 0.0792, MN2O = 0.0792 |
| Maintenance coefficient of denitrifiers on DOC | g C g-1 C h-1 | MDOC = 0.0076 |
| Denitrifiers biomass in soil | kg C kg-1 | BDN (variable) |
| NOx reduction rate for growth and maintenance of denitrifiers | kg N kg-1 h-1 | |
| [N] = sum of NOx concentrations (kg N m-3) | ||
| Denitrifiers growth rate | kg C kg-1 h-1 | |
| Denitrifiers death rate | kg C kg-1 h-1 | |
| N/C ratio in denitrifiers | g N g-1 C | 0.29 |
Appendix A.5. Modeling of Growth of Main Rice and Ratoon Rice
DNDC-Rice, like other versions of the DNDC model, includes a relatively simple crop growth model that represents crop phenological stage with the Plant Growth Index (PGI), based on the effective temperature sum with the base temperature at 10 ℃ (TDD10). Another important crop specific parameter is the maximum N uptake that refers to how much N the crop absorbs under the optimal condition with ample N supply without any stress.
To calibrate parameters controlling biomass partitioning and leaf area development, we employed a 10-year monitoring dataset on the cultivar Koshihikari grown at a rice paddy site called “Mase” in central Japan (36º 03’ N, 140º 01’ E). The Mase site was established on a farmer’s rice field in 1999 for continuous measurements of energy and CO2 exchange fluxes by the eddy covariance methodology[42]. In each year, the cultivar Koshihikari was grown with locally typical managements. Along with the meteorology and flux measurements, rice plant was periodically (mostly every other week) sampled and analyzed for dry weight of each organ (root, stem, green leaf, dead leaf and panicle) and the leaf area index (LAI). For the period of 2001-2010, the average TDD10 from transplanting to harvest was 1644.0 (S.D. 94.2) ℃ days. Based on the dataset, we approximated following 3 parameters as functions of PGI (defined as PGI = TDD10/1644.0): biomass fraction of panicle (FPA), leaf/straw ratio (LSR), and specific leaf weight (SLW) (Fig. A6, Table A8).
Based on the findings on ratoon rice growth mentioned in the main text, we built a sub model in DNDC-Rice that simply relates N demand of ratoon rice to the effective temperature sum from the day of main rice harvest (Table A9). Similarly to the main rice, ratoon rice was assumed to terminate its growth at TDD10 of 1200 or 1600 ℃ days. In addition to N uptake from soil, this model calculates translocation of N and C from stubbles to ratoon. As only limited information was available to quantify what portion of stubble N and C can be translocated to ratoon, we provisionally assumed that 25% of stubble N at harvest can be translocated, referring to the literature data of nonstructural carbohydrate concentration (27-30%) in Koshihikari stubble[21]. Ten % of N and C in stems and leaves at harvest were assumed to be left as stubble N and C.
Figure A6.
Observed data and fitted functions of the panicle/aboveground ratio (A), the leaf/straw ratio (B) and the specific leaf weight (C) at the Mase rice paddy site for 2001-2010.
Figure A6.
Observed data and fitted functions of the panicle/aboveground ratio (A), the leaf/straw ratio (B) and the specific leaf weight (C) at the Mase rice paddy site for 2001-2010.
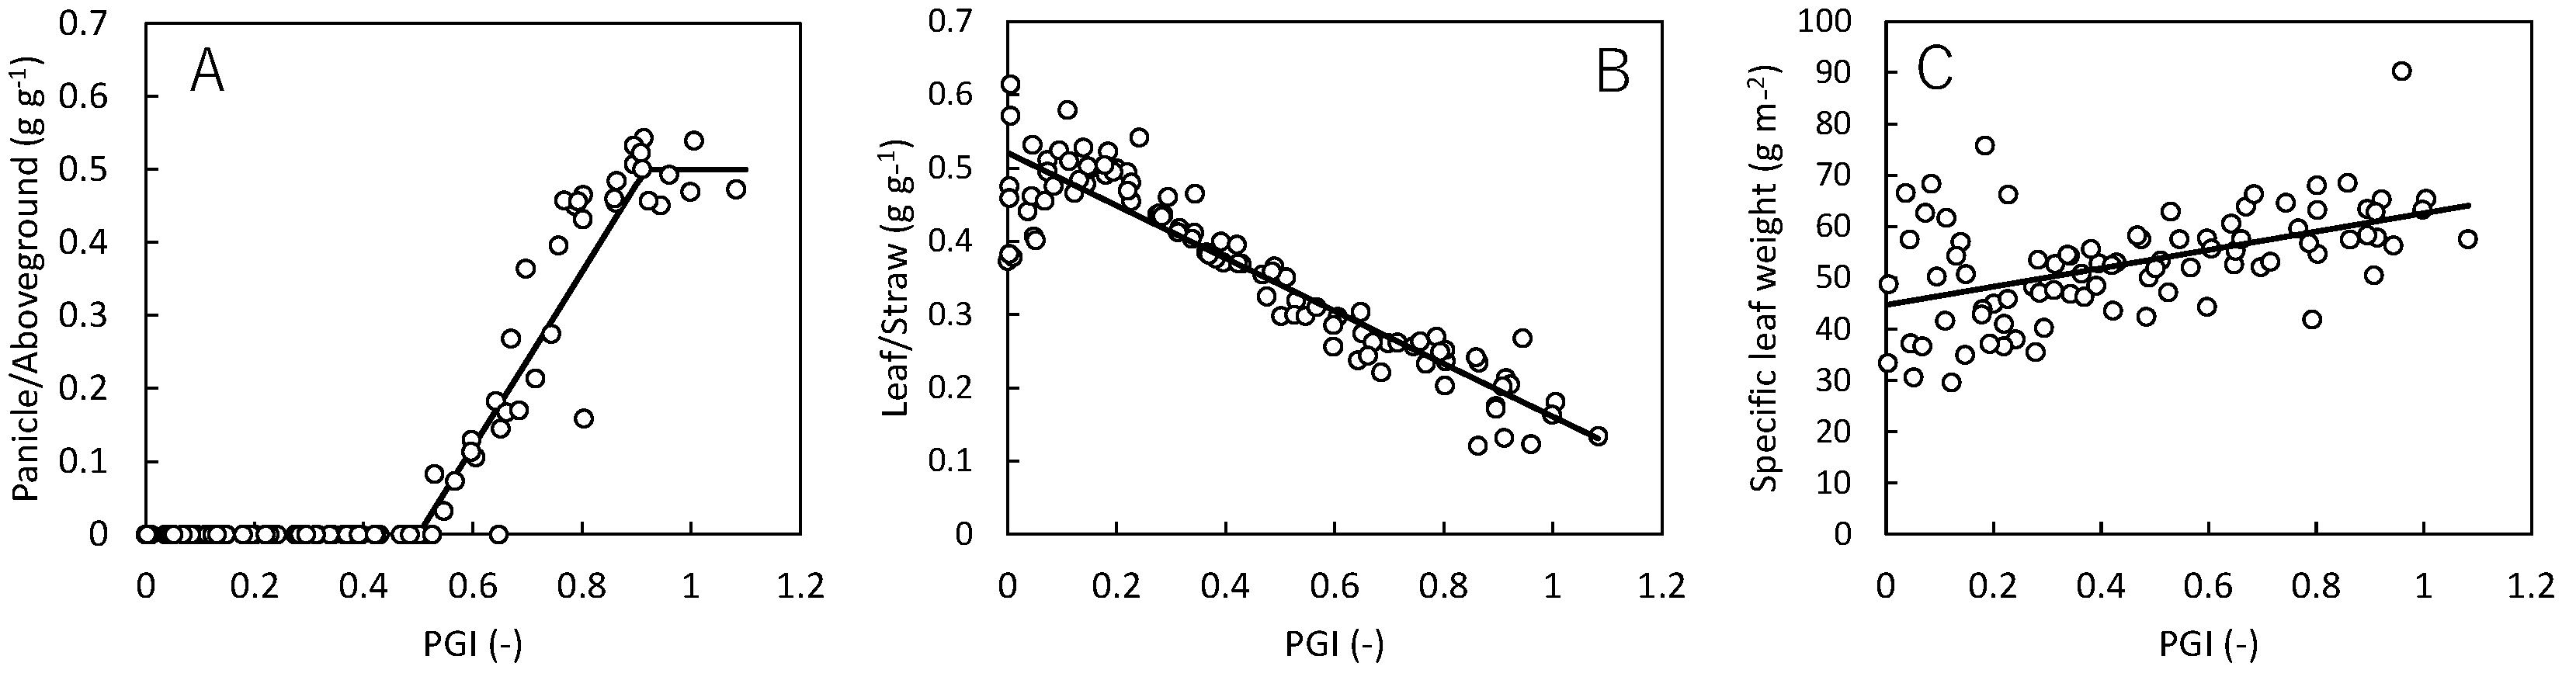
Table A8.
Functions to simulate main rice growth.
| Parameter/variable | Unit | Equation |
| Daily mean air temperature | ℃ | Ta (Variable) |
| Effective temperature sum from transplanting | ℃ days | |
| Effective temperature sum for maturity | ℃ days | TDD10max (Calibrated) |
| Plant growth index | - | |
| Maximum N uptake | kg N ha-1 | Nmax (Calibrated) |
| Daily demand for inorganic N | kg N ha-1 day-1 | , |
| C/N ratio of main rice | g g-1 | 50 |
| Biomass fraction of root | g g-1 | |
| Biomass fraction of panicle | ||
| Biomass fraction of straw | ||
| Leaf/straw ratio | g g-1 | |
| Specific leaf weight | g m-2 | |
| Rooting depth | m | |
Table A9.
Functions to simulate ratoon rice growth.
| Parameter/variable | Unit | Equation |
| Daily mean air temperature | ℃ | Ta (Variable) |
| Effective temperature sum from harvest | ℃ days | |
| Effective temperature sum for maturity | ℃ days | TDD10max = 1600 |
| Maximum N uptake by ratoon rice | kg N ha-1 | RNmax (Calibrated site specifically) |
| Daily demand for inorganic N | kg N ha-1 day-1 | , |
| C/N ratio of ratoon rice | g g-1 | 30 |
| Portion of stubble N translocated to ratoon | kg N ha-1 | |
| Nstubble = main rice stubble N at harvest (kg N ha-1) | ||
| Daily translocation of stubble N to ratoon | kg N ha-1 day-1 | |
| Daily translocation of stubble C to ratoon | kg C ha-1 day-1 | |
| Active root depth of ratoon rice | m | 0.2 |
Appendix A.6. Calibration of the Growth Model for Main Rice and Ratoon Rice
The parameters TDD10max and Nmax for main rice can be cultivar specific. Referring to the TDD10 from transplanting to harvest at each site, TDD10max was set at 1200 ℃ days for Nanatsuboshi (the HO1 and HO2 sites), and 1600 ℃ days for the other cultivars (at the AO3, NI4, SH5 and SH6 sites). Nmax was set at 150 kg N ha-1 for all cultivars, based on the highest value of measured N uptake.
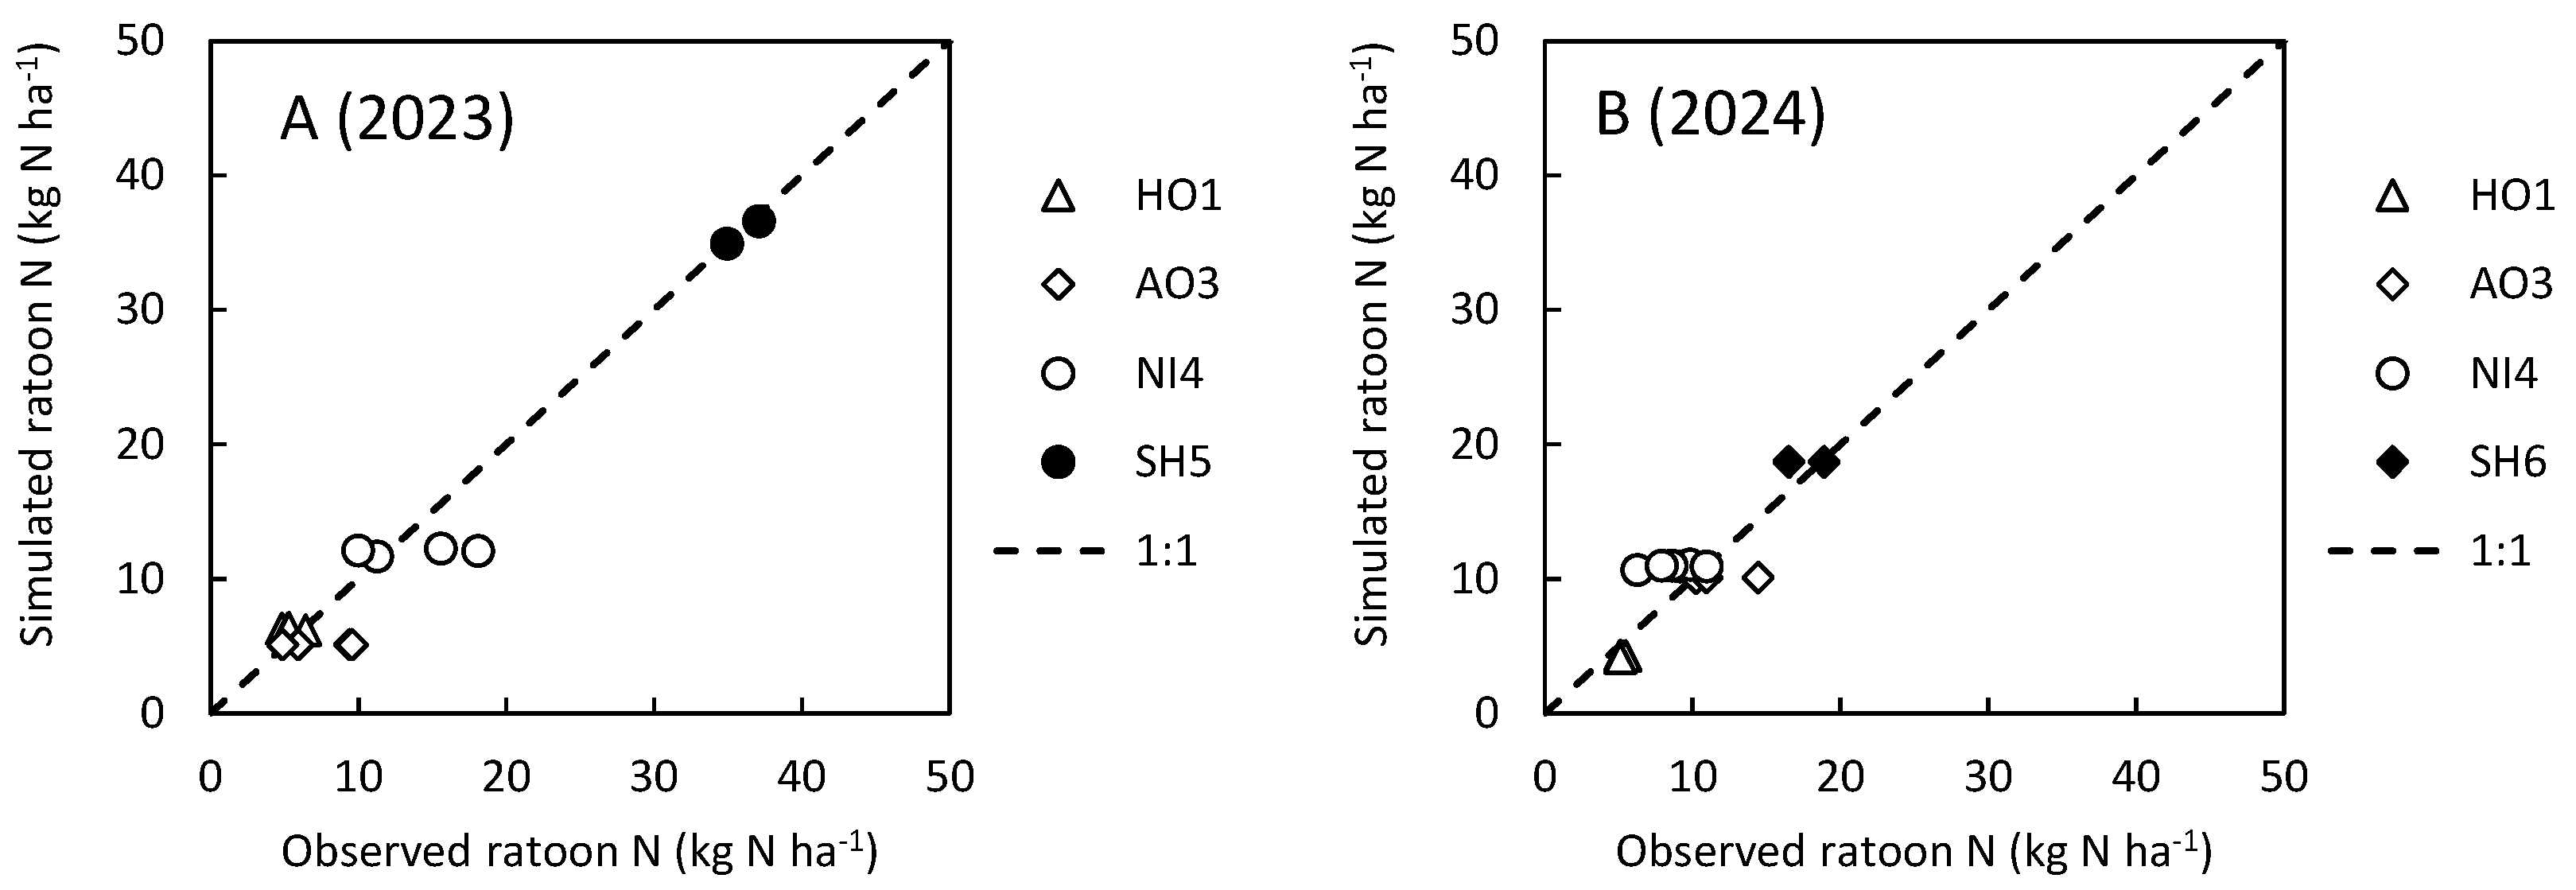
To reproduce observed ratoon rice growth, the maximum N uptake by ratoon rice, RNmax, was calibrated site specifically so that the RMSE of estimated ratoon N was under 3.0 kg N ha-1 at each site (Table A10, Fig. A7). Consequently, RNmax at the AO3 site was adjusted at a high value (150 kg N ha-1) to reproduce the rapid growth observed for just 13 days in 2023.
Table A10.
Growth parameters to simulate main rice and ratoon rice growth at the monitoring sites.
| Site | Main rice | Ratoon rice | |||||
| Cultivar | TDD10 for maturity | Maximum N uptake | C/N | TDD10 for maturity | Maximum N uptake | C/N | |
| (℃ days) | (kg N ha-1) | (g g-1) | (℃ days) | (kg N ha-1) | (g g-1) | ||
| HO1, HO2 | Nanatshuboshi | 1200 | 150 | 50 | 1200 | 20 | 30 |
| AO3 | Masshigura | 1600 | 150 | 50 | 1600 | 150 | 30 |
| Harewatari | 1600 | 150 | 50 | 1600 | 150 | 30 | |
| NI4 | Koshihikari | 1600 | 150 | 50 | 1600 | 40 | 30 |
| SH5 | Mizukagami | 1600 | 150 | 50 | 1600 | 60 | 30 |
| SH6 | Koshihikari | 1600 | 150 | 50 | 1600 | 28 | 30 |
Figure A7.
Ratoon rice N observed and simulated at the monitoring sites in 2023 (A) and 2024 (B). Observed data are the average for each treatment.
Figure A7.
Ratoon rice N observed and simulated at the monitoring sites in 2023 (A) and 2024 (B). Observed data are the average for each treatment.
References
- Mishima, S.-i., M. Matsumori, and T. Inoue, Construction of the Database for Estimation of Nitrogen Flow and Nitrogen Balance in the Districts in Japan. Japanese Journal of Soil Science and Plant Nutrition, 2004. 75(2): p. 275-281.
- Ladha, J.K.; Peoples, M.B.; Reddy, P.M.; Biswas, J.C.; Bennett, A.; Jat, M.L.; Krupnik, T.J. Biological nitrogen fixation and prospects for ecological intensification in cereal-based cropping systems. Field Crop. Res. 2022, 283, 108541. [CrossRef]
- Nakano, H.; Tanaka, R.; Wada, H.; Okami, M.; Nakagomi, K.; Hakata, M. Breaking rice yield barrier with the ratooning method under changing climatic conditions: A paradigm shift in rice-cropping systems in southwestern Japan. Agron. J. 2020, 112, 3975–3992. [CrossRef]
- Fumoto, T.; Kobayashi, K.; Li, C.; Yagi, K.; Hasegawa, T. Revising a process-based biogeochemistry model (DNDC) to simulate methane emission from rice paddy fields under various residue management and fertilizer regimes. Glob. Chang. Biol. 2007, 14, 382–402. [CrossRef]
- Oo, A.Z.; Sudo, S.; Fumoto, T.; Inubushi, K.; Ono, K.; Yamamoto, A.; Bellingrath-Kimura, S.D.; Win, K.T.; Umamageswari, C.; Bama, K.S.; et al. Field Validation of the DNDC-Rice Model for Methane and Nitrous Oxide Emissions from Double-Cropping Paddy Rice under Different Irrigation Practices in Tamil Nadu, India. Agriculture 2020, 10, 355. [CrossRef]
- Fumoto, T.; Yanagihara, T.; Saito, T.; Yagi, K. Assessment of the methane mitigation potentials of alternative water regimes in rice fields using a process-based biogeochemistry model. Glob. Chang. Biol. 2010, 16, 1847–1859. [CrossRef]
- Katayanagi, N.; Fumoto, T.; Hayano, M.; Takata, Y.; Kuwagata, T.; Shirato, Y.; Sawano, S.; Kajiura, M.; Sudo, S.; Ishigooka, Y.; et al. Development of a method for estimating total CH4 emission from rice paddies in Japan using the DNDC-Rice model. Sci. Total. Environ. 2016, 547, 429–440. [CrossRef]
- Katayanagi, N.; Fumoto, T.; Hayano, M.; Shirato, Y.; Takata, Y.; Leon, A.; Yagi, K. Estimation of total CH4 emission from Japanese rice paddies using a new estimation method based on the DNDC-Rice simulation model. Sci. Total. Environ. 2017, 601-602, 346–355. [CrossRef]
- Minamikawa, K.; Fumoto, T.; Itoh, M.; Hayano, M.; Sudo, S.; Yagi, K. Potential of prolonged midseason drainage for reducing methane emission from rice paddies in Japan: a long-term simulation using the DNDC-Rice model. Biol. Fertil. Soils 2014, 50, 879–889. [CrossRef]
- Smakgahn, K.; Fumoto, T.; Yagi, K. Validation of revised DNDC model for methane emissions from irrigated rice fields in Thailand and sensitivity analysis of key factors. J. Geophys. Res. Biogeosciences 2009, 114. [CrossRef]
- Fumoto, T.; Hasegawa, T.; Cheng, W.; Hoque, M.M.; Yamakawa, Y.; Shimono, H.; Kobayashi, K.; Okada, M.; Li, C.; Yagi, K. Application of a process-based biogeochemistry model, DNDC-Rice, to a rice field under free-air CO2 enrichment (FACE). J. Agric. Meteorol. 2013, 69, 173–190. [CrossRef]
- Li, C.; Frolking, S.; Frolking, T.A. A model of nitrous oxide evolution from soil driven by rainfall events: 1. Model structure and sensitivity. J. Geophys. Res. Atmos. 1992, 97, 9759–9776. [CrossRef]
- Li, C.; Frolking, S.; Frolking, T.A. A model of nitrous oxide evolution from soil driven by rainfall events: 2. Model applications. J. Geophys. Res. Atmos. 1992, 97, 9777–9783. [CrossRef]
- Li, C. Modeling Trace Gas Emissions from Agricultural Ecosystems. Nutr. Cycl. Agroecosystems 2000, 58, 259–276. [CrossRef]
- Hayashi, K.; Tokida, T.; Matsushima, M.Y.; Ono, K.; Nakamura, H.; Hasegawa, T. Free-air CO2 enrichment (FACE) net nitrogen fixation experiment at a paddy soil surface under submerged conditions. Nutr. Cycl. Agroecosystems 2013, 98, 57–69. [CrossRef]
- Eguchi, S., K. Aoki, and K. Kohyama. Development of Agricultural Soil-Profile Physical Properties Database, Japan: SolphyJ. in ASA, CSSA and SSSA Annual Meetings (San Antonio, TX-Oct. 16-19, 2011). 2011. ASA-CSSA-SSSA.
- Hayano, M.; Fumoto, T.; Yagi, K.; Shirato, Y. National-scale estimation of methane emission from paddy fields in Japan: Database construction and upscaling using a process-based biogeochemistry model. Soil Sci. Plant Nutr. 2013, 59, 812–823. [CrossRef]
- Obara, H., et al., Comprehensive soil classification system of Japan first approximation. Nogyo Kankyo Gijutsu Kenkyusho Hokoku = Bulletin of National Institute for Agro-Environmental Sciences, 2011(No.29): p. 1–73.
- Vergara, B., F. Lopez, and J. Chauhan, Morphology and physiology of ratoon rice, in Rice ratooning, W.H. Smith and V. Kumble, Editors. 1988, INTERNATIONAL RICE RESEARCH INSTITUTE: Manila. p. 31-40.
- Krishnamurthy, K., Rice ratooning as an alternative to double cropping in tropical Asia, in Rice ratooning, W.H. Smith and V. Kumble, Editors. 1988, INTERNATIONAL RICE RESEARCH INSTITUTE: Manila. p. 3-15.
- Nakano, H.; Tanaka, R.; Hakata, M. Nonstructural carbohydrate content in the stubble per unit area regulates grain yield of the second crop in rice ratooning. Crop. Sci. 2022, 62, 1603–1613. [CrossRef]
- Ono, S. and H. Koga, Studies on nitrogen enrichment in paddy soils. (1) Natural nitrogen enrichment and nitrogen fixation by cyanobacteria in rice paddy surface soil. Japanese Journal of Soil Science and Plant Nutrition, 1984. 55(5): p. 465-470.
- Tokuchi, N.; Iwasaki, A.; Yamaguchi, T.; Hisatsune, K.; Nakagawa, H.; Yago, H.; Makino, S.; Murano, K. Analysis of Long-term Variations of Nitrogen Deposition in Japan (1977-2018). J. Jpn. For. Soc. 2023, 105, 199–208. [CrossRef]
- Matsumoto, N., et al., Evaluation of the sustainability of nitrogen flow systems in a rural area, in Geographical Perspectives on Sustainable Rural Systems, H. Sasaki, Editor. 1996, Kaisei Publication: Tokyo. p. 153-162.
- Masuda, Y.; Itoh, H.; Shiratori, Y.; Isobe, K.; Otsuka, S.; Senoo, K. Predominant but Previously-overlooked Prokaryotic Drivers of Reductive Nitrogen Transformation in Paddy Soils, Revealed by Metatranscriptomics. Microbes Environ. 2017, 32, 180–183. [CrossRef]
- Masuda, Y.; Yamanaka, H.; Xu, Z.-X.; Shiratori, Y.; Aono, T.; Amachi, S.; Senoo, K.; Itoh, H. Diazotrophic Anaeromyxobacter Isolates from Soils. Appl. Environ. Microbiol. 2020, 86, e00956-20. [CrossRef]
- Masuda, Y.; Satoh, S.; Miyamoto, R.; Takano, R.; Ishii, K.; Ohba, H.; Shiratori, Y.; Senoo, K. Biological nitrogen fixation in the long-term nitrogen-fertilized and unfertilized paddy fields, with special reference to diazotrophic iron-reducing bacteria. Arch. Microbiol. 2023, 205, 1–6. [CrossRef]
- Ono, S. and H. Koga, Studies on nitrogen enrichment in paddy soils: 1. Natural nitrogen enrichment and nitrogen fixation by cyanobacteria in rice paddy surface soil (in Japanese). Japanese Journal of Soil Science and Plant Nutrition, 1984. 55(5): p. 465-470.
- Molina, J.A.E.; Clapp, C.E.; Shaffer, M.J.; Chichester, F.W.; Larson, W.E. NCSOIL, A Model of Nitrogen and Carbon Transformations in Soil: Description, Calibration, and Behavior. Soil Sci. Soc. Am. J. 1983, 47, 85–91. [CrossRef]
- Mogi, S., T. Yoshizawa, and M. Nakano, Studies on soil science and fertilizer in the paddy field applied rice and barley straw. (II) Decomposition process of rice straw in paddy field and changes in its chemical composition. Bulletin of Tochigi Agricultural Experiment Station, 1980. 26: p. 17-26.
- Yoshizawa, T. and K. Nakayama, Studies on soil science and fertilizer in the paddy field applied rice and barley straw. (V) Decomposition process of barley and rice straw in the paddy field and changes of soil science by application of organic matter. Bulletin of Tochigi Agricultural Experiment Station, 1983. 29: p. 49-60.
- Müller, T. and H. Höper, Soil organic matter turnover as a function of the soil clay content: consequences for model applications. Soil Biology and Biochemistry, 2004. 36(6): p. 877-888.
- Takahashi, M.; Sakamoto, T. Application of the detergent analysis in the evaluation of the nitrogen mineralization of livestock feces compost. Nihon Chikusan Gakkaiho 2008, 79, 413–426. [CrossRef]
- Maeda, K. and H. Shiga, Decomposition process of different organic materials under paddy conditions. Japanese Journal of Soil Science and Plant Nutrition, 1978. 49(6): p. 455-460.
- A.F.F.R.C., Prediction of Soil Organic Matter Changes in Farmland and Formulation of Organic Matter Application Standards (in Japanese). Project Research Series No. 166. 1985, Tokyo: Ministry of Agriculture, Forestry and Fisheries, Japan.
- Hasegawa, T. Changes in Vertical Distribution of Leaf Nitrogen with the Growth Stage and the Influence on Dry Matter Production in Rice. Plant Prod. Sci. 1999, 2, 37–46. [CrossRef]
- Hasegawa, T.; Sakai, H.; Tokida, T.; Usui, Y.; Nakamura, H.; Wakatsuki, H.; Chen, C.P.; Ikawa, H.; Zhang, G.; Nakano, H.; et al. A High-Yielding Rice Cultivar “Takanari” Shows No N Constraints on CO2 Fertilization. Front. Plant Sci. 2019, 10, 361. [CrossRef]
- Nelder, J.A.; Mead, R. A Simplex Method for Function Minimization. Comput. J. 1965,7, 308–313. [CrossRef]
- Suzuki, I.; Dular, U.; Kwok, S.C. Ammonia or Ammonium Ion as Substrate for Oxidation by Nitrosomonas europaea Cells and Extracts. J. Bacteriol. 1974, 120, 556–558. [CrossRef]
- Grant, R.; Pattey, E. Modelling variability in N2O emissions from fertilized agricultural fields. Soil Biol. Biochem. 2003, 35, 225–243. [CrossRef]
- Grant, R. Simulation of ecological controls on nitrification. Soil Biol. Biochem. 1994, 26, 305–315. [CrossRef]
- Saito, M.; Miyata, A.; Nagai, H.; Yamada, T. Seasonal variation of carbon dioxide exchange in rice paddy field in Japan. Agric. For. Meteorol. 2005, 135, 93–109. [CrossRef]
Figure 1.
Observed and simulated soil N supply (mineralization) during the field soil incubation experiments in 2023 (A) and 2024 (B). S1, simulation with BNF and ratoon rice growth; S2, simulation without ratoon rice growth; S3, simulation without BNF and ratoon rice growth. As in Table 4 and Table 5, **, * and ns indicate P < 0.01, P < 0.05 and no significance, respectively, for observed difference between the treatment and control.
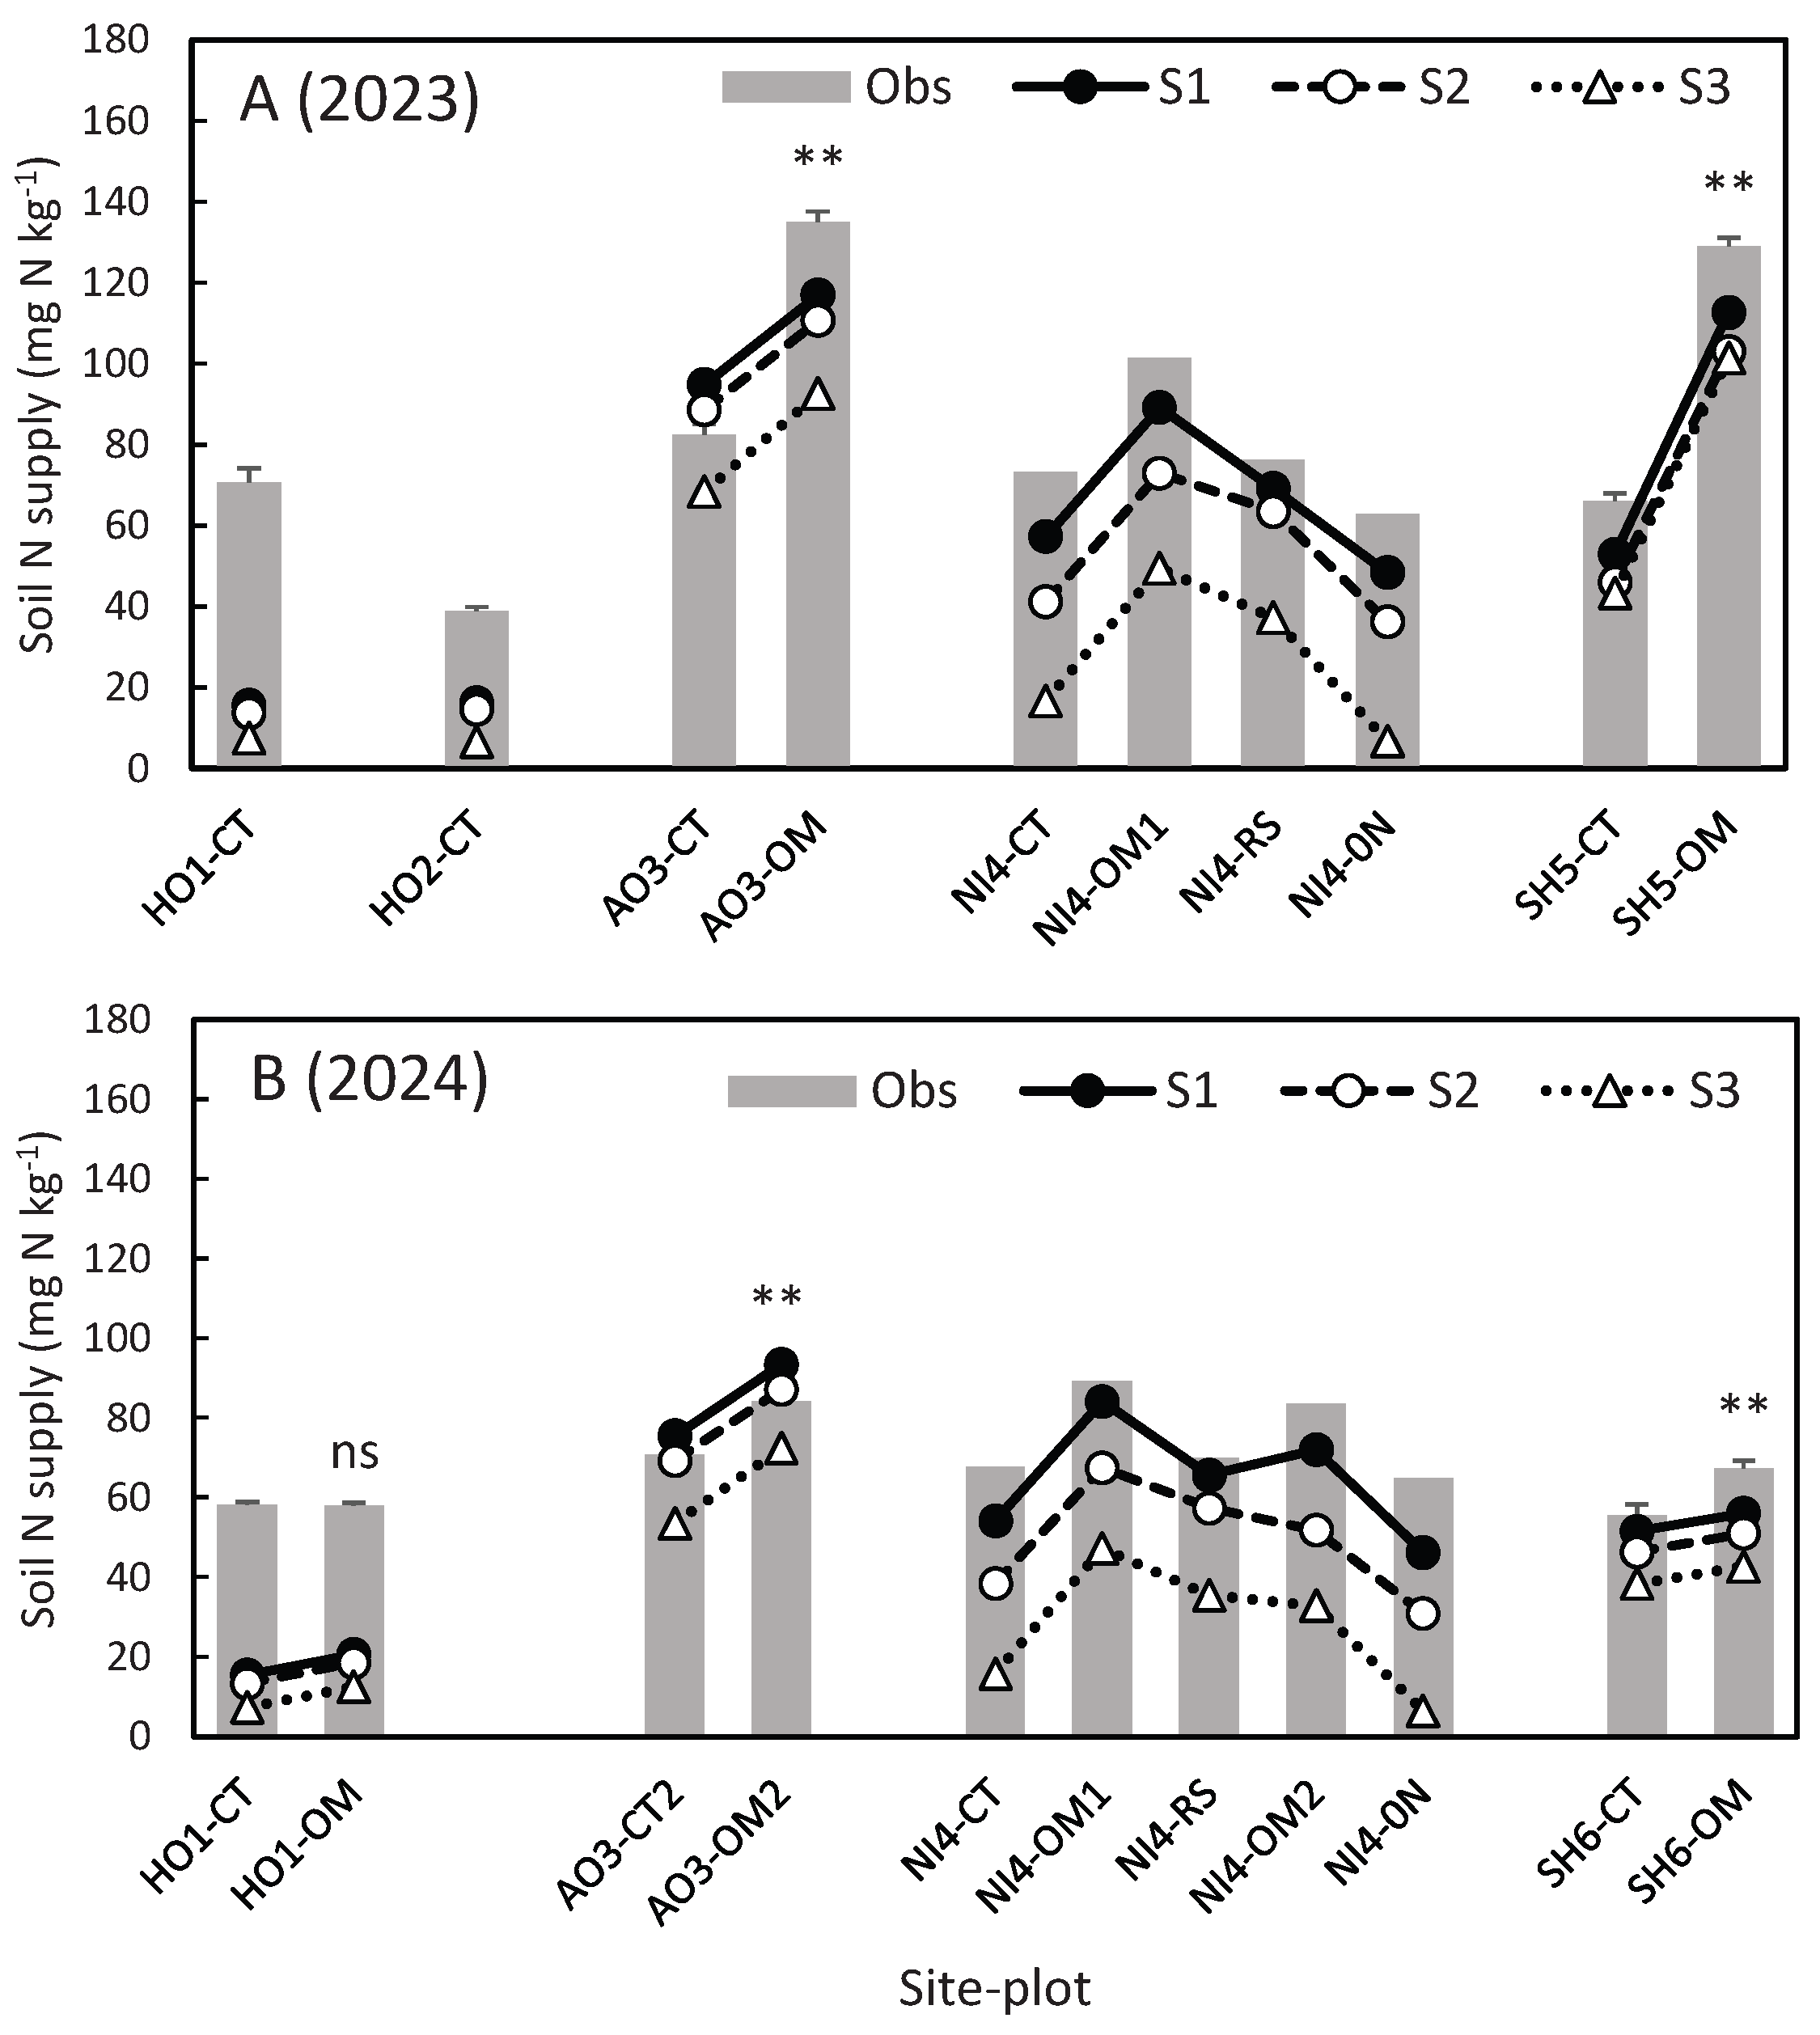
Figure 2.
Comparison of observed and simulated soil N supply (mineralization) due to application of organic materials during the field soil incubation. ChMC, chicken manure compost; RSC, rice straw compost; RS, rice straw; CaMC, cattle manure compost; SMC, swine manure compost.
Figure 2.
Comparison of observed and simulated soil N supply (mineralization) due to application of organic materials during the field soil incubation. ChMC, chicken manure compost; RSC, rice straw compost; RS, rice straw; CaMC, cattle manure compost; SMC, swine manure compost.
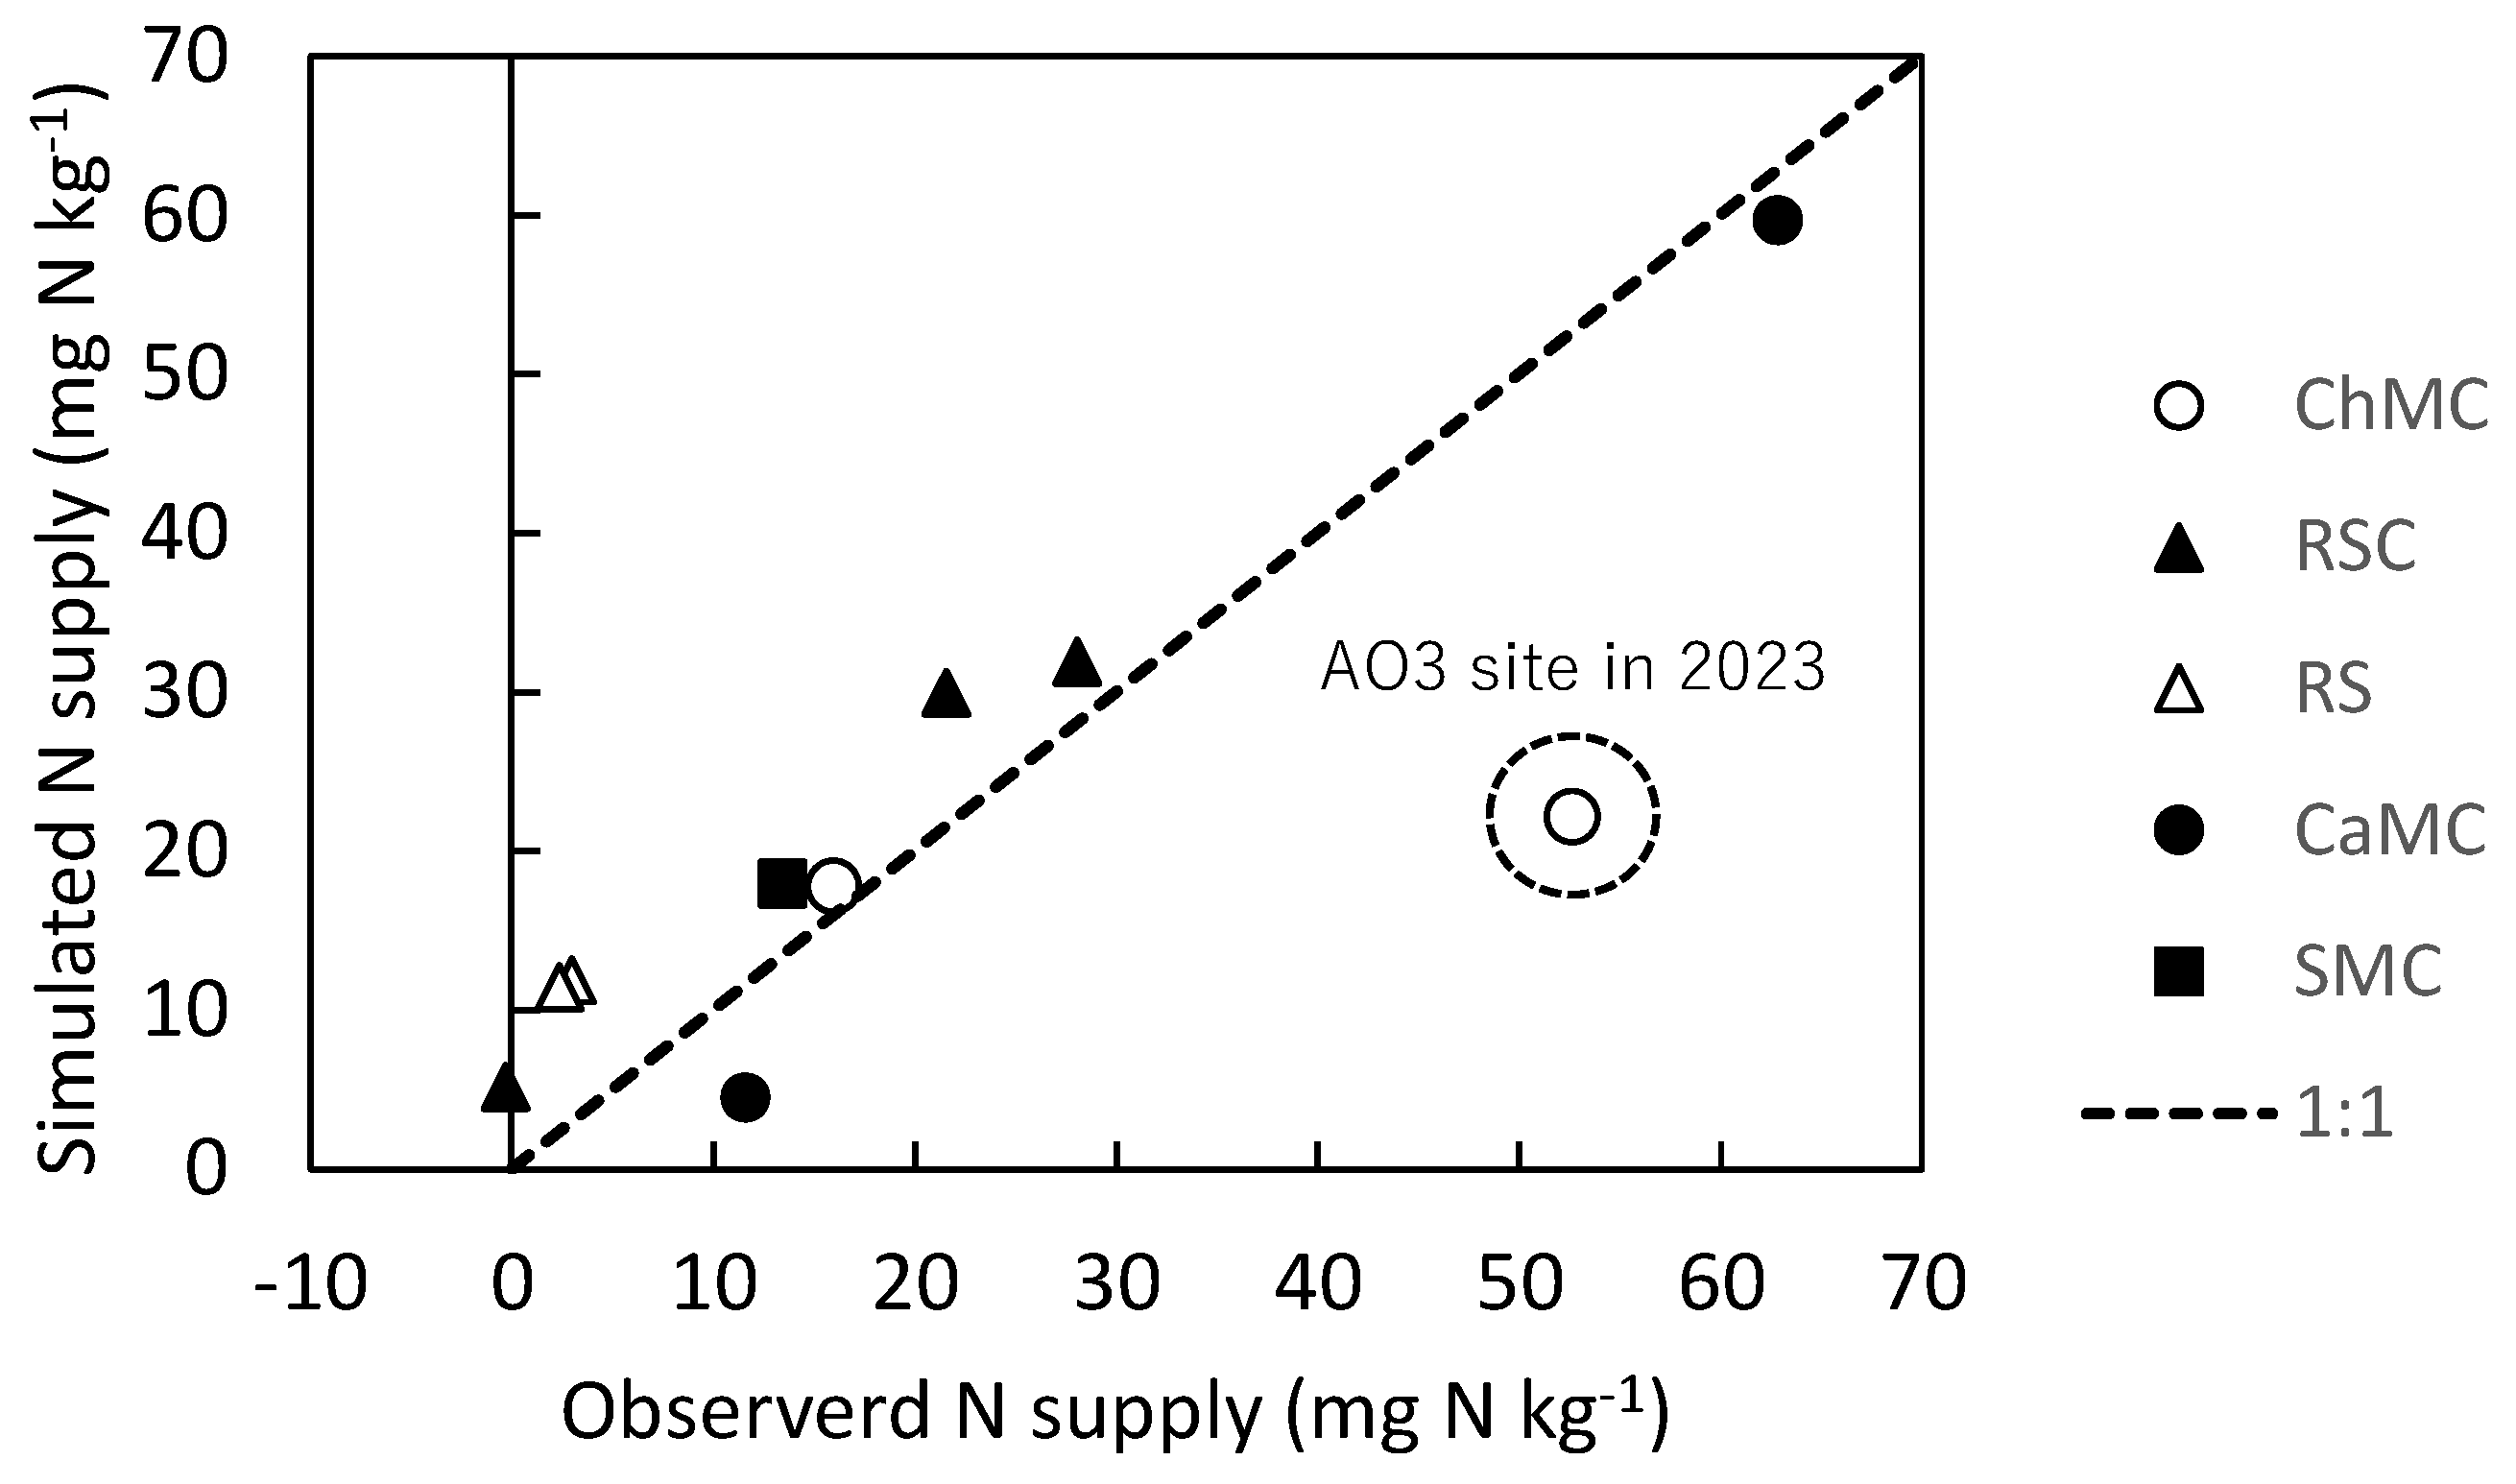
Figure 3.
Observed and simulated main rice N uptake (aboveground N) in 2023 (A) and 2024 (B). S1, simulation with BNF and ratoon rice growth; S2, simulation without ratoon rice growth; S3, simulation without BNF and ratoon rice growth. As in Table 4 and Table 5, **, * and ns indicate P < 0.01, P < 0.05 and no significance, respectively, for observed difference between the treatment and control.
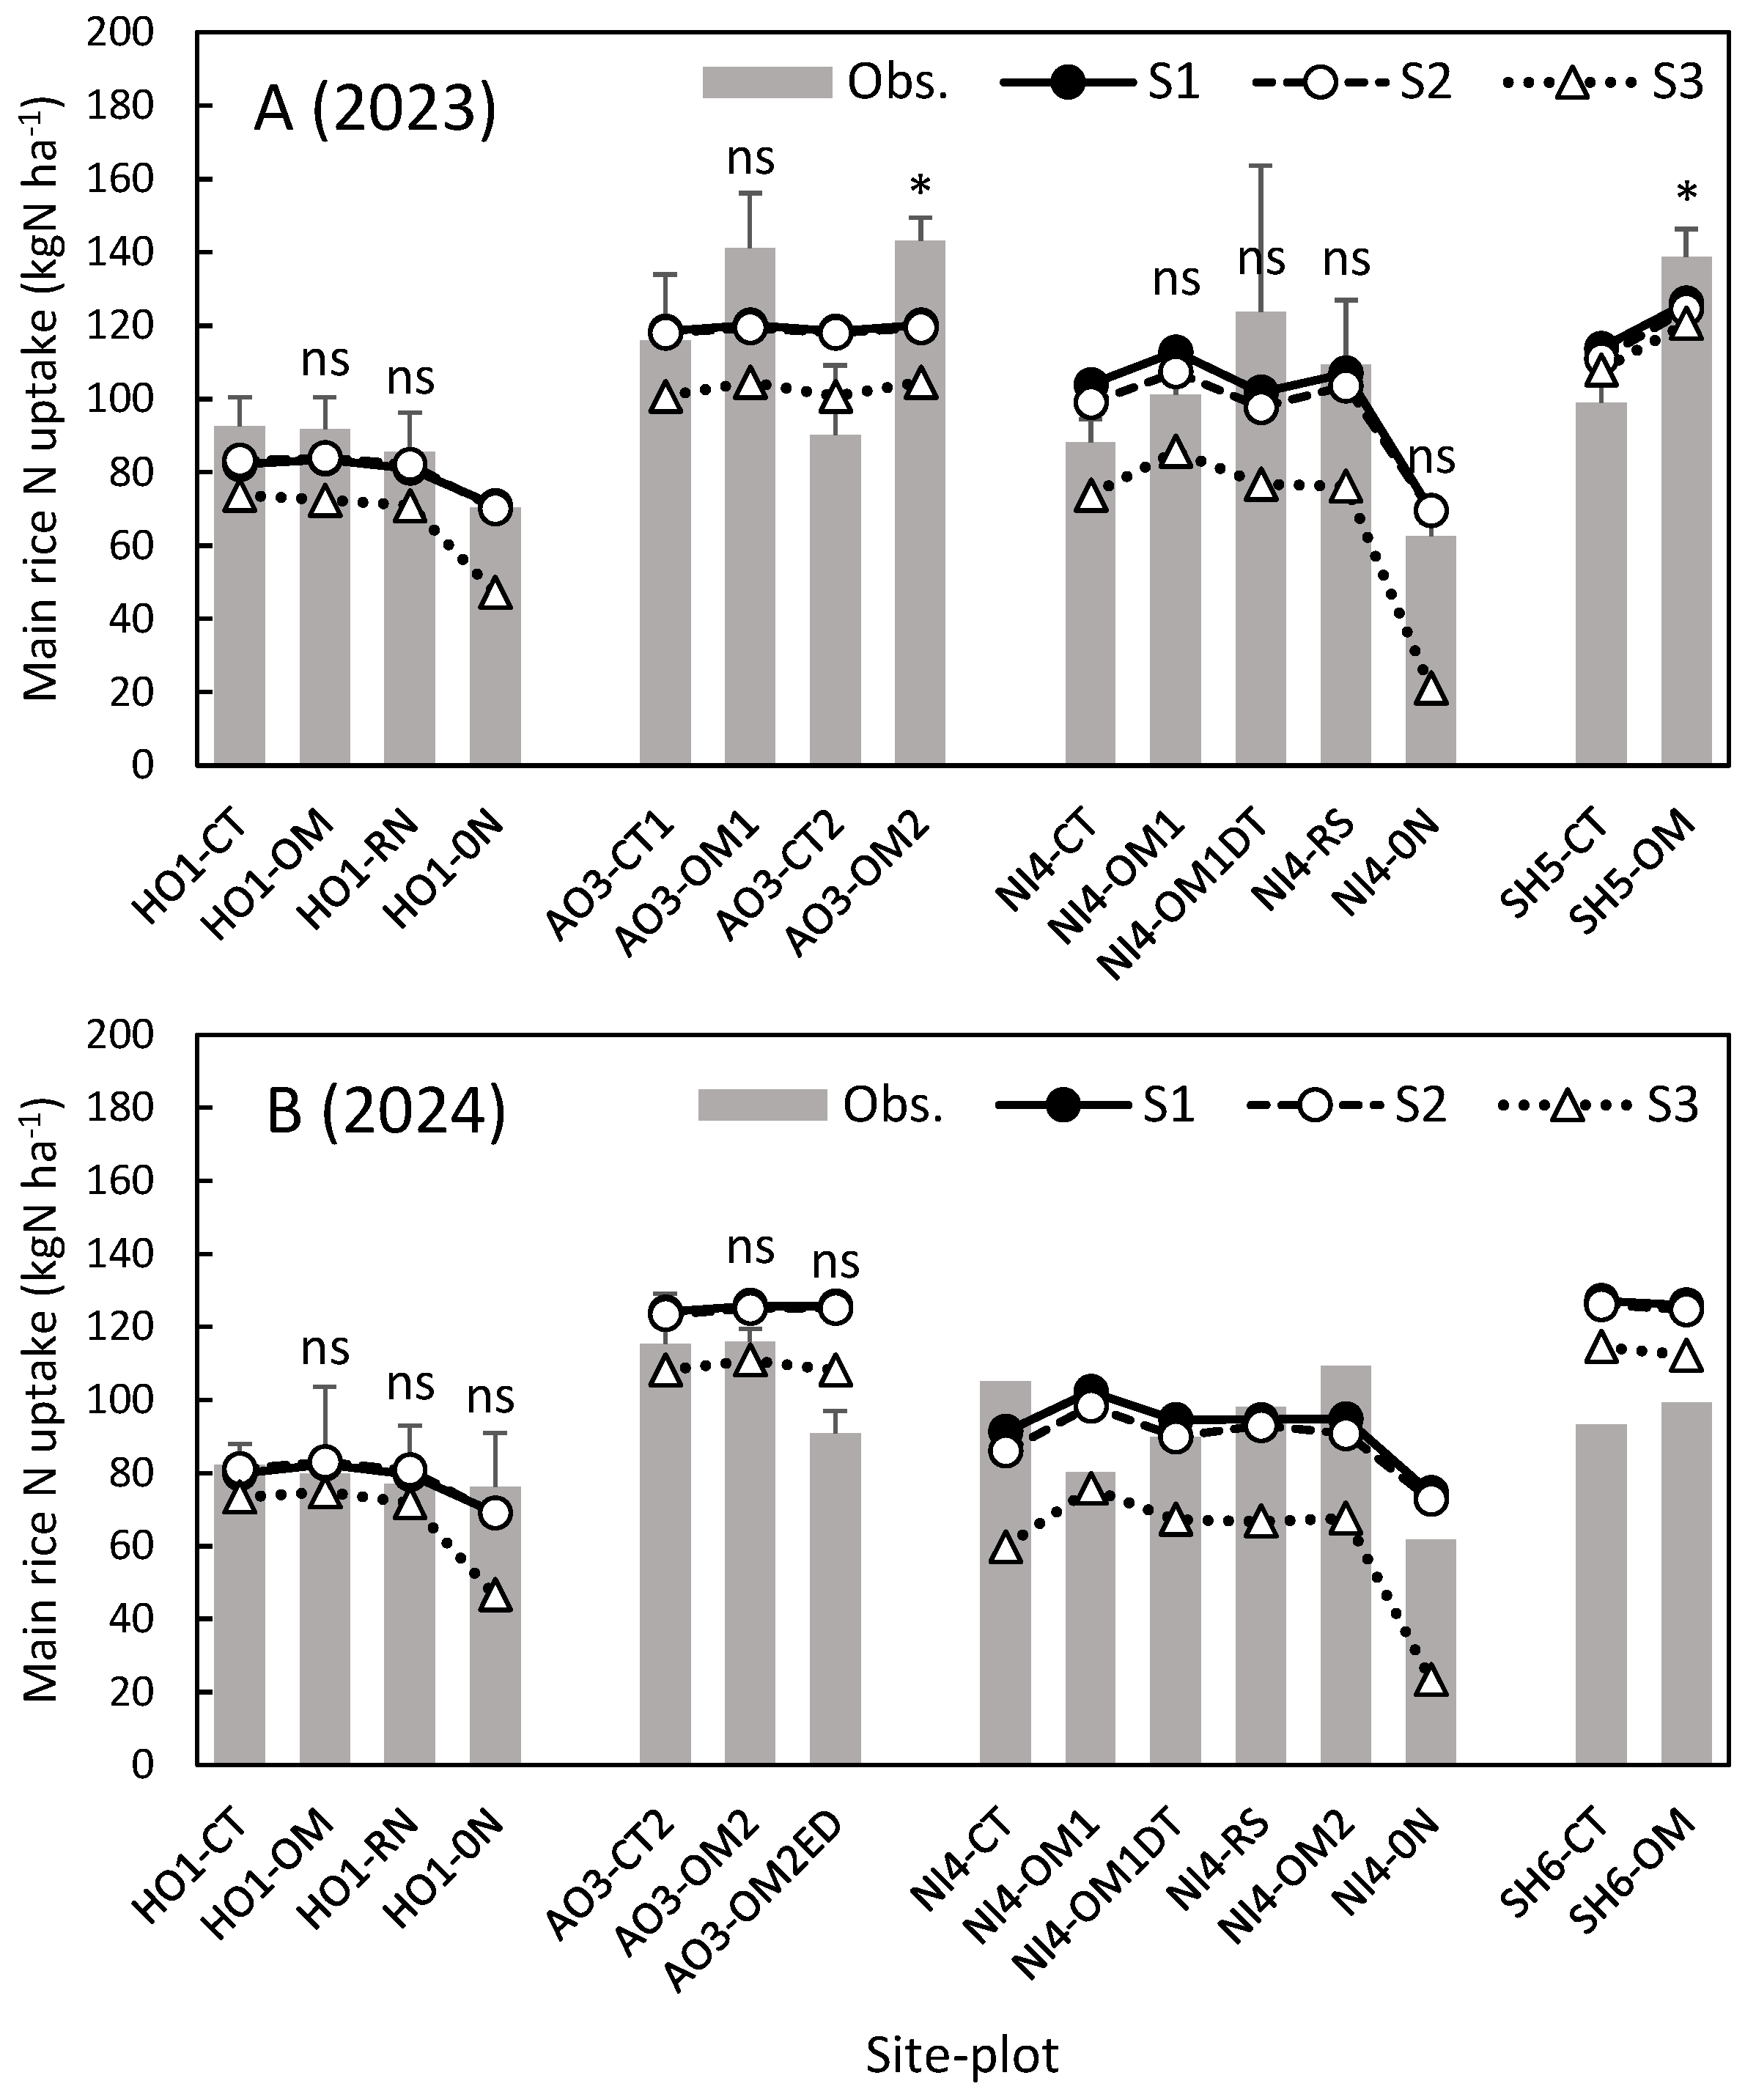
Figure 4.
Simulated N loss (denitrification and N leaching) from the 0-50cm soil profile of control plot at each site in 2023 (A) and 2024 (B).
Figure 4.
Simulated N loss (denitrification and N leaching) from the 0-50cm soil profile of control plot at each site in 2023 (A) and 2024 (B).
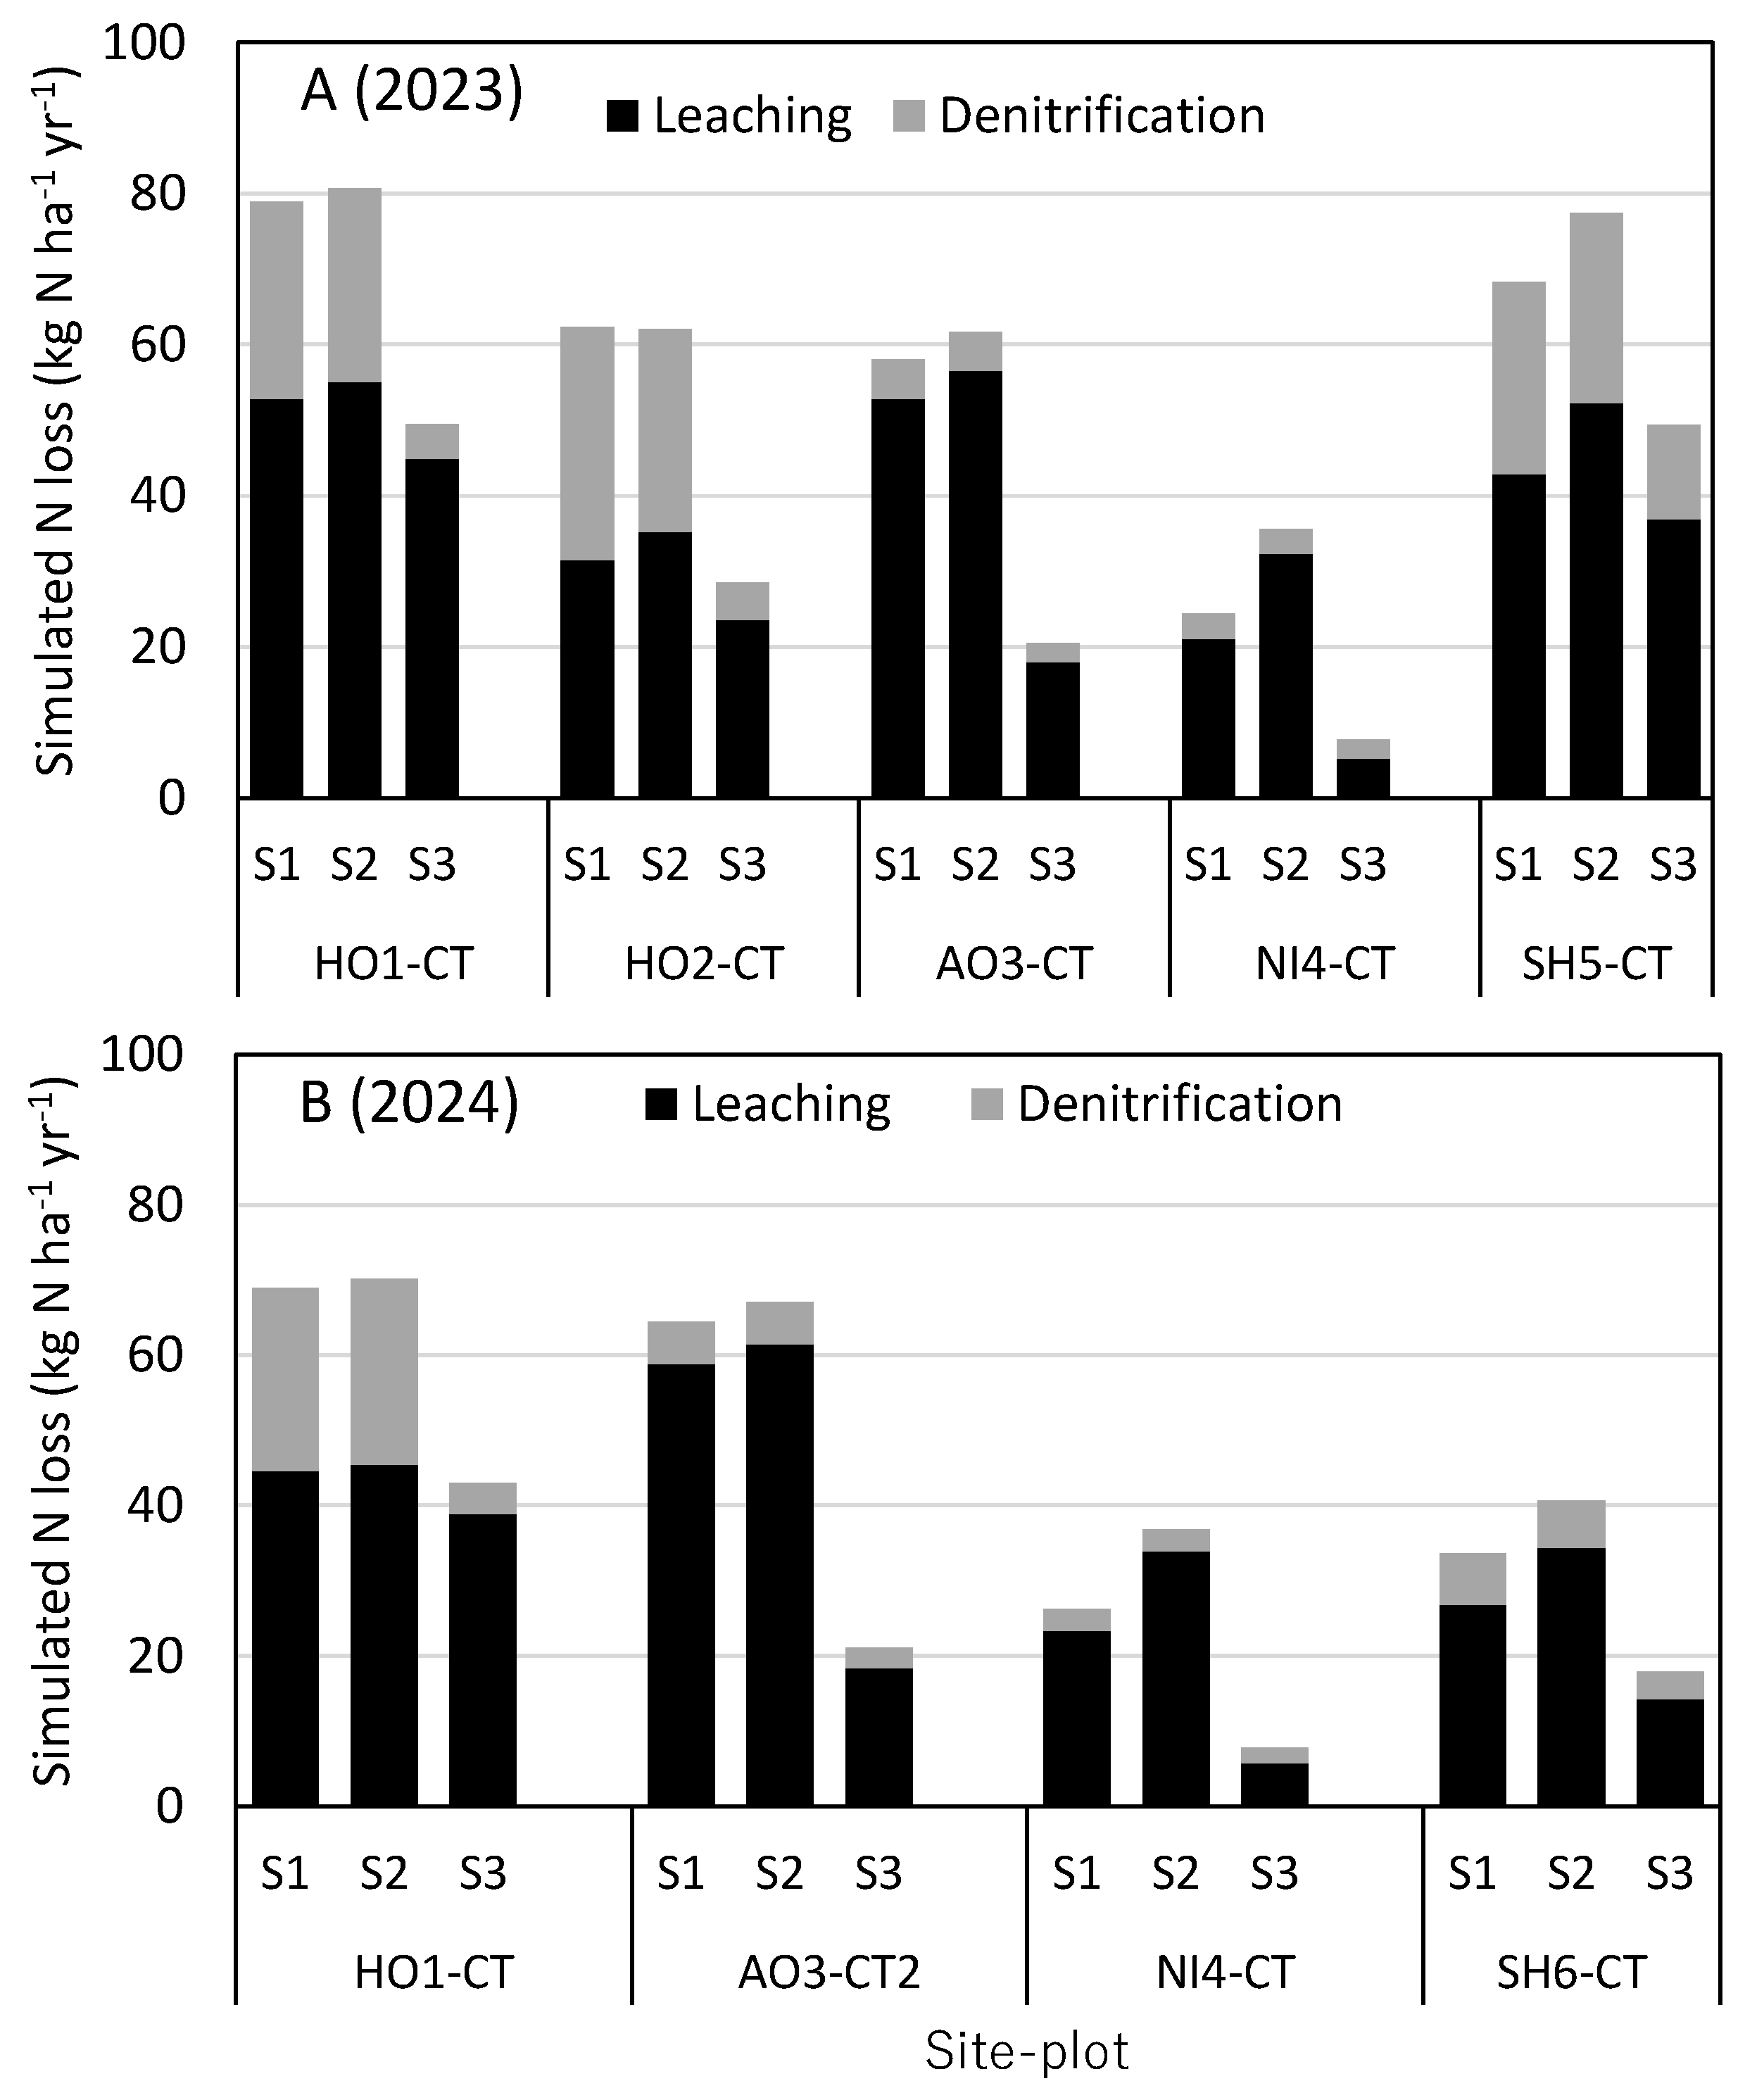
Table 1.
Site location and soil properties.
| Site | HO1 | HO2 | AO3 | NI4 | SH5 | SH6 |
| City, prefecture | Iwamizawa, Hokkaido | Iwamizawa, Hokkaido | Kuroishi, Aomori | Nagaoka, Niigata | Omihachiman, Shiga | Omihachiman, Shiga |
| North latitude, east longitude in degrees | 43.18, 141.72 | 43.18, 141.72 | 40.67, 140.58 | 37.44, 138.87 | 35.18, 135.61 | 35.17, 136.13 |
| Average air temperature (℃) for 1991-2020 | 7.9 | 7.9 | 10.2 | 13.3 | 14.5 | 14.5 |
| Soil type (Comprehensive Soil Classification System of Japan First Approximation)[18] | Epi-mineralic Low-moor Peat soil | Fine-textured Epi-gray Gley Lowland soil | Epi-gray Gley Lowland soil | Fine-textured Mottled Gley Lowland soil | Fine-textured Gleyed Gray Lowland soil | Medium-textured Mottled Gley Lowland soil |
| Soil properties of the control plot 1) | ||||||
| Clay content (g g-1) | 0.25 | 0.29 | 0.18 | 0.28 | 0.26 | 0.14 |
| Bulk density (g cm-3) | 1.09 | 0.85 | 0.92 | 0.93 | 1.16 | 1.1 |
| Carbon content (g g-1) | 0.051 | 0.026 | 0.022 | 0.022 | 0.020 | 0.0155 |
| pH | 6.64 | 6.64 | 5.70 | 5.50 | 6.10 | 6.10 |
| Reducible Fe content (mol kg-1) | 0.103 | 0.103 | 0.103 | 0.134 | 0.160 | 0.1027 |
| Water holding capacity (water filled pore space, cm cm-3) |
0.881 | 0.902 | 0.866 | 0.970 | 0.851 | 0.838 |
| 1) Data in Italics represent the average for the relevant Soil Series Group or Soil Group. | ||||||
Table 2.
Experimental treatments at each site in 2023.
| Site | Plot | Main rice cultivar | Transplanting and harvest dates (MM/DD-MM/DD) | N Fertilization (kg N ha-1) |
Organic materials application | Crop residues application | Tillage date (MM/DD) | Drained period1) (MM/DD-NM/DD) |
Monitoring 2) |
| HO1 | CT | Nanatshuboshi | 5/16-9/4 | 65 | - | - | 4/28 | ID 7/25-8/25 | ABC |
| OM | 55 | Rice straw compost (1.1 t C ha-1, C/N 13.1, started in 2023) | - | AB | |||||
| RN | 55 | - | - | AB | |||||
| 0N | 0 | - | - | AB | |||||
| HO2 | CT | Nanatshuboshi | 5/30-9/5 | 65 | - | - | 5/9 | MSD 7/20-7/26 | C |
| AO3 | CT1 | Masshigura | 5/25-10/14 | 80 | - | Rice straw (2.0 t C ha-1, C/N 60) | 5/2 | MSD 6/28-7/10 | ABC |
| CT2 | Harewatari | 80 | - | ABC | |||||
| OM1 | Masshigura | 60 | Chicken manure compost (0.6 t C ha-1, C/N 7.2, started in 2023) | ABC | |||||
| OM2 | Harewatari | 60 | ABC | ||||||
| NI4 | CT | Koshihikari | 5/10-9/9 | 60 | - | - | 4/17 | MSD 6/9-6/22 ID 6/22-8/25 |
ABC |
| OM1 | 48 | Rice straw compost (0.5 t C ha-1, C/N 12.2, successively applied) | - | 4/17 | ABC | ||||
| OM1DT | 42 | - | 4/17 (deeper tillage every other year) |
AB | |||||
| RS | 56 | - | Rice straw (0.6 t C ha-1, C/N 60) | 4/17, 10/1 | ABC | ||||
| 0N | 0 | - | - | 4/17 | ABC | ||||
| SH5 | CT | Mizukagami, 3 crops (rice-rice-wheat-soybean) in 4 years |
5/2-8/23 | 15 | - | Rice straw (2.5 t C ha-1, C/N 60) Wheat straw (1.2 t C ha-1, C/N 97.2) Soy residue (1.0 t C ha-1, C/N 54.6) |
4/24, 10/29 | MSD 6/12-6/26 | ABC |
| OM | 5/2-8/21 | 0 | Cattle manure compost (5.5 t C ha-1, C/N 13.2, successively applied after rice harvest) | Wheat straw (2.2 t C ha-1, C/N 91.3) Soy residue (1.2 t C ha-1, C/N 53.9 ) |
ABC | ||||
|
1) ID, intermittent drainage; MSD, midseason drainage 2) A, main rice; B, ratoon rice; C, field soil incubation | |||||||||
Table 3.
Experimental treatments at each site in 2024.
| Site | Plot | Main rice cultivar | Transplanting and harvest dates (MM/DD-MM/DD) | N Fertilization (kg N ha-1) |
Organic materials application | Crop residues application | Tillage date (MM/DD) | Drained period1) (MM/DD-NM/DD) |
Monitoring 2) |
| HO1 | CT | Nanatshuboshi | 5/17-9/2 | 65 | - | - | 4/25 | ID 8/5-8/25 | ABC |
| OM | 60 | Rice straw compost (0.7 t C ha-1, C/N 12.9) | - | ABC | |||||
| RN | 60 | - | - | AB | |||||
| 0N | 0 | - | - | AB | |||||
| AO3 | CT2 | Harewatari | 5/23-10/8 | 80 | - | Rice straw (2.0 t C ha-1, C/N 60) | 5/3 | MSD 6/26-7/5 | ABC |
| OM2 | 46 | Swine manure compost (0.5 t C ha-1, C/N 7.7) | ABC | ||||||
| OM2ED | 46 | MSD 6/19-7/5 | AB | ||||||
| NI4 | CT | Koshihikari | 5/10-9/10 | 60 | - | - | 4/16 | MSD 6/10-6/20 ID 6/20-8/28 |
ABC |
| OM1 | 48 | Rice straw compost (0.5 t C ha-1, C/N 12.2, successively applied) | - | ABC | |||||
| OM1DT | 42 | - | 4/16 (deep tillage every other year) |
AB | |||||
| RS | 56 | - | Rice straw (0.6 t C ha-1, C/N 60) | 4/16, 10/6 | ABC | ||||
| OM2 | 48 | Chicken manure compost (0.4 t C ha-1, C/N 10.3, started in 2024) | - | 4/16 | ABC | ||||
| 0N | 0 | - | - | ABC | |||||
| SH6 | CT | Koshihikari | 5/13-8/27 | 60 | - | Rice straw (2.5 t C ha-1, C/N 60) | 4/15, 11/13 | MSD 6/10-6/17 | ABC |
| OM | 50 | Cattle manure compost (1.0 t C ha-1, C/N 12.7, started in 2024) | MSD 6/10-6/24 | ABC | |||||
|
1) ID, intermittent drainage; MSD, midseason drainage 2) A, main rice; B, ratoon rice; C, field soil incubation | |||||||||
Table 4.
Observed results of main rice growth and field soil incubation in 2023.
| Site-plot | Main rice growth | Field soil incubation | |||||||||||||
| TDD10 from transplanting to harvest (℃ days) |
Grain yield (t ha-1) |
Aboveground N (kg N ha-1) |
Straw N (kg N ha-1) |
Duration (days) | Mineralized N (mg N kg-1) |
||||||||||
| Ave. | (S.D.) | Ave. | (S.D.) | Ave. | (S.D.) | Ave. | (S.D.) | ||||||||
| HO1-CT | 1280.2 | 5.11 | - | 92.5 | (8.0) | 34.1 | (2.6) | 70 | 70.7 | (3.4) | |||||
| HO1-OM | 1280.2 | 4.71 | - | 91.8 | (8.7) | ns | 34.5 | (3.5) | ns | - | - | - | |||
| HO1-RN | 1280.2 | 5.03 | - | 85.5 | (10.8) | ns | 32.0 | (4.2) | ns | - | - | - | |||
| HO1-0N | 1280.2 | 3.62 | - | 70.4 | - | - | 29.6 | - | - | - | - | - | |||
| HO2-CT | - | - | - | - | - | 70 | 38.8 | (1.1) | |||||||
| AO3-CT1 | 1792.7 | 6.28 | (0.52) | 115.9 | (18.1) | 77.2 | (13.0) | 125 | 82.4 | (2.7) | |||||
| AO3-CT2 | 1792.7 | 6.32 | (0.62) | 90.1 | (19.2) | 59.2 | (13.9) | ||||||||
| AO3-OM1 | 1792.7 | 7.11 | (0.27) | ns | 141.2 | (15.0) | ns | 85.6 | (8.5) | ns | 125 | 135.1 | (2.5) | ** | |
| AO3-OM2 | 1792.7 | 6.21 | (0.06) | ns | 143.1 | (6.4) | * | 82.2 | (3.8) | ns | |||||
| NI4-CT | 1895.2 | 5.43 | (0.35) | 88.1 | (6.3) | 28.6 | (1.8) | 120 | 73.3 | - | |||||
| NI4-OM1 | 1895.2 | 5.62 | (0.17) | ns | 101.2 | (4.6) | ns | 31.5 | (1.8) | ns | 120 | 101.4 | - | ||
| NI4-OM1DT | 1895.2 | 6.31 | (0.26) | ** | 124.8 | (40.0) | ns | 39.9 | (11.0) | ns | - | - | - | ||
| NI4-RS | 1895.2 | 5.92 | (0.98) | ns | 109.7 | (17.7) | ns | 33.2 | (7.6) | ns | 120 | 76.3 | - | ||
| NI4-0N | 1895.2 | 3.80 | (0.23) | ** | 62.7 | (3.6) | ns | 21.4 | (2.4) | ns | 120 | 62.8 | - | ||
| SH5-CT | 1632.0 | 4.51 | (0.83) | 99.0 | (6.6) | 40.0 | (7.0) | 114 | 66.0 | (1.0) | |||||
| SH5-OM | 1591.6 | 5.97 | (0.73) | ns | 138.7 | (7.7) | * | 55.3 | (5.3) | ns | 114 | 128.8 | (2.3) | ** | |
Table 5.
Observed results of main rice growth and field soil incubation in 2024.
| Site-plot | Main rice growth | Field soil incubation | ||||||||||||
| TDD10 from transplanting to harvest (℃ days) |
Grain yield (t ha-1) |
Aboveground N (kg N ha-1) |
Straw N (kg N ha-1) |
Duration (days) | Mineralized N (mg N kg-1) |
|||||||||
| Ave. | (S.D.) | Ave. | (S.D.) | Ave. | (S.D.) | Ave. | (S.D.) | |||||||
| HO1-CT | 1171.4 | 4.55 | (0.41) | 82.2 | (5.7) | 23.6 | (2.9) | 70 | 58.2 | (0.5) | ||||
| HO1-OM | 1171.4 | 4.37 | (0.38) | ns | 79.7 | (23.9) | ns | 25.7 | (6.5) | ns | 70 | 57.9 | (0.8) | ns |
| HO1-RN | 1171.4 | 4.37 | (0.28) | ns | 77.1 | (15.8) | ns | 22.7 | (6.5) | ns | - | - | - | |
| HO1-0N | 1171.4 | 4.34 | (0.18) | ns | 76.2 | (14.6) | ns | 24.0 | (4.0) | ns | - | - | - | |
| AO3-CT2 | 1625.8 | 6.55 | (0.45) | 115.4 | (13.6) | 38.2 | (5.0) | 98 | 70.8 | (2.3) | ||||
| AO3-OM2 | 1625.8 | 6.40 | (0.27) | ns | 116.0 | (3.5) | ns | 39.6 | (2.5) | ns | 98 | 84.2 | (2.5) | ** |
| AO3-OM2ED | 1625.8 | 5.37 | (0.42) | * | 90.9 | (6.1) | ns | 31.9 | (3.3) | ns | - | - | - | |
| NI4-CT | 1843.4 | 5.26 | - | 105.1 | - | 31.7 | - | 112 | 67.7 | - | ||||
| NI4-OM1 | 1843.4 | 5.25 | - | 80.3 | - | 25.4 | - | 112 | 89.2 | - | ||||
| NI4-OM1DT | 1843.4 | 5.30 | - | 89.8 | - | 27.4 | - | - | - | - | ||||
| NI4-RS | 1843.4 | 5.05 | - | 98.1 | - | 30.6 | - | 112 | 70.0 | - | ||||
| NI4-OM2 | 1843.4 | 5.51 | - | 109.3 | - | 30.2 | - | 112 | 83.6 | - | ||||
| NI4-0N | 1843.4 | 4.06 | - | 61.7 | - | 17.6 | - | 112 | 65.0 | - | ||||
| SH6-CT | 1629.2 | 5.02 | - | 93.2 | - | 33.0 | - | 106 | 55.6 | (2.7) | ||||
| SH6-OM | 1629.2 | 5.33 | - | 99.3 | - | 35.1 | - | 106 | 67.2 | (2.0) | ** | |||
Table 6.
Observed ratoon rice growth in 2023.
| Site-plot | Growth duration (days) | TDD10 (℃ days) |
Dry weight (t ha-1) |
Ratoon N (kg N ha-1) |
Ratoon C (kg C ha-1) |
Ratoon C/N (g g-1) |
||||||||
| Ave. | (S.D.) | Ave. | (S.D.) | Ave. | (S.D.) | Ave. | (S.D.) | |||||||
| HO1-CT | 38 | 315.2 | 0.21 | (0.06) | 4.9 | (1.1) | - | - | - | - | ||||
| HO1-OM | 38 | 315.2 | 0.23 | (0.04) | ns | 5.3 | (0.8) | ns | - | - | - | - | ||
| HO1-RN | 38 | 315.2 | 0.23 | (0.04) | ns | 5.2 | (0.8) | ns | - | - | - | - | ||
| HO1-0N | 38 | 315.2 | 0.31 | - | 6.5 | - | - | - | - | - | ||||
| AO3-CT1 | 13 | 38.8 | 0.40 | (0.05) | 5.9 | (1.5) | 200.4 | (65.7) | 33.9 | (2.5) | ||||
| AO3-CT2 | 13 | 38.8 | 0.46 | (0.16) | 4.9 | (0.8) | 171.6 | (22.4) | 35.0 | (1.3) | ||||
| AO3-OM1 | 13 | 38.8 | 0.61 | (0.04) | * | 9.4 | (0.1) | ns | 267.7 | (8.5) | ns | 28.4 | (0.6) | ns |
| AO3-OM2 | 13 | 38.8 | 0.62 | (0.02) | ns | 9.6 | (0.1) | ns | 264.2 | (16.5) | * | 27.5 | (1.4) | * |
| NI4-CT | 31 | 373.7 | 0.79 | (0.20) | 9.5 | (2.9) | 317.5 | (80.4) | 33.7 | (1.8) | ||||
| NI4-OM1 | 31 | 373.7 | 1.11 | (0.07) | ns | 14.7 | (0.7) | ns | 450.0 | (28.9) | ns | 30.6 | (0.6) | ns |
| NI4-OM1DT | 31 | 373.7 | 1.21 | (0.01) | ns | 17.1 | (0.7) | ns | 491.0 | (1.1) | ns | 28.8 | (1.1) | ns |
| NI4-RS | - | - | - | - | - | - | - | - | - | - | ||||
| NI4-0N | 31 | 373.7 | 0.87 | (0.42) | ns | 10.9 | (6.1) | ns | 357.9 | (177.8) | ns | 33.6 | (2.6) | ns |
| SH5-CT | 70 | 910.4 | 2.46 | (0.53) | 37.6 | (12.5) | 990.9 | (210.0) | 26.3 | (3.3) | ||||
| SH5-OM | 72 | 950.8 | 2.08 | (0.40) | ns | 34.9 | (5.7) | ns | 867.4 | (173.5) | ns | 24.9 | (0.9) | ns |
| Mean | 30.3 | |||||||||||||
Table 7.
Observed ratoon rice growth in 2024.
| Site-plot | Growth duration (days) | TDD10 (℃ days) |
Dry weight (t ha-1) |
Ratoon N (kg N ha-1) |
Ratoon C (kg C ha-1) |
Ratoon C/N (g g-1) |
|||||||||
| Ave. | (S.D.) | Ave. | (S.D.) | Ave. | (S.D.) | Ave. | (S.D.) | ||||||||
| HO1-CT | 18 | 175.3 | 0.19 | (0.05) | 5.16 | (0.89) | - | - | - | - | |||||
| HO1-OM | 18 | 175.3 | 0.18 | (0.05) | ns | 5.12 | (1.06) | ns | - | - | - | - | |||
| HO1-RN | 18 | 175.3 | 0.21 | (0.02) | ns | 5.50 | (0.27) | ns | - | - | - | - | |||
| HO1-0N | 18 | 175.3 | 0.17 | (0.04) | ns | 5.13 | (0.97) | ns | - | - | - | - | |||
| AO3-CT2 | 36 | 84.1 | 0.43 | (0.02) | 10.25 | (0.24) | 173.05 | (6.35) | 16.9 | (0.2) | |||||
| AO3-OM2 | 36 | 84.1 | 0.71 | (0.06) | ns | 14.47 | (1.05) | ns | 282.52 | (23.91) | ns | 19.5 | (0.2) | ** | |
| AO3-OM2ED | 36 | 84.1 | 0.68 | (0.05) | ns | 10.97 | (0.93) | ns | 276.49 | (21.00) | ns | 25.2 | (0.2) | ** | |
| NI4-CT | 24 | 359.7 | 0.59 | (0.18) | 9.19 | - | 245.13 | - | 26.7 | - | |||||
| NI4-OM1 | 24 | 359.7 | 0.57 | (0.07) | ns | 9.87 | - | 234.67 | - | 23.8 | - | ||||
| NI4-OM1DT | 24 | 359.7 | 0.68 | (0.11) | ns | 10.98 | - | 280.12 | - | 25.5 | - | ||||
| NI4-RS | 24 | 359.7 | 0.46 | - | 8.63 | - | 192.94 | - | 22.4 | - | |||||
| NI4-OM2 | 24 | 359.7 | 0.51 | - | 7.92 | - | 209.80 | - | 26.5 | - | |||||
| NI4-0N | 24 | 359.7 | 0.39 | (0.11) | ns | 6.30 | - | 162.33 | - | 25.8 | - | ||||
| SH6-CT | 66 | 946.9 | 1.75 | - | 18.93 | - | 717.24 | - | 37.9 | - | |||||
| SH6-OM | 66 | 946.9 | 1.47 | - | 16.52 | - | 605.69 | - | 36.7 | - | |||||
| Mean | 26.1 | ||||||||||||||
Table 8.
Simulated biological N2 fixation in 2023.
| Site-plot | Flooded period | Irradiance at paddy surface for flooded period | BNF |
| (days) | (MJ m-2) | (kg N ha-1 yr-1) | |
| HO1-CT | 93 | 777.5 | 44.2 |
| HO1-OM | 93 | 773.3 | 43.9 |
| HO1-RN | 93 | 782.9 | 44.5 |
| HO1-0N | 93 | 845.0 | 48.8 |
| HO2-CT | 76 | 691.4 | 38.0 |
| AO3-CT1 | 103 | 888.9 | 51.0 |
| AO3-OM1 | 103 | 886.1 | 50.8 |
| NI4-CT | 82 | 963.5 | 57.7 |
| NI4-OM1 | 82 | 945.3 | 56.5 |
| NI4-OM1DT | 82 | 962.1 | 57.6 |
| NI4-RS | 82 | 958.6 | 57.4 |
| NI4-0N | 82 | 1042.3 | 63.1 |
| SH5-CT | 101 | 715.9 | 41.6 |
| SH5-OM | 101 | 699.3 | 40.5 |
Table 9.
Simulated biological N2 fixation in 2024.
| Site-plot | Flooded period | Irradiance at paddy surface for flooded period | BNF |
| (days) | (MJ m-2) | (kg N ha-1 yr-1) | |
| HO1-CT | 96 | 789.5 | 44.9 |
| HO1-OM | 96 | 782.4 | 44.4 |
| HO1-RN | 96 | 790.7 | 45.0 |
| HO1-0N | 96 | 852.9 | 49.2 |
| AO3-CT2 | 95 | 781.0 | 44.1 |
| AO3-OM2 | 95 | 780.4 | 44.1 |
| AO3-OM2ED | 88 | 733.6 | 41.0 |
| NI4-CT | 88 | 973.4 | 58.7 |
| NI4-OM1 | 88 | 952.6 | 57.2 |
| NI4-OM1DT | 88 | 967.0 | 58.3 |
| NI4-RS | 88 | 965.0 | 58.3 |
| NI4-OM2 | 88 | 966.8 | 58.3 |
| NI4-0N | 88 | 1033.0 | 62.6 |
| SH6-CT | 101 | 646.0 | 34.2 |
| SH6-OM | 94 | 630.5 | 33.2 |
Table 10.
Contributions of BNF and ratoon rice to soil N pool: Organic N in 0-30cm soil layer at the end of 2023 or 2024 simulated with BNF and ratoon rice (S1), with BNF (S2), and without BNF and ratoon rice (S3).
Table 10.
Contributions of BNF and ratoon rice to soil N pool: Organic N in 0-30cm soil layer at the end of 2023 or 2024 simulated with BNF and ratoon rice (S1), with BNF (S2), and without BNF and ratoon rice (S3).
| Site | HO1 | HO2 | AO3 | NI4 | SH5-CT | SH6 | |||||
| Plot | CT | CT | CT | CT | OM1 | OM1DT | RS | 0N | CT | OM | CT |
| Simulated organic N in 0-30cm soil layer (kg N ha-1) | |||||||||||
| S1 | 11716 | 5227 | 5772 | 5303 | 5726 | 5716 | 5383 | 5142 | 6016 | 7335 | 5212 |
| S2 | 11699 | 5213 | 5695 | 5127 | 5514 | 5533 | 5289 | 4975 | 5833 | 7103 | 5104 |
| S3 | 11478 | 4973 | 5356 | 4777 | 5205 | 5179 | 4974 | 4589 | 5745 | 7042 | 4931 |
| Contribution to the organic N pool (kg N ha-1) | |||||||||||
| BNF 1) | 221 | 240 | 339 | 349 | 309 | 354 | 316 | 386 | 88 | 61 | 172 |
| Ratoon rice 2) | 17 | 14 | 77 | 177 | 212 | 183 | 94 | 166 | 183 | 233 | 108 |
| Sum | 238 | 253 | 416 | 526 | 521 | 536 | 410 | 553 | 271 | 293 | 280 |
| Contribution to the organic N pool (%) | |||||||||||
| BNF | 1.89 | 4.59 | 5.87 | 6.58 | 5.39 | 6.19 | 5.86 | 7.51 | 1.46 | 0.82 | 3.31 |
| Ratoon rice | 0.15 | 0.26 | 1.33 | 3.34 | 3.71 | 3.19 | 1.74 | 3.24 | 3.05 | 3.17 | 2.07 |
| Sum | 2.03 | 4.85 | 7.20 | 9.92 | 9.10 | 9.38 | 7.61 | 10.75 | 4.51 | 3.99 | 5.38 |
|
1) Quantified as the difference between S2 and S3. 2) Quantified as the difference between S1 and S2. | |||||||||||
Disclaimer/Publisher’s Note: The statements, opinions and data contained in all publications are solely those of the individual author(s) and contributor(s) and not of MDPI and/or the editor(s). MDPI and/or the editor(s) disclaim responsibility for any injury to people or property resulting from any ideas, methods, instructions or products referred to in the content. |
© 2025 by the authors. Licensee MDPI, Basel, Switzerland. This article is an open access article distributed under the terms and conditions of the Creative Commons Attribution (CC BY) license (http://creativecommons.org/licenses/by/4.0/).
Copyright: This open access article is published under a Creative Commons CC BY 4.0 license, which permit the free download, distribution, and reuse, provided that the author and preprint are cited in any reuse.


