Preprint
Article

This version is not peer-reviewed.

Response of Nitrogen Fertilizer Utilization, Yield, and Quality of Hybrid Indica Rice to Nitrogen Reduction with Organic Fertilizer Application in the Karst Region

Submitted:

14 November 2024

Posted:

15 November 2024

You are already at the latest version

Abstract

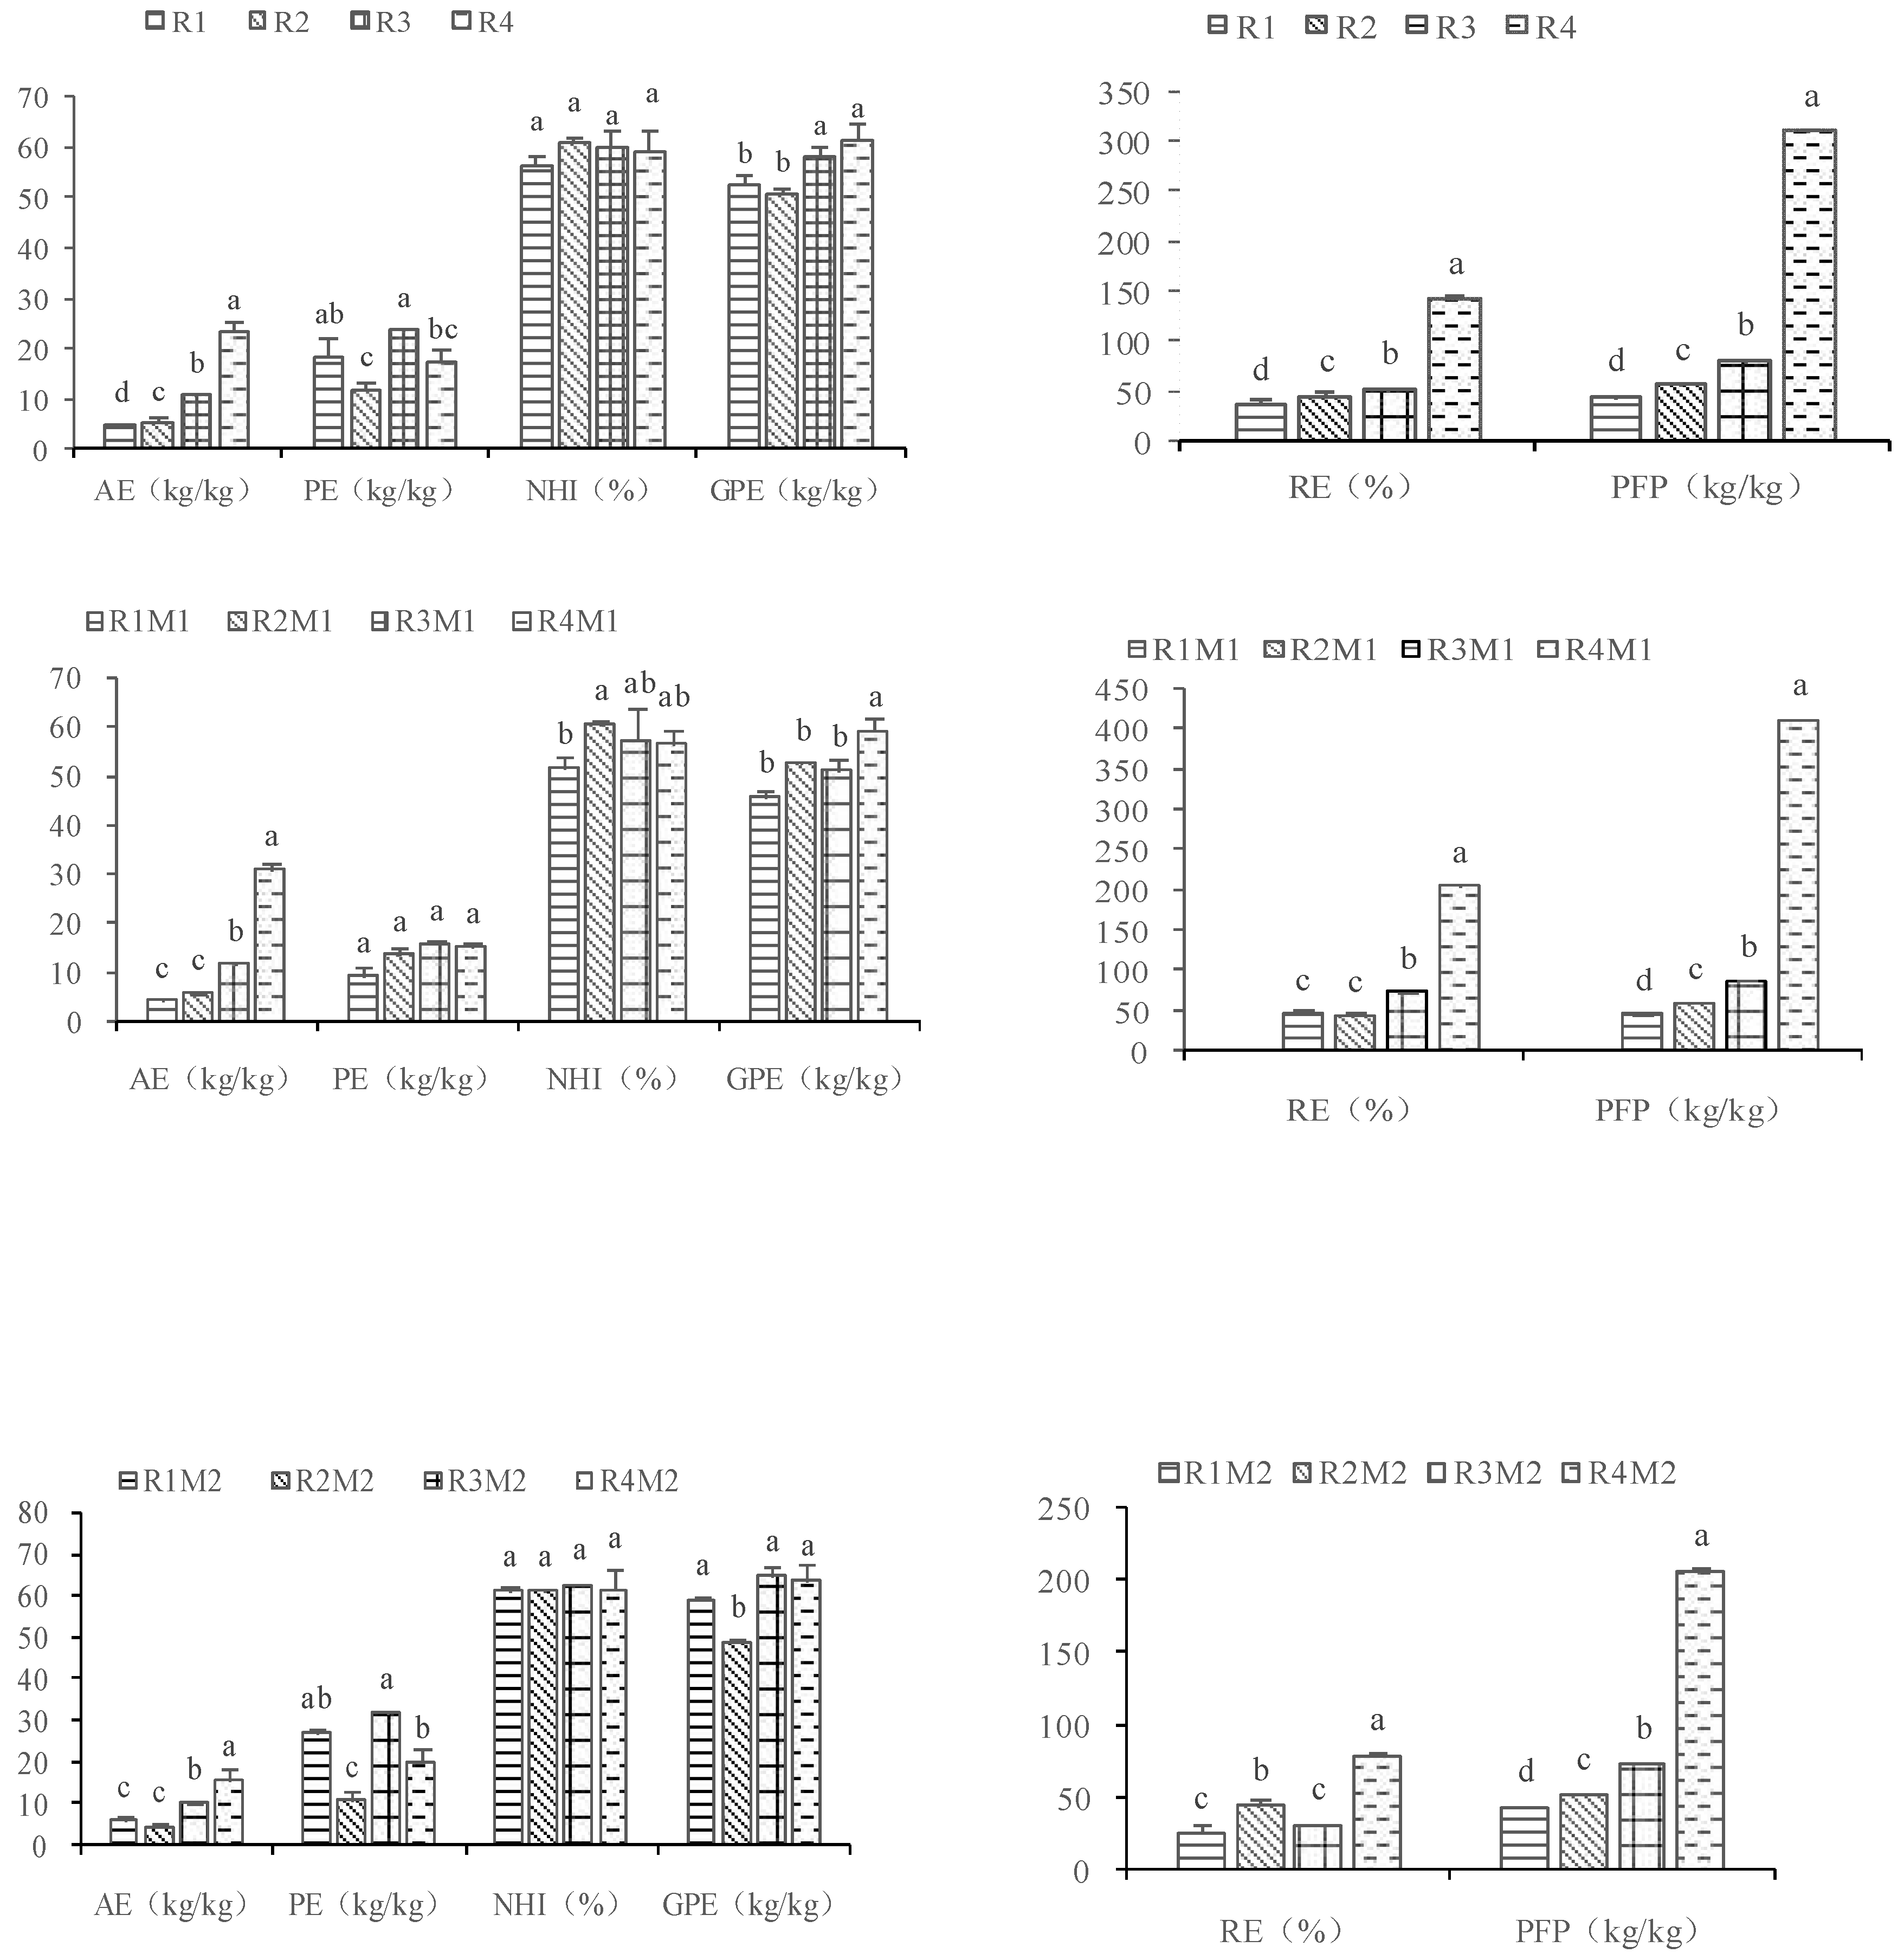
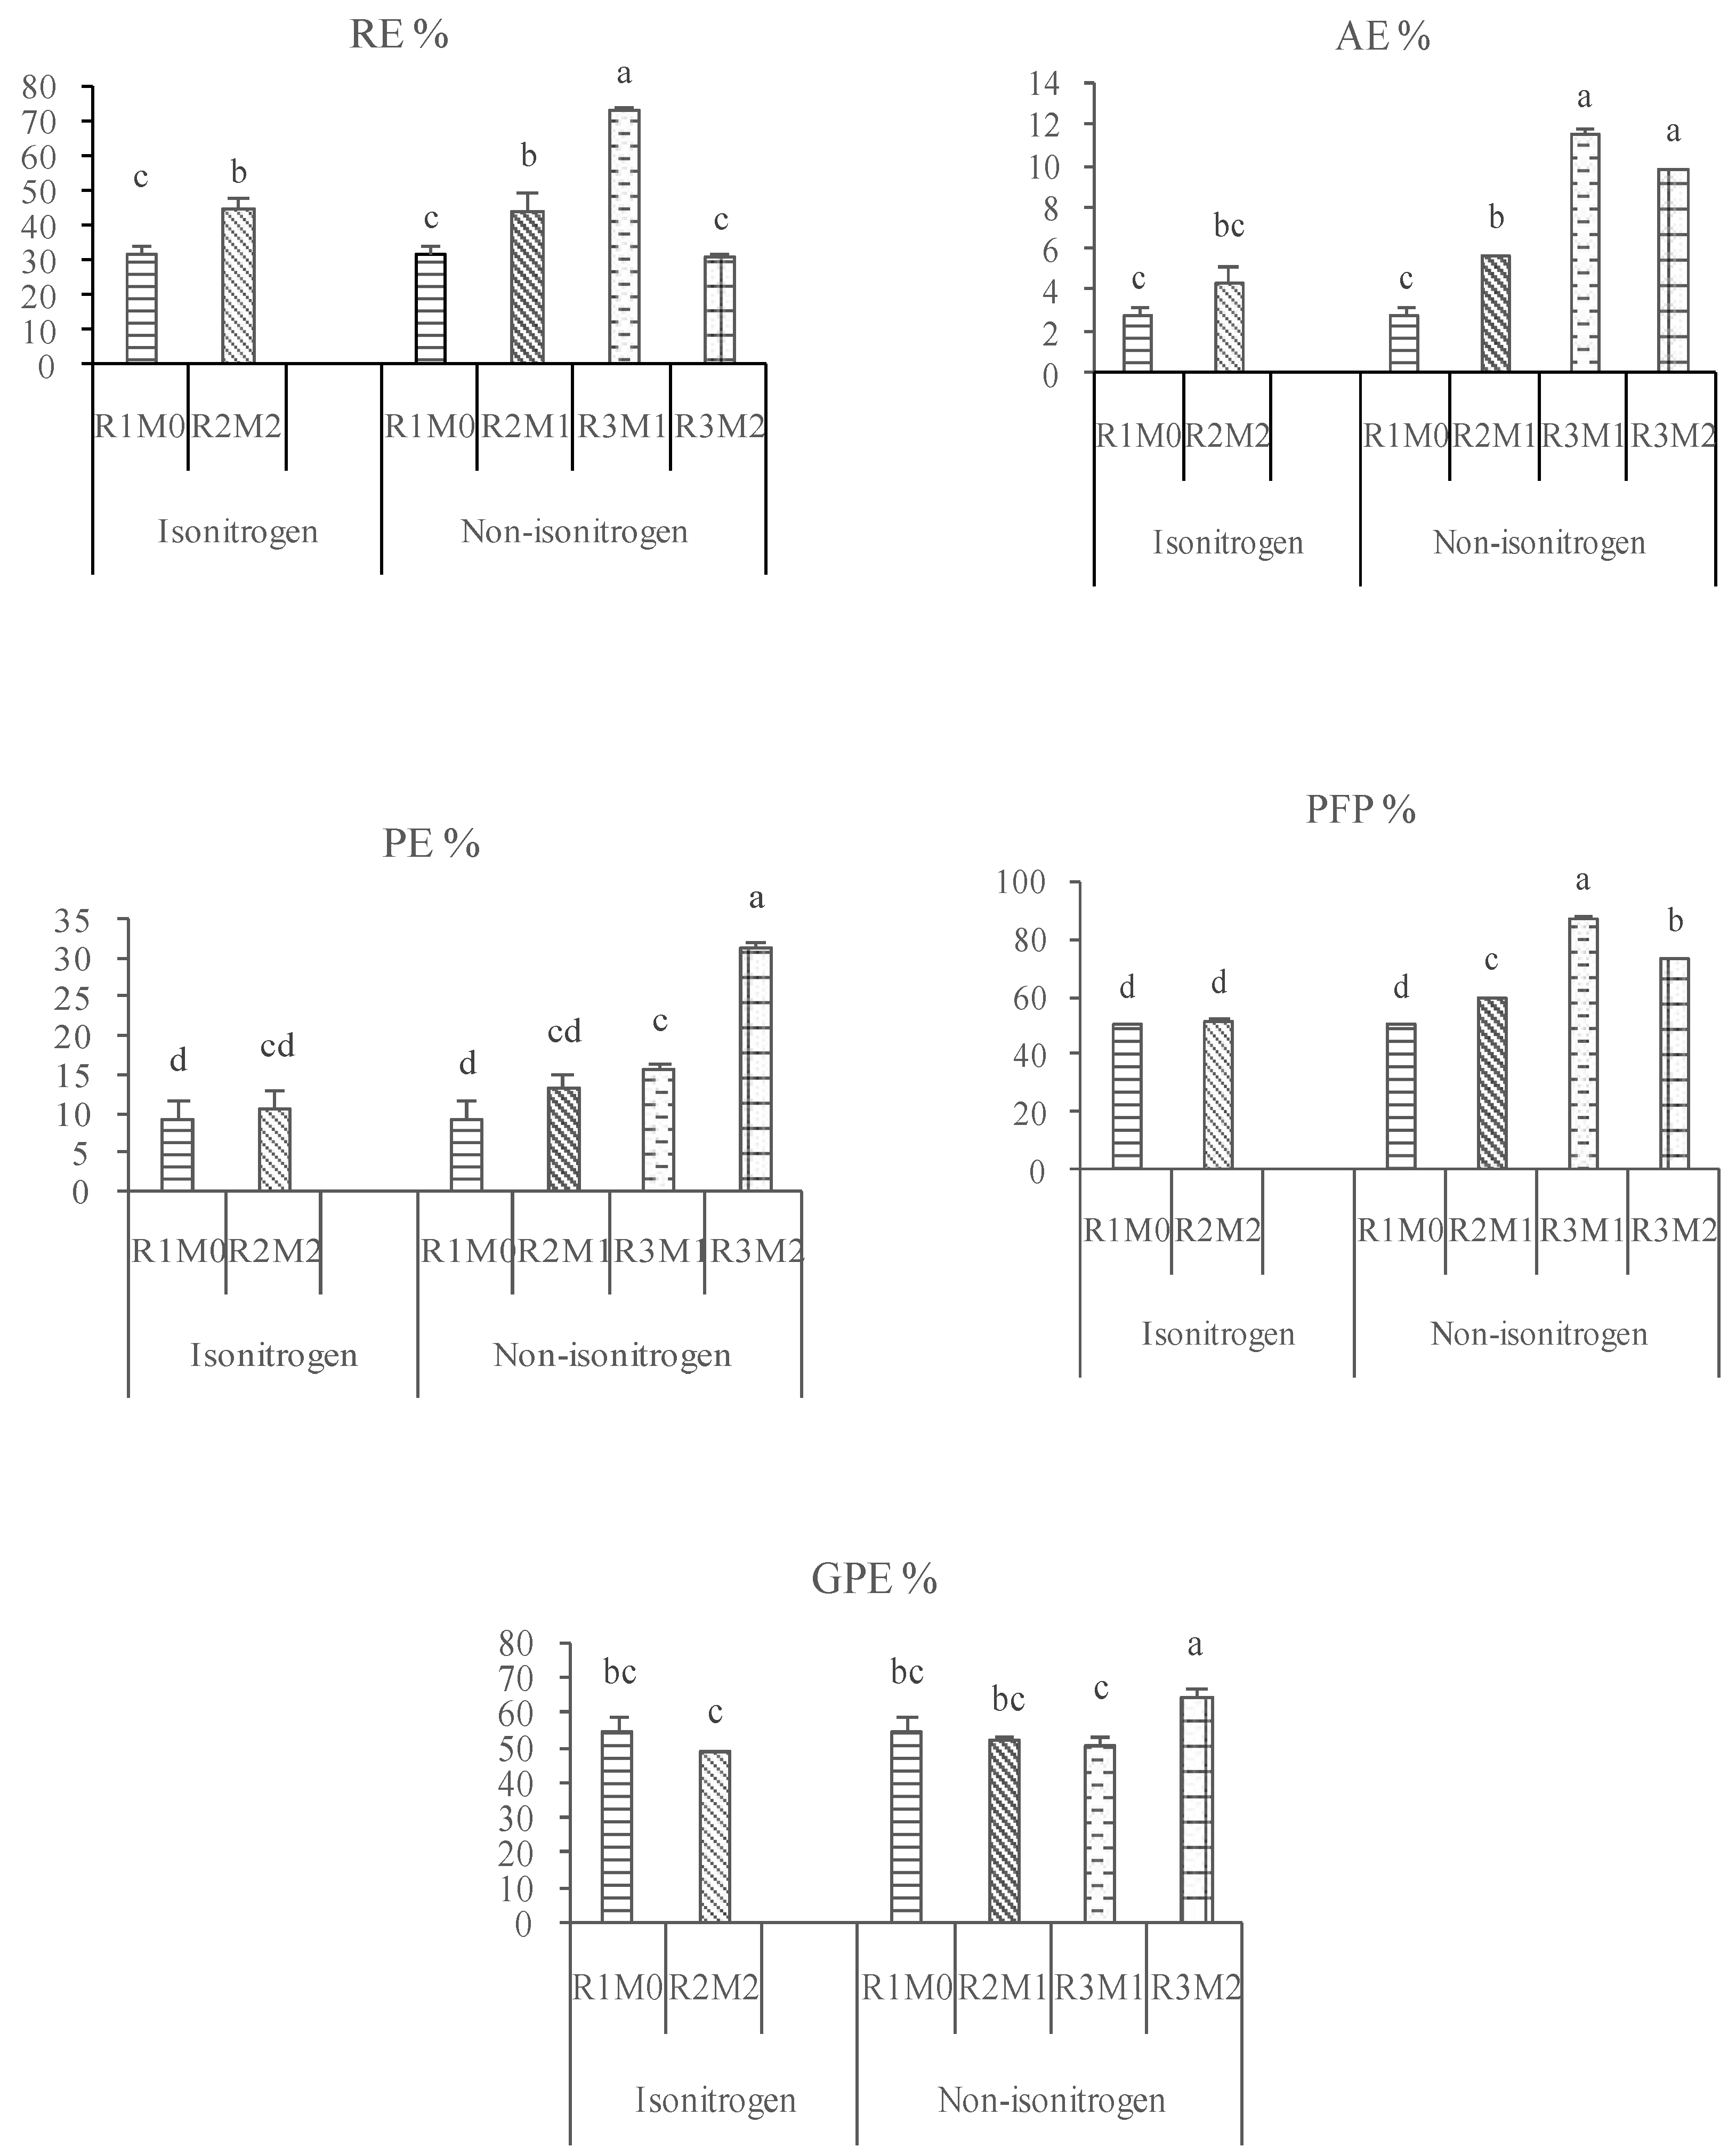
To investigate the effect of nitrogen reduction (NR) and combined application of organic fertilizer (OF) on nitrogen (N) utilization, yield, and quality of hybrid indica rice in the karst area, using rice ‘Yixiangyou 2115’ as the material, a split-plot design experiment of two factors of OF application rate as the main plots and NR rate as the subplots was carried out. The OF application rate had three levels: M0 (0 kg/ha), M1 (low OF, 1673 kg/ha), and M2 (high amount OF, 3346 kg/ha). The NR rate had four levels: R1 (NR rate 0%), R2 (NR rate 25%), R3 (NR rate 50%), and R4 (NR rate 100%). In this experiment, there were three modes of NR and OM application. Mode1: NR under the same amount of OM; Mode 2: NR and OM application under equal N conditions; and Mode 3: NR and combined application of OM under non-isonitrogen conditions. Rice yield was the highest under R3 in mode1. In modes 2 and 3, compared with single N fertilizer (R1M0), the yield of 25% NR combined with a high amount of OM (R2M2) increased significantly. In terms of yield components, under mode 1, with an increase in the N reduction rate, the effective panicle number showed a continuous decreasing trend, and the number of spikelets per panicle increased first and then decreased. The1000-grain weight and spikelet filling had no obvious change trend, but both were highest under R4. In modes 2 and 3, spikelet filling under NR combined with organic fertilizer treatment was higher than that of the single fertilizer treatment. In terms of N efficiency, in mode 1, with the increase in the N reduction rate, N recovery efficiency (RE), agronomic efficiency (AE), and partial factor productivity (PFP) showed a continuous increase trend, all of which were highest under R4. In mode 2, compared with R1M0, the RE of R2M2 significantly increased. In mode 3, compared with R1M0, the AE and PFP of 50% N reduction with low or high amounts of organic fertilizer were significantly increased. In terms of rice processing quality, in mode 1, as the N reduction rate improved, the milled rice rate and head rice rate continued to decline, but in modes 2 and 3, compared with the treatment of chemical fertilizer alone, the brown rice rate, milled rice rate, and head rice rate of the treatment of NR combined with OF improved. In terms of appearance quality and cooking nutritional quality of rice, under the same amount of OF, compared with no NR, the chalky degree and chalky rice rate of NR decreased, but gum consistency increased; meanwhile, under the condition of isonitrogen or non-nitrogen, compared with single N fertilization, the consistency of gel of the treatment of NR combined with OF increased. In summary, NR combined with OF fertilization mode was conducive to the improvement of N efficiency, yield, and quality of hybrid indica rice.

Keywords: 
;  ;  ;  ;  ;  

1. Introduction

In recent years, due to the frequent application of nitrogen (N) fertilizer by farmers, the ecological environment of farmland has been seriously damaged, causing considerable damage to the soil and problems such as declining yield and low N fertilizer utilization [1-6]. Therefore, it is crucial to appropriately reduce the N fertilizer application. The large number of elements and trace elements contained in organic fertilizers play an indispensable role in the growth and development of rice [7]. The rational application of organic fertilizer (OF) can not only increase soil organic matter content but also promote crop growth and increase crop yield [8-9]. Tu et al. [10] showed that compared with a single N fertilizer treatment, the yield of OF with 10% N reduction (NR) treatment was significantly increased. Gao et al. [11] demonstrated that compared with a single application of chemical fertilizer treatment, the yield under 20% NR combined with green manure treatment increased by 6.76%. Ding et al. [12] found that, compared with a single application of chemical fertilizer, 55% NR and commercial OF increased yield by 9.42%. In addition, some scholars have shown that NR and OF can not only increase yield but also enhance N utilization and improve quality. Liu et al.[13] reported that, compared with a single application of chemical fertilizer, 50% NR combined with pig manure OF was conducive to the improvement of N recovery efficiency (RE), agronomic efficiency (AE), and partial factor productivity (PFP). In contrast, Yu et al.[14] indicated that, compared with a single application of chemical fertilizer, NR and commercial OF reduced RE, while there was no significant change in AE and PFP. In terms of rice quality, Yang et al.[15] showed that a 25% NR with cattle stable fertilizer improved rice processing, appearance, and cooking quality compared with chemical fertilizer alone. Similarly, Li [16] indicated that a 33.3% NR with commercial OF improves rice processing, appearance, and cooking quality compared with chemical fertilizer alone. Therefore, in 2021, we carried out a field experiment in Huangping County, Guizhou Province using hybrid indica rice ‘Yixiangyou 2115’ as the material to study the response of N fertilizer utilization, yield, and quality to NR and OF. The results of this study could provide a theoretical basis and practical guidance for the technical promotion of NR and OF.

2. Materials and Methods

2.1. Experimental Site

The experiment was conducted in Zhaibi Village, Jiuzhou Town, Huangping County, Guizhou Province, China (26° 59′ 44.59″ N, 107° 43′ 58.90″ E) in 2021. The planting area had a subtropical humid climate, an altitude of 698 m, and an annual average temperature of 15.7°C. The frost-free period and average annual rainfall were 268 days and 1200 mm, respectively. Soil physicochemical indexes of the cultivation layer in the test field were as follows: total nitrogen (N), 2.55 g/kg; total phosphorus, 0.38 g/kg; total potassium, 13.27 g/kg; pH 5.3; organic matter, 25.37 g/kg; available N, 157.00 mg/kg; available phosphorus, 16.37 mg/kg; available potassium, 162.86 mg/kg.

2.2. Experimental Materials.

The test variety was Yixiangyou 2115, and the organic fertilizer (OF) was Laili OF produced by ZunyiJunyu Bioengineering Co., Ltd. The N, phosphorus, and potassium contents of organic fertilizer were determined to be 1.345%, 0.949%, and 2.365%, respectively. Urea, superphosphate, and potassium chloride were used as N , phosphorus, and potassium fertilizers, respectively.

2.3. Experimental Design

A split-plot design with three replicates was adopted in this experiment. The organic fertilizer application rate was assigned to the main plots, and three levels were set: M0 (0 kg/ha), M1 (1673 kg/ha, that is, 22.5 kg N/ha, low amount of OF), and M2 (3346 kg/ha, that is, 45 kg N/ha, high amount of OF).The N reduction (NR) rate was assigned to the subplots, and four levels were set: R1 (180 kg N/ha, NR rate 0%), R2 (135 kg N/ha, NR rate 25%), R3 (90 kg N/ha, NR rate 50%),and R4 (0 kg N/ha, NR rate 100%).The amount of phosphorus and potassium fertilizer used in each treatment was the same(96 kg P2O5/ha and 135 kg K2O/ha, respectively). The amount of phosphorus and potassium contained in the applied OF was included in the total phosphorus and potassium of each treatment. The size of each subplot was 17.28 m2. OF was used as a base fertilizer. N fertilizer was split applied as follows: 35% basal, 20% at 7 days after transplanting, 30% at the panicle initiation stage, and 15% at the booting stage. Phosphate fertilizer was used as a base fertilizer, and potassium fertilizer was applied as follows: 50% basal and 50% flower-promoting fertilizer. A ridge measuring 30 cm in height and 20 cm in width was constructed around the subplots. This covering was pressed up to 30 cm underground to prevent infiltration of water and fertilizer. A 60 cm walkway was established between replicates for field operation and investigation.
The rice seedlings were sown on 19 April and transplanted on May 27 with a row spacing of 30 cm×20 cm. One seedling was planted per hole. The water surface in the field was kept at 3–5cm from the early tillering stage until about 10d before maturity, and irrigation was stopped, leaving it to dry naturally. Fine field management and diseases and pests in rice were controlled in a timely manner.

2.4. Measurement Items and Mathods

2.4.1. Measurement of Yield and Its Components

At the maturity stage, rice yield and its related components were determined by analyzing 90 hills in each subplot and adjusted to a moisture content of 0.135 g H2O g−1 fresh weight. Six representative hills were selected based on the average number of stems and tillers in the field survey as test samples to investigate the yield components of rice.

2.4.2. Determination of Plant N Content

In the rice jointing and heading stages, four holes of representative plants were taken according to the average number of stem tillers in each community, and six holes were taken at the maturity stage. These representative plants were killed at 105°C for 30 min and dried to a constant weight at 75°C, which was converted into the dry matter weight of rice. The samples of each part were ground and sieved, and 0.50g of the plant samples were weighed and boiled in H2SO4-H2O2, and then the total N content was determined using the Kjeldahl method.

2.4.3. Rice Quality Determination

The measurement of rice quality included processing quality, appearance quality, cooking quality, and nutritional quality. Processing quality included brown rice rate, milled rice rate, and head rice rate. Appearance quality included the rice grain aspect ratio, chalk whiteness, chalk whiteness, and chalk white grain rate. Cooking quality was evaluated using gelatinization temperature, gum consistency, and amylose content. Nutritional quality included protein content.
(1) Processing quality:
According to the standard NY147-88 “Rice Quality Determination Method” of the Ministry of Agriculture of the People’s Republic of China, the brown rice rate, milled rice rate, and head rice rate were determined after 3 months of rice storage, using the following equations:
Brown rice rate (%) = brown rice weight × 100/sample grain weight;
Milled rice rate (%)=milled rice weight× 100/sample grain weight;
Head rice rate (%) = head rice weight × 100/sample grain weight.
(2) Appearance quality:
The appearance quality tester of Wanshen SC-E rice produced by Hangzhou Wanshen Testing Technology Co., Ltd. was used to determine the rice grain length-width ratio, chalkiness degree, and chalky rice rate.
Chalky rice rate (%) = number of chalk white grains/total number of grains× 100;
Chalkiness degree (%) = chalky rice rate× chalk white size× 100.
(3) Cooking quality:
According to NY147-88 “Rice Quality Determination Method,” the gelatinization temperature was determined by the alkali spreading value method. The gel consistency was determined using the rice gel extension method, and the amylose content was determined using the iodine blue colorimetric method.
(4) Nutritional quality:
The protein content of rice was determined using a SKD-200 Kjeldahl analyzer, and the conversion coefficient was 5.95.

2.4.4. Calculation of Relevant Indicators

N uptake utilization rate (%) = (N uptake of crops in N application area − N uptake of crops in blank area)/N application rate;
Agronomic utilization rate of N fertilizer (kg·kg−1) = (yield in N application area − yield in blank area)/N application rate;
Physiological utilization rate of N fertilizer (kg·kg−1) = (yield in N application area − yield in blank area)/(N uptake by plants in fertilization area - N uptake by plants in blank area);
N fertilizer partial productivity = yield per N application area/N application rate per zone;
N rice production efficiency (kg·kg−1) = rice yield in fertilization area/N uptake in mature plants;
N harvest index = grain N uptake/plant N accumulation.
2.4.5. Statistical analysis.
The data were analyzed by SAS9.0 (SAS Institute, Cary, NC, USA).

3. Results

3.1. Yield and Its Composition

3.1.1. Yield

Table 1. shows that the nitrogen reduction (NR) rate and the interaction between the NR rate and the organic fertilizer (OF) application rate had a significant impact on grain yield. For the main effect of the NR rate, there was no obvious change trend in grain yield with the increase in the NR rate, but under a low or high amount of OF, the NR rate of 50% (R3) was the highest, and R3 was significantly higher than that of 25% NR (R2) and 100% NR (R4). The application of a low or high amount of OF with 50% NR was more conducive to increasing grain yield than 25% and 100% combined with NR.
Table 2. shows that under isonitrogen, compared with single nitrogen fertilizer (180 kgN/ha), the grain yield was significantly increased under 25% NR combined with a high amount of OF (R2M2).Under non-isonitrogen, the grain yield was significantly improved under a low or high OF amount with 50% (R3M1, R3M2) and a low OF amount under 25% NR (R2M1)compared with a single N application (180 kgN/ha).

3.1.2. Yield Component Factors

Table1 demonstrates that the NR rate had a significant impact on the number of spikelets per panicle (SPP), 1000-grain weight (TGW), and seed setting rate (SSR). As the NR rate increased, there were different changes in the yield components. Among them, the effective panicle number (EPN) and SPP displayed a trend of increasing first and then decreasing, while TGW and SSR were the opposite. The EPN of R2 was the highest, which was significantly higher than that of R4. The SPP of R3was the highest and was significantly higher than that of R4. The TGW and SSR were highest at R4 and were significantly higher than those of other NR treatments.
Under a low amount of OF, the EPN of the 0% NR rate (R1) was highest and was significantly higher than that of R4, but the difference between R2 and R3 treatment was not significant. R3 had the highest SPP and was significantly higher than that of the other NR treatments. The SSR and TGW of R4 were highest and significantly higher than those of the R3 treatment. Under a high OF amount, the SPP of R3 was also the highest and significantly higher than that of R4. The TGW and SSR were highest under R4 and were significantly higher than those of the other NR treatments. Whether under the combined application of low or high amounts of OF, excessive NR was not conducive to the increase of EPN and SPP, among which the NR rate should not exceed 25% for the EPN, and the NR rate of the SPP should not exceed 50%. However, for TGW and SSR, the 100% reduction in N was more conducive to the improvement of both.
Table 2 indicates that under isonitrogen, the SSR of R2M2 was significantly higher than that of a single N fertilizer (R1M0). Compared with R1M0, the SSR of R2M1 was significantly increased under non-isonitrogen.

3.2. N Efficiency

As shown in Figures 1 (I, II), the main effect of the NR rate indicates that as the NR rate improved, RE, AE, and PFP showed a continuous increasing trend, and the grain production efficiency(GPE) first decreased and then increased. These four N efficiency indexes were highest inR4, and all were significantly higher than those of R1 and R2. The N harvest index(NHI) showed a trend of increasing first and then decreasing, but there was no significant difference between the treatments.
Figure 1 (III, IV, V, VI) shows that under a low and high amount of OF, RE, AE, and PFP were highest in R4, which was significantly higher than other NR treatments. The PE of R3 was the highest among all treatments, which was significantly higher than that of R2 and R4 under a high amount of OF. The NHI increased first and then decreased when the NR rate improved. There was no significant difference between R2 and R3 under a low amount of OF, but it was significantly higher than that of R1.
Figure 2 demonstrates that under isonitrogen, the RE of R2M2 was significantly higher than that of R1M0. Under non-isonitrogen, compared with R1M0, the RE of R2M1 and R3M1 significantly increased. Additionally, the AE of R2M1, R3M1, and R3M2, and the PE of R3M1 and R3M2 significantly improved, and the PFP of R2M1, R3M1, and R3M2 and the GPE of R3M2 were significantly enhanced.
The results of variance analysis showed that the NR rate and the interaction between the NR rate and the OF application rate had a very significant impact on RE, AE, PE, PFP, and GPE.

3.3. Rice Quality

3.3.1. Processing Quality

Table 3 shows that the NR rate had no significant effect on the brown rice rate, but it had a significant or very significant effect on the milled rice rate (MRR) and the head rice rate (HRR). As the NR rate improved, the MRR and HRR continued to decrease.
Under a low amount of OF, with the increase in the NR rate, MRR and HRR showed a continuous decreasing trend, and R1 was significantly higher than R4. However, under a high amount of OF, although R3 and R4 decreased compared with R1, there was no significant difference from R1. The increase in the amount of OF improved the significant decrease in MRR and HRR caused by the increase in the NR rate.
Table 4 shows that, Under isonitrogen, compared with R1M0, the BRR and MRR of R2M2 showed no significant difference, but they increased by 1.45% and 2.02%, respectively. Under non-isonitrogen, compared with R0M1, the BRR and MRR of R2M1 also had no significant difference, but they increased by 1.4% and 0.62%, respectively; the BRR, MRR, and HRR of R3M2 had no significant difference compared with that of R0M1, but they increased by 1.06%, 1.36%, and 6.08%, respectively.

3.3.2. Appearance Quality

Table 5 indicates that with the increase in the NR rate, the chalkiness degree (CD) and chalkiness rate (CR) had a continuous downward trend. The CD of R1 was highest and was significantly higher than that of R4; the CR of R2 was highest and was not significantly different from R1 and R3 but was significantly higher than R4.
Under a low amount of OF, the CD and CR showed a trend of first decreasing and then increasing, while under a high amount of OF, the CD and CR showed the opposite trend. There was no significant difference in the length-width ratio (LWR) between treatments under a low or high amount of OF.
Table 6 demonstrates that under isonitrogen or non- isonitrogen, the CD and CR were not significantly different between treatments, but there were still differences. Under isonitrogen, compared with R1M0, the CD and CR of R2M2 decreased by 1.77% and 4.23%, respectively; compared with R2M0, the CD and CR of R3M2 decreased by 13.83% and 11.83%, respectively. Under non-isonitrogen, compared with R1M0, the CD of R3M1 and R3M2 decreased by 8.78% and 3.58%, respectively, and the CR decreased by 7.41% and 4.86%, respectively; compared with R2M0, the CD and CR of R3M1 decreased by 18.48% and 14.19%, respectively.

3.3.3. Cooking and nutritional quality

Table 7 indicates that the NR rate had an extremely significant effect on the protein content (PC) and a significant effect on the amylose content (AC). The main effect of the NR rate showed that as the NR rate improved, AC and GC continued to increase, both of which were largest under R4 and significantly higher than those of R1 and R2. With the increase in the NR rate, the PC continued to decline and was the largest under R1, but there was no significant difference between R1 and R2.
Under a low or high amount of OF, with the increase in the NR rate, the AC and GC continued to increase, while the PC showed a contrasting trend. Among them, under a low amount of OF, the AC was largest under R4 and was significantly higher than that of the other treatments. Under a high amount of OF, the GC was largest under R4 and was significantly higher than that of R2. The PC was highest at R1 under both OF volumes, but there was no significant difference between R1 and R2.
Table 8 shows that under isonitrogen or non-isonitrogen, there was no significant difference in the nutritional quality of rice cooking between the treatments, but a certain increase or decrease existed. Under isonitrogen, the GC of R2M2 increased by 3.66% compared with that of M0R1, and compared with R2M0, the GC and ASV of R3M2 increased by 8.85% and 1.48%, respectively. Under non-isonitrogen conditions, compared with R1M0, the ASV and PC of R2M1 increased by 5.76% and 1.75%, respectively; the GC of R3M1 or R3M2 increased by 2.43% and 2.05%, respectively. The GC and ASV of R3M1 increased by 1.9% and 2.44% compared with R2M0, respectively.

4. Discussion

In this study, there were three modes of NR and OF application: NR under the same amount of OF (mode 1); NR and OF application under isonitrogen conditions (mode 2); and NR and OF application under non-isonitrogen conditions (mode 3). In mode 1, the grain yield was highest at 50% NR, whether at a low or high amount of OF. However, Hu et al.[17] showed that rice yield continued to decline with the increase in NR rate under the application of 300 kg/ha OF. This conclusion differed from that of this study, which may be due to the lower amount of OF applied and the different types of OF compared with this study. Yang et al. [15] showed that under equal nutrient content, compared with conventional fertilization, the rice yield was higher under OF with a 25% NR. Iqbal et al.[18] showed that under the same nutrient content, compared with N fertilization alone, the yield of cow manure or poultry manure with 30% NR significantly increased. Ma[19] showed that under non-isonitrogen, compared with conventional fertilization, the yield of late rice significantly increased with a 62.5% NR combined with OF, and these conclusions were similar to this study. In modes 2 and 3 of this study, the yield was significantly higher under NR combined with OF treatment than under single N application (180kgN/ha). Regardless of the mode, NR and OF application can increase the yield, which may be because the application of OF can balance the nutrients in the soil and make the nutrient supply of rice sufficient throughout the growth period [20], in addition, OF application reduces chemical fertilizer N application, solving the problem of low nutrient utilization caused by excessive N application in conventional fertilization.
This study indicates that excessive NR (100% NR) under the same amount of OF is not conducive to an increase in EPN and SPP, which is similar to the results of Zhang [21]. This may be due to the obvious N deficiency in rice tillering growth and panicle differentiation due to excessive NR and insufficient nutrient supply, thus showing a smaller reservoir capacity [22]. However, the TGW and SSR were the opposite, and both were highest at 100% NR, indicating that a single application of OF had an increasing effect on TGW and SSR. This is similar to the findings of Gu [23]. The reason for this may be that compared with fast-acting chemical N fertilizer, OF has a gentle and continuous fertilizer effect, which can improve biological N fixation, thus, the N fertilizer can be continuously supplied throughout the entire growth period, which is beneficial to the nutrient supply of grain filling in the late growth period, thereby increasing TGW and SSR [24].
The N fertilizer utilization rate is a dynamic parameter reflecting the relationship between the crop, soil, and fertilizer, and it is also an important indicator for determining whether the fertilizer application rate and fertilization method are scientific and reasonable [25]. Wei et al.[26] showed that under the same amount of OF, as the NR rate increased, the RE, AE, and PFP increased first and then decreased. Under different conditions of total N application rate, compared with single N fertilization, NR combined with OF significantly improved RE and AE, which differs from the conclusion of this study. In this experiment, under mode 1, with the increase in the NR rate, the above-mentioned three N fertilizer utilization indexes continued to increase; meanwhile, in mode 3, compared with a single N fertilizer (180kgN/ha), NR combined with OF not only improved the RE and AE but also improved PFP, PE, and GPE. This may be due to the difference in OF application amount; the OF application rate in this study was higher than that in Wei et al.[26], and increasing the OF application rate was conducive to improving the nutrient preservation capacity of the soil, reducing N leaching, and increasing the microbial activity in the soil, promoting the decomposition of organic matter and adding more effective nutrients to the soil, thereby promoting absorption and utilization in rice[27,28]. Ren et al.[29] showed that, under the same nutrient content, compared with single N fertilizer, OF application with 50% NR significantly improved the RE. He et al.[30] indicated that under the same total N application rate, compared with a single N fertilizer, the N absorption and utilization rate significantly increased under OF with 20% NR, which was similar to the conclusion obtained in mode 2 in this experiment. Under the same conditions of total N application rate, compared with single N fertilizer (180kgN/ha), 25% NR combined with OF significantly improved the RE, further indicating that 25–50% NR combined with OF can improve the N absorption and utilization rate.
In mode 1 of this study, with the increase in the NR rate, the MRR and HRR continued to decrease. Overall, under the same amount of OF, the increase in the NR rate was not conducive to improving the quality of rice processing, similar to the research conclusion of Li [16]. This may be because N fertilizer is closely related to the grouting effect in the late growth stage of rice, and the formation of rice processing quality is inseparable from the grout process, so the processing quality of NR treatment is reduced [31]. In modes 2 and 3, although the rice processing quality indicators did not differ significantly between treatments, the BRR and MRR were improved under NR and OF treatment compared with single chemical fertilizer, and the HRR was also increased under mode 3. The results showed that based on a single application of chemical fertilizer, the mode of NR combined with OF was more conducive to improving the quality of rice processing than the NR mode under the same amount of OF.
Zhou[32] reported that with the increase in the NR rate, CD, and CR increased in single-crop rice, while there was no significant change in the length-width ratio, which is different from the conclusion of this paper. This study showed that, in mode 1, as the NR rate increased, CD and CR had a decreasing trend, and there was no significant change in LWR. NR under OF application improved the appearance quality of rice. This may be because NR combined with OF is beneficial for potassium absorption in rice and enhances the transport of potassium in plants, which is beneficial for improving the appearance quality of rice [33-35]. Under modes 2 and 3 of this experiment, compared with the single application of chemical fertilizer, the CD and CR of NR combined with OF treatment decreased, indicating that NR combined with OF was beneficial in improving the appearance quality.
This study showed that in mode 1, with the application of OF, with the increase in the NR rate, AC and GC had an increasing trend, indicating that NR combined with OF increased the GC, thereby ensuring the palatability of rice. However, the amylose content increased, but the range was15–17%, which is a low amylose content; therefore, the rice remained soft and elastic after cooking. This is consistent with the conclusions of Jiang et al [36]. In terms of nutritional quality, PC showed an opposite trend to AC and GC, indicating that NR under the same amount of OF was not conducive to the improvement of PC, which was consistent with the research conclusion of Shao [37]. This may be because chemical fertilizer work earlier than OF, allowing rice plants to store enough nutrients in the early stages, thus ensuring the material preparation for grouting and filling the grain [32]. In modes 2 and 3, the GC of NR and OF treatment was higher than that of the single fertilizer treatment, and the PC of R2M1 increased by 1.75% compared with R1M0 in mode 3. NR combined with OF application improved the GC compared with the single application of chemical fertilizer, and the appropriate NR rate increased the protein content under the amount of OF.

5. Conclusions

The following findings were revealed: (1) Three NR modes increased grain yield, among which a 50% reduction in N under OF application was the most conducive to increasing grain yield. Under isonitrogen or non-isonitrogen, the grain yield was significantly higher under NR combined with OF treatment than under a single nitrogen fertilizer (180 kgN/ha).
(2) Under the combined application of OF, excessive NR was not conducive to the increase of the EPN or SSP, among which the NR rate did not exceed 25% for the EPN, and the SPP did not exceed 50%. However, for TGW and SSR, a NR rate of 100% was more beneficial to the improvement of both. Under isonitrogen or non-isonitrogen, the SSR significantly increased under the NR combined application compared with a single nitrogen fertilizer (180 kgN/ha).
(3) Under the mixed application of OF, as the NR rate increased, RE, AE, and PFP continued to increase. Compared with a single nitrogen fertilizer (180 kgN/ha), the RE, AE, PFP, PE, and GPE were significantly increased by NR combined with OF under isonitrogen or non-isonitrogen.
(4) Under the mixed application of OF, NR was not conducive to improving the processing quality of rice, but it improved the appearance quality of rice and the GC in the cooking quality index. Under isonitrogen or non-isonitrogen, the processing quality, appearance quality, and GC were improved under NR combined with OF treatment compared with a single fertilizer treatment.

Author Contributions

Conceptualization, Y.F. and G.X.; Methodology, Y.F.; software, G.X. and X.Y.; formal analysis, G.X. and X.Y.; Funding acquisition, Y.F.; Investigation, X.W., Y.G., H.R., Z.H., J.L.; Supervision, X.W., Y.G.; Writing–original draft, G.X. and X.Y.; Writing–review and editing, Y.F. All authors have read and agreed to the published version of the manuscript.

Funding

This work was supported by the National Key Research and Development Plan Project Sub Topic of China (2022YFD1901500/2022YFD1901505-07), the National Natural Science Foundation of China (32260531), the Talents Program of High Level and Innovative in Guizhou Province (Grant no. Qiankehe Platform Talents [2018]5632, 5632-2), the Key Laboratory of Molecular Breeding for Grain and Oil Crops in Guizhou Province (Qiankehezhongyindi (2023)008), and the Key Laboratory of Functional Agriculture of Guizhou Provincial Higher Education Institutions (Qianjiaoji (2023) 007).

Data Availability Statement

The data presented in this study are available on request from the corresponding author.

Conflicts of Interest

The authors declare that they have no known competing financial interest or personal relationships that could have appeared to influence the work reported in this paper.

References

  1. Liu, M, Feng, H, Chen, X. et al. Organic amendments with reduced chemical fertilizer promote soil microbial development and nutrient availability in a subtropical paddy field: The influence of quantity, type and application time of organic amendments. J. Applied Soil Ecology.42 (2) ,166-175(2009).. [CrossRef]
  2. Peng, S.B. ,Huang, J. L. , Zhong, X. H.et al. Research Strategy in Improving Fertilizer-nitrogen Use Efficiency of Irrigated Rice in China. J. Scientia Agricultura Sinica.35(9),1095-1103 (2002)..
  3. Chen, H.F. , Yang, J. Research on the connotation of high-quality development of grain industry. J. Quality & Market. (01),59-61(2021).
  4. Ladha, J.K. ,Pathak, H, Krupnik, T. J.et al. Efficiency of Fertilizer Nitrogen in Cereal Production: Retrospects and Prospects. J. Advances in Agronomy.87,85-156(2005)..
  5. Zhang, F. S. ,Wang, J. Q. ,Zhang, W. F.et al. Nutrient use efficiencies of major cereal crops in China and measures for improvement. J. ActaPedologica Sinica.45(5):915-924 (2008)..
  6. Li, L.K. Research on the impact of production factor utilization on grain production increase and environmental impact. Ph.D. dissertation, China Agricultural University, Beijing, China(2015).
  7. Lu, N.W. Preliminary study on the effect of nitrogen reduction and organic fertilizer application in rice. Ph.D. dissertation, Northeast Agricultural University, Haerbin, Heilongjiang, China(2018).
  8. Mando, A ,Bonzi, M ,Wopereis, M. et al. Long-term effects of mineral and organic fertilization on soil organic matter fractions and sorghum yield under Sudano-Sahelian conditions. J. Soil Use & Management.21 (4) ,396-401(2010).. [CrossRef]
  9. Milkha, S. , Aulakh, et al. Denitrification, N2O and CO2 fluxes in rice-wheat cropping system as affected by crop residues, fertilizer N and legume green manure. J. Biology& Fertility of Soils (2001)..
  10. Tu, Q ,Zhang, Z ,Liu, M. Effect of Reducing Nitrogen and Applying Organic Fertilizer on Nitrogen Use Efficiency and Rice Yield in Red Soil Regions of the Southern China. J. Journal of Energy, Environmental & Chemical Engineering.6 (1)(2021).. [CrossRef]
  11. Gao, Q, Dang, S, Huang, X.l.et al. Research on combined application of organic and inorganic fertilizer-chemical fertilizer reduction technology. J. Northern rice. 52(04): 19-22(2022).
  12. Ding, H. X. ,Wu, X. Q. ,Lu, Y. Effects of combined application of organic and inorganic fertilizers on rice and wheat yield and soil quality. J. Zhejiang Agricultural Sciences. 62(03), 505-507(2021).
  13. Liu, H.J., Jiang, H.W., Sun, G.F.et al. Effects of Different Combined Application Ratios of Organic and Inorganic Fertilizers on Nitrogen Uptake and Utilization Efficiency of Rice. J. Soil and Fertilizer in China. (05), 61-66(2017).
  14. Yu, Q.Q., Wang, H.F., Zhao, X.L. et al. Effects of combined application of organic and inorganic fertilizers on rice yield and nitrogen efficiency in Tongnanarea. J. Anhui Agricultural Sciences. 46(35), 137-139(2018).
  15. Yang, S.L., Hang, X.C., Li, Y.et al. Effects of long-term combined application of organic and inorganic fertilizers on rice growth, dry matter accumulation and yield. J. Zhejiang Journal of Agricultural Sciences. 34(09), 1815-1825(2022).
  16. Li, H. Study on nutrient accumulation and nitrogen use efficiency of rice with combined application of organic-inorganic fertilizer. Ph.D. dissertation, Northeast Agricultural University, Haerbin, Heilongjiang, China(2012).
  17. Hu, F. L. ,Yu, H. M. , Shen, B.S. Effects of nitrogen reduction and organic fertilizer on nitrogen efficiency and yield efficiency of rice in cold land. J. Northern rice. 50(01), 13-17(2020).
  18. Iqbal, A, He, L, Mcbride, S. G.et al. Manure Applications Combined With Chemical Fertilizer Improves Soil Functionality, Microbial Biomass and Rice Production in a Paddy Field. J.(2021).
  19. Ma B. Effects of organic fertilizer replacing part of nitrogen fertilizer on soil fertility and yield in subtropical paddy field. Ph.D. dissertation, Hunan Agricultural University, Changsha, Hunan, China(2017).
  20. Liu, Y.L., Li, Y, Bai, Y.J.et al. Effects of long-term different fertilization on dry matter and phosphorus accumulation and transport in rice. J. Plant Nutrition and Fertilizer Science. 25(07),1146-1156 (2019).
  21. Zhang, W.J. Effects of combined organic-inorganic fertilizer application on crop growth and quality in rice/ryegrass rotation system. Ph.D. dissertation, Inner Mongolia Agricultural University, Huhehaote, Neimenggu, China(2021).
  22. Xu, W.B., Li, M, Luo, D.Q.et al. Effects of nitrogen reduction on yield and photosynthetic characteristics of machine-inserted hybrid indica rice. J. Soil and Fertilizer in China. (06),189-196(2021).
  23. Gu, W.W., Gu, S.P., Zhang ,Q.et al. Effects of organic-inorganic combined application on rice yield and yield composition factors. J. Shanghai Journal of Agricultural Sciences. 31(06), 95-100.24(2015).
  24. Zhao,J.H.,Zhang,C.Z.,Zhang, J.B. Effects of excited straw depth on soil nutrients and winter wheat yield. J. Journal of Soil Science. 53(02), 438-449(2016).
  25. Zhang, X.C., Dai, Q.G., Hu, X.X.et al. Effects of combined application of slow-release urea and conventional urea under soil with different textures on rice yield and growth and development. J. Acta Crops Sinica. 38(08), 1494-1503(2012).
  26. Wei, J, Guo, S.F., Zhai, L.M.et al. Effects of combined application of organic and inorganic fertilizers on nitrogen efficiency and nitrogen loss risk in rice. J. Soil. 50(05), 874-880(2018).
  27. Ren, T ,Wang, J ,Chen, Q , et al. The Effects of Manure and Nitrogen Fertilizer Applications on Soil Organic Carbon and Nitrogen in a High-Input Cropping System. J. Plos One.9 (5) ,e97732(2014).. [CrossRef]
  28. Chen, H.N., Zhou, H.P., Wen, Y.L.et al. Ecostoichiometric characteristics of nutrients and enzyme activities of clay soil under long-term different fertilization. J. Plant Nutrition and Fertilizer Science. 28(06): 972-983(2022).
  29. Ren, Y, Shao, J.J., Lu, C.G.et al. Effects of fertilizer application on rice yield and nitrogen uptake.J. Zhejiang Agricultural Sciences. 62(08), 1486-1488(2021).
  30. He, X, Rong, X M, Xie, Y, et al. Effects of Fertilization Reduction and Organic Fertilizer Replacement on Rice Yield and Nutrient Utilization. J. Hunan Agricultural Sciences (2017)..
  31. Xi, M, Xu, Y.Z., Sun, X.Y.et al. Effect of nitrogen ear fertilizer on rice chalk white grain filling and its relationship with processing quality. J. China Agricultural Science and Technology Review. 23(09), 144-151(2021).
  32. Zhou, J.M. Effects of combined application of organic-inorganic fertilizer on yield, quality and nitrogen uptake of rice. J. Plant Nutrition and Fertilizer Science. 18(01), 234-240(2012).
  33. Zhou, R.Q. Preliminary study on the effects of fertilizer types and nutrients on rice yield and quality. J. Crop Research. (01), 14-17(1988).
  34. Mo, Z.W., Li, W, Duan, M.Y.et al. Effects of potassium reduction on yield, quality and potassium absorption and utilization of morning and evening combined rice in South China. J. North China Journal of Agriculture. 29(01), 151-158(2014),.
  35. Nie J, Qiu J.R., Shi, L.L.et al. Effects of combined application of organic fertilizer and chemical fertilizer on yield, quality and potassium uptake and transport of dumped rice. J. Jiangsu Agricultural Sciences.44(02), 122-125(2016).
  36. Jiang, M.J., Xu, W.B., Wang, R.J.et al. Effects of nitrogen reduction on yield and rice quality of machine-inserted hybrid indica rice. J. Southern Journal of Agricultural Sciences.53(01), 104-114(2022).
  37. Shao, S.M. Effects of nitrogen reduction on yield and quality of different panicle japonica rice cultivars. Ph.D. dissertation, Yangzhou University, Yangzhou, Jiangsu, China(2021).
Figure 1. Effect of NR on N utilization rate. Note: 1. The plot data in Figure 1 (I and II) are the average values of the two OF application rates at the same NR rate. 2. The vertical line indicates SE (n=3). 3. RE - recovery efficiency of N, AE- agronomic efficiency of N, PE - physiological efficiency of N, PFP- partial factor productivity of N, NHI-N harvest index, GPE-grain production efficiency of N. The same below.
Preprints 139610 g001
Figure 2. Comparison of N utilization rates among treatments under isonitrogen or non-isonitrogen conditions.
Preprints 139610 g002
Table 1. Comparison of rice yield and yield composition under different treatments.
Treatment EPN (m-2) SPP TGW (g) SSR (%) Grain yield
(kg ha−1)
R1M1 201.39a 189.23b 33.44b 76.50ab 9388.01b
R2M1 192.59ab 188.67b 33.49b 75.85ab 9478.20b
R3M1 191.67ab 218.16a 33.41b 72.83b 9874.64a
R4M1 174.07b 187.59b 34.56a 80.64a 9275.61b
R1M2 190.74ab 186.85a 33.64b 76.57b 9858.30a
R2M2 200.00a 187.72a 33.54b 75.59b 9378.63b
R3M2 177.78b 205.74a 33.72b 72.55b 9912.98a
R4M2 183.33ab 162.55b 34.56a 85.37a 9279.53b
R1 196.06a 188.04b 33.54b 76.54b 9623.15b
R2 196.30a 188.19b 33.51b 75.72b 9428.41c
R3 184.72ab 211.95a 33.57b 72.69b 9893.81a
R4 178.70b 175.07b 34.56a 83.00a 9277.57d
R 3.05 8.15** 10.48** 9.46** 29.70**
R*M 1.45 1.07 0.20 0.75 6.64**
Note:1. The same lowercase letters after the same column of data indicate that the difference between different NR rate treatments under the same OF application amount in the same column, or between different NR rate treatments, is not significant at the level of 5%. 2. R1-NR rate 0%; R2-NR rate 25%; R3-NR rate 50%, R4-NR rate 100%. EPN - effective panicle number, SPP - spikelets per panicle, TGW - thousand-grain weight, SSR - seed setting rate. The same below.
Table 2. Comparison of yield and yield composition between different treatments with the same total N and total N .
Treatment NARIF
(kgN ha−1)
NAROF (kgN ha−1) TNAR
(kgN ha−1)
EPN(m−2) SPP TGW (g) SSR (%) Harvest yield
(kg ha−1)
R1M0 180 0 180 180.56a 196.44a 33.37a 67.30b 9083.61c
R2M0 135 0 135 182.64a 187.41a 33.55a 67.93b 9937.53a
R2M1 135 22.5 157.5 192.59a 188.67a 33.49a 75.85a 9478.20b
R3M1 90 22.5 112.5 191.67a 218.16a 33.41a 72.83ab 9874.64a
R2M2 135 45 180 200.00a 187.72a 33.54a 75.59a 9378.63b
R3M2 90 45 135 177.78a 205.74a 33.72a 72.55ab 9912.98a
Note: NARIF - N application rate of inorganic fertilizer, NAROF - N application rate of OF, TNAR - Total N application rate. The treatments with the same total N application rate were R1M0 and R2M2, R2M0 and R3M2, respectively. The same below.
Table 3. Comparison of processing quality of rice under different treatments.
Treatment BRR(%) MRR(%) HRR(%)
R1M1 78.071a 71.134a 45.293a
R2M1 78.189a 70.337a 42.952a
R3M1 77.827a 68.401b 42.005ab
R4M1 77.959a 66.986b 38.335b
R1M2 78.230a 71.148a 47.474a
R2M2 78.229a 71.315a 42.289b
R3M2 77.927a 70.862a 45.876ab
R4M2 77.009a 70.257a 43.920ab
R1 78.150a 71.141a 46.384a
R2 78.209a 70.826ab 42.621b
R3 77.877a 69.631bc 43.941ab
R4 77.484a 68.622c 41.127b
R 0.89 7.16** 4.66*
R*M 0.56 2.86 1.66
Note: BRR - brown rice rate; MRR - milled rice rate; HRR - head rice rate.
Table 4. Comparison of rice processing quality between different treatments with the same total N and total N.
Treatment NARIF
(kgN ha−1)
NAROF
(kgN ha−1)
TNAR
(kgN ha−1)
BRR(%) MRR(%) HRR(%)
R1M0 180 0 180 77.11ab 69.91ab 43.28a
R2M0 135 0 135 78.26a 70.90a 45.87a
R2M1 135 22.5 157.5 78.19a 70.34ab 42.95cd
R3M1 90 22.5 112.5 75.37b 68.40b 42.01a
R2M2 135 45 180 78.23a 71.32a 42.29a
R3M2 90 45 135 77.93a 70.86a 45.88a
Table 5. Comparison of appearance and quality of rice treated with different treatments.
Treatment CD(%) CR(%) LWR
R1M1 16.322a 40.082a 2.970a
R2M1 15.042ab 39.258a 2.967a
R3M1 13.015b 34.640a 2.959a
R4M1 13.067b 35.028a 2.964a
R1M2 13.282a 34.002a 2.959a
R2M2 14.015a 35.830a 2.961a
R3M2 13.757a 35.592a 2.964a
R4M2 11.690a 31.840a 2.949a
R1 14.802a 37.042ab 2.965a
R2 14.528a 37.544a 2.964a
R3 13.386ab 35.116ab 2.961a
R4 12.378b 33.434b 2.956a
R 2.91 2.08 0.36
R*M 1.41 1.24 0.47
Note: CD – chalkiness degree; CR - chalkiness rate; LWR - length-width ratio. The same below.
Table 6. Comparison of appearance quality of rice with the same total N and total N treatment.
Treatment NARIF
(kgN ha−1)
NAROF
(kgN ha−1)
TNAR
(kgN ha−1)
CD(%) CR(%) LWR
R1M0 180 0 180 14.268a 37.412a 2.948a
R2M0 135 0 135 15.965a 40.367a 2.957a
R2M1 135 22.5 157.5 15.042a 39.258a 2.967a
R3M1 90 22.5 112.5 13.015a 34.640a 2.959a
R2M2 135 45 180 14.015a 35.830a 2.961a
R3M2 90 45 135 13.757a 35.592a 2.964a
Table 7. Comparison of cooking nutritional quality of rice under different treatments.
Treatment AC(%) GC(mm) ASV PC(%)
R1M1 15.647b 63.500a 5.639a 9.562a
R2M1 15.882b 67.333a 5.722a 9.090ab
R3M1 16.514b 69.167a 5.833a 8.243bc
R4M1 18.846a 72.333a 5.333a 7.461c
R1M2 16.287a 69.667ab 5.861a 8.755a
R2M2 16.114a 66.000b 5.611a 8.721a
R3M2 16.453a 73.833ab 5.778a 8.392a
R4M2 16.799a 78.667a 5.889a 6.562b
R1 15.967b 66.583b 5.750a 9.158a
R2 15.998b 66.667b 5.667a 8.905ab
R3 16.484ab 71.500ab 5.806a 8.318b
R4 17.823a 75.500a 5.611a 7.011c
R 3.38* 2.51 0.44 15.05**
R*M 1.59 0.44 1.37 0.94
Note: AC – amylase content; GC - gel consistency; ASV - alkali spreading value; PC - protein content.
Table 8. Comparison of cooking nutritional quality of rice with the same total N and total N treatment.
Treatment NARIF
(kgN ha−1)
NAROF
(kgN ha−1)
TNAR
(kgN ha−1)
AC(%) GC(mm) ASV PC(%)
R1M0 180 0 180 16.122a 63.667a 5.917a 8.934a
R2M0
R2M1
135
135
0
22.5
135
157.5
15.602a
15.882a
67.883a
67.333a
5.694a
5.722a
8.843a
9.090a
R3M1
R2M2
90
135
22.5
45
115.5
180
16.514a
16.114a
69.167a
66.000a
5.833a
5.611a
8.243a
8.721a
R3M2 90 45 135 16.453a 73.833a 5.778a 8.392a
Disclaimer/Publisher’s Note: The statements, opinions and data contained in all publications are solely those of the individual author(s) and contributor(s) and not of MDPI and/or the editor(s). MDPI and/or the editor(s) disclaim responsibility for any injury to people or property resulting from any ideas, methods, instructions or products referred to in the content.
Copyright: This open access article is published under a Creative Commons CC BY 4.0 license, which permit the free download, distribution, and reuse, provided that the author and preprint are cited in any reuse.
Prerpints.org logo

Preprints.org is a free preprint server supported by MDPI in Basel, Switzerland.

Subscribe

Disclaimer

Terms of Use

Privacy Policy

Privacy Settings

© 2025 MDPI (Basel, Switzerland) unless otherwise stated