Preprint
Article

This version is not peer-reviewed.

The Repeatome in the Mega-Genus Epidendrum L. (Epidendroideae, Orchidaceae): An In Silico Comparative Analysis

Submitted:

01 December 2025

Posted:

02 December 2025

You are already at the latest version

Abstract

The repeatome is composed of satellite DNA (satDNA) and transposable elements (TEs), and variation in its composition is important for shaping genome architecture and driving evolutionary processes in plants. As no repeatome assessment exists for Epidendrum, the largest genus of Orchidaceae in the Neotropics, we aim to describe repetitive sequences across its species. We performed phylogenetic analyses based on plastid (matK and rbcL) and nuclear (ITS) markers using maximum likelihood and Bayesian inference methods, and characterized the repeatome of 34 species using the RepeatExplorer2 pipeline. Our results reveal substantial variation in satDNA content among species, with a total of 208 individually identified satDNAs, which were used to build a custom database for repeatome comparative analysis. We found that 73 satDNA clusters are shared among species, while only three are species-specific (CL359 and CL82 in E. rigidum, and CL430 in E. gasteriferum), supporting the library hypothesis. Regarding TEs, Class I elements were the most abundant repeats identified in Epidendrum, primarily long terminal repeat retrotransposons of the Ty3-gypsy superfamily. Elements of the Ty1-copia superfamily were the least abundant. Only two Class II TIR superfamilies were identified, namely EnSpm_CACTA and hAT. The heterogeneous distribution of satDNAs and TEs among closely related species suggests lineage-specific patterns of expansion and contraction, potentially influenced by evolutionary processes such as hybridization and environmental adaptation. Our findings represent the first comprehensive characterization of the repeatome in Epidendrum and provide a basis for future studies on the composition and cytogenomic variation within the mega-genus.

Keywords: 
;  ;  ;  

1. Introduction

Genome size (GS) in plants is shaped by the dynamic interaction of recurrent and shared evolutionary processes throughout their history [1]. The GS, also known as C-value (where C refers to constant), represents the amount of DNA present in a non-replicated nucleus [2] and can vary through two mechanisms: changes in chromosome number via aneuploidy or polyploidy [3], and/or expansions and contractions of repetitive DNA sequences, collectively known as the repeatome [4,5]. These sequences are located in the cell nucleus and can be classified into two major types: (1) transposable elements (TEs), which are dispersed along the chromosomes, and (2) tandemly repeated DNA sequences, which are repeated two or more times sequentially in the same genomic region, such as satellite DNA (satDNA; [6,7,8].
The TEs are divided into two main classes based on their transposition mechanism. Class I TEs (retrotransposons) move through a “copy-and-paste” mechanism, in which an RNA intermediate is reverse-transcribed into complementary DNA and then integrated into a new genomic location [9]. This process generally results in a greater prevalence of Class I TEs in genomes, since each transposition event increases their copy number [10]. On the other hand, Class II TEs (DNA transposons) move through a “cut-and-paste” mechanism, where the DNA sequence is excised and relocated from one point to another within the genome [9,11]. As a result, the frequency of Class II TEs in the genome tends to be lower compared to Class I TEs [10,12].
The most common TEs in plants are retroelements (REs) belonging to the long terminal repeat (LTR) subclass, with sizes ranging from a few hundred base pairs to over 10 Kb. Taxonomically, LTR-REs are classified into two main superfamilies: Ty1-Copia and Ty3-Gypsy, which are distinguished mainly by the order of their protein-coding domains and are subdivided into major evolutionary lineages [9,13,14]. Among these lineages are Athila [15], Chromovirus [16,17] and Ogre/TAT [14,18] for the Ty3-Gypsy superfamily; and Ale, Alesia, Angela, Bianca, Ivana, Ikeros, SIRE, TAR and Tork for the Ty1-Copia superfamily [13,14,19].
Within host genomes, TEs proliferate through transposition bursts when they escape cellular surveillance. However, when they exhibit deleterious effects, they are suppressed by epigenetic silencing mechanisms in plants [10,20]. Although TE insertions can generate deleterious mutations, most are neutral, and some may become adaptive under certain conditions [10]. TEs do not directly cause speciation, but they can significantly alter their abundance after species divergence, increasing genomic polymorphism among them [12]. In some cases, this can lead to chromosomal rearrangements such as deletions, duplications, inversions, and translocations, as well as non-homologous recombinations between regions where TEs are inserted [12,21]. These rearrangements can affect heterochromatin organization and centromere dynamics, leading to structural changes that impact gene regulation [22].
Furthermore, several studies indicate that TE transpositions can serve as a substrate for the emergence and mobility of satDNA, which in turn amplify in specific chromosomal regions such as telomeric, subtelomeric, pericentromeric or interstitial regions [23,24,25,26,27,28]. Although there is a great diversity of TE-derived satDNAs, they often share common features, such as monomers larger than the standard size (>500 bp) that are derived from LTRs and untranslated regions of REs, and are located in (peri)centromeric regions [21,29].
Among the components of plant repeatomes, TEs are the main drivers of GS differences [7]. However, satDNAs can also significantly contribute to these variations [8]. In plants, satDNA may comprise from 0.1% to 50.43% of the genome, and although it has the potential to drive genome size differences, most species maintain relatively constant genome sizes [30]. Despite the existence of numerous species-specific satDNAs, some families are widely distributed and shared across different organisms, from the genus to the phylum level [8].
According to the library hypothesis, proposed by Salser et al. (1976) [31], the origin of satDNA families in different evolutionary lineages can be explained by the duplication of nucleotide sequences in specific genomic loci, forming a “library” of repetitive sequences that can expand and diversify over time. The rapid amplification of a satDNA from the “library” can considerably alter the genomic profile of chromosomal arrangements and create reproductive barriers between organisms, promoting speciation. However, some satDNA sequences exhibit conservation of part or all of the monomer over long evolutionary periods [8,32,33].
It is known that the abundance of repetitive elements in the genomes of related species can diverge considerably due to heterogeneous patterns of repetitive DNA accumulation/deletion [34]. In this sense, identifying how GS variation relates to repeatome composition is important to unravel the underlying mechanisms of genome evolution in plants. Studies focused on specific genera can reveal complex patterns of diversification and adaptation that are less evident in phylogenetic analyses based on traditional molecular markers [34,35,36,37,38].
One promising plant group for this type of investigation is Epidendrum L. (Epidendroideae), a mega-genus of orchids widely distributed across the Neotropical region [39], which exhibits recurrent cases of hybridization [40,41]. Over the past two decades, the number of formally described species of Epidendrum has increased from 1,000 to 1,800 [42]. This mega-genus also exhibits numerous cases of adaptive radiation events [43], contributing to its diversification into plants with distinct morphological and cytogenetic characteristics. Epidendrum orchids show wide karyotypic diversity [44], with chromosome numbers ranging from 2n = 24 [45] to 2n = 240 [46] and GS ranging from 1C = 1.21 pg [47] to 1C = 10.1 pg [48].
In addition, the increasing availability of sequencing data for Epidendrum in public databases makes this genus an excellent model for repeatome evolutionary studies, which have not yet been conducted in this orchid group. Currently, sequencing data are available for 34 species of the genus (Table 1). Among all of them, GS data are only known for E. rigidium (1C = 1.21 pg; [47], E. nocturnum (1C = 3.02 pg; [49], and E. ciliare (1C = 3.14 pg; [50]. Despite the low representativeness of GS records for the genus, it is possible to estimate the diversity of repetitive DNA sequences in their genomes through in silico analyses. These analyses can be conducted with bioinformatics tools such as RepeatExplorer2, which employs a graph-based clustering algorithm to identify and quantify repetitive elements from next-generation sequencing reads, even in non-model organisms without reference genomes [51].
Thus, considering the cytogenomic variations reported for Epidendrum in the literature, we aimed to characterize and compare the repeatome composition of the 34 Epidendrum species for which sequencing data are available, with the objective of answering the following questions: (1) What satDNAs and TEs compose the repeatome of Epidendrum species?; (2) Is there a differential distribution of satDNAs and TEs among species?; (3) Are the satDNA sequences species-specific or shared across the genus? This analysis will help to uncover significant aspects of repeatome composition and satDNA diversity in these orchids, contributing to the identification of the causes behind GS variation among them in future studies and expanding our understanding of the genomic evolution of the genus.

2. Materials and Methods

2.1. Sequencing Data Collection

To characterize the repeatome in Epidendrum, we used sequencing data obtained through target enrichment with the Angiosperm 353 probe set [52]. Their off-target reads, that do not hybridize with the target genes, can be recycled to identify and quantify repetitive DNA in plants [53]. These data, available in the National Center for Biotechnology Information (NCBI) database, include 34 Epidendrum species and represent all sequencing data currently available for the genus (Table 1). Additionally, three species outside Epidendrum were included as outgroups in the phylogenetic analysis and also had their repeatomes characterized using sequencing data from NCBI: Laelia rubescens Lindl. (SRX22571372) for rooting, and Barkeria palmeri Schltr. (ERX7193186), and Caularthron bicornutum Raf. (SRX7133950), which are closely-related species of Epidendrum form the subtribe Laeliinae [54]. To further increase the representativeness and support of the phylogenetic tree generated in this study, we added marker data from 27 additional Epidendrum species also available in the NCBI database (Table S1).

2.2. Phylogenetic Analysis

To investigate the phylogenetic relationships among the Epidendrum species studied herein, we conducted phylogenetic analyses using Maximum Likelihood (ML) and Bayesian Inference (BI) methods based on three molecular markers: one from nuclear genome, the internal transcribed spacer (ITS), and two from chloroplast genome, the genes maturase K (matK) and ribulose-1,5-bisphosphate carboxylase/oxygenase (rbcL). For species lacking available marker sequences but with genome data deposited in NCBI, we retrieved consensus sequences for the target markers through reference-guided mapping using the “Map to Reference” function in Geneious v. 7.1.3. (https://www.geneious.com). The reference marker sequences used for this were MN332382.1 (ITS), MT518444.1 (matK), and MT519153.1 (rbcL), all available on NCBI. When a mapped sequence showed low quality (>50% ambiguities or 'N') and was not available in NCBI, it was considered as missing data in the final matrix. Few differences were observed among the phylogenetic analyses for each independent marker (Supplementary Material 1), and therefore we proceeded with the concatenated analysis.
The marker concatenated matrix was prepared using Mesquite v. 3.81. Sequence alignment was carried out using the online MAFFT server [55,56](Kuraku et al. 2013; Katoh, Rozewicki, and Yamada 2019), followed by a trimming step with TrimAl v1.3 [57]using the “Gappy out” method to remove poorly informative regions and manual pruning in Geneious to ensure sequence length equivalence.
For the phylogenetic analyses, the best-fitting model for each molecular marker was selected based on the Akaike Information Criterion (AIC). Model selection was performed using ModelFinder [58] for ML analyses, and the modelTest function in the phangorn package [59] in RStudio [60] for BI. The selected models were TIM3+F+I+G4 for ITS, K3Pu+F+G4 for matK, and HKY+F+I for rbcL in the ML analysis, while GTR+I+G was selected for all markers in the BI. ML inference was conducted using the IQ-TREE web server [61] with 1,000 ultrafast bootstrap [62] replicates and 1,000 iterations to assess branch support. BI analyses were performed in MrBayes v.3.2.7 [63], using four Markov Chain Monte Carlo (MCMC) chains for 10 million generations, sampling parameters every 1,000 generations. A 25% burn-in was applied, discarding the initial generations to ensure the results reflected converged chains. Saved trees were summarized in a majority-rule consensus tree, and branch support was assessed by posterior probabilities (PP), with values ≥ 0.95 considered strongly supported [64,65], following Baranow et al. (2022) [66] with minor modification.
The ML and BI consensus phylogenetic trees were visualized on FigTree v. 1.4.4. Comparison between species' taxonomic relationships based on each tree's results was performed using the cophylo function from the phytools package [67] in RStudio [60].

2.3. Preprocessing of Sequencing Reads

All FASTQ paired end sequencing data were evaluated and filtered for quality using the preprocessing tool FASTQC [68], integrated into RepeatExplorer2 (RE2) [51]. Reads that did not meet the criteria of 95% of bases with a minimum quality (cut-off) of 10 and those containing adapter sequences were discarded. Additionally, all reads shorter than 100 bp were removed using the “Trim reads” tool, ensuring that the reads in the resulting dataset met the minimum length required for analysis. The sequences were converted to FASTA format, and the forward and reverse reads were merged into a single interlaced file, discarding incomplete pairs. The total number of reads analyzed per species in the individual analysis is provided in Table S2, whereas those from the comparative analysis are shown in Table 2.

2.4. Individual Characterization of Epidendrum Species Repeatome Using RepeatExplorer2 and Construction of a Satellite DNA Database

Filtered sequencing data from the 34 species and the phylogenetic outgroup were analyzed independently using the RE2 pipeline. For this, reads showing at least 95% similarity across a minimum of 55% of their length were grouped into clusters. Clusters with an abundance greater than 0.01% were automatically annotated and manually verified [51]. Clusters annotated as plastid or mitochondrial sequences were considered contamination and excluded from the final annotation.
For the annotation of satDNA sequences, we employed the Tandem Repeat Analyzer (TAREAN) tool [69]. This tool performs automatic annotation of satellite repeats based on the topology of the cluster graphs generated by SeqGraph [70]. All contigs with tandem repeats automatically identified by TAREAN, as well as other satellite sequences not detected by the tool but that showed typical satellite graph layouts (i.e., dense, circular graphs indicating tandemly repeated clusters), were validated according to the following criteria: (1) satDNA consensus sequence longer than 100 nucleotides, having greater potential to form heterochromatic blocks on chromosomes; and (2) dotplot analysis using EMBOSS Dotmatcher [71] (https://www.ebi.ac.uk/jdispatcher/seqstats/emboss_dotmatcher), showing dense line overlaps indicating a repetitive pattern in the consensus sequence.
For satDNAs automatically identified by TAREAN, the tool itself provided a consensus monomer sequence. For manually identified clusters, contigs were aligned and consensus sequences were obtained using Geneious, following Ibiapino et al. (2022) [72]. The same filtering criteria applied to TAREAN-identified sequences were used for manually annotated sequences. The monomers of the satDNAs were named independently for each species using the following pattern: a prefix of the species name (as shown in Table 1) + “Sat” + cluster number + number of nucleotides in the sequence. When identity (ID) similarity exceeded 50% between two satDNA sequences, they were classified as belonging to the same superfamily (SPF: ID between 50–80%), the same subfamily (SBF: ID between 80–94.9%), or as variants of the same family (F: ID above 95%), as described in Ruiz-Ruano et al. (2016) [73].
Finally, candidate TE clusters in Epidendrum were classified based on the REXdb database of conserved protein domains [14] and annotated according to the final automatic RE2 output. All these processes were carried out independently for each species to characterize the individual repeatome of the orchids.

2.5. Comparative Analysis of the Repeatome Composition in Epidendrum

To answer the second and third questions of our study regarding differential abundance and sharing of repetitive elements among species, we performed a comparative analysis of the repeatome composition of the 34 Epidendrum species and those of the outgroup of the phylogeny. For this, forward and reverse read sequences from each taxon were interlaced in RE2 and randomly sampled in sets of 500,000 reads per species, following the normalization recommendations of [51].
The comparative analysis used the same parameters applied in the individual analyses. The main distinction in this step was the inclusion of the custom database of satDNA sequences based on the individual in silico annotation of the 34 Epidendrum species described in the previous topic (Supplementary Material 2). In cases where RE2 annotated more than one satDNA sequence from the custom database to a single supercluster, we adopted the following criteria to determine the final annotation: (1) if one satDNA showed a similarity score at least twice as high as any other, it was retained as the final annotation, as per RE2’s standard procedure; or (2) if similarity scores among the satDNAs were very similar, we aligned the consensus sequences and grouped them into the same superfamily when they shared at least 50% identity, following [73].
If the same class of satDNA, TE or rDNA was present in different species, the corresponding reads from those species were grouped into the same cluster due to sequence similarity. Conversely, clusters containing reads from only one species were considered taxon-specific repeats [51]. Since quantitative information derived from read counts in clusters is also available, these data were used to analyze differences in the abundance of repeats among the species analyzed.

3. Results

3.1. Phylogeny of Epidendrum

The final matrix consisted of 2,392 characters divided into three partitions: 1–653 (ITS), 654–1458 (matK), and 1459–2392 (rbcL), representing 445 distinct patterns, of which 184 sites were informative. We observed few differences between the results of the ML and BI trees, mainly related to ML dichotomies with low support (Figure S1), which were displayed as polytomies in the BI tree (Figure S2). The only species with notably divergent placement between the two trees was E. campestre, which was associated with different groups of species (Figure S3). Still, the ML phylogenetic tree generally showed higher branch support than the BI tree (as seen in the clade of E. igneum, E. coclidium, and E. xanthinum - Figure S1). For this reason, we chose to show the comparative organization of repetitive elements based on the ML phylogeny results in the following sections.

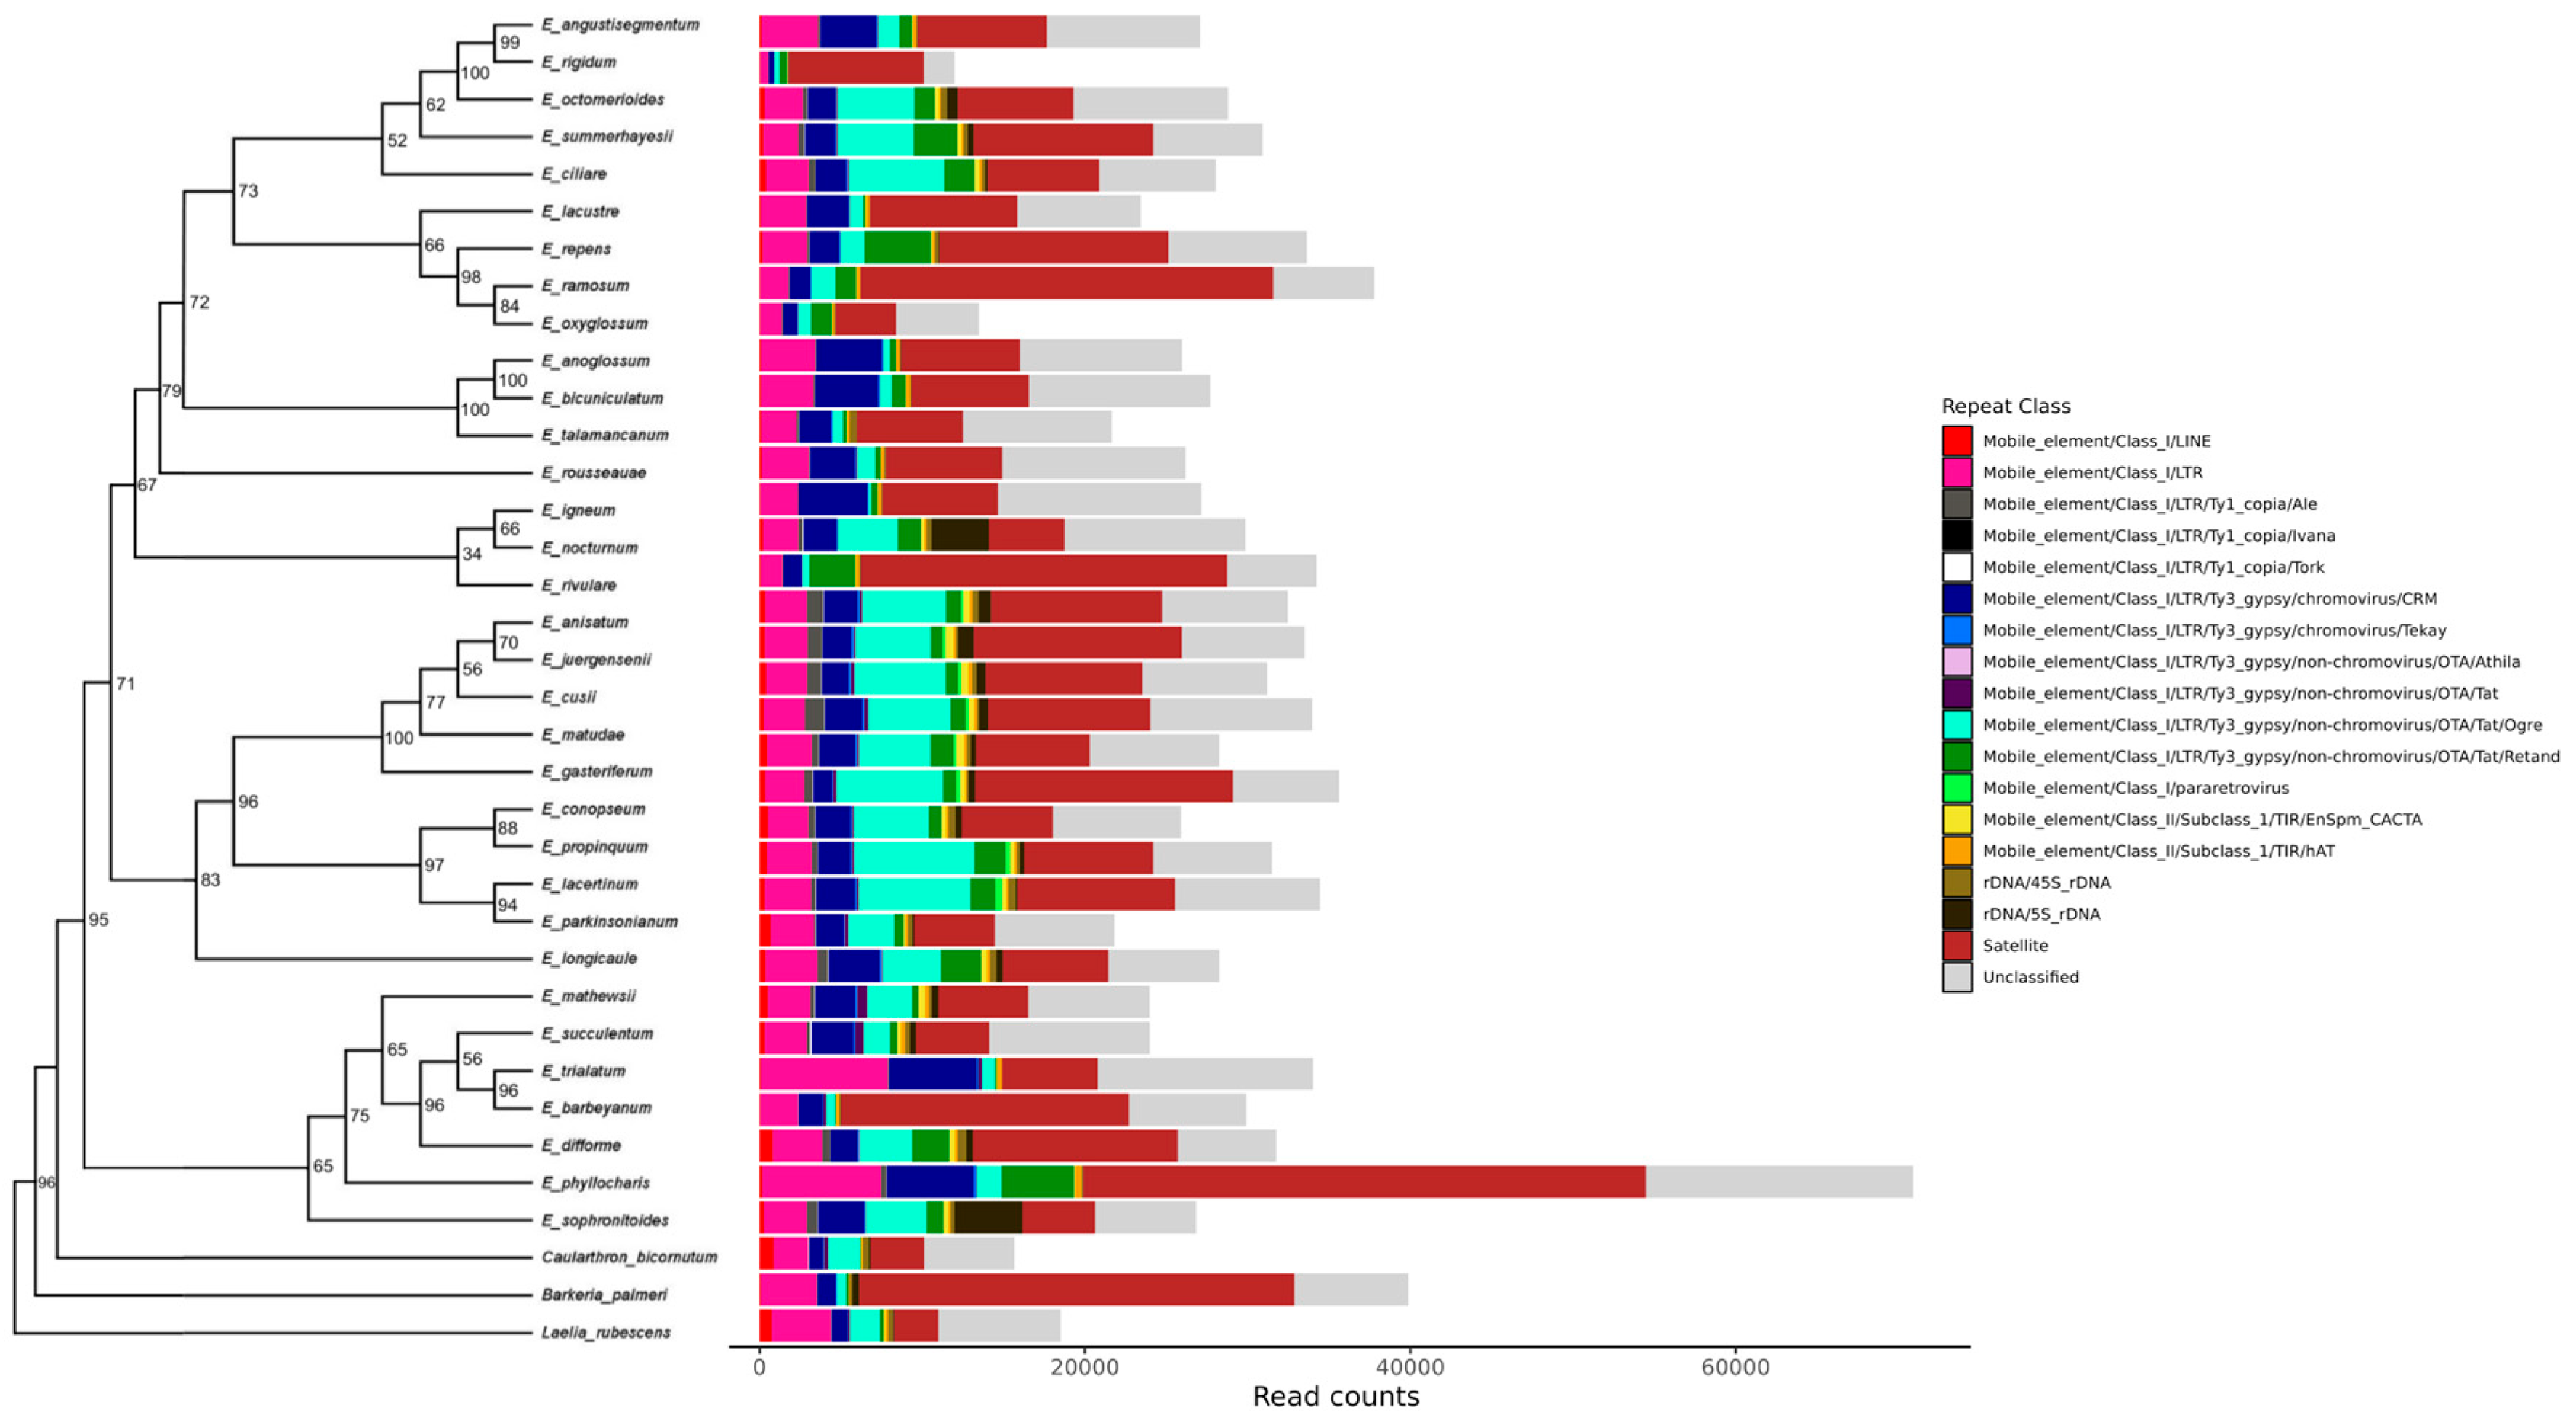
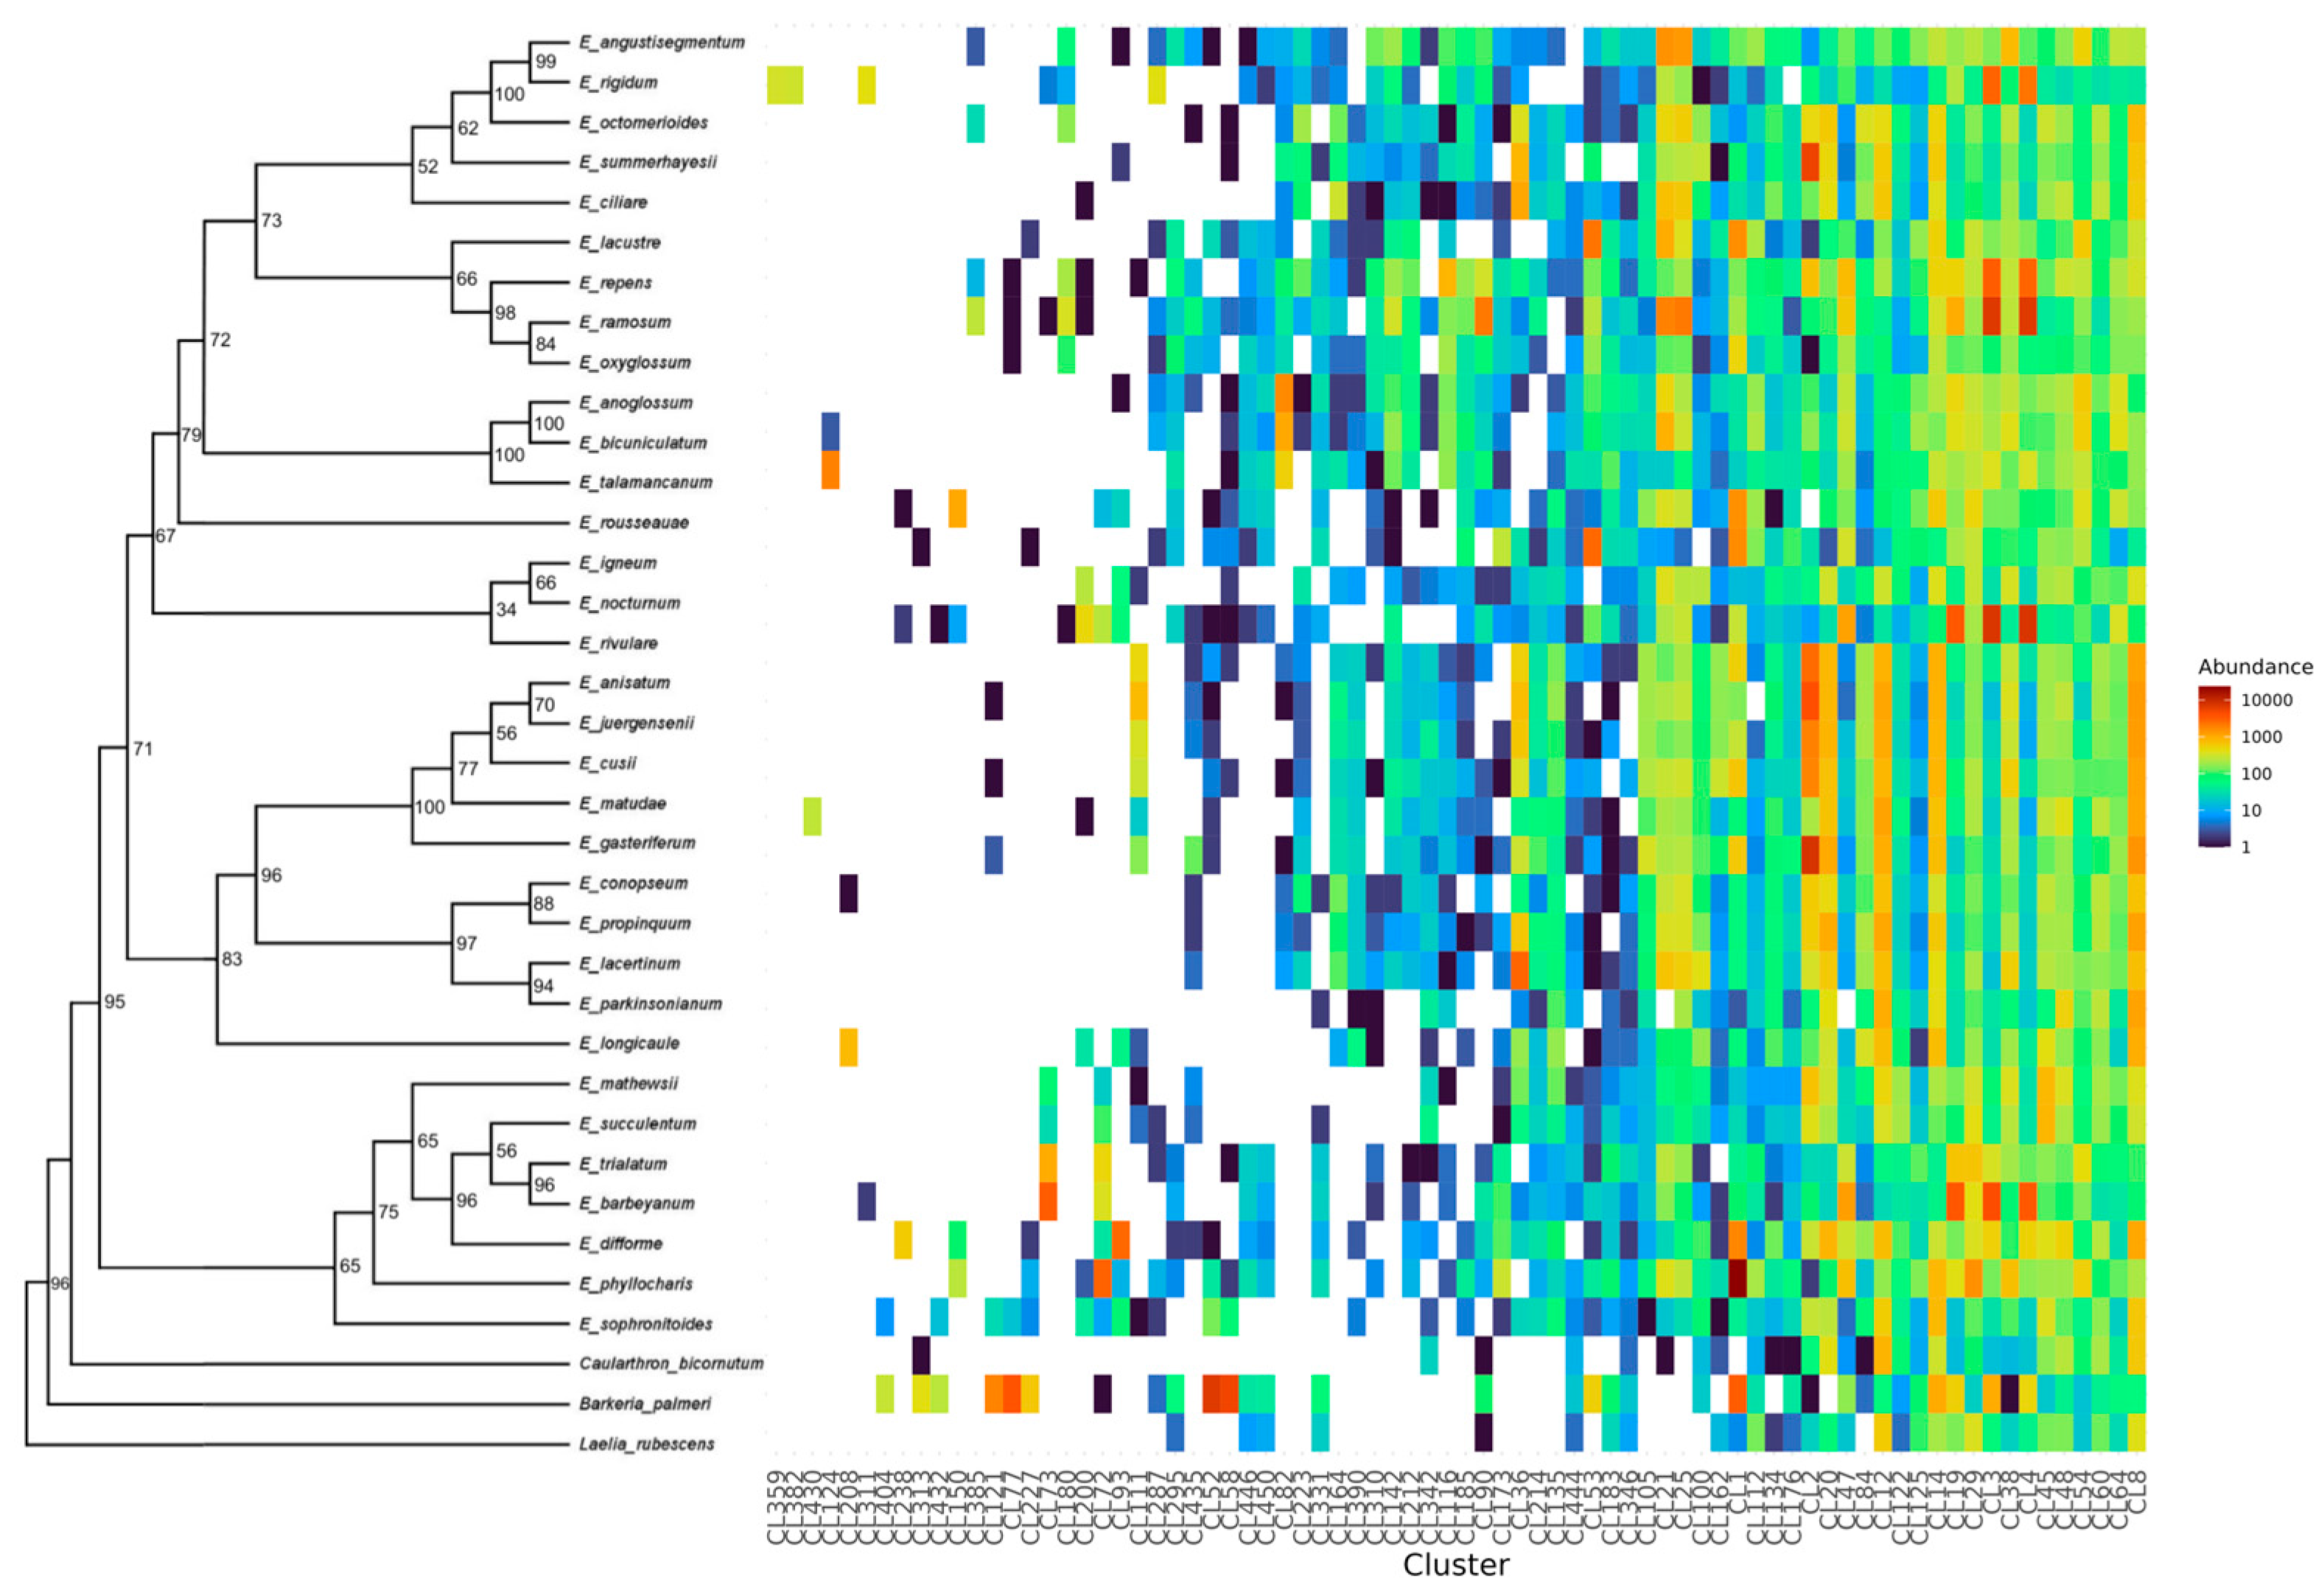
3.2. Individual and Comparative Analysis of Repeatome Composition in Epidendrum

In our individual analyses conducted using RE2 with data from the 34 Epidendrum species, we observed that repeatome profiles varied significantly among species. The proportion of satDNA ranged from 1% in E. sophronitoides, E. longicaule, and E. parkinsonianum to 99% in E. rivulare and E. difforme. In contrast, TEs ranged from 0.3% in E. rivulare and E. difforme to 96% in E. longicaule, according to manual and RE2 automatic annotation (Table S2). These results refer to the repeatome characterization performed independently for each species. Moreover, by summing all satDNAs identified across the 34 species in the individual analysis, we obtained a dataset of 208 satDNAs, which were included in a custom database for Epidendrum. This database was then used to support cluster annotation in the comparative analysis. The unit sizes of the 208 satDNA monomers ranged from 75 bp to 1114 bp, with the most frequent size being 170 bp and an overall mean of 257 bp (Table S2).
The comparative analysis of the repeatome from the 34 Epidendrum species identified 160,041 clusters from 2,495,238 analyzed reads, of which 775,261 (31%) corresponded to repetitive element sequences (Supplementary Material 3). The clustered sequences were automatically annotated by RE2, which detected 50,001 organellar reads that were excluded from subsequent analyses, along with other unannotated sequences from small clusters. Summing the automatic annotations from RE2, TAREAN, and manual satDNA annotations, we identified 23,121 ribosomal DNA reads (3% of the repeatome), 374,429 reads associated with satDNA (48% of the repeatome), and 377,711 reads associated with TEs (49% of the repeatome) in Epidendrum. Among these sequences, the number of reads classified as satDNA varied by up to ninefold between E. phyllocharis (34,569 reads) and E. oxyglossum (3,708 reads), while reads classified as TEs varied by up to elevenfold between E. phyllocharis (19,794 reads) and E. rigidum (1,731 reads) (Figure 1).

3.3. Characterization of Satellite DNA Composition in Epidendrum

With the aid of the custom satDNA database built previously for the genus in the individual analysis, a total of 76 clusters (abbreviated as CL) were annotated as satDNA in Epidendrum in the comparative analysis, with the number of shared monomers per species within this total ranging from 37 in E. longicaule to 58 in E. ramosum (Table 2). Of all these clusters, 48 represent unique monomer sequences, while the remaining 28 are distributed across 18 superfamilies, which were classified according to [73] Ruiz-Ruano et al. 2016 when consensus sequences shared at least 50% identity (Supplementary Material 4). Among these superfamilies, SPF2 is the most abundant, representing 19% of all satellite sequences in Epidendrum and including the monomers EoctSat57-510 (from E. octomerioides) and EdifSat97-156 (from E. difforme), represented by clusters CL8, CL14, CL20, CL84, and CL105. The only species-specific satDNAs identified in this analysis were CL430, present exclusively in E. gasteriferum, and CL359 and CL382, found only in E. rigidum.
The other monomers and non-specific superfamilies were broadly distributed across the 34 Epidendrum species, allowing us to evaluate how these elements are shared across them (Figure 2). We observed that most clusters exhibited characteristic satDNA graph layouts in SeqGraph, with high read density connected between cluster vertices, representing groupings of repetitive sequences. Moreover, dot plot graphs for these satDNAs showed overlapping dense lines, indicating a repetitive pattern in the consensus sequence of the monomers, as seen in CL8 from SPF2, the most abundant and shared cluster in Epidendrum, and in CL430, which is specific to E. gasteriferum, for example (Figure 3).

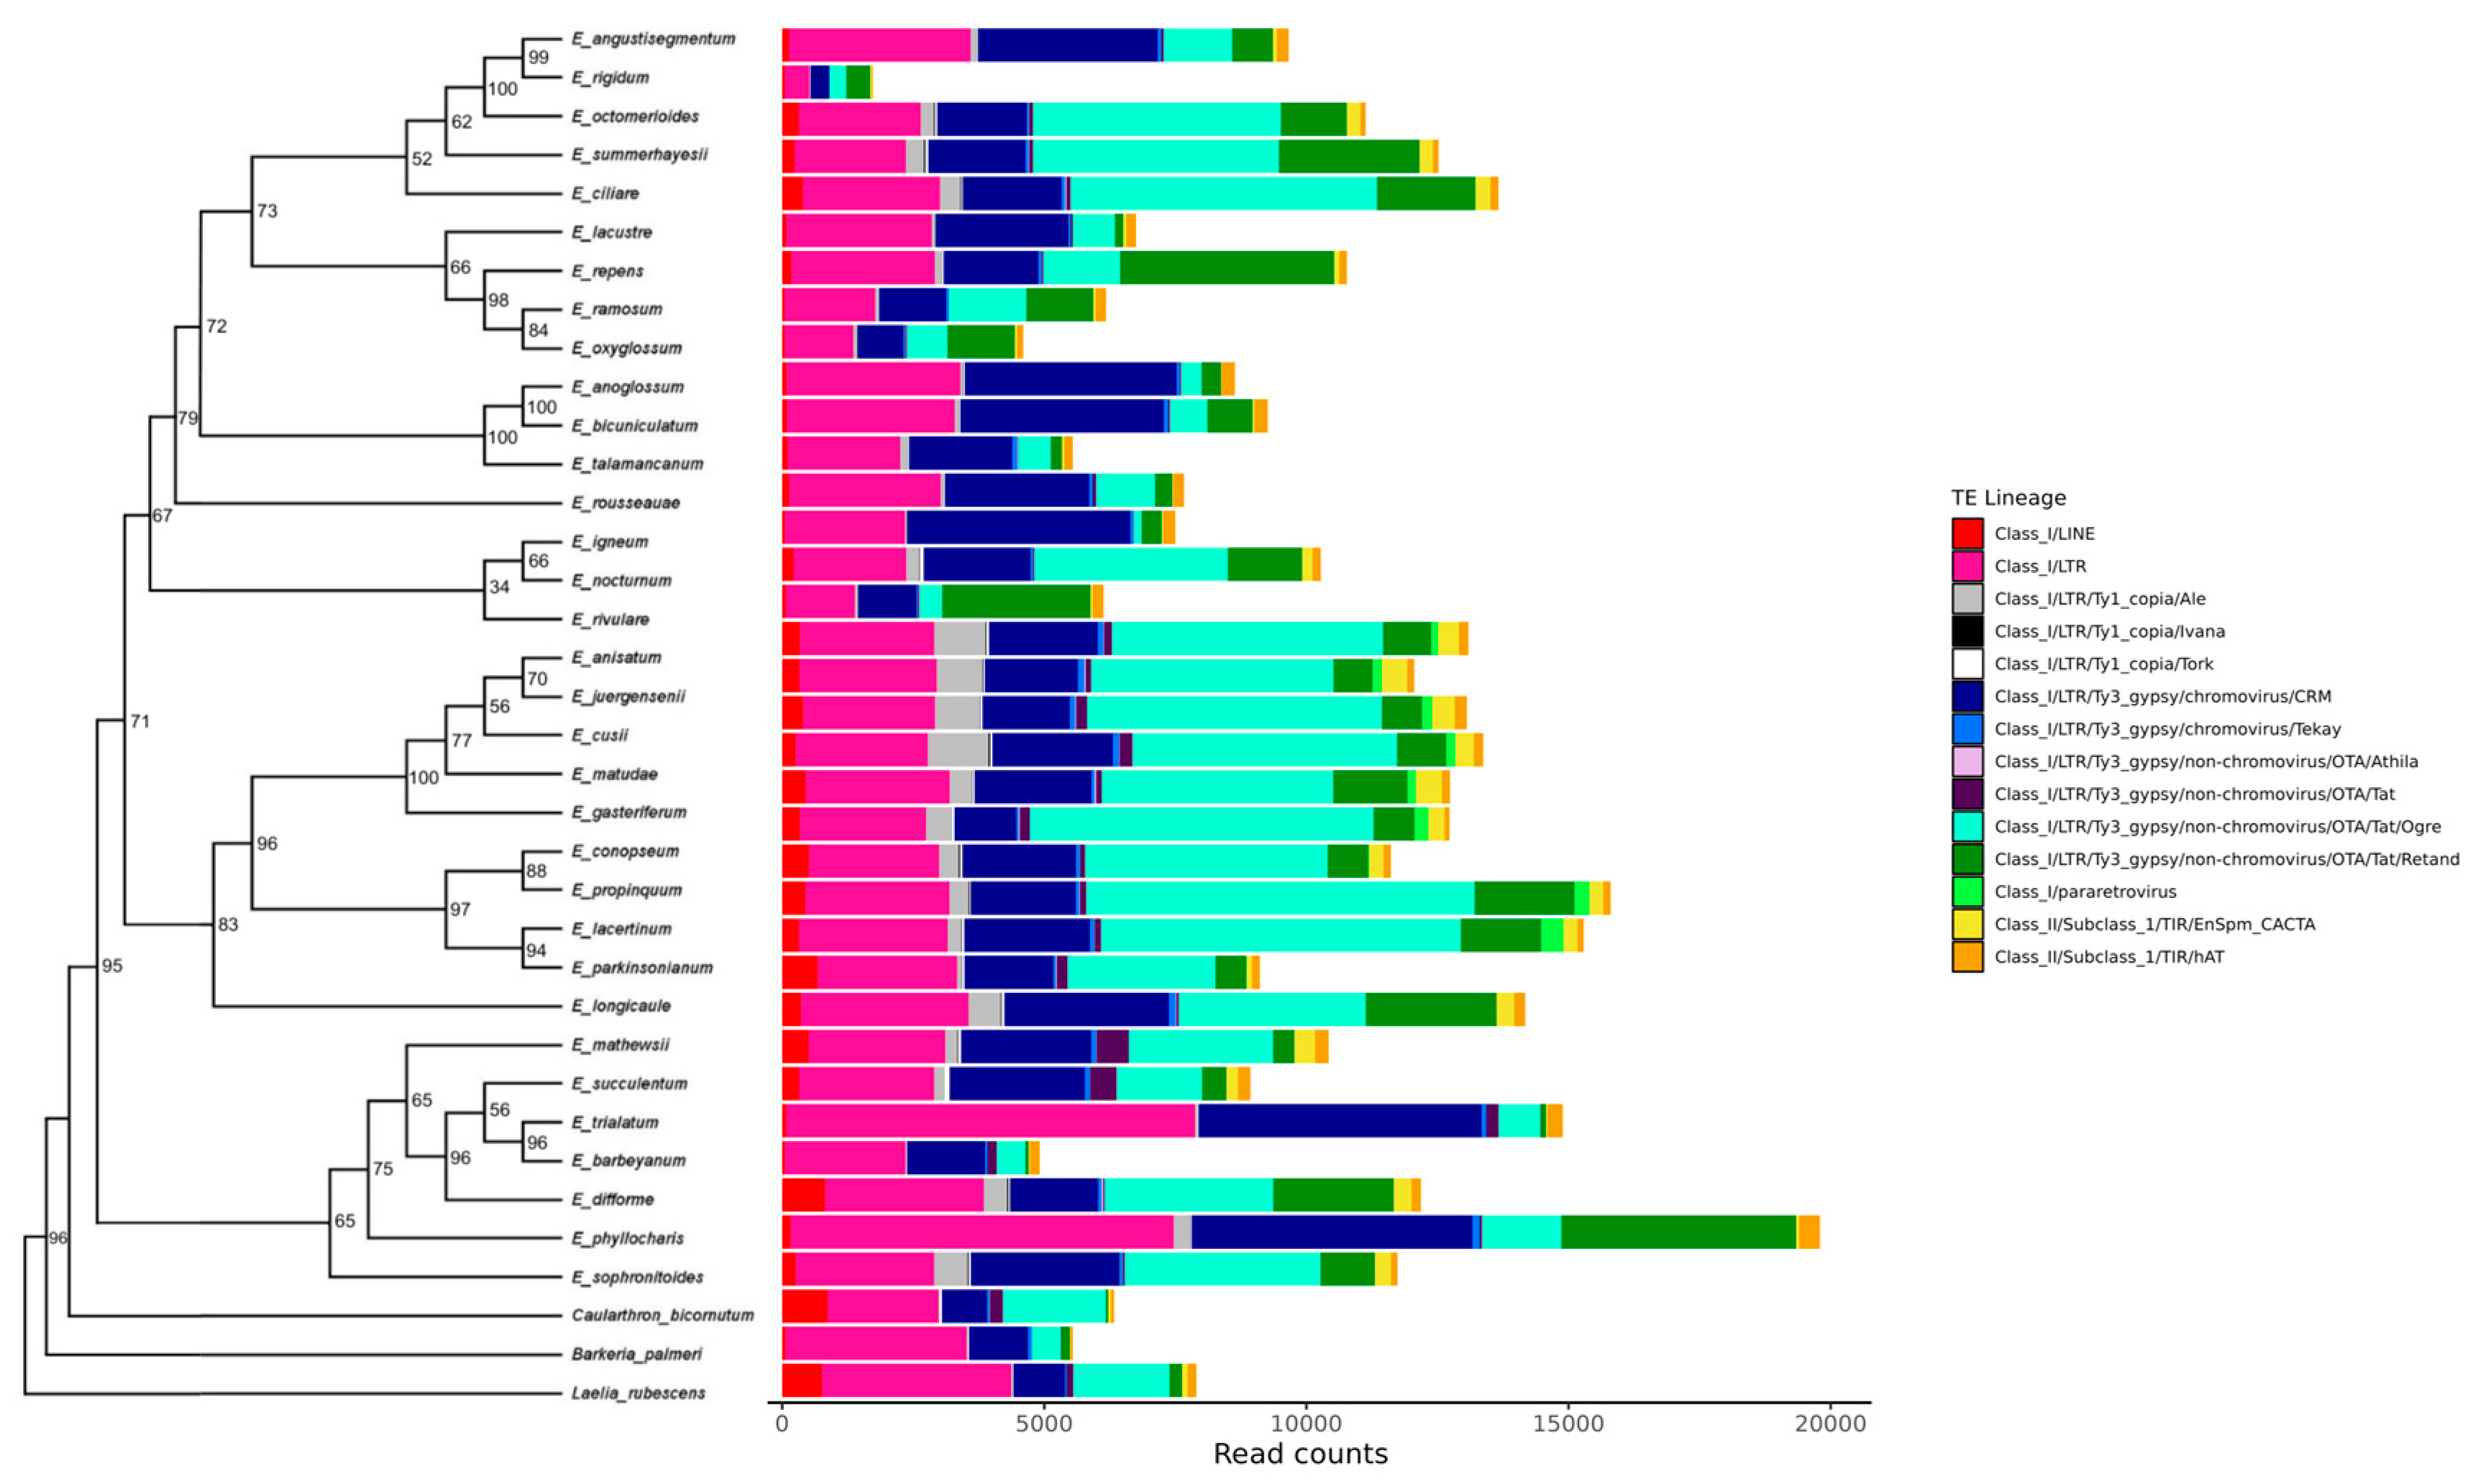
3.4. Characterization of Transposable Element Composition in Epidendrum

Considering the distribution of TEs within the Epidendrum repeatome (Figure 4), the comparative analysis indicated that 97% of the identified TEs belong to Class I REs, while the remaining 3% correspond to Class II elements. Among Class I elements, LTRs were the most abundant order, accounting for 97% of all REs, with the remaining 3% represented by long interspersed elements (LINEs). Regarding Class II TEs, 51% of the elements were classified as terminal inverted repeats (TIRs) of the EnSpm_CACTA type, and 49% belonged to the hAT family.
Moreover, we observed that among the two main LTR superfamilies, Ty3-Gypsy was approximately 20x more abundant than Ty1-Copia (236,471 and 12,009 reads, respectively - Figure 5), for which only the Ale, Ivana, and Tork lineages were detected. For Ty3-Gypsy, the identified lineages included Chromoviruses CRM and Tekay, as well as Non-Chromoviruses such as OTA/Athila, Tat, Ogre, and Retand (Figure 5a-b). At the individual level, Ogre was the most abundant LTR lineage across all species, while Ivana was the least frequent (Figure 4). Representative graph layouts of selected Ty1-Copia and Ty3-Gypsy clusters, CL109 and CL9 respectively, illustrate the typical structural organization of these elements in Epidendrum, characterized by dense, linear-like topologies (Figure 5c-d).

4. Discussion

The present study represents the first compilation of data on the satDNAs and TEs that compose the repeatome of 34 Epidendrum species newly identified herein. The taxa analyzed are distributed from the United States to southern Brazil, with the highest concentration of records in Central American countries, according to the Global Biodiversity Information Facility occurrence database [74] (Supplementary Material 5). Central America therefore stands out as a major hotspot for the genus, consistent with its recognized center of diversity in the Neotropical region. The broad geographic range of Epidendrum, together with its remarkable ecological and morphological diversity [39,42], suggests that differences in genome composition may also underlie its diversification.
In this context, our analysis of repetitive DNA elements provided an opportunity to uncover potential genomic patterns across species with contrasting biogeographic histories. We found that both satDNAs and TEs are distributed heterogeneously among the species but most of them are shared across species. To date, among all Epidendrum species investigated here, GS data are only known for E. rigidum, E. nocturnum, and E. ciliare, as previously mentioned. However, even though complete genome sequencing has not been performed for any species, it was possible to estimate the amount of repetitive elements present in their repeatomes using enriched sequencing data available in NCBI (Table 1).
When comparing the distribution of satDNA clusters among species, we found that, although there is considerable variation in the abundance of these elements among them, the monomer sequences tend to be shared among different lineages (Figure 3). Sequences of satDNA are known to evolve rapidly, exhibiting high mutation rates and variation in abundance and chromosomal location. Nevertheless, the mechanisms underlying these changes are still debated, with unequal crossing-over, gene conversion events, and rolling-circle replication among those proposed [8,33,75].
According to the library hypothesis, related species may share a set of conserved satDNA sequences over long evolutionary periods, which are mostly subject to quantitative changes [8,31,33,76]. In several studies involving the composition and variation of satDNA sets in different related species within the same genus, this pattern is recurrent, and significant expansions and contractions in satDNA content are observed among closely related lineages over short evolutionary timescales, as reported in both animal and plant groups such as Schistocerca [33], Drosophila [77], Corvus [78], Heloniopsis [36], and Sorghum [79]. As an example, in Asclepias (Apocynaceae) the abundance of satDNA ranges from 0.98% to 7.73% among species, with some families correlated to phylogeny and geographic distribution, indicating that the variation accompanies evolutionary diversification [80]. Similarly, our results suggest that the set of 73 shared satDNA clusters identified in Epidendrum is part of an ancestral “satellite library” that has been present in all 34 species since their most recent common ancestor. Exceptions to this pattern are CL430, found only in E. gasteriferum, and CL359 and CL382, exclusive to E. rigidum. Throughout evolution, it is possible that independent expansion and contraction events of these satDNAs in different lineages may have contributed to the diversification of the genus.
Considering TE lineages, Class I elements are more prevalent in Epidendrum repeatomes than Class II elements, as is the case in most plant genomes [12]. Although Class I TEs are largely intergenic, most Class II TEs are preferentially found within or near genes. Thus, Class I elements contribute more significantly to GS variation in plants, while Class II elements are often involved in generating allelic diversity [81]. Therefore, the TE diversity found in Epidendrum repeatomes may reflect a source of GS variation among species, which needs to be validated through further genomic characterization studies of the genus and especially, further GS estimates.
Among the Class I elements in Epidendrum, most are classified as LTR-REs, which was expected given that these are the most abundant group of TEs in plants [12]. Furthermore, the LTR lineages found in Epidendrum reflect the main evolutionary lineages of the Ty3-gypsy and Ty1-copia superfamilies [19] A notable observation from our data is that Ty1-copia is nearly 20 times less abundant than Ty3-gypsy (Figure 5). It is known that among the two superfamilies that compose autonomous LTR-REs in plants, Ty3-gypsy is usually more abundant in genomes than Ty1-copia [82,83,84], which is consistent with our data. Although they share similar structural characteristics, Ty3-gypsy and Ty1-copia differ both in their gene sequence composition and in the organization of the domains within the POL gene that they encode [85].
In Helianthus, it was found that the proliferation of Ty1-copia elements in the genomes is much lower than that of Ty3-gypsy [86]. Moreover, the scale of increase in copy number of these elements differs considerably among the hybrid species compared to the average value of the parental species (+3.7-fold in H. paradoxus, –1.7-fold in H. anomalus, and –2.2-fold in H. deserticola). This may happen due to transcriptional silencing via DNA methylation and chromatin modification, and the disruption, potentially caused by hybridization or environmental stress, could induce a form of genome shock. On the other hand, in some cases, Ty1-copia can be the most abundant LTR component, accounting for up to 40% of the TEs in the species Linum usitatissimum L. [82] and 10.7% in Cucumis sativus L. [87], for example. In this context, it is suggested that the differences in the degree of LTR-RE proliferation among Epidendrum species may reflect random dynamics of Ty1-copia and Ty3-gypsy element activation and/or be influenced by environmental conditions of the different habitats where the species occur, in addition to hybridization events, which are recurrent in the genus [40,41,88]. This may occur because genomic shocks [89] caused by environmental stress and hybridization can loosen gene expression regulation, inducing TE activation and leading to rapid genetic and epigenetic changes, including chromosomal rearrangements. As a consequence, this set of changes may contribute to the stabilization and diversification of new species [86,90,91,92,93].
Considering the Class II elements in Epidendrum, we observed that they include only two TIR superfamilies: EnSpm_CACTA and hAT. It is known that only five of the seventeen Class II TE superfamilies characterized to date have been found in plant genomes: EnSpm_CACTA, Mutator, PIF/Harbinger, hAT, and Tc1/mariner [81]. Therefore, the identification of EnSpm_CACTA and hAT in the Epidendrum repeatomes is consistent with what has been reported in the literature for Class II TEs in plants, while the absence of the other superfamilies may reflect either their elimination in these species or a sampling bias, considering that our data do not include all representatives of Epidendrum, but only those for which sequencing data are currently available.
With regard to phylogeny, the relationships obtained here are mostly in agreement with those recovered by Granados Mendoza et al. (2020) [54], who indicated that the genus Epidendrum is divided into two main clades, called Clade A and Clade B, shortly after the divergence of C. bicornutum. Clade A includes one group with E. sophronitoides as the sister species to E. nocturnum, and another group that includes E. mathewsii, E. succulentum, and E. trialatum, while Clade B comprises another 13 species of the genus. Although their overall phylogenetic structure agrees with previous classifications, the recovery of E. nocturnum within Clade A directly contrasts with earlier studies (such as [94]), where this species was traditionally placed in Clade B. In the present study, the same species of Clade A examined by Granados Mendoza et al. (2020) [54] are also grouped within a single clade together with additional species investigated in our study (E. barbeyanum, E. difforme, E. phyllocharis). However, E. nocturnum was grouped in the second clade following previous classifications [94], together with all other species analyzed here. This discrepancy in the position of E. nocturnum between studies may be primarily related to the use of different molecular markers and to variation in taxon sampling [95,96,97]. Because each marker can reflect distinct evolutionary histories, changes in the set of regions analyzed can modify the recovered topology. Additionally, the inclusion of additional species in the present study, not evaluated by Granados Mendoza et al. (2020) [54], may also have influenced the repositioning of E. nocturnum, since sampling composition directly affects the stability and resolution of clades.
Additionally, there does not appear to be a strict correspondence between phylogenetic proximity and repeatome profile similarity. For example, closely related species in the tree, such as E. igneum and E. nocturnum, exhibit notable differences in the proportion of satDNAs and TEs, which may indicate independent events of gain and loss of repetitive elements following the potential divergence from E. rivulare. This phenomenon suggests that repeatome evolution in Epidendrum may be influenced by factors specific to the natural history of each species, such as adaptation to different habitats or internal mechanisms of genome regulation, which may converge toward similar repeatome patterns even in taxa that are more distantly related in the phylogeny [98].
Thus, although our dataset represents less than ~2% of the total species diversity within Epidendrum, the repeatome characterization of the 34 species described here has already shown that satDNAs and TEs can vary considerably among them, potentially impacting repeatome differentiation and, consequently, genome differentiation.

5. Conclusions

Taken together, our results suggest that repeatome evolution in Epidendrum is a dynamic process, with notable variation both among closely related species and among distantly related groups in the phylogeny. Regarding the first question proposed in this study, we identified that the repeatome of Epidendrum species is predominantly composed of TEs from the LTR-RE lineage of the Ty3-gypsy superfamily and by broadly distributed satDNA sequences, including 73 clusters shared in varying proportions. This allowed us to address the second question of this study, showing that the distribution of TEs and satDNAs among species is not homogeneous. Thus, the observation of differences in the abundance of certain clusters among species suggests that specific evolutionary factors, such as different selective pressures and demographic histories, may have influenced the expansion or reduction of these sequences throughout the evolution of the genus. Finally, regarding the third question, we observed extensive sharing of satDNA sequences among species, which supports the library hypothesis and indicates a likely ancestral origin of these sequences prior to the diversification of the Epidendrum lineages investigated here. As exceptions, we identified three species-specific clusters: one in E. gasteriferum (CL430) and two in E. rigidum (CL359 and CL382). These findings expand our understanding of genome evolution in the genus Epidendrum and provide a basis for future investigations into the relationship between repeatome composition and genome size variation throughout the genus’s evolutionary history.

Supplementary Materials

The following supporting information can be downloaded at: https://doi.org/10.5281/zenodo.17767624. Figure S1: Epidendrum Maximum likelihood tree; Figure S2: Epidendrum Bayesian inference tree; Table S1: Epidendrum additional marker data; Table S2: Epidendrum individual repeatome characterization; Supplementary Material 1: Epidendrum individual trees by marker (ITS, matK, rbcL); Supplementary Material 2: Epidendrum custom satDNA database; Supplementary Material 3: Krona chart of Epidendrum repeatome; Supplementary Material 4: Epidendrum satDNA clusters classification; Supplementary Material 5: Geographical distribution of Epidendrum.

Author Contributions

Conceptualization: A.P.M.; Formal Analysis: A.C.H., A.P.M., M.V.; Figures: A.C.H.; Writing – Original Draft Preparation: A.C.H.; Writing – Review & Editing: A.P.M., M.V; Supervision: A.P.M.; Funding acquisition: A.P.M., A.C.H. All authors have read and agreed to the published version of the manuscript.

Funding

This work was supported by Fundação de Amparo à Pesquisa do Estado de São Paulo (FAPESP Proc. 2023/05740-4 and 2021/10639-5 to A.C.H. and Proc. 2022/05890-3 to A.P.M.) and Conselho Nacional de Desenvolvimento Científico e Tecnológico (CNPq grant to A.P.M. - Proc. 312855/2021-4). A.C.H. and A.P.M. are affiliated with the Center for Research on Biodiversity Dynamics and Climate Change (CEPID FAPESP#2021/10639-5).

Institutional Review Board Statement

Not applicable.

Informed Consent Statement

Not applicable.

Data Availability Statement

The original contributions presented in this study are included in the article/Supplementary Material. Further inquiries can be directed to the corresponding authors.

Conflicts of Interest

The authors declare that they have no conflict of interest.

References

  1. Wendel, J.F.; Jackson, S.A.; Meyers, B.C.; Wing, R.A. Evolution of plant genome architecture. Genome Biol. 2016, 17, 1–14. [Google Scholar] [CrossRef]
  2. Mehrotra, S.; Goyal, V. Repetitive sequences in plant nuclear DNA: types, distribution, evolution and function. Genomics Proteomics Bioinformatics 2014, 12, 164–1711. [Google Scholar] [CrossRef]
  3. Todd, R.T.; Forche, A.; Selmecki, A. Ploidy variation in fungi: polyploidy, aneuploidy, and genome evolution. Microbiol. Spectr. 2017, 5, 1–20. [Google Scholar] [CrossRef] [PubMed]
  4. Hannan, A.J. Tandem repeat polymorphisms. In Tandem Repeat Polymorphisms; Hannan, A.J., Ed.; Springer: New York, NY, USA, 2012. [Google Scholar] [CrossRef]
  5. Kim, Y.B.; Oh, J.H.; McIver, L.J.; Rashkovetsky, E.; Michalak, K.; Garner, H.R.; Kang, L.; Nevo, E.; Korol, A.B.; Michalak, P. Divergence of Drosophila melanogaster repeatomes in response to a sharp microclimate contrast in Evolution Canyon, Israel. Proc. Natl. Acad. Sci. USA 2014, 111, 10630–10635. [Google Scholar] [CrossRef] [PubMed]
  6. Treangen, T.J.; Salzberg, S.L. Repetitive DNA and next-generation sequencing: Computational challenges and solutions. Nat. Rev. Genet. 2012, 13, 36–46. [Google Scholar] [CrossRef]
  7. Lee, S.I.; Kim, N.S. Transposable elements and genome size variations in plants. Genomics Inform. 2014, 12, 87–97. [Google Scholar] [CrossRef]
  8. Garrido-Ramos, M.A. Satellite DNA: An evolving topic. Genes 2017, 8, 1–41. [Google Scholar] [CrossRef]
  9. Wicker, T.; Sabot, F.; Hua-Van, A.; Bennetzen, J.L.; Capy, P.; Chalhoub, B.; Flavell, A.; Leroy, P.; Morgante, M.; Panaud, O.; Paux, E.; SanMiguel, P.; Schulman, A.H. A unified classification system for eukaryotic transposable elements. Nat. Rev. Genet. 2007, 8, 973–982. [Google Scholar] [CrossRef]
  10. Pulido, M.; Casacuberta, J.M. Transposable element evolution in plant genome ecosystems. Curr. Opin. Plant Biol. 2023, 75, 1–8. [Google Scholar] [CrossRef]
  11. Bourque, G.; Burns, K.H.; Gehring, M.; Gorbunova, V.; Seluanov, A.; Hammell, M.; Feschotte, C.; et al. Ten things you should know about transposable elements. Genome Biol. 2018, 19, 1–12. [Google Scholar] [CrossRef]
  12. Galindo-González, L.; Mhiri, C.; Deyholos, M.K.; Grandbastien, M.A. LTR-retrotransposons in plants: engines of evolution. Gene 2017, 26, 14–25. [Google Scholar] [CrossRef]
  13. Pellicer, J.; Hidalgo, O.; Dodsworth, S.; Leitch, I.J. Genome size diversity and its impact on the evolution of land plants. Genes 2018, 9, 1–14. [Google Scholar] [CrossRef]
  14. Neumann, P.; Novák, P.; Hoštáková, N.; Macas, J. Systematic survey of plant LTR-retrotransposons elucidates phylogenetic relationships of their polyprotein domains and provides a reference for element classification. Mobile DNA 2019, 10, 1–17. [Google Scholar] [CrossRef] [PubMed]
  15. Wright, D.A.; Voytas, D.F. Athila4 of Arabidopsis and Calypso of soybean define a lineage of endogenous plant retroviruses. Genome Res. 2002, 12, 122–131. [Google Scholar] [CrossRef]
  16. Llorens, C.; Futami, R.; Covelli, L.; Domínguez-Escribá, L.; Viu, J.M.; Tamarit, D.; Aguilar-Rodríguez, J.; Vicente-Ripolles, M.; Fuster, G.; Bernet, G.P.; Maumus, F.; Munoz-Pomer, A.; Sempere, J.M.; Latorre, A.; Moya, A. The gypsy database (GyDB) of mobile genetic elements: Release 2.0. Nucleic Acids Res. 2011, 39, D70–D74. [Google Scholar] [CrossRef]
  17. Neumann, P.; Navrátilová, A.; Koblížková, A.; Kejnovský, E.; Hřibová, E.; Hobza, R.; Widmer, A.; Doležel, J.; Macas, J. Plant centromeric retrotransposons: A structural and cytogenetic perspective. Mobile DNA 2011, 2, 1–16. [Google Scholar] [CrossRef] [PubMed]
  18. Macas, J.; Neumann, P. Ogre elements – a distinct group of plant Ty3/gypsy-like retrotransposons. Gene 2007, 390, 108–116. [Google Scholar] [CrossRef]
  19. Mascagni, F.; Vangelisti, A.; Giordani, T.; Cavallini, A.; Natali, L. A computational comparative study of the repetitive DNA in the genus Quercus L. Tree Genet. Genomes 2020, 16, 1–11. [Google Scholar] [CrossRef]
  20. Liu, P.; Cuerda-Gil, D.; Shahid, S.; Slotkin, R.K. The epigenetic control of the transposable element life cycle in plant genomes and beyond. Annu. Rev. Genet. 2022, 56, 63–87. [Google Scholar] [CrossRef]
  21. Meštrović, N.; Mravinac, B.; Pavlek, M.; Vojvoda-Zeljko, T.; Šatović, E.; Plohl, M. Structural and functional liaisons between transposable elements and satellite DNAs. Chromosome Res. 2015, 23, 583–596. [Google Scholar] [CrossRef]
  22. Amorim, I.C.; Sotero-Caio, C.G.; Costa, R.G.C.; Xavier, C.; de Moura, R.C. Comprehensive mapping of transposable elements reveals distinct patterns of element accumulation on chromosomes of wild beetles. Chromosome Res. 2021, 29, 203–218. [Google Scholar] [CrossRef]
  23. Plohl, M.; Meštrović, N.; Mravinac, B. Satellite DNA evolution. Repetitive DNA 2012, 7, 126–152. [Google Scholar] [CrossRef]
  24. Biscotti, M.A.; Olmo, E.; Heslop-Harrison, J.S. Repetitive DNA in eukaryotic genomes. Chromosome Res. 2015, 23, 415–420. [Google Scholar] [CrossRef] [PubMed]
  25. Satović, E.; Vojvoda Zeljko, T.; Luchetti, A.; Mantovani, B.; Plohl, M. Adjacent sequences disclose potential for intra-genomic dispersal of satellite DNA repeats and suggest a complex network with transposable elements. BMC Genomics 2016, 17, 1–12. [Google Scholar] [CrossRef]
  26. Silva, B.S.M.L.; Picorelli, A.C.R.; Kuhn, G.C.S. In silico identification and characterization of satellite DNAs in 23 Drosophila species from the Montium group. Genes 2023, 14, 1–14. [Google Scholar] [CrossRef] [PubMed]
  27. Wlodzimierz, P.; Rabanal, F.A.; Burns, R.; Naish, M.; Primetis, E.; Scott, A.; Mandáková, T.; Gorringe, N.; Tock, A.J.; Holland, D.; Fritschi, K.; Habring, A.; Lanz, C.; Patel, C.; Schlegel, T.; Collenberg, M.; Mielke, M.; Nordborg, M.; Roux, F.; Henderson, I.R.; et al. Cycles of satellite and transposon evolution in Arabidopsis centromeres. Nature 2023, 618, 557–565. [Google Scholar] [CrossRef]
  28. Tunjić-Cvitanić, M.; García-Souto, D.; Pasantes, J.J.; Šatović-Vukšić, E. Dominance of transposable element-related satDNAs results in great complexity of “satDNA library” and invokes the extension towards “repetitive DNA library. ” Mar. Life Sci. Technol. 2024, 6, 236–251. [Google Scholar] [CrossRef] [PubMed]
  29. Macas, J.; Koblížková, A.; Navrátilová, A.; Neumann, P. Hypervariable 3′ UTR region of plant LTR-retrotransposons as a source of novel satellite repeats. Gene 2009, 448, 198–206. [Google Scholar] [CrossRef]
  30. Šatović-Vukšić, E.; Plohl, M. Satellite DNAs—From localized to highly dispersed genome components. Genes 2023, 14, 1–22. [Google Scholar] [CrossRef]
  31. Salser, W.; Bowen, S.; Browne, D.; El-Adli, F.; Fedoroff, N.; Fry, K.; Whitcome, P.; et al. Investigation of the organization of mammalian chromosomes at the DNA sequence level. Fed. Proc. 1976, 35, 23–35. [Google Scholar] [PubMed]
  32. Belyayev, A.; Jandová, M.; Josefiová, J.; Kalendar, R.; Mahelka, V.; Mandák, B.; Krak, K. The major satellite DNA families of the diploid Chenopodium album aggregate species: Arguments for and against the “library hypothesis. ” PLoS ONE 2020, 15, 1–14. [Google Scholar] [CrossRef]
  33. Palacios-Gimenez, O.M.; Milani, D.; Song, H.; Marti, D.A.; López-León, M.D.; Ruiz-Ruano, F.J.; Camacho, J.P.M.; Cabral-De-Mello, D.C.; O’Neill, R. Eight million years of satellite DNA evolution in grasshoppers of the genus Schistocerca illuminate the ins and outs of the library hypothesis. Genome Biol. Evol. 2020, 12, 88–102. [Google Scholar] [CrossRef]
  34. Kelly, L.J.; Renny-Byfield, S.; Pellicer, J.; Macas, J.; Novák, P.; Neumann, P.; Lysak, M.A.; Day, P.D.; Berger, M.; Fay, M.F.; Nichols, R.A.; Leitch, A.R.; Leitch, I.J. Analysis of the giant genomes of Fritillaria (Liliaceae) indicates that a lack of DNA removal characterizes extreme expansions in genome size. New Phytol. 2015, 208, 596–607. [Google Scholar] [CrossRef] [PubMed]
  35. McCann, J.; Macas, J.; Novák, P.; Stuessy, T.F.; Villaseñor, J.L.; Weiss-Schneeweiss, H. Differential genome size and repetitive DNA evolution in diploid species of Melampodium sect. Melampodium (Asteraceae). Front. Plant Sci. 2020, 11, 1–14. [Google Scholar] [CrossRef]
  36. Pellicer, J.; Fernández, P.; Fay, M.F.; Michálková, E.; Leitch, I.J. Genome size doubling arises from the differential repetitive DNA dynamics in the genus Heloniopsis (Melanthiaceae). Front. Genet. 2021, 12, 1–12. [Google Scholar] [CrossRef]
  37. Neumann, P.; Oliveira, L.; Čížková, J.; Jang, T.S.; Klemme, S.; Novák, P.; Stelmach, K.; Koblížková, A.; Doležel, J.; Macas, J. Impact of parasitic lifestyle and different types of centromere organization on chromosome and genome evolution in the plant genus Cuscuta. New Phytol. 2021, 229, 2365–2377. [Google Scholar] [CrossRef]
  38. Schmidt, N.; Sielemann, K.; Breitenbach, S.; Fuchs, J.; Pucker, B.; Weisshaar, B.; Holtgräwe, D.; Heitkam, T. Repeat turnover meets stable chromosomes: repetitive DNA sequences mark speciation and gene pool boundaries in sugar beet and wild beets. Plant J. 2024, 118, 171–190. [Google Scholar] [CrossRef]
  39. Pinheiro, F.; Cozzolino, S. Epidendrum (Orchidaceae) as a model system for ecological and evolutionary studies in the Neotropics. Taxon 2013, 62, 77–88. [Google Scholar] [CrossRef]
  40. Moraes, A.P.; Chinaglia, M.; Palma-Silva, C.; Pinheiro, F. Interploidy hybridization in sympatric zones: The formation of Epidendrum fulgens × E. puniceoluteum hybrids (Epidendroideae, Orchidaceae). Ecol. Evol. 2013, 3, 3824–3837. [Google Scholar] [CrossRef] [PubMed]
  41. Marques, I.; Draper, D.; Riofrío, L.; Naranjo, C. Multiple hybridization events, polyploidy and low postmating isolation entangle the evolution of neotropical species of Epidendrum (Orchidaceae). BMC Evol. Biol. 2014, 14, 1–14. [Google Scholar] [CrossRef]
  42. Karremans, A.P. With great biodiversity comes great responsibility: The underestimated diversity of Epidendrum (Orchidaceae). Harv. Pap. Bot. 2021, 26, 299–369. [Google Scholar] [CrossRef]
  43. Zhao, Z.; Zeng, M.Y.; Wu, Y.W.; Li, J.W.; Zhou, Z.; Liu, Z.J.; Li, M.H. Characterization and comparative analysis of the complete plastomes of five Epidendrum species. Int. J. Mol. Sci. 2023, 24, 1–14. [Google Scholar] [CrossRef]
  44. Nollet, F.; Medeiros Neto, E.; Cordeiro, J.M.; Buril, M.T.; Chase, M.W.; Felix, L.P. Chromosome numbers and heterochromatin variation in introgressed and non-introgressed populations of Epidendrum: Interspecific transfers of heterochromatin lead to divergent variable karyotypes. Bot. J. Linn. Soc. 2022, 199, 694–705. [Google Scholar] [CrossRef]
  45. Pinheiro, F.; Koehler, S.; Corrêa, A.M.; Salatino, M.L.F.; Salatino, A.; de Barros, F. Phylogenetic relationships and infrageneric classification of Epidendrum subgenus Amphiglottium. Plant Syst. Evol. 2009, 283, 165–177. [Google Scholar] [CrossRef]
  46. Felix, L.P.; Guerra, M. Variation in chromosome number and the basic number of subfamily Epidendroideae (Orchidaceae). Bot. J. Linn. Soc. 2010, 163, 234–278. [Google Scholar] [CrossRef]
  47. Trávníček, P.; Ponert, J.; Urfus, T.; Jersáková, J.; Vrána, J.; Hřibová, E.; Suda, J. Challenges of flow-cytometric estimation of nuclear genome size in orchids. Cytometry A 2015, 87, 958–966. [Google Scholar] [CrossRef]
  48. Assis, F. N. M. D. (2013). Mecanismos de evolução cariotípica em Epidendrum L. (Orchidaceae: Epidendroideae). Ph.D. Thesis, Federal University of Paraíba, Brazil, 2013. [Google Scholar]
  49. Cordeiro, J.M.; Chase, M.W.; Hágsater, E.; Almeida, E.M.; Costa, L.; Souza, G.; et al. Chromosome number, heterochromatin, and genome size support recent polyploid origin of the Epidendrum nocturnum group and reveal a new species. Botany 2022, 100, 409–421. [Google Scholar] [CrossRef]
  50. Cordeiro, J.M.P. Citotaxonomia do gênero neotropical Epidendrum L. (Laeliinae, Orchidaceae). Ph.D. Thesis, Universidade Federal da Paraíba, 2019. Available online at https://repositorio.ufpb. 1234. [Google Scholar]
  51. Novák, P.; Neumann, P.; Macas, J. Global analysis of repetitive DNA from unassembled sequence reads using RepeatExplorer2. Nat. Protoc. 2020, 15, 3745–3776. [Google Scholar] [CrossRef]
  52. Johnson, M.G.; Pokorny, L.; Dodsworth, S.; Botigué, L.R.; Cowan, R.S.; Devault, A.; Eiserhardt, W.L.; Epitawalage, N.; Forest, F.; Kim, J.T.; Leebens-Mack, J.H.; Leitch, I.J.; Maurin, O.; Soltis, D.E.; Soltis, P.S.; Wong, G.K.S.; Baker, W.J.; Wickett, N.J. A universal probe set for targeted sequencing of 353 nuclear genes from any flowering plant designed using k-Medoids clustering. Syst. Biol. 2019, 68, 594–606. [Google Scholar] [CrossRef]
  53. Costa, L.; Marques, A.; Buddenhagen, C.; Thomas, W.; Huettel, B.; Schubert, V.; Dodsworth, S.; Houben, A.; Souza, G.; Pedrosa-Harand, A. Aiming off the target: recycling target capture sequencing reads for investigating repetitive DNA. Ann. Bot. 2021, 128, 835–848. [Google Scholar] [CrossRef]
  54. Granados Mendoza, C.; Jost, M.; Hágsater, E.; Magallón, S.; van den Berg, C.; Lemmon, E.M.; Wanke, S.; et al. Target nuclear and off-target plastid hybrid enrichment data inform a range of evolutionary depths in the orchid genus Epidendrum. Front. Plant Sci. 2020, 10, 1–16. [Google Scholar] [CrossRef] [PubMed]
  55. Kuraku, S.; Zmasek, C.M.; Nishimura, O.; Katoh, K. aLeaves facilitates on-demand exploration of metazoan gene family trees on MAFFT sequence alignment server with enhanced interactivity. Nucleic Acids Res. 2013, 41, W22–W28. [Google Scholar] [CrossRef] [PubMed]
  56. Katoh, K.; Rozewicki, J.; Yamada, K.D. MAFFT online service: multiple sequence alignment, interactive sequence choice and visualization. Brief. Bioinform. 2019, 20, 1160–1166. [Google Scholar] [CrossRef]
  57. Capella-Gutiérrez, S.; Silla-Martínez, J.M.; Gabaldón, T. trimAl: a tool for automated alignment trimming in large-scale phylogenetic analyses. Bioinformatics 2009, 25, 1972–1973. [Google Scholar] [CrossRef]
  58. Kalyaanamoorthy, S.; Minh, B.Q.; Wong, T.K.; Von Haeseler, A.; Jermiin, L.S. ModelFinder: fast model selection for accurate phylogenetic estimates. Nat. Methods 2017, 14, 587–589. [Google Scholar] [CrossRef]
  59. Schliep, K.P. phangorn: phylogenetic analysis in R. Bioinformatics 2011, 27, 592–593. [Google Scholar] [CrossRef]
  60. RStudio Team. RStudio: Integrated Development for R. RStudio, PBC, Boston, MA, 2020. http://www.rstudio.
  61. Trifinopoulos, J.; Nguyen, L.T.; von Haeseler, A.; Minh, B.Q. W-IQ-TREE: a fast online phylogenetic tool for maximum likelihood analysis. Nucleic Acids Res. 2016, 44, W232–W235. [Google Scholar] [CrossRef]
  62. Minh, B.Q.; Nguyen, M.A.T.; von Haeseler, A. Ultrafast approximation for phylogenetic bootstrap. Mol. Biol. Evol. 2013, 30, 1188–1195. [Google Scholar] [CrossRef]
  63. Ronquist, F.; Teslenko, M.; van der Mark, P.; Ayres, D.L.; Darling, A.; Höhna, S.; Huelsenbeck, J.P.; et al. MrBayes 3.2: efficient Bayesian phylogenetic inference and model choice across a large model space. Syst. Biol. 2012, 61, 539–542. [Google Scholar] [CrossRef]
  64. Cummings, M.P.; Handley, S.A.; Myers, D.S.; Reed, D.L.; Rokas, A.; Winka, K. Comparing bootstrap and posterior probability values in the four-taxon case. Syst. Biol. 2003, 52, 477–487. [Google Scholar] [CrossRef] [PubMed]
  65. Simmons, M.P.; Pickett, K.M.; Miya, M. How meaningful are Bayesian support values? Mol. Biol. Evol. 2004, 21, 188–199. [Google Scholar] [CrossRef]
  66. Baranow, P.; Rojek, J.; Dudek, M.; Szlachetko, D.; Bohdanowicz, J.; Kapusta, M.; Moraes, A.P.; et al. Chromosome number and genome size evolution in Brasolia and Sobralia (Sobralieae, Orchidaceae). Int. J. Mol. Sci. 2022, 23, 1–17. [Google Scholar] [CrossRef]
  67. Revell, L.J. phytools: an R package for phylogenetic comparative biology (and other things). Methods Ecol. Evol. 2012, 2, 217–223. [Google Scholar] [CrossRef]
  68. Andrews, S. FastQC: a quality control tool for high throughput sequence data. 2010. Available online at http://www.bioinformatics.babraham.ac.
  69. Novák, P.; Robledillo, L.Á.; Koblížková, A.; Vrbová, I.; Neumann, P.; Macas, J. TAREAN: A computational tool for identification and characterization of satellite DNA from unassembled short reads. Nucleic Acids Res. 2017, 45, 1–10. [Google Scholar] [CrossRef]
  70. Novák, P.; Neumann, P.; Macas, J. Graph-based clustering and characterization of repetitive sequences in next-generation sequencing data. BMC Bioinformatics 2010, 11, 1–12. [Google Scholar] [CrossRef]
  71. Madeira, F.; Madhusoodanan, N.; Lee, J.; Eusebi, A.; Niewielska, A.; Tivey, A.R.; Butcher, S.; et al. The EMBL-EBI Job Dispatcher sequence analysis tools framework in 2024. Nucleic Acids Res. 2024, 52, W521–W525. [Google Scholar] [CrossRef] [PubMed]
  72. Ibiapino, A.; Báez, M.; García, M.A.; Costea, M.; Stefanović, S.; Pedrosa-Harand, A. Karyotype asymmetry in Cuscuta L. subgenus Pachystigma reflects its repeat DNA composition. Chromosome Res. 2022, 30, 91–107. [Google Scholar] [CrossRef]
  73. Ruiz-Ruano, F.J.; López-León, M.D.; Cabrero, J.; Camacho, J.P.M. High-throughput analysis of the satellitome illuminates satellite DNA evolution. Sci. Rep. 2016, 6, 1–14. [Google Scholar] [CrossRef] [PubMed]
  74. GBIF.org. GBIF Occurrence Download; 05 September 2025. Available online at https://doi.org/10.15468/dl.5skaxx. 05 September.
  75. Ferree, P.M.; Prasad, S. How can satellite DNA divergence cause reproductive isolation? Let us count the chromosomal ways. Genet. Res. Int. 2012, 2012, 1–11. [Google Scholar] [CrossRef] [PubMed]
  76. Thakur, J.; Packiaraj, J.; Henikoff, S. Sequence, chromatin and evolution of satellite DNA. Int. J. Mol. Sci. 2021, 22, 1–28. [Google Scholar] [CrossRef]
  77. De Lima, L.G.; Ruiz-Ruano, F.J. In-depth satellitome analyses of 37 Drosophila species illuminate repetitive DNA evolution in the Drosophila genus. Genome Biol. Evol. 2022, 14, 1–19. [Google Scholar] [CrossRef]
  78. Peona, V.; Kutschera, V.E.; Blom, M.P.K.; Irestedt, M.; Suh, A. Satellite DNA evolution in Corvoidea inferred from short and long reads. Mol. Ecol. 2023, 32, 1288–1305. [Google Scholar] [CrossRef]
  79. Kuo, Y.T.; Ishii, T.; Fuchs, J.; Hsieh, W.H.; Houben, A.; Lin, Y.R. The evolutionary dynamics of repetitive DNA and its impact on genome diversification in the genus Sorghum. Front. Plant Sci. 2021, 12, 1–16. [Google Scholar] [CrossRef]
  80. Costa, G.C.; Almeida, C. Identification of differential abundance of satellite DNA sequences in Asclepias (Apocynaceae): in-depth characterization of species-specific sequences. Plant Syst. Evol. 2022, 308, 1–7. [Google Scholar] [CrossRef]
  81. Han, Y.; Qin, S.; Wessler, S.R. Comparison of class 2 transposable elements at superfamily resolution reveals conserved and distinct features in cereal grass genomes. BMC Genom. 2013, 14, 1–10. [Google Scholar] [CrossRef] [PubMed]
  82. González, L.G.; Deyholos, M.K. Identification, characterization and distribution of transposable elements in the flax (Linum usitatissimum L.) genome. BMC Genom. 2012, 13, 1–17. [Google Scholar] [CrossRef] [PubMed]
  83. Sader, M.; Vaio, M.; Cauz-Santos, L.A.; Dornelas, M.C.; Vieira, M.L.C.; Melo, N.; Pedrosa-Harand, A. Large vs small genomes in Passiflora: the influence of the mobilome and the satellitome. Planta 2021, 253, 1–18. [Google Scholar] [CrossRef] [PubMed]
  84. Nascimento, J.; Sader, M.; Ribeiro, T.; Pedrosa-Harand, A. Influence of Ty3/gypsy and Ty1/copia LTR-retrotransposons on the large genomes of Alstroemeriaceae: genome landscape of Bomarea edulis (Tussac) Herb. Protoplasma 2025, 262, 881–894. [Google Scholar] [CrossRef]
  85. Kumar, A.; Bennetzen, J.L. Plant retrotransposons. Annu. Rev. Genet. 1999, 33, 479–532. [Google Scholar] [CrossRef]
  86. Kawakami, T.; Strakosh, S.C.; Zhen, Y.; Ungerer, M.C. Different scales of Ty1/copia-like retrotransposon proliferation in the genomes of three diploid hybrid sunflower species. Heredity 2010, 104, 341–350. [Google Scholar] [CrossRef]
  87. Huang, S.; Li, R.; Zhang, Z.; Li, L.; Gu, X.; Fan, W.; Lucas, W.J.; Wang, X.; Xie, B.; Ni, P.; Ren, Y.; Zhu, H.; Li, J.; Lin, K.; Jin, W.; Fei, Z.; Li, G.; Staub, J.; Kilian, A.; Li, S.; et al. The genome of the cucumber, Cucumis sativus L. Nat. Genet. 2009, 41, 1275–1281. [Google Scholar] [CrossRef]
  88. Arida, B.L.; Scopece, G.; Machado, R.M.; Moraes, A.P.; Forni-Martins, E.; Pinheiro, F. Reproductive barriers and fertility of two neotropical orchid species and their natural hybrid. Evol. Ecol. 2021, 35, 41–64. [Google Scholar] [CrossRef]
  89. McClintock, B. The significance of responses of the genome to challenge. Science 1984, 226, 792–801. [Google Scholar] [CrossRef]
  90. Chénais, B.; Caruso, A.; Hiard, S.; Casse, N. The impact of transposable elements on eukaryotic genomes: from genome size increase to genetic adaptation to stressful environments. Gene 2012, 509, 7–15. [Google Scholar] [CrossRef] [PubMed]
  91. De Storme, N.; Mason, A. Plant speciation through chromosome instability and ploidy change: cellular mechanisms, molecular factors and evolutionary relevance. Curr. Plant Biol. 2014, 1, 10–33. [Google Scholar] [CrossRef]
  92. Gantuz, M.; Morales, A.; Bertoldi, M.V.; Ibañez, V.N.; Duarte, P.F.; Marfil, C.F.; Masuelli, R.W. Hybridization and polyploidization effects on LTR-retrotransposon activation in potato genome. J. Plant Res. 2022, 135, 81–92. [Google Scholar] [CrossRef] [PubMed]
  93. Hlavatá, K.; Záveská, E.; Leong-Škorničková, J.; Pouch, M.; Poulsen, A.D.; Šída, O.; Fér, T.; et al. Ancient hybridization and repetitive element proliferation in the evolutionary history of the monocot genus Amomum (Zingiberaceae). Front. Plant Sci. 2024, 15, 1324358. [Google Scholar] [CrossRef]
  94. Hágsater, E.; Soto-Arenas, M.Á. L. In Genera Orchidacearum, 2nd ed.; Pridgeon, A.M., Cribb, P.J., Chase, M.W., Rasmussen, F.N., Eds.; Oxford University Press: Oxford, UK, 2005; Volume 4, pp. 236–251. [Google Scholar]
  95. Patwardhan, A.; Ray, S.; Roy, A. Molecular markers in phylogenetic studies: a review. J. Phylogenet. Evol. Biol. 2014, 2, 131. [Google Scholar] [CrossRef]
  96. Macías-Hernández, N.; Domènech, M.; Cardoso, P.; Emerson, B.; Borges, P.; Lozano-Fernandez, J.; Paulo, O.; Vieira, A.; Enguídanos, A.; Rigal, F.; Amorim, I.; Arnedo, M. Building a robust, densely-sampled spider tree of life for ecosystem research. Diversity 2020, 12, 1–23. [Google Scholar] [CrossRef]
  97. Luebert, F.; Scherson, R. Choice of molecular marker influences spatial patterns of phylogenetic diversity. Biol. Lett. 2024, 20, 1–6. [Google Scholar] [CrossRef]
  98. Castro, N.; Vilela, B.; Mata-Sucre, Y.; Marques, A.; Gagnon, E.; Lewis, G.P.; Souza, G.; et al. Repeatome evolution across space and time: Unravelling repeats dynamics in the plant genus Erythrostemon Klotzsch (Leguminosae Juss.). Mol. Ecol. 2024, e17510, 1–18. [Google Scholar] [CrossRef] [PubMed]
Figure 1. Comparative distribution of repetitive elements across Epidendrum species. Bars represent the percentage of reads of different classes of elements, identified according to the color scheme in the legend (right). The schematic phylogenetic tree (left) is derived from the ML topology (simplified from Fig. S2 for clarity), with node labels indicating bootstrap support values based on likelihood analysis.
Preprints 187579 g001
Figure 2. Sharing and abundance of the satellite DNA set identified in silico in Epidendrum. The graph shows the abundance of satDNA cluster reads per species, with values transformed using base 10 logarithms (log10). This transformation was applied to reduce disparities between the highest and lowest values, making relative differences among species easier to visualize. The legend’s color scale reflects cluster abundance, where warmer colors indicate higher values, cooler colors indicate lower values, and white gaps indicate cluster absence. The schematic phylogenetic tree (left) is derived from the ML topology (simplified from Fig. S2 for clarity), with node labels indicating bootstrap support values based on likelihood analysis.
Preprints 187579 g002
Figure 3. Graph layouts for two of the most and least shared satellite DNA clusters in Epidendrum. a Shows SeqGraph layout for CL8 from SPF2, the most abundant and widely shared cluster; b Shows SeqGraph layout for CL430, which is specific to E. gasteriferum. c Dot plot graphs generated for the consensus sequence of CL8. d Dot plot graphs generated for the consensus sequence of CL430.
Preprints 187579 g003
Figure 4. Diversity of transposable elements in Epidendrum. Comparative distribution of TE read abundance across Epidendrum species. The different lineages are identified according to the color scheme in the legend. The schematic phylogenetic tree (left) is derived from the ML topology (simplified from Fig. S2 for clarity), with node labels indicating bootstrap support values based on likelihood analysis.
Preprints 187579 g004
Figure 5. Most abundant superfamilies of long terminal repeats in Epidendrum. a Pie chart showing total number of reads of Ty1-copia lineages (Ale, Ivana, Tork) identified in Epidendrum. b Pie chart showing total number of reads of Ty3-gypsy chromovirus (CRM, Tekay) and non-chromovirus (Athila, Tat, Ogre, Retand) lineages identified in Epidendrum. c SeqGraph layout of a typical Ty1-copia cluster (CL109). d SeqGraph layout of a typical Ty3-gypsy cluster (CL9).
Preprints 187579 g005
Table 1. Sequencing data collection of all Epidendrum species currently available in NCBI.
NCBI ID Species Prefix
ERX7192163 Epidendrum angustisegmentum (L.O.Williams) Hágsater Eang
SRX7133951 Epidendrum anisatum La Llave & Lex. Eani
SRX22571358 Epidendrum anoglossum Schltr. Eano
SRX22571359 Epidendrum barbeyanum Kraenzl. Ebar
SRX22571360 Epidendrum bicuniculatum Hágsater & E.Santiago Ebic
SRX7133952 Epidendrum ciliare L. Ecil
SRX7133937 Epidendrum conopseum R. Br Econ
SRX7133953 Epidendrum cusii Hágsater Ecus
ERX7193246 Epidendrum difforme Jacq. Edif
SRX7133954 Epidendrum gasteriferum Scheeren Egas
SRX22571361 Epidendrum igneum Hágsater Eign
SRX7133955 Epidendrum juergensenii Rchb.f. Ejue
SRX7133935 Epidendrum lacertinum Lindl. Elac
SRX22571362 Epidendrum lacustre Lindley Elau
SRX7133936 Epidendrum longicaule (L.O. Williams) L.O. Williams Elon
SRX7133938 Epidendrum matthewsii Rchb.f Emah
SRX7133939 Epidendrum matudae L.O.Williams Emau
ERX7193247 Epidendrum nocturnum Jacq. Enoc
ERX7193201 Epidendrum nora-mesae Hágsater & O.Pérez Enor
SRX7133941 Epidendrum octomerioides Schltr. Eoct
SRX22544933 Epidendrum oxyglossum Schltr. Eoxy
SRX7133942 Epidendrum parkinsonianum Hooker Epar
SRX22571363 Epidendrum phyllocharis Rchb.f. Ephy
SRX7133943 Epidendrum propinquum A. Rich. & Galeotti Epro
ERX7193248 Epidendrum ramosum Jacq. Eram
ERX7193250 Epidendrum repens Cogn. Erep
ERX7193245 Epidendrum rigidum Jacq. Erig
ERX7193249 Epidendrum rivulare Lindl. Eriv
SRX22571365 Epidendrum rousseauae Schltr. Erou
SRX7133944 Epidendrum sophronitoides F. Lehm. & Kraenzl. Esop
SRX7133946 Epidendrum succulentum Hágsater Esuc
SRX7133947 Epidendrum summerhayesii Hágsater Esum
ERX7193031 Epidendrum talamancanum (J.T.Atwood) Mora-Ret. & García Castro Etal
SRX7133948 Epidendrum trialatum Hágsater Etri
NCBI ID corresponds to the accession code of the sequencing dataset for each species. The prefix column indicates the code used to label species-specific datasets in the comparative RE2 analysis and to designate satDNA monomers annotated per species.
Table 2. Comparative summary of satDNA identified in Epidendrum species in silico.
Species No. of shared satDNA clusters Total satDNA abundance (%) Total reads analysed in RE2
E. angustisegmentum 55 29.39 64,728
E. anisatum 50 32.38 65,012
E. anoglossum 54 28.06 64,350
E. barbeyanum 47 17.28 64,175
E. bicuniculatum 52 26.10 64,664
E. ciliare 48 24.54 64,766
E. conopseum 50 44.44 64,592
E. cusii 46 30.90 64,106
E. difforme 47 59.22 64,346
E. gasteriferum 47 24.82 64,446
E. igneum 47 26.15 64,690
E. juergensenii 45 38.17 65,008
E. lacertinum 47 25.20 64,416
E. lacustre 49 38.64 64,990
E. longicaule 37 22.69 64,640
E. mathewsii 44 22.98 64,566
E. matudae 50 29.41 65,036
E. nocturnum 48 15.56 65,484
E. nora-mesae 51 39.68 64,272
E. octomerioides 51 24.70 64,870
E. oxyglossum 53 27.53 35,926
E. parkinsonianum 47 28.17 65,092
E. phyllocharis 52 48.76 129,334
E. propinquum 47 21.64 64,664
E. ramosum 58 67.18 64,820
E. repens 56 41.89 64,834
E. rigidum 50 69.03 65,004
E. rivulare 54 65.81 65,026
E. rousseauae 49 27.29 65,378
E. sophronitoides 51 16.57 64,814
E. succulentum 42 23.07 64,600
E. summerhayesii 46 35.72 64,924
E. talamancanum 49 30.20 64,266
E. trialatum 43 18.75 64,452
Summary of satDNA annotations in Epidendrum species. The second column shows the number of satDNA clusters classified by RE2 (with automatic and manual annotations using the Epidendrum satDNA custom database) that are shared with other species of the genus (Figure 2). The third column indicates the total satDNA abundance (%) in each species dataset, and the last column shows the total number of reads analyzed in RE2.
Disclaimer/Publisher’s Note: The statements, opinions and data contained in all publications are solely those of the individual author(s) and contributor(s) and not of MDPI and/or the editor(s). MDPI and/or the editor(s) disclaim responsibility for any injury to people or property resulting from any ideas, methods, instructions or products referred to in the content.
Copyright: This open access article is published under a Creative Commons CC BY 4.0 license, which permit the free download, distribution, and reuse, provided that the author and preprint are cited in any reuse.
Prerpints.org logo

Preprints.org is a free preprint server supported by MDPI in Basel, Switzerland.

Subscribe

Disclaimer

Terms of Use

Privacy Policy

Privacy Settings

© 2025 MDPI (Basel, Switzerland) unless otherwise stated