
Submitted:
01 December 2025
Posted:
02 December 2025
You are already at the latest version
Abstract
High Nature Value (HNV) mountain grasslands in the Eastern Carpathians are sensitive to fertilization intensification. This study evaluated the effects of organic and mineral inputs on the floristic composition, vegetation types, and diversity of an oligotrophic grassland with Nardus stricta in a long-term experiment established in 2002, with results presented here from three recent experimental years (2022–2024) with nine variants (unfertilized control, 10–30 t ha⁻¹ manure applied in autumn/spring, and 200–300 kg ha⁻¹ nitrocalcar). Vegetation composition was analyzed using hierarchical classification, PCoA, MRPP, Indicator Species Analysis, and α-diversity indices (species richness, Shannon, Simpson, and evenness). The results revealed six floristic types arranged along a clear trophic gradient, ranging from oligotrophic to eutrophic communities. Specifically, low-moderate manure treatments (10–20 t ha⁻¹) simultaneously maximized community diversity and balance, maintaining a rich core of oligotrophic and mesotrophic species. Conversely, high doses of manure (30 t ha⁻¹) and mineral fertilization led to a marked reduction in species richness and the dominance of a few competitive-grass species. Ultimately, this study demonstrates that moderate organic fertilization is compatible with the adaptive management of HNV grasslands, whereas intensive mineral fertilization is incompatible with conservation objectives.
Keywords:
montane grasslands
; High Nature Value (HNV)
; fertilization gradient
; biodiversity
; indicator species
; Eastern Carpathians
; sustainable grassland management
1. Introduction
High Nature Value (HNV) grasslands represent some of the most complex and valuable agro-pastoral ecosystems in Europe, characterized by high floristic richness, structural heterogeneity, and a long history of traditional management through mowing and extensive grazing [1,2,3]. These grasslands provide a wide range of essential ecosystem services, such as the production of high-quality fodder [4] for ruminants, which is rich in protein and minerals [5,6], maintaining soil structure and nutrient cycling [7,8], carbon sequestration, regulating hydro-ecological processes [9,10,11], providing habitat for biodiversity [12,13,14,15], and cultural services that support the identity of mountain communities[16,17,18].
In Romania, HNV grasslands cover extensive areas across the Eastern, Southern, and Western Carpathians, where they form core biodiversity hotspots and are included in the Natura 2000 Network. Among these, the Nardus stricta–dominated grasslands of the Eastern Carpathians stand out as unique oligotrophic ecosystems that are exceptionally sensitive to anthropogenic pressures [9,19,20]. These semi-natural systems are home to numerous species of conservation and economic interest, including medicinal plants such as Arnica montana, which is well represented in the high areas of the northeastern Carpathians [21,22,23]. In addition, HNV grasslands are a central component of traditional cultural landscapes and the identity of rural communities [24,25]. Given their sensitivity to anthropogenic pressures, mountain grasslands are considered important indicators of socioecological resilience [26,27,28,29]. In recent decades, socioeconomic transformations have generated two opposing but equally problematic trends: agricultural intensification and abandonment [30,31]. Within the context of changing land use, fertilization remains one of the main factors controlling the dynamics of plant communities in mountain grasslands, contributing to increased productivity and improved nutritional value of the fodder [32,33,34]. However, intensification through excessive fertilization and mechanization leads to simplified vegetation cover, increased dominance of nitrophilic species, and reduced diversity ([35]. At the opposite end of the spectrum, abandonment favors secondary succession, the emergence of woody species, and a decrease in forage value [36,37,38,39].
Fertilization remains one of the main factors controlling the dynamics of plant communities in mountain grasslands, with effects depending on the dose, frequency, and nutrient source [36,40,41]. Low or moderate organic inputs can stimulate productivity while maintaining species diversity [27,42], in line with the intermediate disturbance hypothesis ([43,44,45]. Mulching is another method for maintaining HNV grasslands [46,47,48]. In contrast, repeated mineral fertilization favors competitive grasses, reduces the presence of oligotrophic species, and simplifies phytocenoses [49,50]. Recent results have shown that fertilization influences not only vegetation but also soil microbiome functions, restructures plant–microorganism relationships, and alters key nutrient cycle processes [51,52]. At the European level, recent studies have confirmed that persistent fertilization reduces diversity and favors competitive grasses in alpine and subalpine regions [53,54], and that traditional management is essential for maintaining species-rich habitats [11,28,55]. In the Carpathians, where climatic, demographic, and economic pressures are increasing, research on the interactions between fertilization and vegetation structure is fundamental for designing sustainable management strategies [56,57] for the conservation of biodiversity and the mountain cultural landscape [58,59,60].
Despite substantial progress in grassland ecology, long-term experimental evidence focusing on the specific effects of different organic and mineral fertilization regimes on Nardus stricta–dominated HNV grasslands in the Eastern Carpathians is still limited. Most previous studies either address broader geographic areas, rely on short-term observations, or do not directly compare the influence of varying fertilizer doses and application times within a single, long-term experimental framework. Filling this gap is essential for understanding how fine-scale management differences shape floristic composition and biodiversity and for developing adaptive strategies that reconcile conservation goals with agricultural needs in sensitive mountainous environments. Specifically, we hypothesized that: (1) moderate organic fertilization would maintain or increase floristic diversity compared to unfertilized controls, in line with the intermediate disturbance hypothesis; (2) high organic and mineral fertilization would lead to a significant reduction in species richness and a shift towards competitive, eutrophic species; and (3) the timing of organic fertilizer application (autumn vs. spring) would differentially influence floristic composition and diversity. Therefore, this study aimed to analyze how different fertilizer inputs (organic, mineral, moderate, and intensive) influence the floristic composition, vegetation types, and diversity of mountain grasslands in the Eastern Carpathians using an integrated analytical framework comprising vegetation classification, PCoA, MRPP, and indicator species analysis. The results have direct implications for the adaptive management of HNV grasslands, biodiversity conservation, and optimization of agricultural practices in sensitive mountain areas. This study, conducted within a long-term experimental setup initiated in 2002, focuses on the floristic composition, vegetation types, and diversity of mountain grasslands based on data collected during the 2022-2024 period.
2. Results
2.1. Hierarchical Cluster Analysis of Floristic Composition
The hierarchical classification analysis of floristic composition revealed clear differences between the experimental variants, driven by fertilization intensity and type. Using a cutoff of approximately 72% of the remaining information allowed the delimitation of six distinct floristic groups, each corresponding to a specific ecological grassland type (Figure 1). Cluster 1 (control variant T1) was characterized by the dominance of acidophilic species, particularly Nardus stricta associated with Festuca rubra, reflecting the grasslands' initial oligotrophic state. Cluster 2 included variants moderately fertilized with small doses of manure (T2 and T5). Reduced organic fertilization led to a decrease in the abundance of Nardus stricta and an increase in the proportion of Festuca rubra, marking the transition to grasslands with a moderate trophic supply of nutrients. Cluster 3 included variants at an advanced stage of the improvement process (T3 and T6). Festuca rubra and Agrostis capillaris dominated this group, but acidophilic elements were still present, indicating an intermediate stage between oligotrophic and mesotrophic grasslands. Cluster 4 corresponded to a stable type of improved grassland dominated by Festuca rubra and Agrostis capillaris. This group is associated with moderate to high doses of manure applied in both autumn and spring, resulting in a balanced floristic structure and diversification of mesotrophic species. Cluster 5 was characterized by the pronounced dominance of Agrostis capillaris, followed by Festuca rubra, especially under high doses of manure (T4 and T7). The increased competitiveness of mesotrophic species gives vegetation a more uniform and productive structure. Cluster 6 includes variants intensively fertilized with nitrocalcar (T8, T9), where Agrostis capillaris becomes almost exclusively dominant. High mineral fertilization significantly reduces the presence of oligotrophic species and leads to simplification of the floristic structure. Overall, the dendrogram indicated clear differences between the control, organic fertilization, and mineral fertilization, reflecting a consistent gradient of change in floristic composition. The obtained groups formed the basis for the detailed ecological interpretations presented in the Discussion section.
Legend: T1 - unfertilized control; T2 - 10 t ha⁻¹ manure applied in autumn; T3 - 20 t ha⁻¹ manure applied in autumn; T4 - 30 t ha⁻¹ manure applied in autumn; T5 - 10 t ha⁻¹ manure applied in spring; T6 - 20 t ha⁻¹ manure applied in spring; T7 - 30 t ha⁻¹ manure applied in spring; T8 - 200 kg ha⁻¹ nitrocalcar applied in spring; T9 - 300 kg ha⁻¹ nitrocalcar applied in spring; R1–R4—replications. The dendrogram cutoff line was set at approximately 72% of the remaining information, resulting in six clusters being identified.
2.2. Principal Coordinates Analysis (PCoA) and Floristic Differentiation
PCoA confirmed the clear separation of treatments according to the vegetation types previously identified by clustering analysis. Axis 1 explains 92.1% of the variation in species composition and represent the main fertilization gradient. Axis 2 contributed an additional 6.7%, primarily distinguishing unfertilized plots from those receiving organic fertilization applied in autumn (Table 1).
The strongest link was between Nitrocalc_30 and Axis 1 (r = 0.582, p < 0.01), indicating their position at the eutrophic end of the gradient. On Axis 2, only two treatments showed significant correlations: no fertilization (positive) and 20 t ha⁻¹ manure in autumn (negative), highlighting the differentiated effect of the timing of manure application on vegetation structure. Overall, Axis 1 represented the oligotrophic–eutrophic gradient, and Axis 2 differentiated the moderate treatments according to the season of manure application (Table 2).

Table 2.
Correlation of experimental factors with ordination axes (PCoA).
| Experimental Factors | Axis 1 (r) | Significance | Axis 2 (r) | Significance |
|---|---|---|---|---|
| No fertilization | −0.436 | * | 0.768 | *** |
| 10t_man_aut | −0.340 | * | −0.162 | ns |
| 20t_man_aut | −0.144 | ns | −0.580 | ** |
| 30t_man_aut | 0.237 | ns | −0.093 | ns |
| 10t_man_spri | −0.336 | * | 0.008 | ns |
| 20t_man_spri | −0.217 | ns | −0.238 | ns |
| 30t_man_spri | 0.213 | ns | −0.033 | ns |
| Nitrocalcar 200 kg ha⁻¹ | 0.443 | ** | 0.093 | ns |
| Nitrocalcar 300 kg ha⁻¹ | 0.582 | ** | 0.238 | ns |
| Axis importance | 92.1% | 6.7% |
Note: r = correlation coefficient between ordination distances and explanatory variables; significance: *** p < 0.001, ** p < 0.01, * p < 0.05, ns = not significant. Axis importance indicates the proportion of the total variance explained by each axis: Axis 1 = 92.1%, Axis 2 = 6.7%, cumulative = 98.8%.
The PCoA (Figure 2) showed a clear separation of areas based on floristic composition, with the first two axes explaining almost all of the variation between treatments. The areas were organized into three large groups corresponding to the types dominated by Nardus stricta, Festuca rubra, and Agrostis capillaris. The unfertilized areas (T1) were grouped in the area associated with Nardus stricta, whereas the treatments with moderate levels of manure (T2–T6) were located in the intermediate area, which was characterized by the presence of Festuca rubra. Mineral treatments (T8–T9) and some variants with high doses of manure (T4 and T7) were applied in areas dominated by Agrostis capillaris. The overlaid vectors indicate the overall direction of the fertilization gradient. No_fertilz was oriented toward the Nardus stricta group. The vectors corresponding to high fertilization levels (Nitrocalc_20, Nitrocalc_30, Fert_high_aut, Fert_high_spr) pointed towards the Agrostis capillaris group. The contours of vegetation types (vegetation ‘hilltops’, i.e., areas of maximum density in ordination space) highlighted a clear spatial separation of the three main groups, with moderate overlap in the intermediate mesotrophic zone and complete separation at the extremes of the gradient. The treatment gradient followed the expected transition from the unfertilized control (T1) on the left side of the ordination to the high nitrocalcar doses (T9) on the right side, reflecting progressive changes in floristic composition.
The relationships between the three dominant species (Agrostis capillaris, Festuca rubra, and Nardus stricta) and the PCoA axes confirmed their essential roles in defining trophic gradients (Figure 3). Agrostis capillaris (panel A) appeared in the positive area of Axis 1, coinciding with the positioning of treatments T8 and T9 and variants with high doses of manure (T4 and T7). The clear positive relationship between Axis 1 scores and species abundance indicates an affinity for high trophic input levels. Festuca rubra (panel B). Festuca rubra occupied intermediate positions on Axis 1 and values close to the origin on Axis 2. Areas T2–T6 are in the vicinity of this species, reflecting its preference for moderate fertilization levels. The negative slopes of the regressions on both axes indicate that the abundance of Festuca rubra decreases towards both the oligotrophic and eutrophic extremes. Nardus stricta (panel C). Nardus stricta is positioned in the negative area of Axis 1 and in the positive part of Axis 2, in line with the grouping of control areas (T1). The negative relationships with Axis 1 and slightly positive relationships with Axis 2 highlight the preference of this species for oligotrophic soils with no or minimal fertilization. Overall, the overlap of treatment vectors over site scores and species abundance clearly demonstrated how the applied inputs shaped the floristic-ecological distribution of the communities.
The two main axes delimit four major floristic types (Figure 4 A+B): Subtype Nardus stricta – Festuca rubra; Type Festuca rubra – Nardus stricta; Type Festuca rubra – Agrostis capillaris; Type Agrostis capillaris. These were coherently arranged in the ordination space. Unfertilized areas (T1) were concentrated in the Nardus stricta zone, whereas low and medium manure treatments (T2–T6) overlapped in the mesotrophic zone dominated by Festuca rubra. Mineral (T8–T9) and high manure (T4, T7) treatments were grouped in the eutrophic zone dominated by Agrostis capillaris. The treatment vectors reflect the direction of the trophic gradient: No_fertilz → oligotrophic zone; Fert_high_aut / Fert_high_spr / Nitrocalc_20 / Nitrocalc_30 → Eutrophic zone. The distribution of dominant species is consistent with this structure, confirming the concordance between classification, ordination, and ecologically defined floristic type. These floristic types, visually highlighted in the ordination space, were subsequently statistically validated using the MRPP analysis.
2.3. Multi-Response Permutation Procedure Analysis
MRPP analysis confirmed the strong statistical separation of the six floristic groups. All pairwise comparisons were significant (p < 0.001) with high A values (0.284–0.767), indicating internal homogeneity above the expected random level. Key findings: Group 1 (T1) was the most distinct from all other treatments (A = 0.682–0.767). Group 6 (T8–T9, nitrocalcar) showed the highest internal homogeneity (A up to 0.767), confirming the uniformity of composition under intense mineral fertilization. Group 5 (high manure dose) was clearly separated from Group 6, indicating that intensive organic fertilization produced a distinct type from that obtained through mineral fertilization. Thus, the MRPP validated the stability of the floristic types delineated by the cluster and PCoA.
Table 2.
MRPP pairwise comparisons of floristic composition between the four grassland groups.
| Groups compared | T statistic | A (within-group agreement) | p-value |
|---|---|---|---|
| Group 1 vs. Group 2 | −7.080 | 0.485 | <0.001 |
| Group 1 vs. Group 3 | −4.450 | 0.721 | <0.001 |
| Group 1 vs. Group 4 | −7.314 | 0.682 | <0.001 |
| Group 1 vs. Group 5 | −4.444 | 0.609 | <0.001 |
| Group 1 vs. Group 6 | −7.280 | 0.767 | <0.001 |
| Group 2 vs. Group 3 | −6.736 | 0.458 | <0.001 |
| Group 2 vs. Group 4 | −10.122 | 0.622 | <0.001 |
| Group 2 vs. Group 5 | −6.282 | 0.284 | <0.001 |
| Group 2 vs. Group 6 | −10.107 | 0.745 | <0.001 |
| Group 3 vs. Group 4 | −7.253 | 0.562 | <0.001 |
| Group 3 vs. Group 5 | −4.273 | 0.400 | <0.001 |
| Group 3 vs. Group 6 | −7.191 | 0.719 | <0.001 |
| Group 4 vs. Group 5 | −7.248 | 0.534 | <0.001 |
| Group 4 vs. Group 6 | −9.513 | 0.462 | <0.001 |
| Group 5 vs. Group 6 | −7.207 | 0.702 | <0.001 |
Note: T = test statistics; A = chance-corrected within-group agreement. Significance: ***p < 0.001. Group 1 = T1 - unfertilized control; Group 2 = T2, T5 (T2 - 10 t ha⁻¹ manure applied in autumn; T5 - 10 t ha⁻¹ manure applied in spring); Group 3 = T6 - 20 t ha⁻¹ manure applied in spring; Group 4 = T3 - 20 t ha⁻¹ manure applied in autumn; Group 5 = T4, T7 (T4 - 30 t ha⁻¹ manure applied in autumn; T7 - 30 t ha⁻¹ manure applied in spring); Group 6 = T8, T9 (T8 - 200 kg ha⁻¹ nitrocalcar applied in spring; T9 - 300 kg ha⁻¹ nitrocalcar applied in spring).
2.4. Species–Environment Relationships Along PCoA Axes
The distribution of species in relation to the ordination axes highlighted how each species responded to the treatment gradient, particularly the differences between organic and mineral inputs (Table 4). On Axis 1, positive values were mainly associated with variants fertilized with nitrocalcar (T8–T9) and variants with high doses of manure (T4–T7). This area contained species with the highest positive correlations, such as Agrostis capillaris and Phleum pratense. These are characteristic of areas where fertilization, especially mineral fertilization, strongly influences the floristic composition. The negative values on Axis 1 were associated with unfertilized areas (T1) and treatments with low doses of manure applied in autumn and spring (T2 and T5, respectively). This area is home to Nardus stricta, Festuca rubra, Scorzonera rosea, Potentilla erecta, and other species characteristic of areas with low inputs. The association of these species with the negative area of Axis 1 corresponds to treatments in which the influence of fertilization was reduced or absent. On Axis 2, the differentiation was mainly between unfertilized areas, variants with manure applied in autumn, and treatments with medium-to high organic inputs. Thus, Nardus stricta, Viola canina, and Luzula luzuloides were positioned in the positive area, where repetitions from T1 and, partially, variants with low doses of manure were predominantly found. Species with negative correlations on Axis 2, such as Trifolium repens, Anthoxanthum odoratum, Veronica chamaedrys, Lotus corniculatus, and Trifolium pratense, were associated with variants with medium organic inputs and transitions between moderately and intensively fertilized areas. These species were found mainly in the space occupied by treatments T3, T4, and T6, where the effect of manure, regardless of the time of application, was reflected in the floristic composition. Species with low or insignificant correlations were evenly distributed in the order, with no obvious response to the inputs applied, suggesting a constant presence in most variants, regardless of the level of fertilization.
2.5. Indicator Species Analysis (ISA)
Indicator species analysis (ISA) revealed distinct sets of characteristic species for each of the six floristic groups identified by cluster classification (Table 5). Each group had at least one indicator species with high IndVal values, confirming the delimitation of vegetation types based on floristic composition.
Group 1 (oligotrophic grasslands of Nardus stricta-Festuca rubra) has the most consistent set of indicator species, including Nardus stricta, Avenula planiculmis, Potentilla erecta, Viola canina, and Luzula luzuloides, all with high IndVal values and statistical significance. These define the oligotrophic communities that are typical of nutrient-poor mountain habitats. Group 2 (communities with low manure inputs) was determined by treatments with 10 t ha⁻¹ and was mainly associated with Phleum alpinum, Poa chaixii, Rhinanthus minor, and Hypochaeris uniflora. These species have high indicator values and delimit an intermediate type of vegetation between unfertilized and moderately fertilized areas, while also indicating an early transition to mesotrophic conditions. Group 3 (communities under moderate spring manure inputs) was marked by species that prefer moderate trophic input, such as Anthoxanthum odoratum, Trifolium hybridum, Trifolium repens, Lotus corniculatus, Hypericum maculatum, Leucanthemum vulgare, Cruciata glabra, and Veronica chamaedrys. Their constant presence reflects the stability of communities with moderate nutrient input. Group 4 (communities with moderate autumn manure inputs) was defined by the presence of Trifolium pratense and Centaurea phrygia, both of which had significant indicator values. This group corresponds to moderately fertilized grasslands with organic inputs applied in the fall, which leads to a different floristic composition than that of identical fertilization applied in the spring. Group 5 (communities with high manure inputs) showed high indicator values for Alchemilla xanthochlora and Dianthus barbatus subsp. compactus, species characteristic of high doses of manure applied in autumn and spring, respectively. This reflects the influence of intensive organic fertilization on vegetation structure. Group 6 (communities with mineral fertilization) was associated with clear indicators of mineral fertilization, such as Agrostis capillaris and Phleum pratense. Both species showed high indicator values and almost exclusive distribution in the nitrocalcar treatments, highlighting the clear response of vegetation to mineral input, emphasizing the uniformity of communities, and the dominance of competitive grasses. Overall, ISA validated the robustness of the identified floristic types, confirming the response of plant communities to fertilization gradients.
Table 5.
Indicator value of species related to the groups.
| Species | Group | IndVal | Signif. |
| Agrostis capillaris L. | 6 | 46.4 | p < 0.001 |
| Festuca rubra L. | 3 | 22.1 | ns |
| Nardus stricta L. | 1 | 41.9 | p < 0.001 |
| Avenula planiculmis (Schur) Holub | 1 | 50.0 | p < 0.01 |
| Anthoxanthum odoratum L. | 3 | 39.5 | p < 0.01 |
| Phleum alpinum L. | 2 | 51.1 | p < 0.01 |
| Phleum pratense L. | 6 | 30.4 | p < 0.01 |
| Poa chaixii Vill. | 2 | 40.9 | p < 0.01 |
| Deschampsia flexuosa (L.) Trin. | 1 | 26.7 | ns |
| Trifolium hybridum L. | 3 | 48.1 | p < 0.01 |
| Trifolium pratense L. | 4 | 23.3 | p < 0.05 |
| Trifolium repens L. | 3 | 31.0 | p < 0.01 |
| Lotus corniculatus L. | 3 | 40.3 | p < 0.01 |
| Achillea millefolium L. | 4 | 34.7 | ns |
| Achillea stricta Schleich. ex W.D.J. Koch | 1 | 29.6 | ns |
| Alchemilla xanthochlora Rothm. | 5 | 47.1 | p < 0.01 |
| Campanula serrata (Kit.) Hendrych | 5 | 27.0 | ns |
| Centaurea phrygia L. | 4 | 39.2 | p < 0.01 |
| Cruciata glabra (L.) Ehrend. | 3 | 46.5 | p < 0.01 |
| Dianthus barbatus subsp. compactus (Kit.) Grognot | 5 | 40.0 | p < 0.05 |
| Euphrasia stricta D. Wolff ex J.F. Lehm. | 1 | 30.8 | ns |
| Hieracium aurantiacum L. | 1 | 34.8 | ns |
| Hieracium umbellatum L. | 1 | 38.2 | ns |
| Hypericum maculatum Crantz | 3 | 39.5 | p < 0.01 |
| Hypochaeris uniflora Vill. | 2 | 26.1 | p < 0.05 |
| Leucanthemum vulgare Lam. | 3 | 49.0 | p < 0.01 |
| Luzula luzuloides (Lam.) Dandy & Wilmott | 1 | 40.0 | p < 0.05 |
| Phyteuma spicatum L. | 5 | 30.0 | ns |
| Potentilla erecta (L.) Raeusch. | 1 | 36.4 | p < 0.05 |
| Rhinanthus minor L. | 2 | 50.0 | p < 0.01 |
| Rumex acetosa L. | 1 | 20.0 | ns |
| Scorzonera rosea Waldst. & Kit. | 1 | 23.5 | ns |
| Stellaria graminea L. | 2 | 22.9 | ns |
| Veronica chamaedrys L. | 3 | 34.8 | p < 0.05 |
| Viola canina L. | 1 | 53.3 | p < 0.01 |
| Viola declinata Waldst. & Kit. | 1 | 22.5 | ns |
Note: Groups correspond to the six phytosociological clusters identified by the cluster analysis. Significance: *** p < 0.001, ** p < 0.01, * p < 0.05, ns = not significant. Groups meaning: Group 1 = T1 - unfertilized control; Group 2 = T2, T5 (T2 - 10 t ha⁻¹ manure applied in autumn; T5 - 10 t ha⁻¹ manure applied in spring); Group 3 = T6 - 20 t ha⁻¹ manure applied in spring; Group 4 = T3 - 20 t ha⁻¹ manure applied in autumn; Group 5 = T4, T7 (T4 - 30 t ha⁻¹ manure applied in autumn; T7 - 30 t ha⁻¹ manure applied in spring); Group 6 = T8, T9 (T8 - 200 kg ha⁻¹ nitrocalcar applied in spring; T9 - 300 kg ha⁻¹ nitrocalcar applied in spring).
2.6. The Impact of Management Scenarios on Diversity Indices
The diversity index values showed that grasslands responded nonlinearly to the fertilization gradient. Oligotrophic communities (T1) exhibited moderate levels of diversity and uniformity, which are typical of nutrient-poor mountain grasslands (S = 31.75 and H′ = 2.199). These values reflect the structure of a low-fertility mountain grassland, where the dominance of competitive species is limited and the distribution of abundance is relatively balanced. Applying a reduced amount of waste (T2, T5: low-input, maximum diversity) significantly increased diversity, especially in T5 (spring), which had the highest species richness and Shannon index (S = 35 and H′ = 2.857). These results confirm the intermediate disturbance hypothesis: low-nutrient input reduces the dominance of competitive species, favoring their co-existence. Moderate fertilization applied in autumn (T3, T6: medium-input-high and stable diversity) produced high diversity values (H′ ≈ 2.70–2.77), highlighting an optimal compromise between productivity and species conservation. This level of input promotes a well-balanced community with similar proportions of species while maintaining a high diversity. High doses of fertilizer applied in autumn (T4 and T7: high-input organic-decline in diversity) caused a reduction in diversity and uniformity (e.g., T7, H′ = 1.958; S = 24.25), indicating the emergence of dominance of grasses tolerant to intensive fertilization. This indicates the emergence of imbalances in the community structure and an increasingly pronounced dominance of species tolerant to high organic inputs.
Mineral fertilization (T8 and T9 - extreme simplification) generated the lowest values for all indices, especially T9 (H′ = 0.926 and S = 11.25). This confirms rapid eutrophication and the loss of sensitive oligotrophic species, as well as a strong simplification of the community, with increased dominance of a small number of species adapted to high fertility and tolerant of mineral input levels. ANOVA revealed significant differences for all variables (p < 0.001), indicating that the effect of fertilization on community structure was strong and consistent.
Table 6.
The influence of fertilization treatments on biodiversity indices in grasslands.
| Treatment | Species richness (S) |
Shannon index (H') | Evenness (E) | Simpson (D) |
|---|---|---|---|---|
| T1 | 31.75 ± 0.96 | 2.199 ± 0.055 | 0.636 ± 0.016 | 0.789 ± 0.018 |
| T2 | 32.50 ± 1.73 | 2.714 ± 0.043 | 0.780 ± 0.011 | 0.892 ± 0.006 |
| T3 | 32.25 ± 1.50 | 2.770 ± 0.035 | 0.798 ± 0.004 | 0.903 ± 0.003 |
| T4 | 26.25 ± 2.50 | 2.158 ± 0.036 | 0.662 ± 0.025 | 0.779 ± 0.007 |
| T5 | 35.00 ± 1.15 | 2.857 ± 0.042 | 0.804 ± 0.016 | 0.912 ± 0.004 |
| T6 | 32.25 ± 2.22 | 2.709 ± 0.037 | 0.780 ± 0.011 | 0.895 ± 0.003 |
| T7 | 24.25 ± 1.71 | 1.958 ± 0.070 | 0.615 ± 0.021 | 0.744 ± 0.017 |
| T8 | 18.25 ± 5.12 | 1.426 ± 0.085 | 0.500 ± 0.032 | 0.548 ± 0.009 |
| T9 | 11.25 ± 2.22 | 0.926 ± 0.027 | 0.388 ± 0.037 | 0.387 ± 0.017 |
| F-test | 43.05 | 685.81 (df=8,27) |
183.73 (df=8,27) |
1079.41 (df=8,27) |
| p-value | < 0.001 | < 0.001 | < 0.001 | < 0.001 |
Legend: T1 - unfertilized control; T2 - 10 t ha⁻¹ manure applied in autumn; T3 - 20 t ha⁻¹ manure applied in autumn; T4 - 30 t ha⁻¹ manure applied in autumn; T5 - 10 t ha⁻¹ manure applied in spring; T6 - 20 t ha⁻¹ manure applied in spring; T7 - 30 t ha⁻¹ manure applied in spring; T8 - 200 kg ha⁻¹ nitrocalcar applied in spring; T9 - 300 kg ha⁻¹ nitrocalcar applied in spring. Note: Values are means ± standard error (n = four replicates per treatment). One-way ANOVA was used to test for differences between the treatments. Different letters within a column indicate significant differences at p < 0.05, according to the LSD test
3. Discussion
3.1. Floristic Responses to Fertilization in HNV Mountain Grasslands
The results of hierarchical classification and PCoA ordination clearly show that the fertilization gradient profoundly alters the structure of plant communities, generating clear transitions between three major vegetation types: Nardus stricta (oligotrophic), Festuca rubra (mesotrophic), and Agrostis capillaris (eutrophic). The evolution of these floristic types is in line with the patterns reported in HNV grasslands in Romania [14,61,62] and Central Europe, where excessive fertilization leads to the simplification of vegetation cover and loss of specialized species [63,64]. In the Lucina experiment, low-moderate organic fertilization favored the Festuca rubra – Nardus stricta and Festuca rubra – Agrostis capillaris types, confirming that moderate nutrient levels can improve trophic conditions without compromising diversity. Similar results were reported in the Apuseni Mountains and Transylvania, where moderate doses of manure maintained a stable core of mesotrophic and oligotrophic species [27,46,65].
In contrast, intensive organic and mineral fertilization led to the almost exclusive dominance of Agrostis capillaris, indicating that the resilience threshold of HNV habitats had been exceeded. Similar results regarding floristic simplification under intensive fertilization have been reported in mountain grasslands in Romania [66] and in long-term experiments in Central Europe [63,67]. These studies show that once fertilization exceeds moderate levels, semi-natural communities tend to be dominated by a few competitive grasses, with the loss of oligotrophic species of conservation value and HNV indicators [64,68]. In the context of HNV, and as confirmed by our results, high and repeated organic and mineral fertilization is incompatible with the maintenance of oligotrophic types of Nardus stricta, as defined in recent literature [56,69,70]. From this perspective, the results from the Eastern Carpathians converge with those reported in the Apuseni Mountains for Arnica montana grasslands, where moderate manure use has allowed the conservation of HNV habitats, whereas intensification has led to the loss of sensitive species [21,22,71].
3.2. Species–Environment Relationships and Indicator Species Patterns
The correlations between species and the PCoA axes confirmed the role of dominant grasses as effective indicators of trophic gradient. Nardus stricta and the associated oligotrophic species (e.g., Potentilla erecta, Luzula luzuloides, Avenula planiculmis, Euphrasia stricta, Viola canina) are strongly associated with unfertilized areas, characterizing the oligotrophic type typical of 6230* habitats. This group of species largely corresponds to the sets of indicators used to define oligotrophic grasslands in the Apuseni Mountains [19,28,59], and other European mountain regions [64]. Many of these species have been proposed as indicators for the management of HNV grasslands [15,116]. Mesotrophic species, especially Festuca rubra, Trifolium repens, Anthoxanthum odoratum, and Lotus corniculatus, showed intermediate correlations, being sensitive to both intensification and reduction of inputs. These marked the optimal biodiversity zones identified in treatments with moderate manure. Such responses have also been described in other grassland systems [13,80], where moderate organo-mineral inputs maintained a balance between forage value and the presence of oligotrophic species. Our results are consistent with those obtained in the Apuseni Mountains on Festuca rubra grasslands fertilized with manure [50,114,115].
Nitrocalcar treatments were characterized almost exclusively by Agrostis capillaris and Phleum pratense, which had the highest IndVal values in group 6. This pattern is typical of eutrophicated habitats, where competition for light and nutrients favors the growth of fast-growing grasses [12,68]. ISA analysis thus validated the six floristic types identified, confirming that fertilization is the determining factor of the vegetation structure. These patterns are consistent with international studies showing that in semi-natural grasslands, nitrogen fertilization rapidly reduces diversity and favors a small set of competitive grasses [72]. Recent meta-analyses have confirmed that mineral fertilization tends to homogenize communities and reduce the importance of eutrophication-sensitive species, whereas moderate organic fertilization can maintain a higher degree of functional heterogeneity [8,73,74,75].
3.3. Diversity Responses to Organic vs Mineral Fertilization
The analysis of diversity indices showed a typical response to the "intermediate" curve—the maximum values of specific Richness, Shannon and Simpson appeared in treatments with low or moderate doses of manure, especially T5 and T3/T6, in both autumn and spring. This structure corresponds to the intermediate disturbance hypothesis [43,44,67] and is consistent with the results obtained in other mountain experiments in Romania [50], as well as in Central Europe [63]. Moderate organic fertilization maintained a balanced distribution of species abundance, reflecting reduced competition between dominant grasses and oligotrophic species. Similar results have been reported in recent meta-analyses, which show that moderate organic amendments increase functional diversity and ecosystem stability [8,73,76,77]. In contrast, mineral fertilization with nitrocalcar reduced diversity to extremely low levels, confirming the trend towards uniformity and loss of sensitive species. This situation has been confirmed by studies on HNV grasslands in Romania [111,112,113] and international research highlighting the destabilizing effect of eutrophication on the productivity and stability of grassland ecosystems [72,78]. The results of the experiment confirm that there is an "optimal window" in which moderate organic fertilization simultaneously maximizes productivity and diversity, a trade-off supported by recent studies [74,79,80].
3.4. Management Implications for Nardus Stricta Grasslands in the Eastern Carpathians
From the perspective of HNV grassland management in the Eastern Carpathians, the results indicate three main findings. Maintaining oligotrophic types (Nardus stricta). The reference grasslands (T1) and those with very low fertilization represent the core of oligotrophic habitats 6230 and HNV, comparable to those described in studies conducted in the Apuseni Mountains and Natura 2000 sites [108,109,110]. These ecosystems are home to numerous indicator species and plants of conservation and economic value [46,47,48] and are sensitive to both intensification and abandonment [39,52]. They are a priority for conservation and agricultural environmental schemes.
Moderate organic fertilization as an adaptive management tool. Doses of 10–20 t ha⁻¹ (autumn or spring) increased diversity and production without compromising community structure. This "optimal window" is applicable for both maintaining HNV habitats and sustainable fodder production in the future. Similar results have been obtained in the Apuseni Mountains and other HNV grasslands, where technologies such as mulching combined with organic fertilization have maintained high levels of diversity and a relatively stable community composition [81,104].
Limiting mineral fertilization and high doses of manure. Mineral fertilization (T8–T9) and high manure doses (T4, T7) greatly simplified the vegetation. Furthermore, the results regarding species structure and ISA values are compatible with the use of indicator species as a rapid diagnostic tool for the agrochemical status of the soil and for assessing management quality [105,106]. The integration of these indicators with modern monitoring methods, such as multivariate ordination [82,83,84] and remote sensing [56,85,86,87], can support the development of adaptive management schemes for HNV grasslands in the Carpathian region of Romania.
3.5. Study Limitations
The study was based on a single monofactorial experiment at a location representative of Nardus stricta grasslands in the Eastern Carpathians. Given the short duration (3 years) of the experiment, generalization of the results to the entire Carpathian range requires integration with other regional studies on fertilization, abandonment, and climate change [88,89,90,107].
3.6. Future Research Directions
The analysis also focused on vegetation. Further integration of data on the soil microbiome [51,91,92], edaphic fauna [12,78], and ecosystem services [93,94] would allow for a more comprehensive assessment of the effects of fertilization on the functioning of HNV ecosystems. Despite these limitations, the results clearly demonstrate that moderate organic fertilization can simultaneously support productivity and biodiversity, whereas mineral intensification leads to the loss of HNV habitats.
4. Materials and Methods
4.1. Study Area and Pedoclimatic Conditions
The experiment was conducted on a permanent Nardus stricta grassland in the Lucina area of the Lucina-Fundu Moldovei Depression of the major geomorphological unit Obcinele Bucovinei (Eastern Carpathians, northeastern Romania) in a mountainous region characterized by a cool and humid climate typical of the lower mountain range. The experimental field was located at an altitude of 1220 m, eastern longitude 25°10ꞌ 44ꞌꞌ and northern latitude 47°38ꞌ44ꞌꞌ, with a 5% slope and northern exposure. The soil is of the white skeletal clinogleic luvosol type and at a depth of 0-28 cm is characterized by a low degree of base saturation, only 28-47%, strong acidity, with pH values of 4.5-4.6, low total cation exchange capacity, 6.7-13, 9 me/100 g soil, low phosphorus content of 10-15 mg/kg and very low potassium content of 4-9 mg/kg, carbon/nitrogen (C/N) ratio of 11.3, indicating a fairly slow decomposition of organic matter, the soil also being affected by excess stagnant moisture. The peat layer on the soil surface, approximately 5-7 cm thick, promotes faster infiltration of water from precipitation and prevents water loss through direct evaporation, influencing plant growth and development. The surface layer showed an accumulation of plant debris on the surface and low natural fertility, which is characteristic of oligotrophic grasslands. This study, conducted within a long-term experimental setup initiated in 2002, focuses on the floristic composition, vegetation types, and diversity of mountain grasslands based on data collected during the 2022-2024 period. The average annual temperature in the area is approximately 6–7°C, and the annual precipitation frequently exceeds 650–700 mm, with maximums recorded in the summer months (May–August) and minimums in winter. The rainfall and temperature regimes are typical of mountain depressions, with high atmospheric humidity throughout the year. Before the experiment was set up, the grassland was used extensively in a traditional system (mowing and/or grazing with low stocking rates) without systematic mineral or organic fertilization, with nutrients primarily coming from animal manure.
The multi-year average temperature is 6.4°C, and the average temperature during the growing season is 12.7°C. During the period 2022-2024, both annually and during the growing season, the average temperature was higher than the multi-year average by 0.5-1.3ºC (Table 7, Table 9) and 0.1-0.9ºC, respectively, and the bioactive period (with temperatures above 0°C) in the studied area was 255 days, between March 10 and November 20. The multi-annual average precipitation is 738.6 mm, with the following distribution by season: spring 175.1 mm (23.7%), summer 287.8 mm (39%), autumn 154.0 mm (20.8%), and winter 121.7 mm (16.5%). During the growing season (April-September), the multi-annual average precipitation is 493.0 mm, which represents 66.7% of the annual amount (Table 8, Table 10). During the period 2022-2024, the annual precipitation was 65 mm (9%) higher than the multi-year average, and during the growing season, it was close to the multi-year average. The highest amounts of precipitation were recorded in June and July, with positive deviations between 33.1-42.8 mm from the multi-year average.
- The studied area is characterized by an average annual number of days in the cold season with snow cover between 79-100 days, an annual potential evapotranspiration of 599 mm, of which 338 (56.4%) in June -August, and a duration of sunshine of 1600-1800 hours/year, of which 1200-1300 hours (60%) in the warm season (April-September) and 400-500 hours/year (40%) in the cold season.
Table 7.
Average air temperatures (ºC) at Poiana Stampei Meteorological Station (2022-2023).
| Specify | Oct. | Nov. | Dec. | Jan. | Febr. | Mar. | April | May | June | July | Aug. | Sept. | Total 12 months | Vegetation period (IV-IX) |
|---|---|---|---|---|---|---|---|---|---|---|---|---|---|---|
| Multi-year averages | ||||||||||||||
| Decade I | 7,2 | 4,1 | -2,4 | -4,2 | -2,6 | 0,4 | 4,0 | 9,2 | 14,3 | 16,2 | 17,2 | 13,8 | 6,4 | 12,5 |
| Decade II-a | 5,9 | 1,7 | -2,1 | -5,2 | -3,5 | 0,4 | 6,0 | 9,8 | 15,1 | 16,1 | 16,7 | 12,7 | 6,1 | 12,7 |
| Decade III-a | 6,4 | -1,1 | -2,2 | -3,9 | -1,2 | 2,3 | 7,0 | 11,9 | 16,4 | 17,2 | 15,8 | 9,3 | 6,5 | 12,9 |
| Monthly average | 6,5 | 1,7 | -2,2 | -4,4 | -2,4 | 1,0 | 5,7 | 10,3 | 15,3 | 16,5 | 16,6 | 11,9 | 6,4 | 12,7 |
| Agricultural year 2022-2023 | ||||||||||||||
| Decade I | 8,2 | 5,6 | 0,3 | 1,5 | -7,7 | 0,6 | 0,6 | 8,0 | 13,4 | 16,7 | 16,1 | 13,2 | 6,4 | 11,3 |
| Decade II-a | 6,4 | 2,2 | -2,7 | 1,3 | -2,7 | 0,7 | 5,2 | 10,9 | 13,5 | 18,2 | 17,1 | 14,3 | 7,0 | 13,2 |
| Decade III-a | 7,4 | -0,9 | 0,4 | -2,4 | 0,3 | 2,3 | 5 | 12,6 | 15,8 | 16,2 | 18,1 | 13,3 | 7,3 | 13,5 |
| Monthly average | 7,3 | 2,3 | -0,7 | 0,1 | -3,4 | 1,2 | 3,6 | 10,5 | 14,2 | 17,0 | 17,1 | 13,6 | 6,9 | 12,7 |
| Multi-year average | 6,5 | 1,7 | -2,2 | -4,4 | -2,4 | 1,0 | 5,7 | 10,3 | 15,3 | 16,5 | 16,6 | 11,9 | 6,4 | 12,8 |
| Deviation | +0,8 | +0,6 | +1,5 | +4,5 | -1,0 | +0,2 | -2,1 | +0,2 | -1,1 | +0,5 | +0,5 | +1,7 | +0,5 | +0,1 |
Table 8.
Atmospheric precipitation (mm) at the Poiana Stampei Meteorological Station (2022-2023).
| Specify | Oct. | Nov. | Dec. | Jan. | Febr. | Mar. | April | May | June | July | Aug. | Sept. | Total 12 months | Vegetation period (IV-IX) |
|---|---|---|---|---|---|---|---|---|---|---|---|---|---|---|
| Multi-year averages | ||||||||||||||
| Decade I | 13,6 | 11,5 | 14,8 | 12,4 | 19,2 | 11,6 | 18,7 | 24,3 | 31,2 | 29,9 | 19,7 | 19,7 | 226,6 | 143,5 |
| Decade II-a | 14,6 | 15,7 | 12,4 | 14,8 | 11,3 | 11,4 | 16,5 | 32,0 | 40,1 | 26,8 | 20,5 | 20,8 | 236,9 | 156,7 |
| Decade III-a | 17,2 | 18,3 | 17,4 | 8,1 | 11,3 | 10,0 | 19,2 | 31,4 | 50,6 | 44,6 | 24,4 | 22,6 | 275,1 | 192,8 |
| Monthly amount | 45,4 | 45,5 | 44,6 | 35,3 | 41,8 | 33,0 | 54,4 | 87,7 | 121,9 | 101,3 | 64,6 | 63,1 | 738,6 | 493,0 |
| Agricultural year 2022-2023 | ||||||||||||||
| Decade I | 4,4 | 5,3 | 8,4 | 13,0 | 9,3 | 15,6 | 38,9 | 13,9 | 42,1 | 18,4 | 14,6 | 10,7 | 194,6 | 138,6 |
| Decade II-a | 15,3 | 40,4 | 28,0 | 27,6 | 24,2 | 4,5 | 10,1 | 7,5 | 89,5 | 39,3 | 2,0 | 10,7 | 299,1 | 159,1 |
| Decade III-a | 9,4 | 18,4 | 13,3 | 9,0 | 39,4 | 18,5 | 48,3 | 9,5 | 27,0 | 78,4 | 36,2 | 3,2 | 310,6 | 202,6 |
| Monthly amount | 29,1 | 64,1 | 49,7 | 49,6 | 72,9 | 38,6 | 97,3 | 30,9 | 158,6 | 136,1 | 52,8 | 24,6 | 804,3 | 500,3 |
| Multi-year average | 45,4 | 45,5 | 44,6 | 35,3 | 41,8 | 33,0 | 54,4 | 87,7 | 121,9 | 101,3 | 64,6 | 63,1 | 738,6 | 493,0 |
| Deviation | -16,3 | +18,6 | +5,1 | +14,3 | +31,1 | +5,6 | +42,9 | -56,8 | +36,7 | +34,8 | -11,8 | -38,5 | +65,7 | +7,3 |
Table 9.
Average air temperatures (ºC) at the Poiana Stampei Meteorological Station (2023-2024).
| Specify | Oct. | Nov. | Dec. | Jan. | Febr. | Mar. | April | May | June | July | Aug. | Sept. | Total 12 months | Vegetation period (IV-IX) |
|---|---|---|---|---|---|---|---|---|---|---|---|---|---|---|
| Agricultural year 2023-2024 | ||||||||||||||
| Decade I | 7,9 | 4,5 | -1,2 | -2,1 | 2,1 | 3,7 | 9,0 | 10,2 | 12,5 | 17,4 | 16,7 | 15,0 | 8,0 | 13,5 |
| Decade II-a | 6,5 | 1,4 | -1,2 | -4,7 | 1,7 | 2,2 | 8,4 | 9,4 | 16,5 | 21,2 | 19,6 | 5,4 | 7,2 | 13,4 |
| Decade III-a | 9,9 | -2,0 | 0,6 | -6,1 | 4,2 | 5,1 | 6,8 | 12,5 | 19,2 | 16,7 | 17,7 | 9,9 | 7,9 | 13,8 |
| Monthly average | 8,1 | 1,3 | -0,6 | -4,3 | 2,7 | 3,7 | 8,1 | 10,7 | 16,1 | 18,4 | 18,0 | 10,1 | 7,7 | 13,6 |
| Multi-year average | 6,5 | 1,7 | -2,2 | -4,4 | -2,4 | 1,0 | 5,7 | 10,3 | 15,3 | 16,5 | 16,6 | 11,9 | 6,4 | 12,7 |
| Deviation | +1,6 | -0,4 | +1,6 | +0,1 | -0,3 | +2,7 | +2,4 | +0,4 | +0,8 | +1,9 | +1,4 | -1,8 | +1,3 | +0,9 |
Table 10.
Atmospheric precipitation (mm) at the Poiana Stampei Meteorological Station (2023-2024).
| Specify | Oct. | Nov. | Dec. | Jan. | Febr. | Mar. | April | May | June | July | Aug. | Sept. | Total 12 months | Vegetation period (IV-IX) |
|||||||||||
|---|---|---|---|---|---|---|---|---|---|---|---|---|---|---|---|---|---|---|---|---|---|---|---|---|---|
| Agricultural year 2023-2024 | |||||||||||||||||||||||||
| Decade I | 11,0 | 28,0 | 23,2 | 16,7 | 15,3 | 4,1 | 10,2 | 16,8 | 21,8 | 79,6 | 45,2 | 4,3 | 276,2 | 177,9 | |||||||||||
| Decade II-a | 24,1 | 29,6 | 24,3 | 36,4 | 9,4 | 13,0 | 26,8 | 9,2 | 46,8 | 28,8 | 2,0 | 13,0 | 263,4 | 126,6 | |||||||||||
| Decade III-a | 22,7 | 22,4 | 17,5 | 7,0 | 0,1 | 11,8 | 15,8 | 13,8 | 96,1 | 26,0 | 2,2 | 28,3 | 263,7 | 182,2 | |||||||||||
| Monthly amount | 57,8 | 80 | 65 | 60,1 | 24,8 | 28,9 | 52,8 | 39,8 | 164,7 | 134,4 | 49,4 | 45,6 | 803,3 | 486,7 | |||||||||||
| Multi-year average | 45,4 | 45,5 | 44,6 | 35,3 | 41,8 | 33,0 | 54,4 | 87,7 | 121,9 | 101,3 | 64,6 | 63,1 | 738,6 | 493,0 | |||||||||||
| Deviation | +12,4 | +34,5 | +20,4 | +24,8 | -17,0 | -4,1 | -1,6 | -47,9 | 42,8 | 33,1 | -15,2 | -17,5 | 64,7 | -6,3 | |||||||||||
4.2. Experimental Design
A single-factor experiment was organized using the randomized block method, with nine treatment variants and four repetitions, installed on a permanent grassland derived from Nardus stricta L (Nardus stricta-Festuca rubra). The experimental plots were located on gently sloping terrain under homogeneous site conditions to reduce the influence of soil and relief microvariability on the results of the study. The research covered four blocks, and the experiment had the following variants: T1 – Unfertilized control; T2 – 10 t ha⁻¹ well-decomposed horse manure applied in autumn; T3 – 20 t ha⁻¹ well-decomposed horse manure applied in autumn; T4 – 30 t ha⁻¹ well-decomposed horse manure applied in autumn; T5 – 10 t ha⁻¹ well-decomposed horse manure applied in spring; T6 – 20 t ha⁻¹ well-decomposed horse manure applied in spring; T7 – 30 t ha⁻¹ well-decomposed horse manure applied in spring; T8 – 200 kg ha⁻¹ nitrocalcar (calcium ammonium nitrate) applied in spring; T9 – 300 kg ha⁻¹ nitrocalcar (calcium ammonium nitrate) applied in spring. The horse manure used in the experiment was well decomposed (more than two years old) and originated from a traditional husbandry system, providing a complex supply of nutrients and organic matter to the soil. Its chemical composition was as follows: pH 6.7, P₂O₅ 0.334%, K₂O 0.691%, total nitrogen 0.434%, Na 0.0544%, Mg 0.1197%, Zn 5.59 mg/kg, Cu 1.358 mg/kg; Fe 65.06 mg/kg. Mineral fertilization was performed with nitrocalcar (27% total N; 8–12% CaCO₃ + MgCO₃). The balanced proportion between the nitric and ammoniacal forms ensures both rapid availability and gradual release of N. Fertilization was applied annually in spring (T5–T9) and November for the autumn treatment (T2–T4). Mechanization was minimal; mowing was performed once a year (in July), and the biomass was removed. The entire perimeter was fenced to prevent accidental grazing by animals.
4.3. Studies of Floral Composition
Floristic composition was assessed annually (in July) using the Braun–Blanquet scale modified for mountain grasslands [102]. The classic 1–5 scale was subdivided into subclasses a–c to increase the accuracy of the coverage estimates, a modification that is particularly beneficial for capturing subtle changes in species abundance in diverse and often finely structured mountain grassland communities (Figure 5 and Table 7). Floristic surveys were conducted annually in early July, when most grasses were in the flowering stage, allowing for accurate species identification and adequate comparisons between years and treatments[86]. The coverage of each species was estimated in each experimental plot (T1–T9, with four replicates per plot). Taxonomic determination of species was carried out with the help of specialized floristic works and by consulting international databases (POWO – Plants of the World Online, Euro+Med PlantBase) to ensure the use of updated and uniform nomenclature. To reduce disruptive influences, the area was protected, and mowing was performed uniformly at the same height after the surveys.
4.4. Data Analysis
Multivariate analyses were performed using PC-ORD version 7 software, which is widely applied in community ecology for classification, ordination, and testing differences among groups [83,84]. Floristic-ecological classification. To group the plots into grassland types, we used hierarchical cluster analysis based on the Sørensen (Bray–Curtis) similarity index and the unweighted pair group method with arithmetic mean (UPGMA) linkage method. This combination (Bray–Curtis + UPGMA) is considered a robust standard in plant community analysis and is frequently used to delineate phytosociological and ecological groups in semi-natural grasslands [96,97]. The dendrogram cutoff level was set at approximately 72% of the remaining information, which allowed the identification of six distinct floristic groups with clear ecological interpretations (types and subtypes of grasslands dominated by Nardus stricta, Festuca rubra, and Agrostis capillaris). To illustrate the trophic gradient generated by the fertilization treatments and to separate vegetation types, we performed a Principal Coordinate Analysis (PCoA) using the Bray–Curtis distance. PCoA provides a unique and reproducible solution and allows for the direct interpretation of distances among plots, which is an important advantage over iterative methods such as the NMDS [35,98]. The first two ordination axes explained over 98% of the floristic variation. The treatments were introduced into the prescription as vectors ("joint plots"), representing the input gradient: No_fertilz – unfertilized control (T1); Fert_low_aut – 10 t ha⁻¹ manure in autumn (T2); Fert_med_aut – 20 t ha⁻¹ manure in autumn (T3); Fert_high_aut – 30 t ha⁻¹ manure in autumn (T4); Fert_low_spr – 10 t ha⁻¹ manure in spring (T5); Fert_med_spr – 20 t ha⁻¹ manure in spring (T6); Fert_high_spr – 30 t ha⁻¹ manure in spring (T7); Nitrocalc_20 – 200 kg ha⁻¹ nitrocalcar (T8); Nitrocalc_30 – 300 kg ha⁻¹ of nitrocalcar (T9). The vectors were normalized, and their statistical significance was tested using permutation tests (n = 999).
Testing differences between groups. The statistical separation of floristic groups was tested using the Multi-Response Permutation Procedure (MRPP), which calculates the following metrics: T statistic (differentiation between groups), A coefficient (intragroup homogeneity), and p-value (statistical significance threshold of α = 0.05). All pairwise comparisons between groups were tested, and A and T values were used to support the robustness of the floristic types associated with the treatments [82]. To identify the species characteristics of each type of grassland, Indicator Species Analysis (ISA) was used, according to the method of [99]. For each species, IndVal values (combination of frequency and relative abundance in the group) were calculated, and statistical significance was tested using permutations (n = 999). Species with high IndVal and p < 0.05 were considered indicator species relevant to the floristic groups corresponding to the six clusters.
4.5. Diversity Indices and Statistical Analysis
For each treatment and repetition, the classic α-diversity indices were calculated as follows: Specific richness (S) – total number of species per plot; Shannon–Wiener index (H′), which combines species richness and relative abundance; Evenness (E), calculated as the ratio between the observed H′ and the maximum possible H′ for the number of species (E = H′ / ln S); Simpson index (D), which is sensitive to the dominance of abundant species in the community.
These indices are widely used in grassland ecology studies and are considered robust tools for assessing plant community diversity and balance [72,76,87]. The formula and interpretation of these indices followed standard recommendations in community ecology [100] and are widely used in semi-natural grassland studies. The differences between treatments (T1–T9) for each index were tested using a one-way analysis of variance (ANOVA). The assumptions of normality and homogeneity of variance were checked before applying ANOVA [101,102], where conditions were met, and means were separated using the LSD test at p < 0.05. The values presented in the diversity table (Table 11) are means ± standard error (n = 4 replicates per treatment).
Figure 5.
Modified Braun-Blanquét scale for grasslands based on species coverage [103]. Legend: 1 to 5 indicate the class of coverage; a, b, c indicate the sub-note of each class.
Figure 5.
Modified Braun-Blanquét scale for grasslands based on species coverage [103]. Legend: 1 to 5 indicate the class of coverage; a, b, c indicate the sub-note of each class.
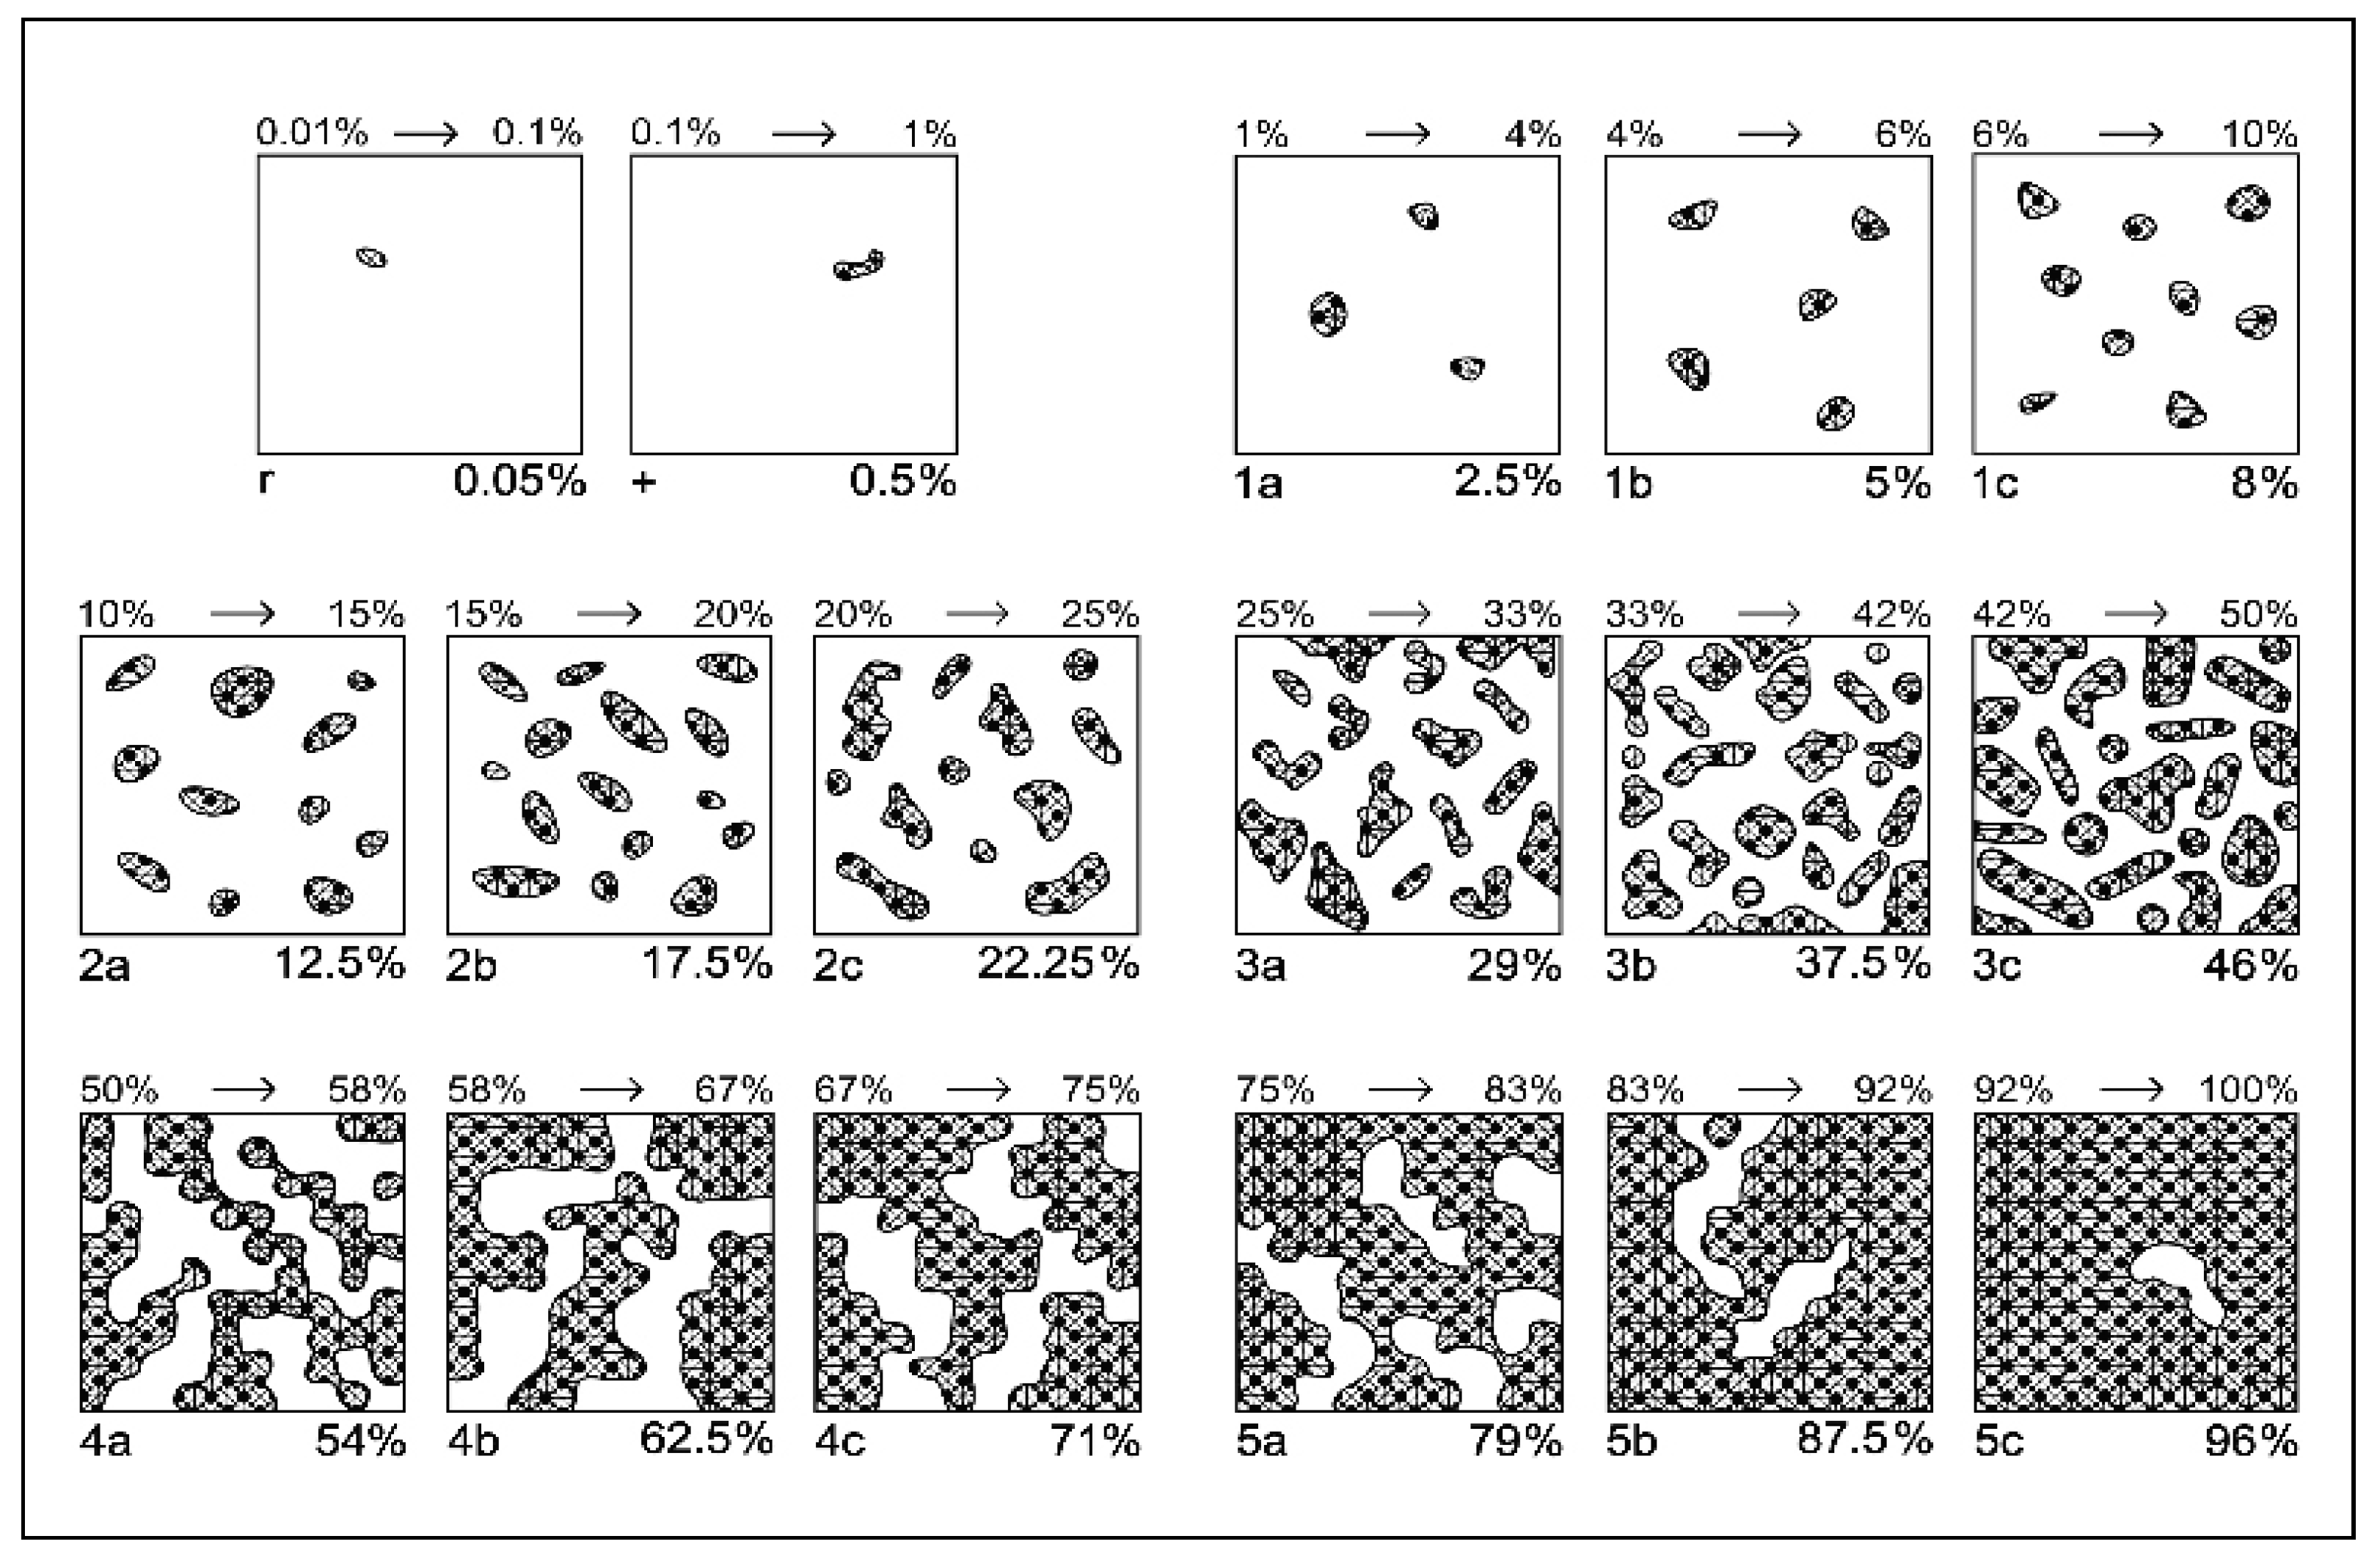
Table 11.
Modified Braun-Blanquét scale for assessing the abundance–dominance of plant species based on classes and sub-classes [103].
Table 11.
Modified Braun-Blanquét scale for assessing the abundance–dominance of plant species based on classes and sub-classes [103].
| Class | Coverage Interval (%) |
Class Central Value (%) |
Sub-Note | Sub-Interval (%) | Central-Adjusted Value of Sub-Interval (%) |
|---|---|---|---|---|---|
| 5 | 75–100 | 87.5 | 5c | 92–100 | 96 |
| 5b | 83–92 | 87.5 | |||
| 5a | 75–83 | 79 | |||
| 4 | 50–75 | 62.5 | 4c | 67–75 | 71 |
| 4b | 58–67 | 62.5 | |||
| 4a | 50–58 | 54 | |||
| 3 | 25–50 | 37.5 | 3c | 42–50 | 46 |
| 3b | 33–42 | 37.5 | |||
| 3a | 25–33 | 29 | |||
| 2 | 10–25 | 17.5 | 2c | 20–25 | 22.25 |
| 2b | 15–20 | 17.5 | |||
| 2a | 10–15 | 12.5 | |||
| 1 | 1–10 | 5 | 1c | 6–10 | 8 |
| 1b | 4–6 | 5 | |||
| 1a | 1–4 | 2.5 | |||
| + | 0.1–1 | 0.5 | - | - | 0.5 |
| r | 0.01–0.1 | 0.05 | - | - | 0.05 |
Note: a, b, and c indicate the sub-notes of each class
5. Conclusions
This study demonstrates that fertilization is a determining factor of the structure and diversity of Nardus stricta mountain grasslands in the Eastern Carpathians, Romania. The results showed a well-defined trophic gradient from oligotrophic communities rich in conservatively valuable species to increasingly simplified phytocenoses as the nutrient inputs increased. Moderate organic fertilization (10–20 t ha⁻¹ manure), applied in autumn or spring, supported the highest floristic diversity, confirming the existence of an optimal range in which productivity and biodiversity can be simultaneously maintained. These treatments favored the intermediate types Festuca rubra – Nardus stricta and Festuca rubra – Agrostis capillaris, which are characterized by structural heterogeneity and a stable set of indicator species.
In contrast, high doses of manure (30 t ha⁻¹) and, especially, mineral fertilization with nitrocalcar (200–300 kg ha⁻¹) led to a severe reduction in species richness, loss of oligotrophic species, and establishment of eutrophicated types dominated by Agrostis capillaris, which is incompatible with the objectives of the Natura 2000 network and HNV management. Overall, the results support the integration of moderate organic fertilization as an adaptive management tool for sensitive mountain grasslands, whereas the application of mineral fertilizers should be avoided in these regions. Multivariate analyses and indicator species are valuable tools for rapid diagnosis.
Author Contributions
Conceptualization, E.C., V.V. and C.S. (Costel Samuil); methodology, V.V., C.S. (Culiță Sîrbu) and E.C.; software, A.I.N, C.S. (Culiță Sîrbu) and B.I.G.; validation, V.V., C.S. (Costel Samuil) and C.S. (Culiță Sîrbu); formal analysis, E.C., V.V. and A.I.N.; writing—original draft preparation, E.C. and V.V.; writing—review and editing, V.V., E.C., C.S. (Costel Samuil) and B.I.G.; supervision, V.V., C.S. (Costel Samuil), and A.I.N. All authors have read and agreed to the published version of the manuscript.
Funding
This work was supported from Ion Ionescu de la Brad, Iasi University of Life Sciences.
Data Availability Statement
No new data were created or analyzed in this study.
Conflicts of Interest
The authors declare no conflicts of interest.
References
- Peeters, A. Environmental Impacts and Future Challenges of Grasslands and Grassland-Based Livestock Production Systems in Europe. Grassland: A Global Resource Perspective; Ghosh, PK, Mahanta, SK, Singh, JB, Pathak, PS, Eds 2015, 365–390.
- Reif, A.; Ruşdea, E.; Păcurar, F.; Rotar, I.; Brinkmann, K.; Auch, E.; Goia, A.; Bühler, J. A Traditional Cultural Landscape in Transformation. Mountain Research and Development 2008, 28, 18–22. [CrossRef]
- Balázsi, Á.; Pacurar, F.; Mihu-Pintilie, A.; Konold, W. How Do Public Institutions on Nature Conservation and Agriculture Contribute to the Conservation of Species-Rich Hay Meadows? International Journal of Conservation Science 2018, 9.
- Samuil, C.; Stavarache, M.; Sirbu, C.; Vintu, V. Influence of Sustainable Fertilization on Yield and Quality Food of Mountain Grassland. Notulae Botanicae Horti Agrobotanici Cluj-Napoca 2018, 46, 410–417. [CrossRef]
- Dale, L.; Fernandez, J.A.; Vermeulen, P.; Lecler, B.; Bogdan, A.D.; Pacurar, F.; Rotar, I.; Thewis, A.; Baeten, V. Research on Crude Protein and Digestibility of Arnica Montana L. Using Conventional NIR Spectrometry and Hyperspectral Imaging NIR. Journal of Food, Agriculture and Environment 2012, 10.
- Sima, N.; Păcurar, F. Quality of Forage Obtained from a Mountain Pasture as Influenced by Harvesting Phenophase and Management. 2002.
- Stoian, V.; Vidican, R.; Florin, P.; Corcoz, L.; Pop-Moldovan, V.; Vaida, I.; Vâtcă, S.-D.; Stoian, V.A.; Pleșa, A. Exploration of Soil Functional Microbiomes—A Concept Proposal for Long-Term Fertilized Grasslands. Plants 2022, 11, 1253. [CrossRef]
- Wan, L.; Liu, G.; Su, X. Organic Fertilization Balances Biodiversity Maintenance, Grass Production, Soil Storage, Nutrient Cycling and Greenhouse Gas Emissions for Sustainable Grassland Development in China: A Meta-Analysis. Agriculture, Ecosystems & Environment 2025, 381, 109473. [CrossRef]
- Păcurar, F.S.; Rotar, I.; Vaida, I.; Gaga, I.; Costantea, D. Ecological and agronomical value of Agrostis Capillaris-Festuca Rupicola grasslands. Romanian Journal of Grasslands and Forage Crops 2020, 22, 55.
- Vaida, I.; Rotar, I.; Pacurar, F. The Cumulative Effect of Manure on a Festuca Rubra Grasslands for 15 Years. Bulletin of the University of Agricultural Sciences & Veterinary Medicine Cluj-Napoca. Agriculture 2017, 74, 126. [CrossRef]
- Janišová, M.; Škodová, I.; Magnes, M.; Iuga, A.; Biro, A.-S.; Ivașcu, C.M.; Ďuricová, V.; Buzhdygan, O.Y. Role of Livestock and Traditional Management Practices in Maintaining High Nature Value Grasslands. Biological Conservation 2025, 309, 111301. [CrossRef]
- Liu, S.; Ward, S.E.; Wilby, A.; Manning, P.; Gong, M.; Davies, J.; Killick, R.; Quinton, J.N.; Bardgett, R.D. Multiple Targeted Grassland Restoration Interventions Enhance Ecosystem Service Multifunctionality. Nature Communications 2025, 16, 1–11. [CrossRef]
- Gaga, I.; Pacurar, F.; Vaida, I.; Plesa, A.; Rotar, I. Responses of Diversity and Productivity to Organo-Mineral Fertilizer Inputs in a High-Natural-Value Grassland, Transylvanian Plain, Romania. Plants 2022, 11, 1975. [CrossRef]
- Ghețe, I.; Rotar, I.; Pleșa, A.; Ghețe, A.; Șerban, C.; Stoian, V. Effect of Mineral Fertilization on Vegetation of HNV Pastures in the Apuseni Mountains (Romania). Plants 2025, 14, 3564. [CrossRef]
- Rotar, I.; Vaida, I.; Păcurar, F. Species with Indicative Values for the Management of the Mountain Grasslands. Romanian Agricultural Research 2020. [CrossRef]
- Báldi, A.; Pellaton, R.; Bihaly, Á.D.; Szigeti, V.; Lellei-Kovács, E.; Máté, A.; Sárospataki, M.; Soltész, Z.; Somay, L.; Kovács-Hostyánszki, A. Improving Ecosystem Services in Farmlands: Beginning of a Long-Term Ecological Study with Restored Flower-Rich Grasslands. Ecosystem Health and Sustainability 2022, 8, 2090449. [CrossRef]
- Pellaton, R.; Lellei-Kovács, E.; Báldi, A. Cultural Ecosystem Services in European Grasslands: A Systematic Review of Threats. Ambio 2022, 51, 2462–2477. [CrossRef]
- Reif, A.; Auch, E.; Bühler, J.; Brinkmann, K.; Goia, A.I.; Pacurar, F.; Rusdea, E. Landschaft Und Landnutzung Im Apusenigebirge Rumäniens. Carinthia II 2005, 195, 161–201.
- Marușca, T.; Păcurar, F.S.; Scrob, N.; Vaida, I.; Nicola, N.; Taulescu, E.; Dragoș, M.; Lukács, Z. Contributions to the Assessment of Grasslands Productivity of the Apuseni Natural Park (Rosci 0002). Romanian Journal of Grassland and Forage Crops 2021, 24, 23.
- Păcurar, F. Specii Indicator Pentru Evaluarea Şi Elaborarea Managementului Sistemelor de Pajişti Cu Înaltă Valoare Naturală-HNV; Casa Cărţii de Ştiinţă, 2020;
- Michler, B.; Rotar, I.; Pacurar, F.; Stoie, A. Arnica Montana, an Endangered Species and a Traditional Medicinal Plant: The Biodiversity and Productivity of Its Typical Grasslands Habitats. Grassland Science in Europe 2005, 10, 336–339.
- Michler, M.; Rotar, I.; Pacurar, F. Biodiversity and Conservation of Medicinal Plants: A Case Study in the Apuseni Mountains in Romania. Bulletin of University of Agricultural Sciences and Veterinary Medicine Cluj-Napoca. Agriculture 2006, 62. [CrossRef]
- Huygens, D.; Rotar, I.; Vidican, R.; Păcurar, F.; Carlier, L.; Mălinaș, A. The Influence of Different Type of Management upon the Floristic Structure of Grasslands Systems, with Special Attention on Arnica Montana L. 2013.
- Rușdea, E.; Reif, A.; Höchtl, F.; Păcurar, F.; Rotar, I.; Stoie, A.; Dahlström, A.; Svensson, R.; Aronsson, M. Grassland Vegetation and Management-on the Interface between Science and Education. Bulletin of University of Agricultural Sciences and Veterinary Medicine Cluj-Napoca: Agriculture 2011, 68. [CrossRef]
- Păcurar, F.; Reif, A.; Ruşdea, E. Conservation of Oligotrophic Grassland of High Nature Value (HNV) through Sustainable Use of Arnica Montana in the Apuseni Mountains, Romania. In Medicinal Agroecology; CRC Press, 2023.
- Brinkmann, K.; Păcurar, F.; Rotar, I.; Rușdea, E.; Auch, E.; Reif, A. The Grasslands of the Apuseni Mountains, Romania, În Grasslands in Europe of High Nature Value, Print ISBN 978 90 5011 31 68 2009.
- Morea, A.; Rotar, I.; Vidican, R.; Păcurar, F.; Mălinaş, A. The Influence of Different Type of Management upon the Floristic Structure of Grasslands Systems, with Special Attention on Arnica Montana L. Bulletin of the University of Agricultural Sciences & Veterinary Medicine Cluj-Napoca. Agriculture 2013, 70.
- Maruşca, T.; Păcurar, F.S.; Taulescu, E.; Vaida, I.; Nicola, N.; Scrob, N.; Dragoș, M.M. Indicative Species for the Agrochemical Properties of Mountain Grasslands Soil from the Apuseni Natural Park (Rosci 0002). Romanian Journal of Grasslands and Forage Crops 2022, 25, 31.
- Zieliński, M.; Łopatka, A.; Koza, P.; Gołębiewska, B. The Carpathian Agriculture in Poland in Relation to Other EU Countries, Ukraine and the Environmental Goals of the EU CAP 2023–2027. Agriculture 2024, 14, 1325. [CrossRef]
- Jakobsson, S.; Envall, I.; Bengtsson, J.; Rundlöf, M.; Svensson, M.; Åberg, C.; Lindborg, R. Effects on Biodiversity in Semi-Natural Pastures of Giving the Grazing Animals Access to Additional Nutrient Sources: A Systematic Review. Environmental Evidence 2024, 13, 18. [CrossRef]
- Bucała-Hrabia, A. Reflections on Land Use and Land Cover Change under Different Socio-Economic Regimes in the Polish Western Carpathians. Regional Environmental Change 2024, 24, 28. [CrossRef]
- Balfour, N.J.; Harris, C.; Storkey, J.; Ratnieks, F.L. Trade-off between Pollinator-Wildflower Diversity & Grassland Yields. npj Biodiversity 2025, 4, 1. [CrossRef]
- Dale, L.M.; Thewis, A.; Boudry, C.; Rotar, I.; Păcurar, F.S.; Abbas, O.; Dardenne, P.; Baeten, V.; Pfister, J.; Fernández Pierna, J.A. Discrimination of Grassland Species and Their Classification in Botanical Families by Laboratory Scale NIR Hyperspectral Imaging: Preliminary Results. Talanta 2013, 116, 149–154. [CrossRef]
- Mălinas, A.; Rotar, I.; Vidican, R.; Iuga, V.; Păcurar, F.; Mălinas, C.; Moldovan, C. Designing a Sustainable Temporary Grassland System by Monitoring Nitrogen Use Efficiency. Agronomy 2020, 10, 149. [CrossRef]
- Pardo, I.; Zabalza, S.; Berastegi, A.; Ripoll-Bosch, R.; Astrain, C. Assessment of Determinants of High Nature Value (HNV) Farmland at Plot Scale in Western Pyrenees. Journal of Environmental Management 2024, 349, 119516. [CrossRef]
- Rotar, I.; Păcurar, F.; Balázsi, Á.; Vidican, R.; Mălinaş, A. Effects of low-input treatments on Agrostis capillaris L.-Festuca rubra L. grasslands. In The Future of European Grasslands, Proceedings of the 17th General Meeting of the European Grassland Federation, Ghent, Belgium, 15-18 September 2014; Vlaamse Landmaatschappij (VLM): Ghent, Belgium, 2014.
- Stoian, V.; Vidican, R.; Crişan, I.; Puia, C.; Şandor, M.; Stoian, V.A.; Păcurar, F.; Vaida, I. Sensitive approach and future perspectives in microscopic patterns of mycorrhizal roots. Sci. Rep. 2019, 9, 10233. [CrossRef]
- Shipley, J.R.; Frei, E.R.; Bergamini, A.; Boch, S.; Schulz, T.; Ginzler, C.; Barandun, M.; Bebi, P.; Bolliger, J.; Bollmann, K. Agricultural Practices and Biodiversity: Conservation Policies for Semi-Natural Grasslands in Europe. Current Biology 2024, 34, R753–R761. [CrossRef]
- Elliott, J.; Tindale, S.; Outhwaite, S.; Nicholson, F.; Newell-Price, P.; Sari, N.H.; Hunter, E.; Sánchez-Zamora, P.; Jin, S.; Gallardo-Cobos, R. European Permanent Grasslands: A Systematic Review of Economic Drivers of Change, Including a Detailed Analysis of the Czech Republic, Spain, Sweden, and UK. Land 2024, 13, 116. [CrossRef]
- Păcurar, F.; Rotar, I.; Albert, R.; Vidican, R.; Stoian, V.; Gaertner, S.M.; Allen, R.B. Impact of Climate on Vegetation Change in a Mountain Grassland-Succession and Fluctuation. Notulae Botanicae Horti Agrobotanici Cluj-Napoca 2014, 42, 347–356. [CrossRef]
- Dullau, S.; Kirmer, A.; Tischew, S.; Holz, F.; Meyer, M.H.; Schmidt, A. Effects of Fertilizer Levels and Drought Conditions on Species Assembly and Biomass Production in the Restoration of a Mesic Temperate Grassland on Ex-Arable Land. Global Ecology and Conservation 2023, 48, e02730. [CrossRef]
- Balázsi, Á.; Păcurar, F.; Rotar, I.; Vidican, R. Alternative Management for Oligotrophic Grassland Conservation in the Apuseni Mountains. 2016.
- Connell, J.H. Diversity in Tropical Rain Forests and Coral Reefs: High Diversity of Trees and Corals Is Maintained Only in a Nonequilibrium State. Science 1978, 199, 1302–1310. [CrossRef]
- Tilman, D. Secondary Succession and the Pattern of Plant Dominance Along Experimental Nitrogen Gradients. Ecological Monographs 1987, 57, 189–214. [CrossRef]
- Biswas, T. A Spatio-Temporal Analysis of Landscape Change within the Eastern Terai, India: Linking Grassland and Forest Loss to Changes in River Course and Land Use; Utah State University, 2010;
- Gârda, N.; Rotar, I.; Păcurar, F.; Vidican, R. The role of pastoral landscape in defining the mountainous space in Apuseni Mountains. Lucr. Ştiinţifice. Ser. Agron. (Iași) 2009.
- Păcurar, F.S.; Rotar, I.; Vaida, I. The effects of wild boar disturbances on the agronomical value of semi-natural grasslands. Rom. J. Grassl. Forage Crops 2019, 20, 27.
- Vaida, I.; Rotar, I.; Păcurar, F.; Vidican, R.; Pleşa, A.; Mălinaş, A.; Stoian, V. Impact on the Abandonment of Semi-Natural Grasslands from Apuseni Mountains. Bull. Univ. Agric. Sci. Vet. Med. Cluj-Napoca: Agric. 2016, 73, 2. [CrossRef]
- Francksen, R.M.; Turnbull, S.; Rhymer, C.M.; Hiron, M.; Bufe, C.; Klaus, V.H.; Newell-Price, P.; Stewart, G.; Whittingham, M.J. The Effects of Nitrogen Fertilisation on Plant Species Richness in European Permanent Grasslands: A Systematic Review and Meta-Analysis. Agronomy 2022, 12, 2928. [CrossRef]
- Vaida, I.; Păcurar, F.; Rotar, I.; Tomoș, L.; Stoian, V. Changes in Diversity Due to Long-Term Management in a High Natural Value Grassland. Plants 2021, 10, 739. [CrossRef]
- Corcoz, L.; Păcurar, F.; Pop-Moldovan, V.; Vaida, I.; Stoian, V.; Vidican, R. Mycorrhizal Patterns in the Roots of Dominant Festuca Rubra in a High-Natural-Value Grassland. Plants 2021, 11, 112. [CrossRef]
- Vaida, I.; Rotar, I.; Vidican, R. The Influence Of Mineral Fertilization On Festuca Rubra grassland. Romanian Journal of Grassland and Forage Crops 2017, 15.
- Bonari, G.; Bricca, A.; Tomasi, G.; Dorigatti, L.; Bertolli, A.; Andreatta, D.; Sabatini, F.M.; Di Musciano, M.; Prosser, F. Grassland Changes in the Eastern Alps Over Four Decades: Unveiling Patterns Along an Elevation Gradient. Applied Vegetation Science 2025, 28, e70012. [CrossRef]
- Botter, M.; Zeeman, M.; Burlando, P.; Fatichi, S. Impacts of Fertilization on Grassland Productivity and Water Quality across the European Alps under Current and Warming Climate: Insights from a Mechanistic Model. Biogeosciences 2021, 18, 1917–1939. [CrossRef]
- Świerszcz, S.; Czarniecka-Wiera, M.; Szymura, T.H.; Szymura, M. From Invasive Species Stand to Species-Rich Grassland: Long-Term Changes in Plant Species Composition during Solidago Invaded Site Restoration. Journal of Environmental Management 2024, 353, 120216. [CrossRef]
- Sângeorzan, D.D.; Păcurar, F.; Reif, A.; Weinacker, H.; Rușdea, E.; Vaida, I.; Rotar, I. Detection and Quantification of Arnica Montana l. Inflorescences in Grassland Ecosystems Using Convolutional Neural Networks and Drone-Based Remote Sensing. Remote Sensing 2024, 16, 2012. [CrossRef]
- González-Moreno, P.; Schmitt, E.; Moreno-Ortiz, J.; Pinto-Correia, T.; Guiomar, N.; Delgado-Serrano, M.D.M. Assessing the Vulnerability of Mountain Value Chains to Environmental and Social Drivers in Europe: A Land-Use and Stakeholder-Based Approach. Ambio 2025, 54, 1386–1403. [CrossRef]
- Rotar, I.; Păcurar, F.; Stoie, A.; Gârda, N.; Dale, L.-M. The evolution of Arnica montana L. grasslands depending on the performed management (Apuseni Mountains, Romania). Lucrări Științifice Seria Agronomie / Scientific Papers Series Agriculture 2010, 53, 221–226.
- Marușca, T.; Pacurar, F.; Memedemin, D.; Oprea, A.; Ioana, V.; Taulescu, E.; Nicola, N. Ecological, Agronomic and Anthropogenic Characterization of the Habitat 62C0* Ponto-Sarmatian Steppes in the North of Dobrogea (Romania). Bulletin of University of Agricultural Sciences and Veterinary Medicine Cluj-Napoca Agriculture 2023, 79, 42–55. [CrossRef]
- Păcurar, F.; Rotar, I.; Vaida, I.; Vidican, R.; Mălinaş, A. Indicator Species of Fertilization Intensity in Mountain Grasslands. Grassland resources for extensive farming systems in marginal lands: major drivers and future scenarios 2017, 378.
- Rotar, I.; Păcurar, F.; Gârda, N.; Morea, A. The Management of Oligotrophic Grasslands and the Approach of New Improvement Methods. 2010.
- Samuil, C.; Nazare, A.I.; Sîrbu, C.; Grigoraş, B.; Vîntu, V. The Impact of Fertilizer Gradient on High Nature Value Mountain Grassland. Plants 2025, 14, 3397. [CrossRef]
- Socher, S.A.; Prati, D.; Boch, S.; Müller, J.; Baumbach, H.; Gockel, S.; Hemp, A.; Schöning, I.; Wells, K.; Buscot, F. Interacting Effects of Fertilization, Mowing and Grazing on Plant Species Diversity of 1500 Grasslands in Germany Differ between Regions. Basic and Applied Ecology 2013, 14, 126–136. [CrossRef]
- Peppler-Lisbach, C.; Stanik, N.; Könitz, N.; Rosenthal, G. Long-term Vegetation Changes in Nardus Grasslands Indicate Eutrophication, Recovery from Acidification, and Management Change as the Main Drivers. Applied Vegetation Science 2020, 23, 508–521. [CrossRef]
- Morea, A.; Rotar, I.; Vidican, R.; Păcurar, F.; Stoian, V. Changes in Vegetation in a Festuca Rubra Meadow in Apuseni Mountains Due to Organic Fertilization. 2014.
- Nazare, A.-I.; Grigoraş, B.-I.; Vîntu, V.; Samuil, C. Research on the behavior of perennial grasses and legumes in simple and complex mixtures in the conditions of the Moldovian Forest-Steppe. Rom. J. Grassl. Forage Crops 2025, 31, 67.
- Titěra, J.; Pavlů, V.V.; Pavlů, L.; Hejcman, M.; Gaisler, J.; Schellberg, J. Response of Grassland Vegetation Composition to Different Fertilizer Treatments Recorded over Ten Years Following 64 Years of Fertilizer Applications in the Rengen Grassland Experiment. Applied Vegetation Science 2020, 23, 417–427. [CrossRef]
- Melts, I.; Lanno, K.; Sammul, M.; Uchida, K.; Heinsoo, K.; Kull, T.; Laanisto, L. Fertilising Semi-natural Grasslands May Cause Long-term Negative Effects on Both Biodiversity and Ecosystem Stability. Journal of Applied Ecology 2018, 55, 1951–1955. [CrossRef]
- Sângeorzan, D.; Rotar, I.; Păcurar, F.; Vaida, I.; Suteu, A.; Deac, V. The Definition of Oligotrophic Grasslands. Rom. J. Grassl. Forage Crops 2018, 2018, 17.
- Dalle Fratte, M.; Cerabolini, B.E. Extending the Interpretation of Natura 2000 Habitat Types beyond Their Definition Can Bias Their Conservation Status Assessment: An Example with Species-Rich Nardus Grasslands (6230*). Ecological Indicators 2023, 156, 111113. [CrossRef]
- Rodica, V.; Ioan, V.D.; Tania, M.; Florin, P. RESEARCH ON THE OPTIMISATION OF ARNICA MONTANA L SEEDLING PRODUCTION.
- Hautier, Y.; Zhang, P.; Loreau, M.; Wilcox, K.R.; Seabloom, E.W.; Borer, E.T.; Byrnes, J.E.; Koerner, S.E.; Komatsu, K.J.; Lefcheck, J.S. General Destabilizing Effects of Eutrophication on Grassland Productivity at Multiple Spatial Scales. Nature Communications 2020, 11, 5375. [CrossRef]
- Shi, T.-S.; Collins, S.L.; Yu, K.; Peñuelas, J.; Sardans, J.; Li, H.; Ye, J.-S. A Global Meta-Analysis on the Effects of Organic and Inorganic Fertilization on Grasslands and Croplands. Nature Communications 2024, 15, 3411. [CrossRef]
- Villa-Galaviz, E.; Smart, S.M.; Ward, S.E.; Fraser, M.D.; Memmott, J. Fertilization Using Manure Minimizes the Trade-Offs between Biodiversity and Forage Production in Agri-Environment Scheme Grasslands. Plos one 2023, 18, e0290843. [CrossRef]
- Sun, Z.; Wang, Y.; Sun, L. Effects of Straw Mulching on Soil Nutrient Content and Microbial Community on the Gentle Slope Arable Land in Dryland Farming. Archives of Agronomy and Soil Science 2022, 1–12. [CrossRef]
- Wang, Y.; Lv, W.; Xue, K.; Wang, S.; Zhang, L.; Hu, R.; Zeng, H.; Xu, X.; Li, Y.; Jiang, L. Grassland Changes and Adaptive Management on the Qinghai–Tibetan Plateau. Nature Reviews Earth & Environment 2022, 3, 668–683. [CrossRef]
- Zhang, M.; Delgado-Baquerizo, M.; Li, G.; Isbell, F.; Wang, Y.; Hautier, Y.; Wang, Y.; Xiao, Y.; Cai, J.; Pan, X. Experimental Impacts of Grazing on Grassland Biodiversity and Function Are Explained by Aridity. Nature Communications 2023, 14, 5040. [CrossRef]
- Schaub, S.; Finger, R.; Leiber, F.; Probst, S.; Kreuzer, M.; Weigelt, A.; Buchmann, N.; Scherer-Lorenzen, M. Plant Diversity Effects on Forage Quality, Yield and Revenues of Semi-Natural Grasslands. Nature Communications 2020, 11, 768. [CrossRef]
- Călina, J.; Călina, A.; Iancu, T.; Miluț, M.; Croitoru, A.C. Research on the Influence of Fertilization System on the Production and Sustainability of Temporary Grasslands from Romania. Agronomy 2022, 12, 2979. [CrossRef]
- Păcurar, F.; Balazsi, A.; Rotar, I.; Vaida, I.; Reif, A.; Vidican, R.; Rușdea, E.; Stoian, V.; Sangeorzan, D. Technologies Used for Maintaining Oligotrophic Grasslands and Their Biodiversity in a Mountain Landscape. Romanian Biotechnological Letters 2020, 25, 1128–1135. [CrossRef]
- Zarzycki, J.; Józefowska, A.; Kopeć, M. Can Mulching or Composting Be Applied to Maintain Semi-Natural Grassland Managed for Biodiversity? Journal for Nature Conservation 2024, 78, 126584. [CrossRef]
- Peck, J.E. Multivariate Analysis for Community Ecologists: Step-by-Step Using PC-ORD; MjM software design, 2010.
- McCune, B.; Mefford, M.J. PC-ORD: Multivariate Analysis of Ecological Data. Version 7. MjM Software Design, Gleneden Beach, Oregon, U.S.A.; MjM software design, 2016.
- McCune, B.; Grace, J.B. Analysis of Ecological Communities; 2002.
- Păcurar, F.; Rotar, I.; Vidican, R.; Vaida, I.; Pleșa, A.; Stoian, V.; Tomoș, L.; Ghețe, A. Density-based assessment of Adonis vernalis abundance in native habitats. Sci. Pap. Ser. A. Agron. 2025, 68, 1.
- Andreatta, D.; Bachofen, C.; Dalponte, M.; Klaus, V.H.; Buchmann, N. Extracting Flowering Phenology from Grassland Species Mixtures Using Time-Lapse Cameras. Remote Sensing of Environment 2023, 298, 113835. [CrossRef]
- Sang, Y.; Gu, H.; Meng, Q.; Men, X.; Sheng, J.; Li, N.; Wang, Z. An Evaluation of the Performance of Remote Sensing Indices as an Indication of Spatial Variability and Vegetation Diversity in Alpine Grassland. Remote Sensing 2024, 16, 4726. [CrossRef]
- Zhu, X.; Zheng, J.; An, Y.; Xin, X.; Xu, D.; Yan, R.; Xu, L.; Shen, B.; Hou, L. Grassland Ecosystem Progress: A Review and Bibliometric Analysis Based on Research Publication over the Last Three Decades. Agronomy 2023, 13, 614. [CrossRef]
- Movedi, E.; Bocchi, S.; Paleari, L.; Vesely, F.M.; Vagge, I.; Confalonieri, R. Impacts of Climate Change on Semi-Natural Alpine Pastures Productivity and Floristic Composition. Regional Environmental Change 2023, 23, 159. [CrossRef]
- Straffelini, E.; Luo, J.; Tarolli, P. Climate Change Is Threatening Mountain Grasslands and Their Cultural Ecosystem Services. Catena 2024, 237, 107802. [CrossRef]
- Rotar, I.; Păcurar, F.S.; Vidican, R.M.; Iuga, V.; Mălinaş, A. The best seeding density and N fertilization level for red clover and Italian ryegrass in pure stands and in mixture. Not. Bot. Horti Agrobot. Cluj-Napoca 2019, 47, 584–591.
- Malinas, A.; Rotar, I.; Vidican, R.; Păcurar, F.; Gliga, A.; Balazsi, A.; Nagy, M. The Effect of Distance between Rows on Sowing and of Mineral Fertilisers on a Complex Forage Mixture in Condition Specific to Transylvania Plain. 2014. [CrossRef]
- Hao, R.; Yu, D. Optimization Schemes for Grassland Ecosystem Services under Climate Change. Ecological Indicators 2018, 85, 1158–1169. [CrossRef]
- Cultural Ecosystem Services in European Grasslands: A Systematic Review of Threats | Ambio Available online: https://link.springer.com/article/10.1007/s13280-022-01755-7 (accessed on 28 November 2025). [CrossRef]
- Păcurar, F.; Rotar, I.; Vidican, R. Organic fertilization and biodiversity of Festuca rubra grasslands. In Permanent and Temporary Grassland: Plant, Environment and Economy, Proceedings of the 14th Symposium of the European Grassland Federation (EGF), Ghent, Belgium, 3–5 September 2007, Grassland Science in Europe Volume 12; de Vliegher, A., Carlier, L., Eds.; 2007; pp. 363–366.
- Diviaková, A.; Ollerová, H.; Stašiov, S.; Veverková, D.; Novikmec, M. Plant Functional Structure Varies across Different Management Regimes in Submontane Meadows. Nature Conservation 2024, 56, 181–200. [CrossRef]
- Campos, R.; Fontana, V.; Losapio, G.; Moretti, M. How Cities Impact Diversity and Ecological Networks: A Functional and Phylogenetic Perspective. Urban Ecosyst 2024, 27, 1359–1373.
- Manu, M.; Băncilă, R.I.; Onete, M. Soil Fauna-Indicators of Ungrazed Versus Grazed Grassland Ecosystems in Romania. Diversity 2025, 17, 323. [CrossRef]
- Dufrêne, M.; Legendre, P. Species assemblages and indicator species: the need for a flexible asymmetrical approach. Ecological Monographs 1997, 67, 345–366. [CrossRef]
- Magurran, A.E. Measuring Biological Diversity. Blackwell Publishing, Malden, Massachusetts. 2004.
- Gheţe, A.; Copândean, A.; Haş, I.; Haş, V.; Duda, M.; Tinca, E.; Călugăr, R.E.; Varga, A.; Moldovan, C. Moisture Loss Dynamics in Some Inbred Lines, Parental Forms of Maize Hybrids, Created at ARDS Turda. Research Journal of Agricultural Science 2016, 48.
- Ghețe, A.B.; Haș, V.; Vidican, R.; Copândean, A.; Ranta, O.; Moldovan, C.M.; Crișan, I.; Duda, M.M. Influence of Detasseling Methods on Seed Yield of Some Parent Inbred Lines of Turda Maize Hybrids. Agronomy 2020, 10, 729. [CrossRef]
- Pacurar, F.; Rotar, I. Metode de Studiu Si Interpretare a Vegetatiei Pajistilor; 2014; ISBN 978-973-53-1452-1.
- Rotar, I.; Vidican, R.; Ciure A., Păcurar, A.; Gliga, A.; Balaszi, A. The behavior of the mixture formed by Trifolium pratense, Medicago sativa, Lolium perenne, Festulolium, Phleum pratense and Dactylis glomerata under the influence of mineral fertilization. Rom. J. Grassl. Forage Crops 2014, 9, 87.
- Păcurar, F.; Rotar, I.; Vidican, R.; Vaida, I. The Ecological and Agronomic Study of Some Grasslands Phytocenoses from the Site Natura 2000 Rosci 0238 Suatu-Cojocna-Crairît. Rom. J. Grassl. Forage Crops 2023, 27, 9–28.
- Gârda, N.; Rotar, I.; Păcurar, F.; Vidican, R. The role of pastoral landscape in defining the mountainous space in Apuseni Mountains. Lucr. Ştiinţifice. Ser. Agron. (Iași) 2009.
- Păcurar, F.; Rotar, I.; Gârda, N.; Vidican, R. New directions in the study of oligotrophic grasslands in the mountain area. Lucr. Ştiinţifice. Ser. Agron. (Iași) 2009.
- Păcurar, F.; Morea, A.; Gârda, N. Productivity and biodiversity evolution of Festuca rubra grasslands during a seven years period. Bull. Univ. Agric. Sci. Vet. Med. Cluj-Napoca. Agric. 2008, 65, 5.
- Păcurar, F.; Rotar, I. The evolution of biodiversity on Festuca rubra meadow following to some specifical technologies inputs to sustainable agriculture. Bull. Univ. Agric. Sci. Vet. Med. Cluj-Napoca. Agric. 2006, 62, 124–127. [CrossRef]
- Hermoso, V.; Carvalho, S.B.; Giakoumi, S.; Goldsborough, D.; Katsanevakis, S.; Leontiou, S.; Yates, K.L. The EU Biodiversity Strategy for 2030: Opportunities and challenges on the path towards biodiversity recovery. Environ. Sci. Policy 2022, 127, 263–271. [CrossRef]
- Rinaldi, A. Biodiversity 2030: A road paved with good intentions: The new EU Commission's biodiversity strategy risks to remain an empty husk without proper implementation. EMBO Rep. 2021, 22.
- Robuchon, M.; Liquete, C.; Hammond, E.; Alonso Aller, E.; Barredo, J.I.; Bopp, S.; Cardoso, A.C.; Catarino, R.; Gras, M.; Grizzetti, B.; et al. Assessing Progress in Monitoring and Implementing the EU Biodiversity Strategy for 2030; Publications Office of the European Union: Luxembourg, 2025. [CrossRef]
- Rotar, I.; Păcurar, F.; Vidican, R.; Sima, N. Effects of manure/sawdust fertilisation on Festuca rubra type meadows at Ghetari (Apuseni Mountains). In Optimal Forage Systems for Animal Production and the Environment, Proceedings of the 12th Symposium of the European Grassland Federation (EGF), Pleven, Bulgaria, 26–28 May 2003, Grassland Science in Europe Volume 8; Kirilov, A., Todorov, N., Katerov, I., Eds.; 2003; pp. 192–194.
- Rotar, I.; Pacurar, F.; Vidican, R.; Morea, A. The organic-mineral fertilization of a Festuca rubra L. grassland in Apuseni Mountains. Rom. J. Grassl. Forage Crops 2010, 2, 55–60.
- Păcurar, F.; Rotar, I. The effect of low-input upon semi-natural grasslands of Apuseni Mountains. Lucrări Ştiinţifice—Seria Agronomie. 2011, 54, 2.
- Rotar, I.; Toth, G.; Vaida, I.; Mălinaș, A.; Stoian, V.; Deac, V. Ecological and agronomical value of type Festuca rupicola-Bromus erectus grasslands. Rom. J. Grassl. Forage Crops 2016, 19, 81–87.
Figure 1.
Floristic classification of the vegetation and changes in grassland type.
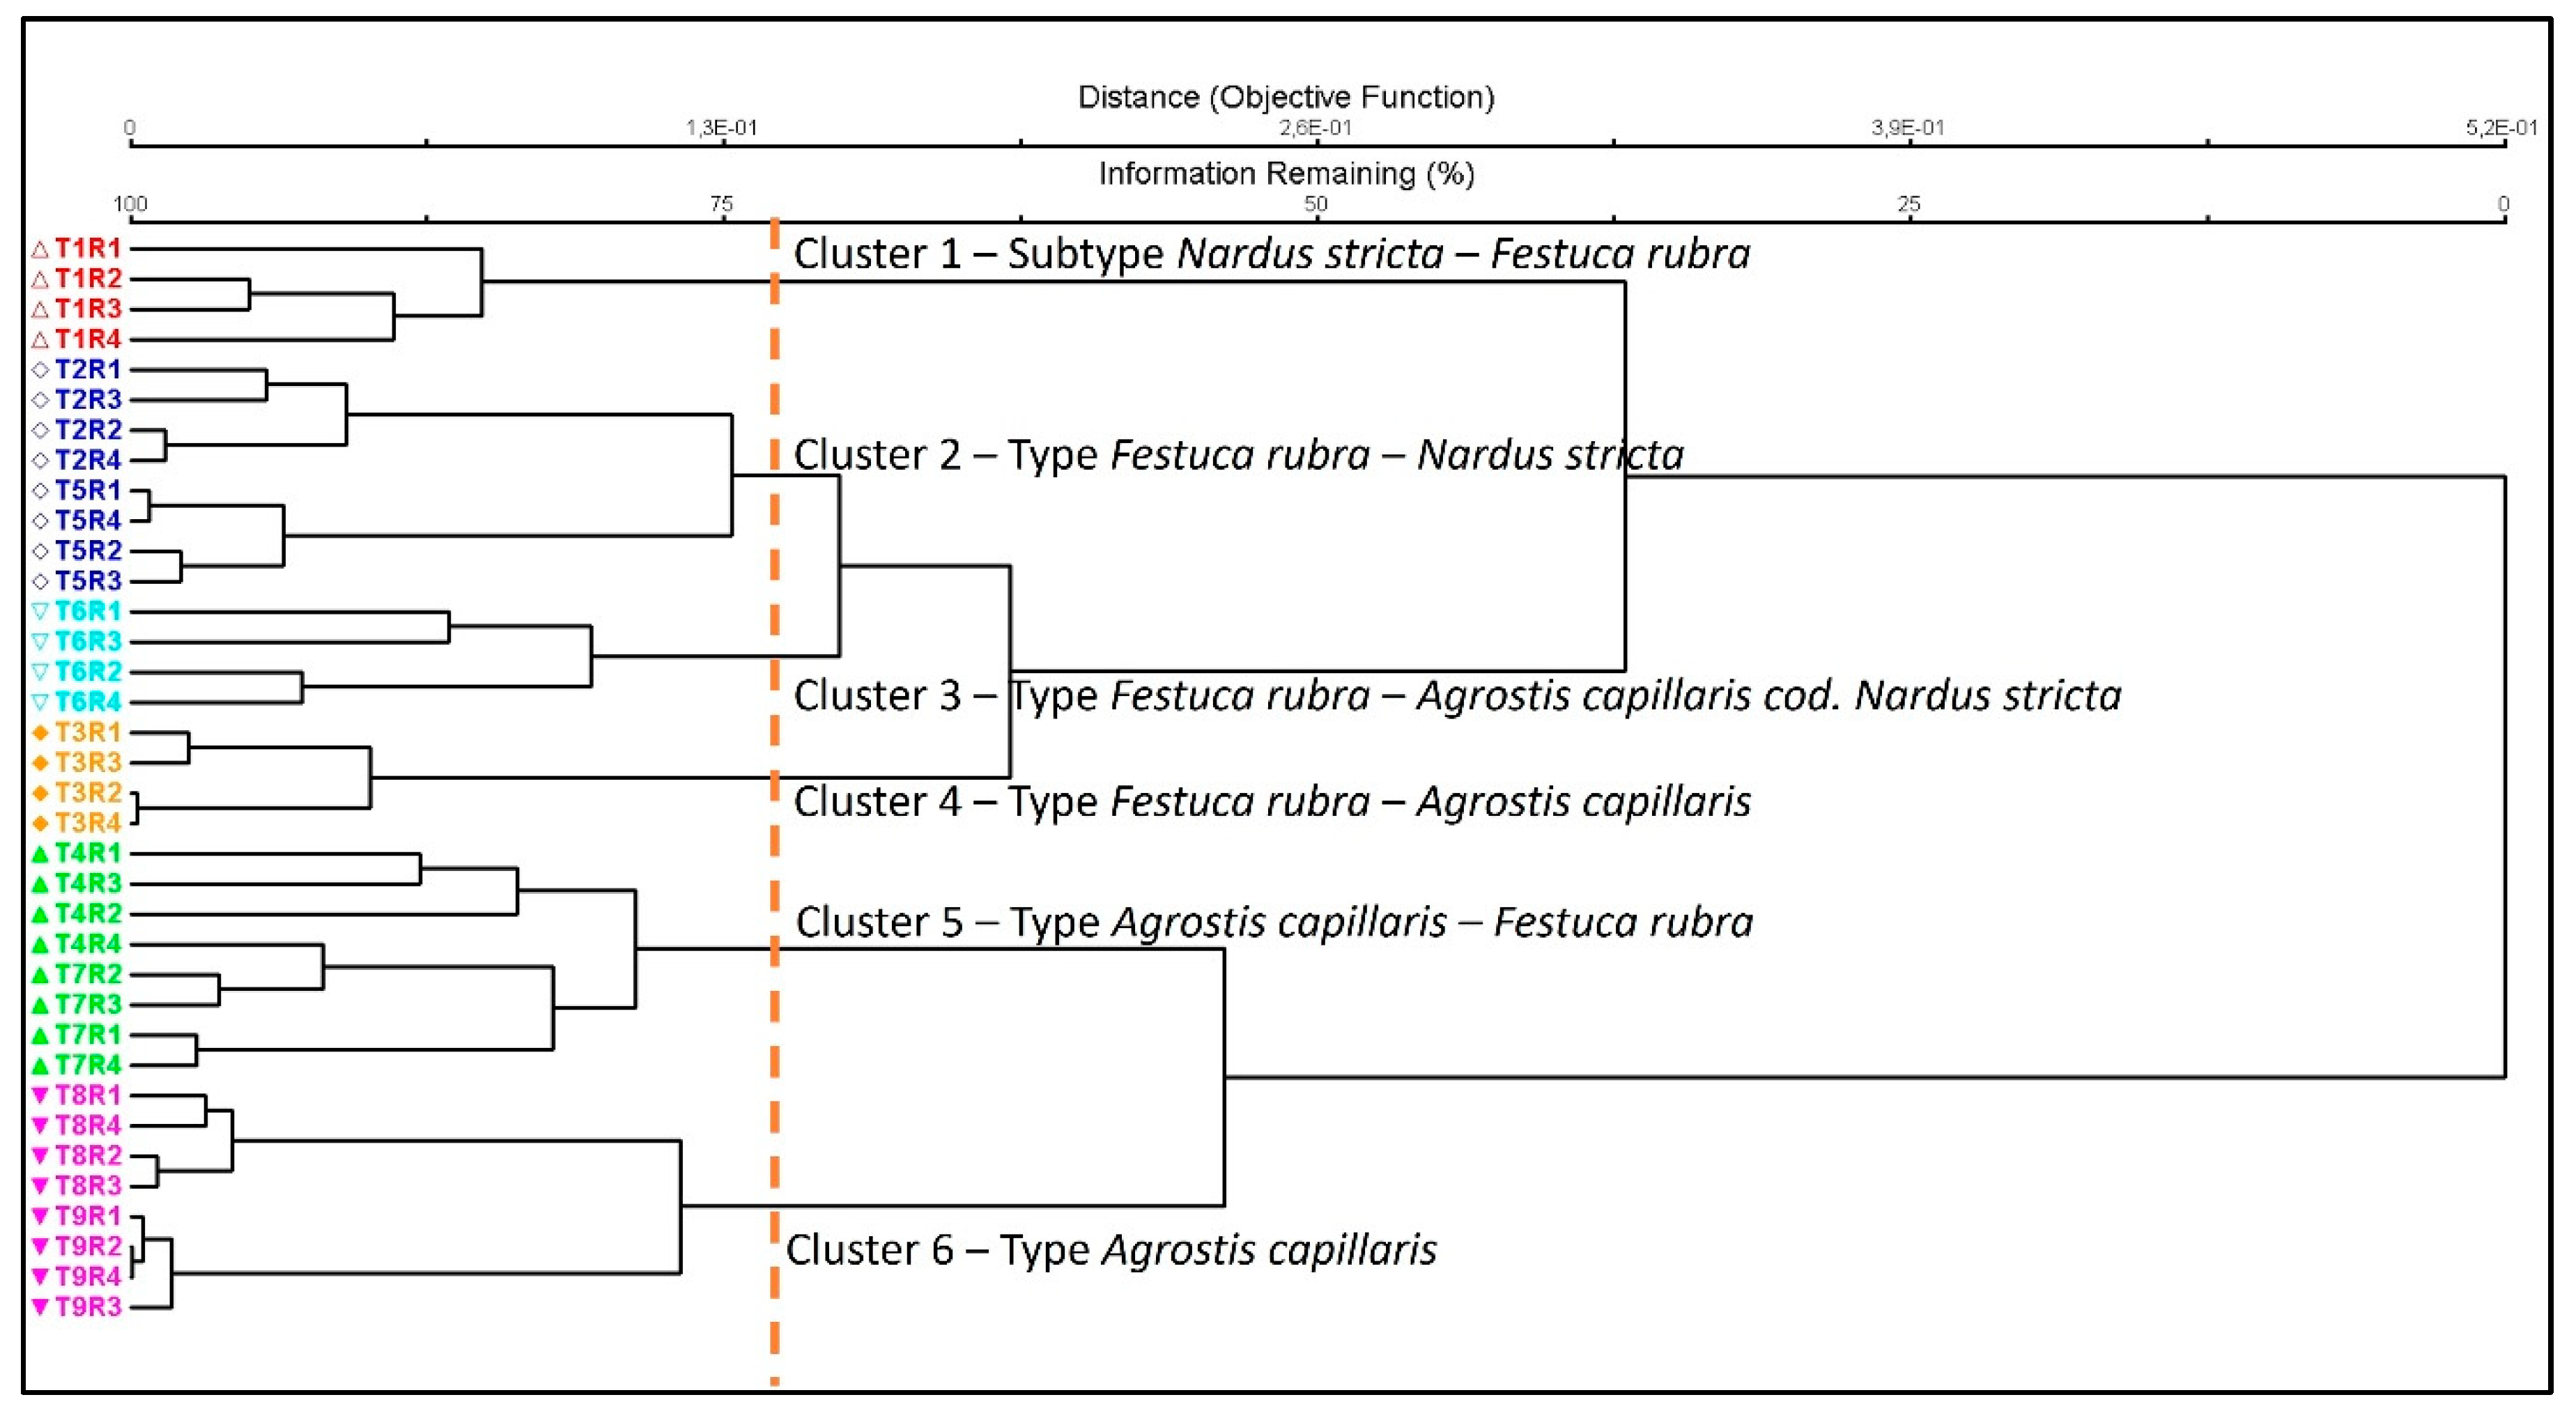
Figure 2.
Principal Coordinates Analysis (PCoA) showing the floristic differentiation of mountain grasslands under manure and mineral fertilization treatments, with vegetation types delimited by the dominance of Agrostis capillaris, Festuca rubra, and Nardus stricta. Legend: T1 - unfertilized control; T2 - 10 t ha⁻¹ manure applied in autumn; T3 - 20 t ha⁻¹ manure applied in autumn; T4 - 30 t ha⁻¹ manure applied in autumn; T5 - 10 t ha⁻¹ manure applied in spring; T6 - 20 t ha⁻¹ manure applied in spring; T7 - 30 t ha⁻¹ manure applied in spring; T8 - 200 kg ha⁻¹ nitrocalcar applied in spring; T9 - 300 kg ha⁻¹ nitrocalcar applied in spring; R1–R4—replications. Vectors indicate the fertilization gradient: no _fertilz, no fertilization (unfertilized control); Fert_low_aut, 10 t ha⁻¹ manure applied in autumn (T2); Fert_med_aut, 20 t ha⁻¹ manure applied in autumn (T3); Fert_high_aut, 30 t ha⁻¹ manure applied in autumn (T4); Fert_low_spr, 10 t ha⁻¹ manure applied in spring (T5); Fert_med_spr, 20 t ha⁻¹ manure applied in spring (T6); Fert_high_spr, 30 t ha⁻¹ manure applied in spring (T7); Nitrocalc_20, 200 kg ha⁻¹ nitrocalcar applied in spring (T8); Nitrocalc_30, 300 kg ha⁻¹ nitrocalcar applied in spring (T9).
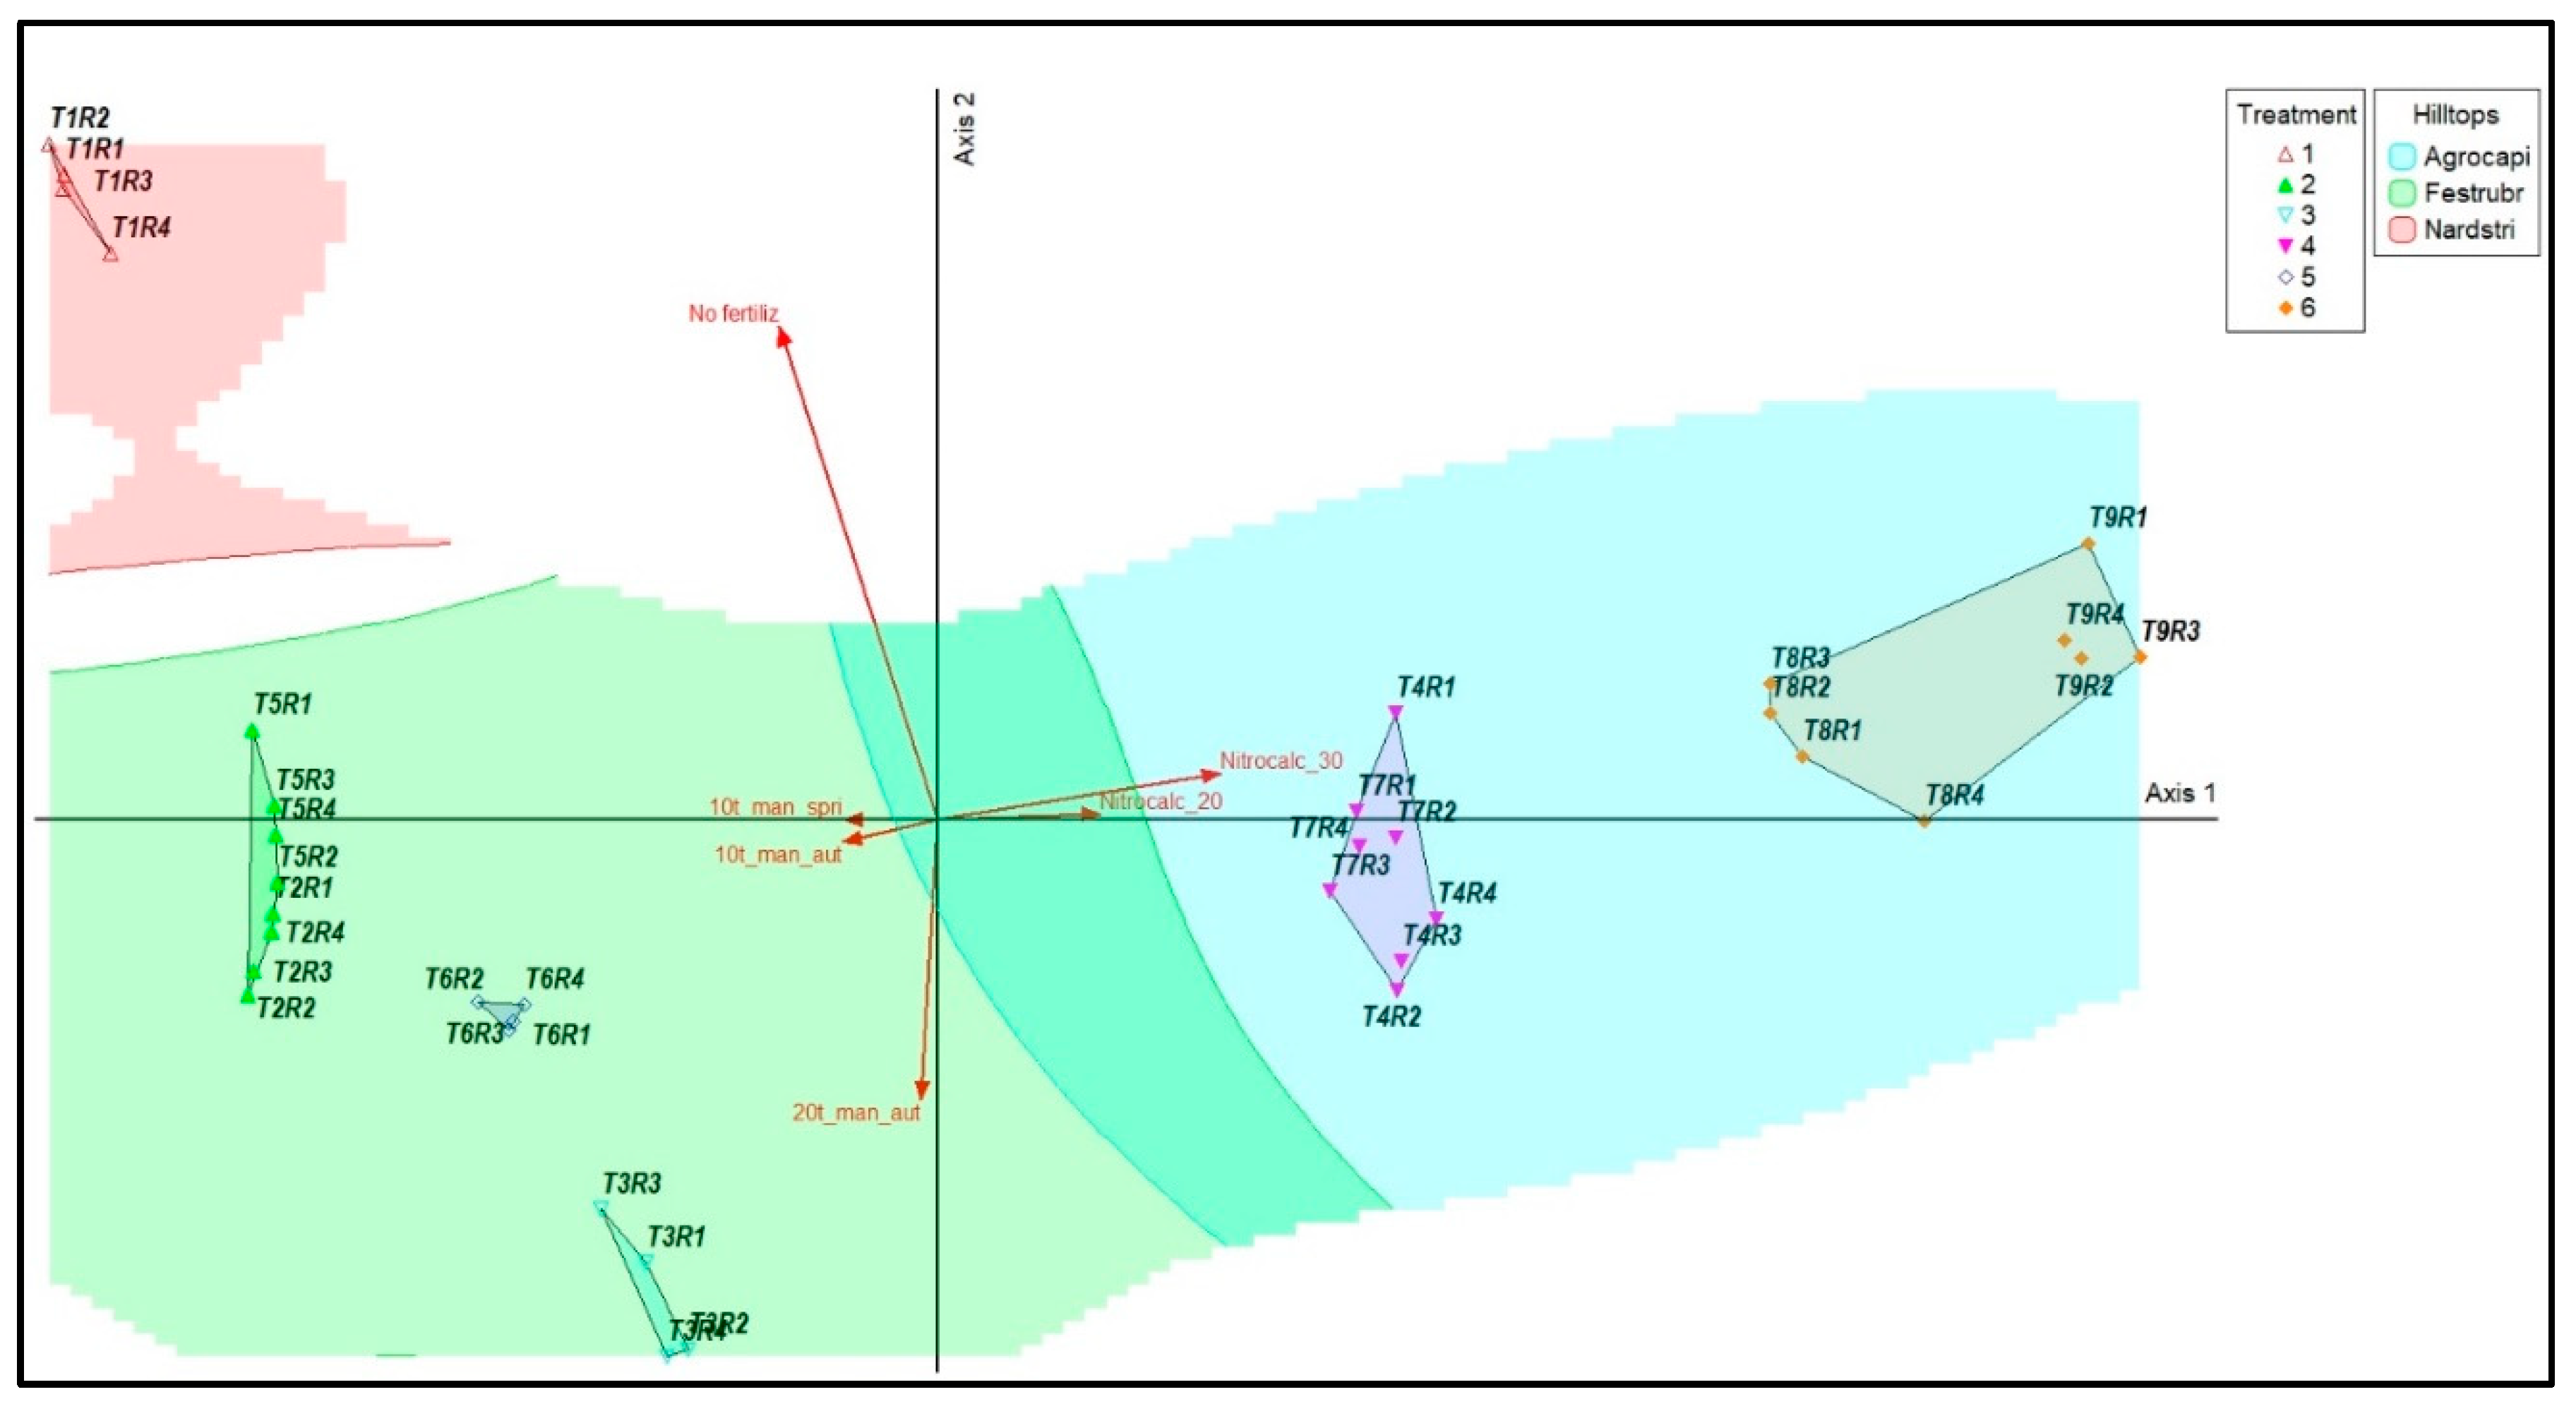
Figure 3.
Species–environment relationships for the dominant grasses in the studied grasslands. Panels: (A) Agrostis capillaris, (B) Festuca rubra, (C) Nardus stricta. Each panel combines (i) principal coordinates analysis (PCoA) scores of vegetation plots, (ii) fitted environmental vectors (fertilization treatments), and (iii) species–environment correlations along the PCoA axes. Legend: T1 - unfertilized control; T2 - 10 t ha⁻¹ manure applied in autumn; T3 - 20 t ha⁻¹ manure applied in autumn; T4 - 30 t ha⁻¹ manure applied in autumn; T5 - 10 t ha⁻¹ manure applied in spring; T6 - 20 t ha⁻¹ manure applied in spring; T7 - 30 t ha⁻¹ manure applied in spring; T8 - 200 kg ha⁻¹ nitrocalcar applied in spring; T9 - 300 kg ha⁻¹ nitrocalcar applied in spring; R1–R4—replications. Vectors indicate the fertilization gradient: No_fertilz – no fertilization (unfertilized control); Fert_low_aut – 10 t ha⁻¹ manure applied in autumn (T2); Fert_med_aut – 20 t ha⁻¹ manure applied in autumn (T3); Fert_high_aut – 30 t ha⁻¹ manure applied in autumn (T4); Fert_low_spr – 10 t ha⁻¹ manure applied in spring (T5); Fert_med_spr – 20 t ha⁻¹ manure applied in spring (T6);
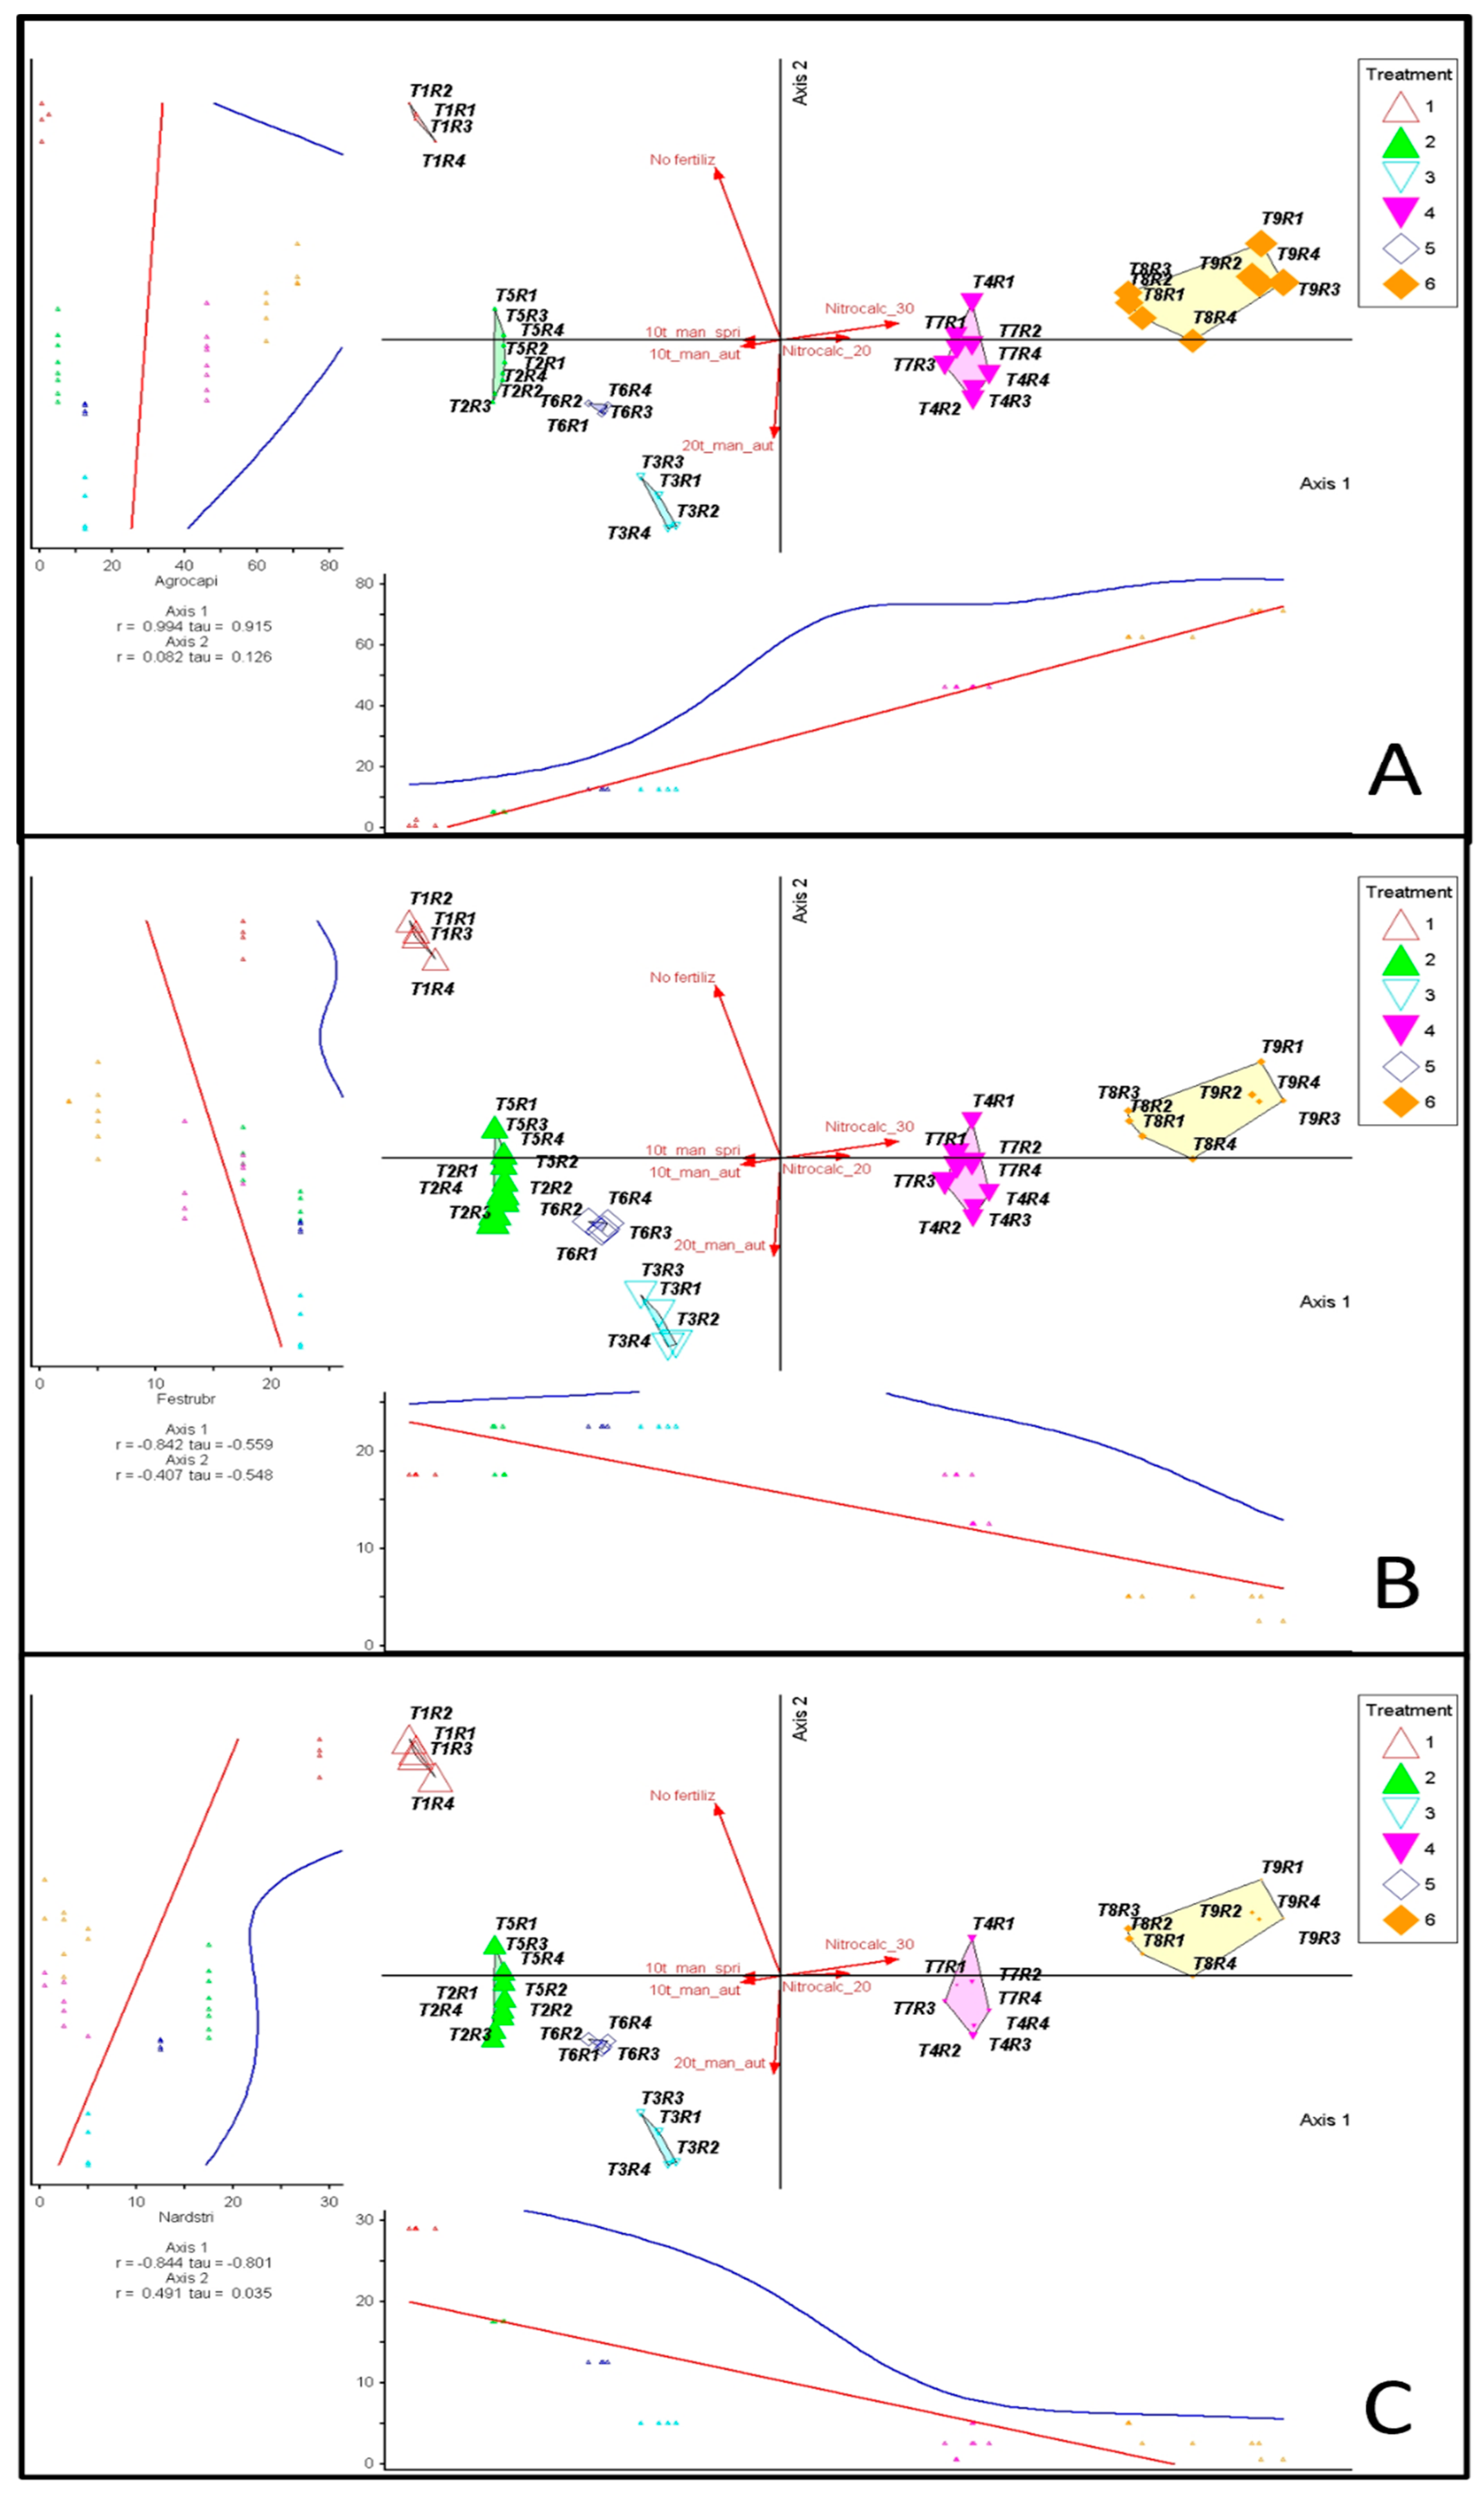
Figure 4.
(A and B). Principal Coordinates Analysis (PCoA) of grassland communities under different fertilization regimes. Legend: T1 - unfertilized control; T2 - 10 t ha⁻¹ manure applied in autumn; T3 - 20 t ha⁻¹ manure applied in autumn; T4 - 30 t ha⁻¹ manure applied in autumn; T5 - 10 t ha⁻¹ manure applied in spring; T6 - 20 t ha⁻¹ manure applied in spring; T7 - 30 t ha⁻¹ manure applied in spring; T8 - 200 kg ha⁻¹ nitrocalcar applied in spring; T9 - 300 kg ha⁻¹ nitrocalcar applied in spring; R1–R4—replications. Vectors indicate the fertilization gradient: No_fertilz – no fertilization (unfertilized control); Fert_low_aut – 10 t ha⁻¹ manure applied in autumn (T2); Fert_med_aut – 20 t ha⁻¹ manure applied in autumn (T3); Fert_high_aut – 30 t ha⁻¹ manure applied in autumn (T4); Fert_low_spr – 10 t ha⁻¹ manure applied in spring (T5); Fert_med_spr – 20 t ha⁻¹ manure applied in spring (T6); Fert_high_spr – 30 t ha⁻¹ manure applied in spring (T7); Nitrocalc_20 – 200 kg ha⁻¹ nitrocalcar applied in spring (T8); and Nitrocalc_30 – 300 kg ha⁻¹ nitrocalcar applied in spring (T9). Species abbreviations: Agrocapi – Agrostis capillaris L.; Festrubr – Festuca rubra L.; Nardstri – Nardus stricta L.; Avenplani – Avenula planiculmis (Schur) Holub; Anthodor – Anthoxanthum odoratum L.; Phlealpi – Phleum alpinum L.; Phleprat – Phleum pratense L.; Poachaix – Poa chaixii Vill.; Descflex – Deschampsia flexuosa (L.) Trin.; Trifhybr – Trifolium hybridum L.; Trifprat – Trifolium pratense L.; Trifrepe – Trifolium repens L.; Lotucorn – Lotus corniculatus L.; Achimill – Achillea millefolium L.; Achistri – Achillea stricta Schleich. ex W.D.J. Koch; Alchxant – Alchemilla xanthochlora Rothm.; Campserr – Campanula serrata (Kit.) Hendr.; Centphry – Centaurea phrygia L.; Crucglab – Cruciata glabra (L.) Ehrend.; Dianbarb – Dianthus barbatus subsp. compactus (Kit.) Grognot; Euphstri – Euphrasia stricta D. Wolff ex. J.F. Lehm.; Hieraura – Hieracium aurantiacum L.; Hierumbel – Hieracium umbellatum L.; Hypemacu – Hypericum maculatum Crantz; Hypounif – Hypochaeris uniflora Vill.; Leucvulg – Leucanthemum vulgare Lam.; Luzuluzu – Luzula luzuloides (Lam.) Dandy & Wilmott; Phytspic – Phyteuma spicatum L.; Poteerec – Potentilla erecta (L.) Raeusch.; Rhinmino – Rhinanthus minor L.; Rumeacet – Rumex acetosa L.; Scorrose – Scorzonera rosea Waldst. & Kit.; Stelgram – Stellaria graminea L.; Verocham – Veronica chamaedrys L.; Violcani – Viola canina L.; Violdecl – Viola declinata Waldst. & Kit.
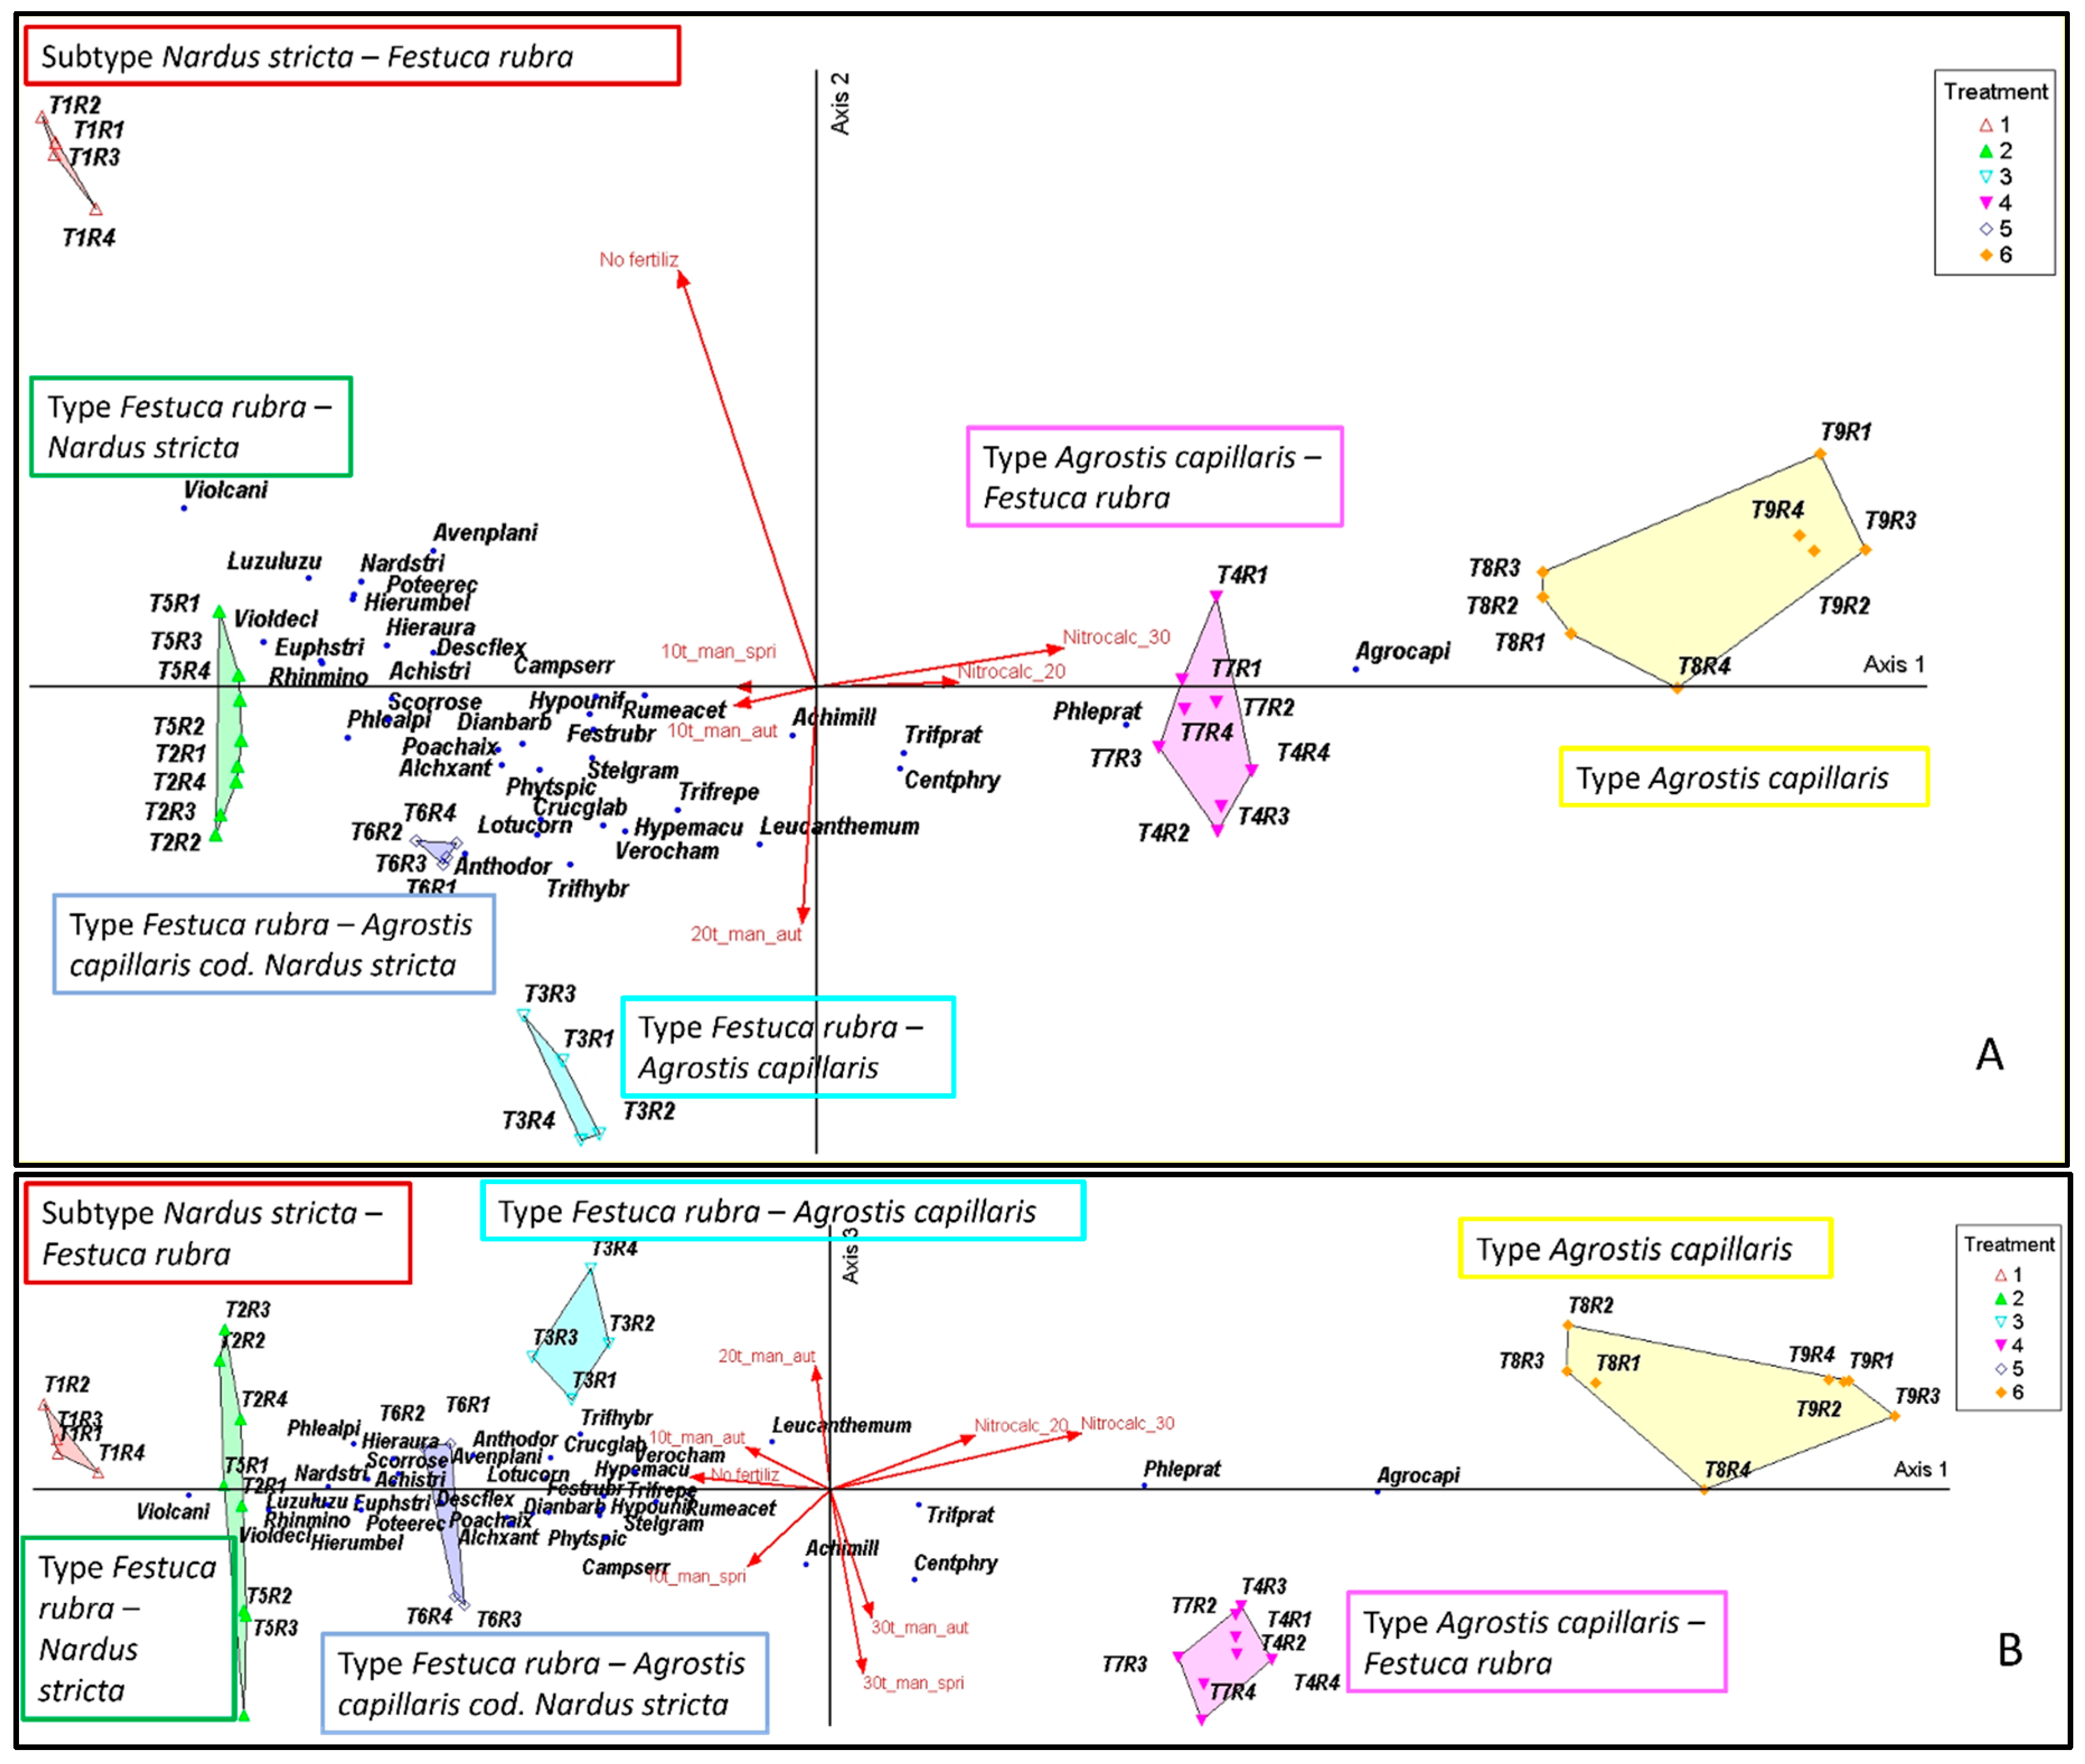
Table 1.
Importance of axis.
| Axis | Degree of participation (r) | Cumulative |
|---|---|---|
| 1 | 0.921 | 0.921 |
| 2 | 0.067 | 0.988 |
| 3 | 0.001 | 0.989 |
Note: The correlations between the treatments and the PCoA axes (Table 2) showed that negative values on Axis 1 corresponded to unfertilized variants or variants with low organic input, and positive values on Axis 1 were associated with mineral fertilization and high doses of manure.
Table 4.
Plant species correlation with ordination axes (PCoA).
| Species | Axis 1 (r) | Axis 1 (r-sq) | Axis 1 (tau) | Signif. | Axis 2 (r) | Axis 2 (r-sq) | Axis 2 (tau) | Signif. |
|---|---|---|---|---|---|---|---|---|
| Agrostis capillaris L. | 0.994 | 0.989 | 0.915 | *** | 0.082 | 0.007 | 0.126 | ns |
| Festuca rubra L. | −0.842 | 0.708 | −0.559 | *** | −0.407 | 0.165 | −0.548 | * |
| Nardus stricta L. | −0.844 | 0.713 | −0.801 | *** | 0.491 | 0.241 | 0.035 | ** |
| Avenula planiculmis (Schur) Holub | −0.499 | 0.249 | −0.534 | ** | 0.445 | 0.198 | −0.024 | ** |
| Anthoxanthum odoratum L. | −0.581 | 0.338 | −0.403 | ** | −0.687 | 0.472 | −0.592 | *** |
| Phleum alpinum L. | −0.532 | 0.283 | −0.592 | ** | −0.146 | 0.021 | −0.140 | ns |
| Phleum pratense L. | 0.842 | 0.709 | 0.773 | *** | −0.260 | 0.068 | −0.026 | ns |
| Poa chaixii Vill. | −0.512 | 0.262 | −0.420 | ** | −0.253 | 0.064 | −0.316 | ns |
| Deschampsia flexuosa (L.) Trin. | −0.701 | 0.491 | −0.584 | *** | 0.154 | 0.024 | −0.004 | ns |
| Trifolium hybridum L. | −0.331 | 0.110 | −0.310 | * | −0.596 | 0.355 | −0.537 | ** |
| Trifolium pratense L. | 0.350 | 0.123 | 0.336 | * | −0.670 | 0.449 | −0.389 | ** |
| Trifolium repens L. | −0.346 | 0.120 | −0.209 | * | −0.768 | 0.590 | −0.663 | *** |
| Lotus corniculatus L. | −0.488 | 0.238 | −0.357 | ** | −0.647 | 0.419 | −0.544 | *** |
| Achillea millefolium L. | −0.032 | 0.001 | −0.209 | ns | −0.157 | 0.025 | −0.260 | ns |
| Achillea stricta Schleich. ex W.D.J. Koch | −0.695 | 0.483 | −0.531 | *** | −0.046 | 0.002 | −0.155 | ns |
| Alchemilla xanthochlora Rothm. | −0.422 | 0.178 | −0.386 | ** | −0.262 | 0.069 | −0.436 | ns |
| Campanula serrata (Kit.) Hendrych | −0.312 | 0.097 | −0.347 | ns | −0.033 | 0.001 | −0.202 | ns |
| Centaurea phrygia L. | 0.149 | 0.022 | 0.212 | ns | −0.371 | 0.138 | −0.379 | * |
| Cruciata glabra (L.) Ehrend. | −0.426 | 0.182 | −0.360 | ** | −0.512 | 0.262 | −0.425 | ** |
| Dianthus barbatus subsp. compactus (Kit.) Grognot | −0.429 | 0.184 | −0.468 | ** | −0.207 | 0.043 | −0.362 | ns |
| Euphrasia stricta D. Wolff ex J.F. Lehm. | −0.764 | 0.583 | −0.636 | *** | 0.093 | 0.009 | −0.078 | ns |
| Hieracium aurantiacum L. | −0.546 | 0.298 | −0.611 | ** | 0.133 | 0.018 | −0.140 | ns |
| Hieracium umbellatum L. | −0.579 | 0.336 | −0.624 | ** | 0.289 | 0.083 | −0.083 | ns |
| Hypericum maculatum Crantz | −0.365 | 0.133 | −0.270 | * | −0.591 | 0.349 | −0.502 | ** |
| Hypochaeris uniflora Vill. | −0.688 | 0.473 | −0.532 | *** | −0.205 | 0.042 | −0.249 | ns |
| Leucanthemum vulgare Lam. | −0.076 | 0.006 | 0.066 | ns | −0.520 | 0.270 | −0.306 | ** |
| Luzula luzuloides (Lam.) Dandy & Wilmott | −0.624 | 0.390 | −0.551 | *** | 0.336 | 0.113 | 0.159 | * |
| Phyteuma spicatum L. | −0.311 | 0.097 | −0.261 | ns | −0.232 | 0.054 | −0.270 | ns |
| Potentilla erecta (L.) Raeusch. | −0.774 | 0.599 | −0.753 | *** | 0.366 | 0.134 | −0.005 | * |
| Rhinanthus minor L. | −0.614 | 0.377 | −0.582 | *** | 0.081 | 0.007 | −0.065 | ns |
| Rumex acetosa L. | −0.526 | 0.277 | −0.399 | ** | −0.062 | 0.004 | −0.160 | ns |
| Scorzonera rosea Waldst. & Kit. | −0.879 | 0.772 | −0.672 | *** | −0.171 | 0.029 | −0.327 | ns |
| Stellaria graminea L. | −0.554 | 0.306 | −0.387 | ** | −0.436 | 0.190 | −0.449 | * |
| Veronica chamaedrys L. | −0.334 | 0.111 | −0.257 | * | −0.628 | 0.394 | −0.619 | *** |
| Viola canina L. | −0.641 | 0.411 | −0.593 | *** | 0.453 | 0.205 | 0.242 | ** |
| Viola declinata Waldst. & Kit. | −0.679 | 0.461 | −0.546 | *** | 0.137 | 0.019 | −0.012 | ns |
Note: r— Pearson’s correlation coefficient; r-sq—coefficient of determination; tau—Kendall's tau correlation between ordination scores and species abundance. Significance: *** p < 0.001, ** p < 0.01, * p < 0.05, ns = not significant.
Disclaimer/Publisher’s Note: The statements, opinions and data contained in all publications are solely those of the individual author(s) and contributor(s) and not of MDPI and/or the editor(s). MDPI and/or the editor(s) disclaim responsibility for any injury to people or property resulting from any ideas, methods, instructions or products referred to in the content. |
© 2025 by the authors. Licensee MDPI, Basel, Switzerland. This article is an open access article distributed under the terms and conditions of the Creative Commons Attribution (CC BY) license (http://creativecommons.org/licenses/by/4.0/).
Copyright: This open access article is published under a Creative Commons CC BY 4.0 license, which permit the free download, distribution, and reuse, provided that the author and preprint are cited in any reuse.


