
Submitted:
08 October 2025
Posted:
09 October 2025
You are already at the latest version
Abstract
High Nature Value (HNV) grasslands in mountain areas are important ecosystems for biodiversity maintenance and offer a multitude of ecosystem services but constantly threatened by abandonment or intensive fertilization. The aim of this study was to assess the effects of organic and mineral fertilization, under mulching and abandonment scenarios, on the floristic composition and diversity of Nardus stricta-dominated grasslands located in the North-Eastern Carpathians (Romania). The field experiment included 11 variants (control, low, moderate and high inputs), analyzed as communities with cluster, ordinations, indicator species and α indices (specific richness, Shannon–Wiener, equity, Simpson). The results showed a clear separation of communities along the input gradient, from the oligotrophic grassland dominated by Nardus stricta (control variant) to mesotrophic/eutrophic communities dominated by Dactylis glomerata, Festuca pratensis and Trifolium pratense at moderate and high inputs. Moderate fertilization (10–20 t ha⁻¹ manure; N50P50K50–N100P100K100) maximized species richness (37–38 species), Shannon diversity (H′ = 2.5–2.6) and evenness (E = 0.70–0.75), confirming the Intermediate Disturbance Hypothesis. In contrast, high inputs reduced diversity and favored competitive grasses. Indicator species analysis highlighted a multitude of species that show plant communities response to the adaptive management. Moderate fertilization provides a viable trade-off between productivity and biodiversity, while abandonment or overfertilization accelerates biodiversity loss.
Keywords:
grassland management
; input doses
; biodiversity
; indicator species
; Carpathian Mountains
; sustainable practices
1. Introduction
High Nature Value (HNV) grasslands are mountain ecosystems of strategic importance for biodiversity conservation, providing ecosystem services and maintaining traditional cultural landscapes in Europe [1,2]. They provide essential support, supply, regulation and cultural services, contributing to carbon sequestration, water retention, fire risk reduction and the maintenance of natural and cultural heritage [3]. Recent studies in the Apuseni Natural Park (Romania) show that permanent grasslands in habitat 6520 have an average productivity of 5.2 t/ha green mass and a pastoral value of 35 [4], values that highlight the importance of these ecosystems for maintaining biodiversity and providing fodder resources. HNV grasslands support medicinal plants such as Arnica montana, which provide high economic and cultural value, but are constantly threatened by intensive agricultural practices, requiring sustainable conservation strategies [5]. These semi-natural agricultural systems were formed and maintained through extensive management, especially mowing and grazing, and are characterized by high floristic diversity and the presence of indicator species adapted to oligotrophic and stressful conditions [6,7,8]. In the establishment of mountain grasslands management, the soil-plant relationship plays an essential role, with indicator species providing rapid information on the agrochemical conditions of the soil and on the state of fertility [9,10].
In last decades, changes in agricultural practices – the intensification of mineral fertilization, or the abandonment of traditional management – have led to major transformations in the structure and functioning of mountain grasslands [11,12,13,14]. The abandonment determines secondary successions and major structural changes, with the degradation of agronomic and ecological value [15]. In the Apuseni Mountains (Romania), population exodus has accentuated the abandonment of grasslands, leading to the transformation of traditional cultural landscapes and the reduction of biodiversity, which highlights the need to restore traditional agricultural practices [16]. The classification and assessment of grasslands is an essential basis for choosing adapted management techniques and for understanding their role in cultural landscapes [17]. The pressures are exacerbated by difficulties in implementing EU conservation policies, due to limited collaboration between environmental and agricultural institutions, leading to an unfavorable conservation status for species-rich semi-natural habitats [18]. Moderate fertilization can stimulate species productivity and coexistence, reducing competitive dominance - a mechanism similar to that suggested by the Intermediate Disturbance Hypothesis [19,20,21,22]. Recent studies propose alternative technologies economically viable in mountainous areas, such as mulching combined with organic fertilization, that maintain oligotrophic grasslands at an appropriate level of diversity, with minimal changes in vegetation composition [23– 25]. Long-term studies conducted in the Apuseni Mountains have demonstrated that constant application of manure has a significant impact on the floristic composition and productivity of Festuca rubra grasslands [26]. In contrast, intensive fertilization leads to the simplification of phytocoenoses, the dominance of competitive grasses and perennial legumes, while the lack of input favors oligotrophic species and reduces forage value [27,28,29,30]. Furthermore, long-term fertilization reorients mycorrhizal colonization strategies in the roots of dominant species (e.g. Agrostis capillaris), favoring storage structures over transfer ones, which may affect nutrient cycling in HNV ecosystems [31]. Recent conceptual approaches propose the segmentation of microbial functional niche to assess alterations caused by fertilization, extracting sensitive and stable guilds, which support sustainable management policies in HNV grasslands [32]. Another approach can analyze the nitrogen use efficiency (NUE), which is used in the design of sustainable temporary grassland systems, as an indicator for optimizing fertilization and reducing nutrient losses [33]. The identification of indicator species for soil agrochemical characterization has also been used in recent studies conducted in the Apuseni Natural Park [9], providing a useful framework for monitoring and adaptive management of type 6520 habitats. These results can inform conservation policies, where, according to comparative studies, institutional collaboration between conservation and agriculture is essential for maintaining the favorable status of species-rich grasslands, integrating socio-cultural aspects [34].
Romania has some of the largest areas of HNV grasslands in the European Union, especially in the Western and Southern Carpathians, where they amount to over 2 million hectares [35,8]. These ecosystems are valued both for their floristic biodiversity and for their cultural and economic value [36]. However, maintaining the balance between productivity, biodiversity conservation and sustainable resource use remains a major challenge for current and future agricultural and environmental policies [37,38]. In this sense, European agricultural policies promote agri-environmental schemes and compensatory measures that support biodiversity, but abandonment and intensification continue to pose significant threats [39,40,8].
In this context, the objective of the study was to evaluate different management scenarios on the effects of organic and mineral fertilization, combined with mulching and abandonment, on the diversity and structure of Nardus stricta grasslands in the North-Eastern Carpathians. By applying multivariate methods and indicator species analysis, the research aims to highlight the mechanisms by which the intensity and type of input influence the dynamics of mountain phytocoenoses and to provide recommendations for an adaptive and sustainable management of these ecosystems. A complex system of data analysis was carried out to identify the most suitable test that answers one or several research questions: a) the application of combined management scenarios are visible in the plant communities?; b) diversity indices are sensitive enough to show the changes due to applied management?; c) is there a visible shift from an oligotrophic status to a meso- or eutrophicated one
2. Results
2.1. The Influence of Management Scenario on Floristic Composition
The cluster analysis highlighted the vegetation classification and clearly reflected the ecological gradient induced by the different management practices and fertilization rates (Figure 1). The cut-off level of the dendrogram was set at ~60% remaining information, corresponding to the best compromise between ecological, phytosociological and agronomic interpretation. The choice of this threshold aligns with the methodologies used in recent analyses, where UPGMA cut-off values based on Sørensen/Bray–Curtis were used to obtain ecologically meaningful groupings [22,41]. Four distinct clusters were identified: Group 1 – oligotrophic grasslands dominated by Nardus stricta, typical of nutrient-poor conditions and extensive management; Group 2 – transitional communities of Nardus stricta–Festuca rubra, reflecting a moderate shift in floristic composition at slightly increased inputs; Group 3 – Festuca rubra–Nardus stricta communities co-dominant with Agrostis capillaris; Group 4 – mesotrophic grasslands of Agrostis capillaris–Festuca rubra, associated with high fertilization levels. The formation of these clusters demonstrates that fertilizers produce major changes in the floristic structure of HNV grasslands, separating two large ecological groups: one corresponding to treatments with low or absent input (T1–T3) and another associated with intensive organic or mineral fertilization (T4–T11). Each management regime thus generated a specific type of grassland, highlighting the close relationship between the level of inputs and the composition of the communities.
2.2. Plant Community Patterns Explored Through Principal Coordinates Analysis (PCoA)
To more clearly visualize the relationships between treatments and floristic communities, we used PCoA analysis, which highlighted the distribution of phytocoenoses along the trophic gradient generated by fertilization (Figure 2, Table 1). The first two axes explained 98.6% of the variation in composition, of which Axis 1 concentrated 87.5% and was the main ecological gradient.
On this axis, treatments without fertilization (T1–T3) were negatively correlated (r = −0.825, p < 0.001) and clustered on the left side of the ordinate, while treatments with medium and high inputs (T5–T11) were positively correlated (r = 0.586–0.512) and clustered on the right side. Axis 2 explained only 11.1% of the variation and had low biological relevance. It partially separated variants with medium input from those with high input. Overall, PCoA confirms that fertilization intensity, and not type (organic vs. mineral), explains most of the variation in floristic composition.
The vectors corresponding to the type of fertilizer (organic vs. mineral) had close values and similar directions, indicating the lack of significant differences between the two types of input at the same intensity level. Thus, the variability of the floristic composition is mainly explained by the intensity of fertilization and not by its type.
2.3. The Analysis of Community Composition Through Multi-Response Permutation Procedure (MRPP)
The PCoA results revealed a clear separation of floristic readings along the fertilization gradient, especially on Axis 1. To test the robustness of this separation and to quantify the floristic distance between the identified grassland types, MRPP analysis was applied. The groups without input (T1–T3) were significantly separated from all fertilized treatments (p < 0.01), but the differences between treatments with close doses, either organic or mineral, were not statistically significant (Table 2). The greatest difference was observed between the Zero-input group (T1–T3) and the High-input group (T6, T10) (A = 0.723). Intermediate values of the A index were obtained for the Zero-input vs. Medium-input (A = 0.689) and Low-input vs. High-input (A = 0.623) comparisons. The lowest values were recorded between Medium-input and High-input (A = 0.519), suggesting a partial convergence of the communities under high fertilization.
To visualize how these correlations are reflected in the community structure, the distribution of species and treatments was graphically represented by PCoA analysis, where the vectors indicate the direction and amplitude of the species response to the fertilization gradient (Figure 3). These differences confirm the clear separation between the grassland groups previously identified by cluster analysis and MRPP tests. The PCoA showed a clear separation between the treatments with low inputs (T1–T3) and those with medium and high levels of mineral and organic fertilization (T4–T11), arranged along Axis 1. This axis explained most of the variation (87.5%) and represented the main trophic gradient. On the negative side of Axis 1 are phytocenoses dominated by Nardus stricta, Vaccinium myrtillus and Luzula multiflora, indicating oligotrophic grasslands characteristic of treatments without inputs. On the positive side, medium and high fertilization caused a shift of communities towards competitive mesotrophic species, such as Dactylis glomerata, Festuca pratensis and Phleum pratense. Axis 2, although explaining only 11.1% of the variation, highlighted the differentiation of leguminous species (Trifolium pratense, Trifolium repens) associated with moderate organic inputs. This distribution confirms the trends highlighted by the cluster and MRPP, suggesting that the application of inputs not only changes the dominance of species, but also the typology of phytocenoses in the long term.
To further explore the contribution of individual species to the separation of phytocenoses highlighted in the PCoA analysis, the correlations between species abundance and the two ordination axes are presented in Table 4. The coefficient values show which species were favored by the lack of fertilization and which respond positively to moderate or high nutrient inputs. The correlations between ordination scores and the abundance of dominant species were analyzed showing that species characteristic for oligotrophic grasslands, such as Nardus stricta (p < 0.001), Vaccinium myrtillus (p < 0.001), Luzula multiflora (p < 0.01) and Potentilla erecta (p < 0.001), were negatively correlated with Axis 1. This position on the ordination indicate that their ecological optimum is associated with the absence of fertilization or with very low inputs. Festuca rubra (p < 0.001) and Carex pallescens (p < 0.05) also showed the same trend, confirming their vulnerability to management intensification. In contrast, mesotrophic and competitive species had positive and significant correlations with Axis 1, among which Dactylis glomerata, Festuca pratensis, Phleum pratense and Agrostis capillaris stand out (all p < 0.001), demonstrating an increase in their abundance under medium and high fertilization conditions. Axis 2, although explaining a smaller proportion of the variation, highlighted a distinct behavior of leguminous species. Trifolium pratense and Trifolium repens were negatively and significantly correlated with this axis (p < 0.001), showing that their response was influenced by the application of moderate organic inputs. Other species, such as Briza media (p < 0.01) and Veronica chamaedrys (p < 0.05), also presented significant correlations with Axis 2, suggesting the role of secondary ecological factors in structuring communities.
2.4. The Indicator Species Analysis (ISA) on Plant Communities Shaped by Management Scenarios
To identify the species responsible for these differences, we used ISA analysis. Analysis of species indicator values for the four phytosociological groups (Table 5) highlighted floristic differentiation along the management and fertilization gradient. Four distinct groups were identified and profiled through this method:
- •Group 1 (Nardus stricta grasslands) – characterized by strong indicators with high significance: Nardus stricta, Campanula abietina, Cerastium sylvaticum, Cruciata glabra, Polygala vulgaris, Viola declinata, Veronica officinalis, Vaccinium myrtillus.
- •Group 2 (transitional communities) – associated with grasses (Anthoxanthum odoratum, Briza media, Cynosurus cristatus) and legumes (Lotus corniculatus, Trifolium ochroleucon, Trifolium repens).
- •Group 3 (Festuca rubra–Agrostis capillaris co-dominance) – marked by species tolerant to moderate inputs: Festuca rubra, Holcus lanatus, Trifolium pratense, Alchemilla vulgaris, Centaurea pseudophrygia, Stellaria graminea.
- •Group 4 (competitive mesotrophs) – with indicators such as Agrostis capillaris, Dactylis glomerata, Festuca pratensis, Phleum pratense, but also generalist species (Taraxacum officinale, Veronica chamaedrys).
Thus, the indicator species analysis (ISA) confirmed that each phytosociological group has a distinct set of characteristic species, which validates the separation of clusters and the ordination gradient obtained by PCoA.
2.4. The Impact of Management Scenarios on Diversity Indices
To evaluate the effects of fertilization on α diversity, four biodiversity indices (S, H′, E, D) were calculated, and the results are presented in Table 6. The overall assessment of biodiversity indices highlights a significant effect of fertilization treatments on the structure of phytocenoses (F test, p < 0.001 for all four parameters).
Species richness (S) had the highest values in the variants with moderate inputs (T4—37 spp., T7—38 spp., T9—37 spp.), confirming the positive effect of moderate organic or mineral fertilization on diversity. The lowest values were recorded in the treatments with high doses of fertilizers (T6—22.5 spp., T10—22.8 spp.), where the competitive pressure of dominant species led to a reduction in the total number of species.
The Shannon index (H′) increased significantly in the fertilized treatments (T4–T9, values > 2.4), compared to the control (T1—1.54) and the abandonment variant (T2—1.30). This shows a more balanced distribution of species and a higher diversity under moderate fertilization conditions. In contrast, in very high doses of inputs (T6, T10), although the Shannon index remains relatively high (> 2.1), diversity tends to be supported by a few dominant species.
Species evenness (E) followed the same trend: low values in the control and abandonment (0.43 and 0.38), compared to the highest values in the fertilized treatments (0.70–0.75). This indicates that fertilization favors a more uniform distribution of species abundance, up to an input threshold, after which the communities become unbalanced again.
The Simpson index (D) reflected the same dynamics, with higher values in fertilized treatments (0.83–0.86), compared to the control and abandonment (0.51, 0.42, respectively).
It is observed that moderate fertilization (T4, T7, T9) maximizes α diversity, which confirms the hypothesis that intermediate inputs favor species coexistence by reducing competitive imbalances. These results support the intermediate disturbance hypothesis, indicating that moderate fertilization maximizes species coexistence, while both the absence of inputs and excessive fertilization lead to a reduction in diversity.
3. Discussion
The evolution of phytocoenoses in different management scenarios
The application of organic and mineral fertilizers determined a clear difference in the evolution of phytocoenoses, confirming the hypothesis that management intensity is the main factor modulating the structure and diversity of grasslands [42,43]. In the case of the unfertilized control (T1), the large number of species and the high values of the Shannon and Simpson indices confirm the oligotrophic character and ecological stability of the Nardus stricta grassland, results consistent with other research conducted in mountainous areas in Romania [44].
The T2 treatment (abandonment) led to a decrease in specific richness and uniformity, confirming the observations that the total lack of interventions favors the establishment of ruderal-nitrophil species, but reduces the overall diversity [45]. The reduction in specific richness observed in the case of abandonment was previously reported by [15], who showed that after 6–10 years of non-use, diversity and forage value decrease, being replaced by low-value species, such as Nardus stricta. In contrast, mulched variants (T3) maintained high diversity, indicating that this type of extensive management can substitute traditional mowing and prevent the loss of valuable species [24,25].
Mineral fertilization (T4–T6) had contrasting effects: at moderate doses (N50P50K50, T4) maximum diversity values (H’=2.59; D=0.84) were recorded, suggesting an optimal coexistence of competing and stress-tolerant species. This result supports the Intermediate Disturbance Hypothesis, according to which diversity is maximized at a medium level of intensity [19,46]. However, high doses (T6: N150P150K150) led to a significant reduction in the number of species and uniformity, confirming the trend reported by other studies on high nature value grasslands [47,23,28,29]. Similar studies from the Apuseni Mountains (Romania), using NIR techniques, confirm the decrease in protein content and digestibility under intensive NPK, linked to the reduction of Fabaceae, and recommend moderate doses (below 100:50:50) or organic fertilization to maintain biodiversity and forage quality [48], which highlights the importance of integrated management in HNV.
Regarding organic fertilization, the application of 10–20 t ha⁻¹ of cattle manure (T7–T8) stimulated the establishment of perennial legumes (Trifolium pratense, Lotus corniculatus), improving diversity and forage value, an aspect also confirmed in other mountain ecosystems [49,8]. Our results are comparable to long-term studies carried out on Festuca rubra meadows in the Apuseni Mountains, where it was observed that the dose of 10 t/ha contributed to balancing the floristic composition and increasing the Shannon index, suggesting that moderate organic fertilization can support both productivity and maintaining diversity [26]. At the same time, periodic fertilization with 20 t ha⁻¹ every two years (T9) allowed maintaining a balance between productivity and biodiversity, the results being similar to those reported by [8] and [50] for HNV grasslands in the Romanian Carpathians.
At high manure doses (T10, T11), diversity was again restricted, with values close to those obtained for intensive mineral fertilization. These results indicate that both zero and excessive inputs lead to biodiversity loss, while moderate doses provide a good compromise between productivity and species conservation [36,51,52]. Our results confirm that low NPK doses do not produce major structural changes, in line with 6-year studies in the Apuseni Mountains, where it was shown that low fertilization does not change grassland type, but influences species diversity [53].
Plant specificity to applied treatments
The results of ISA show that each identified phytocoenotic group has a distinct set of species with diagnostic value. Oligotrophic grasslands are characterized by Nardus stricta, Vaccinium myrtillus and Potentilla erecta, species typical for acidic soils and restrictive conditions [7]. Several recent studies confirm that Nardus stricta is a characteristic species for oligotrophic grasslands on acidic soils, such as the case of reserves in Germany, where typical acidophilic species decrease with the improvement of soil acidity [54]. Vaccinium myrtillus also thrives in restricted acidophilic environments, such as heaths and degraded grasslands [55,56]. The case study of Nardus stricta grasslands (6230*) provides further evidence for the role of these species as ecological indicators in oligotrophic communities [57,10]. In contrast to oligotrophic grasslands, mesotrophic and eutrophic communities were dominated by species with higher nutritional requirements, such as Dactylis glomerata, Festuca pratensis and Trifolium pratense. These species are recognized as competitive under moderate and intense fertilization conditions, where biomass accumulation and the reduction of species sensitive to low nutrient inputs are favored. This opposition between species characteristic of oligotrophic environments and those associated with mesotrophic/eutrophic communities highlights the impact of the fertilization gradient on the structure of mountain vegetation. Similar results have been reported in recent studies on mixtures of grasses and legumes fertilized with mineral and organic fertilizers, where Dactylis glomerata and Trifolium pratense became dominant [58,59]. Parallel findings have also been presented for high nature value mountain meadows in the Apuseni Mountains, where increased fertilization levels have led to an increased role for mesotrophic and eutrophic species [8]. Such results confirm the role of indicator species as essential tools for diagnosing the agrochemical status of the soil and for underpinning adaptive management strategies for mountain meadows [9,10,27].
Overall, the results demonstrate that Nardus stricta meadows respond differently to the intensity and type of fertilization, but the general trend remains the same: extensive or moderate management preserves diversity, while excessive intensification leads to simplification of the phytocoenosis. These findings support the recommendations for adaptive management and sustainable use of mountain resources [60,61,54,62]. Changes generated by fertilization are subsequently amplified or attenuated by climate variability, which complicates predictions of the long-term dynamics of these ecosystems. Although fertilization treatments explain a large part of the observed variation in vegetation composition, these changes cannot be interpreted as isolated cases. Interannual climatic fluctuations (temperature, water balance) can amplify or attenuate the effects of management, generating both directional successions and annual variations in the structure of phytocoenoses. This aspect is particularly relevant for mountain grasslands, where the interaction between anthropogenic and climatic factors determines the dynamics of plant communities. Studies in the Apuseni Mountains show that these changes are magnified by climatic fluctuations, which induce directional successions in initial periods and annual fluctuations related to temperature and water balance, affecting the vegetation composition in similar grasslands [63]. Climate fluctuations can increase the speed of vegetation changes in mountain grasslands — recent studies showing directional successions towards species adapted to warmer and drier conditions [64] and changes in floral composition under warming conditions [65]. These results indicate a background of a high global sensitivity of vegetation indicators to temperature and precipitation (global meta-analysis) and dramatic examples such as the effects of the extreme drought of 2022 [66]. The context demand the necessity to integrate climate monitoring into HNV management, in order to distinguish between human-induced and natural changes — as demonstrated by integrated monitoring programs for HNV [67]. the German standardized observation system [68] and the international GLORIA network dedicated to alpine eco-vegetation [69].
Structural and diversity changes along input gradients
The results of our study demonstrate that fertilization intensity plays a central role in shaping the structure and diversity of high nature value (HNV) grasslands. Cluster analysis and ordination methods (PCoA, MRPP) consistently separate grassland communities along the input gradient, from unfertilized oligotrophic grasslands to intensively fertilized mesotrophic systems. This pattern highlights the sensitivity of oligotrophic grasslands, dominated by Nardus stricta and associated stress-tolerant species, to increased nutrient availability. Also, intensive fertilization reduces diversity and favors competitive species, potentially increasing the risk of toxic species in grasslands [70]. To prevent animal poisoning, technologies such as NIR hyperspectral imaging can discriminate species and botanical families, allowing the identification of toxic species in grasslands similar to those in the Apuseni Mountains [71]. This highlights the need for advanced monitoring in sustainable HNV management. Our results are consistent with previous reports showing that moderate fertilization can improve species coexistence by balancing competitive dynamics, while both the absence of inputs and excessive fertilization reduce biodiversity [42,72,8,73,52]. Intermediate input treatments (T4, T7, T9) maximized species richness and Shannon diversity, supporting the Intermediate Disturbance Hypothesis in grassland ecosystems [19,20,46].
Overall, the results highlight that reduced or absent inputs favor oligotrophic and stress-tolerant species [7], thus maintaining the traditional character and high biodiversity of mountain meadows. In contrast, intense fertilization causes a transition towards communities dominated by competitive grasses and perennial legumes, with a visible reduction in floristic diversity. These findings are in agreement with both national studies [8,42,27,74] and recent international research showing that excessive mineral fertilization increases biomass, but significantly reduces species richness and community evenness [43,52]. Also, the global analysis carried out by [64] confirms that climatic fluctuations can amplify these effects, accelerating the succession towards simpler mesotrophic communities and reducing the stability of ecosystems. Thus, the transition from oligotrophic to mesotrophic systems, accompanied by gradual losses of diversity, reflects a general pattern recently reported for mountain ecosystems in Europe [35,38,65].
Therefore, the results obtained confirm that moderate fertilization represents an optimal solution for maintaining the balance between productivity and biodiversity, while extremes – the total lack of inputs or excessive fertilization – inevitably lead to the simplification of plant communities. This opposition between the species characteristic of oligotrophic environments (Nardus stricta, Vaccinium myrtillus, Potentilla erecta) and those associated with mesotrophic and eutrophic communities (Dactylis glomerata, Festuca pratensis, Trifolium pratense) highlights the importance of the fertilization gradient as a determining factor in the structure and dynamics of mountain meadows. Therefore, maintaining the balance between productivity and diversity depends on adaptive management, which integrates both agricultural pressure and climatic variability, being the only viable option for the conservation of biodiversity and the sustainable use of resources in the mountain area.
4. Materials and Methods
The methods used in this study were chosen to meet the main objective of the study – evaluating how the intensity and type of fertilization influence the structure and diversity of Nardus stricta grasslands.
4.1. Soil and Climatic Conditions
The experiment was conducted during 2020-2024 period, at a permanent meadow derived from Nardus stricta L., on the Plaiu Sarului (47030′42″ N, 25037′95″ E), in the region of the North-Eastern Carpathians (Dorna Depression) at 845 m above sea level. The type of the soil within the experimental field is represented by hyposkeletal luvosoil [75].
Within the luvosoil type, the well-developed sub-horizon with a thickness of 8-10 cm is noticeable (At), a horizon of accumulation of acid humus and lighter in color (Ao), the El horizon and the mineral horizon (Bt argic). The soil mountain-meadow is a luvosol hyposkeletal, belonging to the acid soils with pH = 4.2, and the land slope with an inclination of 16º near a deciduous forest. The climatic conditions in the area are characterized by an average temperature of 6.3 °C and 675 mm of total annual precipitation.
4.2. Experimental Design
A monofactorial experiment was organized according to the randomized block method, in three replicates. The research covered three blocks, and the experiment had the following variants:
- V1 - unfertilized (control);
- V2 – abandonment (unharvested or non-grazing);
- V3 – mulching (cut and leave the biomass on site);
- V4 - N50P50K50 kg/ha annually;
- V5 - N100P100K100 kg/ha annually;
- V6 - N150P150K150 kg/ha annually;
- V7 - 10 t/ha cattle manure, annually;
- V8 - 20 t/ha cattle manure, annually;
- V9 - 20 t/ha cattle manure, at 2 years;
- V10 - 30 t/ha cattle manure, annually;
- V11 - 30 t/ha cattle manure, at 2 years.
Two types of fertilizers were used: an organic one represented by well fermented cattle manure (older than two years) and a mineral one represented by a complex fertilizer with nitrogen, phosphorus and potassium (N20P20K20). The cattle manure had the following chemical composition: N-0.445%, P2O5-0.212% and K2O-0.695%. Fertilizers were applied manually in the same period, in early spring before the start of active vegetation growth, respectively.
4.3. Vegetation Survey
The floristic studies were performed according to a modified Braun-Blanquét method (Figure 4, Table 7), with smaller intervals adapted for a better and more realistic vegetation assessment [76]. The floristic studies were performed in 2024, at the beginning of July, when the grasses were in the phenological flowering phase. The sampling time in July reflects the flowering stage of the grasses, which ensures relevance for the comparative analysis of species composition, similar to studies in semi-natural grasslands that analyze the phenology of dominant plants during this period [77,78]
4.4. Data Analysis
Data analysis was performed with PC-ORD 7 software [79,80]. For cluster analysis, the Sørensen similarity index (Bray–Curtis) and the UPGMA (Group Average linkage) clustering method were used, considered standard in plant community analysis and have been applied in numerous recent studies to delimit ecological and phytosociological groups [81,82,41]. The cutoff level of the dendrogram was set at approximately 60% of the remaining information, which allowed obtaining clusters with ecological and phytosociological relevance.
To integrate the experimental treatments (T1–T11) into the multivariate analyses, they were coded according to the level of nutrient inputs and the type of fertilizer. Thus, the first three treatments (T1–control, T2–abandonment, T3–mulching) were included in the “Zero-input” category, characterized by the lack of nutrient input. The rest of the variants were grouped as follows:
- Low-input: T4 (N50P50K50), T7 (10 t/ha cattle manure applied annually);
- Medium-input: T5 (N100P100K100), T8 (20 t/ha cattle manure applied annually), T9 (20 t/ha cattle manure once every two years), T11 (30 t/ha cattle manure once every two years);
- High-input: T6 (N150P150K150), T10 (30 t/ha cattle manure applied annually).
This classification reflects the reference to the threes holds established by the Nitrates Directive (170 kg N/ha/year), as well as the ecological response of the vegetation observed in the field. The differentiation between mineral and organic fertilization was introduced by additional binary variables (e.g.: Low_o, Low_m, Med_o, Med_m), allowing the separate testing of the effects of the type of fertilizer on the community structure. The procedure for classifying the experimental treatments by input categories (“Zero-input”, “Low-input”, “Medium-input”, “High-input”) follows common practices in the experimental ecology literature, where treatments with different levels of fertilization (or nutrient input) are compared for effects on plant diversity and productivity [83,84].
Ordination analysis was performed by PCoA (Principal Coordinates Analysis), using the Sørensen (Bray–Curtis) distance, a method frequently applied in ecology to compare plant communities based on floristic composition. The choice of PCoA was based on its advantages over iterative methods such as NMDS, as it provides a unique and reproducible solution, with direct interpretation of distances between samples. In addition, the Bray–Curtis distance is considered one of the most robust dissimilarity measures for vegetation data, being widely used in recent studies of fertilization and management of grasslands and soils [85,86,87]. For each experimental variant, vectors corresponding to fertilization levels (zero, low, medium, high) and input type (organic or mineral) were drawn. The vectors were normalized, and their significance was tested by permutations (n = 999). PC-ORD offers ordination options based on Bray-Curtis distances, overlays or joint plots, and randomization tests, which makes the choice to use vectors corresponding to fertilization levels consistent with good methodological practices [80,88]. The first two ordination axes were retained for interpretation, as they together explained over 95% of the variation in floristic composition.
To test the differences between the groups identified by cluster and ordination analysis, MRPP (Multi-Response Permutation Procedure) analysis was applied. Statistical significance was assessed at the α = 0.05 level. Additionaly, Indicator Species Analysis (ISA) [89]; was used to identify the species characteristic of each grassland group. For each experimental treatment, α diversity indices were calculated – species richness (S), Shannon–Wiener index (H′), species evenness (E) and Simpson index (D). These indices are widely used in grassland ecology studies, being considered robust tools for assessing the diversity and balance of plant communities [47,90,91,92]. The formulas for these indices are standard in community ecology [93] and were calculated based on relative abundance data. Differences between treatments were tested by one-way ANOVA and scored for significant differences by the LSD test (p < 0.05).
5. Conclusions
The study demonstrates that fertilization intensity is the main determinant of the structure and diversity of high nature value (HNV) grasslands. Cluster and ordination analyses revealed clear separation of communities along the input gradient, from oligotrophic grasslands dominated by stress-tolerant species to mesotrophic systems characterized by competitive grasses.
The results confirm that moderate fertilization, both organic (10–20 t ha⁻¹ cattle manure) and mineral (N50P50K50–N100P100K100), maximizes species richness and floristic diversity, by maintaining a balance between competing species and those adapted to restrictive conditions. Conversely, the total absence of inputs or the application of excessive doses causes a reduction in biodiversity, favoring the dominance of a few tolerant or competitive species. ISA analyses have highlighted the role of indicator species in diagnosing the agrochemical state and in delimiting oligotrophic, mesotrophic and eutrophic communities.
At the applied level, a clear definition of oligotrophic grasslands is essential for guiding sustainable management strategies and for maintaining the HNV character of these ecosystems. The results show that moderate input can represent a viable compromise between productivity and biodiversity conservation, maintaining the HNV character of grasslands. The identification of species with indicator value for each level of intensification provides a useful tool for monitoring changes and implementing adaptive management strategies.
The controlled application of organic and mineral fertilizers, below critical thresholds, emerges as an effective solution for the sustainable use of mountain resources, while contributing to the preservation of essential ecosystem services. Semi-natural HNV grasslands, especially those located on disadvantaged lands, should be mowed at least once every 4–5 years to avoid biodiversity loss and structural degradation of the vegetation cover
Author: Contributions Conceptualization, S.C. and V.V.; methodology, S.C. and V.V.; software, N.A.I. and G.B.; validation, S.C., N.A.I. and B.G.; formal analysis, S.C. and N.A.I. writing—original draft preparation, S.C. and V.V.; writing—review and editing, S.C., V.V. and N.A.I.; supervision, S.C., N.A.I. and B.G. All authors have read and agreed to the published version of the manuscript.
Funding
This work was supported from Ion Ionescu de la Brad, Iasi University of Life Sciences.
Data Availability Statement
No new data were created or analyzed in this study.
Conflicts of Interest
The authors declare no conflicts of interest.
References
- Buchmann, N.; Fuchs, K.; Feigenwinter, I.; Gilgen, A.K. Multifunctionality of Permanent Grasslands: Ecosystem Services and Resilience to Climate Change. In Grassland Science in Europe; European Grassland Federation; Zurich, Switzerland, 2019; Vol. 24, 19–26.
- Lomba, A.; McCracken, D.; Herzon, I. High Nature Value Farming Systems in Europe. Ecology and Society 2023, 1;28(2).
- Liu, S.; Ward, S.E.; Wilby, A.; Manning, P.; Gong, M.; Davies, J.; Killick, R.; Quinton, J.N.; Bardgett, R.D. Multiple Targeted Grassland Restoration Interventions Enhance Ecosystem Service Multifunctionality. Nature Communications 2025, 28;16(1):1-1.
- Marușca, T.; Păcurar, F.S.; Scrob, N.; Vaida, I.; Nicola, N.; Taulescu, E.; Dragoș, M.; Lukács, Z. Contributions to the Assessment of Grasslands Productivity of the Apuseni Natural Park (Rosci 0002. Romanian Journal of Grassland and Forage Crops 2021, 24.
- Michler, B.; Rotar, I.; Păcurar, F. Biodiversity and Conservation of Medicinal Plants: A Case Study in the Apuseni Mountains in Romania. Buletinul USAMV-CN 2006, 62, 86–87.
- Jakobsson, S.; Envall, I.; Bengtsson, J.; Rundlöf, M.; Svensson, M.; Åberg, C.; Lindborg, R. Effects on Biodiversity in Semi-Natural Pastures of Giving the Grazing Animals Access to Additional Nutrient Sources: A Systematic Review. Environmental Evidence 2024, 1;13(1):18.
- Sângeorzan, D.; Rotar, I.; Păcurar, F.; Vaida, I.; Suteu, A.; Deac, V. The definition of oligotrophic grasslands. Rom. J. Grassl. Forage Crops 2018, 2018.
- Vaida, I.; Păcurar, F.; Rotar, I.; Tomoş, L.; Stoian, V. Changes in Diversity Due to Long-Term Management in a High Natural Value Grassland. Plants 2021, 10, 739, doi:10.3390/plants10040739.
- Maruşca T, Păcurar FS, Taulescu E, Vaida I, Nicola N, Scrob N, Dragoș MM. Indicative species for the agrochemical properties of mountain grasslands soil from the apuseni natural park (rosci 0002). Romanian Journal of Grasslands and Forage Crops. 2022;31.
- Păcurar, F. Specii indicator pentru evaluarea şi elaborarea managementului sistemelor de pajişti cu înaltă valoare natu-rală-HNV. Casa Cărţii de Ştiinţă 2020.
- Diviaková, A.; Ollerová, H.; Stašiov, S.; Veverková, D.; Novikmec, M. Plant Functional Structure Varies across Different Management Regimes in Submontane Meadows. Nature Conservation 2024, 13;56, 181–200.
- Fernández-Guisuraga, J.M.; Fernández-García, V.; Tárrega, R.; Marcos, E.; Valbuena, L.; Pinto, R.; Monte, P.; Beltrán, D.; Huerta, S.; Calvo, L. Transhumant Sheep Grazing Enhances Ecosystem Multifunctionality in Productive Mountain Grasslands: A Case Study in the Cantabrian Mountains. Frontiers in Ecology and Evolution 2022, 12;10, 861611.
- Gaga, I.; Rotar, I.; Păcurar, F.S.; Plesa, A.D.; Vaida, I. Study of Grassland Types from the Agricultural Research-Development Station (Ards) Turda. Romanian Journal of Grasslands and Forage Crops 2020, 21.
- Vaida, I.; Rotar, I.; Păcurar, F.; Vidican, R.; Pleşa, A.; Mălinaş, A.; Stoian, V. Impact on the Abandonment of Semi-Natural Grasslands from Apuseni Mountains. Bulletin of the University of Agricultural Sciences & Veterinary Medicine Cluj-Napoca. Agriculture 2016, 1;73(2.
- Păcurar, F.; Rotar, I.; Pleșa, A.; Balázsi, Á.; Vidican, R. Study of the Floristic Composition of Certain Secondary Grasslands in Different Successional Stages as a Result of Abandonment. Print ISSN 1843-5246; Elec-tronic ISSN 1843-5386, DOI 2015, 72, 11165.
- Reif, A.; Ruşdea, E.; Păcurar, F.; Rotar, I.; Brinkmann, K. A Traditional Cultural Landscape in Transformation. Mountain Research and Development 2008, 28, 18–22, doi:10.1659/mrd.0806.
- Rușdea, E.; Reif, A.; Höchtl, F.; Păcurar, F.; Rotar, I.; Stoie, A.; Dahlström, A.; Svensson, R.; Aronsson, M. Grassland Vegetation and Management-on the Interface between Science and Education. Bulletin of University of Agricultural Sciences and Veterinary Medicine Cluj-Napoca: Agriculture 2011, 68.
- Balazsi, A., Rotar I., Păcurar F., Vidican R., Pleșa A., Gliga A., Mălinaș A. Mulching and mulching with organic fertilizing as an alternative way to conserve the oligotrophy grasslands’ phytodiversity and maintain their productivity in Apuseni Mountains. Romanian Journal of Grasslands and Forage Crops 2014, 9, 7.
- Connell, J.H. Diversity in Tropical Rain Forests and Coral Reefs. Science 1978, 199, 1302–1310, doi:10.1126/science.199.4335.1302.
- Tilman, D. Secondary Succession and the Pattern of Plant Dominance along Experimental Nitrogen Gradients. Ecol. Monogr 1987, 57, 189–214, doi:10.2307/2937080.
- Biswas, M., SR; A.U. Disturbance Effects on Species Diversity and Functional Diversity in Riparian and Upland Plant Com-Munities. Ecology 2010, Jan;91(1):28-35.
- Zhang, C.; Xu, H.; Li, S. Revealing Ecotype Influences on Cistanche Sinensis Distribution and Diversity. Frontiers in Plant Science 2023, 14, 10394521, doi:10.3389/fpls.2023.10394521.
- Păcurar, F.; Balázsi, Á.; Rotar, I.; Vaida, I.; Reif, A.; Vidican, R.; Ruşdea, E.; Stoian, V.; Sângeorzan, D. Technologies Used for Maintaining Oligotrophic Grasslands and Their Biodiversity in a Mountain Landscape. Romanian Biotechnological Letters 2018, 23, 13614–13623, doi:10.25083/rbl/23.3/13614.13623.
- Rotar, I.; Păcurar, F.; Vaida, I.; Nicola, N.; Pleșa, A. The Effect of Mulching on a Grasslands in the Apuseni Mountains. Romanian Journal of Grasslands and Forage Crops 2023, 28.
- Zarzycki, J.; Józefowska, A.; Kopeć, M. Can Mulching or Composting Be Applied to Maintain Semi-Natural Grassland Managed for Biodiversity? Journal for Nature Conservation 2024, 1;78, 126584.
- Vaida, I.; Rotar, I.; Păcurar, F. The Cumulative Effect of Manure on a Festuca Rubra Grasslands for 15 Years. Bulletin of the University of Agricultural Sciences & Veterinary Medicine Cluj-Napoca. Agriculture 2017, 1;74(2).
- Rotar, I.; Vaida, I.; Păcurar, F. Species with Indicative Values for the Management of the Mountain Grasslands. Romanian Agri-cultural Research 2020, 1.
- Samuil, C.; Vintu, S.C.; M, S. Influence of Fertilizers on the Biodiversity of Semi-natural Grassland in the Eastern Carpathians, Notulae Botanicae Horti Agrobotanici Cluj-Napoca 2013, 41, 195–200.
- Samuil, C.; Vîntu, V.; Sîrbu, C.; Saghin, G.; Popovici, C. The Influence of Mineral and Organic Fertilization on Temporary Grasslands in North-Eastern Romania. Romanian Agricultural Research 2014, 31, 91–99.
- Vîntu V.; Samuil C.; Sirbu C.; Popovici C.I.; Stavarache M.; Sustainable Management of Nardus stricta L. Grasslands in Ro-mania’s Carpathians, Notulae Botanicae Horti Agrobotanici Cluj-Napoca 2011, 39, 142–145.
- Corcoz, L.; Păcurar, F.; Pop-Moldovan, V.; Vaida, I.; Pleșa, A.; Stoian, V.; Vidican, R. Long-Term Fertilization Alters Mycorrhizal Colo-Nization Strategy in the Roots of Agrostis Capillaris. Agriculture 2022, 12;12(6):847.
- Stoian, V.; Vidican, R.; Păcurar, F.; Corcoz, L.; Pop-Moldovan, V.; Vaida, I.; Vâtcă, S.-D.; Stoian, V.A.; Plesa, A. Exploration of Soil Functional Microbiomes - A Concept Proposal for Long-Term Fertilized Grasslands. Plants 1253, 2022, 11, doi:10.3390/plants11091253.
- Mălinas, A.; Rotar, I.; Vidican, R.; Iuga, V.; Păcurar, F.; Mălinas, C.; Moldovan, C. Designing a Sustainable Temporary Grassland System by Monitoring Nitrogen Use Efficiency. Agronomy 2020, 19;10(1):149.
- Balazsi, A.; Păcurar, F.; Mihu-Pintilie, A.; Konold, W. How Do Public Institutions on Nature Conservation and Agriculture Contribute to the Conservation of Species-Rich Hay Meadows? International Journal of Conservation Science 2018, 9, 549–564.
- Sângeorzan, D.D.; Păcurar, F.; Reif, A.; Weinacker, H.; Ruşdea, E.; Vaida, I.; Rotar, I. Detection and Quantification of Arnica Montana L. Inflorescences in Grassland Ecosystems Using Convolutional Neural Networks and Drone-Based Remote Sensing. Remote Sensing 2024, 16, doi:10.3390/rs16112012.
- Janišová, M.; Škodová, I.; Magnes, M.; Iuga, A.; Biro, A.-S.; Ivașcu, C.M.; Ďuricová, V.; Buzhdygan, O.Y. Role of Livestock and Traditional Management Practices in Maintaining High Nature Value Grasslands. Biological Conservation 2025, 309, 111301.
- Hagemann, N.; Gerling, C.; Hölting, L.; Kernecker, M.; Markova-Nenova, N.N.; Wätzold, F.; Wendler, J.; Cord, A.F. Improving Re-Sult-Based Schemes for Nature Conservation in Agricultural Landscapes—Challenges and Best Practices from Selected European Countries. Regional Environmental Change 2025, Mar;25(1):12.
- Păcurar, F.; Reif, A.; Rusḑea, E. Conservation of Oligotrophic Grassland of High Nature Value (HNV) through Sustainable Use of Arnica Montana in the Apuseni Mountains, Romania. InMedicinal Agroecology 2023.
- Elliott, J.; Tindale, S.; Outhwaite, S.; Nicholson, F.; Newell-Price, P.; Sari, N.H.; Hunter, E.; Sánchez-Zamora, P.; Jin, S.; Gallardo-Cobos, R.; et al. European Permanent Grasslands: A Systematic Review of Economic Drivers of Change, Including a Detailed Analysis of the Czech Republic 2024, 21;13(1):116.
- Sattler, C.; Schrader, J.; Hüttner, M.L.; Henle, K. Effects of Management, Habitat and Landscape Characteristics on Biodiversity of Orchard Meadows in Central Europe: A Brief Review. Nature Conservation 2024, 28;55, 103–134.
- Rocha-Filho, L.C.; Santos, J.L.; Pereira, B.A. The Initial Impact of a Hydroelectric Reservoir on Tree Community Structure. Forests 2025, 16, 1236, doi:10.3390/f16081236.
- Gaga I.; Păcurar, F.; Vaida, I.; Plesa, A.; Rotar, I. Responses of Diversity and Productivity to Organo-Mineral Fertilizer Inputs in a High-Natural-Value Grassland, Transylvanian Plain, Romania. Plants 2022, 11, doi:10.3390/plants11151975.
- Shi, T.S.; Collins, S.L.; Yu, K.; Peñuelas, J.; Sardans, J.; Li, H.; Ye, J.S. A Global Meta-Analysis on the Effects of Organic and Inorganic Fertilization on Grasslands and Croplands. Nature Communications 2024, 22;15(1):3411.
- Titěra, J.; Pavlů, P., VV; L, H.; M, G.; J, S.; J. Response of Grassland Vegetation Composition to Different Fertilizer Treatments Recorded over Ten Years Following 64 Years of Fertilizer Applications in the Rengen Grassland Experiment. Applied Vegetation Science 2020, Jul;23(3):417-27.
- Melts, I.; Lanno, K.; Sammul, M.; Uchida, K.; Heinsoo, K.; Kull, T.; Laanisto, L. Fertilising Semi-Natural Grasslands May Cause Long-Term Negative Effects on Both Biodiversity and Ecosystem Stability. J. Appl. Ecol 2018, 55, 1851–1864, doi:10.1111/1365-2664.13129.
- Schaub, S.; Finger, R.; Leiber, F.; Probst, S.; Kreuzer, M.; Weigelt, A.; Buchmann, N.; Scherer-Lorenzen, M. Plant Diversity Effects on Forage Quality, Yield and Revenues of Semi-Natural Grasslands. Nature Communications 2020, 7;11(1):768.
- Hautier, Y.; Zhang, P.; Loreau, M.; Wilcox, K.R.; Seabloom, E.W.; Borer, E.T.; Byrnes, J.E.; Koerner, S.E.; Komatsu, K.J.; Lefcheck, J.S.; et al. General Destabilizing Effects of Eutrophication on Grassland Productivity at Multiple Spatial Scales. Nature Communications 2020, 23;11(1):5375.
- Dale, L.M.; Thewis, A.; Rotar, I.; Boudry, C.; Păcurar, F.S.; Lecler, B.; Agneessens, R.; Dardenne, P.; Baeten, V. Fertilization Effects on the Chemical Composition and in Vitro Organic Matter Digestibility of Semi-Natural Meadows as Predicted by NIR Spectrometry. Notulae Botanicae Horti Agrobotanici Cluj-Napoca 2013 b, 41, 58–64.
- Isselstein, J.; Jeangros, B.; Pavlu, V. Agronomic Aspects of Biodiversity Targeted Management of Temperate Grasslands in Europe–a Review. Agronomy research 2005, 3, 139–151.
- Samuil, C.; Stavarache, M.; Sirbu, C.; Vintu, V. Influence of sustainable fertilization on yield and quality food of Mountain Grassland. Notulae Botanicae Horti Agrobotanici Cluj-Napoca 2018, 46, 410–417.
- Rotar I, Păcurar F, Vidican R, Bogdan A. Impact of grassland management on occurrence of Arnica montana L. Grassland–a European Resource?. 2012 Aug 1:701.
- Wan, L.; LIU, G.; SU, X. Organic Fertilization Balances Biodiversity Maintenance, Grass Production, Soil Storage, Nutrient Cycling and Greenhouse Gas Emissions for Sustainable Grassland Development in China: A Meta-Analysis. Agriculture, Ecosystems & Environment 2025, 381, 109473.
- Rotar, I.; Păcurar, F.; Pleșa, A.; Balázsi, Á. Low mineral fertilization on grassland after 6 years. Lucrări Ştiinţifice 2015, 58, 2.
- Peppler-Lisbach, C.; Kratochwil, A.; Mazalla, L.; Rosenthal, G.; Schwabe, A.; Schwane, J.; Stanik, N. Synopsis of Nardus Grassland Resurveys Across Germany: Is Eutrophication Driven by a Recovery of Soil pH After Acidification? Journal of Vegetation Science 2025, May;36(3, 70040.
- Sherstiuk, M.; Skliar, V.; Kašpar, J.; Mohammadi, Z. Size and Vitality Characteristics of Bilberry (Vaccinium Myrtillus L.) Popula-Tions in the Central Bohemian Region of the Czech Republic: A Case Study of Non-Timber Forest Products. Global Ecology and Conservation 2024, 1;56, 03295.
- Hegland, S.J.; Gillespie, M.A. Vaccinium Dwarf Shrubs Responses to Experimental Warming and Herbivory Resistance Treatment Are Species-and Context Dependent. Frontiers in Ecology and Evolution 2024, 13;12, 1347837.
- Dalle Fratte M, Cerabolini BE. Extending the Interpretation of Natura 2000 Habitat Types beyond Their Definition Can Bias Their Conservation Status Assessment: An Example with Species-Rich Nardus Grasslands (6230*. Ecological Indicators 2023, 1;156, 111113.
- Borawska-Jarmułowicz, B.; Mastalerczuk, G.; Janicka, M.; Wróbel, B. Effect of Silicon-Containing Fertilizers on the Nutritional Value of Grass–Legume Mixtures on Temporary Grasslands. Agriculture 2022, 21;12(2):145.
- Călina, J.; Călina, A.; Iancu, T.; Miluț, M.; Croitoru, A.C. Research on the Influence of Fertilization System on the Production and Sustainability of Temporary Grasslands from Romania. Agronomy 2022, 27;12(12):2979.
- Bobbink, R. Review and Revision of Empirical Critical Loads and Dose-Response Relationships. UNECE Workshop on the Review and Revision of Empirical Critical Loads and Dose-response Relationships. RIVM 2011.
- Nazare A.I., Stavarache M., Samuil C., Vîntu V. The Improvement of Nardus Stricta L. Permanent Meadow from the Dorna Depression through Mineral and Organic Fertilization. Scientific Papers. Series A. Agronomy 2024, 1;67(2.
- Zornić, V.; Petrović, M.; Babić, S.; Lazarević, Đ.; Đurović, V.; Sokolović, D.; Tomić, D. NPK fertilizer addition effect on „Nardus stricta” type grassland in kopaonik mountine. In Proceedings of the 1st International Symposium On Biotechnology, Proceedings, 2023.
- Păcurar, F.; Rotar, I.; Reif, A.; Vidican, R.; Stoian, V.; Gärtner, S.M.; Allen, R.B. Impact of Climate on Vegetation Change in a Mountain Grassland – Succession and Fluctuation. Notulae Botanicae Horti Agrobotanici Cluj-Napoca 2014, 42, 347–356, doi:10.15835/nbha4229578.
- Zhu, K.; Song, Y.; Lesage, J.C.; Luong, J.C.; Bartolome, J.W.; Chiariello, N.R.; Dudney, J.; Field, C.B.; Hallett, L.M.; Hammond, M.; et al. Rapid Shifts in Grassland Communities Driven by Climate Change. Nature Ecology & Evolution 2024, Dec;8(12):2252-64.
- Movedi, E.; Bocchi, S.; Paleari, L.; Vesely, F.M.; Vagge, I.; Confalonieri, R. Impacts of Climate Change on Semi-Natural Alpine Pastures Productivity and Floristic Composition. Regional Environmental Change 2023, Dec;23(4):159.
- Straffelini, E.; Luo, J.; Tarolli, P. Climate Change Is Threatening Mountain Grasslands and Their Cultural Ecosystem Services. Catena 2024, 30;237, 107802.
- Poláková J, Maroušková A, Holec J, Kolářová M, Janků J. Changes in grassland area in lowlands and marginal uplands: Medium-term differences and potential for carbon farming. Soil & Water Res. 2023;18, 245. 10.17221/65/2023.
- Hünig, C.; Benzler, A. The monitoring of agricultural land with high natural value in Germany., BfN - Skripten (Bundesamt für Naturschutz 2017, 196.
- Butz, R.J.; Dennis, A.; Millar, C.I.; Westfall, R.D. Global Observation Research Initiative in Alpine Environments (GLORIA): Results from Four Target Regions in California. InAGU fall meeting abstracts 2008, Dec, Vol. 2008, 21–0705.
- Socher, S.A.; Prati, D.; Boch, S.; Müller, J.; Baumbach, H.; Gockel, S.; Hemp, A.; Schöning, I.; Wells, K.; Buscot, F.; et al. Interacting Effects of Fertilization, Mowing and Grazing on Plant Species Diversity of 1500 Grasslands in Germany Differ between Regions. Basic and Applied Ecology 2013, 1;14(2):126-36.
- Dale, L.M.; Thewis, A.; Boudry, C.; Rotar, I.; Păcurar, F.S.; Abbas, O.; Dardenne, P.; Baeten, V.; Pfister, J.; Fernández Pierna, J.A. Discrimination of Grassland Species and Their Classification in Botanical Families by Laboratory Scale NIR Hyperspectral Imaging: Preliminary Results. Talanta 2013 a 116, 149–154, doi:10.1016/j.talanta.2013.05.006.
- Kagan, K.; Jonak, K.; Wolińska, A. The Impact of Reduced N Fertilization Rates According to the “Farm to Fork” Strategy on the Environment and Human Health. Applied Sciences 2024, 20;14(22):10726.
- Villa-Galaviz, E.; Smart, S.M.; Ward, S.E.; Fraser, M.D.; Memmott, J. Fertilization Using Manure Minimizes the Trade-Offs between Biodiversity and Forage Production in Agri-Environment Scheme Grasslands. Plos one 2023, 4;18(10):e0290843.
- Păcurar, F.; Rotar, I.; Morea, A.; Stoie, A.; Vaida, I. Management of High Nature Value Grasslands in the Apuseni Mountains. Romanian Biotechnological Letters 2012, 17, 7164–7174.
- Stănilă, A.L.; Dumitru, M. Soils Zones in Romania and Pedogenetic Processes. Agriculture and Agricultural Science Procedia 2016, 1;10, 135–139.
- Păcurar, F.; Rotar, I. Metode de Studiu Şi Interpretare a Vegetaţiei Pajiştilor 2014.
- Fartyal, A.; Chaturvedi, R.K.; Bargali, S.S.; Bargali, K. The Relationship between Phenological Characteristics and Life Forms within Temperate Semi-Natural Grassland Ecosystems in the Central Himalaya Region of India. Plants 2025, 7;14(6):835.
- Andreatta, D.; Bachofen, C.; Dalponte, M.; Klaus, V.H.; Buchmann, N. Extracting Flowering Phenology from Grassland Species Mixtures Using Time-Lapse Cameras. Remote Sensing of Environment 2023, 1;298, 113835.
- McCune, B.; Grace, J.B. Analysis of Ecological Communities; MjM Software Design: Gleneden Beach 2002.
- McCune B., Mefford M., P.C.-O.R.D. Multivariate Analysis of Ecological data. Versiunea 6. MjM Software 2011.
- Hao, Z.; Zhang, J.; Song, B. Assessing Biological Dissimilarities between Five Forest Plots in China Using Species Abun-Dance and Phylogenetic Information. Forest Ecosystems 2019, 6, 47, doi:10.1186/s40663-019-0188-9.
- Campos, R.; Fontana, V.; Losapio, G.; Moretti, M. How Cities Impact Diversity and Ecological Networks: A Functional and Phylogenetic Perspective. Urban Ecosystems 2024, doi:10.1007/s11252-024-01551-z.
- Li, X.; Pearson, D.E.; Ortega, Y.K.; Jiang, L.; Wang, S.; Gao, Q.; Wang, D.; Hautier, Y.; Zhong, Z. Nitrogen Inputs Suppress Plant Diversity by Overriding Consumer Control. Nature Communications 2025, 1;16(1):5855.
- Caldararu, S.; Rolo, V.; Stocker, B.D.; Gimeno, T.E.; Nair, R. Ideas and Perspectives: Beyond Model Evaluation–Combining Experi-Ments and Models to Advance Terrestrial Ecosystem Science. Biogeosciences Discussions 2023, 1–22.
- Sun, Y.; Tao, C.; Deng, X.; Liu, H.; Shen, Z.; Liu, Y.; Li, R.; Shen, Q.; Geisen, S. Organic Fertilization Enhances the Resistance and Resilience of Soil Microbial Communities under Extreme Drought. Journal of Advanced Research 2023, 1;47, 1–2.
- Jaunatre, R.; Buisson, E.; Leborgne, E.; Dutoit, T. Soil Fertility and Landscape Surrounding Former Arable Fields Drive the Ecological Resilience of Mediterranean Dry Grassland Plant Communities. Frontiers in Ecology and Evolution 2023, 11.
- Manu, M.; Băncilă, R.I.; Onete, M. Soil Fauna-Indicators of Ungrazed Versus Grazed Grassland Ecosystems in Romania. Diversity 2025, 29;17(5):323.
- Peck, J. Multivariate Analysis for Community Ecologists: Stepby Step Using PC-ORD 2010.
- Dufrêne, M.; Legendre, P. Species Assemblages and Indicator Species: The Need for a Flexible Asymmetrical Approach. Ecol. Monogr 1997, 67, 345–366, doi:10.1890/0012-9615(1997)067.
- Yan, H.; Li, F.; Liu, G. Diminishing Influence of Negative Relationship between Species Richness and Evenness on the Modeling of Grassland α-Diversity Metrics. Frontiers in Ecology and Evolution 2023, 3;11, 1108739.
- Sang, Y.; Gu, H.; Meng, Q.; Men, X.; Sheng, J.; Li, N.; Wang, Z. An Evaluation of the Performance of Remote Sensing Indices as an Indication of Spatial Variability and Vegetation Diversity in Alpine Grassland. Remote Sensing 2024, 18;16(24):4726.
- Wang, J.; Liu, Y.; Oduor, A.M.; Kleunen, M.; Liu, Y. Diversity and Productivity of a Natural Grassland Decline with the Number of Global Change Factors. Journal of Plant Ecology 2025, 17, 112.
- Magurran, A.E. Measuring Biological Diversity; Oxford, UK: Blackwell Publishing, 2004; ISBN 978-0-632-05633-0.
Figure 1.
Floristic classification of the vegetation and the changes of grassland type based on cluster analysis. Legend: T1—unfertilized control; T2—abandonment; T3—mulching; T4—N50P50K50 mineral fertilization; T5—N100P100K100 mineral fertilization; T6—N150P150K150 mineral fertilization; T7—10 t ha⁻¹ cattle manure applied annually; T8—20 t ha⁻¹ cattle manure applied annually; T9—20 t ha⁻¹ cattle manure applied every two years; T10—30 t ha⁻¹ cattle manure applied annually; T11—30 t ha⁻¹ cattle manure applied every two years; R1–R4—replications. The dendrogram cutoff line was set at ~60% remaining information, resulting in four ecologically interpretable clusters.
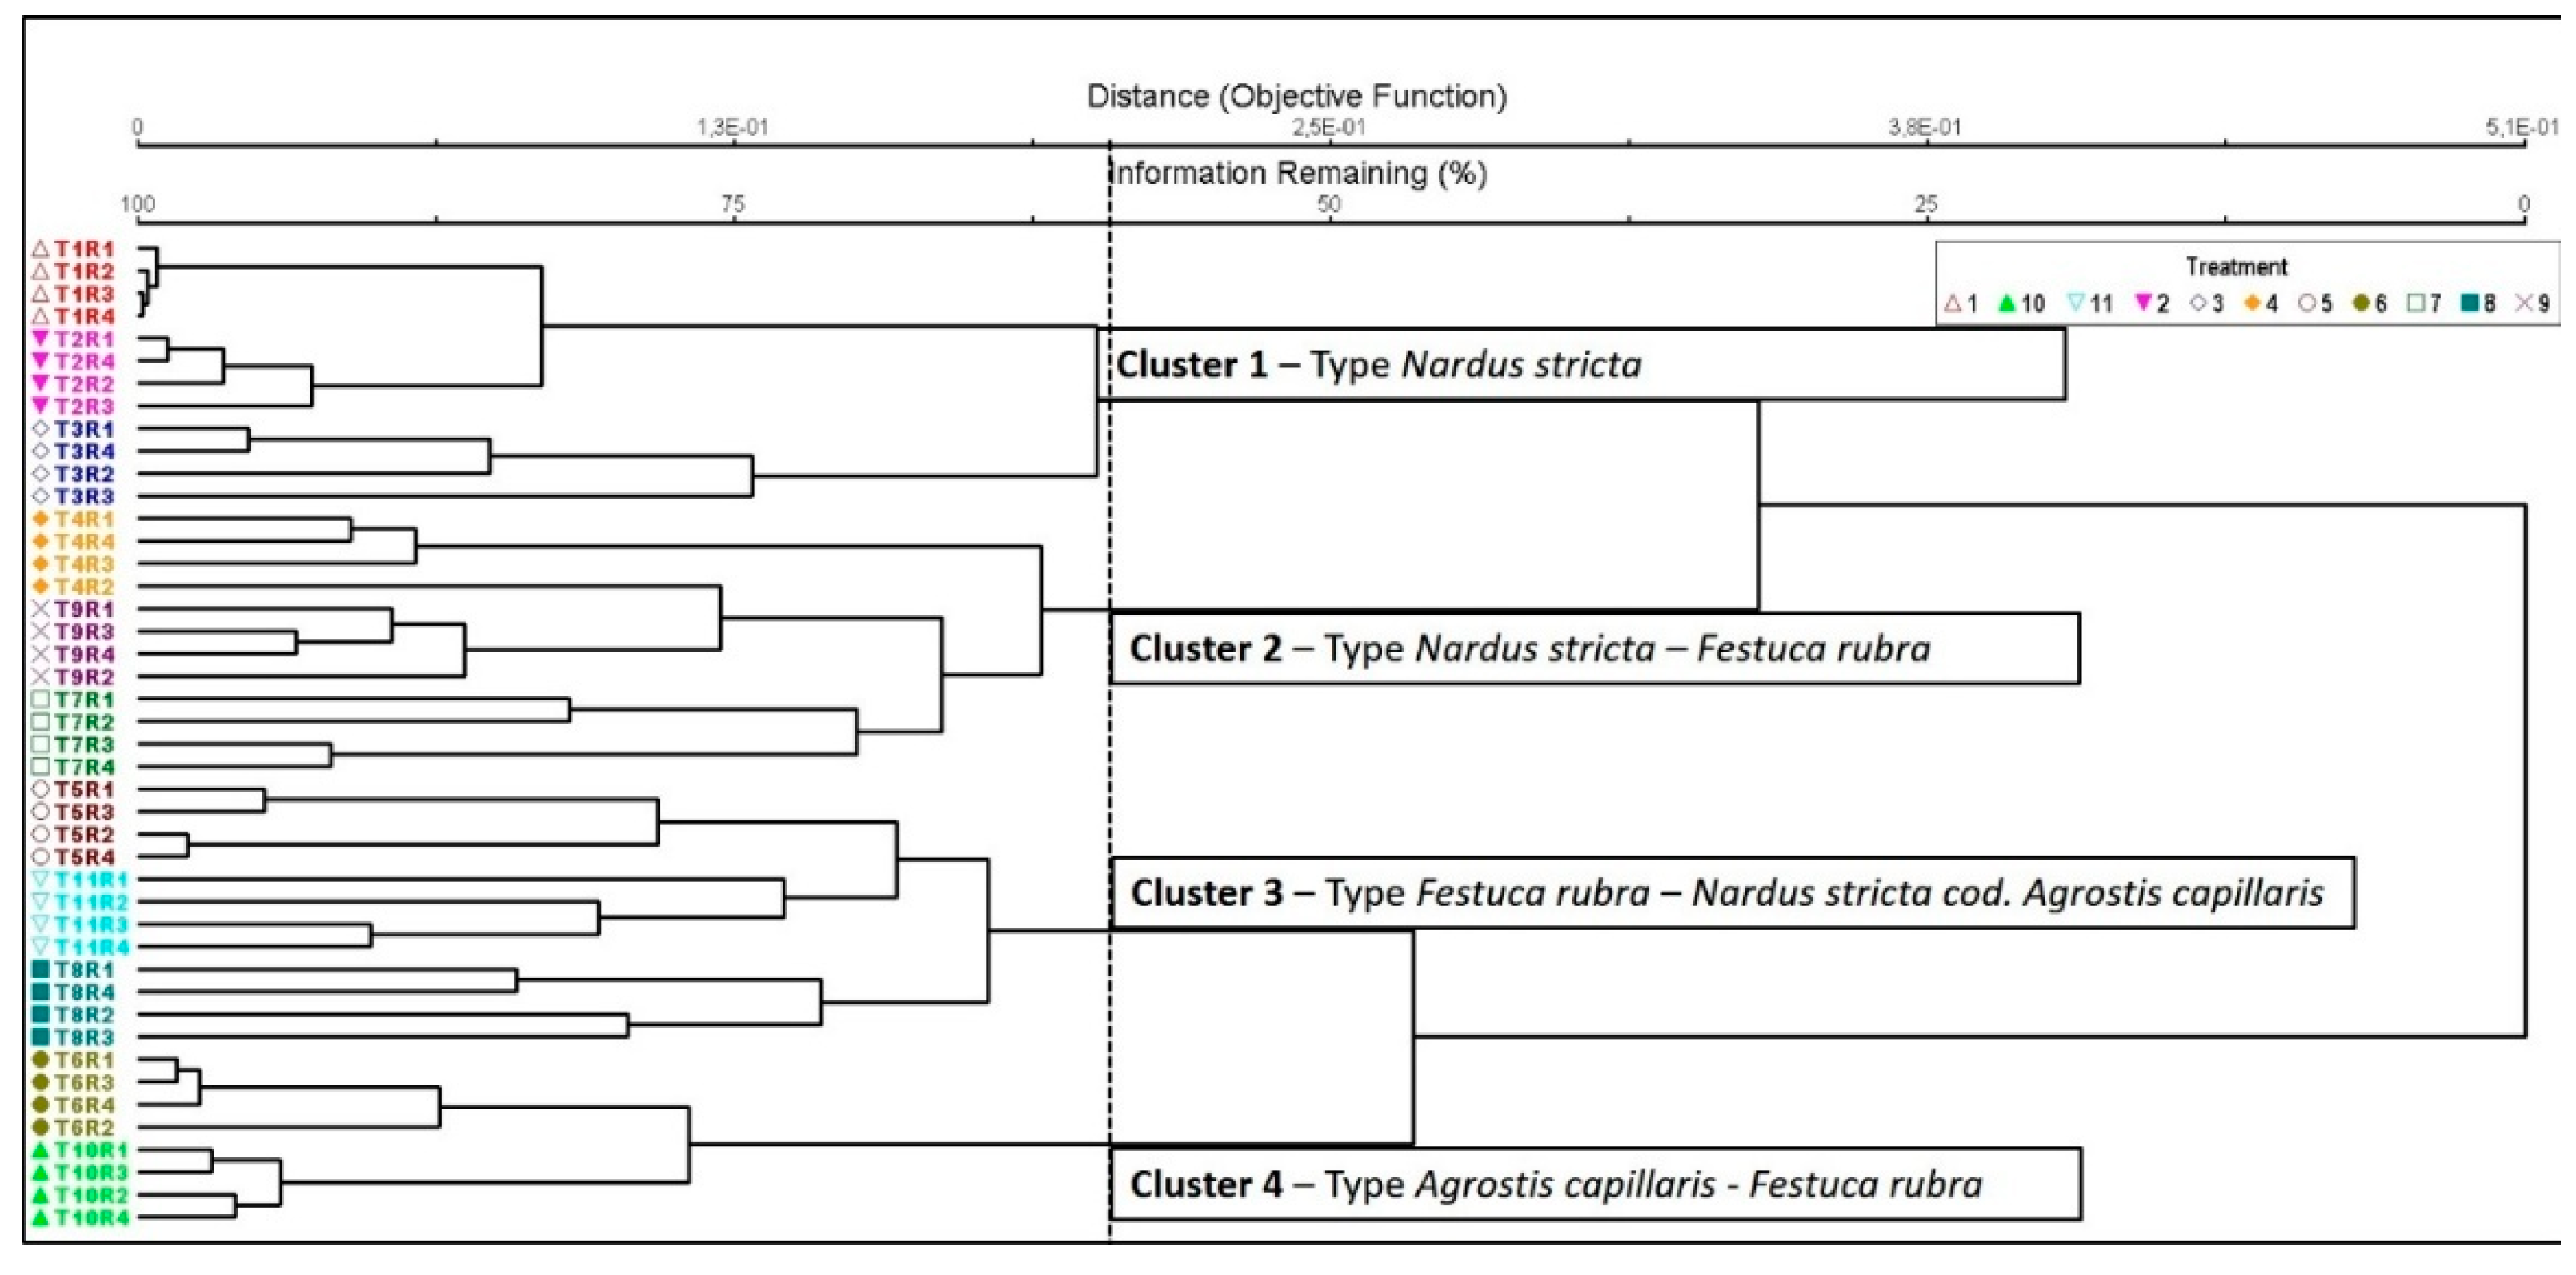
Figure 2.
Principal Coordinates Analysis (PCoA) of grassland communities under different fertilization regimes. Legend: T1—unfertilized control (martor); T2—abandonment; T3—mulching; T4—N50P50K50 mineral fertilization; T5—N100P100K100 mineral fertilization; T6—N150P150K150 mineral fertilization; T7—10 t ha⁻¹ cattle manure applied annually; T8—20 t ha⁻¹ cattle manure applied annually; T9—20 t ha⁻¹ cattle manure applied every two years; T10—30 t ha⁻¹ cattle manure applied annually; T11—30 t ha⁻¹ cattle manure applied every two years; R1–R4—replications. Vectors indicate the fertilization gradient: Zero-input (no fertilizers applied: T1–T3), Low-input (reduced doses: T4, T7), Medium-input (moderate doses: T5, T8, T9, T11), and High-input (intensive fertilization: T6, T10), with separation between organic (o) and mineral (m) treatments.
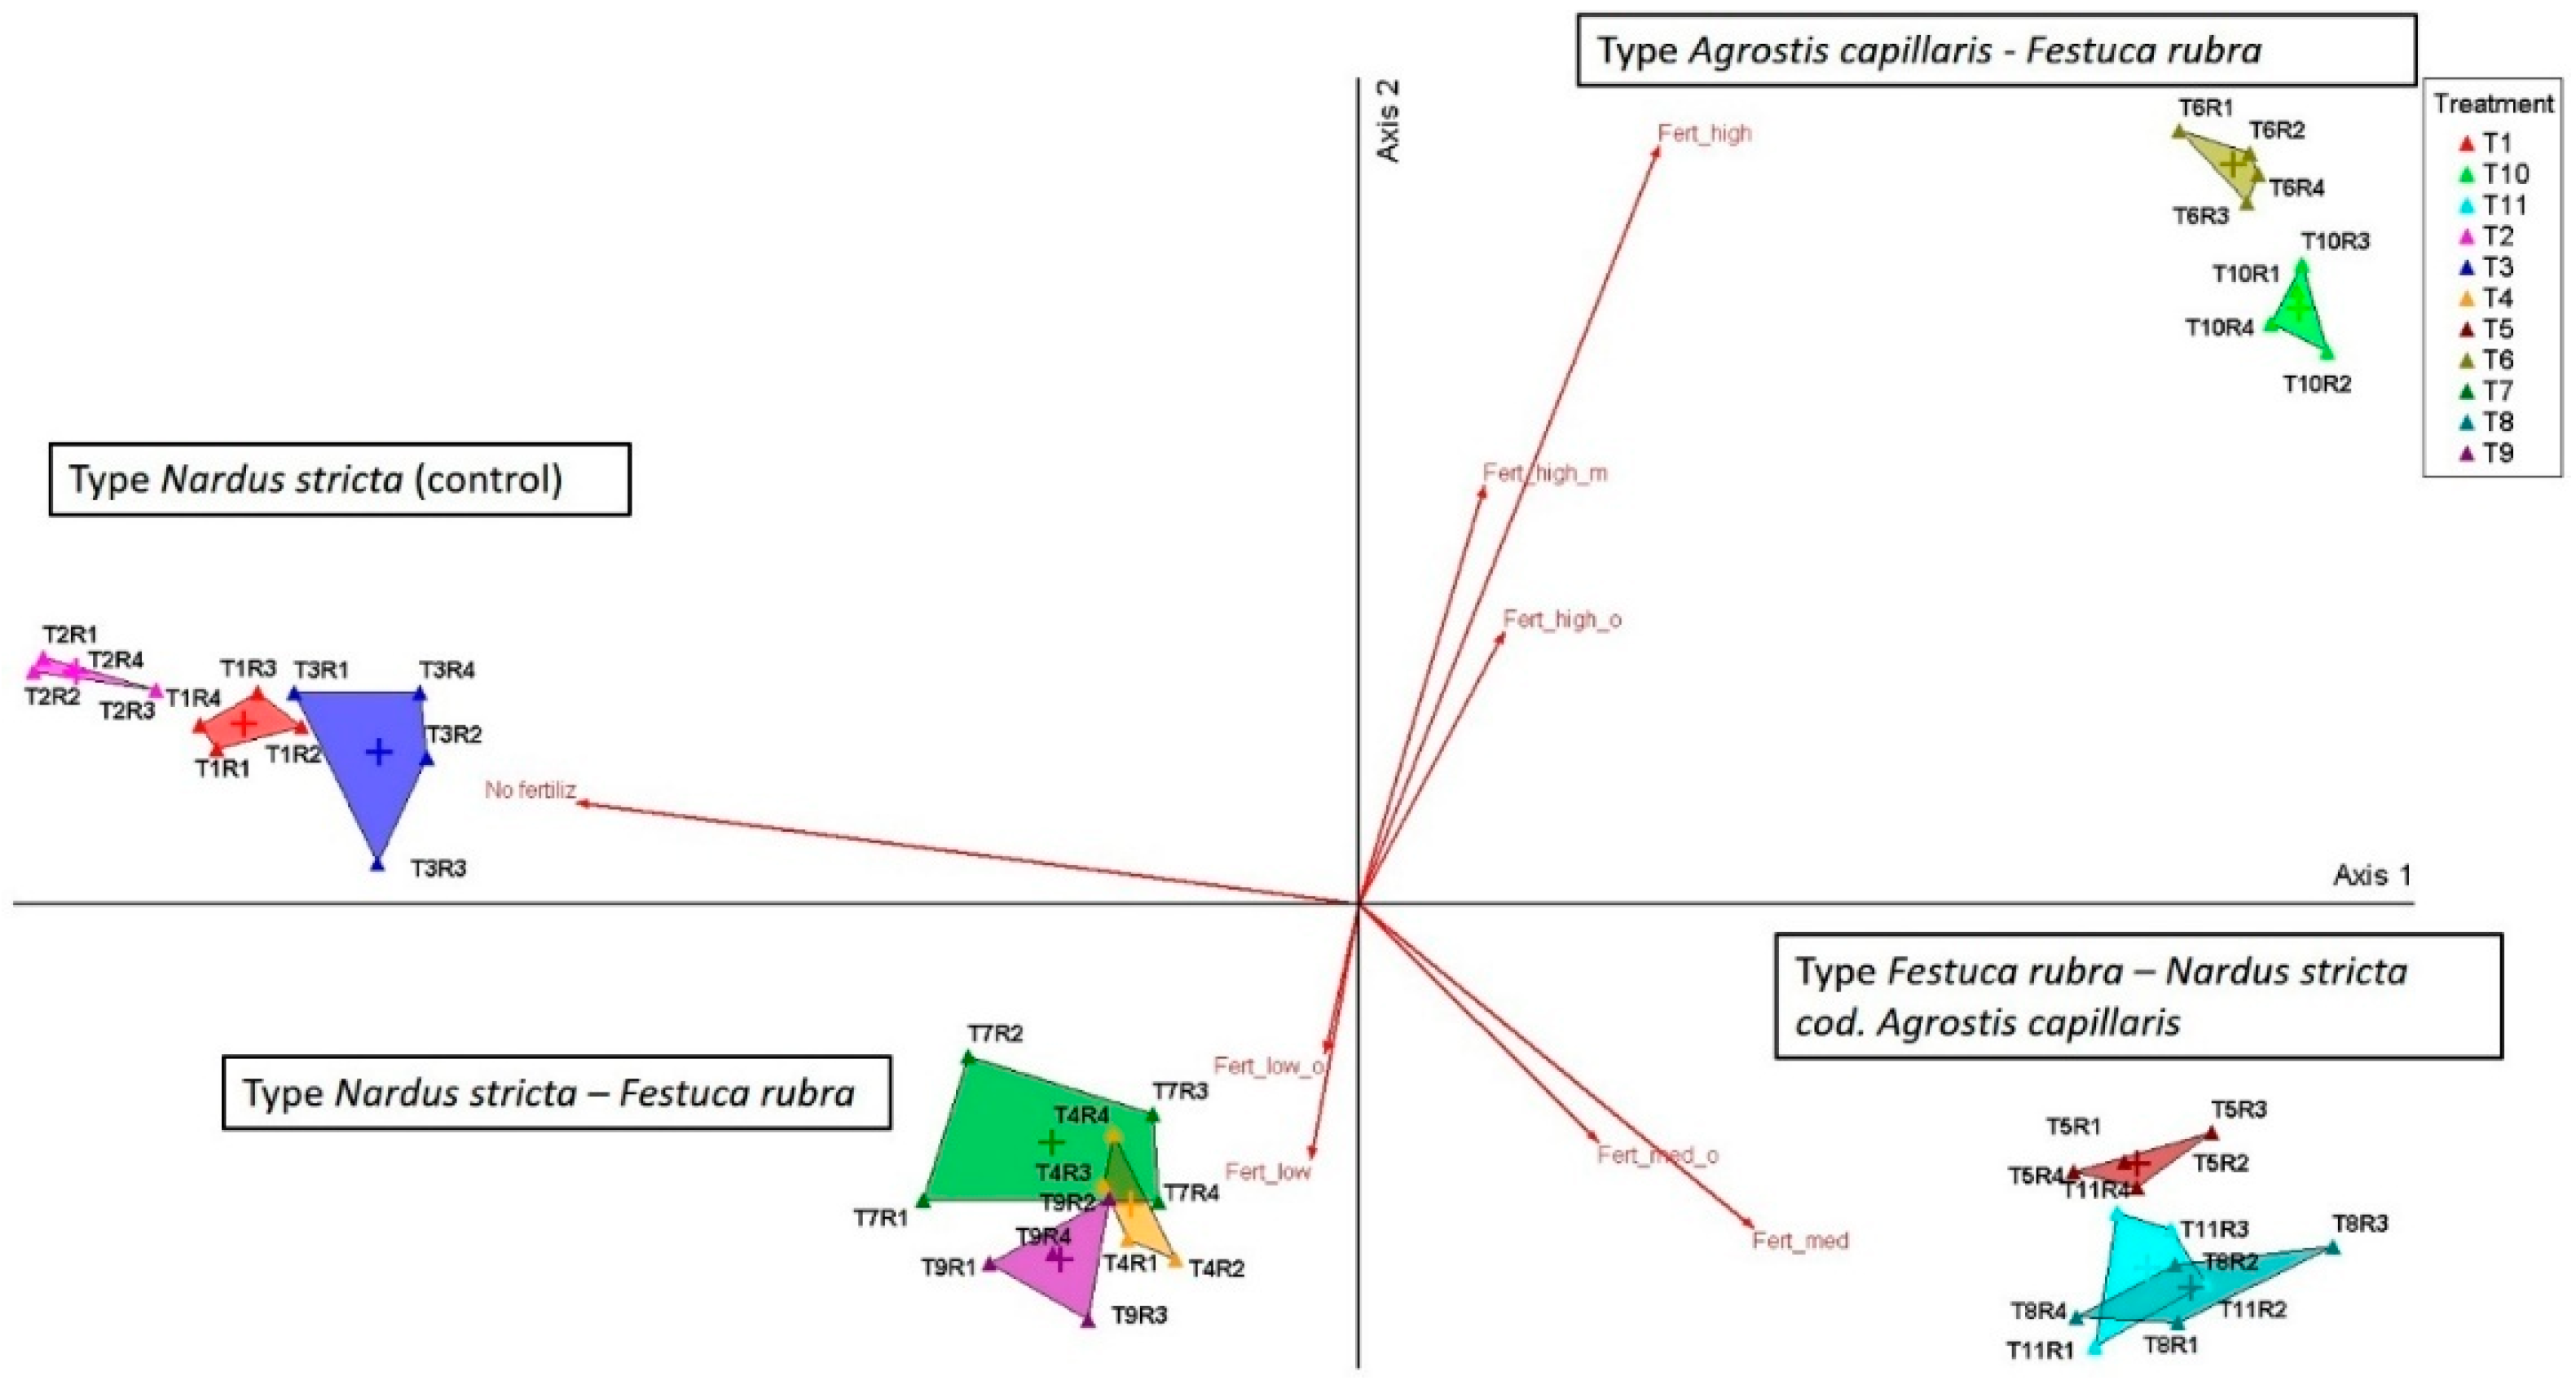
Figure 3.
Principal Coordinates Analysis (PCoA) of floristic composition in relation to fertilization treatments. Legend: No fertiliz-no fertilization -T1—unfertilized control; T2—abandonment; No fertiliz-T3—mulching; Fert_low-T4—N50P50K50 mineral fertilization; Fert_medi-T5—N100P100K100 mineral fertilization; Fert_hight - T6—N150P150K150 mineral fertilization; Fert_low_o-T7—10 t ha⁻¹ cattle manure annually; Fert_medi_o -T8—20 t ha⁻¹ cattle manure annually; Fert_medi_o - T9—20 t ha⁻¹ cattle manure applied every two years; Fert_hight_o-T10—30 t ha⁻¹ cattle manure annually; Fert_medi_o -T11—30 t ha⁻¹ cattle manure applied every two years. Species abbreviations: Agrocapi—Agrostis capillaris L.; Alchvulg—Alchemilla vulgaris L.; Achidist - Achillea distants Waldst. & Kit. ex Willd., Anthodor—Anthoxanthum odoratum L.; Brizmedi - Briza media L., Campabie—Campanula abietina Griseb. & Schenk.; Campsera-Campanula serata Kit. ex Schult.; Carepube—Carex pubescens L.; Cerasyiv—Cerastium sylvaticum L.; Cynocysi—Cynosurus cristatus L.; Crucglab- Cruciata glabra L.; Chryleuc- Leucanthemum vulgare Lam., Dactglom—Dactylis glomerata L.; Deschcaes- Deschampsia caespitosa L.; Festprat—Festuca pratensis Huds.; Festrubr—Festuca rubra L.; Hierpilo - Hieracium pilosela L., Hypemacu-Hypericum maculatum Crantz; Holclana-Holcus lanatus L; Luzumult—Luzula multiflora (Ehrh.) Lej.; Lotuscor—Lotus corniculatus L.; Nardstri-Nardus stricta L; Phleumprat-Phleum pratense L.;Planlanc—Plantago lanceolata L.; Prunvulg.- Prunella vulgaris L.; Poteerec - Potentilla erecta L., Polyvulg—Polygala vulgaris L.; Poterect—Potentilla erecta (L.) Raeusch.; Ranuacer—Ranunculus acer L.; Stellgram—Stellaria graminea L.; Taraoffi - Taraxacum officinale Weber ex F.H.Wigg., Trifprat - Trifolium pratense L., Trifrepe—Trifolium repens L.; Trifochr = Trifolium ochroleucon L., Thympule - Thymus pulegiodes L.; Verooffi—Veronica officinalis L.; Verocham - Veronica chamaedrys L., Vaccmyrt—Vaccinium myrtillus L.; Violdecl—Viola declinata L.
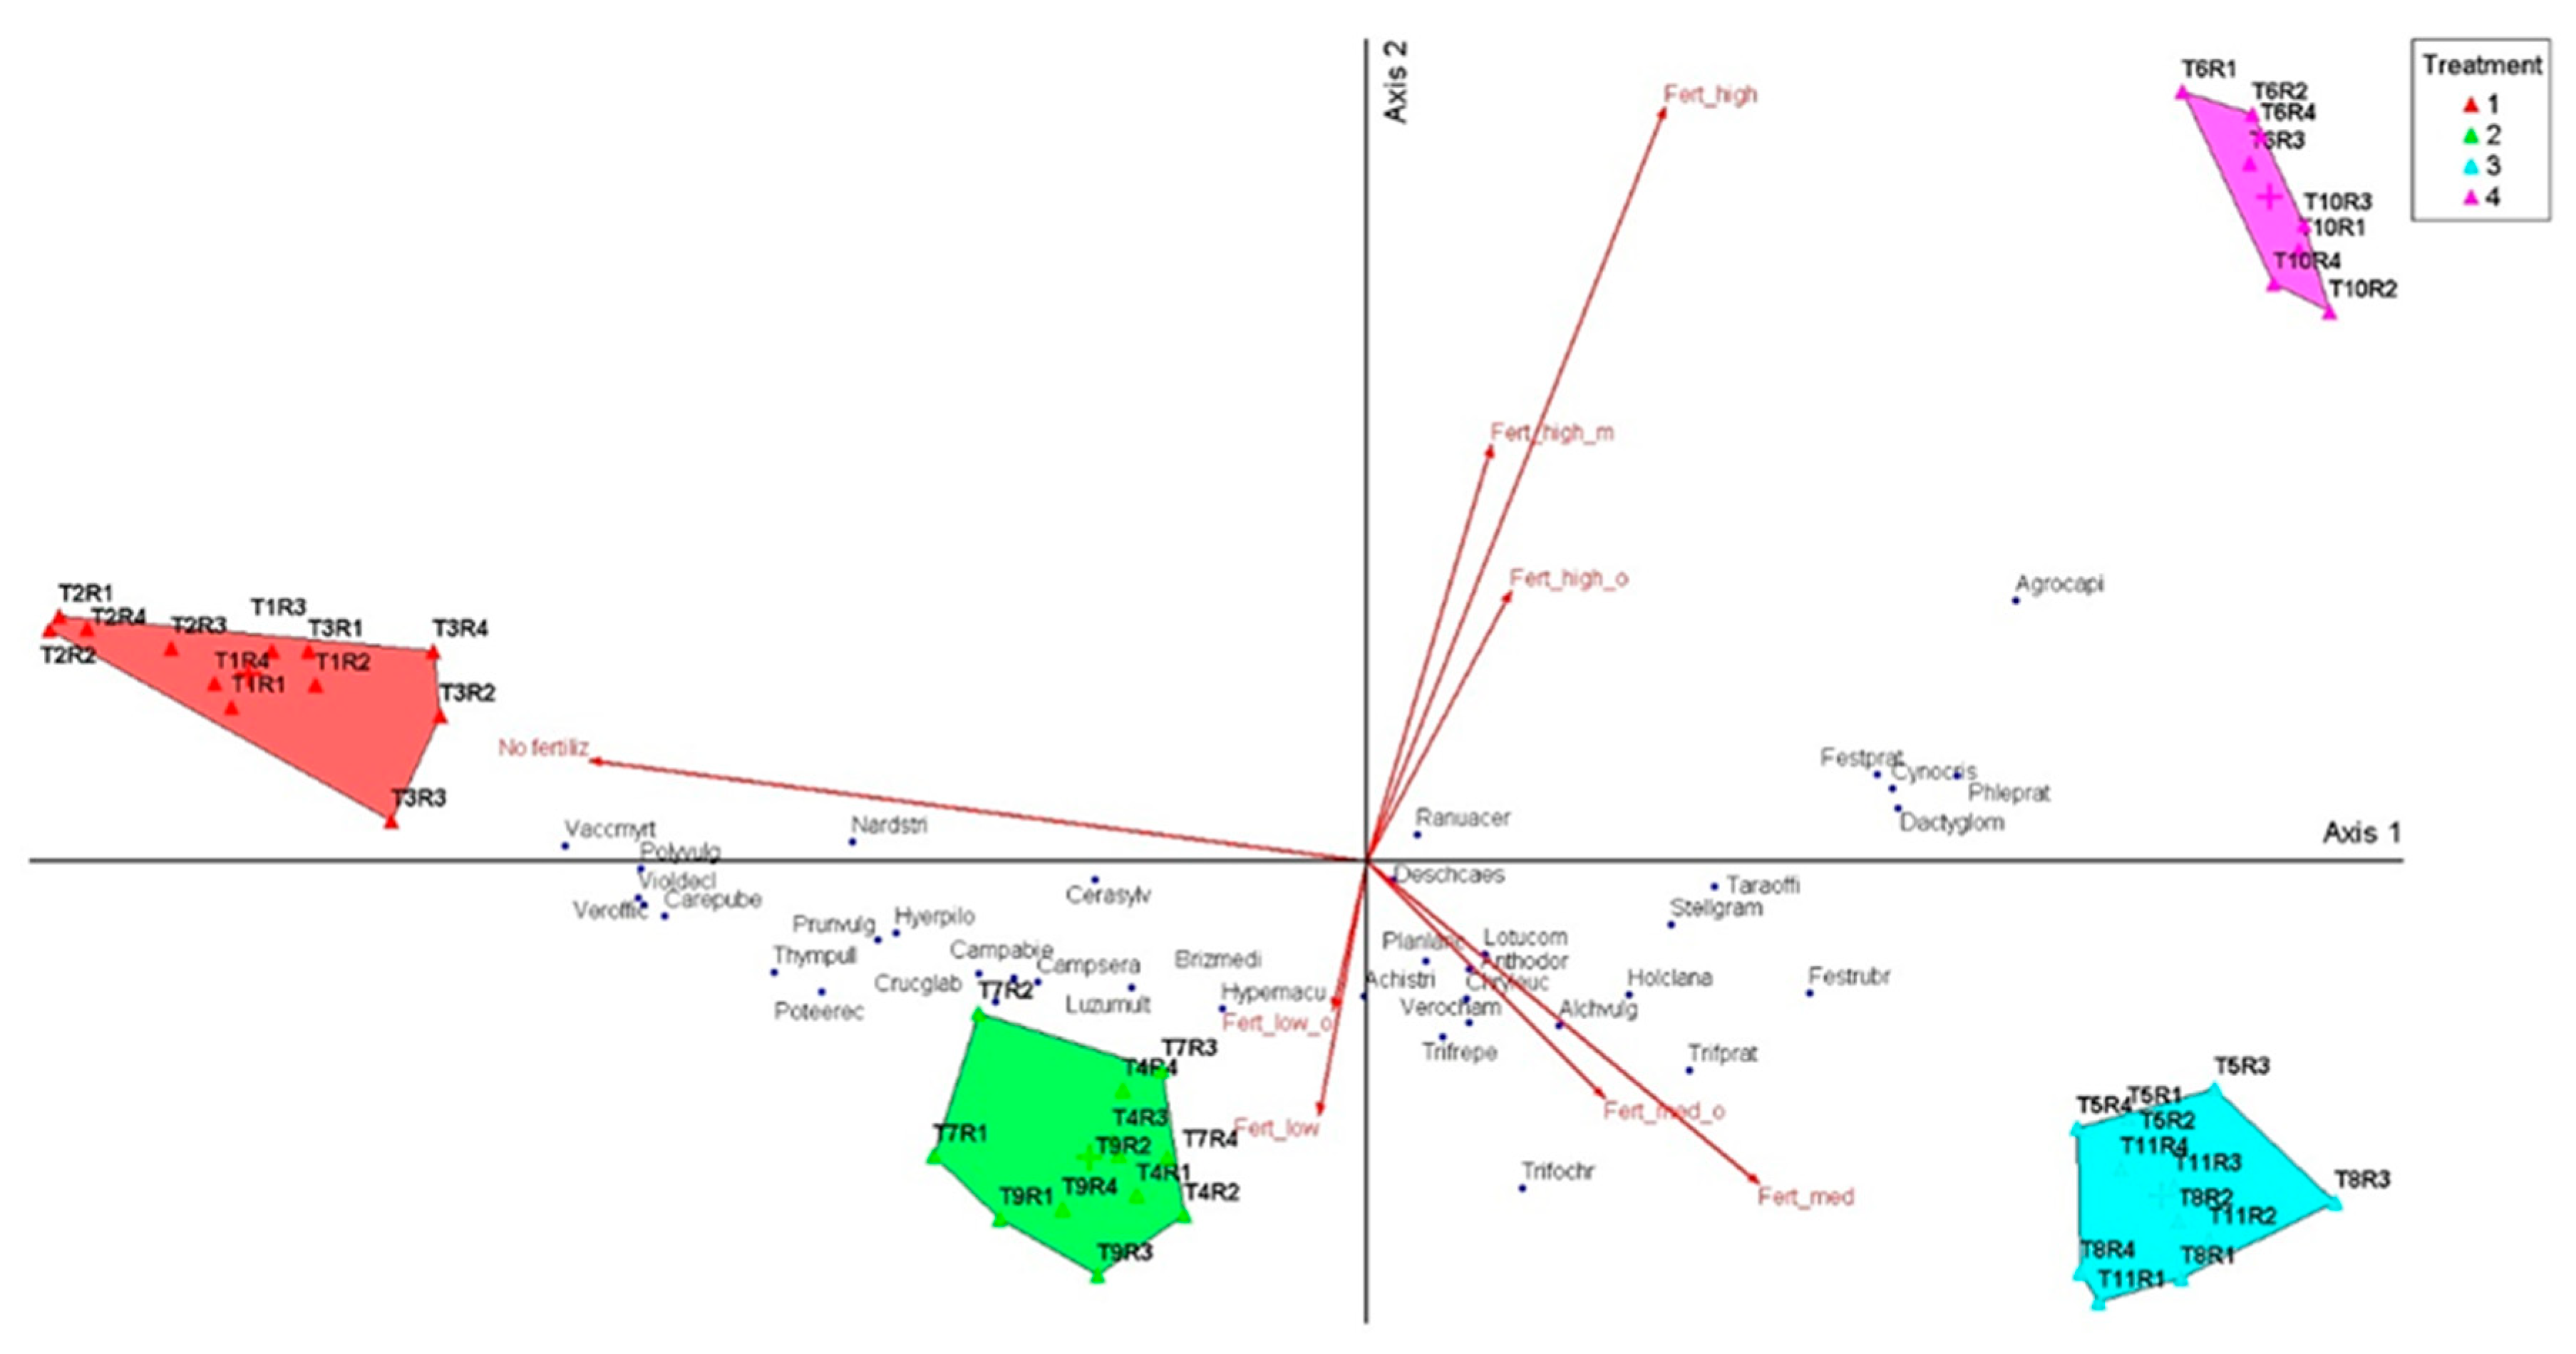
Figure 4.
Modified Braun-Blanquét scale for grasslands, based on species coverage (after [76]) Legend: 1 to 5 indicates the class of coverage; a,b,c indicates the sub-note of each class.
Figure 4.
Modified Braun-Blanquét scale for grasslands, based on species coverage (after [76]) Legend: 1 to 5 indicates the class of coverage; a,b,c indicates the sub-note of each class.
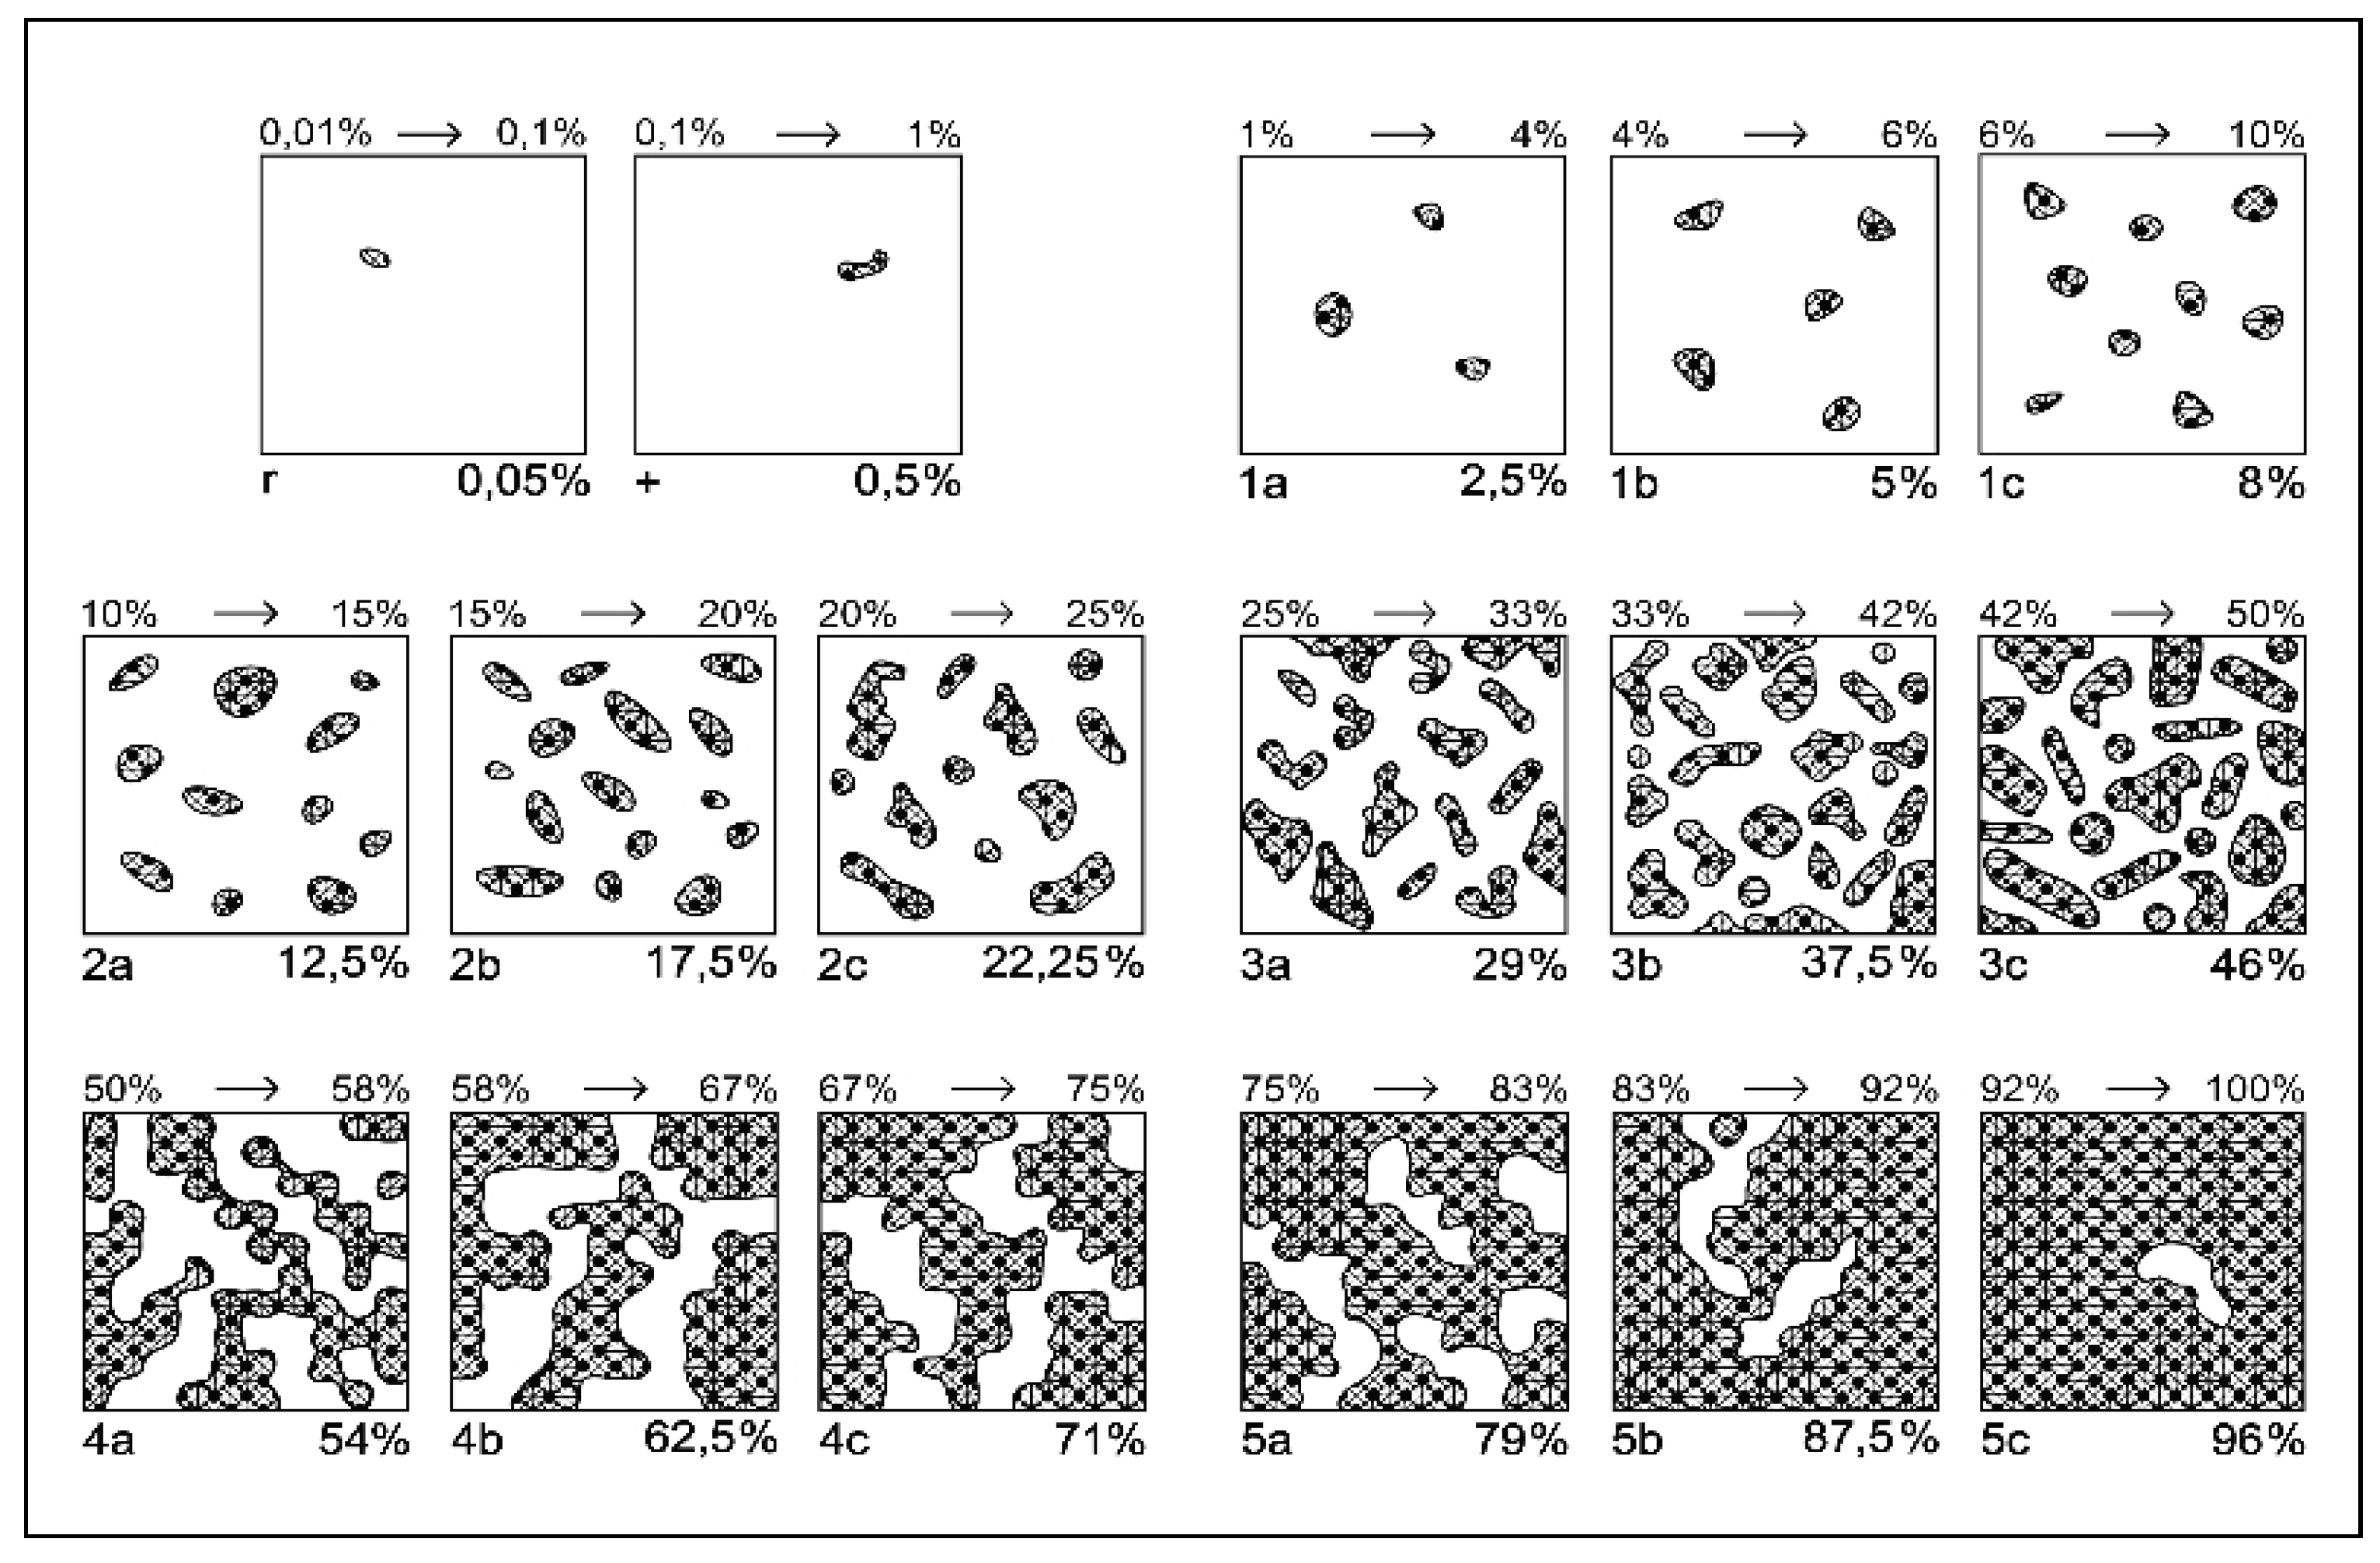

Table 1.
Correlation of experimental factors with the ordination axes (PCoA).
| Experimental factors | Axis 1 (r) | Sig. | Axis 2 (r) | Sig. |
| No fertilization (T1–T3) | −0.825 | *** | 0.224 | ns |
| Fertilization – Low (T4, T7) | 0.352 | * | −0.315 | ns |
| Fertilization – Medium (T5, T8, T9, T11) | 0.586 | ** | 0.174 | ns |
| Fertilization – High (T6, T10) | 0.512 | ** | −0.241 | ns |
| Organic inputs (all levels) | 0.468 | ** | 0.112 | ns |
| Mineral inputs (all levels) | 0.455 | ** | −0.098 | ns |
| Axis importance | 87.5% | 11.1% | ns |
Note: r—correlation coefficient between ordination distances and explanatory variables; Significance: *** p < 0.001, ** p < 0.01, * p < 0.05, ns = not significant. Axis importance indicates the proportion of total variance explained by each axis: Axis 1 = 87.5%, Axis 2 = 11.1%, cumulative = 98.6%.
Table 2.
MRPP pairwise comparisons of floristic composition between the four grassland groups.
| Groups compared | T statistic | A (within-group agreement) | p-value |
| Group 1 vs. Group 2 | −15.43 | 0.513 | <0.001 |
| Group 1 vs. Group 3 | −15.75 | 0.689 | <0.001 |
| Group 1 vs. Group 4 | −12.95 | 0.723 | <0.001 |
| Group 2 vs. Group 3 | −15.69 | 0.535 | <0.001 |
| Group 2 vs. Group 4 | −12.95 | 0.623 | <0.001 |
| Group 3 vs. Group 4 | −12.87 | 0.519 | <0.001 |
Note: T = test statistic; A = chance-corrected within-group agreement. Significance: ***p < 0.001. Group 1 = Zero-input (T1: unfertilized control, T2: abandonment, T3: mulching); Group 2 = Low-input (T4: N50P50K50, T7: 10 t ha⁻¹ manure annually, T9: 20 t ha⁻¹ manure every two years); Group 3 = Medium-input (T5: N100P100K100, T8: 20 t ha⁻¹ manure annually, T11: 30 t ha⁻¹ manure every two years); Group 4 = High-input (T6: N150P150K150, T10: 30 t ha⁻¹ manure annually).
Table 4.
Plant species correlation with the ordination axes (PCoA).
| Species | Axis 1 (r) | Axis 1 (r-sq) | Axis 1 (tau) | Signif. | Axis 2 (r) | Axis 2 (r-sq) | Axis 2 (tau) | Signif. |
| Agrostis capillaris | 0.735 | 0.540 | 0.788 | *** | 0.635 | 0.403 | -0.006 | ns |
| Anthoxanthum odoratum | 0.163 | 0.026 | 0.171 | ns | -0.368 | 0.136 | -0.270 | * |
| Briza media | -0.423 | 0.179 | -0.410 | * | -0.488 | 0.238 | -0.319 | ** |
| Cynosurus cristatus | 0.761 | 0.579 | 0.699 | *** | 0.227 | 0.052 | -0.127 | ns |
| Dactylis glomerata | 0.859 | 0.737 | 0.646 | *** | 0.186 | 0.035 | 0.053 | ns |
| Festuca pratensis | 0.819 | 0.670 | 0.732 | *** | 0.301 | 0.090 | 0.043 | ns |
| Festuca rubra | 0.768 | 0.591 | 0.567 | *** | -0.494 | 0.244 | -0.309 | * |
| Nardus stricta | -0.987 | 0.974 | -0.906 | *** | 0.083 | 0.007 | 0.107 | ns |
| Phleum pratense | 0.845 | 0.714 | 0.754 | *** | 0.262 | 0.069 | -0.050 | ns |
| Trifolium pratense | 0.544 | 0.296 | 0.356 | ** | -0.762 | 0.581 | -0.565 | *** |
| Trifolium repens | 0.144 | 0.021 | 0.095 | ns | -0.719 | 0.517 | -0.522 | *** |
| Luzula multiflora | -0.525 | 0.275 | -0.451 | ** | -0.426 | 0.181 | -0.287 | * |
| Potentilla erecta | -0.634 | 0.402 | -0.506 | *** | -0.328 | 0.108 | -0.176 | ns |
| Veronica chamaedrys | 0.137 | 0.019 | 0.093 | ns | -0.465 | 0.216 | -0.433 | * |
| Vaccinium myrtillus | -0.848 | 0.719 | -0.654 | *** | 0.037 | 0.001 | 0.170 | ns |
| Carex pallescens | -0.452 | 0.204 | -0.387 | * | -0.312 | 0.097 | -0.243 | ns |
| Ranunculus acris | 0.236 | 0.056 | 0.139 | ns | -0.268 | 0.072 | -0.201 | ns |
| Rumex acetosella | 0.718 | 0.515 | -0.535 | *** | 0.059 | 0.003 | 0.010 | ns |
| Stellaria graminea | -0.023 | 0.001 | 0.025 | ns | -0.240 | 0.057 | 0.205 | ns |
| Taraxacum officinale | 0.702 | 0.493 | -0.554 | *** | -0.258 | 0.066 | 0.194 | ns |
Note: r—Pearson correlation coefficient; r-sq—coefficient of determination; tau—Kendall’s tau correlation between ordination scores and species abundances. Significance: *** p < 0.001, ** p < 0.01, * p < 0.05, ns = not significant.
Table 5.
Plant species correlation with the ordination axes (PCoA).
| Species | Group | IndVal | Signif. |
| Agrostis capillaris | 4 | 66.7 | p < 0.001 |
| Anthoxanthum odoratum | 2 | 50.2 | p < 0.001 |
| Briza media | 2 | 45.2 | p < 0.001 |
| Cynosurus cristatus | 4 | 46.6 | p < 0.001 |
| Dactylis glomerata | 4 | 42.4 | p < 0.001 |
| Deschampsia caespitosa | 3 | 27.8 | ns |
| Festuca pratensis | 4 | 46.7 | p < 0.001 |
| Festuca rubra | 3 | 52.3 | p < 0.001 |
| Holcus lanatus | 3 | 54.9 | p < 0.001 |
| Nardus stricta | 1 | 50.4 | p < 0.001 |
| Phleum pratense | 4 | 48.1 | p < 0.001 |
| Lotus corniculatus | 2 | 36.2 | p < 0.05 |
| Trifolium ochroleucon | 2 | 60.0 | p < 0.001 |
| Trifolium pratense | 3 | 46.8 | p < 0.001 |
| Trifolium repens | 2 | 46.7 | p < 0.001 |
| Achillea stricta | 2 | 55.1 | p < 0.001 |
| Alchemilla vulgaris | 3 | 38.2 | p < 0.05 |
| Leucanthemum vulgare | 2 | 38.8 | p < 0.01 |
| Carex pubescens | 2 | 52.2 | p < 0.001 |
| Campanula serata | 2 | 35.3 | p < 0.05 |
| Campanula abietina | 1 | 41.7 | p < 0.001 |
| Cerastium sylvaticum | 1 | 35.9 | p < 0.001 |
| Cruciata glabra | 1 | 42.9 | p < 0.001 |
| Luzula multiflora | 2 | 48.3 | p < 0.001 |
| Hyeracium pilosela | 2 | 43.5 | p < 0.01 |
| Hypericum maculatum | 2 | 51.7 | p < 0.001 |
| Prunela vulgaris | 2 | 45.2 | p < 0.01 |
| Polygala vulgaris | 1 | 52.4 | p < 0.001 |
| Plantago lanceolata | 2 | 35.4 | ns |
| Potentila erecta | 2 | 62.9 | p < 0.001 |
| Ranunculas acris | 3 | 27.9 | ns |
| Stellaria gramineae | 3 | 42.0 | p < 0.05 |
| Taraxacum officinale | 4 | 34.8 | ns |
| Thymus pullegioides | 2 | 56.3 | p < 0.001 |
| Viola declinata | 1 | 53.8 | p < 0.001 |
| Veronica officinalis | 1 | 52.0 | p < 0.001 |
| Veronica chamaedrys | 2 | 37.0 | ns |
| Vaccinium myrtillus | 1 | 61.9 | p < 0.001 |
Note: Groups correspond to the four phytosociological clusters identified by cluster analysis. Significance: *** p < 0.001, ** p < 0.01, * p < 0.05, ns = not significant. Groups meaning: Group 1 = Nardus stricta (oligotrophic grasslands); Group 2 = Nardus stricta–Festuca rubra (transitional communities); Group 3 = Festuca rubra–Nardus stricta co-dominated by Agrostis capillaris; Group 4 = Agrostis capillaris–Festuca rubra (mesotrophic grasslands).
Table 6.
The influence of fertilization treatments on biodiversity indices in grasslands.
| Treatment |
Species richness (S) |
Shannon index (H’) | Evenness (E) | Simpson (D) |
| T1 | 35.50 ± 0.50 a | 1.54 ± 0.02 e | 0.43 ± 0.01 d | 0.51 ± 0.01 d |
| T2 | 31.25 ± 0.48 b | 1.30 ± 0.04 f | 0.38 ± 0.01 d | 0.42 ± 0.02 d |
| T3 | 35.00 ± 0.00 a | 1.79 ± 0.05 d | 0.50 ± 0.02 c | 0.58 ± 0.02 c |
| T4 | 37.00 ± 0.00 a | 2.59 ± 0.04 a | 0.72 ± 0.01 a | 0.84 ± 0.01 a |
| T5 | 27.50 ± 1.55 c | 2.37 ± 0.04 b | 0.72 ± 0.01 a | 0.84 ± 0.01 a |
| T6 | 22.50 ± 0.65 d | 2.15 ± 0.01 c | 0.69 ± 0.01 ab | 0.80 ± 0.00 b |
| T7 | 38.00 ± 0.00 a | 2.54 ± 0.05 a | 0.70 ± 0.01 ab | 0.83 ± 0.01 a |
| T8 | 28.25 ± 1.11 c | 2.49 ± 0.04 a | 0.75 ± 0.01 a | 0.86 ± 0.01 a |
| T9 | 37.00 ± 0.00 a | 2.62 ± 0.01 a | 0.73 ± 0.00 a | 0.85 ± 0.00 a |
| T10 | 22.75 ± 0.48 d | 2.24 ± 0.02 bc | 0.72 ± 0.00 a | 0.83 ± 0.00 a |
| T11 | 28.00 ± 1.47 c | 2.5 ± 0.05 a | 0.75 ± 0.016 a | 0.86 ± 0.01 a |
| F test | 51.72 (df=10,33) | 156.03 (df=10,33) | 160.32 (df=10,33) | 267.54 (df=10,33) |
| p-value | < 0.001 | < 0.001 | < 0.001 | < 0.001 |
Note: T1—unfertilized control; T2—abandonment; T3—mulching; T4—N50P50K50 mineral fertilization; T5—N100P100K100 mineral fertilization; T6—N150P150K150 mineral fertilization; T7—10 t ha⁻¹ cattle manure annually; T8—20 t ha⁻¹ cattle manure annually; T9—20 t ha⁻¹ cattle manure applied every two years; T10—30 t ha⁻¹ cattle manure annually; T11—30 t ha⁻¹ cattle manure applied every two years. Note: Values are means ± s.e. (n = 4 replicates per treatment). One-way ANOVA was used to test for differences among treatments. Different letters within a column indicate significant differences at p < 0.05 according to LSD test.
Table 7.
Modified Braun-Blanquét scale for assessing the abundance-dominance of plant species, based on classes and sub-classes (after [76]).
Table 7.
Modified Braun-Blanquét scale for assessing the abundance-dominance of plant species, based on classes and sub-classes (after [76]).
| Class |
Coverage Interaval (%) |
Class Central Value (%) |
Sub-Note | Sub-Interval (%) | Central-Adjusted Value of Sub-Interval (%) |
| 5 | 75–100 | 87.5 | 5c | 92–100 | 96 |
| 5b | 83–92 | 87.5 | |||
| 5a | 75–83 | 79 | |||
| 4 | 50–75 | 62.5 | 4c | 67–75 | 71 |
| 4b | 58–67 | 62.5 | |||
| 4a | 50–58 | 54 | |||
| 3 | 25–50 | 37.5 | 3c | 42–50 | 46 |
| 3b | 33–42 | 37.5 | |||
| 3a | 25–33 | 29 | |||
| 2 | 10–25 | 17.5 | 2c | 20–25 | 22.25 |
| 2b | 15–20 | 17.5 | |||
| 2a | 10–15 | 12.5 | |||
| 1 | 1–10 | 5 | 1c | 6–10 | 8 |
| 1b | 4–6 | 5 | |||
| 1a | 1–4 | 2.5 | |||
| + | 0.1–1 | 0.5 | - | - | 0.5 |
| r | 0.01–0.1 | 0.05 | - | - | 0.05 |
a, b, c indicates the sub-note of each class.
Disclaimer/Publisher’s Note: The statements, opinions and data contained in all publications are solely those of the individual author(s) and contributor(s) and not of MDPI and/or the editor(s). MDPI and/or the editor(s) disclaim responsibility for any injury to people or property resulting from any ideas, methods, instructions or products referred to in the content. |
© 2025 by the authors. Licensee MDPI, Basel, Switzerland. This article is an open access article distributed under the terms and conditions of the Creative Commons Attribution (CC BY) license (http://creativecommons.org/licenses/by/4.0/).
Copyright: This open access article is published under a Creative Commons CC BY 4.0 license, which permit the free download, distribution, and reuse, provided that the author and preprint are cited in any reuse.


