Preprint
Article

This version is not peer-reviewed.

Optimizing Water–Carbon Coupling Through a Trait-Based Framework Integrating WCCI and Dual-Filter CATS Model

A peer-reviewed article of this preprint also exists.

Submitted:

27 September 2025

Posted:

29 September 2025

You are already at the latest version

Abstract

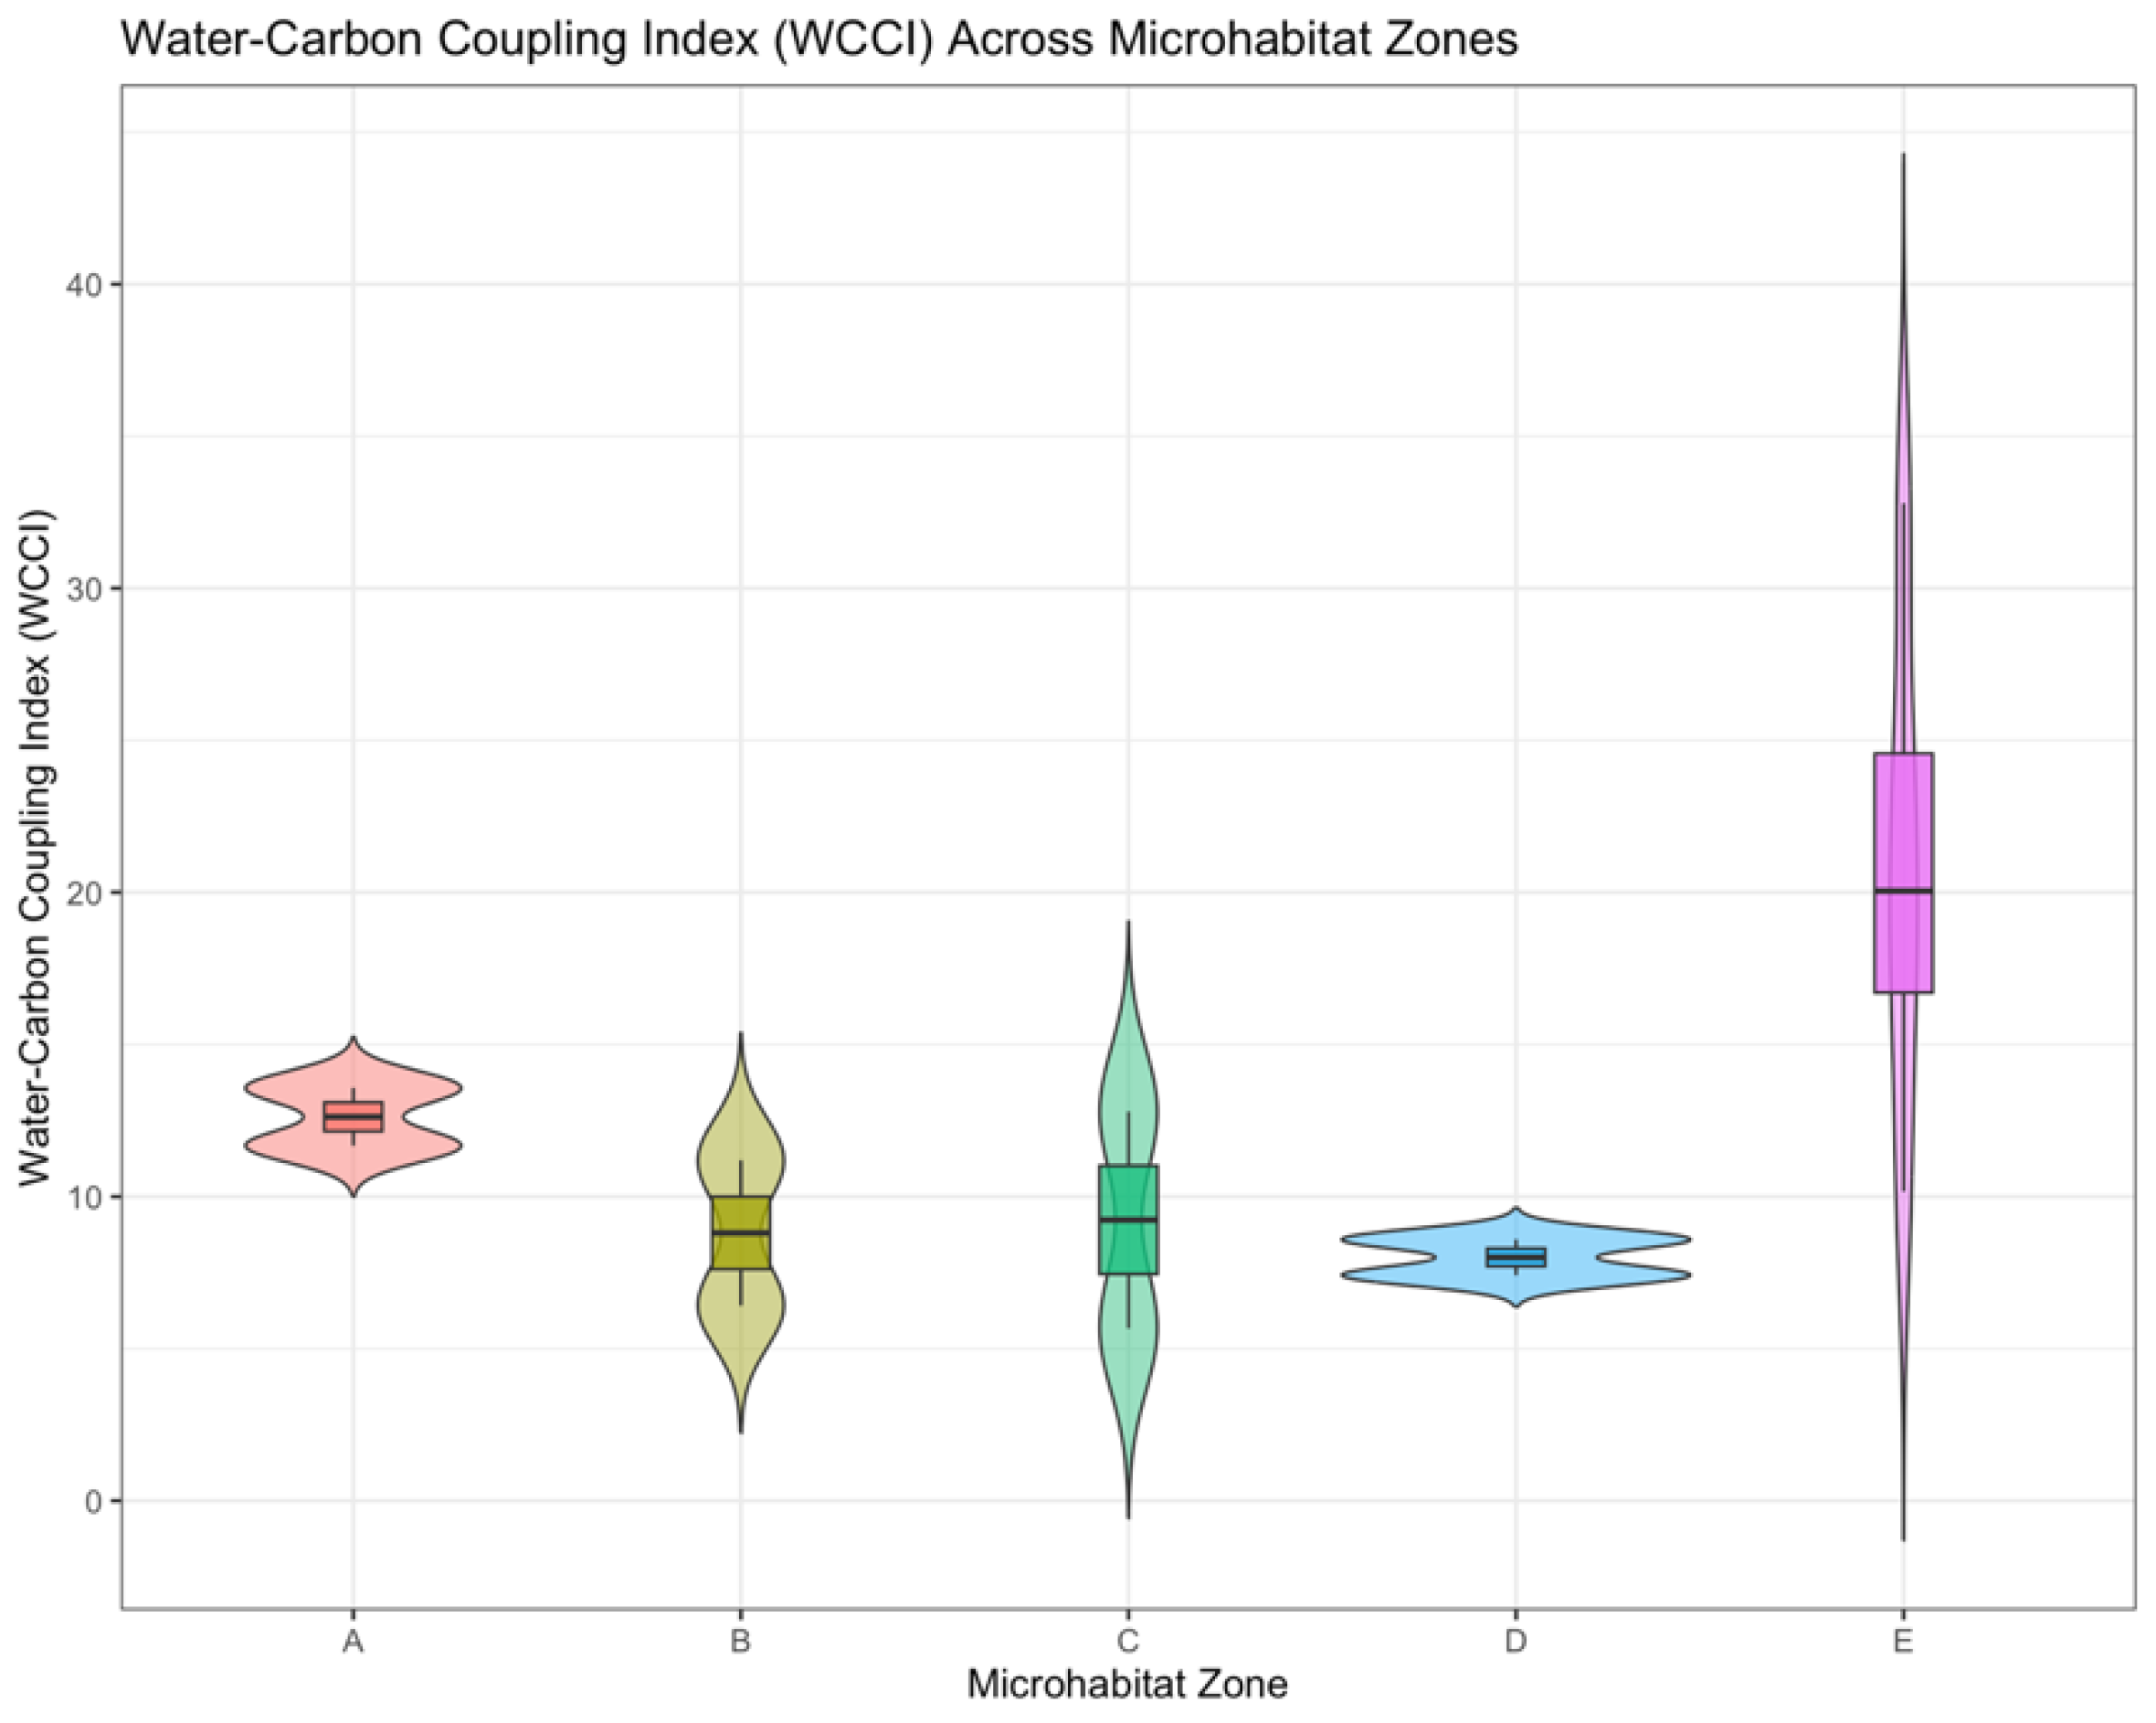
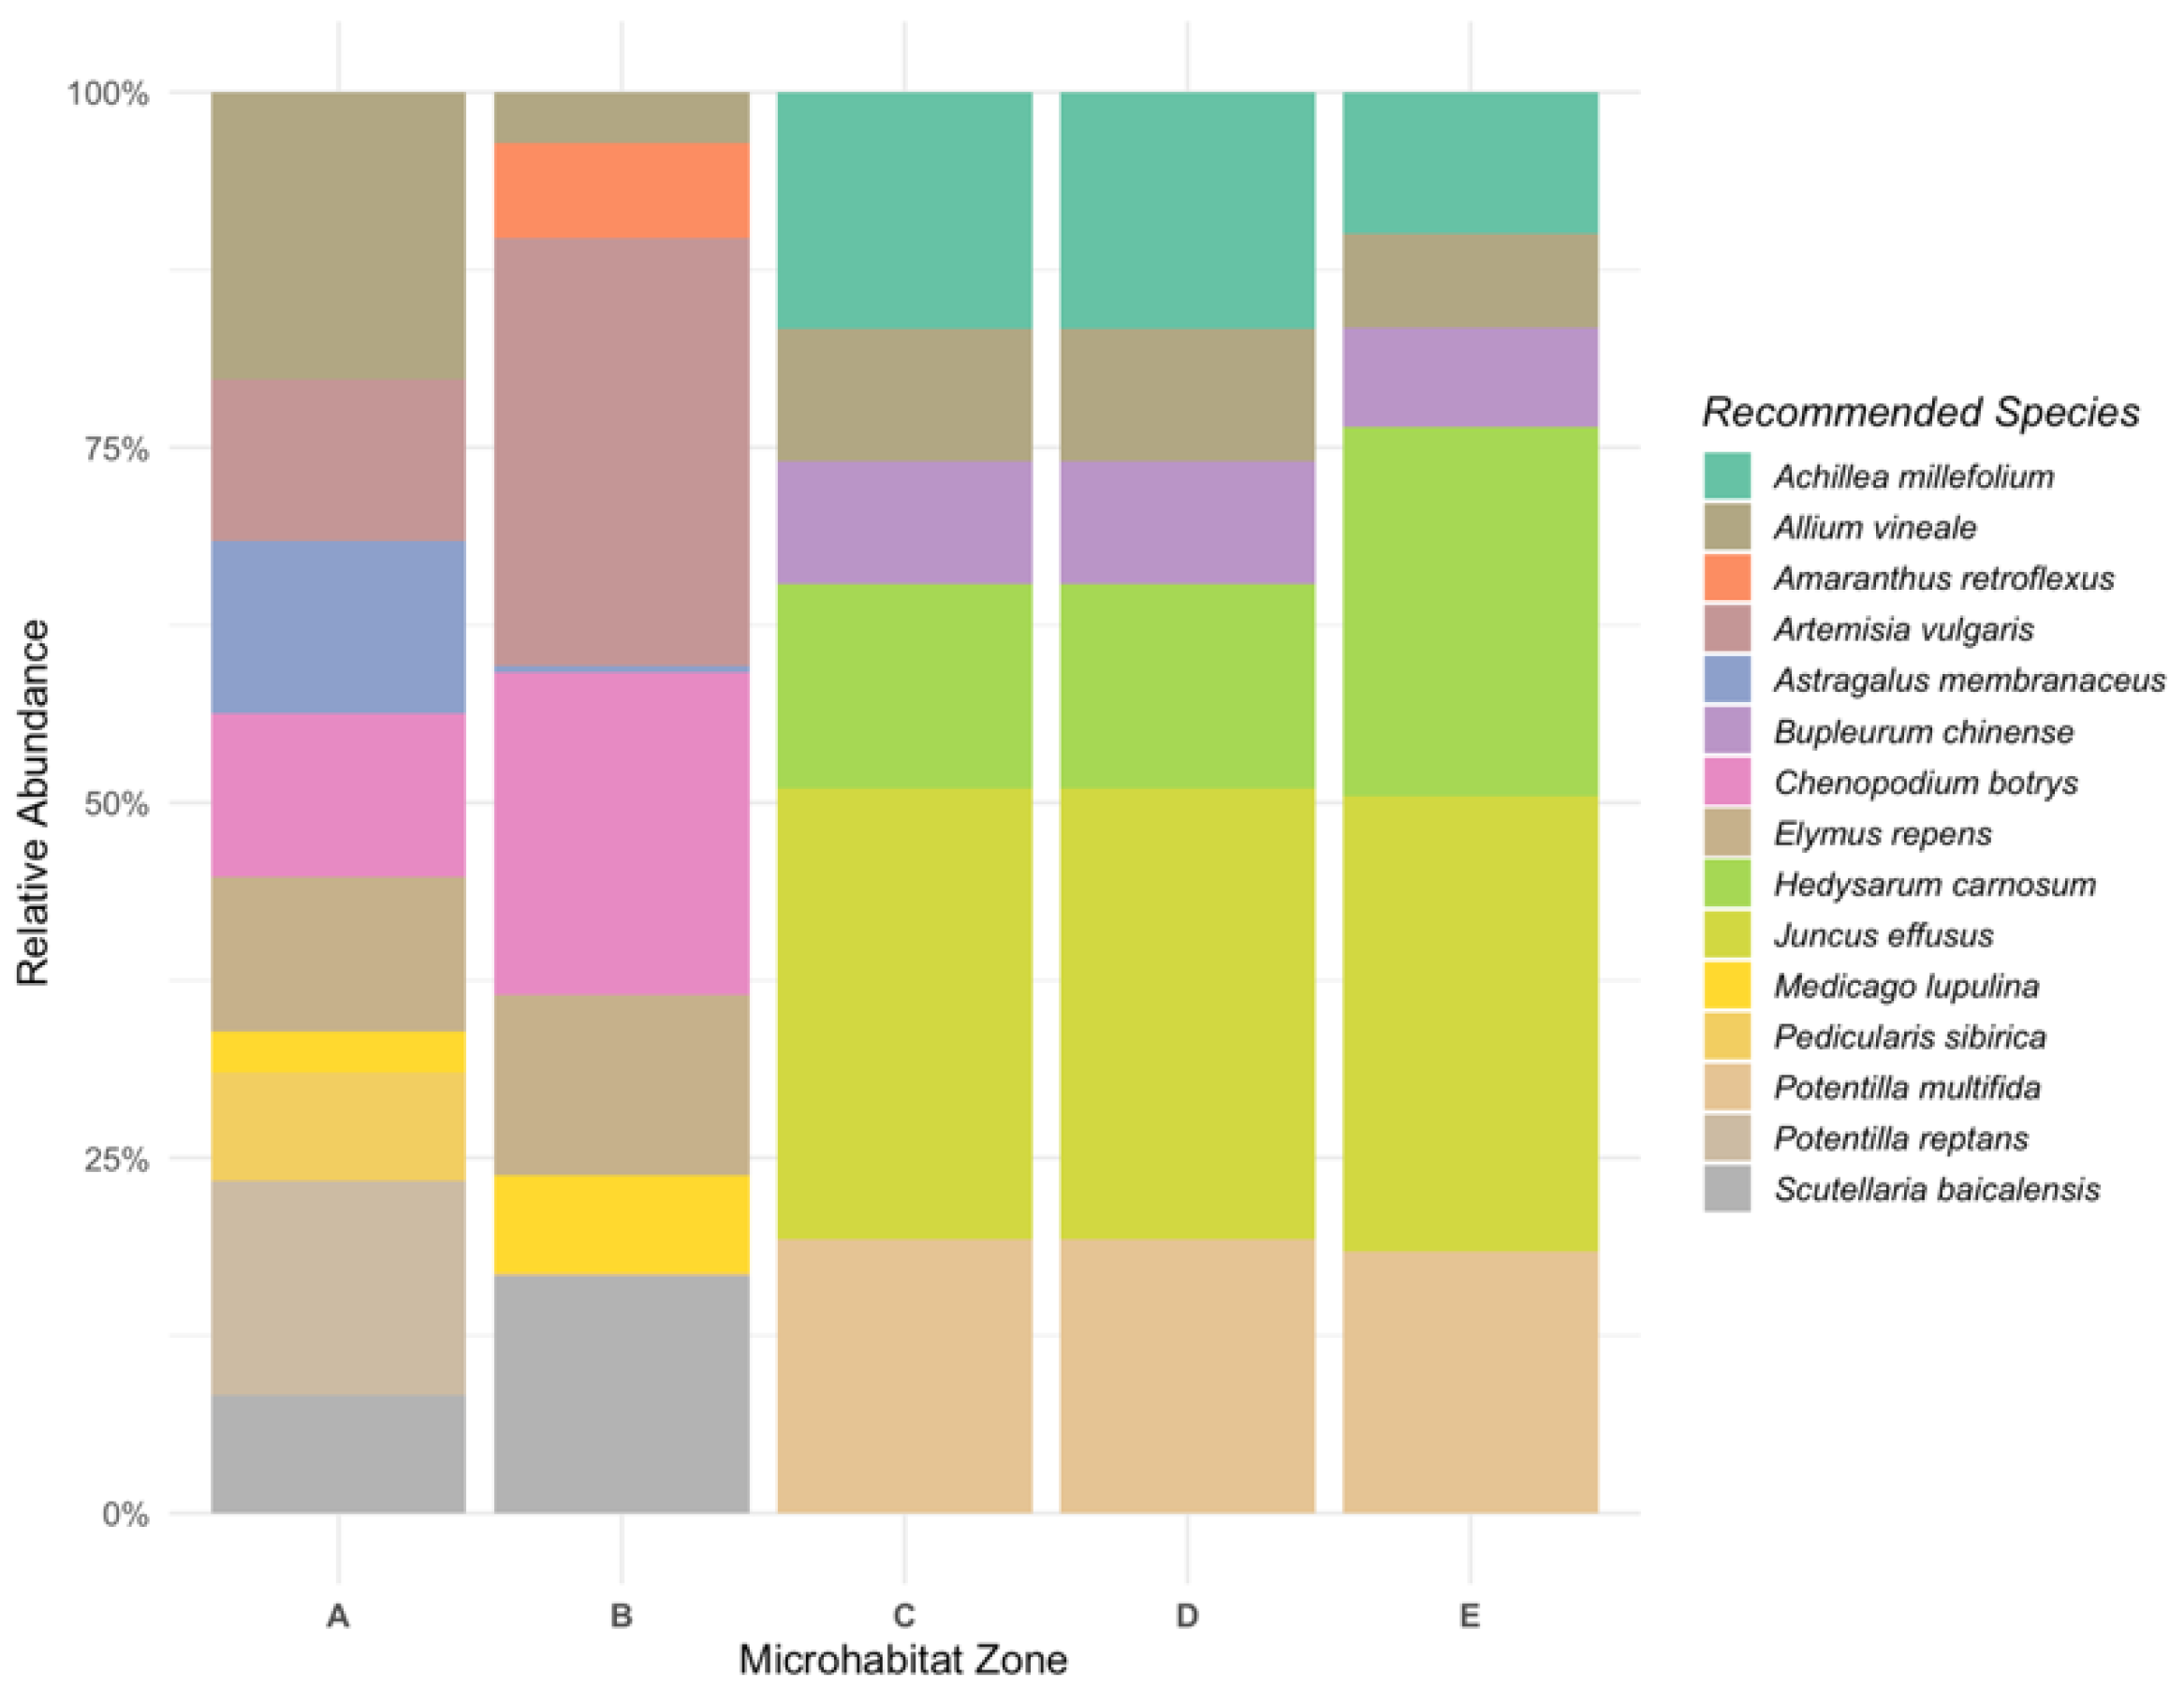
Ecological restoration in degraded landscapes requires a comprehensive understanding of the factors influencing ecosystem function, particularly in relation to water and carbon cycling. This study explores the role of microtopography and plant functional traits in optimizing water-carbon coupling efficiency in a mining-affected ecosystem using the CATS model. We assessed the water-carbon coupling index (WCCI) across five microhabitat zones (A–E) within a mining area in the Hulunbuir Grassland. Results show significant variability in WCCI across zones, with Zone B exhibiting the highest functional efficiency due to its moderate moisture and low erosion, while Zone A displayed the lowest WCCI, constrained by water and nutrient limitations. The CATS model simulations revealed that water-carbon coupling is highly influenced by species functional traits such as SLA, height, and drought tolerance, with species like polygonum aviculare and cleistogenes caespitosa contributing most significantly to functional performance. Additionally, ecological filters, such as soil moisture, nutrient availability, and erosion intensity, were found to shape species selection and community structure. Our findings highlight the importance of trait-based approaches in restoration, emphasizing the need for tailored species optimization that accounts for both functional trait diversity and local environmental conditions. This research offers valuable insights for improving ecosystem resilience and optimizing water-carbon coupling in the face of climate change and land degradation.

Keywords: 
;  ;  ;  ;  ;  

1. Introduction

Global terrestrial ecosystems are undergoing unprecedented degradation, driven by a combination of climate change, anthropogenic activities, and land-use change[1,2,3]. According to the Intergovernmental Science-Policy Platform on Biodiversity and Ecosystem Services[4], over 23% of agricultural lands have experienced a decline in productivity, and approximately 15% of terrestrial carbon sinks have been lost due to ecosystem degradation[5,6]. This alarming trend is further compounded by the ongoing loss of biodiversity, exacerbating the challenges for ecosystem-based services such as carbon sequestration, water regulation, and soil stabilization[7,8,9]. These developments highlight the urgent need for innovative and scalable ecological restoration strategies that can reinstate ecosystem functionality while also mitigating climate change impacts.
Ecological restoration, defined as the process of reestablishing ecological functions and services in degraded ecosystems, has become a critical area of scientific research[10,11]. While conventional restoration efforts have focused primarily on the reassembly of native species[12,13,14], these approaches often struggle to restore ecosystems’ full functionality under the pressures of climate change and other anthropogenic disturbances[15]. Thus, a shift towards more dynamic, trait-based restoration approaches that account for the complex interactions between plants, soil, and their environment has gained significant traction in recent years[16].
The integration of plant functional traits (PFTs) into restoration practices has opened new avenues for designing more resilient ecosystems[17,18,19,20,21]. Functional traits—such as leaf area, specific leaf area (SLA), plant height, and root depth—affect key ecological processes, including nutrient cycling, water regulation, and biomass accumulation[22,23,24]. Recent advances in trait-based ecology have demonstrated that species’ functional strategies, how they interact with and adapt to their environment—play a crucial role in shaping community structure and ecosystem functions[25,26,27,28,29,30]. The Continuum Assembly of Trait-based Species (CATS) model has emerged as a particularly promising tool for restoration, enabling the optimization of species assemblages by balancing ecological constraints with functional outcomes[27,29,30]. In traditional restoration approaches, the focus is often on species identity and taxonomic diversity, which does not necessarily translate into functional recovery or resilience under changing environmental conditions[31,32,33,34]. In contrast, trait-based approaches use PFTs to predict how species will respond to various environmental filters, making it possible to optimize species selection for desired ecosystem functions[35,36]. This predictive power is crucial, particularly in disturbed environments such as degraded mining landscapes, where the species pool is often limited, and recovery trajectories can be slow and uncertain[37,38].
However, despite their promise, current trait-based models, including CATS, face several limitations[39]. First, they often neglect the dynamic feedbacks between plants and their environment, such as soil feedbacks and interspecies interactions[40]. Additionally, these models are typically limited by the availability of trait data, which can constrain their predictive power and generalizability[41,42,43,44]. Recent developments in restoration ecology have begun to integrate biogeochemical cycles, particularly the coupling of water and carbon processes, into trait-based models[45]. Water and carbon are two of the most critical resources for plant growth, and their interactions are fundamental to ecosystem functioning, particularly in arid and semi-arid regions where water stress limits both plant productivity and carbon sequestration potential[46,47,48,49,50]. The dynamics of water–carbon coupling involve complex feedback mechanisms, where water availability influences plant carbon uptake and storage, while plant biomass and soil organic matter contribute to water retention and nutrient cycling[51,52,53]. But despite the growing recognition of the importance of water–carbon interactions, the integration of these processes into ecosystem restoration frameworks remains underexplored[54]. While traditional ecological models tend to treat water and carbon processes separately, the reality of ecosystem functioning requires a more holistic approach that accounts for their interdependencies[55,56]. For instance, plants that are efficient in water use (e.g., drought-resistant species) may also be effective in carbon storage, but the mechanisms behind this coupling are still poorly understood[57,58].
Recent studies have shown that trait-based models, particularly those focusing on water-use efficiency and biomass production, can provide valuable insights into how species can be selected for optimal water–carbon synergy[59]. By optimizing species combinations based on both water and carbon traits, restoration projects can enhance ecosystem resilience and provide greater potential for climate change mitigation. Despite these advances, integrating water–carbon coupling into trait-based models such as CATS remains a significant gap in restoration science[60].
This study confronts a critical limitation in trait-based restoration: the absence of a direct method for optimizing a specific, complex ecosystem process like water-carbon coupling. To address this gap, our primary innovation is the development of the Water-Carbon Coupling Index (WCCI), a novel, quantitative metric designed to explicitly capture the functional synergy between a species’ water conservation and carbon accumulation strategies. Specifically, we propose a novel framework that combines microhabitat stratification, functional trait optimization, and species interaction networks to improve the restoration outcomes in degraded mining ecosystems. We hypothesize that by optimizing species selection not only based on abiotic filters but also considering species co-occurrence and interaction effects, we can enhance the stability and functional diversity of restored ecosystems. This approach represents a significant advancement in restoration ecology, as it moves beyond taxonomic-based strategies and offers a more integrated, ecosystem-level perspective on ecological recovery.

2. Materials and Methods

2.1. Study Area

This study was conducted in a degraded mining ecosystem located within the Hulun Buir Grassland, Inner Mongolia, China. The mining site, which covers approximately 0.9 km2, was abandoned in 2019 and has undergone around five years of unassisted natural recovery. This region belongs to the semi-arid continental steppe climate zone, with an annual average precipitation of 350–370 mm. January is the coldest month, with an average low temperature of −30.83 °C, while July is the hottest month, with an average high temperature of 25.84 °C. The dominant soil types include chestnut soils and chernozems, which are typical for northern China’s grasslands. Adjacent to the mining site, a pristine reference grassland was selected as a baseline ecosystem. This reference site, located approximately 100 km from the mining area, serves as a natural comparison for ecological conditions and community structure.
Figure 1. Map of the study area and sampling design, showing the location of the Hulunbuir grassland mining area (triangle) and surrounding reference sites (circles), with the distribution of 25 sampling plots (5 in the mined area and 20 in reference ecosystems).
Preprints 178489 g001

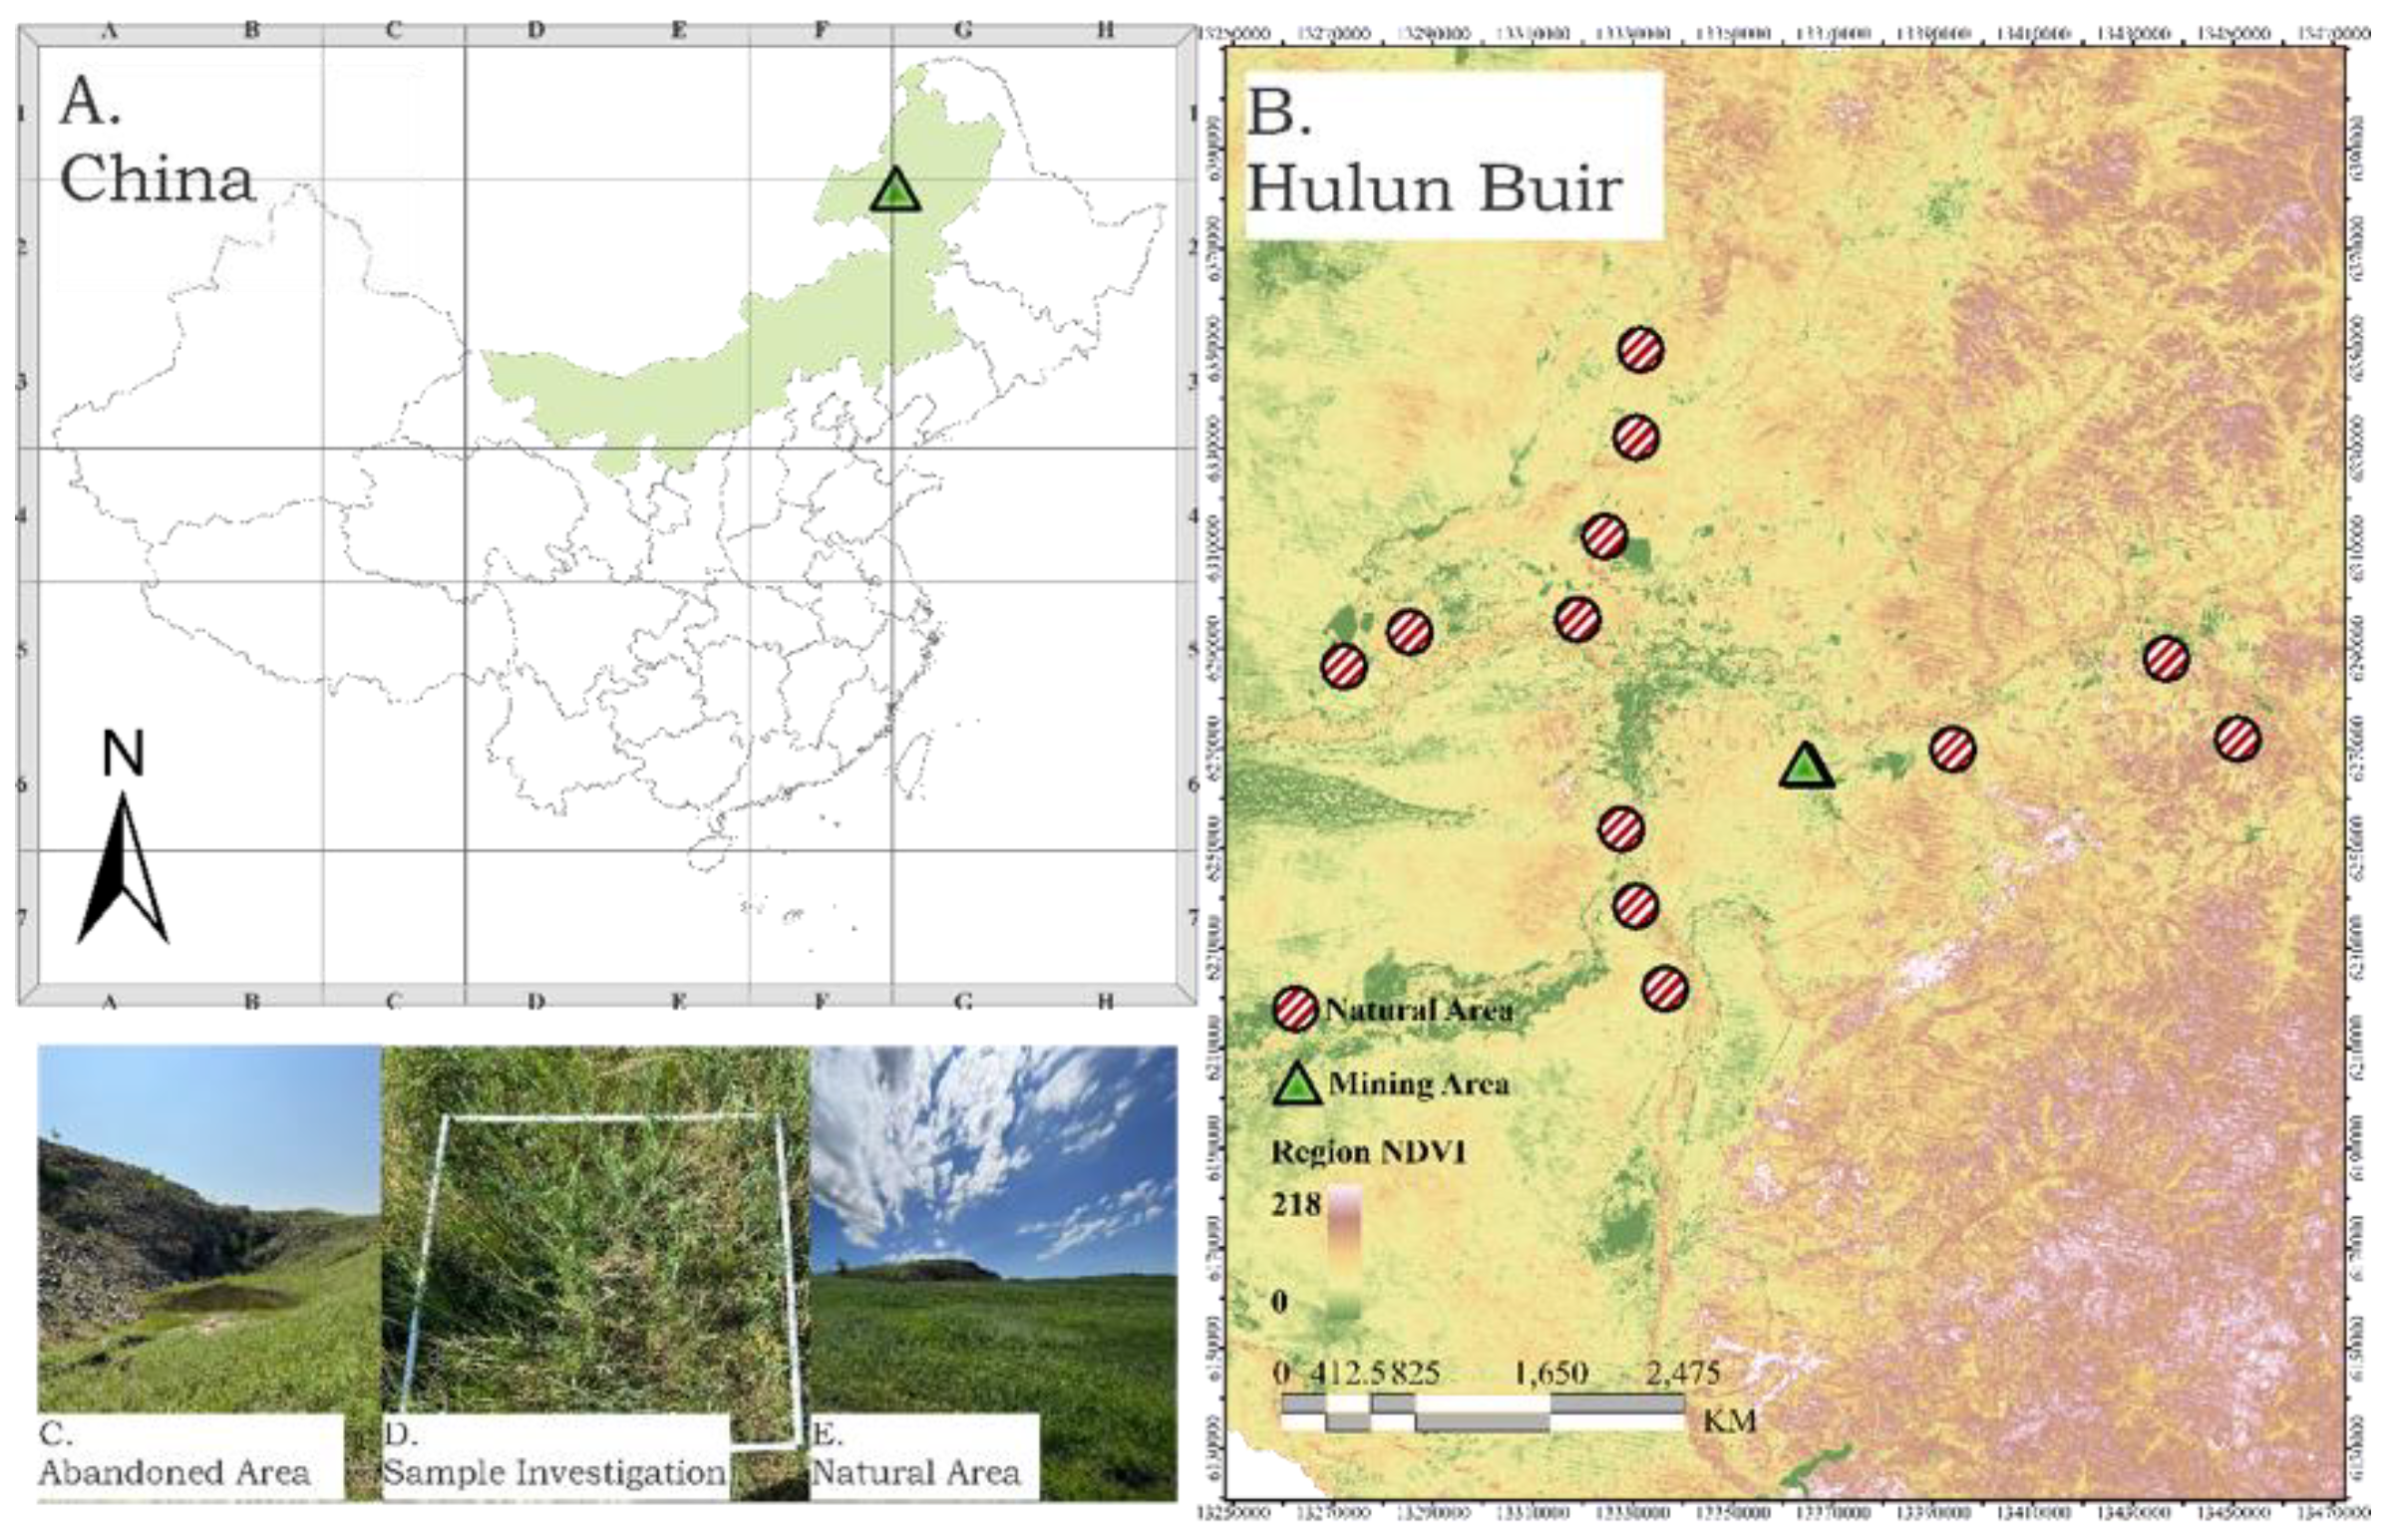
2.2. Sampling Design

To assess ecological variability across both degraded and reference ecosystems, a stratified sampling design was used. Five sampling plots were established within the degraded mining site, corresponding to different microhabitats (A–E). These microhabitats were selected based on variations in soil moisture, erosion intensity, organic matter content, and other environmental factors. A total of 15 sampling plots were established in the mining site. In the reference ecosystem, 20 sampling locations were selected in two zones: (i) Transition Zone (8 plots within a 0.5–2 km radius from the mining site) and (ii) Regional Background Zone (12 plots across a 100 km radius). These reference plots represented undisturbed ecosystems and were used to characterize natural community dynamics.

2.3. Vegetation and Soil Data Collection

In each quadrat, plant community structure was quantified using the Braun-Blanquet cover-abundance scale[61]. For each species, we recorded the total vegetation cover percentage, species composition, and mean plant height. Additionally, functional traits including leaf length (LL), leaf width (LW), leaf area (LA), specific leaf area (SLA), and leaf circumference (C) were measured for the dominant species. For each species, three healthy individuals were selected, and leaf samples (n = 5 per individual) were pressed, scanned, and analyzed using a CI-202 scanner (±0.1 cm2 accuracy).
Soil samples were collected to a depth of 30 cm using a stainless-steel auger. These samples were homogenized and stored in light-proof containers for laboratory analysis. The following soil properties were measured: i.) Physical properties: Bulk density, moisture content (oven-dried at 105 °C to constant weight); ii.) Chemical properties: Total nitrogen (TN), phosphorus (TP), and organic carbon (SOC); iii.) Erosion estimation: Soil erosion rates were determined using 137Cs activity measured by gamma-ray spectrometry.

2.4. Trait-Environment Coupling Analysis

2.4.1. Community-Weighted Mean (CWM) Calculation[62]

For each species in the study, we calculated the community-weighted mean (CWM) of seven key functional traits (LL, LW, LA, SLA, H, C, FC). CWM values were computed using the formula:
C W M i = i = 1 S p i t i
where pi is the relative abundance of species ii in the community, and ti is the mean trait value of species i. These CWM values were used to quantify the functional composition of plant communities across both the mining and reference ecosystems.

2.4.2. Trait-Environment Correlation

To understand how environmental factors shape plant trait distributions, we calculated Pearson correlation coefficients between key soil variables (SWC, SOM, TN, TP) and CWM trait values[63]. This analysis aimed to identify the environmental factors most strongly influencing the distribution of functional traits in the study areas. The results provided essential data for model construction and species optimization, highlighting which environmental gradients drive specific trait expressions.

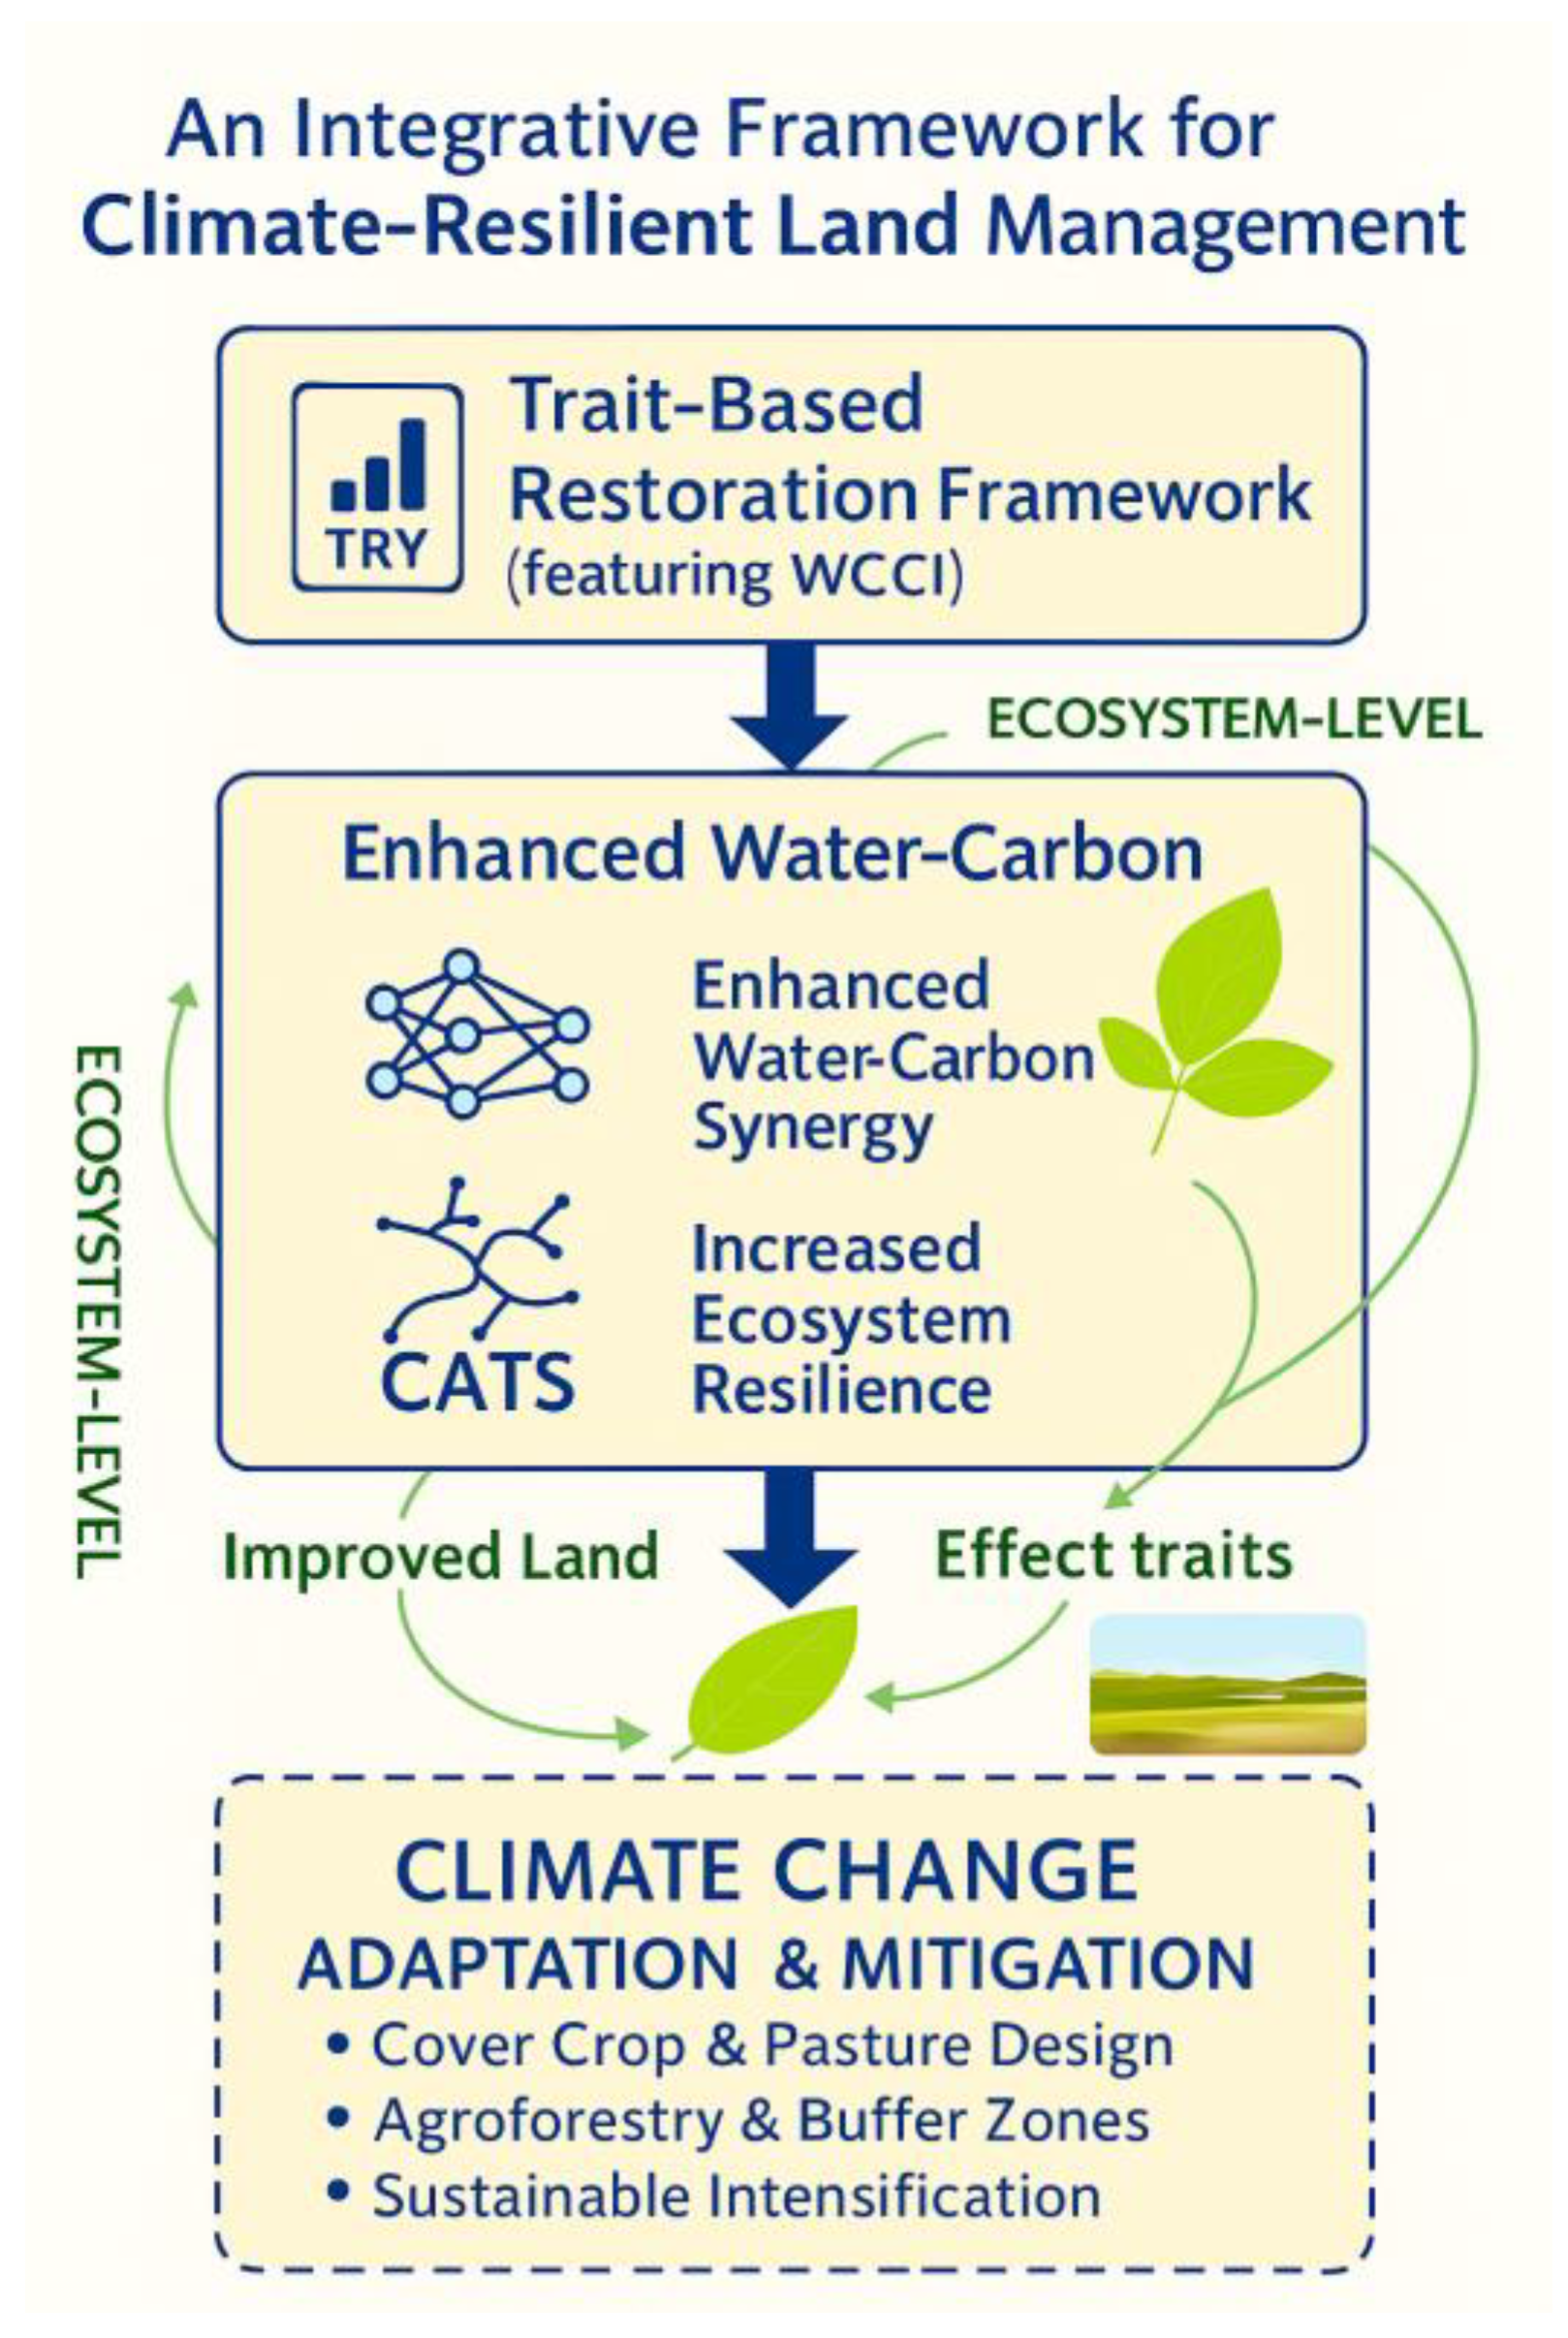
2.5. A Framework for Optimizing Water-Carbon Coupling

The core innovation of this study is a framework designed to integrate water-carbon functional optimization into trait-based restoration. This framework consists of two primary components: (i.) the development of a Water-Carbon Coupling Index (WCCI) to quantify functional synergy at the species level, and (ii.) the application of this index within the CATS (Community Assembly by Trait Selection) model to identify optimal, microhabitat-specific species assemblages.
Figure 2. Conceptual flowchart of the Water-Carbon Coupling (WCCI) optimization framework.
Preprints 178489 g002

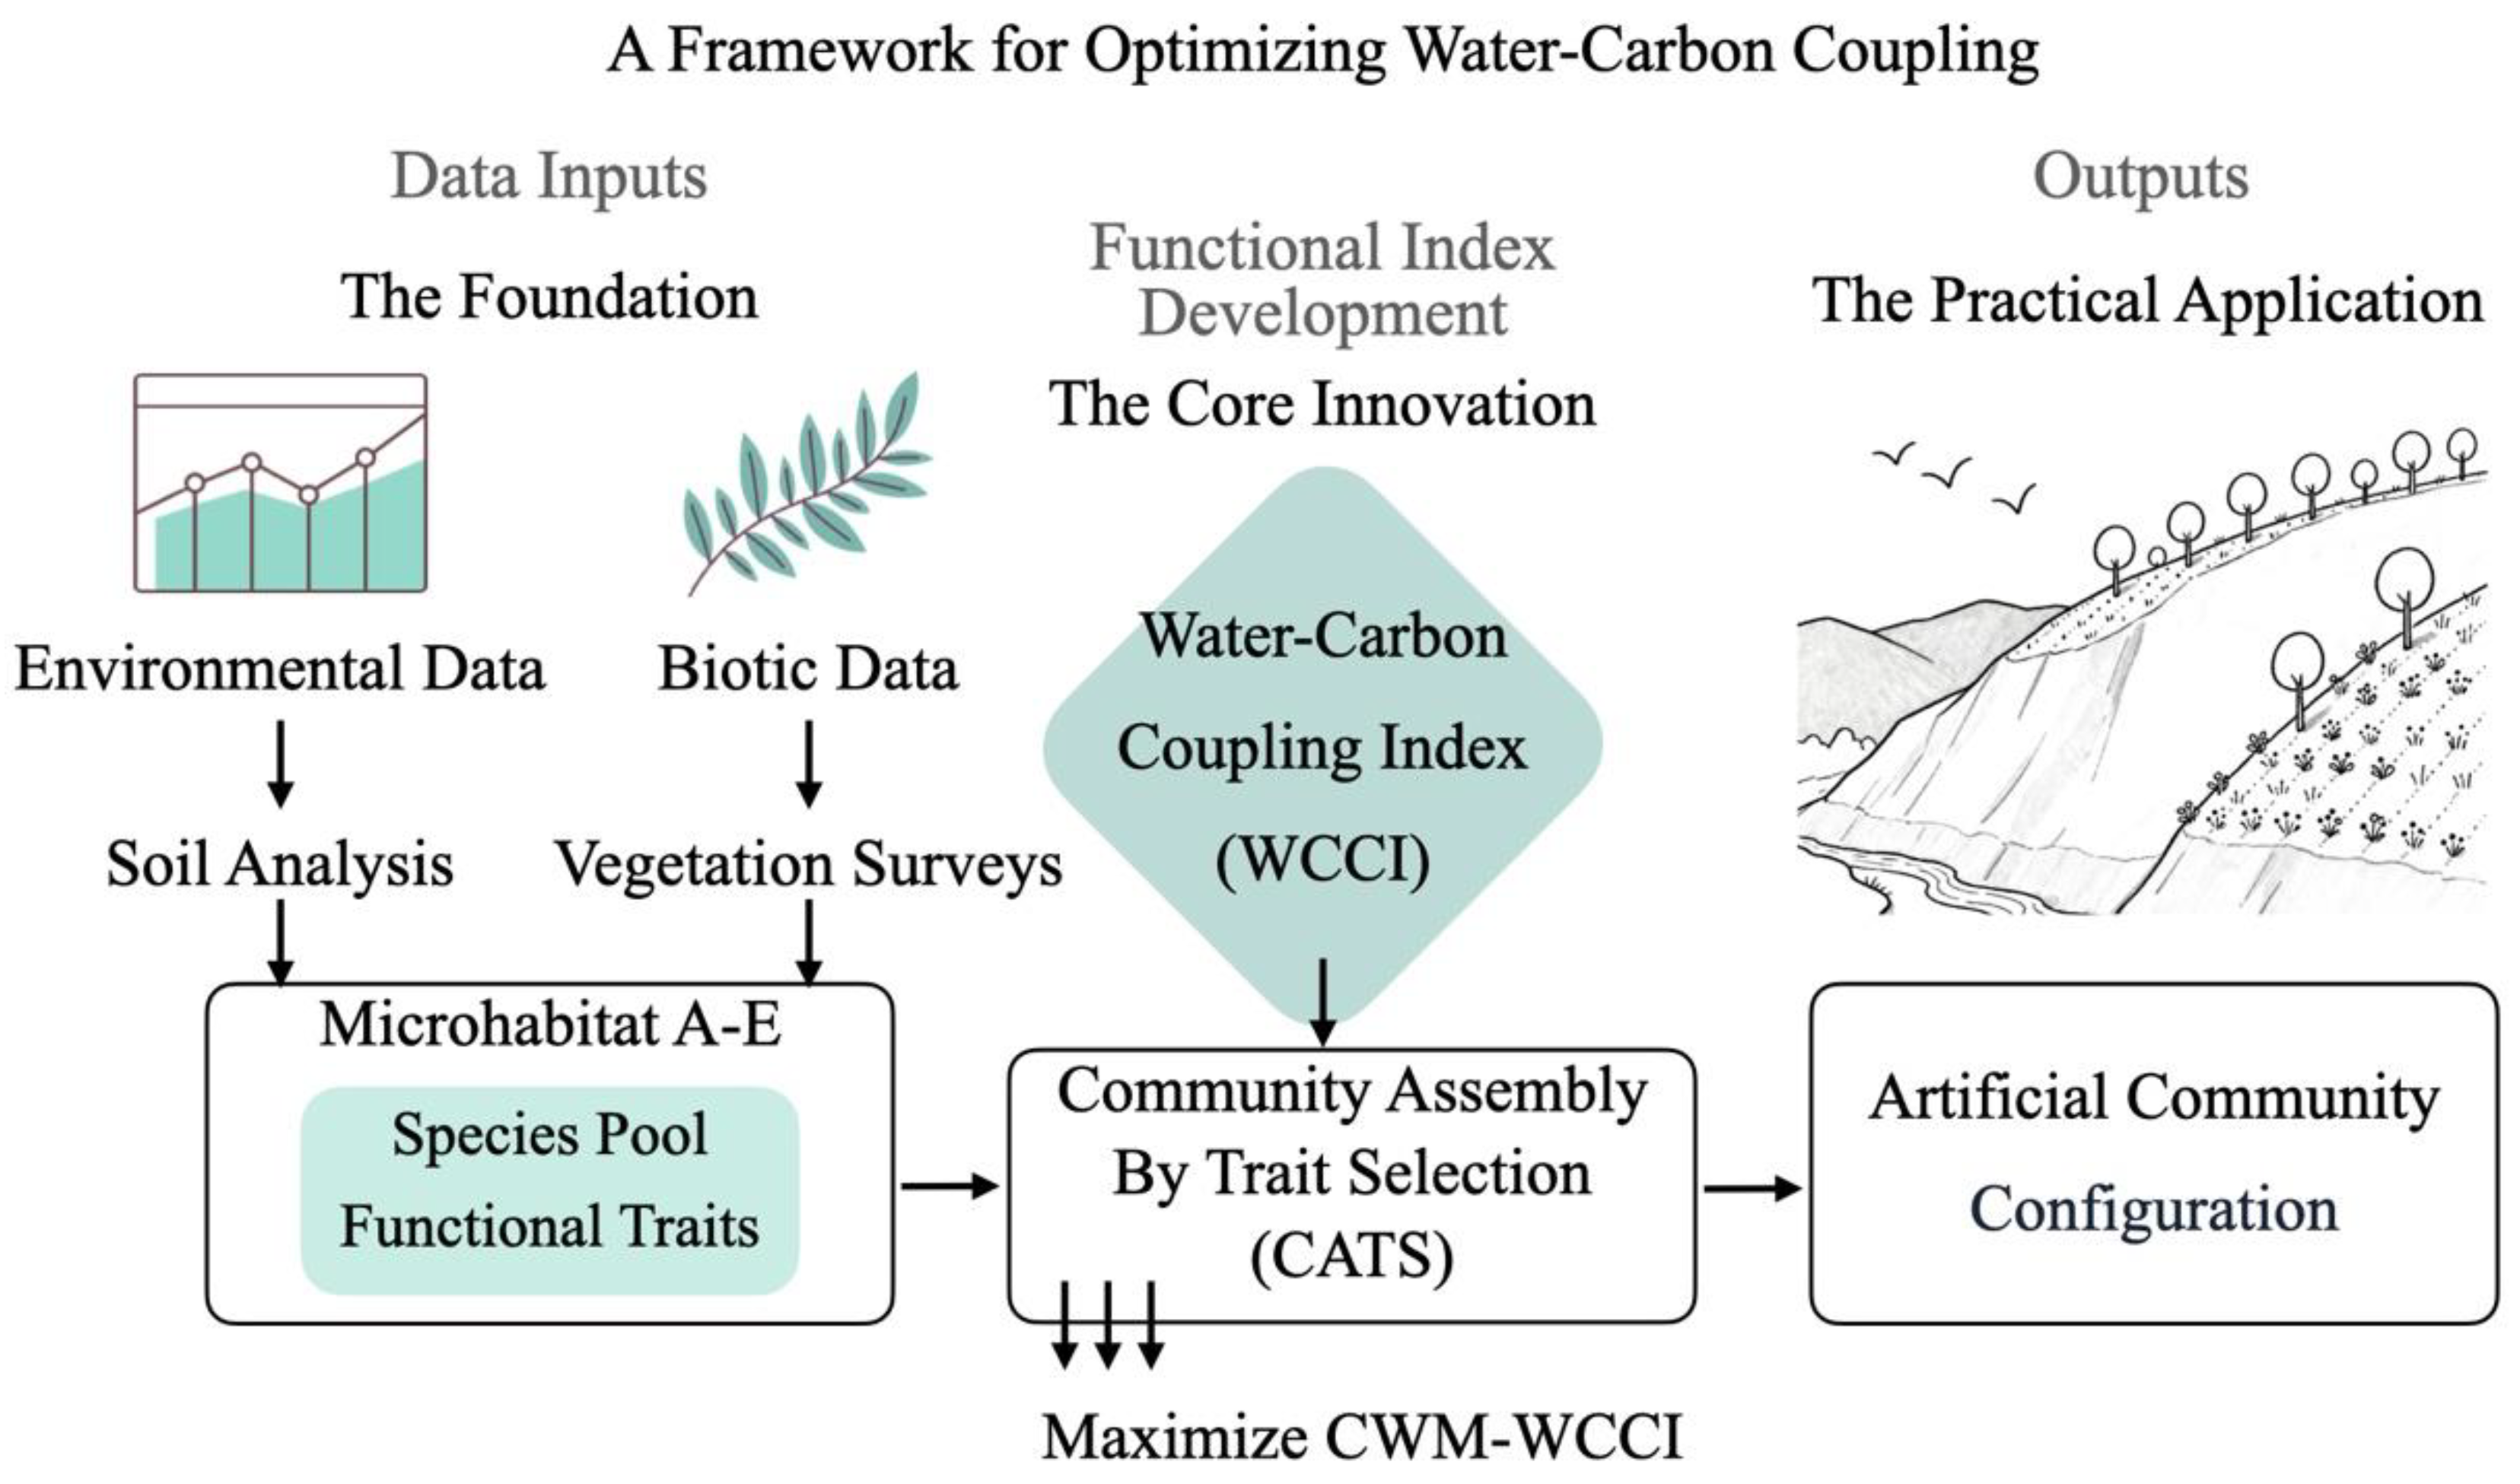
2.5.1. Calculation of the Water-Carbon Coupling Index (WCCI)

To quantify the synergy between water conservation and carbon accumulation, we developed the WCCI based on functional trait proxies. The index is built upon three key traits that simultaneously inform both ecological functions:
(1)Inverse Specific Leaf Area (1/SLA): A higher value serves a dual purpose, acting as a proxy for greater water-use efficiency (WUE) while also indicating higher leaf tissue density and thus greater carbon persistence.
(2)Plant Height (H): Taller stature represents greater biomass potential (carbon function) and simultaneously suggests an enhanced ability to access deeper, more stable soil water resources (water function).
(3)Foliage Cover (FC): Higher foliage cover directly contributes to community-level biomass and carbon stock, while also reducing soil water loss through evaporation by creating ground shade and a more humid microclimate.
The species-level WCCI was calculated through a multi-step normalization process to ensure all traits contributed equally:
(1)
Trait Aggregation: For each of the 86 species, the average value for H, FC, and SLA was calculated from field measurements.
(2)
Proxy Normalization: Each of the three proxy traits (H, FC, and 1/SLA) was independently normalized to a scale of 0 to 1 across all species using min-max scaling:
T r a i t n o r m = T r a i t a b s e r v e d T r a i t m i n T r a i t m a x T r a i t m i n #
(3)
Component Score Calculation: A Water Score and a Carbon Score were calculated for each species by summing the normalized values of their respective proxy traits.
W s c o r e = H n o r m + F C n o r m + 1 / S L A n o r m #
C s c o r e = H n o r m + F C n o r m + 1 / S L A n o r m #
(4)
Final Index Formulation: The resulting were themselves normalized to a 0–1 scale. The final WCCI was then calculated as the equally weighted average of these two component scores, as shown in Equation 2, with α set to 0.5.
This process yields a single WCCI value for each species, ranging from 0 (very poor coupling) to 1 (optimal coupling), which was then used to calculate community-weighted means (CWM-WCCI) for each plot and simulated community.
W C C I i = α · W s c o r e i + 1 α · C s c o r e i #
where W_scorei and C_scorei represent the normalized scores for water-use efficiency and carbon sequestration, respectively. The coefficient α was set to 0.5 to balance the weight of water and carbon in the index, though alternative weighting schemes were also considered in sensitivity analyses. This coupling index was used to assess the water–carbon synergy across different species assemblages optimized for each microhabitat.
This process yields a single WCCI value per species (0 = poor coupling, 1 = optimal coupling), which serves as the core functional target for community-level analyses and optimization.

2.5.2. Trait-Based Species Optimization with CATS

To optimize species assemblages for the water-carbon coupling goal, we utilized the CATS model. The CATS model simulates species abundance distributions based on functional traits, optimizing species selection to align with environmental constraints and functional goals. This model was applied in two phases:
(1)
Trait Filtering: The first phase involved applying environmental constraints (e.g., SWC, SOM) to identify species whose traits align with the restoration site’s conditions. This process used random forest regression models to predict trait values and optimize the species pool.
(2)
Species Optimization: In the second phase, species abundance was optimized under the water-carbon coupling framework. Species in each microhabitat (A–E) were selected based on their ability to enhance water retention and carbon sequestration. Species were ranked by their ability to meet both the water and carbon targets, and a final species pool was selected for each microhabitat.

2.5.3. Microhabitat-Specific Optimization

We applied the CATS model to identify the optimal species assemblage for each of the five microhabitats (A–E). Unlike conventional applications that target trait matching, our approach defined the optimization goal as maximizing the Community-Weighted Mean of the WCCI (CWM-WCCI). For each microhabitat, the environmental constraints were used as abiotic filters to define the viable species pool. The CATS algorithm then solved for the relative abundance distribution that maximized the CWM-WCCI, thereby identifying the community composition predicted to yield the highest water-carbon synergy under those specific local conditions.

2.6. Statistical Analysis

All statistical analyses were conducted using R (version 4.2.2). Pearson correlation coefficients were used to analyze the relationship between functional traits and environmental factors. Random forest models were used for trait prediction based on environmental variables, with model performance validated through cross-validation (R2). Monte Carlo simulations (1000 iterations) were performed to propagate uncertainty in the trait imputation process and assess its impact on the final species optimization.

2.7. Sensitivity and Uncertainty Analysis

A sensitivity analysis was performed to assess the robustness of the water-carbon coupling optimization to different data imputation methods. Three strategies for filling missing trait data were tested: (i) functional-group-based mean, (ii) genus-level mean, and (iii) model-based imputation. The resulting species assemblages were compared to identify the influence of data uncertainty on the final outcomes. The Monte Carlo method was used to quantify uncertainty in the water-carbon coupling index, and this uncertainty was propagated through the optimization process to provide confidence intervals for the final results.

3. Results

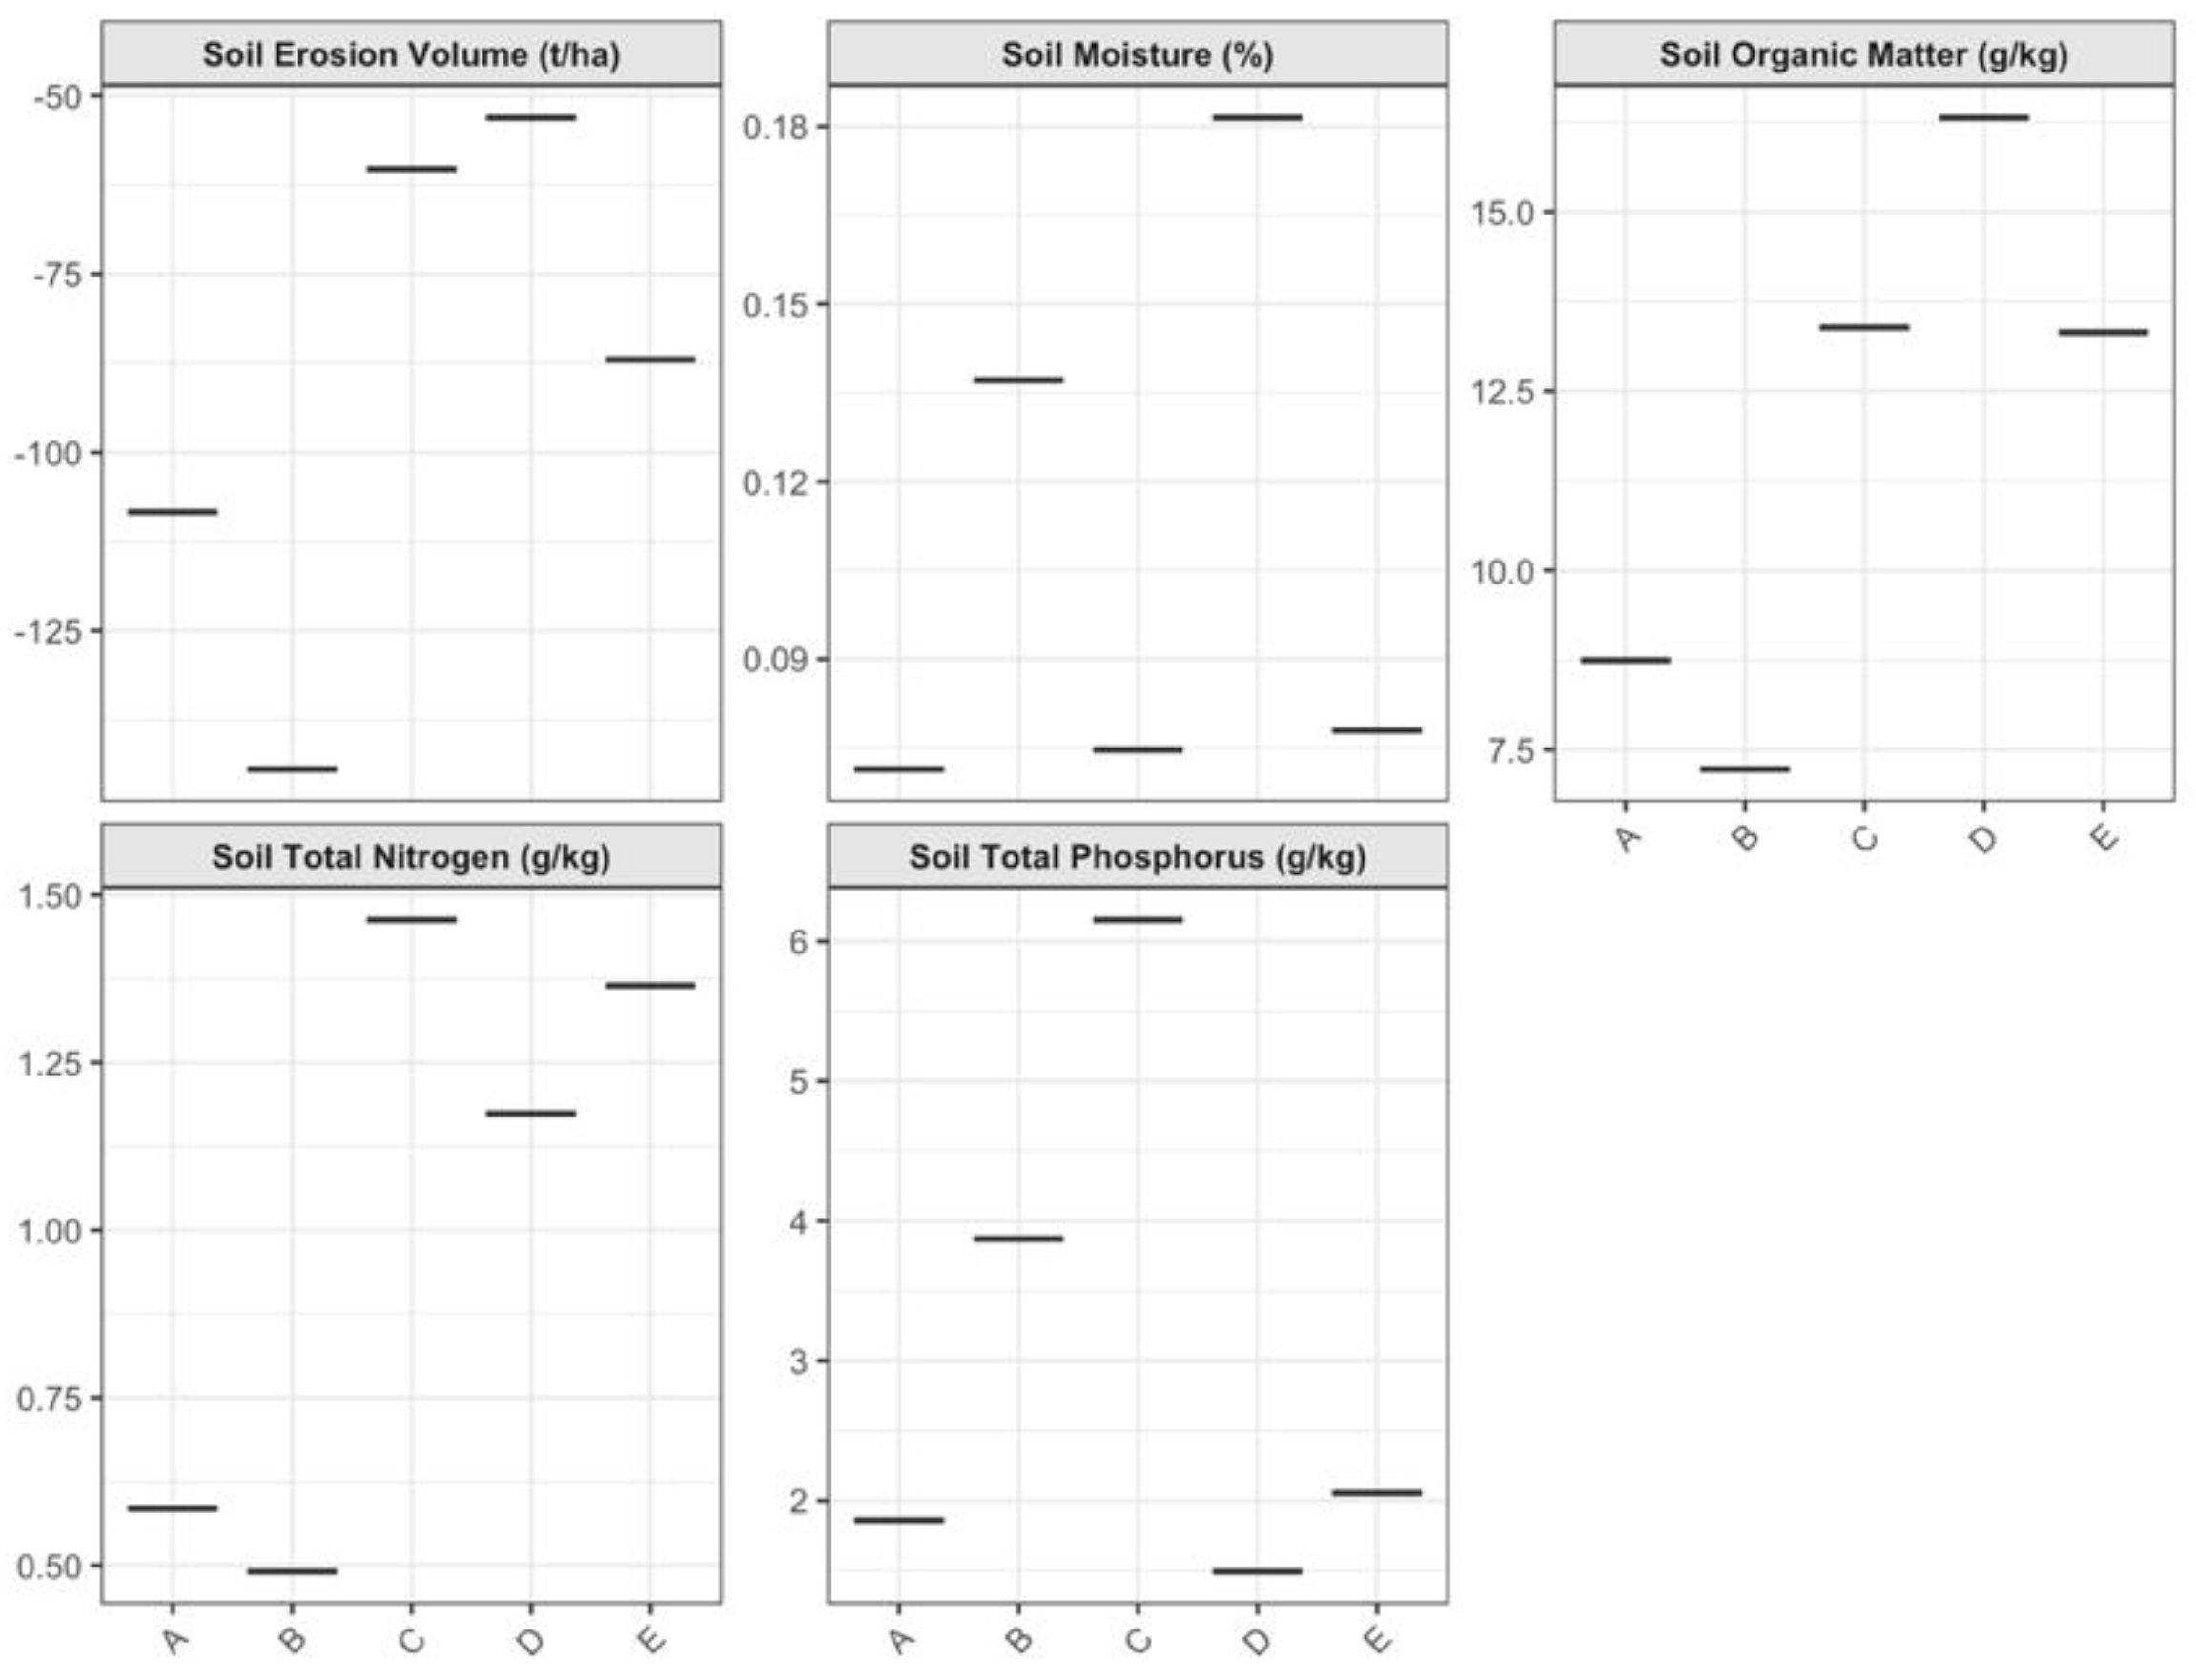
3.1. Significant Environmental Heterogeneity and Microhabitat Stratification

To better understand how local abiotic conditions shape community assembly and functional processes, it was first necessary to identify the degree of environmental heterogeneity within the study site. Through cluster analysis of key soil physicochemical properties, the study site was quantitatively stratified into five statistically distinct microhabitat zones (Figure 4). The environmental conditions varied significantly across these zones (ANOVA, p < 0.001 for all tested variables).
Zone B exhibited the highest mean Soil Moisture Content (SMC) at 13.71 ± 5.2% (mean ± SD), making it the most mesic microhabitat. In contrast, Zone A was the most arid, with a mean SMC of only 7.14 ± 1.5%. Soil fertility gradients were equally pronounced. Zone D was the most fertile, possessing the highest mean Soil Organic Matter (SWM) (16.31 ± 2.1 g/kg) and Total Nitrogen (TN) (1.17 ± 0.3 g/kg). Conversely, Zone B, despite its high moisture, was nutrient-poor, showing the lowest mean SWM (7.23 ± 1.8 g/kg) and TN (0.49 ± 0.2 g/kg). Furthermore, the soil erosion index (E) revealed different geomorphological dynamics: Zone B experienced the most severe erosion (E = −144.4 ± 35.1 t/ha), while Zone D was a depositional area (E = 41.0 ± 15.2 t/ha). These results confirm that the microtopography creates a complex mosaic of distinct environmental filters, each posing unique challenges and opportunities for plant establishment and growth.
Figure 3. Environmental heterogeneity across distinct microhabitat zones. Boxplots show the distribution of key soil properties: (a) Soil Erosion vlume (E), (b) Soil Moisture Content (SMC), (c) Soil Organic Matter (SWM), (d) Total Nitrogen (TN), and (e) Total Phosphorus (TP), Data are grouped by the five primary microhabitat zones (A, B, C, D, E) identified in the study area. The horizontal line within each box represents the median, the box boundaries represent the 25th and 75th percentiles, and the whiskers extend to 1.5 times the interquartile range.
Preprints 178489 g003
Figure 4. Relationships between community-weighted mean (CWM) traits and key environmental factors. Scatterplots illustrate the significant correlations between plant functional traits and soil properties. (a) A negative relationship between CWM Specific Leaf Area (SLA) and Soil Moisture Content (SMC). (b) A positive relationship between CWM Leaf Area (LA) and Soil Total Nitrogen (TN). The solid black line in each panel represents the linear regression model fit, and the shaded area (if included) represents the 95% confidence interval.
Preprints 178489 g004

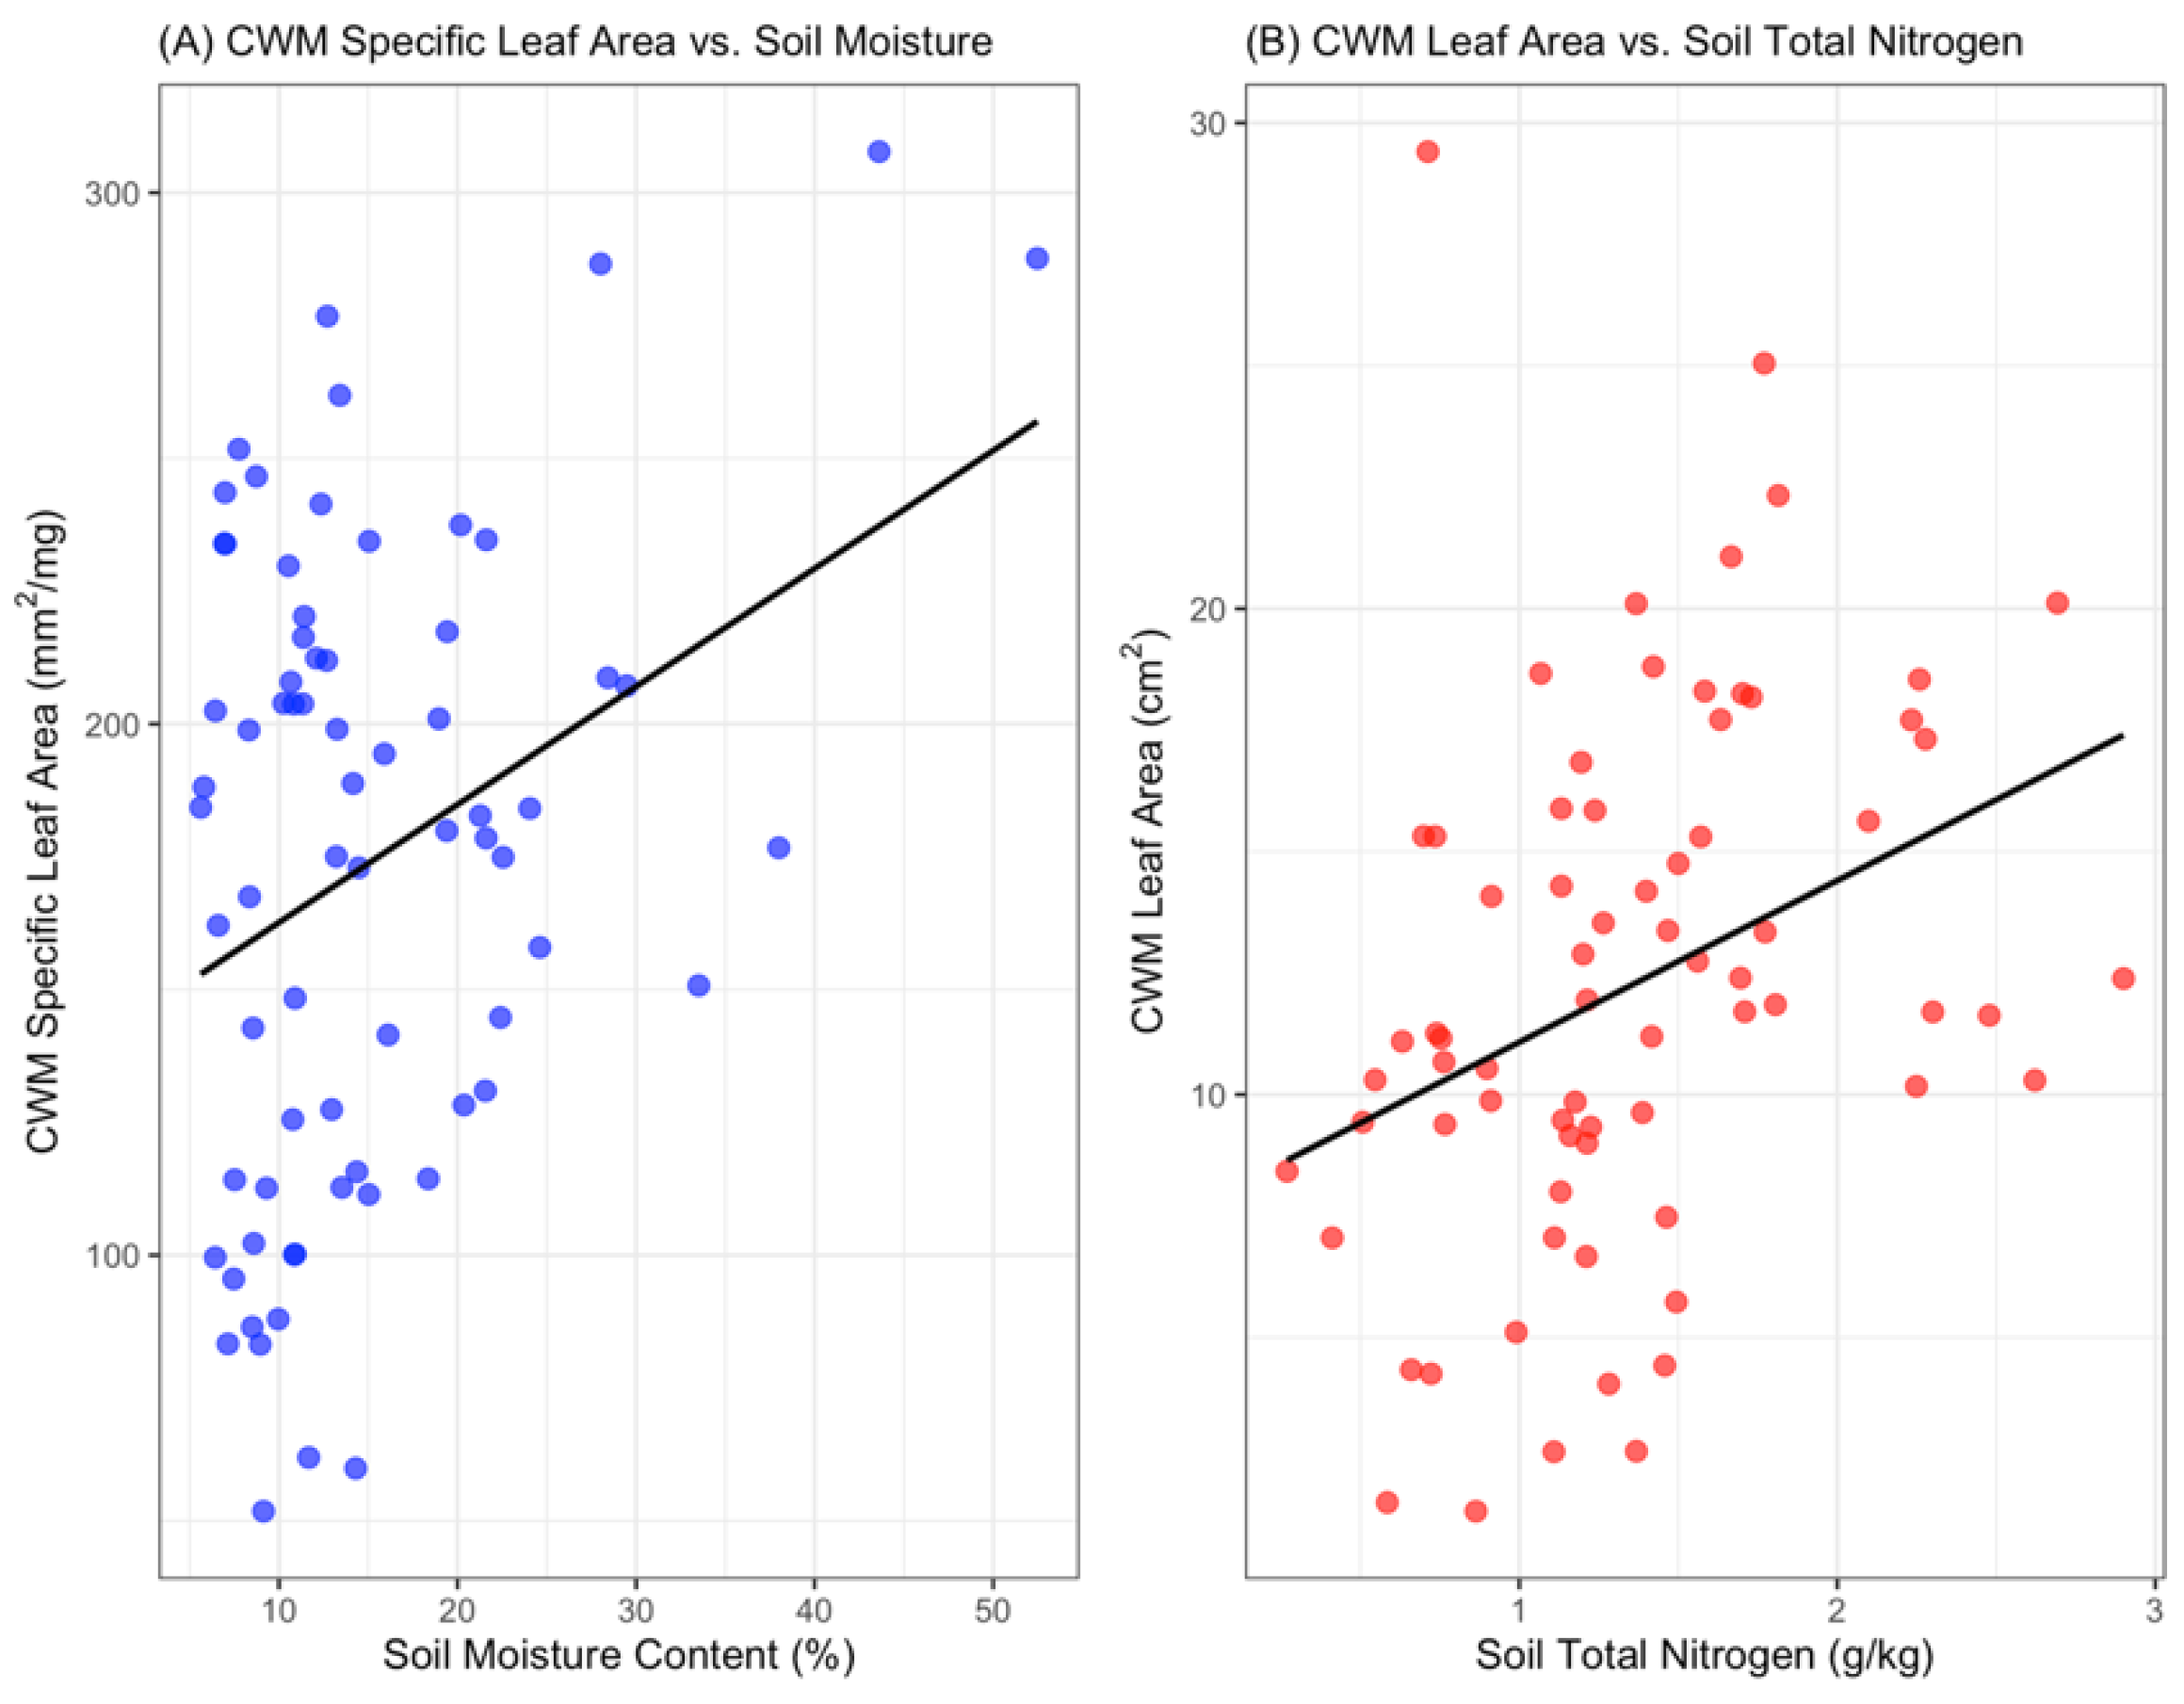
3.2. Strong Evidence of Trait-Based Environmental Filtering in Plant Communities

The functional composition of the extant plant communities strongly reflected the underlying environmental gradients, providing clear evidence of non-random, trait-based assembly processes (Figure 4). Across all 75 plots, community-weighted mean (CWM) traits varied widely, with CWM Specific Leaf Area (SLA) ranging from 45.2 to 315.6 mm2/mg and CWM Leaf Area (LA) from 0.09 to 19.06 cm2.
Linear regression analysis revealed significant trait-environment relationships. We observed a strong negative correlation between CWM-SLA and soil moisture content (r = −0.69, p < 0.01) (Figure 4a). As soil moisture increased, the dominant community-level leaf strategy shifted demonstrably from a resource-acquisitive strategy (high SLA, thin leaves for rapid carbon gain) in drier zones to a more conservative one (low SLA, thicker, more durable leaves) in wetter zones. Concurrently, CWM-LA was strongly and positively correlated with soil Total Nitrogen (r = 0.82, p < 0.01) (Figure 4b). This indicates that communities in more fertile soils were dominated by species with larger leaf surfaces, maximizing light interception and photosynthetic capacity. Additionally, CWM plant height (H) showed a significant positive correlation with SWM (r = 0.58, p < 0.05), suggesting that greater resource availability allows for the dominance of taller, more competitive species.

3.3. CATS-Based Simulations and Functional Trade-Offs Across Microhabitats

The integrated functional performance of the existing communities, quantified by our novel Water-Carbon Coupling Index (WCCI), showed significant disparities among the microhabitat zones (ANOVA, F = 18.9, p < 0.001) (Figure 5). The communities in the fertile and moderately moist Zone D achieved the highest and most stable functional performance, with a mean WCCI of 0.58 ± 0.12. In stark contrast, communities in the arid Zone A exhibited the poorest performance, with a mean WCCI of only 0.38 ± 0.09. The performance in Zone B (mean WCCI = 0.41 ± 0.15) and Zone C (mean WCCI = 0.45 ± 0.11) fell in between.
Notably, the median WCCI in Zone D was approximately 1.5 times higher than that in Zone A, highlighting a substantial functional performance gap between the best and worst-performing microhabitats. The high coefficient of variation for WCCI in Zone B (36.6%) also suggests that its functional performance was not only low but also highly unstable. This quantitative assessment successfully diagnoses the functional deficits across the landscape, pinpointing Zone A and B as primary targets for restoration intervention. This indicates that functional deficits in arid and erosion-prone microhabitats cannot be resolved by natural succession alone, highlighting the necessity of targeted restoration interventions.

3.4. Optimized and Zone-Specific Community Assemblages for Functional Restoration

Applying the dual-filter optimization framework, we generated four distinct, tailored species assemblages designed to maximize the WCCI for each microhabitat zone (Figure 6). The model’s recommendations for species composition and relative abundance varied substantially, reflecting the need for precision restoration.
The assemblage for the arid and nutrient-poor Zone A is functionally characterized by stress-tolerant traits. The top three recommended species, allium vineale (13.3% relative abundance), potentilla reptans (9.9%), and astragalus membranaceus (8.0%), are all known for their drought resistance and collectively account for over 31% of the proposed community. In stark contrast, the recommended assemblage for the resource-rich Zone D is dominated by species with resource-acquisitive traits. The model selected for highly productive species such as juncus effusus (14.3%), potentilla multifida (8.7%), and achillea millefolium (7.5%), which are capable of rapidly utilizing the available water and nutrients.
The configuration for Zone C, which has intermediate conditions, included a balanced mix of species, with carex rigescens (11.2%) and artemisia sieversiana (9.5%) as the dominant components. The model proposed a total of 18 species for Zone A, while for the more stable Zone D, it recommended a slightly more diverse assemblage of 22 species, demonstrating its ability to tailor not only species identity but also community richness to local conditions.

4. Discussion

This study advances a trait-based restoration framework by moving beyond the conventional goals of species reassembly to the targeted optimization of a critical ecosystem process: water-carbon coupling. Our findings demonstrate that by integrating a novel functional index (WCCI) into a spatially explicit modeling framework, it is possible to design functionally superior plant communities tailored to the heterogeneous conditions of degraded landscapes.

4.1. An Innovative Framework for Optimizing Biogeochemical Function

The central innovation of this study is the development of the Water–Carbon Coupling Index (WCCI) and its integration into a dual-filter CATS optimization framework. Unlike conventional restoration strategies that aim to approximate reference communities, our framework establishes WCCI as an explicit functional target and directly designs assemblages to maximize this outcome. The empirical results demonstrate the added value of this approach. Observed communities exhibited large functional disparities across microhabitats, with mean WCCI ranging from 0.38 in the arid Zone A to 0.58 in the fertile Zone D (ANOVA, p < 0.05; Figure 5). By applying WCCI as the optimization criterion, the CATS model produced assemblages with significantly higher functional efficiency: optimized communities in Zone A increased their CWM-WCCI from 0.38 (± 0.09) to 0.62 (± 0.08), while Zone D rose from 0.58 (± 0.12) to 0.71 (± 0.10). These gains demonstrate that the framework is not simply descriptive but prescriptive, capable of identifying configurations that outperform both natural recovery and reference-based mimicry. Importantly, the optimization highlighted functional keystone species such as Polygonum aviculare and Cleistogenes caespitosa, which consistently contributed to WCCI improvement across multiple zones. Together, these findings validate WCCI as a robust indicator of biogeochemical efficiency and establish the dual-filter CATS framework as a practical tool for function-oriented restoration.

4.2. The Mechanisms of Functional Optimization: Filters, Keystones, and Soil Feedbacks

The observed improvement in WCCI through optimization invites the question of why certain communities can achieve higher water–carbon coupling. Our results provide three complementary mechanistic explanations.
First, environmental filtering at the microhabitat scale emerged as a decisive constraint on functional potential[64]. For example, optimized communities in Zone D (fertile and moderately moist) reached a mean CWM-WCCI of 0.71, whereas Zone A (arid and erosion-prone) plateaued at 0.62 despite optimization. This 15% functional gap underscores that soil water and nutrient conditions set an upper limit on achievable efficiency, operationalizing habitat filtering theory in a restoration context[65]. Second, functional performance was disproportionately driven by a small number of keystone species[66]. In the natural communities, Polygonum aviculare, Cleistogenes caespitosa, and Artemisia frigida together accounted for more than 45% of the community-level WCCI. Their traits illustrate complementary strategies: acquisitive growth and rapid cover formation in P. aviculare enhanced carbon gain, while the stress tolerance and low SLA of C. caespitosa and A. frigida improved water-use efficiency under drought[67,68]. The optimized assemblages consistently elevated the relative abundance of these species, confirming their central role in driving functional gains. Third, links between functional optimization and soil processes suggest potential feedback mechanisms[69]. Communities with higher CWM-WCCI showed positive correlations with soil moisture (r = 0.41) and organic matter (r = 0.36), even though these relationships were not statistically significant given sample size. This pattern implies that functionally efficient communities may contribute to soil stabilization and nutrient retention, reinforcing the long-term sustainability of restored ecosystems.
Together, these findings provide mechanistic support for the WCCI-based framework: environmental filters define the boundary conditions, functional keystone species drive disproportionate contributions, and soil feedbacks may lock in improvements over time. Conceptually, this advances trait-based theory by demonstrating that functional optimization is not only predictable but also explainable through established ecological principles.

4.3. Practical Implications: From Precision Restoration to Sustainable Agronomy

From an applied perspective, the WCCI–CATS framework provides a concrete pathway for precision restoration in heterogeneous, degraded landscapes. The diagnosis of functional performance revealed that arid and erosion-prone zones (e.g., Zone A, mean WCCI = 0.38) and moisture-rich but unstable zones (Zone B, mean WCCI = 0.41 with CV = 36.6%) are unlikely to recover functional efficiency through natural succession alone. These zones therefore represent priority targets for intervention. By contrast, Zone D, with both higher fertility and a mean WCCI of 0.58, can be considered relatively resilient and may require only minimal assistance.
The optimization outputs move beyond descriptive assessment to actionable prescriptions. For each microhabitat, the framework generated zone-specific assemblages: stress-tolerant species such as Allium vineale and Astragalus membranaceus were emphasized in Zone A, while resource-acquisitive species like Juncus effusus dominated Zone D (Figure 6). These tailored mixes are predicted to deliver dual ecological benefits: (i) greater water-use efficiency and soil moisture conservation in arid zones, and (ii) enhanced carbon fixation and biomass accumulation in resource-rich zones. This dual benefit is particularly valuable for mining landscapes, where both soil stability and carbon sequestration are urgent restoration goals.
Importantly, the approach is not limited to post-mining contexts. Because the framework rests on general ecological principles—microhabitat stratification, functional trade-off quantification, and optimization for explicit outcomes—it is transferable to other fragile ecosystems where water limitation and carbon cycling are tightly coupled. Potential applications include semi-arid grasslands facing overgrazing, riparian corridors subject to erosion, and sloping agricultural lands prone to degradation. Beyond ecological restoration, the WCCI can also inform sustainable agronomy practices:
i.
Cover crop design: selecting species mixtures that simultaneously build soil organic carbon and reduce evaporation losses during fallow periods.
ii.
Pasture revitalization: identifying grass–forb combinations that increase forage productivity while enhancing drought resilience.
iii.
Buffer zone management: deploying species with high WCCI to improve water retention and erosion control in agroforestry or watershed protection schemes.
In this way, the framework provides not only a tool for ecological rehabilitation but also a generalizable strategy for designing multifunctional plant communities that reconcile productivity, resilience, and sustainability.

4.4. Limitations and Future Directions

While the WCCI–CATS framework represents a methodological advance, several limitations should be acknowledged.
First, the analysis is based primarily on above-ground functional traits (e.g., SLA, height, foliage cover). Although these traits are strong predictors of water–carbon processes, they cannot fully capture below-ground dynamics such as rooting depth, hydraulic lift, or soil–microbe interactions[70]. This simplification may underestimate the role of traits directly linked to water acquisition and carbon stabilization in soils. Second, the framework is inherently static. It identifies optimal assemblages for a given set of environmental conditions, but does not simulate successional trajectories, dispersal, or species turnover[71]. As a result, the predicted communities represent functional “endpoints,” and the long-term stability of these optimized assemblages under climate variability or disturbance remains uncertain. Third, the correlation between WCCI and soil health indicators (e.g., r = 0.41 for soil moisture, r = 0.36 for organic matter) was encouraging but not statistically significant, partly due to limited sample size. This highlights the need for larger-scale and longitudinal datasets to rigorously test whether communities optimized for high WCCI can indeed reinforce soil quality and ecosystem resilience through feedback processes. Finally, the species pool used in the optimization is site-specific. While the framework is transferable, the actual species lists must be recalibrated to local conditions, which requires reliable trait databases and careful validation in different ecological contexts.
Future research should therefore pursue four directions: (i) expanding trait datasets to include below-ground, hydraulic, and physiological traits[72]; (ii) coupling the optimization framework with dynamic, spatially explicit models that simulate recruitment, mortality, and successional change[73]; (iii) conducting field trials to compare the establishment, persistence, and soil feedbacks of WCCI-optimized communities against conventional restoration mixes; and (iv) testing the framework across diverse degraded ecosystems (e.g., semi-arid grasslands, riparian corridors, sloping agricultural lands) to evaluate its generalizability.
By addressing these limitations, the WCCI–CATS framework can be further refined into a robust, predictive, and widely applicable tool for designing resilient ecosystems under conditions of land degradation and climate stress.
Figure 7. By starting with a trait-based design centered on the WCCI, we can generate resilient plant communities that not only enhance water-carbon synergy but also initiate a positive feedback loop, leading to improved soil moisture, organic matter, and stability. This entire process directly contributes to the dual goals of climate change adaptation and the implementation of sustainable land management practices, such as optimized cover cropping and agroforestry systems.
Preprints 178489 g007

5. Conclusions

This study highlights the importance of understanding the role of microtopography and plant functional traits in optimizing water-carbon coupling efficiency during ecological restoration. Our findings demonstrate that different microhabitats exhibit distinct functional characteristics that influence plant community structure and ecological recovery. Specifically, the CATS model simulations revealed that species functional traits, such as SLA, height, and drought tolerance, play significant roles in enhancing water and carbon cycling efficiency in different zones.
The results suggest that the success of ecological restoration is not solely dependent on plant species diversity but on the functional traits of those species. In particular, species like polygonum aviculare and cleistogenes caespitosa, which exhibit high water-use efficiency and resilience to environmental stress, were found to be key contributors to improving water-carbon synergy in restored ecosystems.
Furthermore, ecological filters, such as soil moisture, nutrient levels, and erosion intensity, act as critical determinants of the functional performance of plant communities. This reinforces the need for restoration strategies that consider local environmental conditions and functional trait diversity to improve ecosystem resilience. Ultimately, the insights gained from this study can guide the design of more effective and targeted restoration efforts, aimed at enhancing ecosystem functionality and resilience to environmental changes.

Acknowledgments

The authors would like to express their sincere gratitude to the Inner Mongolia Autonomous Region Science and Technology Plan Project (Grant No. 2023YFDZ0025) and the National Natural Science Foundation of China (Grant No. 41907047) for financial support. We also thank our colleagues and mentors for their valuable guidance throughout this study. The constructive comments and suggestions from the anonymous reviewers and editors are deeply appreciated, as they greatly improved the quality of this manuscript.

References

  1. Zhou, G.; Eisenhauer, N.; Terrer, C.; Eldridge, D.J.; Duan, H.; Guirado, E.; Berdugo, M.; Zhou, L.; Liu, S.; Zhou, X.; et al. Resistance of Ecosystem Services to Global Change Weakened by Increasing Number of Environmental Stressors. Nat. Geosci. 2024, 17, 882–888. [Google Scholar] [CrossRef]
  2. Nolan, C.; Overpeck, J.T.; Allen, J.R.M.; Anderson, P.M.; Betancourt, J.L.; Binney, H.A.; Brewer, S.; Bush, M.B.; Chase, B.M.; Cheddadi, R.; et al. Past and Future Global Transformation of Terrestrial Ecosystems under Climate Change. Science 2018, 361, 920–923. [Google Scholar] [CrossRef]
  3. Farooq, M.; Khan, U.; Adnan, M.; Younas, W.; Qureshi, N.B.; Yasir, Q.M.; Cai, Q.; Chiu, M.-C. Global Decline of Aquatic and Terrestrial Insects Driven by Climate Change and Anthropogenic Impacts: The Interaction of Multiple Stressors and Disruption of Niche Conservatism. Biological Conservation 2025, 308, 111181. [Google Scholar] [CrossRef]
  4. Scholes, R.; Montanarella, L.; Brainich, A.; Barger, N.; Brink, B.; Cantele, M.; Erasmus, B.; Fisher, J.; Gardner, T.; Holland, T.; et al. IPBES (2018): Summary for Policymakers of the Assessment Report on Land Degradation and Restoration of the Intergovernmental SciencePolicy Platform on Biodiversity and Ecosystem Services. In; 2018.
  5. Prăvălie, R.; Patriche, C.; Borrelli, P.; Panagos, P.; Roșca, B.; Dumitraşcu, M.; Nita, I.-A.; Săvulescu, I.; Birsan, M.-V.; Bandoc, G. Arable Lands under the Pressure of Multiple Land Degradation Processes. A Global Perspective. Environmental Research 2021, 194, 110697. [Google Scholar] [CrossRef]
  6. Hossain, A.; Krupnik, T.J.; Timsina, J.; Mahboob, M.G.; Chaki, A.K.; Farooq, M.; Bhatt, R.; Fahad, S.; Hasanuzzaman, M. Agricultural Land Degradation: Processes and Problems Undermining Future Food Security. In Environment, Climate, Plant and Vegetation Growth; Fahad, S., Hasanuzzaman, M., Alam, M., Ullah, H., Saeed, M., Ali Khan, I., Adnan, M., Eds.; Springer International Publishing: Cham, 2020; pp. 17–61. ISBN 978-3-030-49731-6. [Google Scholar]
  7. Habibullah, M.S.; Din, B.H.; Tan, S.-H.; Zahid, H. Impact of Climate Change on Biodiversity Loss: Global Evidence. Environ Sci Pollut Res 2022, 29, 1073–1086. [Google Scholar] [CrossRef] [PubMed]
  8. Kleespies, M.W.; Hahn-Klimroth, M.; Dierkes, P.W. Perceptions of Biodiversity Loss among Future Decision-Makers in 37 Countries. npj biodivers 2024, 3, 21. [Google Scholar] [CrossRef]
  9. Fu, L.; Huang, J.; Zhang, G.; Han, D.; Ding, L.; Wei, Y.; Liu, X.; Li, C.; Yu, H. Abrupt Loss of Species Richness Caused by Ecosystem Transition. Science Bulletin 2025, 70, 1523–1532. [Google Scholar] [CrossRef]
  10. Fu, B.; Liu, Y.; Meadows, M.E. Ecological Restoration for Sustainable Development in China. National Science Review 2023, 10, nwad033. [Google Scholar] [CrossRef] [PubMed]
  11. Gann, G. The Language(s) of Ecological Restoration. Ecological Restoration 2009, 27, 3–4. [Google Scholar] [CrossRef]
  12. Kremer, K.N.; Bauhus, J. Drivers of Native Species Regeneration in the Process of Restoring Natural Forests from Mono--specific, Even--aged Tree Plantations: A Quantitative Review. Restoration Ecology 2020, 28, 1074–1086. [Google Scholar] [CrossRef]
  13. Qian, J.; Ji, C.; Yang, J.; Zhao, H.; Wang, Y.; Fu, L.; Liu, Q. The Advantage of Afforestation Using Native Tree Species to Enhance Soil Quality in Degraded Forest Ecosystems. Sci Rep 2024, 14, 20022. [Google Scholar] [CrossRef]
  14. Thomas, E.; Jalonen, R.; Loo, J.; Boshier, D.; Gallo, L.; Cavers, S.; Bordács, S.; Smith, P.; Bozzano, M. Genetic Considerations in Ecosystem Restoration Using Native Tree Species. Forest Ecology and Management 2014, 333, 66–75. [Google Scholar] [CrossRef]
  15. Moreno-Mateos, D.; Alberdi, A.; Morriën, E.; Van Der Putten, W.H.; Rodríguez-Uña, A.; Montoya, D. The Long-Term Restoration of Ecosystem Complexity. Nat Ecol Evol 2020, 4, 676–685. [Google Scholar] [CrossRef]
  16. Loureiro, N.; Mantuano, D.; Manhães, A.; Sansevero, J. Use of the Trait-Based Approach in Ecological Restoration Studies: A Global Review. Trees 2023, 37, 1287–1297. [Google Scholar] [CrossRef]
  17. Burylo, M.; Rey, F.; Mathys, N.; Dutoit, T. Plant Root Traits Affecting the Resistance of Soils to Concentrated Flow Erosion. Earth Surf Processes Landf 2012, 37, 1463–1470. [Google Scholar] [CrossRef]
  18. Brudvig, L.A. The Restoration of Biodiversity: Where Has Research Been and Where Does It Need to Go? American J of Botany 2011, 98, 549–558. [Google Scholar] [CrossRef]
  19. Brancalion, P.H.S.; Niamir, A.; Broadbent, E.; Crouzeilles, R.; Barros, F.S.M.; Almeyda Zambrano, A.M.; Baccini, A.; Aronson, J.; Goetz, S.; Reid, J.L.; et al. Global Restoration Opportunities in Tropical Rainforest Landscapes. Sci. Adv. 2019, 5, eaav3223. [Google Scholar] [CrossRef] [PubMed]
  20. Box, E.O. Plant Functional Types and Climate at the Global Scale. J Vegetation Science 1996, 7, 309–320. [Google Scholar] [CrossRef]
  21. Aubin, I.; Munson, A.D.; Cardou, F.; Burton, P.J.; Isabel, N.; Pedlar, J.H.; Paquette, A.; Taylor, A.R.; Delagrange, S.; Kebli, H.; et al. Traits to Stay, Traits to Move: A Review of Functional Traits to Assess Sensitivity and Adaptive Capacity of Temperate and Boreal Trees to Climate Change. Environ. Rev. 2016, 24, 164–186. [Google Scholar] [CrossRef]
  22. Niklas, K.J.; Shi, P.; Gielis, J.; Schrader, J.; Niinemets, Ü. Editorial: Leaf Functional Traits: Ecological and Evolutionary Implications. Front. Plant Sci. 2023, 14, 1169558. [Google Scholar] [CrossRef]
  23. Xing, Y.; Deng, S.; Bai, Y.; Wu, Z.; Luo, J. Leaf Functional Traits and Their Influencing Factors in Six Typical Vegetation Communities. Plants 2024, 13, 2423. [Google Scholar] [CrossRef]
  24. Rawat, M.; Arunachalam, K.; Arunachalam, A.; Alatalo, J.M.; Pandey, R. Assessment of Leaf Morphological, Physiological, Chemical and Stoichiometry Functional Traits for Understanding the Functioning of Himalayan Temperate Forest Ecosystem. Sci Rep 2021, 11, 23807. [Google Scholar] [CrossRef]
  25. Liu, H.; Yin, D.; He, P.; Cadotte, M.W.; Ye, Q. Linking Plant Functional Traits to Biodiversity under Environmental Change. Biological Diversity 2024, 1, 22–28. [Google Scholar] [CrossRef]
  26. Gross, N.; Bagousse-Pinguet, Y.L.; Liancourt, P.; Berdugo, M.; Gotelli, N.J.; Maestre, F.T. Functional Trait Diversity Maximizes Ecosystem Multifunctionality. Nat Ecol Evol 2017, 1, 0132. [Google Scholar] [CrossRef] [PubMed]
  27. Laughlin, D.C.; Strahan, R.T.; Huffman, D.W.; Sánchez Meador, A.J. Using Trait--based Ecology to Restore Resilient Ecosystems: Historical Conditions and the Future of Montane Forests in Western North America. Restoration Ecology 2017, 25. [Google Scholar] [CrossRef]
  28. Laughlin, D.C.; Laughlin, D.E. Advances in Modeling Trait-Based Plant Community Assembly. Trends in Plant Science 2013, 18, 584–593. [Google Scholar] [CrossRef]
  29. Laughlin, D.C.; Joshi, C.; Van Bodegom, P.M.; Bastow, Z.A.; Fulé, P.Z. A Predictive Model of Community Assembly That Incorporates Intraspecific Trait Variation. Ecology Letters 2012, 15, 1291–1299. [Google Scholar] [CrossRef] [PubMed]
  30. Laughlin, D.C. Applying Trait-Based Models to Achieve Functional Targets for Theory-Driven Ecological Restoration. Ecol Lett 2014, 17, 771–784. [Google Scholar] [CrossRef]
  31. Caners, R.T.; Lieffers, V.J. Divergent Pathways of Successional Recovery for In Situ Oil Sands Exploration Drilling Pads on Wooded Moderate--Rich Fens in Alberta, Canada. Restoration Ecology 2014, 22, 657–667. [Google Scholar] [CrossRef]
  32. Holyoak, M.; Caspi, T.; Redosh, L.W. Integrating Disturbance, Seasonality, Multi-Year Temporal Dynamics, and Dormancy Into the Dynamics and Conservation of Metacommunities. Front. Ecol. Evol. 2020, 8, 571130. [Google Scholar] [CrossRef]
  33. Bakker, J.D.; Price, J.N.; Henning, J.A.; Batzer, E.E.; Ohlert, T.J.; Wainwright, C.E.; Adler, P.B.; Alberti, J.; Arnillas, C.A.; Biederman, L.A.; et al. Compositional Variation in Grassland Plant Communities. Ecosphere 2023, 14, e4542. [Google Scholar] [CrossRef]
  34. George, A.B.; Wang, T.; Maslov, S. Functional Convergence in Slow-Growing Microbial Communities Arises from Thermodynamic Constraints. The ISME Journal 2023, 17, 1482–1494. [Google Scholar] [CrossRef] [PubMed]
  35. Yan, P.; He, N.; Yu, K.; Xu, L.; Van Meerbeek, K. Integrating Multiple Plant Functional Traits to Predict Ecosystem Productivity. Commun Biol 2023, 6, 239. [Google Scholar] [CrossRef]
  36. Levine, J.I.; An, R.; Kraft, N.J.B.; Pacala, S.W.; Levine, J.M. Why Ecologists Struggle to Predict Coexistence from Functional Traits. Trends in Ecology & Evolution 2025, 40, 147–158. [Google Scholar] [CrossRef]
  37. Zirbel, C.R.; Brudvig, L.A. Trait–Environment Interactions Affect Plant Establishment Success during Restoration. Ecology 2020, 101, e02971. [Google Scholar] [CrossRef]
  38. Camps-Valls, G.; Fernández-Torres, M.-Á.; Cohrs, K.-H.; Höhl, A.; Castelletti, A.; Pacal, A.; Robin, C.; Martinuzzi, F.; Papoutsis, I.; Prapas, I.; et al. Artificial Intelligence for Modeling and Understanding Extreme Weather and Climate Events. Nat Commun 2025, 16, 1919. [Google Scholar] [CrossRef]
  39. Díaz, S.; Kattge, J.; Cornelissen, J.H.C.; Wright, I.J.; Lavorel, S.; Dray, S.; Reu, B.; Kleyer, M.; Wirth, C.; Colin Prentice, I.; et al. The Global Spectrum of Plant Form and Function. Nature 2016, 529, 167–171. [Google Scholar] [CrossRef]
  40. Thakur, M.P.; Van Der Putten, W.H.; Wilschut, R.A.; Veen, G.F. (Ciska); Kardol, P.; Van Ruijven, J.; Allan, E.; Roscher, C.; Van Kleunen, M.; Bezemer, T.M. Plant–Soil Feedbacks and Temporal Dynamics of Plant Diversity–Productivity Relationships. Trends in Ecology & Evolution 2021, 36, 651–661. [Google Scholar] [CrossRef]
  41. Gornish, E.S.; Campbell, C.; Svejcar, L.; Munson, S.M.; Vaughn, K.; Spaeth, M.K.; Yelenik, S.G.; Wolf, A.; Mitchell, R. Functional Traits Are Used in Restoration Practice: A Response to Merchant et al. (2022). Restoration Ecology 2023, 31, e13880. [Google Scholar] [CrossRef]
  42. Merchant, T.K.; Henn, J.J.; De Silva, I.; Van Cleemput, E.; Suding, K.N. Aspirational Goals for the Future of Functional Traits in Restoration: A Response to Gornish et al. (2023). Restoration Ecology 2025, 33, e14336. [Google Scholar] [CrossRef]
  43. Crisfield, V.E.; Ficken, C.D.; Allen, B.E.; Jog, S.K.; Bried, J.T. The Potential of Trait Data to Increase the Availability of Bioindicators: A Case Study Using Plant Conservatism Values. Ecological Applications 2023, 33, e2866. [Google Scholar] [CrossRef]
  44. Visscher, A.M.; Vandelook, F.; Fernández-Pascual, E.; Pérez-Martínez, L.V.; Ulian, T.; Diazgranados, M.; Mattana, E. Low Availability of Functional Seed Trait Data from the Tropics Could Negatively Affect Global Macroecological Studies, Predictive Models and Plant Conservation. Annals of Botany 2022, 130, 773–784. [Google Scholar] [CrossRef] [PubMed]
  45. Zhao, Y.; Yuan, X.; Ran, W.; Zhao, Z.; Su, D.; Song, Y. The Ecological Restoration Strategies in Terrestrial Ecosystems Were Reviewed: A New Trend Based on Soil Microbiomics. Ecology and Evolution 2025, 15, e70994. [Google Scholar] [CrossRef] [PubMed]
  46. Boretti, A. Evaluating Water Use Efficiency and CO2 Absorption in Plants under Rising Atmospheric Carbon Dioxide Levels. Journal of Atmospheric and Solar-Terrestrial Physics 2025, 266, 106409. [Google Scholar] [CrossRef]
  47. Torres--Ruiz, J.M.; Cochard, H.; Delzon, S.; Boivin, T.; Burlett, R.; Cailleret, M.; Corso, D.; Delmas, C.E.L.; De Caceres, M.; Diaz--Espejo, A.; et al. Plant Hydraulics at the Heart of Plant, Crops and Ecosystem Functions in the Face of Climate Change. New Phytologist 2024, 241, 984–999. [Google Scholar] [CrossRef]
  48. Still, C.J. Trading Water for Carbon. Nature Geosci 2018, 11, 702–703. [Google Scholar] [CrossRef]
  49. Nakad, M.; Sevanto, S.; Domec, J.-C.; Katul, G. Linking the Water and Carbon Economies of Plants in a Drying and Warming Climate. Curr. For. Rep. 2023, 9, 383–400. [Google Scholar] [CrossRef]
  50. Li, W.; Duveiller, G.; Wieneke, S.; Forkel, M.; Gentine, P.; Reichstein, M.; Niu, S.; Migliavacca, M.; Orth, R. Regulation of the Global Carbon and Water Cycles through Vegetation Structural and Physiological Dynamics. Environ. Res. Lett. 2024, 19, 073008. [Google Scholar] [CrossRef]
  51. Gentine, P.; Green, J.K.; Guérin, M.; Humphrey, V.; Seneviratne, S.I.; Zhang, Y.; Zhou, S. Coupling between the Terrestrial Carbon and Water Cycles—a Review. Environ. Res. Lett. 2019, 14, 083003. [Google Scholar] [CrossRef]
  52. Zhao, F.; Shi, W.; Xiao, J.; Zhao, M.; Li, X.; Wu, Y. Recent Weakening of Carbon-Water Coupling in Northern Ecosystems. npj Clim Atmos Sci 2025, 8, 161. [Google Scholar] [CrossRef]
  53. Sun, P.; Wu, Y.; Xiao, J.; Hui, J.; Hu, J.; Zhao, F.; Qiu, L.; Liu, S. Remote Sensing and Modeling Fusion for Investigating the Ecosystem Water-Carbon Coupling Processes. Science of The Total Environment 2019, 697, 134064. [Google Scholar] [CrossRef]
  54. Novick, K.A.; Ficklin, D.L.; Stoy, P.C.; Williams, C.A.; Bohrer, G.; Oishi, A.C.; Papuga, S.A.; Blanken, P.D.; Noormets, A.; Sulman, B.N.; et al. The Increasing Importance of Atmospheric Demand for Ecosystem Water and Carbon Fluxes. Nature Clim Change 2016, 6, 1023–1027. [Google Scholar] [CrossRef]
  55. El Masri, B.; Schwalm, C.; Huntzinger, D.N.; Mao, J.; Shi, X.; Peng, C.; Fisher, J.B.; Jain, A.K.; Tian, H.; Poulter, B.; et al. Carbon and Water Use Efficiencies: A Comparative Analysis of Ten Terrestrial Ecosystem Models under Changing Climate. Sci Rep 2019, 9, 14680. [Google Scholar] [CrossRef] [PubMed]
  56. Wang, Y.-P.; Zhang, L.; Liang, X.; Yuan, W. Coupled Models of Water and Carbon Cycles from Leaf to Global: A Retrospective and a Prospective. Agricultural and Forest Meteorology 2024, 358, 110229. [Google Scholar] [CrossRef]
  57. Peters, W.; Van Der Velde, I.R.; Van Schaik, E.; Miller, J.B.; Ciais, P.; Duarte, H.F.; Van Der Laan-Luijkx, I.T.; Van Der Molen, M.K.; Scholze, M.; Schaefer, K.; et al. Increased Water-Use Efficiency and Reduced CO2 Uptake by Plants during Droughts at a Continental Scale. Nature Geosci 2018, 11, 744–748. [Google Scholar] [CrossRef]
  58. Bacelar, E.L.V.A.; Moutinho-Pereira, J.M.; Gonçalves, B.M.C.; Brito, C.V.Q.; Gomes-Laranjo, J.; Ferreira, H.M.F.; Correia, C.M. Water Use Strategies of Plants under Drought Conditions. In Plant Responses to Drought Stress; Aroca, R., Ed.; Springer Berlin Heidelberg: Berlin, Heidelberg, 2012; pp. 145–170. ISBN 978-3-642-32652-3. [Google Scholar]
  59. McDowell, N.G.; Sapes, G.; Pivovaroff, A.; Adams, H.D.; Allen, C.D.; Anderegg, W.R.L.; Arend, M.; Breshears, D.D.; Brodribb, T.; Choat, B.; et al. Mechanisms of Woody-Plant Mortality under Rising Drought, CO2 and Vapour Pressure Deficit. Nat Rev Earth Environ 2022, 3, 294–308. [Google Scholar] [CrossRef]
  60. Beugnon, R.; Albert, G.; Hähn, G.; Yu, W.; Haider, S.; Hättenschwiler, S.; Davrinche, A.; Rosenbaum, B.; Gauzens, B.; Eisenhauer, N. Improving Forest Ecosystem Functions by Optimizing Tree Species Spatial Arrangement. Nat Commun 2025, 16, 6286. [Google Scholar] [CrossRef]
  61. Wikum, D.A.; Shanholtzer, G.F. Application of the Braun-Blanquet Cover-Abundance Scale for Vegetation Analysis in Land Development Studies. Environmental Management 1978, 2, 323–329. [Google Scholar] [CrossRef]
  62. Hou, J.; Wu, M.; Feng, H. Applying Trait-Based Modeling to Achieve Functional Targets during the Ecological Restoration of an Arid Mine Area. 2022. [CrossRef]
  63. Li, J. Global Patterns of Plant Functional Traits and Their Relationships to Climate. 2024. [CrossRef]
  64. Asefa, M.; Cao, M.; Zhang, G.; Ci, X.; Li, J.; Yang, J. Environmental Filtering Structures Tree Functional Traits Combination and Lineages across Space in Tropical Tree Assemblages. Sci Rep 2017, 7, 132. [Google Scholar] [CrossRef] [PubMed]
  65. Li, Y.; Shipley, B.; Price, J.N.; Dantas, V.D.L.; Tamme, R.; Westoby, M.; Siefert, A.; Schamp, B.S.; Spasojevic, M.J.; Jung, V.; et al. Habitat Filtering Determines the Functional Niche Occupancy of Plant Communities Worldwide. Journal of Ecology 2018, 106, 1001–1009. [Google Scholar] [CrossRef]
  66. Liu, S.; Yu, H.; Yu, Y.; Huang, J.; Zhou, Z.; Zeng, J.; Chen, P.; Xiao, F.; He, Z.; Yan, Q. Ecological Stability of Microbial Communities in Lake Donghu Regulated by Keystone Taxa. Ecological Indicators 2022, 136, 108695. [Google Scholar] [CrossRef]
  67. Yan, P.; He, N.; Fernández--Martínez, M.; Yang, X.; Zuo, Y.; Zhang, H.; Wang, J.; Chen, S.; Song, J.; Li, G.; et al. Plant Acquisitive Strategies Promote Resistance and Temporal Stability of Semiarid Grasslands. Ecology Letters 2025, 28, e70110. [Google Scholar] [CrossRef] [PubMed]
  68. Zhang, H.; Zhao, Y.; Zhu, J.-K. Thriving under Stress: How Plants Balance Growth and the Stress Response. Developmental Cell 2020, 55, 529–543. [Google Scholar] [CrossRef]
  69. Xi, N.; Adler, P.B.; Chen, D.; Wu, H.; Catford, J.A.; Van Bodegom, P.M.; Bahn, M.; Crawford, K.M.; Chu, C. Relationships between Plant–Soil Feedbacks and Functional Traits. Journal of Ecology 2021, 109, 3411–3423. [Google Scholar] [CrossRef]
  70. Bardgett, R.D.; Mommer, L.; De Vries, F.T. Going Underground: Root Traits as Drivers of Ecosystem Processes. Trends in Ecology & Evolution 2014, 29, 692–699. [Google Scholar] [CrossRef]
  71. Laughlin, D.C.; Chalmandrier, L.; Joshi, C.; Renton, M.; Dwyer, J.M.; Funk, J.L. Generating Species Assemblages for Restoration and Experimentation: A New Method That Can Simultaneously Converge on Average Trait Values and Maximize Functional Diversity. Methods Ecol Evol 2018, 9, 1764–1771. [Google Scholar] [CrossRef]
  72. McCormack, M.L.; Guo, D.; Iversen, C.M.; Chen, W.; Eissenstat, D.M.; Fernandez, C.W.; Li, L.; Ma, C.; Ma, Z.; Poorter, H.; et al. Building a Better Foundation: Improving Root--trait Measurements to Understand and Model Plant and Ecosystem Processes. New Phytologist 2017, 215, 27–37. [Google Scholar] [CrossRef] [PubMed]
  73. Pan, H.; Zhang, L.; Cong, C.; Deal, B.; Wang, Y. A Dynamic and Spatially Explicit Modeling Approach to Identify the Ecosystem Service Implications of Complex Urban Systems Interactions. Ecological Indicators 2019, 102, 426–436. [Google Scholar] [CrossRef]
Figure 5. Variation of the Water-Carbon Coupling Index (WCCI) across microhabitat zones. Violin plots combined with boxplots show the distribution of WCCI values for existing plant communities within each zone. The shape of the violin illustrates the probability density of the data, while the boxplot summarizes the median and interquartile range. Significant differences in WCCI highlight the varying functional performance of communities across the environmental mosaic.
Preprints 178489 g005
Figure 6. Optimized species assemblages for each microhabitat zone as recommended by the dual-filter model. The stacked bar chart displays the proposed relative abundance of species for restoring each microhabitat zone (A, B, C, D, E). Each colored segment within a bar represents a specific plant species, with its height proportional to its recommended relative abundance. These configurations are designed to maximize the Water-Carbon Coupling Index (WCCI) while ensuring biotic compatibility.
Preprints 178489 g006
Disclaimer/Publisher’s Note: The statements, opinions and data contained in all publications are solely those of the individual author(s) and contributor(s) and not of MDPI and/or the editor(s). MDPI and/or the editor(s) disclaim responsibility for any injury to people or property resulting from any ideas, methods, instructions or products referred to in the content.
Copyright: This open access article is published under a Creative Commons CC BY 4.0 license, which permit the free download, distribution, and reuse, provided that the author and preprint are cited in any reuse.
Prerpints.org logo

Preprints.org is a free preprint server supported by MDPI in Basel, Switzerland.

Subscribe

Disclaimer

Terms of Use

Privacy Policy

Privacy Settings

© 2025 MDPI (Basel, Switzerland) unless otherwise stated