
Submitted:
23 September 2024
Posted:
24 September 2024
You are already at the latest version
Abstract
Human activities continuously alter the delivery of ecosystem services (ESs), which play a crucial role in human well-being. There is a pressing need for effective ecological management strategies that consider the spatial heterogeneity of ESs to support the transition from trade-offs to synergies. This study focuses on the Haba River Basin and examines characteristics of land use change and the shift from trade-offs to synergies. The results indicate that from 1990 to 2000, the initial phase of land development, 10.65% of the land experienced change. Subsequently, during the intensive period of land development from 2000 to 2010, 30.29% of the land underwent significant transformation, with approximately 78% of grassland, sparse grassland, forested land, and desert converted into arable land. However, between 2010 and 2020, as the focus shifted towards the establishment of native vegetation and the intensity of land development decreased, only a small percentage (3.65%) of the total area underwent changes. Based on an in-depth analysis of spatial heterogeneity from 1990 to 2020, it is believed there has been a shift from trade-offs to co-benefits between 2000-2010 and 2010-2020. The years 2010 and 2020 were pivotal time nodes for the transition from trade-offs to synergies and for reducing trade-offs, with NPP identified as a critical driving factor for Comprehensive ES (CES) functions. By considering the trade-offs/synergies relationship and hotspots of ecological service functions, combined with unified water resource management policies, comprehensive ecological management measures tailored to different regions are proposed. These measures have facilitated the implementation of robust ecological protection policies to shift ES development from trade-offs to synergies in arid areas, thereby enhancing overall ecosystem service functions in the Haba River Basin. The research findings offer crucial scientific support and guidance for ecosystem management in arid areas, particularly within Central Asia.
Keywords:
Ecosystem services
; spatial-temporal pattern
; arid area
; trade-offs and synergies
; Central Asia
1. Introduction
Ecosystem services (ESs) were defined in the Millennium Ecosystem Assessment (MA) by the United Nations as the benefits gained by humans from ecosystems (Finlayson, 2016). The stock of natural capital is crucial for the Earth’s life-support system and connects natural ecosystems and human well-being (Abson et al., 2014; Costanza et al., 1997). Due to the ongoing development of global socio-economics, factors such as population growth, expansion of cultivated land, and increasing urbanization have resulted in a significant decline in ESs, posing a threat to human survival and health (Bateman et al., 2013; Mbaabu et al., 2020; Srivathsa et al., 2023).
Generally, there are three types of relationship between ESs: synergistic, trade-offs, and neutral. A trade-off occurs when one service negatively affects another. When two services positively change in the same direction, they are termed synergistic (Lee and Lautenbach, 2016). The human development and exploitation of resources, without considering the trade-offs or synergies between ESs, may diminish certain ecosystems’ capacity and threaten their security. Land use indicates the interplay between socio-economic and natural systems, directly influencing ES (Xia et al., 2022). Analyzing the changes in the relationship between land use and ES function helps when proposing better strategies for ecosystem restoration (Guo et al., 2020). In recent years, the relationship changes between ES have become a research focus. Scholars have quantitatively evaluated relationships between different ES using various methods (Liang et al., 2021; Zhang et al., 2018). Numerous studies have delved into the trade-offs and synergies within the four categories of ecosystem service (Raudsepp-Hearne et al., 2010), as well as their respective subtypes, such as freshwater and food supply (Frank et al., 2014). Research into trade-offs in ESs has become essential for strategic planning, effective management, and informed decision-making (Feng et al., 2017). Consequently, assessing ESs and studying trade-offs or synergies can significantly guide ecological management and enhance human well-being (Lu et al., 2020).
Currently, global ecosystems are confronted by a multitude of challenges, particularly in arid regions; these include the expansion of cultivated areas, the retreat of wetlands, deforestation, overgrazing, intensified desertification, conflicts over water resources due to excessive development, reduced capacity for vegetation carbon sequestration and soil retention, and diminished biological conservation capacity. These challenges have presented significant obstacles to ESs, especially regulating services (Mbaabu et al., 2020; Berdugo et al., 2020; DeFries and Nagendra, 2017; Hou et al., 2022; Tully et al., 2015). Hence, research into ESs has expanded to include the evaluation of spatiotemporal dynamics and associated trade-offs/synergies across various spatial and temporal scales (Geng et al., 2022; Qiu et al., 2018). In terms of spatial scale, this encompasses analysis at the national level (Locatelli et al., 2014), regional level (Feng et al., 2017), river basin level (Wang et al., 2019), provincial level (Bai et al., 2019), and urban level (Fu et al., 2017). Numerous scholars are currently directing their attention to various areas at differing spatial scales, such as the Altay region, the economic belt of the northern slope of the Tianshan Mountains, and the Shiyang River basin, to research ecosystem service functions within arid regions. These studies suggest that the spatial distribution of trade-offs and synergies that change with changing land use can affect the provision of ESs(Wang et al., 2019).
Most existing research has focused on examining the relationships controlling ecosystem service trade-offs at large spatial scales. However, there is a lack of exploration into small spatial scales, particularly in arid areas where few ecosystem trade-offs at this scale are considered in ecological management. Only a few scholars have researched the spatial heterogeneity and trade-offs/synergies of carbon storage, water conservation, soil retention, and net primary productivity at the county scale, proposing ecological trade-offs/synergies within different land use types (Yue Li and Hongfen Luo, 2023). However, researchers have failed to effectively consider spatial heterogeneity in accurately delineating the trade-off/synergy dynamics across various regions within the study area (Locatelli et al., 2014). This is why contemporary ecological management predominantly relies on macro-level strategies (e.g., overgrazing, deforestation), posing challenges for implementing targeted management interventions (Fu et al., 2015).
It is imperative to characterize the finer spatial heterogeneity of ESs in arid areas, elucidate the mechanism of effective ecosystem management in balancing and coordinating changes in ESs, propose efficient ecological management strategies for diverse regions, facilitate the transition of ESs from equilibrium to coordination, and enhance the functionality of ESs. These are critical scientific inquiries that warrant further exploration. To address this critical need, the present study involved a spatial analysis of land use changes spanning the period from 1990 to 2020 and investigated the spatiotemporal variations of four essential ecosystem functions: water conservation (WC), soil retention (SC), biodiversity conservation (BC), and oxygen release and carbon sequestration (CS). Ultimately, the study comprehensively compared the spatial balance/coordinated relationships of ecosystem functions with the overall functional changes in hot and cold spot areas over the past three decades. The primary objectives of this study were to elucidate the mechanism of transition from trade-off to synergies in arid areas, propose ecological governance measures tailored to different regions, facilitate the shift of ESs from trade-offs to synergies, refine and enhance the overall functions of ESs in the entire region, and provide guidance for effective ecological management in arid areas. The findings of this study can offer scientific insights for the effective management of similar regions in the world’s arid areas, mainly providing crucial technological support for managing ecosystems in ecologically vulnerable regions such as the Aral Sea basin and Tarim River basin in Central Asia (White, 2013), as well as arid areas in Africa.
This study aims to characterize the spatial heterogeneity of ES, promote transitions from trade-offs to synergies between ES, propose effective management measures for different partitions within the whole basin, and serve as a crucial scientific reference for effective management in arid areas (Figure 1).
2. Materials and Methods
2.1. Study Area
The Haba River Basin, situated in the Altay Prefecture of Xinjiang Uygur Autonomous Region in northwest China, is located between 85°31′~87°09′E and 47°38′~49°09N, covering an area of 8180.57km2. Positioned within the heartland of the Eurasian continent, it constitutes a crucial segment of the Irtysh River basin. It is one of the pivotal ecological functional zones in northwest China (Huang et al., 2021) (Figure 2). This region experiences a typical continental cold climate with low precipitation and high evaporation rates. With annual precipitation of just 205.6mm and an average yearly temperature of 5.3℃, it holds significant importance within Central Asia’s arid expanse (He et al., 2021). The area is inhabited by rare wildlife species, such as elk, cranes, and argali sheep, alongside diverse varieties of poplar trees, including silver poplar. It is the exclusive natural habitat for poplar forests in China and functions as a genetic repository for various types of poplar trees, while showcasing a distinctive oasis desert landscape (Yang et al., 2023a; Zeng et al., 2016). The uneven distribution of water resources has resulted in water scarcity emerging as a primary constraint on socio-economic development and ecological equilibrium within this locale (He et al., 2021). Simultaneously, it represents a quintessential agricultural and pastoral development zone within arid regions.
The ecological background of the region is highly favorable. However, intensive human activities have led to significant ecological challenges, including agricultural water and soil resource development and extensive use of water resources for irrigation systems, resulting in rising groundwater levels downstream and secondary salinization issues. Overgrazing and drought have also contributed to grassland degradation, desertification, and a decline in biodiversity (Fu et al., 2017). In response to these challenges, China has implemented various management policies and projects such as ecological water replenishment, returning farmland to forest or grassland, grazing prohibition, and grassland protection subsidies. These efforts have effectively addressed critical socio-economic development and ecological restoration challenges (Fu et al., 2015; Hanchu et al., 2021; Yang et al., 2023a), improving the ESs within the Haba River Basin. This transformation aligns with the shift from trade-offs to synergies in ES. Therefore, this study focusses on the Haba River Basin not only because of the severe ecosystem degradation caused by human interference, but also because it is a typical area for promoting effective ecological restoration through management practices. It thus provided a valuable experimental area for conducting this study.
2.2. Data Resources
Table 1 shows the primary data sources. For the study, land-use raster data for 1990, 2000, 2010, and 2020 were obtained from the Resources and Environmental Sciences, Chinese Academy of Sciences (RESDC) (https://www.resdc.cn/), with a spatial resolution of 30 m. The land-use types for the four periods were reclassified using ArcGIS 10.8 software, categorizing them into nine types: farmland, forest, shrubland, grassland, sparse grassland, water, wetlands, desert, and construction land. Land use classification results were further corrected on the basis of field surveys with interpretation accuracy reaching more than 90%. A Digital Elevation Model (DEM) was downloaded from the Geospatial Data Cloud platform (https://www.gscloud.cn) with a spatial resolution of 30m. Slope and aspect were computed based on the DEM. Meteorological station data from around the Haba River Basin for 1961–2020 were extracted from the China Meteorological Science Data Center (http://data.cma.cn/), providing multi-year precipitation data. The precipitation data for 1990, 2000, 2010, and 2020 were derived from 1km raster data using Kriging interpolation. Soil texture and type spatial data were sourced from a 1:1,000,000 Soil Database (https://www.resdc.cn) with a 1km resolution. Monthly evapotranspiration data and NPP datasets were sourced from the National Ecosystem Science Data Center Data Platform (http://www.nesdc.org.cn/). In contrast, the NDVI dataset was obtained from the Geographic remote sensing ecological network platform (http://www.gisrs.cn/), with a spatial resolution of 1 km. Socio-economic data were sourced from the Haba River County Chronicles and the Haba River Yearbook.
To ensure consistent calculation, all data were first geographically corrected through coordinate projection, ensuring they were in the same coordinate system before being cropped according to the study area. Subsequently, the resampling tool in ArcGIS was used to unify the data required for evaluating the four ES to a spatial resolution of 250 m×250 m.
2.3. Methods
First, spatial changes in the study area were analyzed using a land-use transfer matrix. Based on methods such as water balance equations, soil erosion equations, habitat suitability assessment, the NPP quantitative index method, and the minimum cumulative resistance model, the spatiotemporal heterogeneity of four typical ES functions (WC, SC, BC, and CS) within the study area were characterized. By integrating these four ES categories, the temporal and spatial evolution characteristics of the Comprehensive ES (CES) over the past 30 years were obtained. Second, temporal and spatial variations in the four individual ES and CES were analyzed utilizing spatial hotspot analysis methods. By deriving both bivariate global and local Moran’s I index, the spatial tradeoffs/synergies between various ES were explored at the whole basin and grid scales, quantifying the contributions of the four individual ES to the CES.
Furthermore, by comparing and analyzing the years 1990, 2000, 2010, and 2020, under intense human activity interference, years with the most effective ecological service functions and those with significantly declining ecosystem service functions were identified. An assessment was made to determine whether ES functions have improved in recent years, identifying relationships transitioning from trade-offs to synergies among the ES or revealing declining trade-off patterns. Third, seventeen representative natural, social, and economic factors were selected(Xue et al., 2023). Through Spearman correlation analysis, the quantitative impacts of these 17 factors on various ES over nearly a decade were assessed, uncovering the driving mechanisms behind ES changes.
2.3.1. ES Evaluation Methods
Based on the Millennium Assessment, the study selected four key ES indicators (Duraiappah et al., 2005) and quantified them from 1990 to 2020. These indicators are Water Conservation (WC), Soil Conservation (SC), Biodiversity Conservation (BC), and Carbon Storage (CS). The detailed evaluation processes for each ES are shown in Table 2. WC represents the critical regulating service that ecosystems provide (Qin and Chen, 2023). In the study, the water conservation function of the area was assessed by calculating the water balance equation using ArcGIS 10.8. SC is an essential safeguard against regional land degradation and flood risk prevention (Bai et al., 2022). Using the modified RUSLE model, we performed raster calculations in ArcGIS 10.8 based on single-factor evaluation data reflecting the sensitivity of various factors to soil erosion. Within the BC function, habitats are crucial areas that promote ecological processes and sustain ES functions, ensuring regional biodiversity and sustainable development (Jieming Kang et al., 2021). Compared to previous studies that often used a single habitat suitability assessment method in models to determine habitat quality, the study evaluated habitat suitability for several focal species in the arid areas based on actual species diversity surveys. This approach reflects the critical role of ESs in biodiversity conservation. CS is a vital ecosystem service (Zhang et al., 2017), and vegetation growth is a crucial metric for carbon sequestration and oxygen release. The study employed the NPP quantitative index method to evaluate vegetation ecosystems (Wu and Zhang, 2021; Yang et al., 2022), in combination with the MCR model to simulate the diffusion process of vegetative genetic resources and study the distribution of regional carbon storage capabilities. CES was constructed by integrating multiple key ES functions, considering the overall spatial heterogeneity in the study area (Wu and Fan, 2022). The evaluation process for each function is detailed in Table 2, and relevant model evaluation indicators can be found in Appendix A.
2.3.2. ES Trade-Offs and Synergies
- (1)
- Hotspot Analysis Method
Hotspot analysis can identify regions exhibiting significant changes in ecosystem service functions (Guo et al., 2020), and the Getis-Ord Gi* statistic is employed to examine the spatial clustering and distribution of ESs. The calculation is as follows:
where and are the mathematical expectation and coefficient of variation, respectively; is the spatial weight. If is positive and significant, it indicates a hotspot area where the values around location i are significantly higher than the average (high-value spatial clustering). Conversely, if is negative and significant, it indicates a cold spot area where the values around location i are significantly lower than the average (low-value spatial clustering). Hotspot areas consist of three levels: extremely significant hotspots (99% confidence), significant hotspots (95% confidence), and less significant hotspots (90% confidence); cold spot areas also include extremely significant cold spots (99% confidence), significant cold spots (95% confidence), and less significant cold spots (90% confidence), with the rest being non-significant areas.
- (2)
- Bivariate spatial correlation analysis
The study used Moran’s I (including bivariate global Moran’s I and local Moran’s I) to explore the spatial tradeoffs and synergies between different types of ES and between ES and CES. Using the GeoDa software, the global Moran’s I was employed to determine if there is a spatial correlation between various types of ES across the entire region and to what extent this spatial correlation exists. Meanwhile, the local bivariate Moran’s I indicates the spatial correlation of different ESs within distinct spatial grids (Anselin and Rey, 2014; Zhang et al., 2018). The calculation is as follows:
where and represent the global and local bivariate Moran’s I for different categories of ES, respectively. N is the total number of spatial units. is the spatial weight matrix used to measure the spatial correlation between i and j. The value of and ranges between -1 and 1. A positive I indicates a positive spatial correlation between two variables, whereas a negative I indicates a negative spatial correlation between them. The larger the absolute value of I, the stronger the spatial correlation between the variables. Positive and negative coefficients represent synergistic and trade-off relationships, respectively.
Next, the local bivariate spatial correlation is visualized using the Bivariate LISA method. The generated local spatial correlation types consist of four categories: H-H, H-L, L-H, and L-L. H-H represents a high-value cluster of the bivariate, H-L indicates high values clustered around low values, L-H denotes low values clustered around high values, and L-L signifies a low-value cluster of the bivariate. The study comprehensively considered various natural, economic, and social factors influencing ES and identified 17 factors for driving force analysis (Table 3 and Appendix B).
3. Results
3.1. Land Use Change and Transition
Grassland, sparse grassland, desert, forested land, and farmland are the main land types in the Haba River basin. Of these, grassland (39.6%) and sparse grassland (27.5%) are the most widespread and cover the largest land types. From 1990 to 2010, the largest increases were in grassland (23,309.7 hm2), arable land (16,275.6 hm2), and desert (12,379.8 hm2). The most considerable area reduction was 30809.9 hectares of forest land and 13704.8 hectares of shrub land. The wetland area increased significantly, and the construction land and water body areas did not fluctuate much. Over the thirty years, the most converted land types were grassland, forest, sparse grassland, and desert. Comparing 1990–2000, 2000–2010, and 2010–2020, the land-use changes were relatively small in the first and last decades. However, the middle decade witnessed more significant fluctuations. In the first decade, there was a notable transformation from forest to grassland in mountain areas.
In contrast, during the middle decade, changes were most evident on the oasis plains. In recent years, the primary land-use change has been an expansion of farmland and a reduction in wasteland, but the rate of farmland expansion has shown a declining trend (Appendix C). This indicates that ecological protection and restoration reservoir ecological regulation have effectively controlled the continuous expansion of farmland and grassland degradation. From 1990 to 2000, 10.7% of the land experienced transitional changes. From 2000 to 2010, this figure rose to 30.3%, with the majority of the increased farmland originating from grassland (accounting for 44.2%), sparse grassland (accounting for 26.6%), forest (accounting for 50.3%), and desert. From 2010 to 2020, only 3.7% of the land underwent transition, with the majority of new farmland coming from sparse grassland at 78.9%. The increased grassland mainly originated from forest (accounting for 47.6%), sparse grassland, and desert (Figure 3).
3.2. Spatiotemporal Heterogeneity of ES
Spatiotemporal distribution characteristics of WC, SC, BC, and CS are detailed in Appendix D. Area percentages of four ES significance levels are shown in Figure 4. Based on the spatiotemporal distribution characteristics of WC, it was found that regions with high WC functionality are mainly concentrated in the northern high mountain areas. Over the past 30 years, the area of regions with poor functionality has been increasing, indicating a gradual degradation of WC functionality. Examining the spatiotemporal distribution of SC, a decline in SC functionality was observed; in particular, a significant reduction in the area with excellent functionality. Over the past three decades, SC functionality has exhibited a significant downward trend, especially in the plains areas.
Regarding the spatiotemporal distribution of BC, areas with excellent functionality remained relatively stable, mainly distributed in the northern high mountains, middle and low mountains, hilly areas, and along the southern riverbanks on the plains. However, on the plains, the functionality was originally rated as excellent, but it transformed into areas rated average and poor around 2000, indicating severe habitat degradation. Although there was some recovery after 2010, the habitat remained fragmented. With the construction of ecological channels and supplementary ecological water, BC in the plains has improved. Examining the spatiotemporal distribution of CS, fluctuations were observed from 1990 to 2020. The area with excellent functionality experienced a sharp decline around 2010 but showed recovery by 2020. The area with poor functionality peaked in extent in 2010 and then declined, indicating some functional recovery. Geographically, significant degradation in ecological functions occurred along riverbanks on the plains around 2010 but showed a noticeable recovery by 2020.
Analyzing the spatiotemporal changes in CES (Figure 5) from 1990 to 2020, functionality has improved overall in the northern high mountain areas and middle and low mountain areas, although localized ecological degradation exists. The CES has seen positive development, with 2010 showing the most significant decline. The plains have experienced the most pronounced and concentrated changes in ecological functionality, with varying degrees of ecological degradation along riverbanks. The most severe degradation occurred in 2010, but by 2020, ecological functionality was significantly improved along riverbanks. Our data indicate that a series of ecological management policies have been implemented to improve the water condition of the ecosystem in the Haba River Basin.
3.3. Changes in ES Trade-Offs and Synergies
3.3.1. Changes in ES Cold and Hot Spots
Based on the spatial and temporal differences in the hotspots and cold spots for WC, SC, BC, and CS from 1990 to 2020 (Appendix E), the hotspots of WC are located in the northern mountain areas, while cold spots are concentrated on the plains. By 2020, although the area of cold spots on the plains had not decreased, their intensity had weakened. In 1990, the cold spots for SC were mainly distributed in the northern high mountain areas and along riverbanks, significantly reducing along riverbanks by 2010. The hotspots of SC shifted from the central hilly areas to the plains over 30 years. The hotspots for BC increased from the middle and high mountain areas to the plains over 30 years and gradually weakened, with cold spots in the central plains also decreasing over the same period. The hotspots for CS were concentrated in the central plains and hilly areas in 1990, gradually deteriorating by 2010 but re-emerging as significant hotspots by 2020. Cold spots in 1990 were along riverbanks, extending to the Haba River section by 2010 and eventually transforming into significant hotspots by 2020. From the proportion of cold spots and hotspots of CES (Figure 6), it is evident that highly significant hotspots dramatically increased in 2010 but reverted to near 2000’s levels by 2020. Both significant and less significant hotspots reached their lowest proportion in 2010.
Conversely, the area of extremely significant cold spots remained relatively stable, while significant cold spots experienced significant fluctuations around 2010, particularly showing an increase by 2020. Less significant cold spots sharply increased in 2010 but rapidly decreased by 2020, returning to 1990 and 2000 levels. Examining the trends in hotspots and cold spots from 1990 to 2020 (Figure 7) reveals that significant changes occurred in the northern high mountain areas, middle and low mountain areas, and on the plains. The cold spots in the northern high mountain and middle and low mountain areas decreased, mainly transitioning to non-significant areas. Hotspots were prevalent in the northern middle and low mountain areas and hilly areas, with a significant increase in the hilly areas after 2000. The changes in cold and hotspots were most pronounced between rivers. By 2020, hotspots along riverbanks had strengthened, while cold spots had diminished.
3.3.2. Spatiotemporal Divergence in Bivariate Trade-Offs and Synergies
- (1)
- ES Trade-offs and Synergies at the overall area scale
The results of the global bivariate Moran’s I are shown in Table 3. The strongest positive correlation was between SC and CS, while the strongest negative correlation was between WS and SC. There were significant negative spatial correlations between WC-SC and BC-WC (all Moran’s I value < 0, p-value < 0.01), with a decreasing trend in the negative correlation relationship from 1990 to 2020. In addition, there were significant positive correlations between BC-SC, SC-CS, and BC-CS (all Moran’s I value > 0, p-value < 0.01). The positive correlation between BC-SC showed an increasing trend before 2010 but decreased by 2020. The positive correlation for SC-CS decreased over time, while the BC-CS positive correlation decreased annually until it rose again in 2020. The CS-WC relationship was negative in 1990 but turned positive after that, showing an annual increase.

Table 3.
ES trade-offs/synergies at the overall area scale.
| Molan’s I | 1990 | 2000 | 2010 | 2020 |
|---|---|---|---|---|
| WC-SC | -0.50 | -0.560 | -0.414 | -0.431 |
| BC-WC | -0.058 | -0.104 | -0.054 | -0.055 |
| CS-WC | -0.076 | 0.036 | 0.038 | 0.193 |
| BC-SC | 0.116 | 0.148 | 0.158 | 0.134 |
| SC-CS | 0.269 | 0.227 | 0.214 | 0.129 |
| BC-CS | 0.110 | 0.104 | 0.065 | 0.113 |
Note: WC is water conservation, SC is soil conservation, BC is biodiversity conservation, and CS is carbon storage.
- (2)
- ES Trade-offs and Synergies at the Grid Scale
The local bivariate Moran’s I results illustrate the spatial correlations between different ES using bivariate LISA cluster analysis (Figure 8 and Figure 9). Within the clustering patterns of the four ES, H-H represents high-value synergies between two ES, L-L signifies low-value synergies between two ES and H-L, L-H denotes trade-offs between two ES. Over the past 30 years, the H-H areas between WC-SC have mainly been concentrated in the mid-low mountain areas and on the plains, with the area remaining relatively stable. The H-L areas were predominantly in the high mountain areas and on the plains,: the area has remained stable in the mountains but there has been a continuous decrease on the plains. The L-H areas have been prominently concentrated on the plains, with a stable area, but there was an increase in 2010.
For BC-WC, the H-H areas are mainly in mid-low mountains, with the area remaining stable. The L-L areas are concentrated in the upper parts of the plains, with the area stabilizing. The H-L areas are focused on the plains, with the area stabilizing, and there was a transition from H-L to non-significant areas after 2000 in parts of the downstream section of the Haba River. The L-H areas are concentrated in the mid-high mountains, remaining relatively stable but showing a slight increase by 2020.
For CS-WC, the H-H areas are primarily concentrated in the mid-low mountains, with a stable area. The L-L area is focused on the upper and southern parts along the riverbanks on the plains, showing a generally increasing trend, but a slight decline by 2020. The H-L areas are predominantly concentrated on the plains, with a decreasing area yearly, especially along the southern riverbanks, transitioning to L-L and non-significant areas. The L-H areas are concentrated in the mid-high mountainous regions, showing an increasing trend, with a slight decline by 2020.
For BS-SC, the H-H areas are mainly concentrated on the plains and in hilly areas, stable across much of the area but with a relatively significant increase by 2000. The L-L areas are concentrated in the mid-high mountains and are stable. The H-L areas focus on mid-high mountains and are stable. The L-H areas are mainly concentrated on the plains, showing a slight overall decline.
For SC-CS, the H-H areas are primarily concentrated in the mid-low mountains, hilly areas, and on the plains, with the proportion increasing until 2010 transitioning to non-significant areas by 2020. The L-L areas are mainly concentrated in the mid-high mountains, with the proportion increasing until 2010, but by 2020, there was a significant decline, transitioning to non-significant areas. The H-L areas are focused on the plains, showing an increasing trend with enhanced regional connectivity. The L-H areas are mainly concentrated in the mid-low mountains and on the plains along riverbanks, with the area showing a slight decline, but with an increase in the mid-low mountain areas by 2020.
4. Discussion
4.1. Driving Force Analysis of Spatiotemporal Differences in ES
Revealing the primary drivers of spatial heterogeneity in ES can assist decision-makers in formulating targeted ecological management measures (Jing et al., 2022). Numerous factors influence ES changes, such as land use, vegetation cover, NPP, meteorological conditions, and socio-economic factors (Liu et al., 2023). Existing studies have shown that natural factors significantly impact ES, and this driving process is complex, exhibiting varied responses across different regions (Rui-Fang et al., 2016). Since 2000, China has initiated the Western Development policy, resulting in intensified human disturbances and significant land use changes in the Basin, leading to ecological degradation. Since 2010, China has implemented a series of ecological protection measures, improving the development of ESs. This highlights that between 2000 and 2010, there was a significant decline in ES, while they generally improved from 2010 to 2020 (Figure 4). Therefore, we selected the years 2010 and 2020 to analyze 17 driving factors with four single ES and CES. Previous studies have indicated that precipitation, land use, DEM, weather, topography, and vegetation cover are primary factors affecting ES spatial heterogeneity (Guo et al., 2020; Li et al., 2022; Zhang et al., 2023). Our analysis found similarities in the spatial patterns of the four ES, with NPP contributing the most to CES, aligning with its recognized importance in ES, as shown in papers from China and elsewhere (Wang et al., 2017).
Analyzing the correlation between driving factors and each ES (Table 4 and Figure 10), it was observed that between 2010 and 2020, the synergistic relationship between CES and X4 (NPP) declined, corresponding to the observed transition of forest and shrubland to grassland. The synergies between CES and X5 (NDVI) increased, aligning with the overall improvement in CS (Figure 4). The trade-off relationship between CES and X3 (ET) is increasing. However, the synergies between CES and X1 (PRE) are increasing, shifting from synergies to trade-offs with X2 (TEM). All of these may contribute to worsening droughts caused by global climate change (Wang et al., 2016). The correlation between CES and factors like X6 (DEM), X7 (slope), X9 (soil erosion), X12 (population density), X13 (per cultivated area), X14 (livestock density), and X16 (distance to roads) strengthened. In contrast, relationships with X8 (surface runoff), X10 (soil type), and X17 (distance to river) decreased. Overall, despite increasing drought, ecological conditions improved, boosting agriculture, livestock farming, and eco-tourism, leading to the GDP of the basin continuing to increase. The spatial pattern of BC is most influenced by its distance to roads and other natural factors, reflecting China’s protective afforestation policies, with increasing biodiversity observed (Chidwala et al., 2014; Shenghu et al., 2013). The per-cultivated area will undoubtedly impact the spatial patterns of CS and BC. Livestock density is crucial for SC but has a minor overall impact. However, its synergies increased from 2010 to 2020, reflecting China’s ecological management policies (Fu et al., 2015; Yang et al., 2023b), such as rotational grazing, a ban on grazing, returning farmlands to grasslands, ecological compensation, forage base construction, and water resource management. These measures limited the ecological damage caused by grazing activities, enhancing the most influential natural factor, NPP, on CS. This indicates that China’s ecological management policies have shifted the trade-offs towards synergies or increased the synergies, effectively promoting overall improvement in ESs.
4.2. Pathways and Guidance for Enhancing ES
To depict accurately the spatial heterogeneity of the study area and reveal the trade-offs in arid areas, we explored the interactions of the four ES at the grid scale, aiming to provide more reasonable suggestions for ecological conservation and the development of agriculture and animal husbandry. First, we studied and determined the spatial distribution characteristics of the cold spots and hotspots for CES from 1990 to 2020 (Figure 11b). Over the 30 years, the hotspots (areas with improved functions) were mainly concentrated in the middle and high mountain areas, hilly areas, and the downstream areas on both sides of the Haba River and along the banks of the Irtysh River. Cold spots (areas with decreased functions) were predominantly focused in the middle and low mountain areas and the upper parts of riverbanks on oasis plains. Second, we qualitatively compared the trade-offs/synergies between ES using bivariate spatial correlation analysis. Existing studies have shown that the ES of carbon and water cycles in arid areas are interdependent (Guo et al., 2020). The results of this study indicate that CS contributes most to the overall ecological function in the study area (Figure 11a). Enhancing the CS function will promote the overall improvement of ES, requiring us to pay more attention to the impacts of NPP, NDVI, and land types. The contribution of BC is next in line. Conducting protective afforestation on both sides of roads can reduce the impact on biodiversity in arid areas. The contribution of SC is decreasing over time, mainly influenced positively by TEM and ET, indicating that drought conditions are intensifying.
The high mountain area (A zone) is a hotspot for CES (enhanced functionality) and also serves as a tradeoff area (H-L) for WC-SC. This is because the mountain area has relatively higher precipitation and lower evaporation, making it a significant area for water conservation. However, influenced by DEM and slope, its soil conservation capabilities are low. The mid-low mountain area (B zone) is a cold spot for CES (weakened functionality) and is a high-value synergistic area (H-H) for WC-SC. The hilly area (C zone) is a hotspot for CES (enhanced functionality) and is also a high-value synergistic area (H-H) between WC-SC. Overall, the ES in the mountain areas are improving. Optimizing grazing activities, controlling livestock numbers appropriately, developing high-yield feed areas in the plains, promoting grassland agriculture, and preventing grassland degradation caused by excessive grazing are recommended (Fu et al., 2017). This could also increase the economic income of herdsmen (as shown in Figure 8 and Figure 11b).
The CES of the Oasis Plain has undergone significant changes, with pronounced hotspots and cold spots emerging. It acts as a trade-off area (L-H) for WC-SC. This is due to the relatively low precipitation, rising temperature, increased evaporation, and gentle terrain slope of the plains. As a result, the SC function is enhanced while the WC function declines. In the D zone of the plain, there is a shift in land types from grassland and sparse grassland to cultivated land. The cultivated area is expanding while its water retention capacity is decreasing. Regarding the CS-WC function relationship, the low-value synergistic areas are increasing (L-L), while the balancing areas are decreasing (H-L), indicating overall ecological degradation in the study area (as shown in Figure 8 and Figure 11). The E zone is predominantly cultivated land, with the CES function declining. Therefore, in the future, the area should carefully develop cultivated land, strictly implement the basic farmland protection policy, and strictly control any expansion of cultivated land. Alongside preserving high-quality farmland, efforts should be made to improve water resource utilization efficiency, manage the scale of oasis areas sensibly, and transition towards more efficient agriculture. This can be achieved by enhancing soil fertility, increasing crop yields, expanding pasture establishment, and fostering agricultural development (Fu et al., 2017; Xia et al., 2023).
Over the three decades, on the plains, zones F-1, F-2, G-3, and G-4 are generally considered hotspot areas (Figure 8 and Figure 11). They also act as high-value synergistic areas for SC-CS (H-H), indicating a positive trend for development in ecological functions. The enhancement of ES along the Haba River and the Irtysh River suggests that, since 2010, ES functionality has generally stabilized with the implementation of China’s ecological civilization construction and local reservoir ecological scheduling. In the future, efforts should continue to strengthen the scheduling of ecological reserves to enhance ES functionality. Conversely, the G-1, G-2, and G-5 zones are cold spots, indicating a decline in ecosystem functionality. These are areas that require strengthened ecological management. It is recommended that effective water resource management methods are established, to maintain consistent water resource management, to link water from the eastern Berezik River with that from the western Haba River, to construct an ecological river channel network between grasslands and wetlands on the plains, and to adopt infiltrating irrigation (Deng et al., 2020). According to the phenological rhythm, water should be replenished in grasslands and wetlands (in the G-1, G-2, G-3, G-4, and G-5 zones) to promote overall ES improvement. Continuous ecological scheduling should be maintained in the F-1 and F-2 zones, ecological scheduling should be increased in the F-3 zone, ecosystem service functions should be further enhanced, precision watering for grasslands and wetlands should be implemented, and vegetation cover should be increased on the oasis plains.
In the desert zones of the plains (zones H-1, H-2, H-3), desertification is increasing, primarily due to the conversion of sparse grasslands and grasslands into desert areas. However, since 2010, the rate of desertification has slowed. There appears to be a balanced relationship (H-L) for both SC-CS and BC-CS. Establishing a comprehensive ecological warning and monitoring system to prevent further degradation of sparse grasslands is recommended. The study indicates that appropriately converting desert areas back to grasslands can contribute to the overall stability of ESs (Fu et al., 2017). It is advisable to improve the water conditions between the desert and the edges of grasslands and sparse grasslands and establish an effective windbreak and sand fixation network to prevent the spread of desertification.
The study has revealed the driving factors behind the spatiotemporal variations in ESs, finely depicted the spatial heterogeneity of ES functions, systematically disclosed the trade-offs and synergies in ES in different areas of the Haba River Basin, and proposed targeted ecological management strategies to guide the transition from areas of trade-offs to areas of synergies. The study will provide directions for the precise and effective management of arid areas, especially for the Tarim River basin (Guo et al., 2020) and the Aral Sea basin in Central Asia (White, 2013), Africa (Wangai et al., 2016), and other regions where the ecosystem service functions have transitioned from trade-offs to synergies. In addition, the detailed characterization of the spatial heterogeneity of ESs and the achievement of effective ecological management have significant reference value.
5. Conclusions
It is crucial to understand ES trade-offs and synergies in the Haba River Basin to enhance ES regional capacity, reduce ecological function conflicts, and achieve long-term sustainable development. Strengthening ecological management and transitioning from trade-offs to synergies in the management of ES in arid areas can effectively improve the ecological environment and economic sustainability, guiding ecological and socio-economic sustainable development in arid areas. From 1990 to 2020, due to water resource management policies, including ecological scheduling and the construction of ecological canal systems, there was a positive trend in the development of land and water resources. The CS function showed a trend of increasing, then decreasing, and increasing again. The high-value areas of CS on the plains are concentrated in the Haba River and Irtysh River basins, showing an overall improvement in ES. Temporally and spatially, ES have a clear dependency on the trade-off and synergistic interactions. The relationship between CS and WC shifted from trade-offs to synergies, while WS-SC and BC-WC generally showed trade-offs. However, at a more detailed spatial scale, different relationships between ES were present in different areas, exhibiting either trade-offs or synergies. To reduce the trade-offs between ES, it is necessary to protect the ecological environment of the Haba River basin, optimize the cultivated land area, and enhance the level of water resource management in arid areas. To achieve this, the following measures should be taken: (1) Optimize grazing activities in zones A and B, control livestock levels, and develop grassland agriculture by constructing high-yield feed areas on the plains. (2) Establish effective water resource management methods, continue ecological scheduling in zones F-1 and F-2, increase ecological scheduling in zone F-3, establish a connected water system, implement irrigation systems in zones G-1 to G-5, and ensure fine-scale watering for grasslands and wetlands to increase vegetation cover on the oasis plains. (3) Improve the water conditions between the desert areas (H-1, H-2, H-3) and the adjacent grasslands and sparse grasslands on the plains and establish an effective windbreak and sand fixation network. This study will help guide the transition of ecosystem service functions from trade-offs to synergies, especially by proposing fine-zoned management, focusing more on the spatial heterogeneity of ecosystem service functions in global arid regions. It provides crucial foundations for efficient, actionable, and detailed planning and effective management.
Author Contributions
Yan Xu: Conceptualization, Methodology, Project administration, Validation, Writing original draft. Xiaoyun Song: Methodology, Software, Validation, Visualization. Mingjiang Deng: Conceptualization, Methodology, Writing review & editing. Tao Bai: Conceptualization, Methodology. Wanghai Tao: Writing review & editing.
Data Availability Statement
The authors do not have permission to share data.
Acknowledgments
This research is supported by the National Key R&D Program Project of China (2023YFC3206700); the National Natural Science Foundation of China (52179025).
Declaration of competing interest
The authors declare that there are no known competing financial interests or personal relationships that could have influenced or appeared to influence any work that is reported in this paper.
References
- Abson, D.J., Von Wehrden, H., Baumgärtner, S., Fischer, J., Hanspach, J., Härdtle, W., Heinrichs, H., Klein, A.M., Lang, D.J., Martens, P., Walmsley, D., 2014. Ecosystem services as a boundary object for sustainability. Ecological Economics 103, 29–37. [CrossRef]
- Anselin, L., Rey, S.J., 2014. Modern spatial econometrics in practice: a guide to GeoDa, GeoDaSpace and PySAL. GeoDa Press, Chicago, IL.
- Bai, J., Zhou, Z., Li, J., Liu, T., Zhu, Q., Zheng, T., 2022. Predicting soil conservation service in the Jinghe River Basin under climate change. Journal of Hydrology 615, 128646. [CrossRef]
- Bai, Y., Ochuodho, T.O., Yang, J., 2019. Impact of land use and climate change on water-related ecosystem services in Kentucky, USA. Ecological Indicators 102, 51–64. [CrossRef]
- Bateman, I.J., Harwood, A.R., Mace, G.M., Watson, R.T., Abson, D.J., Andrews, B., Binner, A., Crowe, A., Day, B.H., Dugdale, S., Fezzi, C., Foden, J., Hadley, D., Haines-Young, R., Hulme, M., Kontoleon, A., Lovett, A.A., Munday, P., Pascual, U., Paterson, J., Perino, G., Sen, A., Siriwardena, G., Van Soest, D., Termansen, M., 2013. Bringing Ecosystem Services into Economic Decision-Making: Land Use in the United Kingdom. Science 341, 45–50. [CrossRef]
- Berdugo, M., Delgado-Baquerizo, M., Soliveres, S., Hernández-Clemente, R., Zhao, Y., Gaitán, J.J., Gross, N., Saiz, H., Maire, V., Lehmann, A., Rillig, M.C., Solé, R.V., Maestre, F.T., 2020. Global ecosystem thresholds driven by aridity. Science 367, 787–790. [CrossRef]
- Chidwala, A., Frimpong, S., Raman, A., 2014. Effect of shelterbelts on the abundance and diversity of Earthworms in pastures in the Central-West Tablelands of New South Wales, Australia. International Journal of Ecology and Environmental Sciences 40, 123–130.
- Costanza, R., d’Arge, R., de Groot, R., Farber, S., Grasso, M., Hannon, B., Limburg, K., Naeem, S., O’Neill, R.V., Paruelo, J., Raskin, R.G., Sutton, P., van den Belt, M., 1997. The value of the world’s ecosystem services and natural capital. Nature 387, 253–260. [CrossRef]
- DeFries, R., Nagendra, H., 2017. Ecosystem management as a wicked problem. Science 356, 265–270. [CrossRef]
- Deng M., Huang Q., Chang J., Huang S., 2020. Large-scale ecological operation research and practice. Journal of Hydraulic Engineering 51, 757–773. [CrossRef]
- Ding, T., Chen, Junfei, Fang, Z., Chen, Junyu, 2021. Assessment of coordinative relationship between comprehensive ecosystem service and urbanization: A case study of Yangtze River Delta urban Agglomerations, China. Ecological Indicators 133, 108454. [CrossRef]
- Duan Y., Liu Q., Lei Y., Li J., Liu W., Li Z., Wang R., 2020. Habitat selection of overwintering common crane (Grus grus) based on individuals tracking by satellite technology. Chinese Journal of Ecology 39, 2392–2399. [CrossRef]
- Duraiappah, A.K., Naeem, S., Agardy, T., Ash, N.J., Cooper, H.D., Diaz, S., Faith, D.P., Mace, G., McNeely, J.A., Mooney, H.A., Oteng-Yeboah, A.A., Pereira, H.M., Polasky, S., Prip, C., Reid, W.V., Samper, C., Schei, P.J., Scholes, R., Schutyser, F., Van Jaarsveld, A., 2005. Ecosystems and human well-being: biodiversity synthesis; a report of the Millennium Ecosystem Assessment. World Resources Institute.
- Feng, Q., Zhao, W., Fu, B., Ding, J., Wang, S., 2017. Ecosystem service trade-offs and their influencing factors: A case study in the Loess Plateau of China. Science of The Total Environment 607–608, 1250–1263. [CrossRef]
- Finlayson, C. M., 2016. Millennium Ecosystem Assessment, in: Finlayson, C. Max, Everard, M., Irvine, K., McInnes, R.J., Middleton, B.A., Van Dam, A.A., Davidson, N.C. (Eds.), The Wetland Book. Springer Netherlands, Dordrecht, pp. 1–5. [CrossRef]
- Frank, S., Fürst, C., Witt, A., Koschke, L., Makeschin, F., 2014. Making use of the ecosystem services concept in regional planning—trade-offs from reducing water erosion. Landscape Ecol 29, 1377–1391. [CrossRef]
- Fu, Q., Li, B., Hou, Y., Bi, X., Zhang, X., 2017. Effects of land use and climate change on ecosystem services in Central Asia’s arid regions: A case study in Altay Prefecture, China. Science of The Total Environment 607–608, 633–646. [CrossRef]
- Fu, Q., Li, B., Yang, L., Wu, Z., Zhang, X., 2015. Ecosystem Services Evaluation and Its Spatial Characteristics in Central Asia’s Arid Regions: A Case Study in Altay Prefecture, China. Sustainability 7, 8335–8353. [CrossRef]
- Gao, H., Teng, L.W., Wang, Y., Wang, J., Liu, Z., 2017. Habitat assessment of red deer (Cervus alashanicus) in the Helan Mountains, China. Acta Ecologica Sinica 37, 3926–3931.
- Geng, W., Li, Y., Zhang, P., Yang, D., Jing, W., Rong, T., 2022. Analyzing spatio-temporal changes and trade-offs/synergies among ecosystem services in the Yellow River Basin, China. Ecological Indicators 138, 108825. [CrossRef]
- Guo, J., Xu, H., Zhang, G., Yuan, K., Ling, H., 2020. The Enhanced Management of Water Resources Improves Ecosystem Services in a Typical Arid Basin. Sustainability 12, 8802. [CrossRef]
- Hanchu, L., Jie, F., Baoyin, L., Li, W., Qin, Q., 2021. Practical Exploration of Ecological Restoration and Management of the Mountains-Rivers-Forests-Farmlands-Lakes-Grasslands System in the Irtysh River Basin in Altay, Xinjiang. jore 12, 766–776. [CrossRef]
- He, B., Chang, J., Wang, Yimin, Wang, Yan, Zhou, S., Chen, C., 2021. Spatio-temporal evolution and non-stationary characteristics of meteorological drought in inland arid areas. Ecological Indicators 126, 107644. [CrossRef]
- Hou, Y., Chen, Y., Ding, J., Li, Z., Li, Y., Sun, F., 2022. Ecological Impacts of Land Use Change in the Arid Tarim River Basin of China. Remote Sensing 14, 1894. [CrossRef]
- Huang, W., Duan, W., Nover, D., Sahu, N., Chen, Y., 2021. An integrated assessment of surface water dynamics in the Irtysh River Basin during 1990–2019 and exploratory factor analyses. Journal of Hydrology 593, 125905. [CrossRef]
- Jieming Kang, Xin Zhang, Xiaowei Zhu, Baolei Zhang, 2021. Ecological security pattern: A new idea for balancing regional development and ecological protection. A case study of the Jiaodong Peninsula, China. Global Ecology and Conservation 26, e01472. [CrossRef]
- Jing H., Liu Y., He P., Zhang J., Dong J., Wang Y., 2022. Spatial heterogeneity of ecosystem services and it’s influencing factors in typical areas of the Qinghai-Tibet Plateau: A case study of Nagqu City. Acta Ecologica Sinica 42, 2657–2673.
- Lambeck, R.J., 1997. Focal Species: A Multi-Species Umbrella for Nature Conservation. Especies Focales: Una Sombrilla Multiespecifica para Conservar la Naturaleza. Conservation Biology 11, 849–856. [CrossRef]
- Lee, H., Lautenbach, S., 2016. A quantitative review of relationships between ecosystem services. Ecological Indicators 66, 340–351. [CrossRef]
- Li, D., Jiang, Z., Wang, Z., 1999. Activity Patterns and Habitat Selection of the Przewalski’s Gazelle (Procapra przewalskii) in the Qinghai Lake Region. Acta Theriologica Sinica 18–25. [CrossRef]
- Li, Y., Liu, W., Feng, Q., Zhu, M., Yang, L., Zhang, J., 2022. Quantitative Assessment for the Spatiotemporal Changes of Ecosystem Services, Tradeoff–Synergy Relationships and Drivers in the Semi-Arid Regions of China. Remote Sensing 14, 239. [CrossRef]
- Liang, J., Li, S., Li, Xiaodong, Li, Xin, Liu, Q., Meng, Q., Lin, A., Li, J., 2021. Trade-off analyses and optimization of water-related ecosystem services (WRESs) based on land use change in a typical agricultural watershed, southern China. Journal of Cleaner Production 279, 123851. [CrossRef]
- Lindenmayer, D.B., Manning, A.D., Smith, P.L., Possingham, H.P., Fischer, J., Oliver, I., McCarthy, M.A., 2002. The Focal-Species Approach and Landscape Restoration: a Critique. Conservation Biology 16, 338–345. [CrossRef]
- Liu, J., Pei, X., Zhu, W., Jiao, J., Wang, Z., 2023. Fine grid scale increases or decreases the trade-off effect between ES in mountain protected areas? Ecological Indicators 155, 110905. [CrossRef]
- Locatelli, B., Imbach, P., Wunder, S., 2014. Synergies and trade-offs between ecosystem services in Costa Rica. Envir. Conserv. 41, 27–36. [CrossRef]
- Lu, Y., Yang, Y., Sun, B., Yuan, J., Yu, M., Stenseth, N.Chr., Bullock, J.M., Obersteiner, M., 2020. Spatial variation in biodiversity loss across China under multiple environmental stressors. Sci. Adv. 6, eabd0952. [CrossRef]
- Mbaabu, P.R., Olago, D., Gichaba, M., Eckert, S., Eschen, R., Oriaso, S., Choge, S.K., Linders, T.E.W., Schaffner, U., 2020. Restoration of degraded grasslands, but not invasion by Prosopis juliflora, avoids trade-offs between climate change mitigation and other ecosystem services. Sci Rep 10, 20391. [CrossRef]
- Qin, H., Chen, Y., 2023. Spatial non-stationarity of water conservation services and landscape patterns in Erhai Lake Basin, China. Ecological Indicators 146, 109894. [CrossRef]
- Qiu, J., Carpenter, S.R., Booth, E.G., Motew, M., Zipper, S.C., Kucharik, C.J., Loheide Ii, S.P., Turner, M.G., 2018. Understanding relationships among ecosystem services across spatial scales and over time. Environ. Res. Lett. 13, 054020. [CrossRef]
- Qu, H., You, C., Feng, C.-C., Guo, L., 2024. Spatial responses of ecosystem services to carbon emission efficiency based on spatial panel models in the Yangtze River Economic Belt. Journal of Cleaner Production 434, 139953. [CrossRef]
- Raudsepp-Hearne, C., Peterson, G.D., Bennett, E.M., 2010. Ecosystem service bundles for analyzing tradeoffs in diverse landscapes. Proc. Natl. Acad. Sci. U.S.A. 107, 5242–5247. [CrossRef]
- Rui-Fang, H., De-Yong, Y., Jian-Guo, W., Qin-Feng, G., Liu Yu-Peng, A., 1Center for Human and Environment System Sustainability (CHESS), State Key Laboratory of Earth Surface Processes and Resource Ecology (ESPRE), Beijing Normal University, Beijing 100875, China;<br />2School of Life Sciences and Global Institute of Sustainability, Arizona State University, Tempe, AZ 85287, USA;<br />3USDA FS, Eastern Forest Environmental Threat Assessment Center, 3041 Cornwallis Rd. Research Triangle Park, NC 27709, USA, 2016. Constraint line methods and the applications in ecology. Chinese Journal of Plant Ecology 40, 1100–1109. [CrossRef]
- Shenghu, Y., Suocheng, D., Zehong, L., Jiajun, L., Junni, W., 2013. Carrying Capacity of Water Resources for Three-North Shelterbelt Construction in China. Journal of Resources and Ecology 4, 50–55. [CrossRef]
- Srivathsa, A., Vasudev, D., Nair, T., Chakrabarti, S., Chanchani, P., DeFries, R., Deomurari, A., Dutta, S., Ghose, D., Goswami, V.R., Nayak, R., Neelakantan, A., Thatte, P., Vaidyanathan, S., Verma, M., Krishnaswamy, J., Sankaran, M., Ramakrishnan, U., 2023. Prioritizing India’s landscapes for biodiversity, ecosystem services and human well-being. Nat Sustain 6, 568–577. [CrossRef]
- Tully, K., Sullivan, C., Weil, R., Sanchez, P., 2015. The State of Soil Degradation in Sub-Saharan Africa: Baselines, Trajectories, and Solutions. Sustainability 7, 6523–6552. [CrossRef]
- Wang, L., Yuan, X., Xie, Z., Wu, P., Li, Y., 2016. Increasing flash droughts over China during the recent global warming hiatus. Sci Rep 6, 30571. [CrossRef]
- Wang, X., Tan, K., Chen, B., Du, P., 2017. Assessing the Spatiotemporal Variation and Impact Factors of Net Primary Productivity in China. Sci Rep 7, 44415. [CrossRef]
- Wang, Y., Zhao, J., Fu, J., Wei, W., 2019. Effects of the Grain for Green Program on the water ecosystem services in an arid area of China—Using the Shiyang River Basin as an example. Ecological Indicators 104, 659–668. [CrossRef]
- Wangai, P.W., Burkhard, B., Müller, F., 2016. A review of studies on ecosystem services in Africa. International Journal of Sustainable Built Environment 5, 225–245. [CrossRef]
- White, K.D., 2013. Nature–Society Linkages in the Aral Sea Region. Journal of Eurasian Studies 4, 18–33. [CrossRef]
- Wischmeier, W.H., Smith, D.D., Administration, S., Hyattsville, (USA, M., 1978. Predicting rainfall erosion losses-A guide to conservation planning. XF2006179521.
- Wu, L., Fan, F., 2022. Assessment of ecosystem services in new perspective: A comprehensive ecosystem service index (CESI) as a proxy to integrate multiple ecosystem services. Ecological Indicators 138, 108800. [CrossRef]
- Wu, Q., Song, J., Sun, H., Huang, P., Jing, K., Xu, W., Wang, H., Liang, D., 2023. Spatiotemporal variations of water conservation function based on EOF analysis at multi time scales under different ecosystems of Heihe River Basin. Journal of Environmental Management 325, 116532. [CrossRef]
- Wu, X., Zhang, H., 2021. Evaluation of ecological environmental quality and factor explanatory power analysis in western Chongqing, China. Ecological Indicators 132, 108311. [CrossRef]
- Xia, F., Yang, Y., Zhang, S., Yang, Y., Li, D., Sun, W., Xie, Y., 2022. Influencing factors of the supply-demand relationships of carbon sequestration and grain provision in China: Does land use matter the most? Science of The Total Environment 832, 154979. [CrossRef]
- Xia, N., Hai, W., Tang, M., Song, J., Quan, W., Zhang, B., Ma, Y., 2023. Spatiotemporal evolution law and driving mechanism of production–living–ecological space from 2000 to 2020 in Xinjiang, China. Ecological Indicators 154, 110807. [CrossRef]
- Xue, C., Chen, X., Xue, L., Zhang, H., Chen, J., Li, D., 2023. Modeling the spatially heterogeneous relationships between tradeoffs and synergies among ecosystem services and potential drivers considering geographic scale in Bairin Left Banner, China. Science of The Total Environment 855, 158834. [CrossRef]
- Yang, L., Suo, M., Gao, S., Jiao, H., 2022. Construction of an Ecological Network Based on an Integrated Approach and Circuit Theory: A Case Study of Panzhou in Guizhou Province. Sustainability 14, 9136. [CrossRef]
- Yang, Z., Li, B., Nan, B., Dai, X., Peng, C., Bi, X., 2023a. A methodological framework for assessing pastoral socio-ecological system vulnerability: A case study of Altay Prefecture in Central Asia. Science of The Total Environment 862, 160828. [CrossRef]
- Yang, Z., Li, B., Nan, B., Dai, X., Peng, C., Bi, X., 2023b. A methodological framework for assessing pastoral socio-ecological system vulnerability: A case study of Altay Prefecture in Central Asia. Science of The Total Environment 862, 160828. [CrossRef]
- Yu K., 1999. Landscape ecological security patterns in biological conservation. Acta Ecologica Sinica 10–17.
- Yue Li, Hongfen Luo, 2023. Trade-off/synergistic changes in ecosystem services and geographical detection of its driving factors in typical karst areas in southern China. Ecological Indicators 154, 110811. [CrossRef]
- Zeng, Y.-F., Zhang, J.-G., Duan, A.-G., Abuduhamiti, B., 2016. Genetic structure of Populus hybrid zone along the Irtysh River provides insight into plastid-nuclear incompatibility. Sci Rep 6, 28043. [CrossRef]
- Zhang, T., Cao, G., Cao, S., Zhang, X., Zhang, J., Han, G., 2017. Dynamic assessment of the value of vegetation carbon fixation and oxygen release services in Qinghai Lake basin. Acta Ecologica Sinica 37, 79–84. [CrossRef]
- Zhang, Yan, Liu, Yanfang, Zhang, Yang, Liu, Yi, Zhang, G., Chen, Y., 2018. On the spatial relationship between ecosystem services and urbanization: A case study in Wuhan, China. Science of The Total Environment 637–638, 780–790. [CrossRef]
- Zhang, Z., Wan, H., Peng, S., Huang, L., 2023. Differentiated factors drive the spatial heterogeneity of ecosystem services in Xinjiang Autonomous Region, China. Front. Ecol. Evol. 11, 1168313. [CrossRef]
Figure 1.
The overall framework of the study.
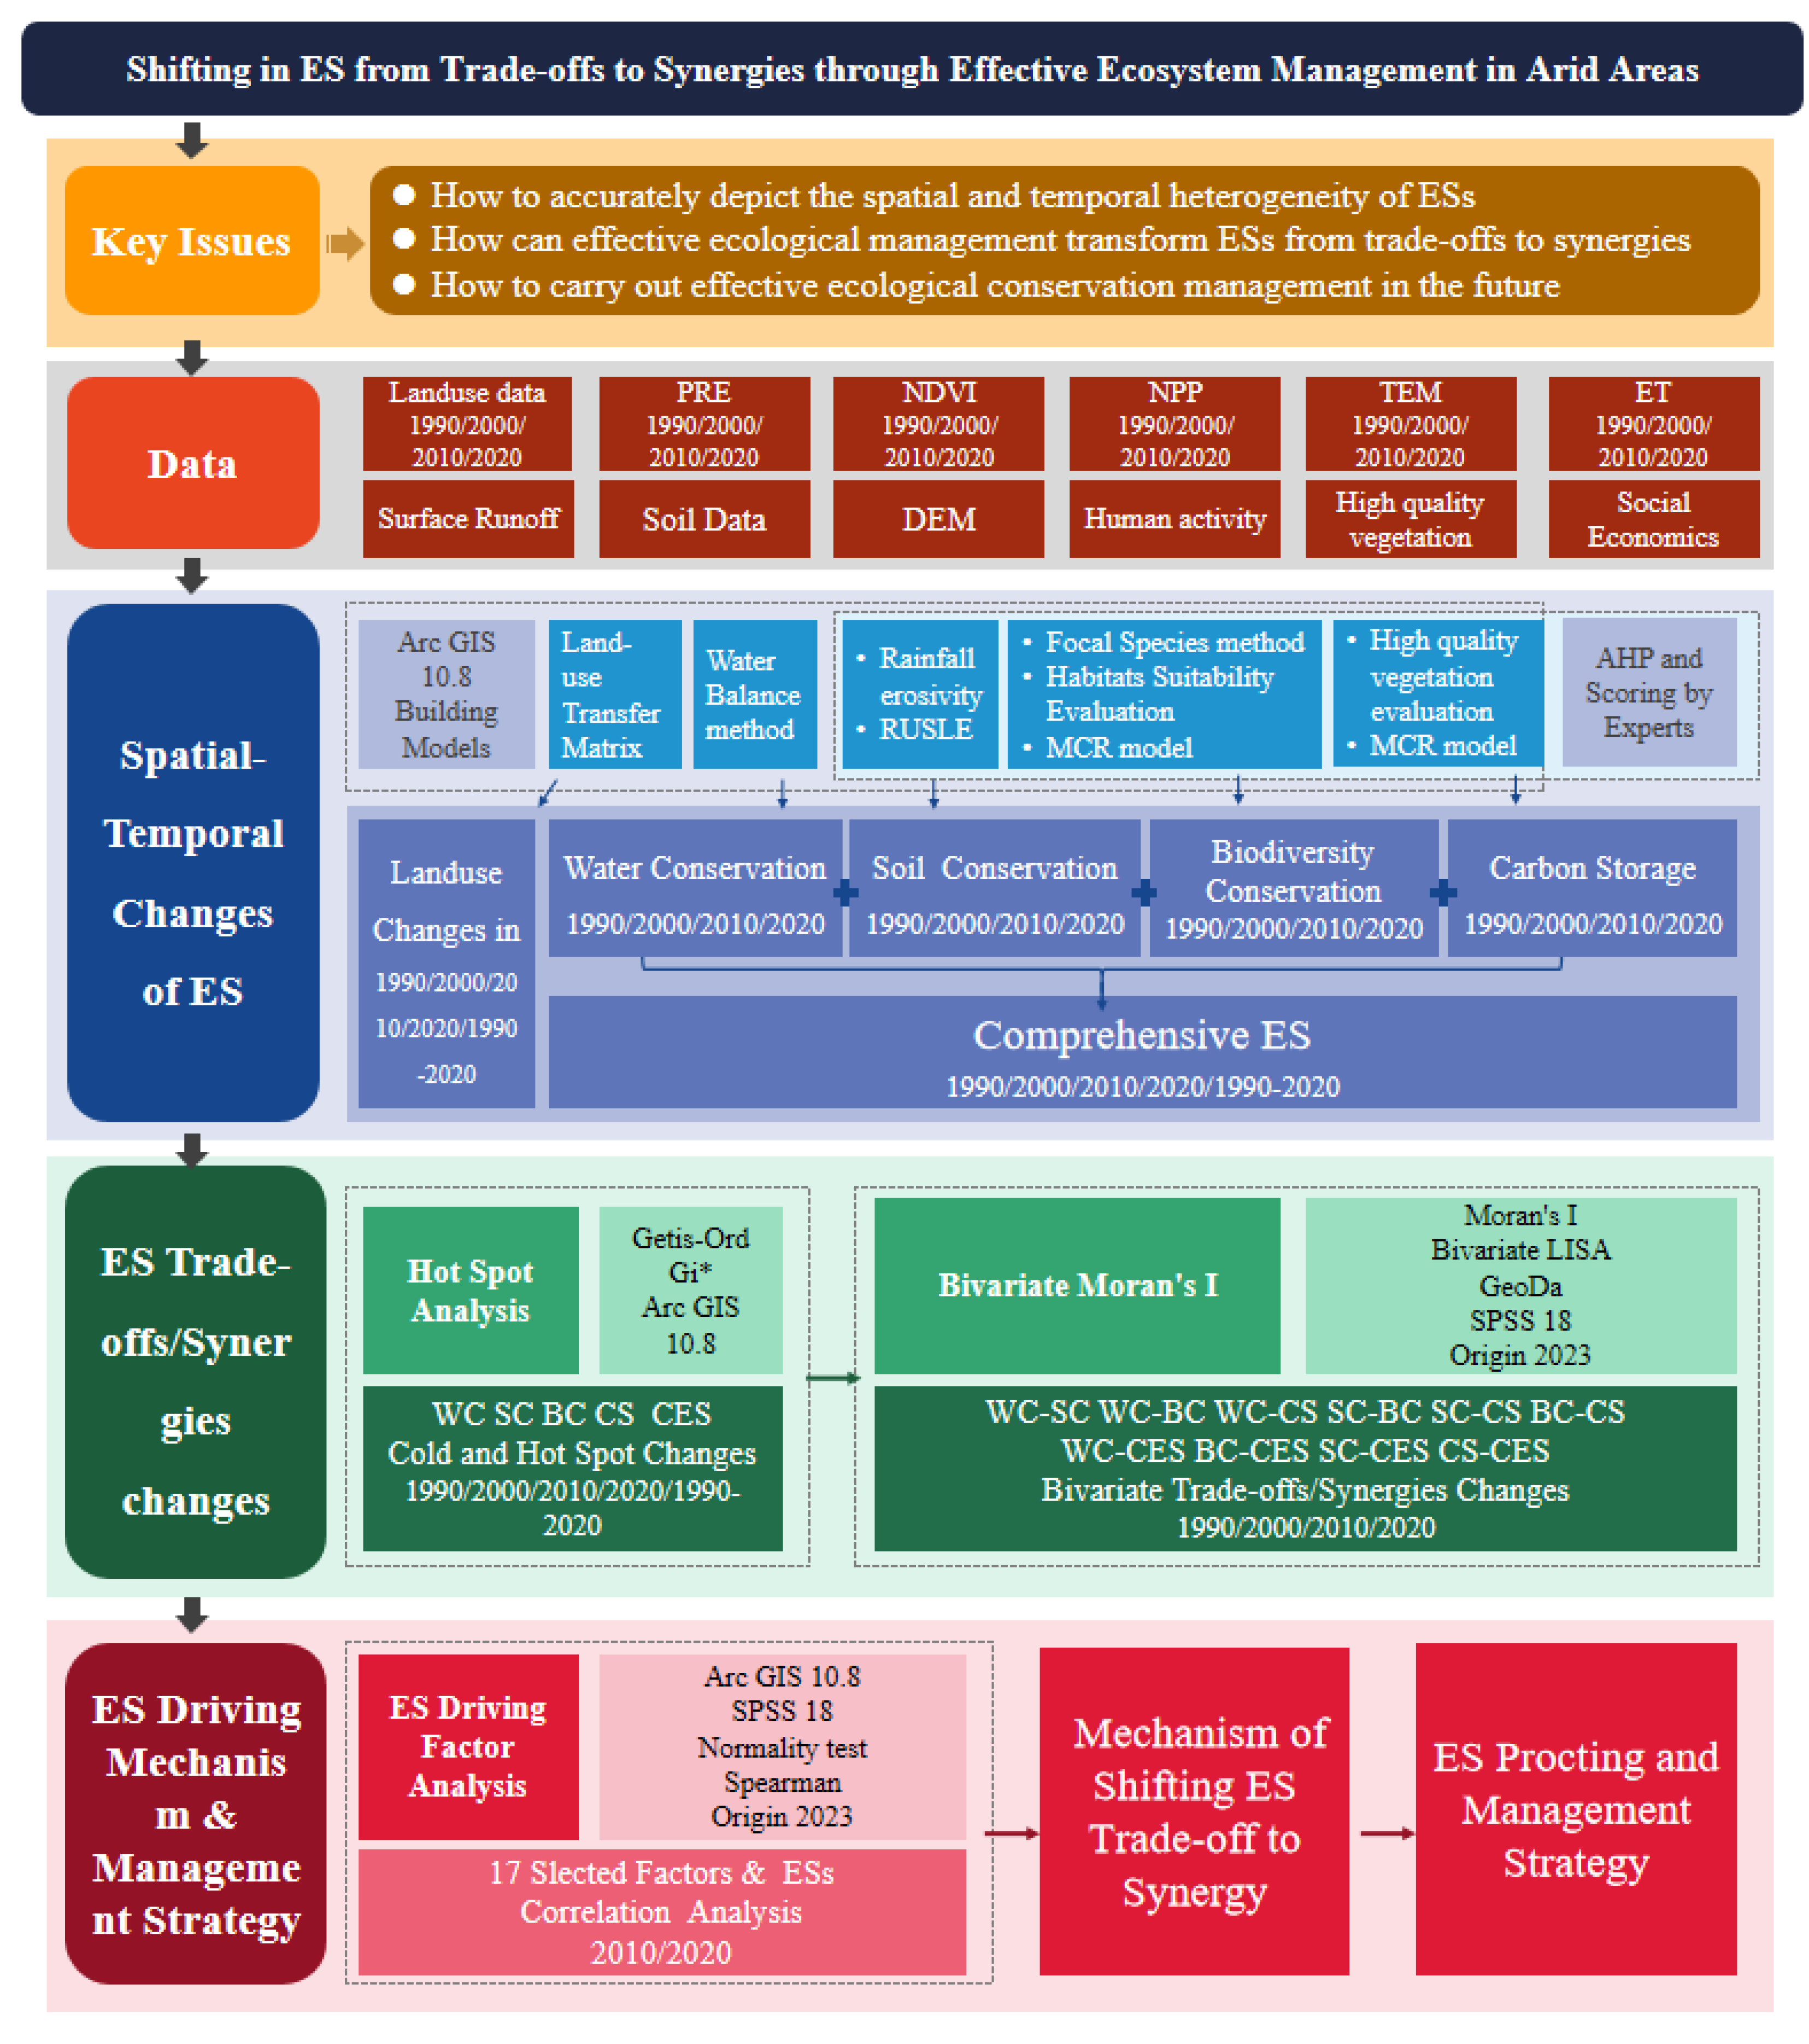
Figure 2.
Overview of the study area.
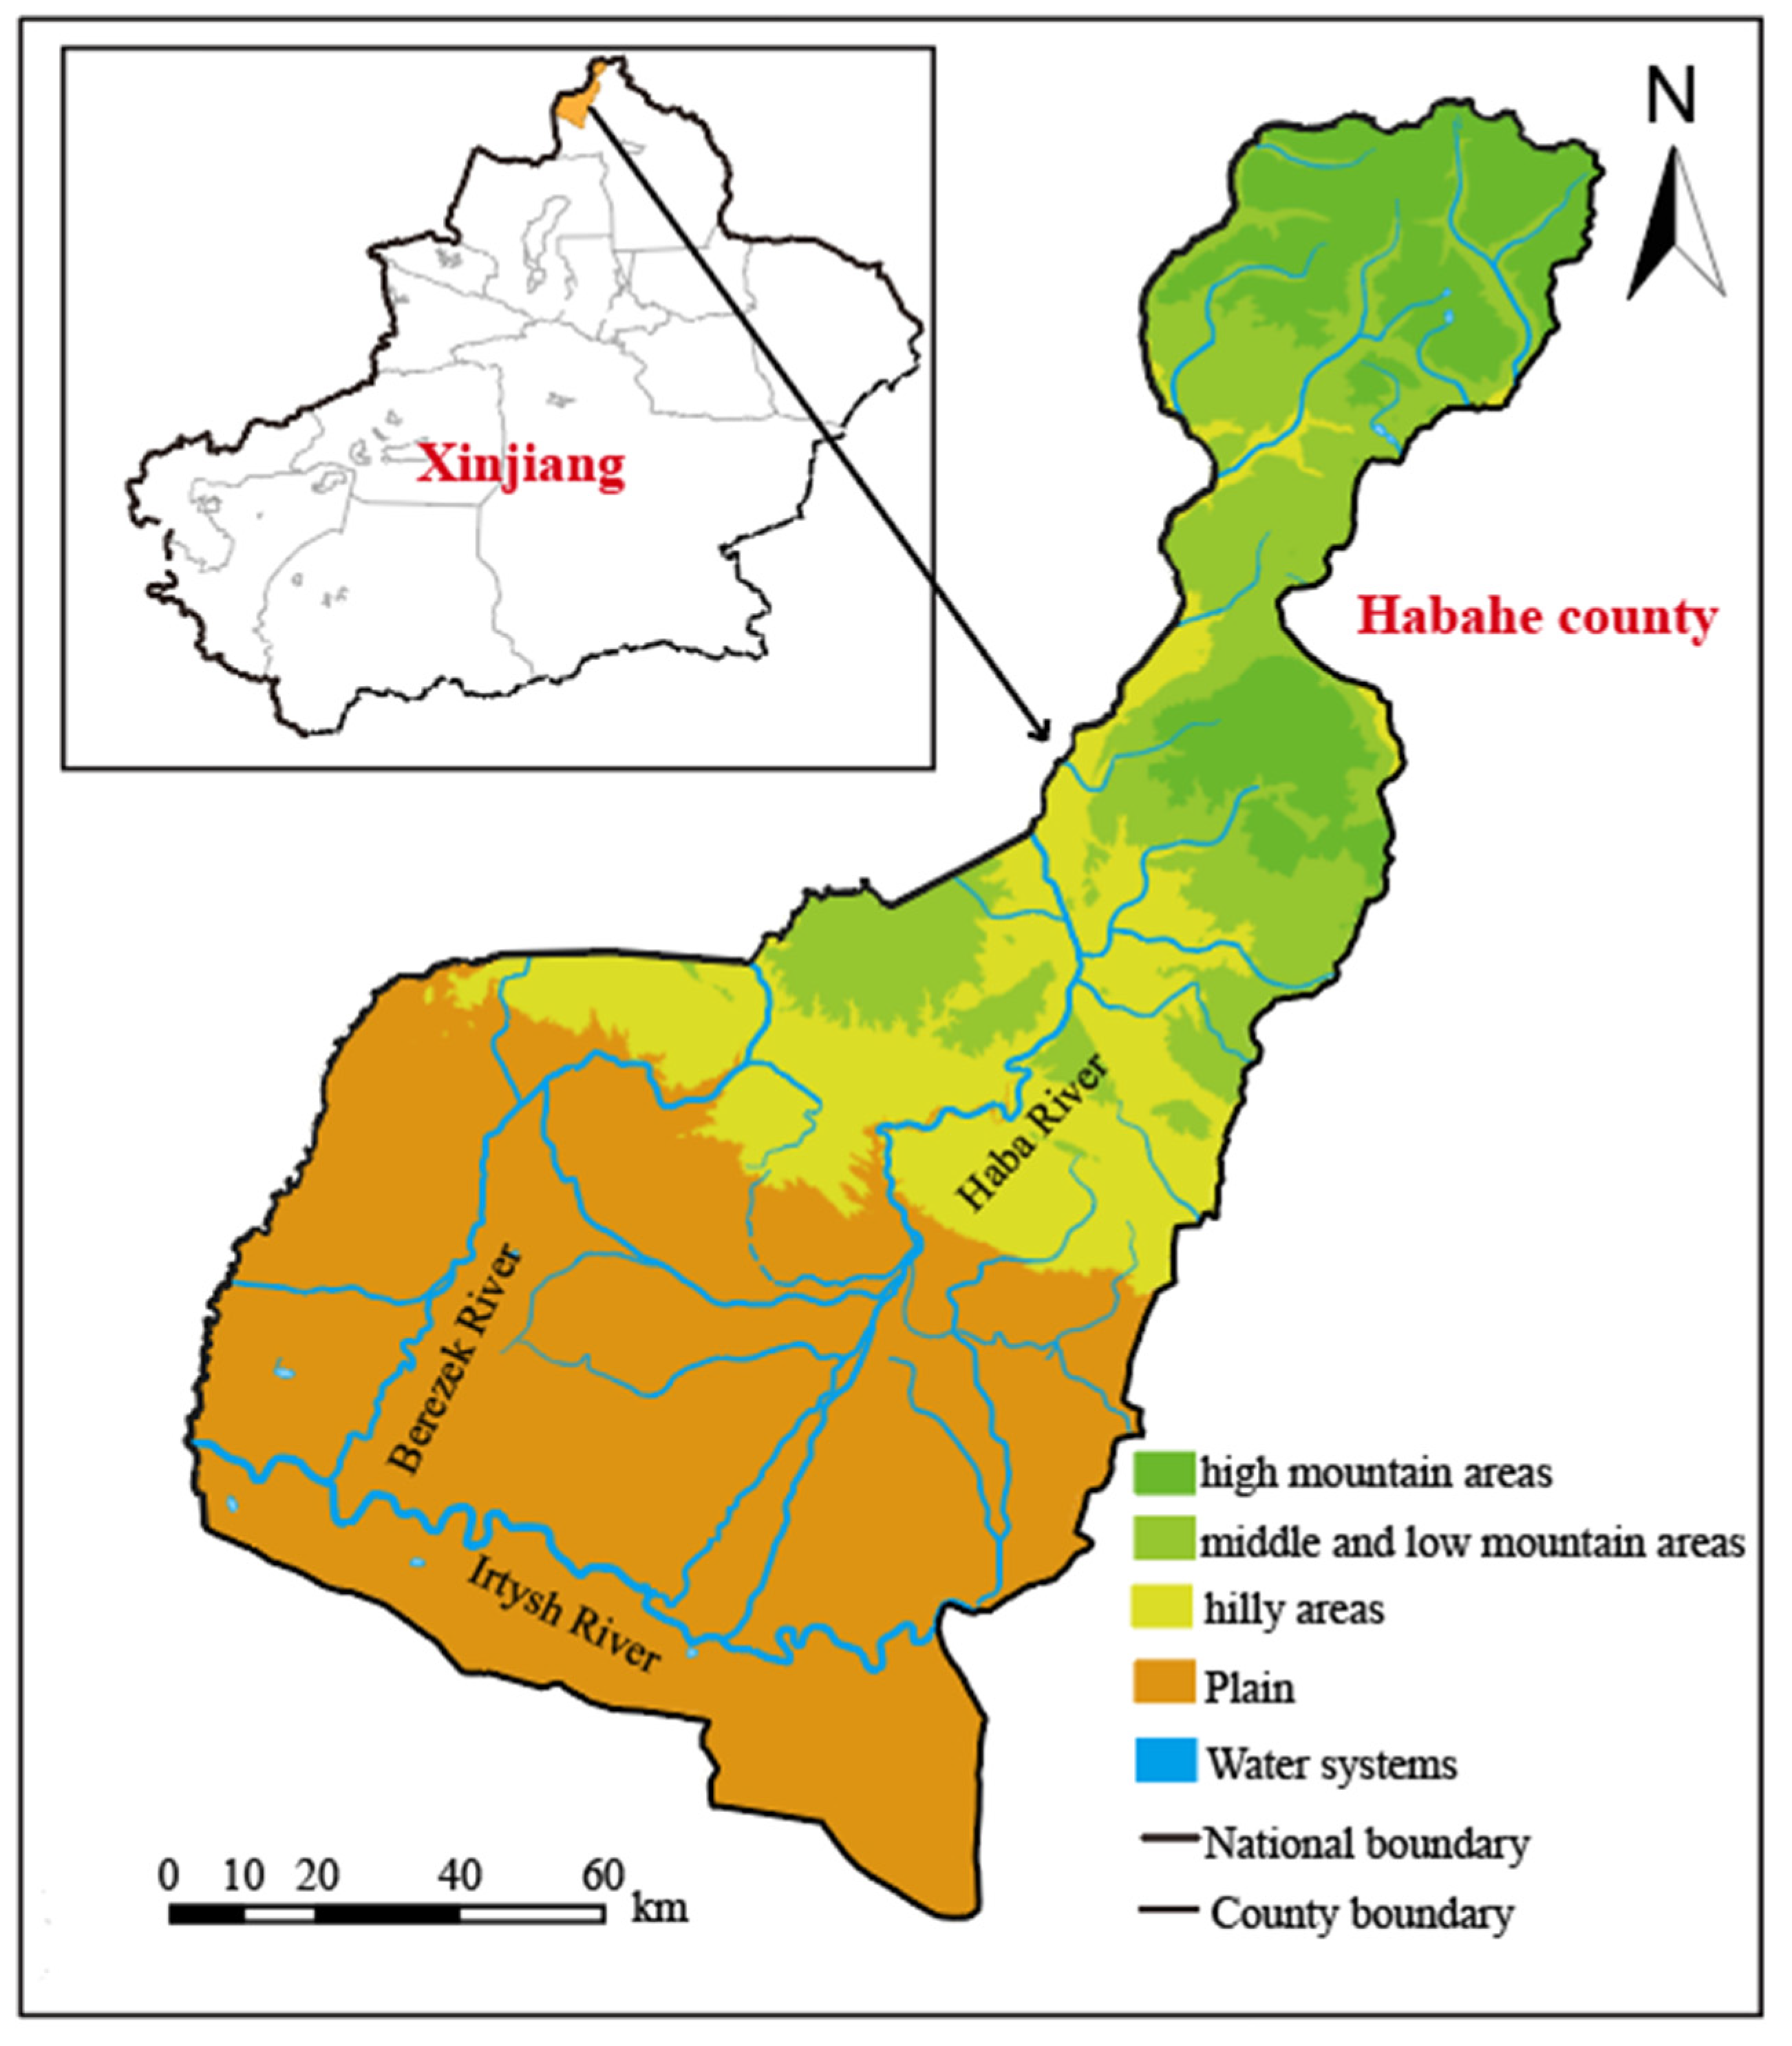
Figure 3.
Land Use Area Transition from 1990 to 2020.
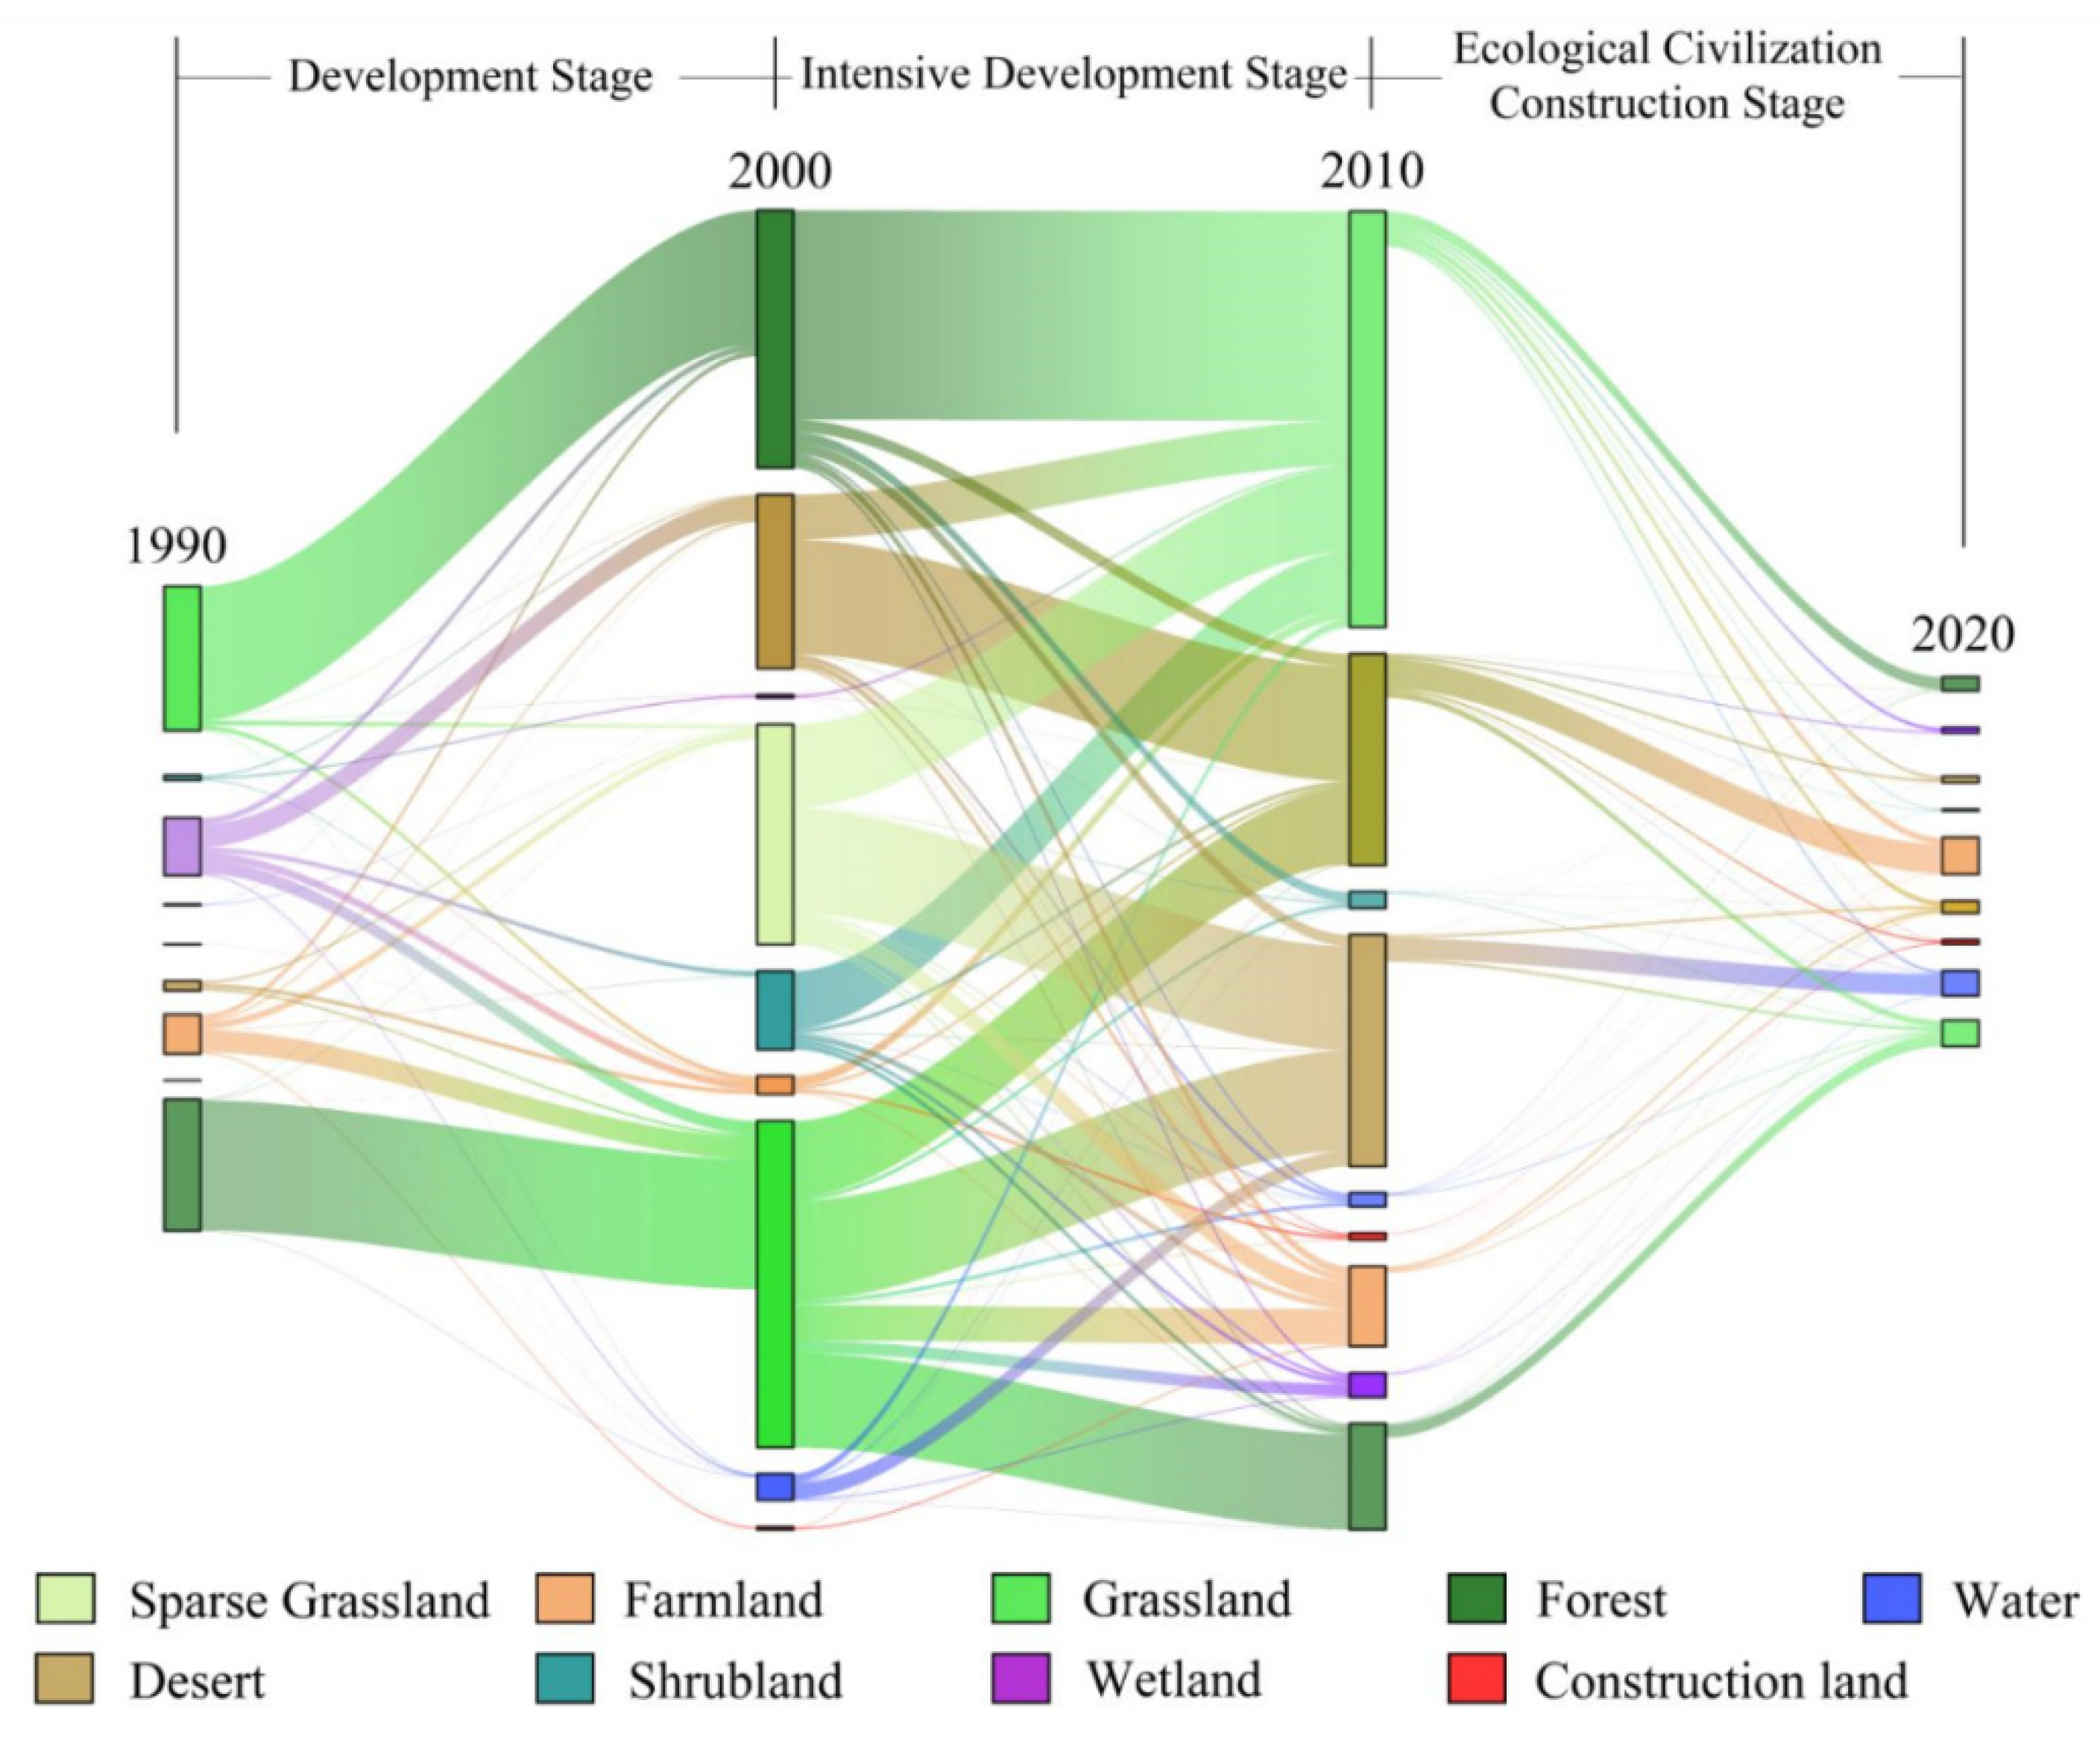
Figure 4.
Area percentage of four ES significance levels. WC is water conservation, SC is soil conservation, BC is biodiversity conservation, and CS is carbon storage.
Figure 4.
Area percentage of four ES significance levels. WC is water conservation, SC is soil conservation, BC is biodiversity conservation, and CS is carbon storage.
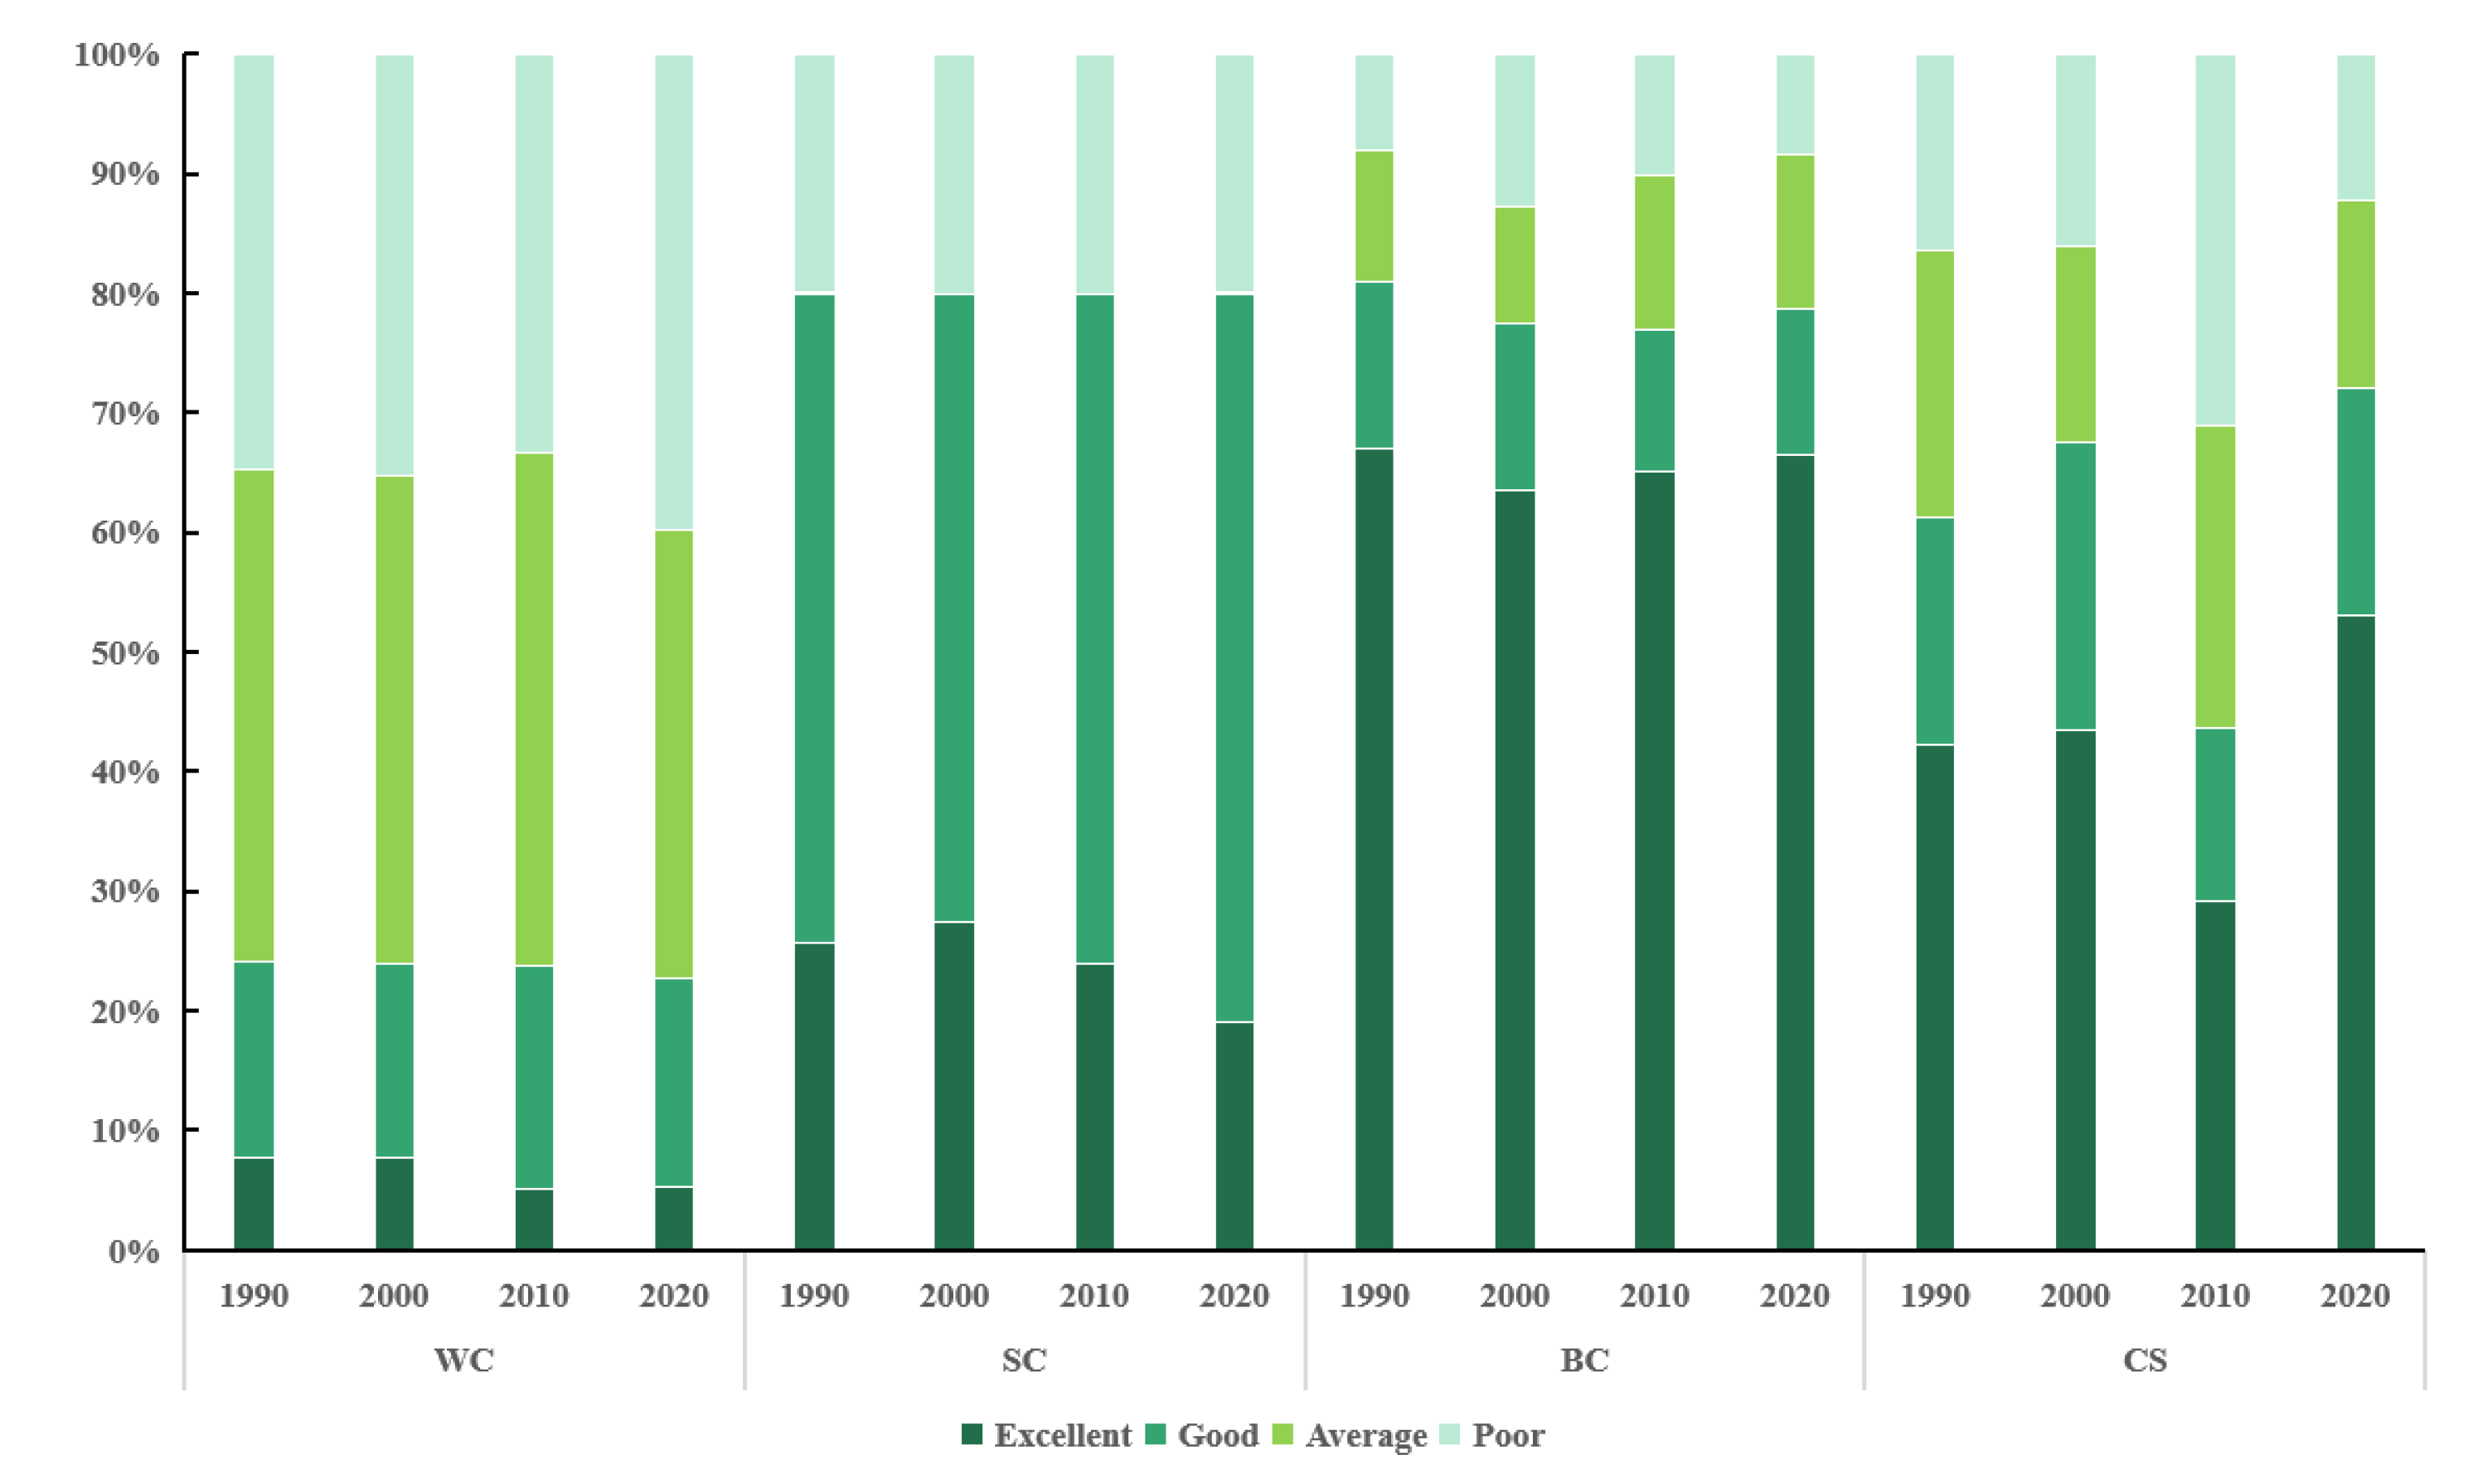
Figure 5.
Spatial and temporal changes in Comprehensive ES from 1990 to 2020.
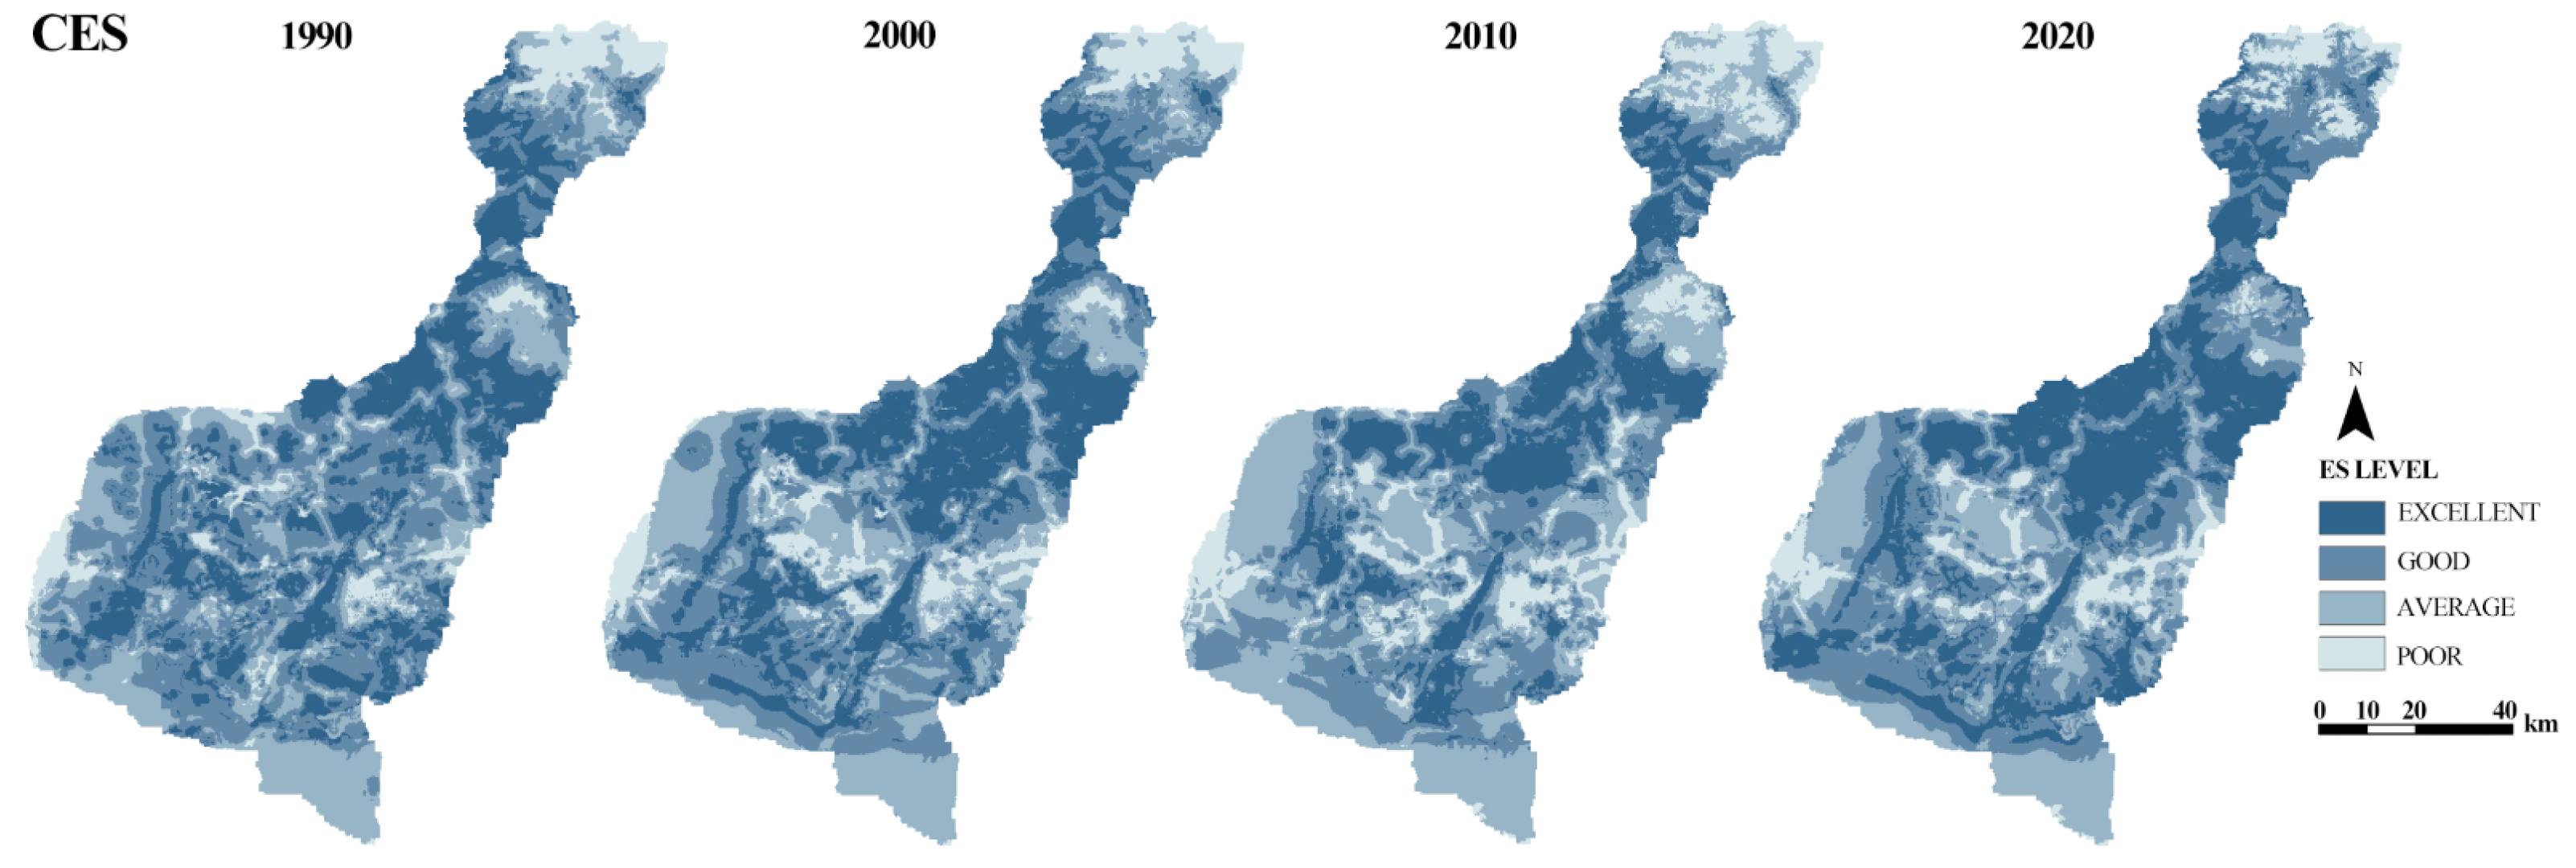
Figure 6.
Cold and hot spot area proportion for comprehensive ES.
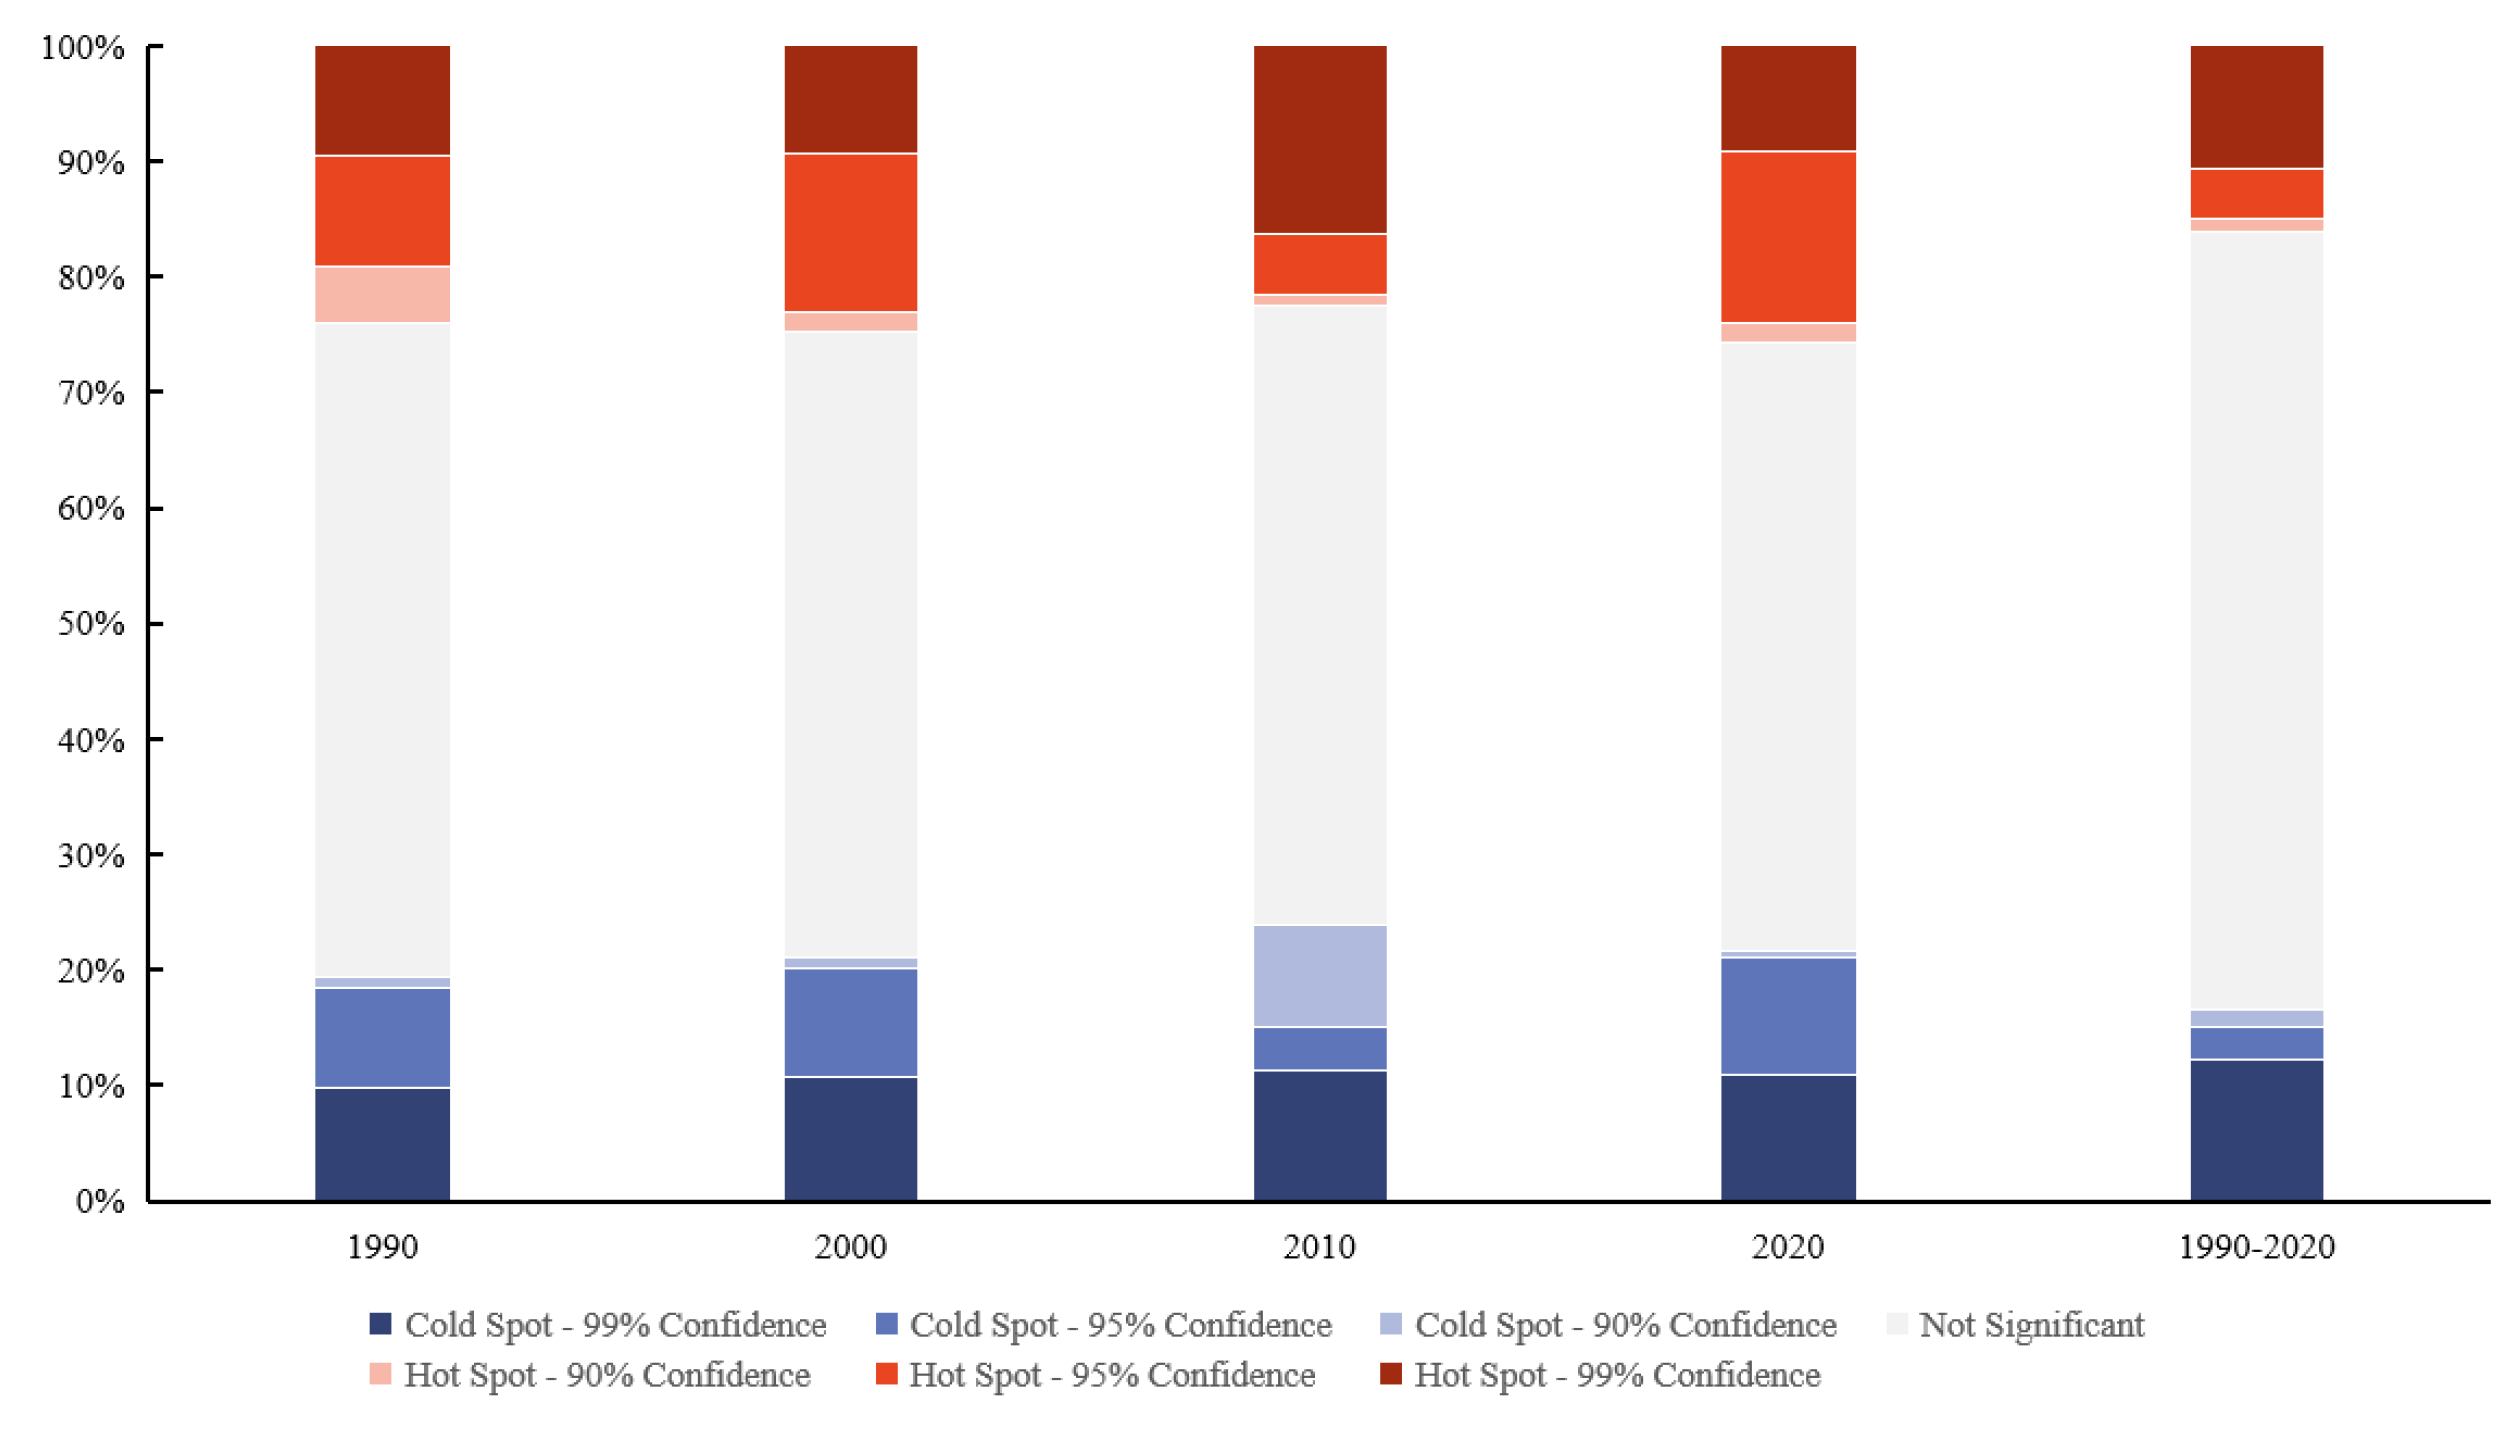
Figure 7.
Cold and hot spot distribution for comprehensive ES from 1990 to 2020.
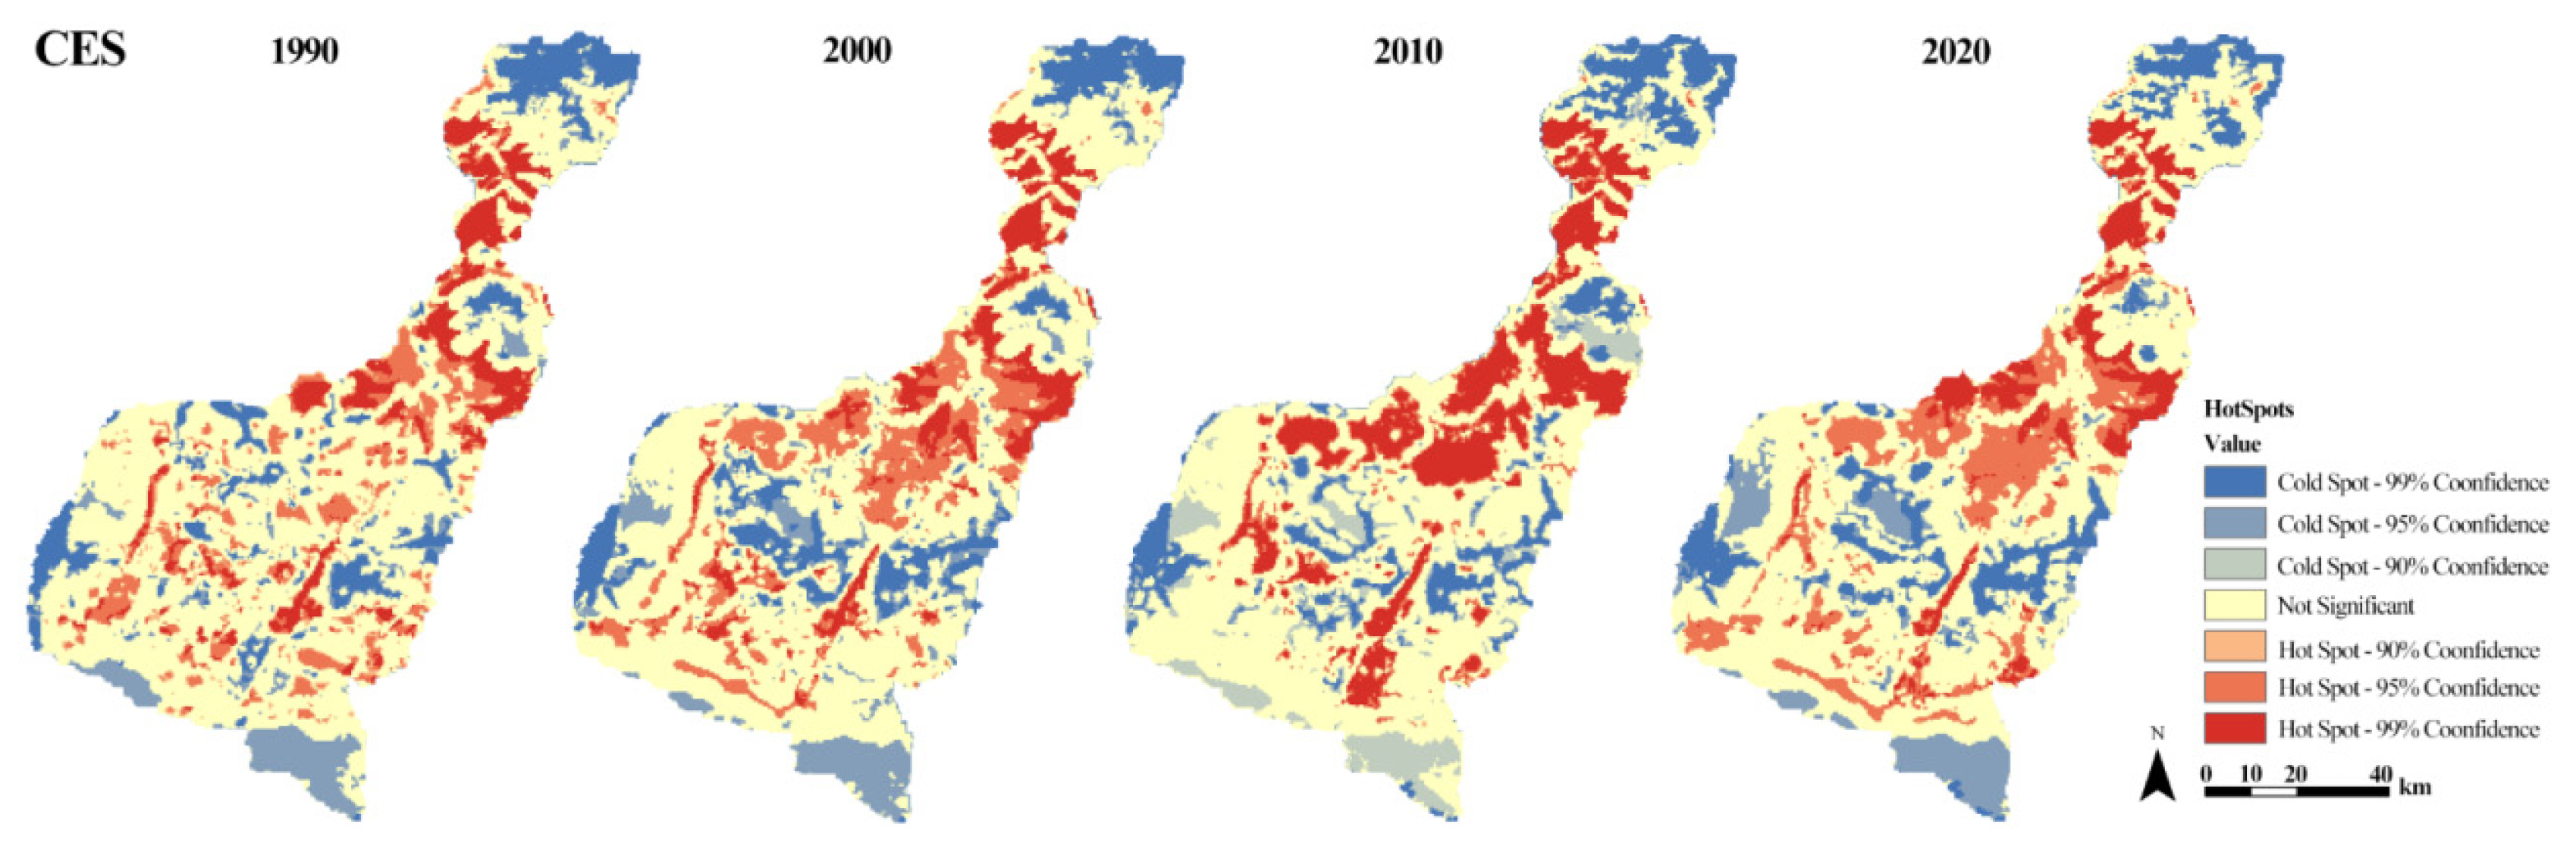
Figure 8.
The trade-offs/synergies between pairwise ES on the grid scale. WC is water conservation, SC is soil conservation, BC is biodiversity conservation, and CS is carbon storage.
Figure 8.
The trade-offs/synergies between pairwise ES on the grid scale. WC is water conservation, SC is soil conservation, BC is biodiversity conservation, and CS is carbon storage.
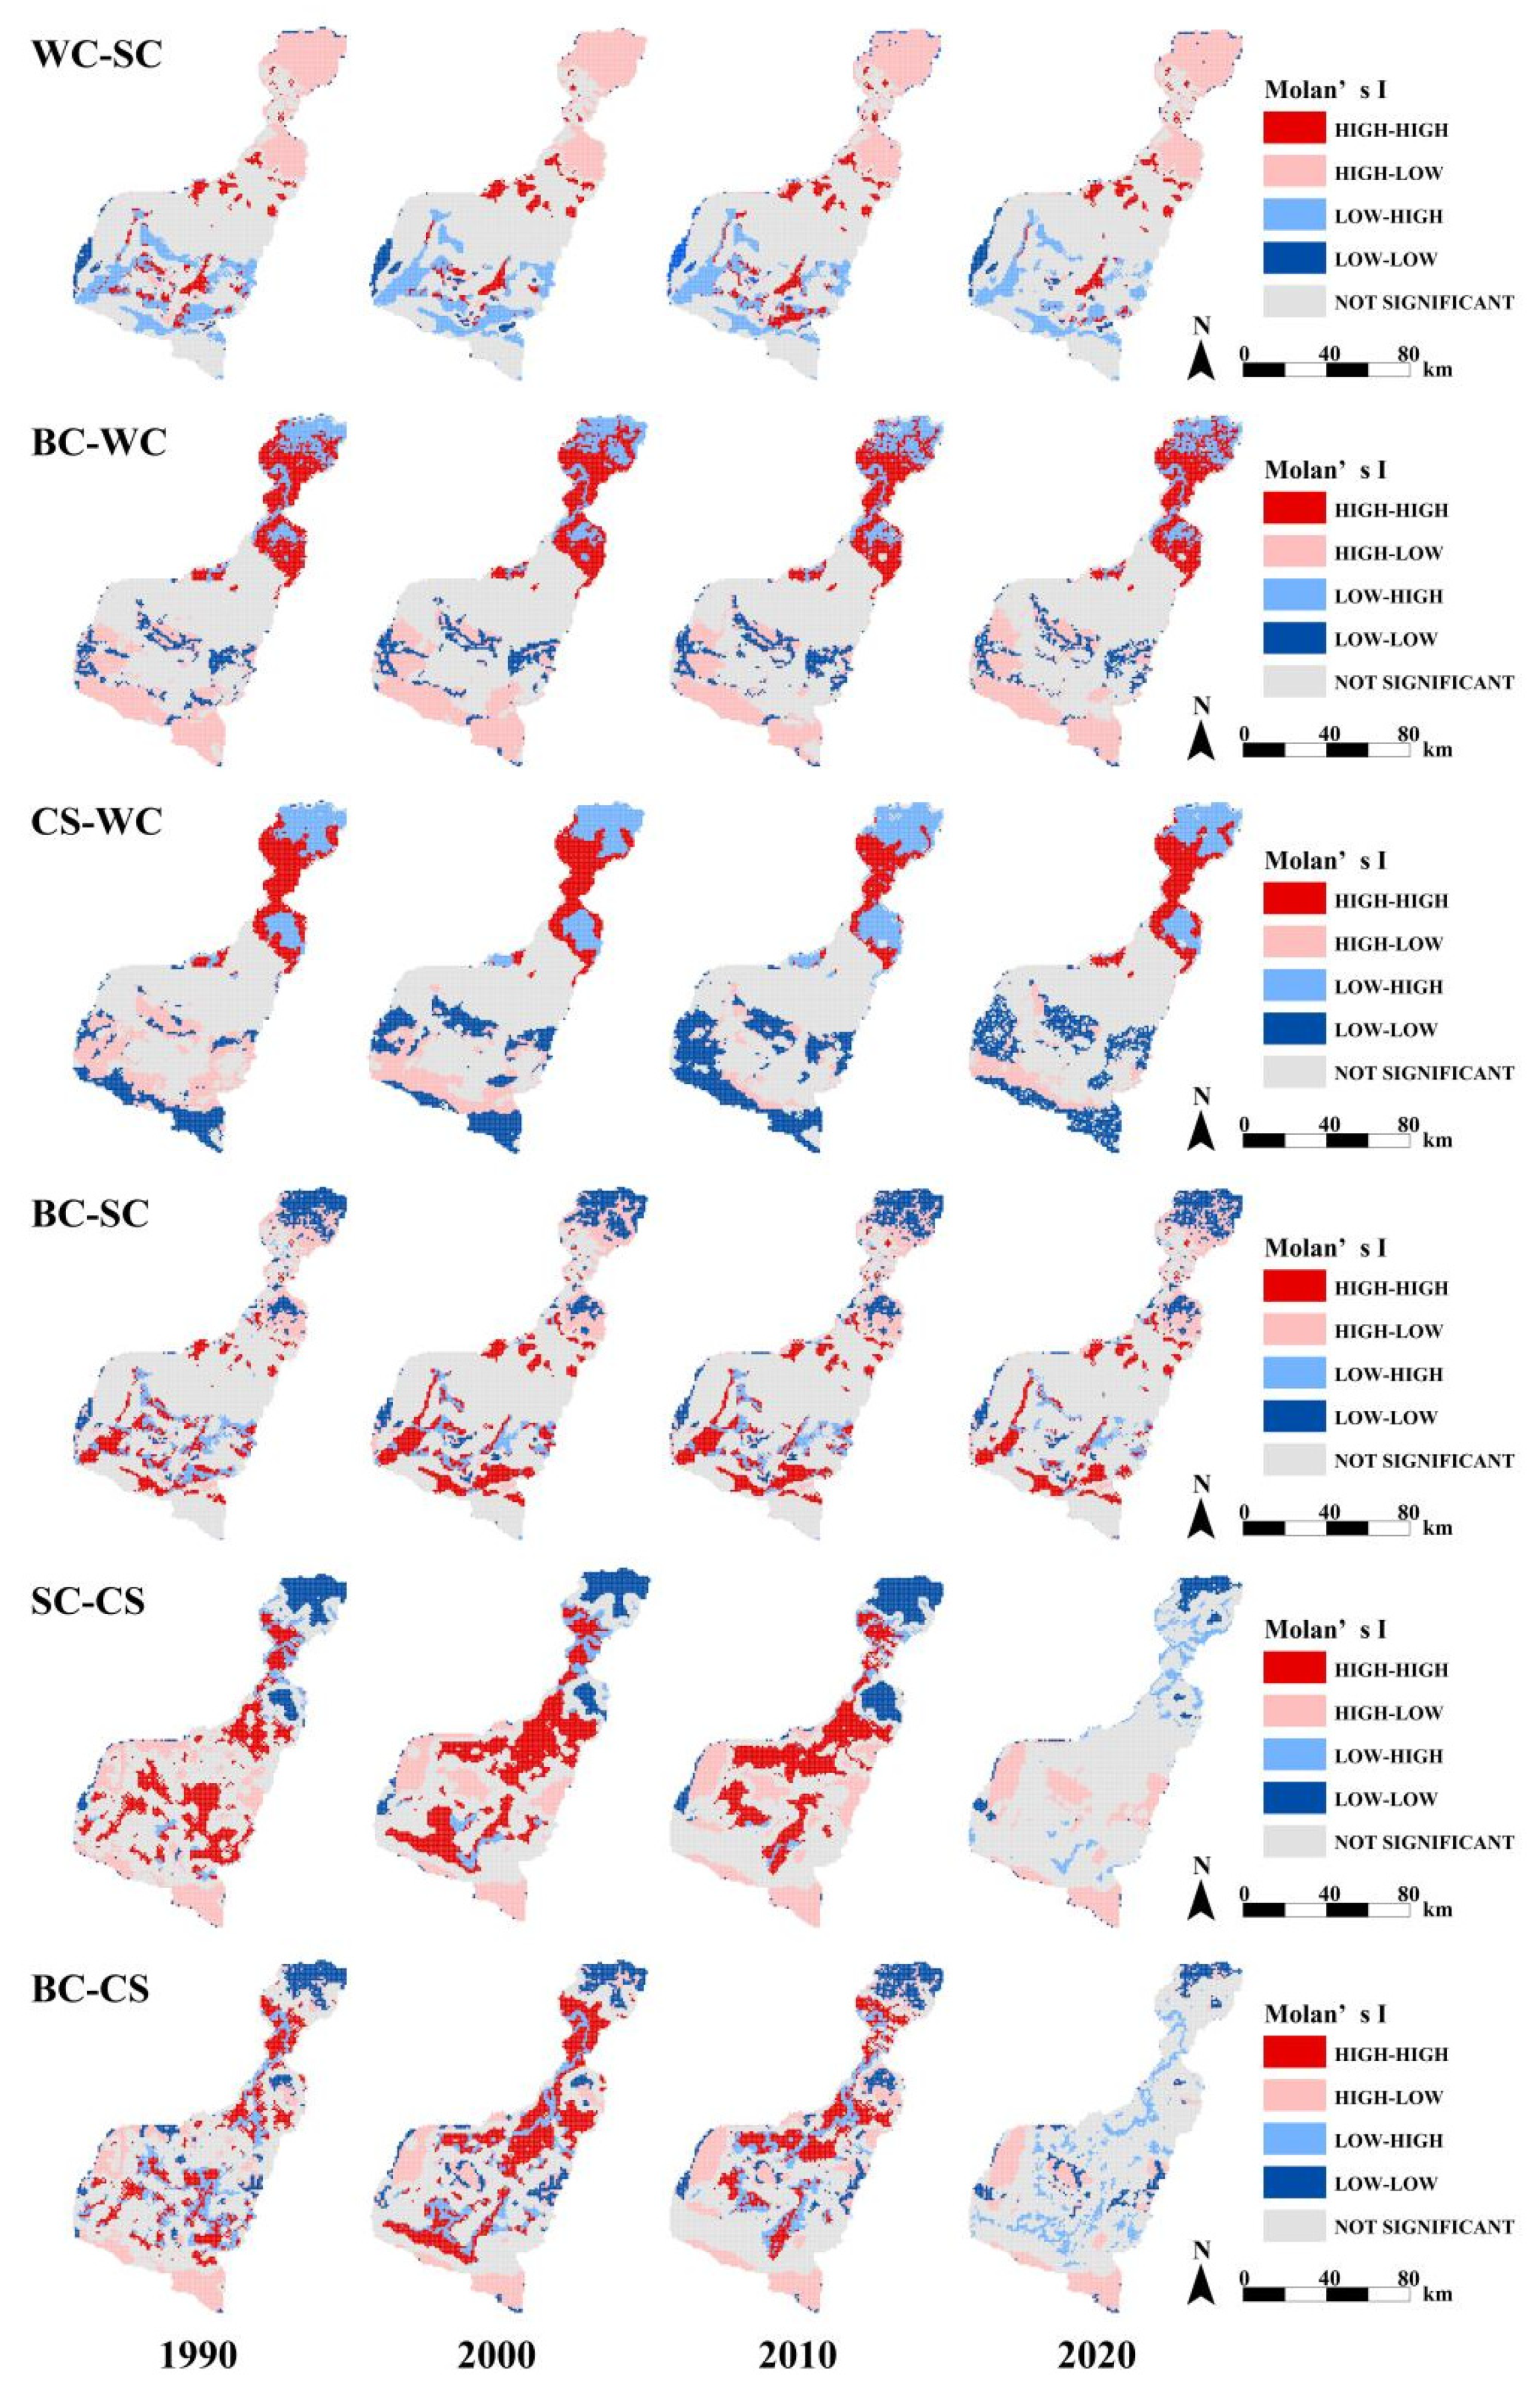
Figure 9.
Trade-offs and synergies area proportions of six pairs of ES on a grid scale. WC is water conservation, SC is soil conservation, BC is biodiversity conservation, and CS is carbon storage.
Figure 9.
Trade-offs and synergies area proportions of six pairs of ES on a grid scale. WC is water conservation, SC is soil conservation, BC is biodiversity conservation, and CS is carbon storage.
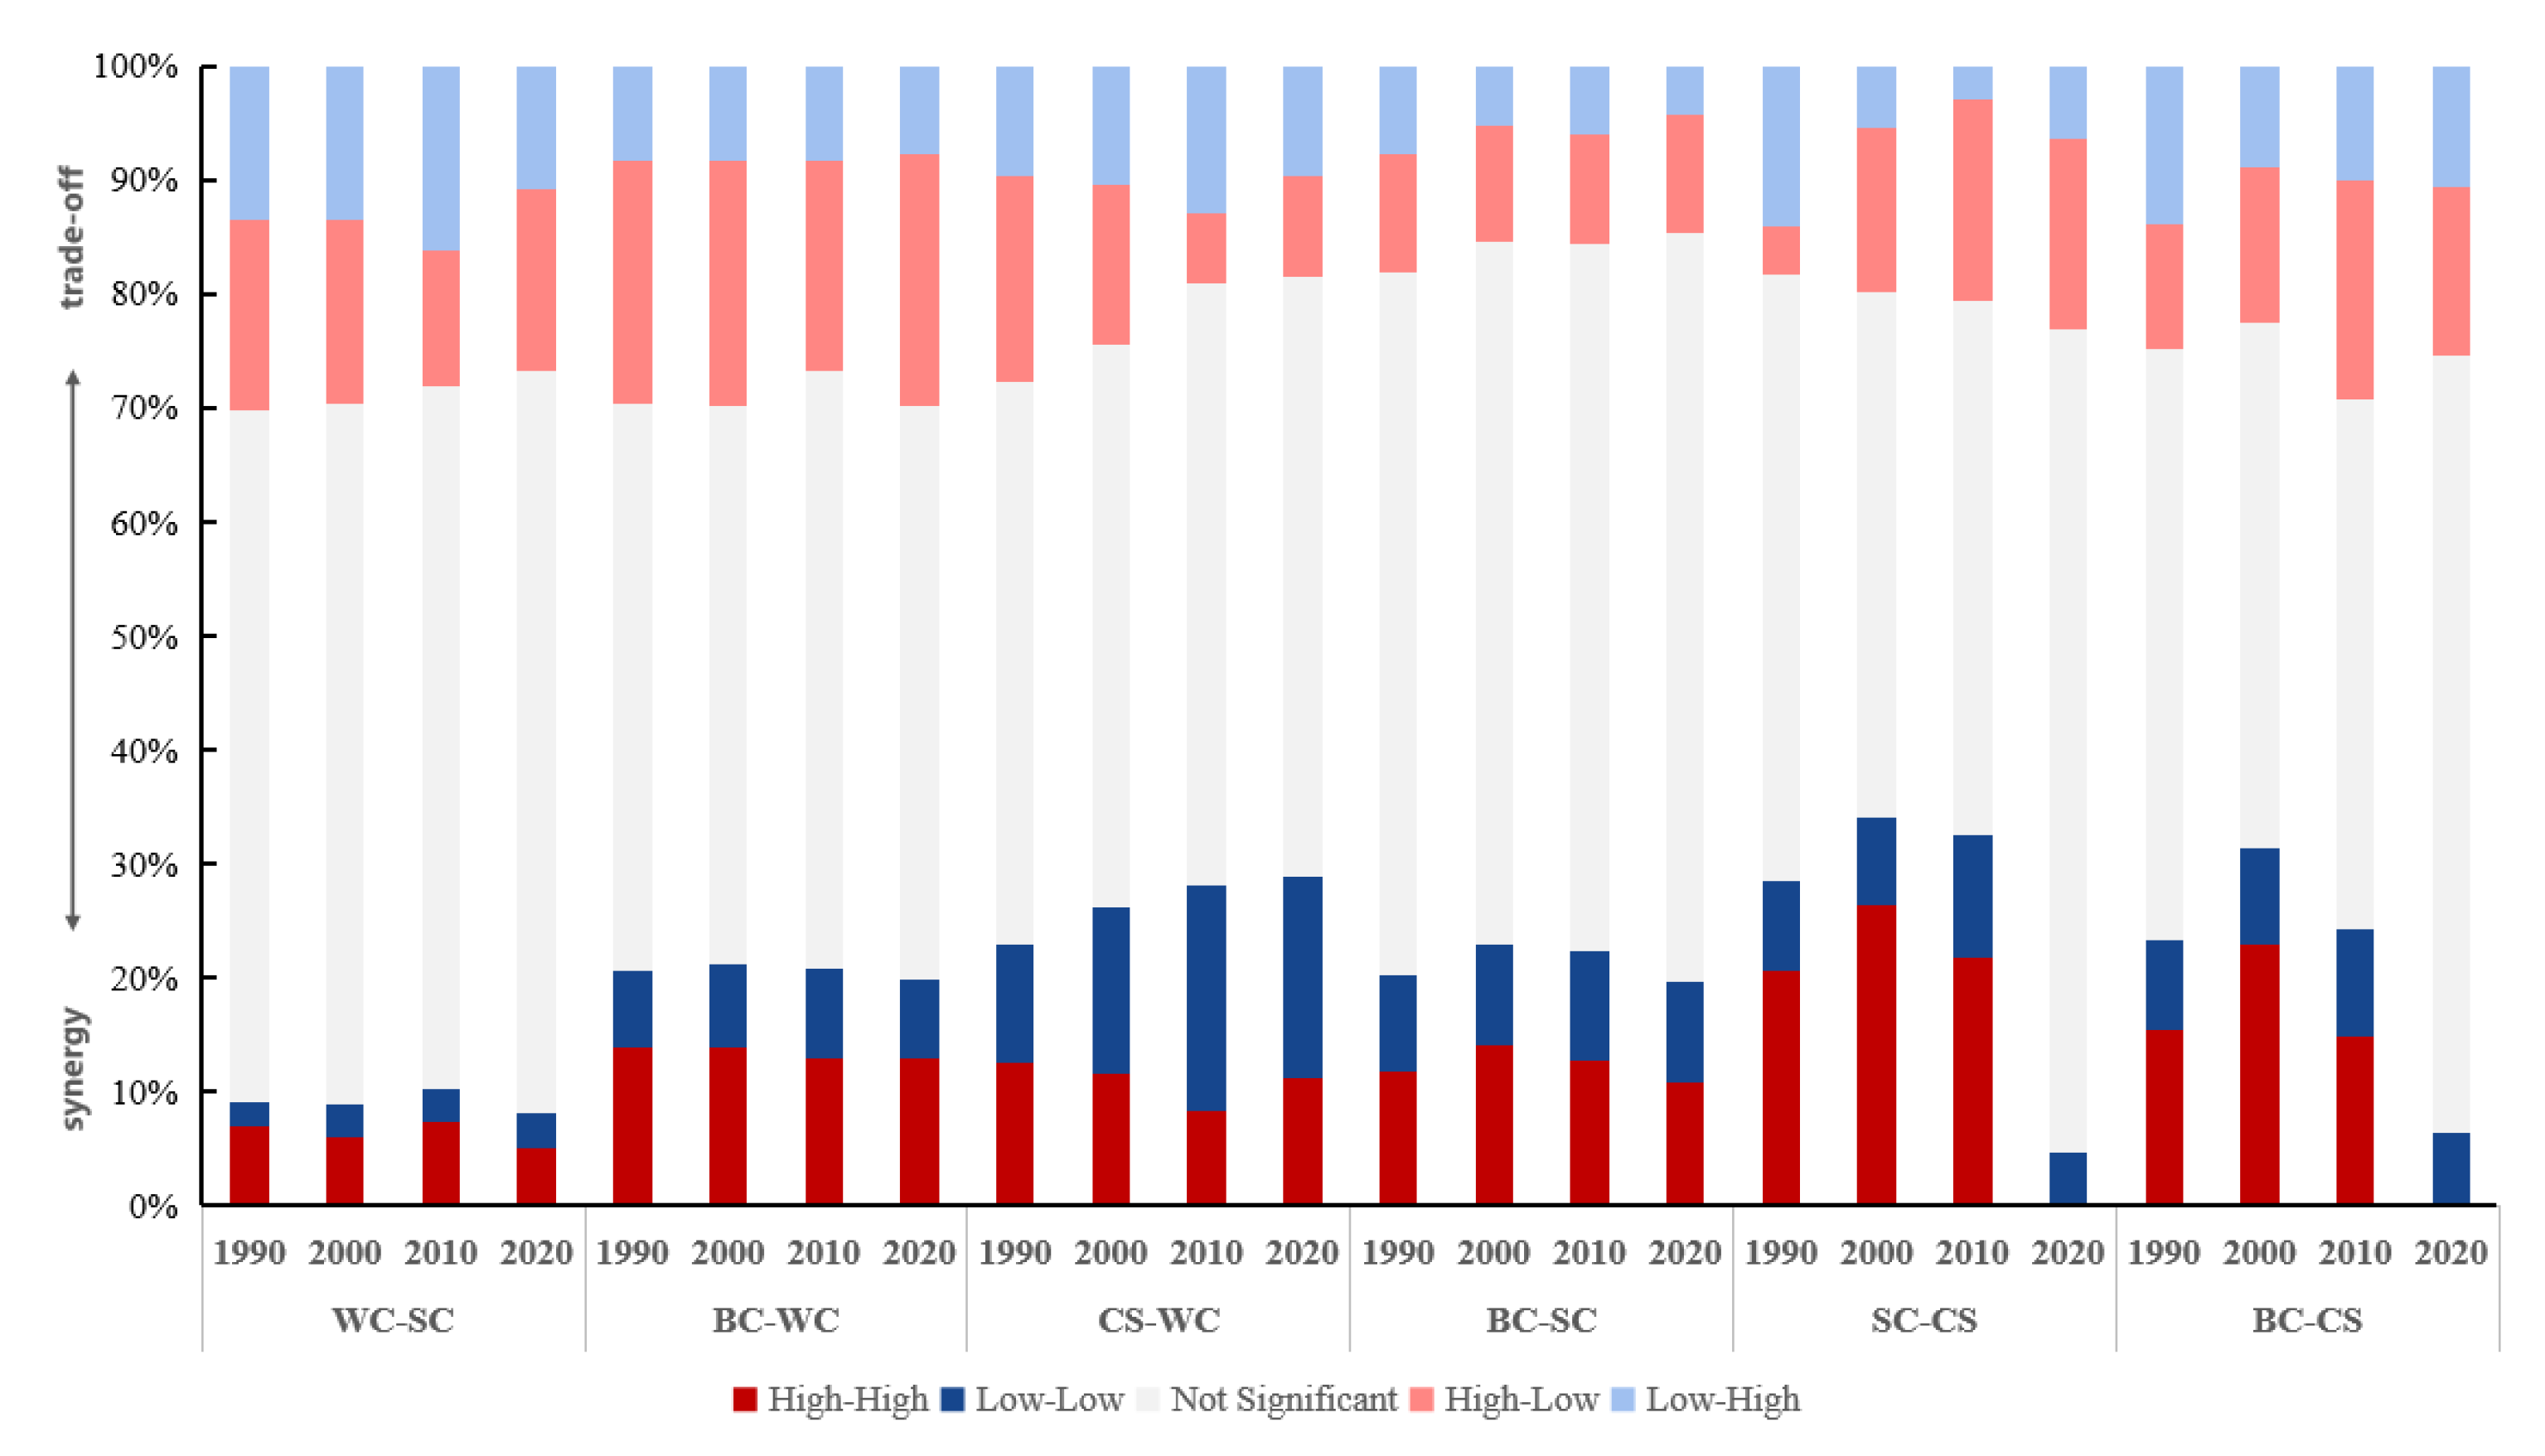
Figure 10.
Results of correlation relationships between the 17 drivers, the four key ESs, and CES in the Basin for 2010–2020. (1) ES: WC (Water Conservation), SC (Soil Conservation), BC (Biodiversity Conservation), CS (Carbon Storage);(2) Driving factors: X1 (PRE), X2 (TEM), X3 (ET), X4 (NPP), X5 (NDVI), X6 (DEM), X7 (slope), X8 (surface runoff), X9 (soil erosion), X10 (soil type), X11 (comprehensive index of land use degree), X12 (population density), X13 (Per Cultivated Area), X14 (Livestock density), X15 (GDP), X16 (distance to road)、and X17 (distance to river).
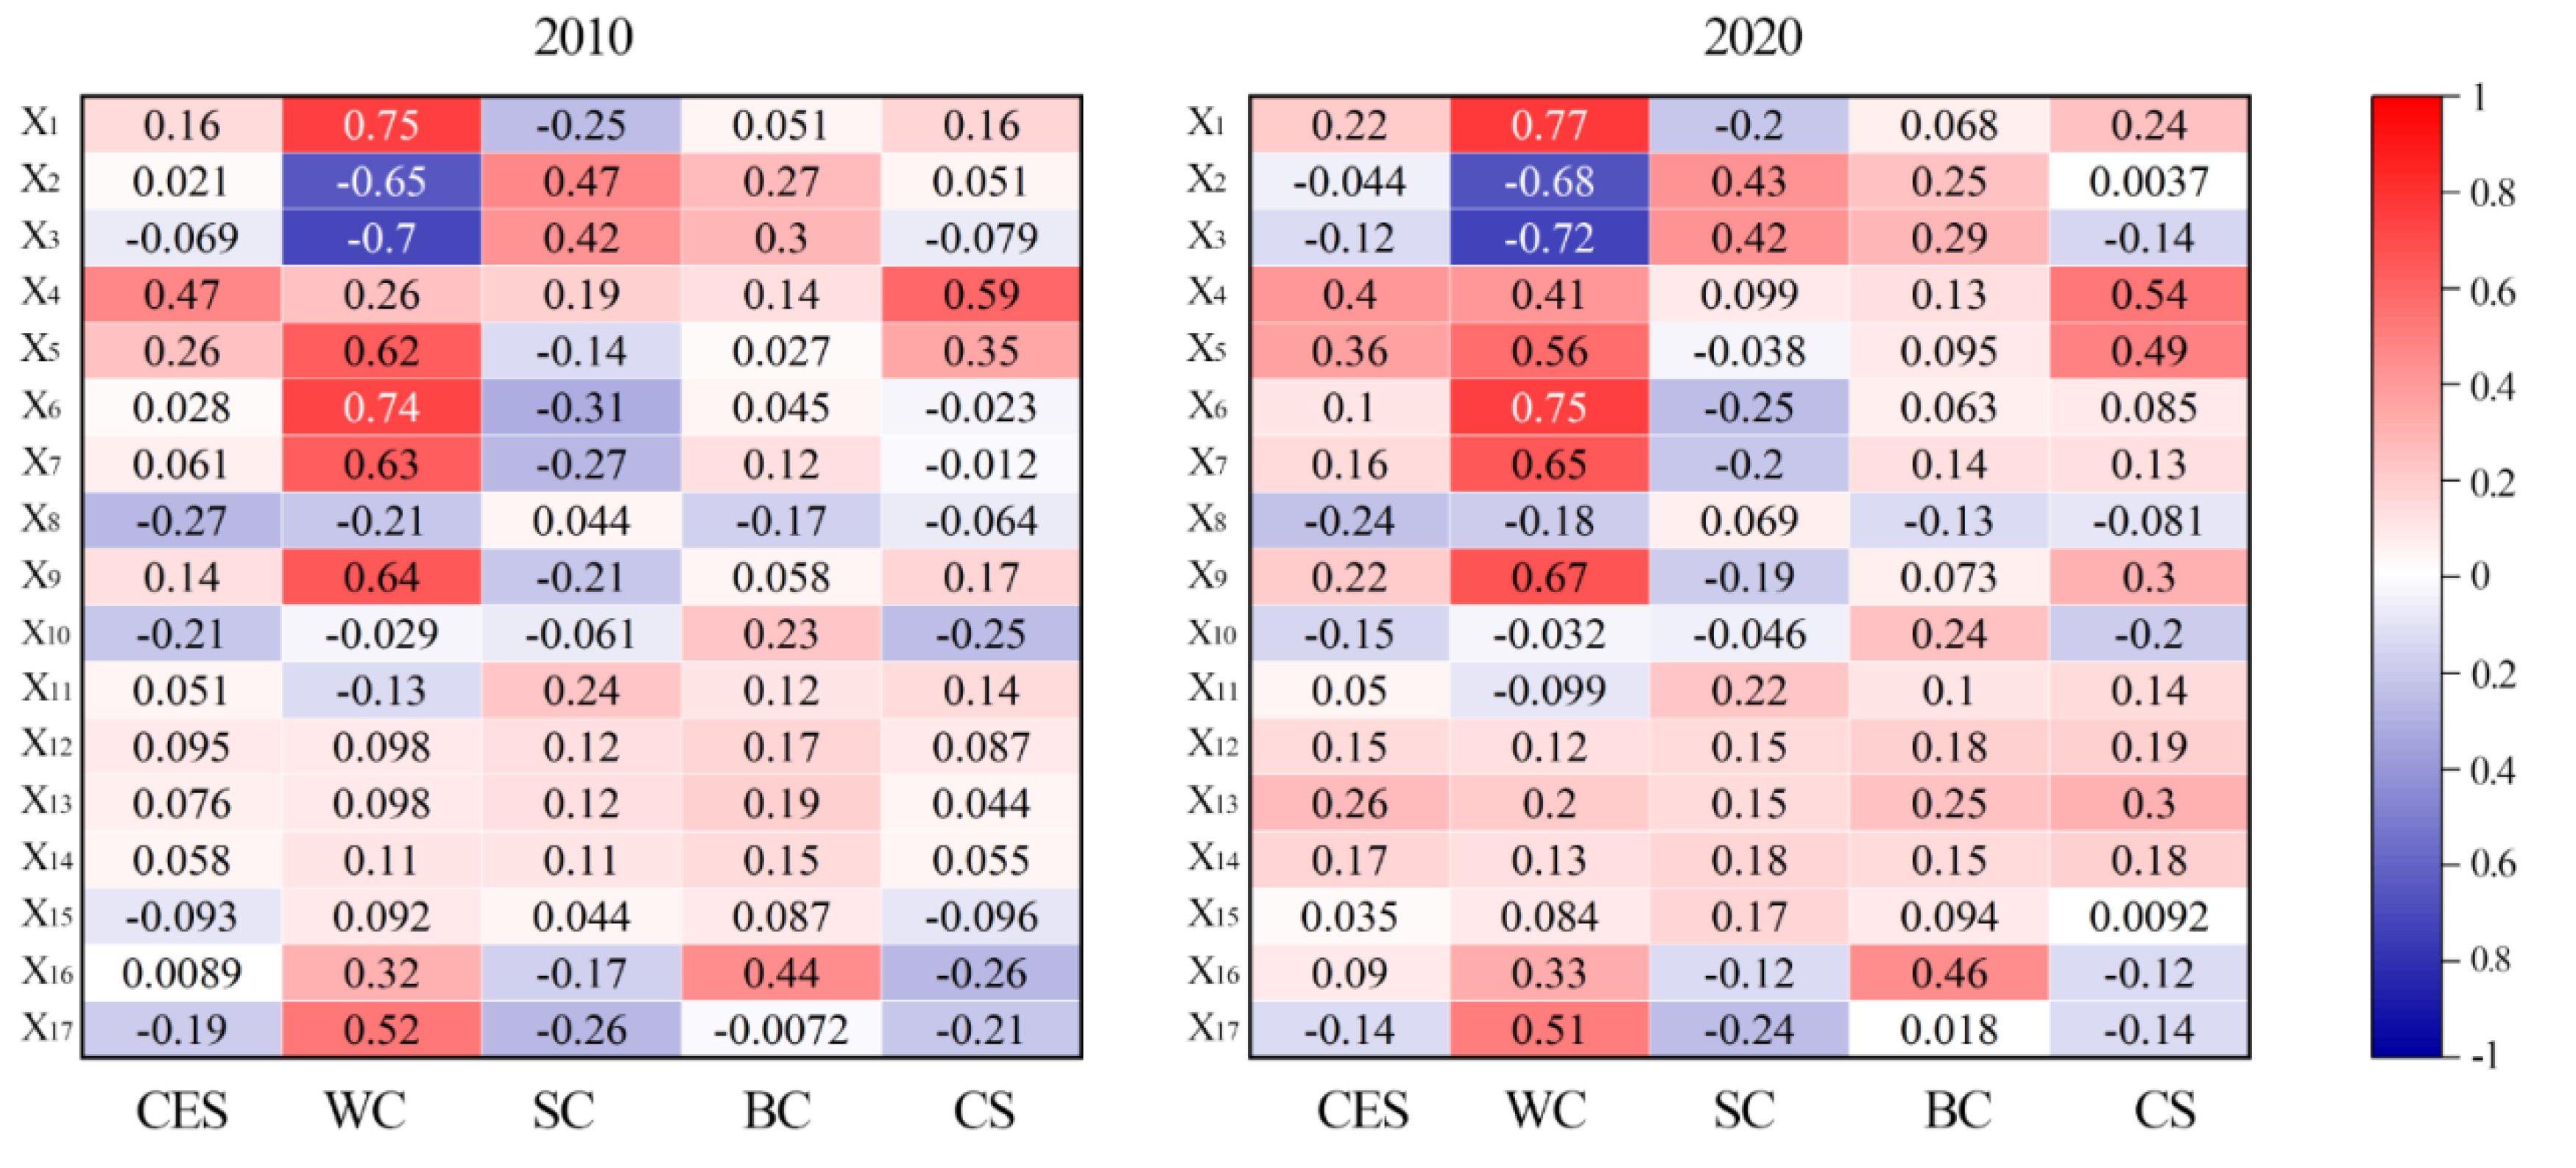
Figure 11.
Spatial characteristics and contribution analysis of the hot and cold spots of ecological service functions. (a) ES contribution to CES, (b) CES Cold and Hot spots Changes from 1990–2020, (c) Ecological Management Partition. WC is water conservation, SC is soil conservation, BC is biodiversity conservation, CS is carbon storage, and CES is the Comprehensive ES.
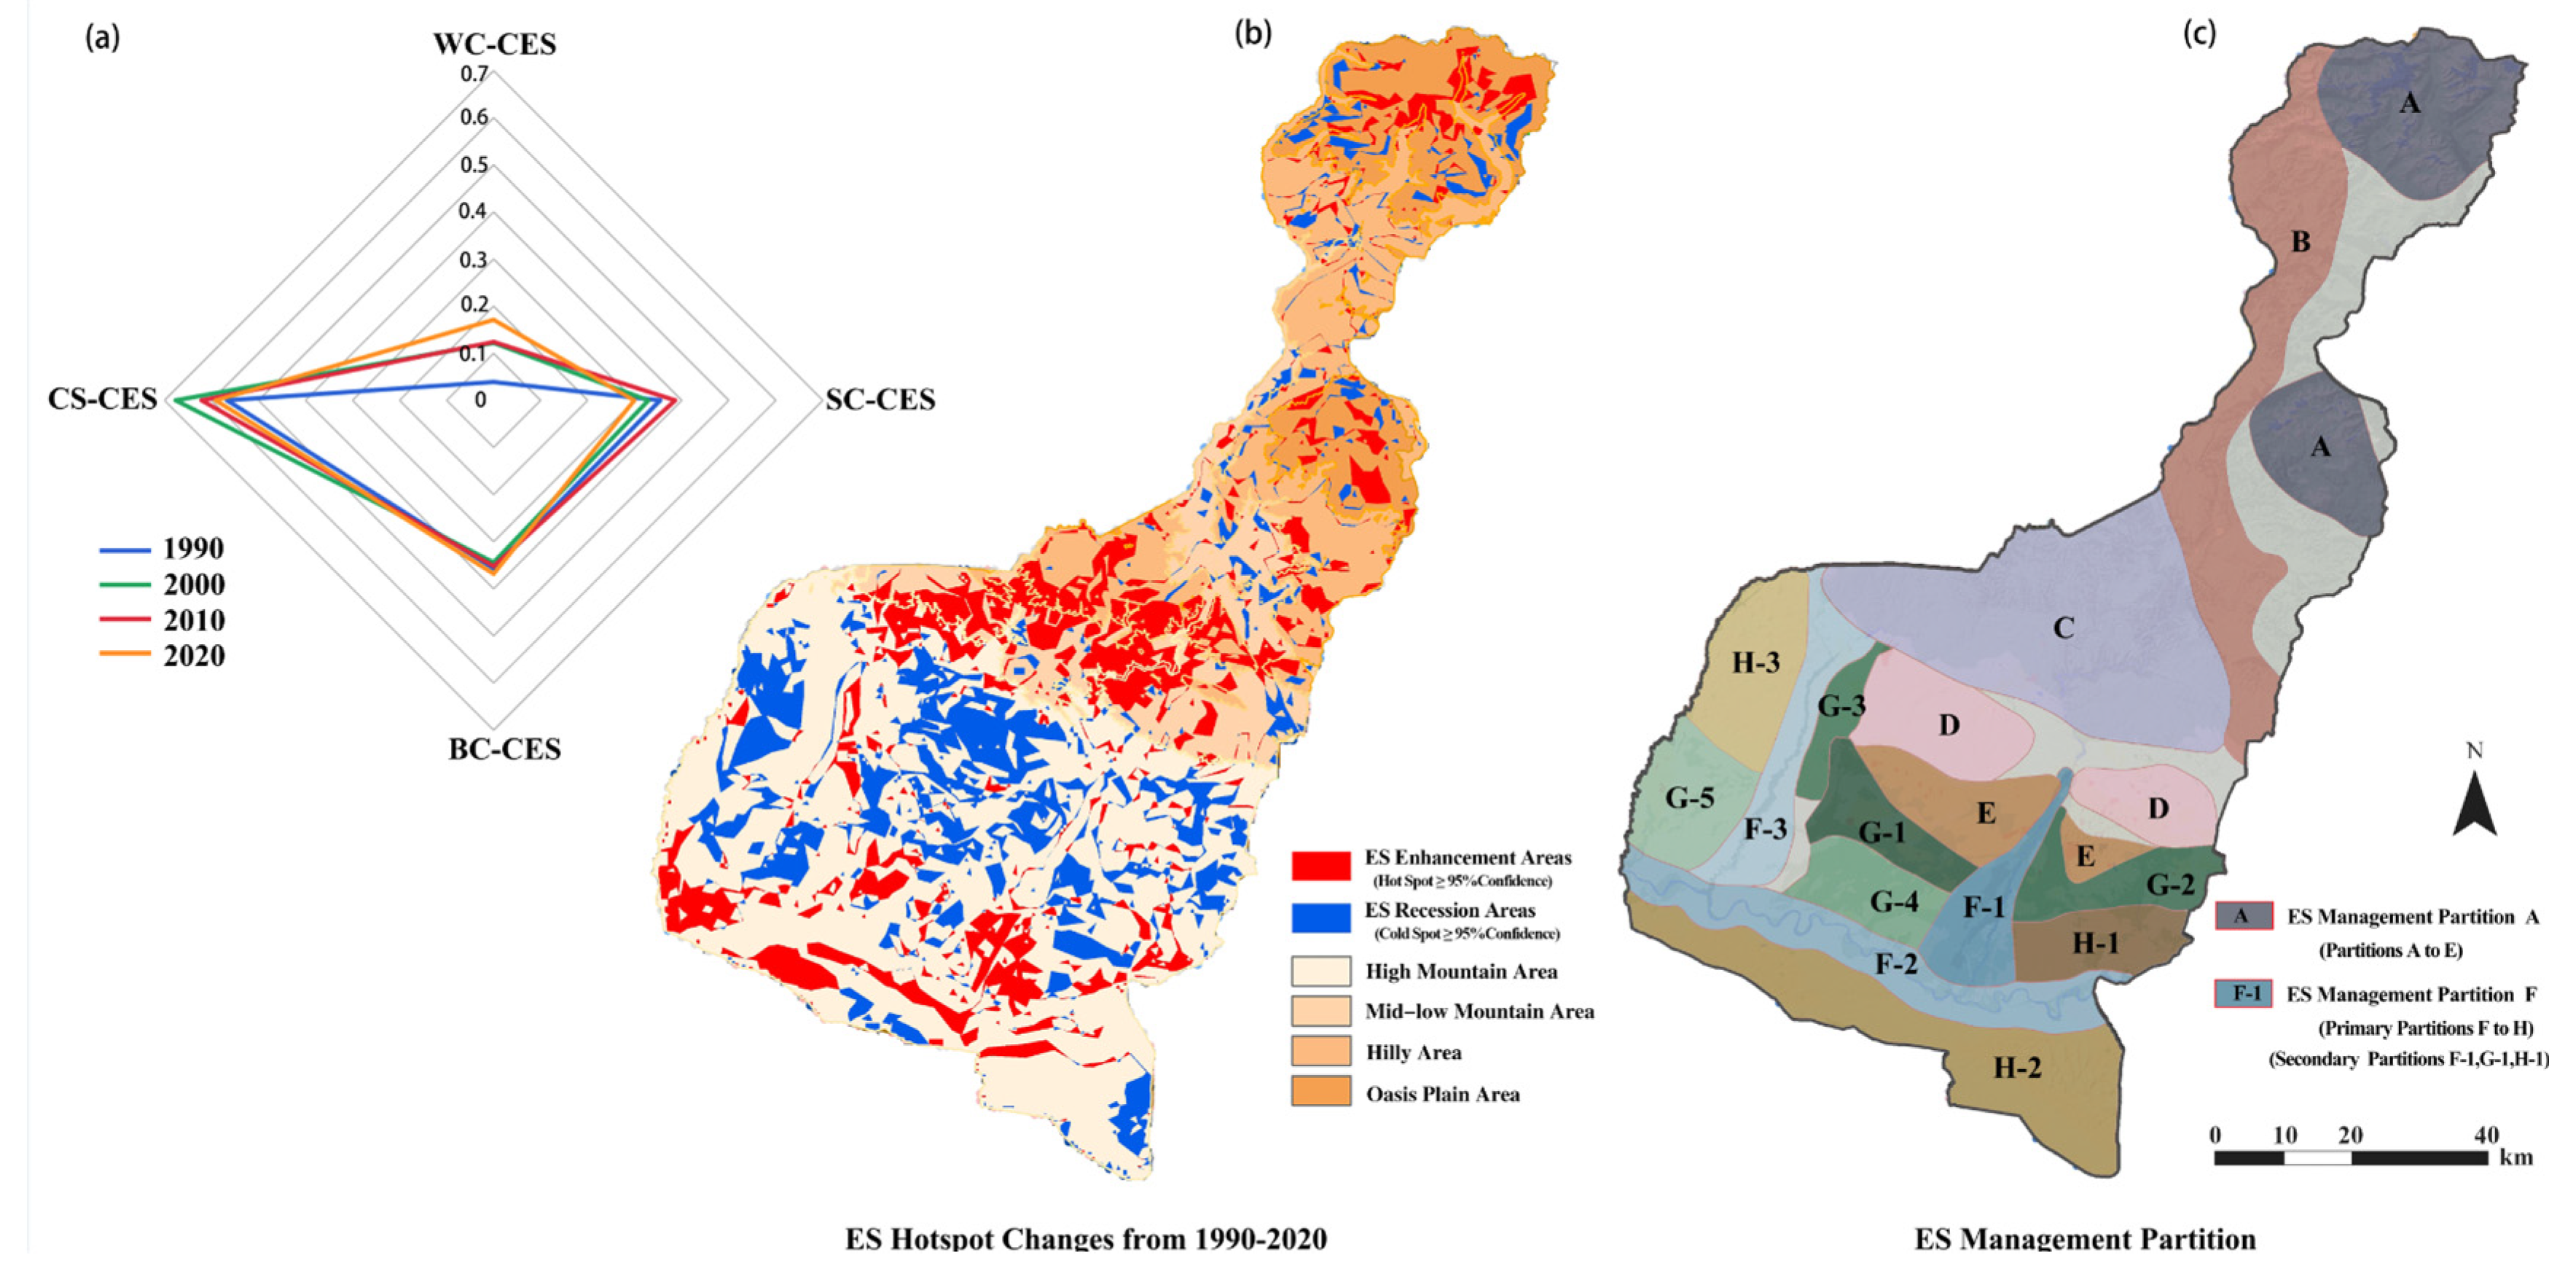
Table 1.
Data used in the study.
| Name | Spatial Resolution | Reference Year | Used for | Data Preprocessing | Data sources |
|---|---|---|---|---|---|
| DEM | 30 m | - | SC/BC/CS | Extracting slope and aspect data through Arc GIS 10.8 | Geospatial Data Cloud (https://www.gscloud.cn) |
| LUCC | 30 m | 1990/2000/2010/2020 | WC/BC/CS | According to field investigations, the land use types were reclassified into nine first-level types by Arc GIS 10.8 | Resources and Environmental Sciences, Chinese Academy of Sciences (RESDC) (https://www.resdc.cn) |
| PRE | 1 km | 1961–2020 | WC/SC/CS | The data from surrounding meteorological stations were extracted, and the precipitation data were interpolated by kriging in Arc GIS 10.8. | The National Meteorological Science Data Center (http://data.cma.cn) |
| NDVI | 1 km | 1990/2000/2010/2020 | SC | Normalization by Arc GIS10.8 fuzzy membership degree. | Geographic remote sensing ecological network platform (http://www.gisrs.cn/) |
| NPP | 1 km | 1990/2000/2010/2020 | CS | Normalization by Arc GIS10.8 fuzzy membership degree. | National Ecosystem Science Data Center (http://www.nesdc.org.cn) |
| TEM | 1 km | 1990/2000/2010/2020 | CS | Annual average temperature data | The National Meteorological Science Data Center (http://data.cma.cn) |
| ET | 1 km | 1990/2000/2010/2020 | WC/CS | Monthly data rasters were overlaid and calculated as annual evapotranspiration data. | National Ecosystem Science Data Center http://www.nesdc.org.cn/ |
| Soil Data | 1 km | - | SC | Spatial distribution data of soil texture and soil type were reclassified | Resources and Environmental Sciences, Chinese Academy of Sciences (RESDC) (https://www.resdc.cn) |
| Social Economics data | 1950–2020 | Driving Factors | Perform spatial statistics and make spatial grids. | Field investigation, Habahe County Records, Habahe Yearbook |
Note: WC is water conservation, SC is soil conservation, BC is biodiversity conservation, CS is carbon storage, and CES is the Comprehensive ES.
Table 2.
ES Evaluation Methods.
| ESs | Methods | Evaluation steps |
|---|---|---|
| WC | Water Balance method (Wu et al., 2023) | The water Balance Equation (1) is the total water conservation capacity (m), represents the annual average precipitation (mm), represents the annual average surface runoff (mm), represents the annual evapotranspiration (mm), represents the area of the nth type of ecosystem in the study area (km2), represents the type of ecosystem in the study area, represents the number of ecosystem types in the study area. |
| SC | Soil Conservation Capacity Evaluation (Wischmeier et al., 1978) | Rainfall erosivity calculating (2) Soil conservation capacity(RUSLE) (3) is the sensitivity index to soil erosion, represents rainfall erosivity, represents monthly rainfall (mm), represents soil texture factor, represents terrain undulation (m), represents vegetation cover. By sorting and classifying soils of different textures based on their erosion resistance capabilities. |
| BC | Habitats Suitability Evaluation (Yu, 1999) | Focal Species method According to the criteria of the focal species method (Lambeck, 1997; Lindenmayer et al., 2002), the Common Crane (Grus grus), Przewalski’s Gazelle (Procapra przewalskii), and Red Deer (Cervus) were selected as representative focal species for typical ecosystem types in arid regions. Habitats Suitability Evaluation Clearly define the specific factors and weights of habitat preferences for each focal species (Duan et al., 2020; Gao et al., 2017; Li et al., 1999), conduct suitability evaluations, and identify the “ecological source areas” for species (evaluation criteria can be found in Appendix A). MCR model Based on the spatial movement patterns of the selected focal species, by simulating their process of overcoming resistance to movement within the landscape, establish a resistance surface, and identify the species migration process using the Minimum Cumulative Resistance (MCR) model. (4) MCR is the minimum cumulative resistance value required to travel from the source to the destination, reflecting the accessibility from the “source” landscape to the destination. A larger value indicates that the resistance the “source” landscape exerts, which needs to be overcome to reach the destination, is greater, making it more challenging to reach. |
| CS | NPP quantitative index method (Wu and Zhang, 2021; Yang et al., 2022) |
NPP quantitative index method (5) is the biodiversity maintenance service capacity index, represents the average net primary productivity of vegetation over multiple years, represents the average annual rainfall over multiple years, represents the average annual temperature over multiple years, represents the altitude factor High-quality vegetation evaluation Based on the vegetation ecosystem evaluation results, select high-quality vegetation (forests, grasslands, wetlands) as the “source” for the dispersion of plant genetic resources and assign different resistance values to them. MCR model Simulate the dispersion process of plant genetic resources using the MCR model (6) |
| CES | Cumulative Equation(Ding et al., 2021; Qu et al., 2024; Wu and Fan, 2022) | CES calculation After normalizing each ES, the ESs are reclassified into four levels: Excellent, Good, Average, and Poor. Then, the CES is calculated using the raster calculator in ArcGIS 10.8. CES=(ES1+ES2+...+ESn)/n (7) CES is the comprehensive ecosystem service function, ES1 refers to the first type of ES function, and n represents a total of n types of ES functions. |
Note: WC is water conservation, SC is soil conservation, BC is biodiversity conservation, CS is carbon storage, and CES is the Comprehensive ES.
Table 3.
ES Driving Factors.
| Factor Type | Factors | Symbol | Descripition | |
| Natural factor | PRE | X1 | precipitation | |
| TEM | X2 | temperature | ||
| ET | X3 | evaporation | ||
| NPP | X4 | net primary productivity | ||
| NDVI | X5 | |||
| DEM | X6 | |||
| Slope | X7 | |||
| surface runoff | X8 | |||
| soil erosion | X9 | |||
| soil type | X10 | |||
| Social & Economic Driving Factors | Land use intensity | Comprehensive index of land use degree | X11 |
00% M represents the comprehensive index of land use degree in study area, is the grade i land use degree classification number; Ci and C are the grade i land use area and the total area of land within the region, respectively; n is the grade number of land use degree classification number (unused land =1, woodland, grassland and water area =2, cultivated land =3, construction land =4). |
| Population density | X12 | (people /per square kilometer) | ||
| Per Cultivated Area | X13 | (people /per hectare) | ||
| Livestock density | X14 | (head/km2) | ||
| Regional economy | GDP | X15 | (ten thousand RMB) | |
| Loactional factor |
Distance to road | X16 | m | |
| Distance to river | X17 | m | ||
| Comprehensive Ecosystem Service | Water Conservation | WC | ||
| Soil Conservation | SC | |||
| Biodiversity Conservation | BC | |||
| Carbon Storage | CS | |||
| Comprehensive Ecosystem Service | CES | |||
Disclaimer/Publisher’s Note: The statements, opinions and data contained in all publications are solely those of the individual author(s) and contributor(s) and not of MDPI and/or the editor(s). MDPI and/or the editor(s) disclaim responsibility for any injury to people or property resulting from any ideas, methods, instructions or products referred to in the content. |
© 2024 by the authors. Licensee MDPI, Basel, Switzerland. This article is an open access article distributed under the terms and conditions of the Creative Commons Attribution (CC BY) license (http://creativecommons.org/licenses/by/4.0/).
Copyright: This open access article is published under a Creative Commons CC BY 4.0 license, which permit the free download, distribution, and reuse, provided that the author and preprint are cited in any reuse.


