1. Introduction
The rapid evolution of the socio-economic landscape, coupled with the persistent processes of the urbanization and industrialization, has led to increasing disturbance of natural habitats by human activities, exacerbating the problem of habitat fragmentation [
1,
2]. In this context, the Sustainable Development Goal (SDG
15), as articulated in the 2030 Agenda for Sustainable Development, underscores the critical importance of protecting, restoring, and sustainably utilizing terrestrial ecosystems to safeguard natural habitats and promote biodiversity [
3]. Over the past four decades, China has undergone significant land-use changes (LUC) [
4,
5,
6]. These alterations in land-use have directly modified the distribution of natural biological habitats, thereby exacerbating habitat fragmentation and contributing to biodiversity loss [
7,
8]. In the future, urban expansion is expected to lead to ecological fragmentation, which will pose an ongoing threat to biological habitats [
9]. Habitat fragmentation disrupts the migration of organisms between habitat patches and impairs the exchange of materials and energy [
10,
11], ultimately leading to a deterioration in HQ. This phenomenon has emerged as a critical focus in global ecological research. Considering the intensifying global habitat fragmentation, investigating the impact of LUC on HQ is of paramount importance for advancing the objectives of SDG
15.
HQ is the ability of an ecosystem to provide suitable natural ecological conditions [
12,
13]. It is critical for maintaining stability in biodiversity within natural ecosystems and plays a significant role in enhancing human well-being [
14]. The advancement of 3S technologies has facilitated the development of various ecosystem assessment models [
15]. Among these, the Maxent model [
16], ARIES model [
17], SoLVES model [
18], and the InVEST model [
19] have emerged as prominent tools widely utilized in the field. Notably, the InVEST model provides intuitive visual representations, thus addressing the limitations of previous ecosystem service assessments that often relied on abstract and less comprehensible textual descriptions [
20,
21]. Moreover, this model is well-established and has been extensively applied in research conducted at various scales [
22,
23,
24], across diverse administrative units [
25,
26], and in biodiversity assessments [
27,
28].
Climate change and LUC serve as the principal driving factors behind modifications in HQ, with LUC themselves being influenced by both climate dynamics and socio-economic development [
28,
29]. Among the latest generation of climate models, the sixth Coupled Model Intercomparison Project (CMIP6) represents the most recent advancements in predicting future climate scenarios [
30]. This model primarily incorporates Shared SSPs and RCPs. In recent years, researchers have increasingly utilized SSPs-RCPs scenarios to investigate land-use prediction studies within the framework of projected climate change [
31,
32]. Zhang et al. [
19] developed a novel integrated framework by combining the SD-FLUS-InVEST models to simulate the dynamic evolution of ecosystem services under LUC in the Yellow River Basin across three scenarios: SSP1-1.9, SSP2-4.5, and SSP5-8.5. Lu et al. [
33] utilized the SD model to investigate the supply and demand relationships of six ecosystem services in the Yangtze River Delta urban agglomeration under the SSP-RCP scenarios from 2018 to 2050, proposing corresponding management measures.
Land-use simulation encompasses two fundamental aspects: quantitative structure and spatial distribution. In predicting quantitative demand, SD is an enhanced top-down model [
34], adeptly accounting for the comprehensive influences of both social and natural factors on LUC. Conversely, the PLUS model has become widely adopted for spatial distribution simulation, primarily due to its high accuracy and user-friendly interface [
35]. Given the inherent complexity of predicting land-use evolution, reliance on a single model is inadequate for a thorough assessment. Consequently, integrating the SD-PLUS model facilitates a more robust simulation of LUC, effectively capturing the interplay between social and natural factors across various prospective development scenarios.
The rapid economic development and accelerated urbanization of the YREB present significant challenges to the regional ecological environment. Despite robust economic growth, there remains a critical gap in research regarding land use quantity, structure, and spatial dynamics. This study addresses this gap by constructing a comprehensive assessment framework based on the latest SSP future development scenarios. The framework integrates SD – PLUS - HQ models to evaluate the spatiotemporal evolution of LUC quantity and their implications for HQ under varying development scenarios. The primary objectives of this research are as follows: (1) to utilize the SD-PLUS model to simulate the quantity, structure, and spatial distribution of land-use within the context of future development scenarios; (2) to couple the SSP-PLUS-HQ model to analyze the spatiotemporal evolution of HQ structure across different scenarios, thereby elucidating the characteristics of HQ evolution and the overall degradation processes; and (3) to examine the response of various LUT to changes in HQ and to identify the spatiotemporal clustering characteristics of HQ through hotspot analysis. The findings of this study will provide a scientific foundation for optimizing land-use structure and advancing ecological sustainability within the YREB.
2. Overview of the Study Area and Data Sources
2.1. Overview of the Study Area
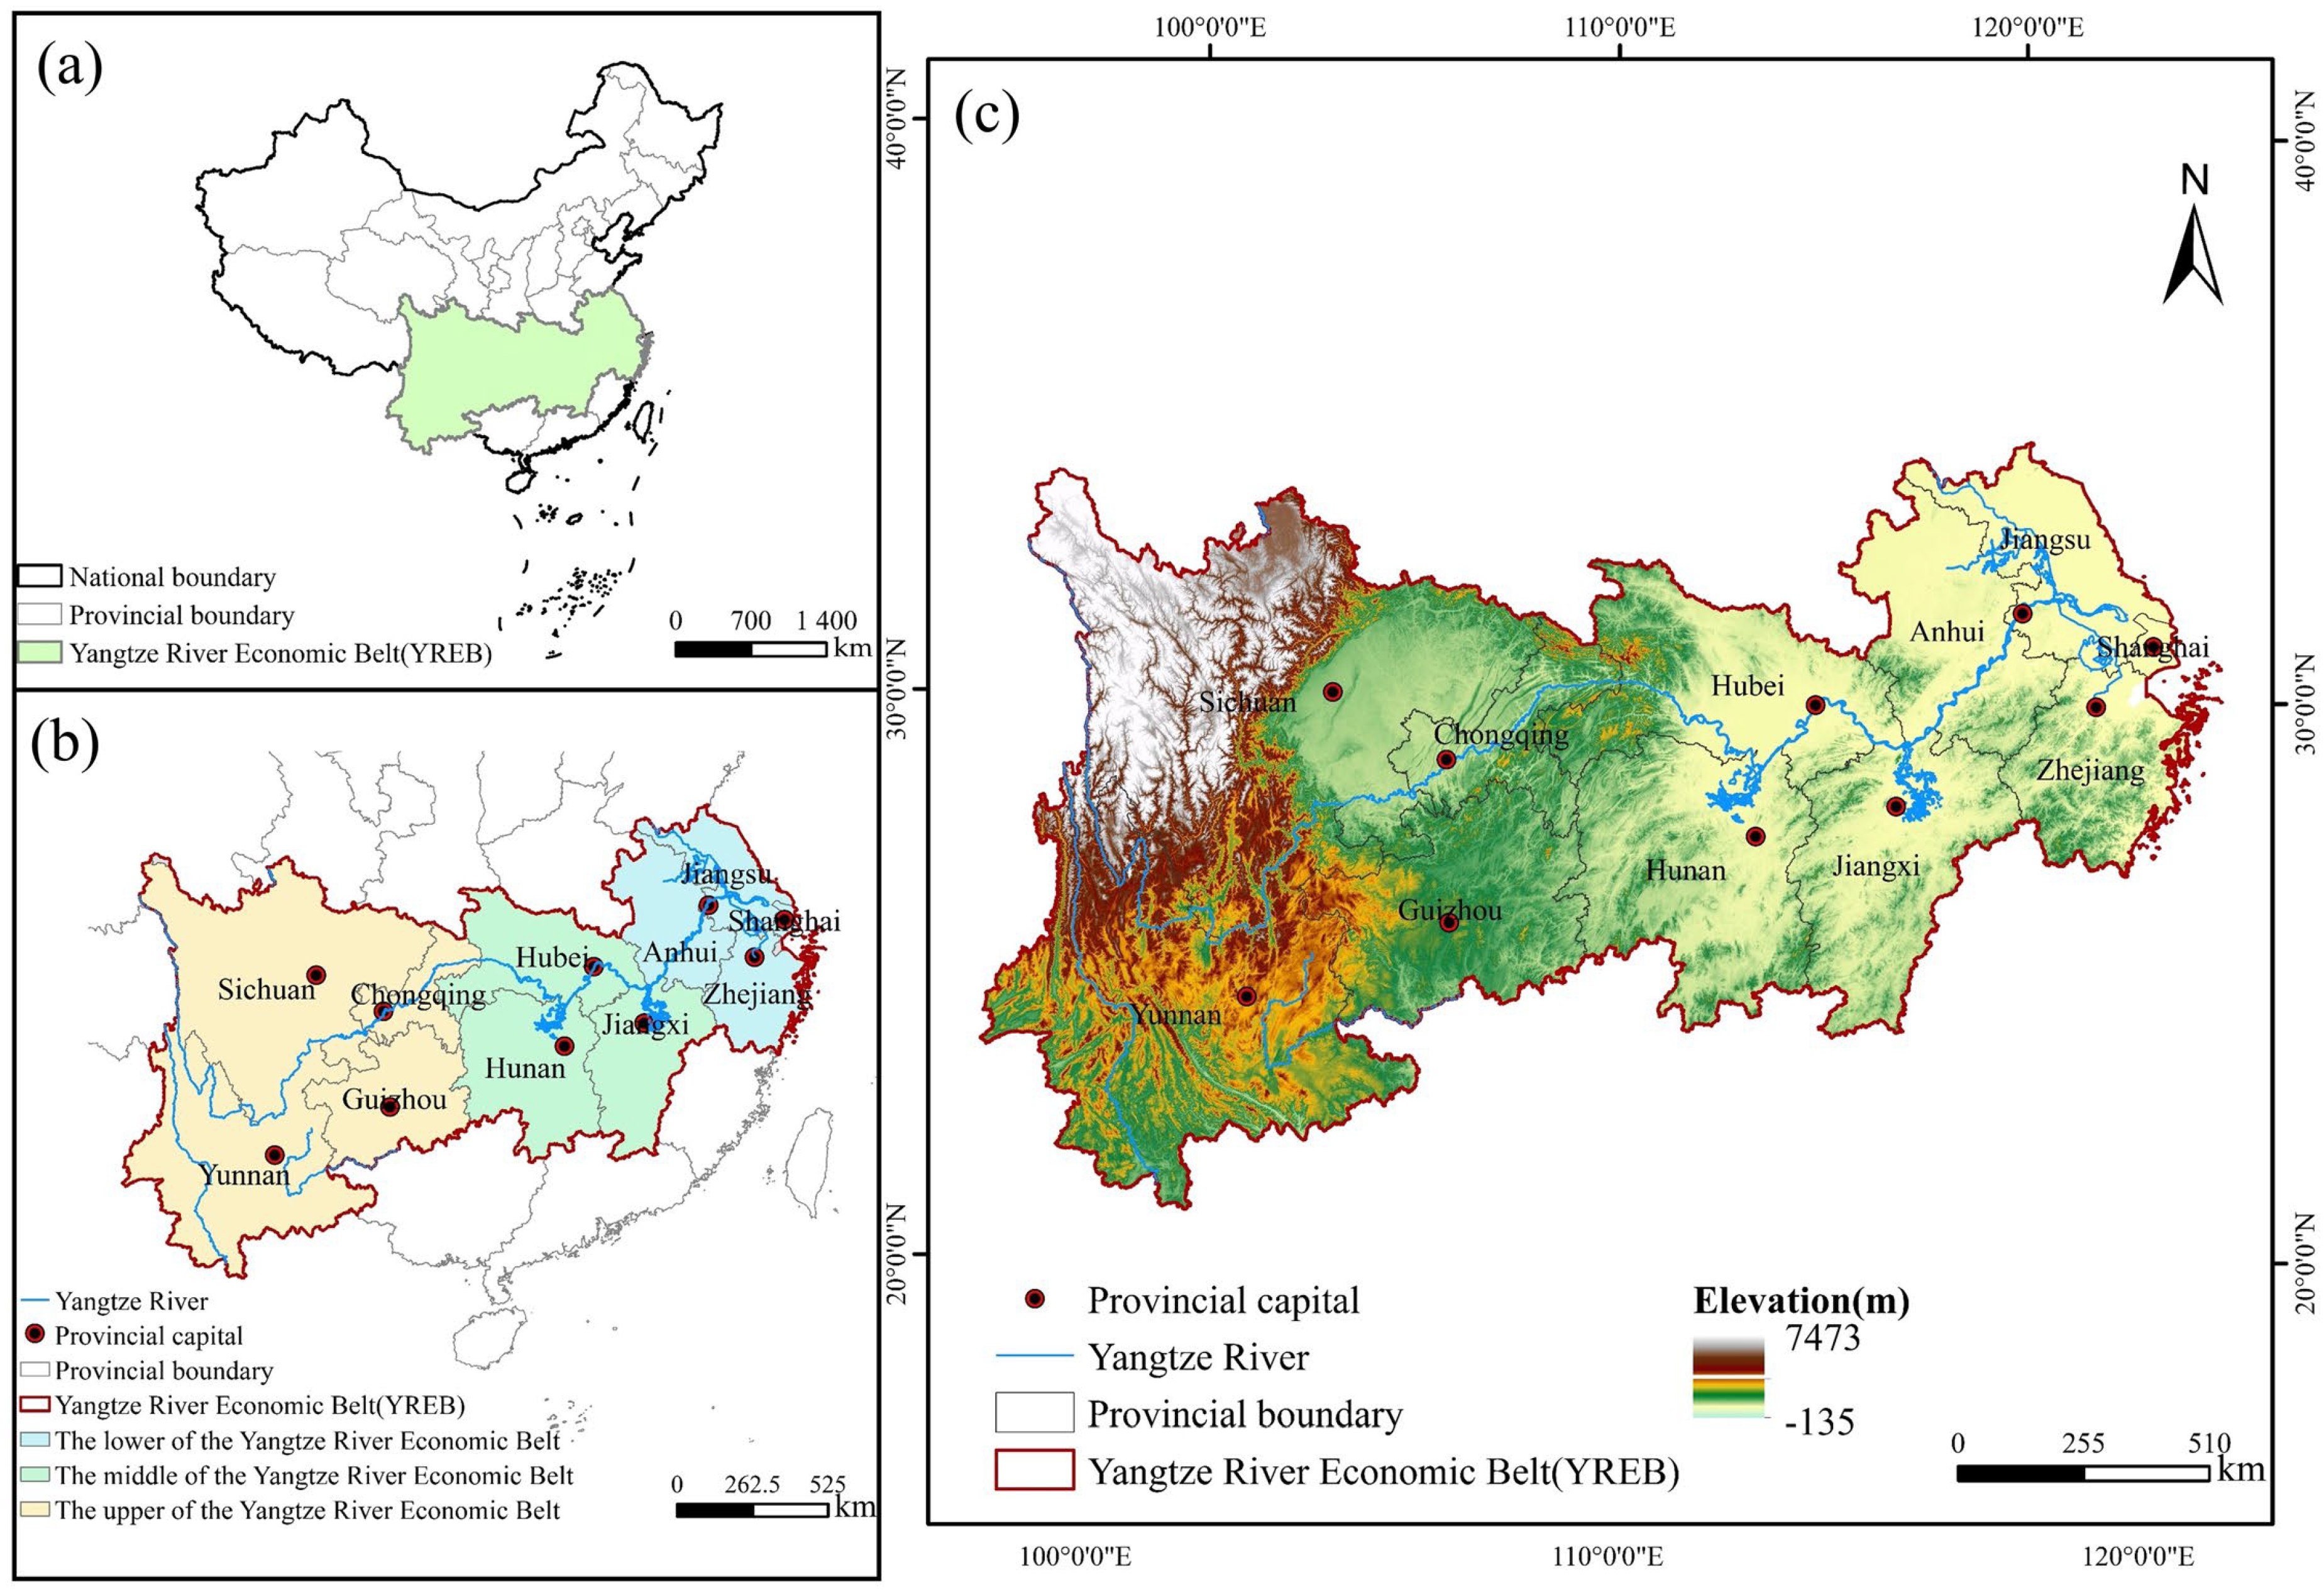
The YREB is located at geographical coordinates 108°30′E to 122°15′E and 24°30′N to 35°45′N, and spans eastern, central and western China. This economic belt comprises 11 provinces and municipalities (
Figure 1). The region has an annual precipitation of 1,067 mm and an annual temperature of 16°C. It covers an area of approximately 2,0523 million km2, accounting for 21.4% of China. In 2023, the population of the YREB is about 608 million, accounting for 42% of China. The region’s GDP is about 58.43 trillion-yuan, accounting for 46.7% of China’s. In addition, the YREB has more than 40% of China’s forest cover and about 20% of China’s water cover, positioning the region as an innovative demonstration zone for ecological conservation and restoration efforts.
The YREB constitutes a vital element of China’s three principal development strategies and serves as a critical link in the framework of the "21st Century Maritime Silk Road" [
36]. Nevertheless, the region is confronted with a myriad of severe environmental challenges resulting from sustained high-intensity development and urban expansion [
37]. These challenges manifest as heightened environmental pollution, ecological degradation, water and air quality deterioration, soil erosion, and a significant decline in ecosystem functionality [
38,
39]. As the longest and most expansive economic belt in China, the YREB, characterized by its unique geographical location, abundant natural resources, and favorable ecological conditions, plays an indispensable role in the country’s ecological security framework. Consequently, the preservation of a robust ecological environment within the YREB is imperative for fostering global ecological security.
2.2. Data Sources
The data required for this study were mainly derived from the SD-PLUS model, including land-use data [
40] and driving factor data (
Table 1). All raster data are uniformly set to a spatial resolution of 300 m and the WGS_1984_Albers projected coordinate system is used.
2.3. Research Framework
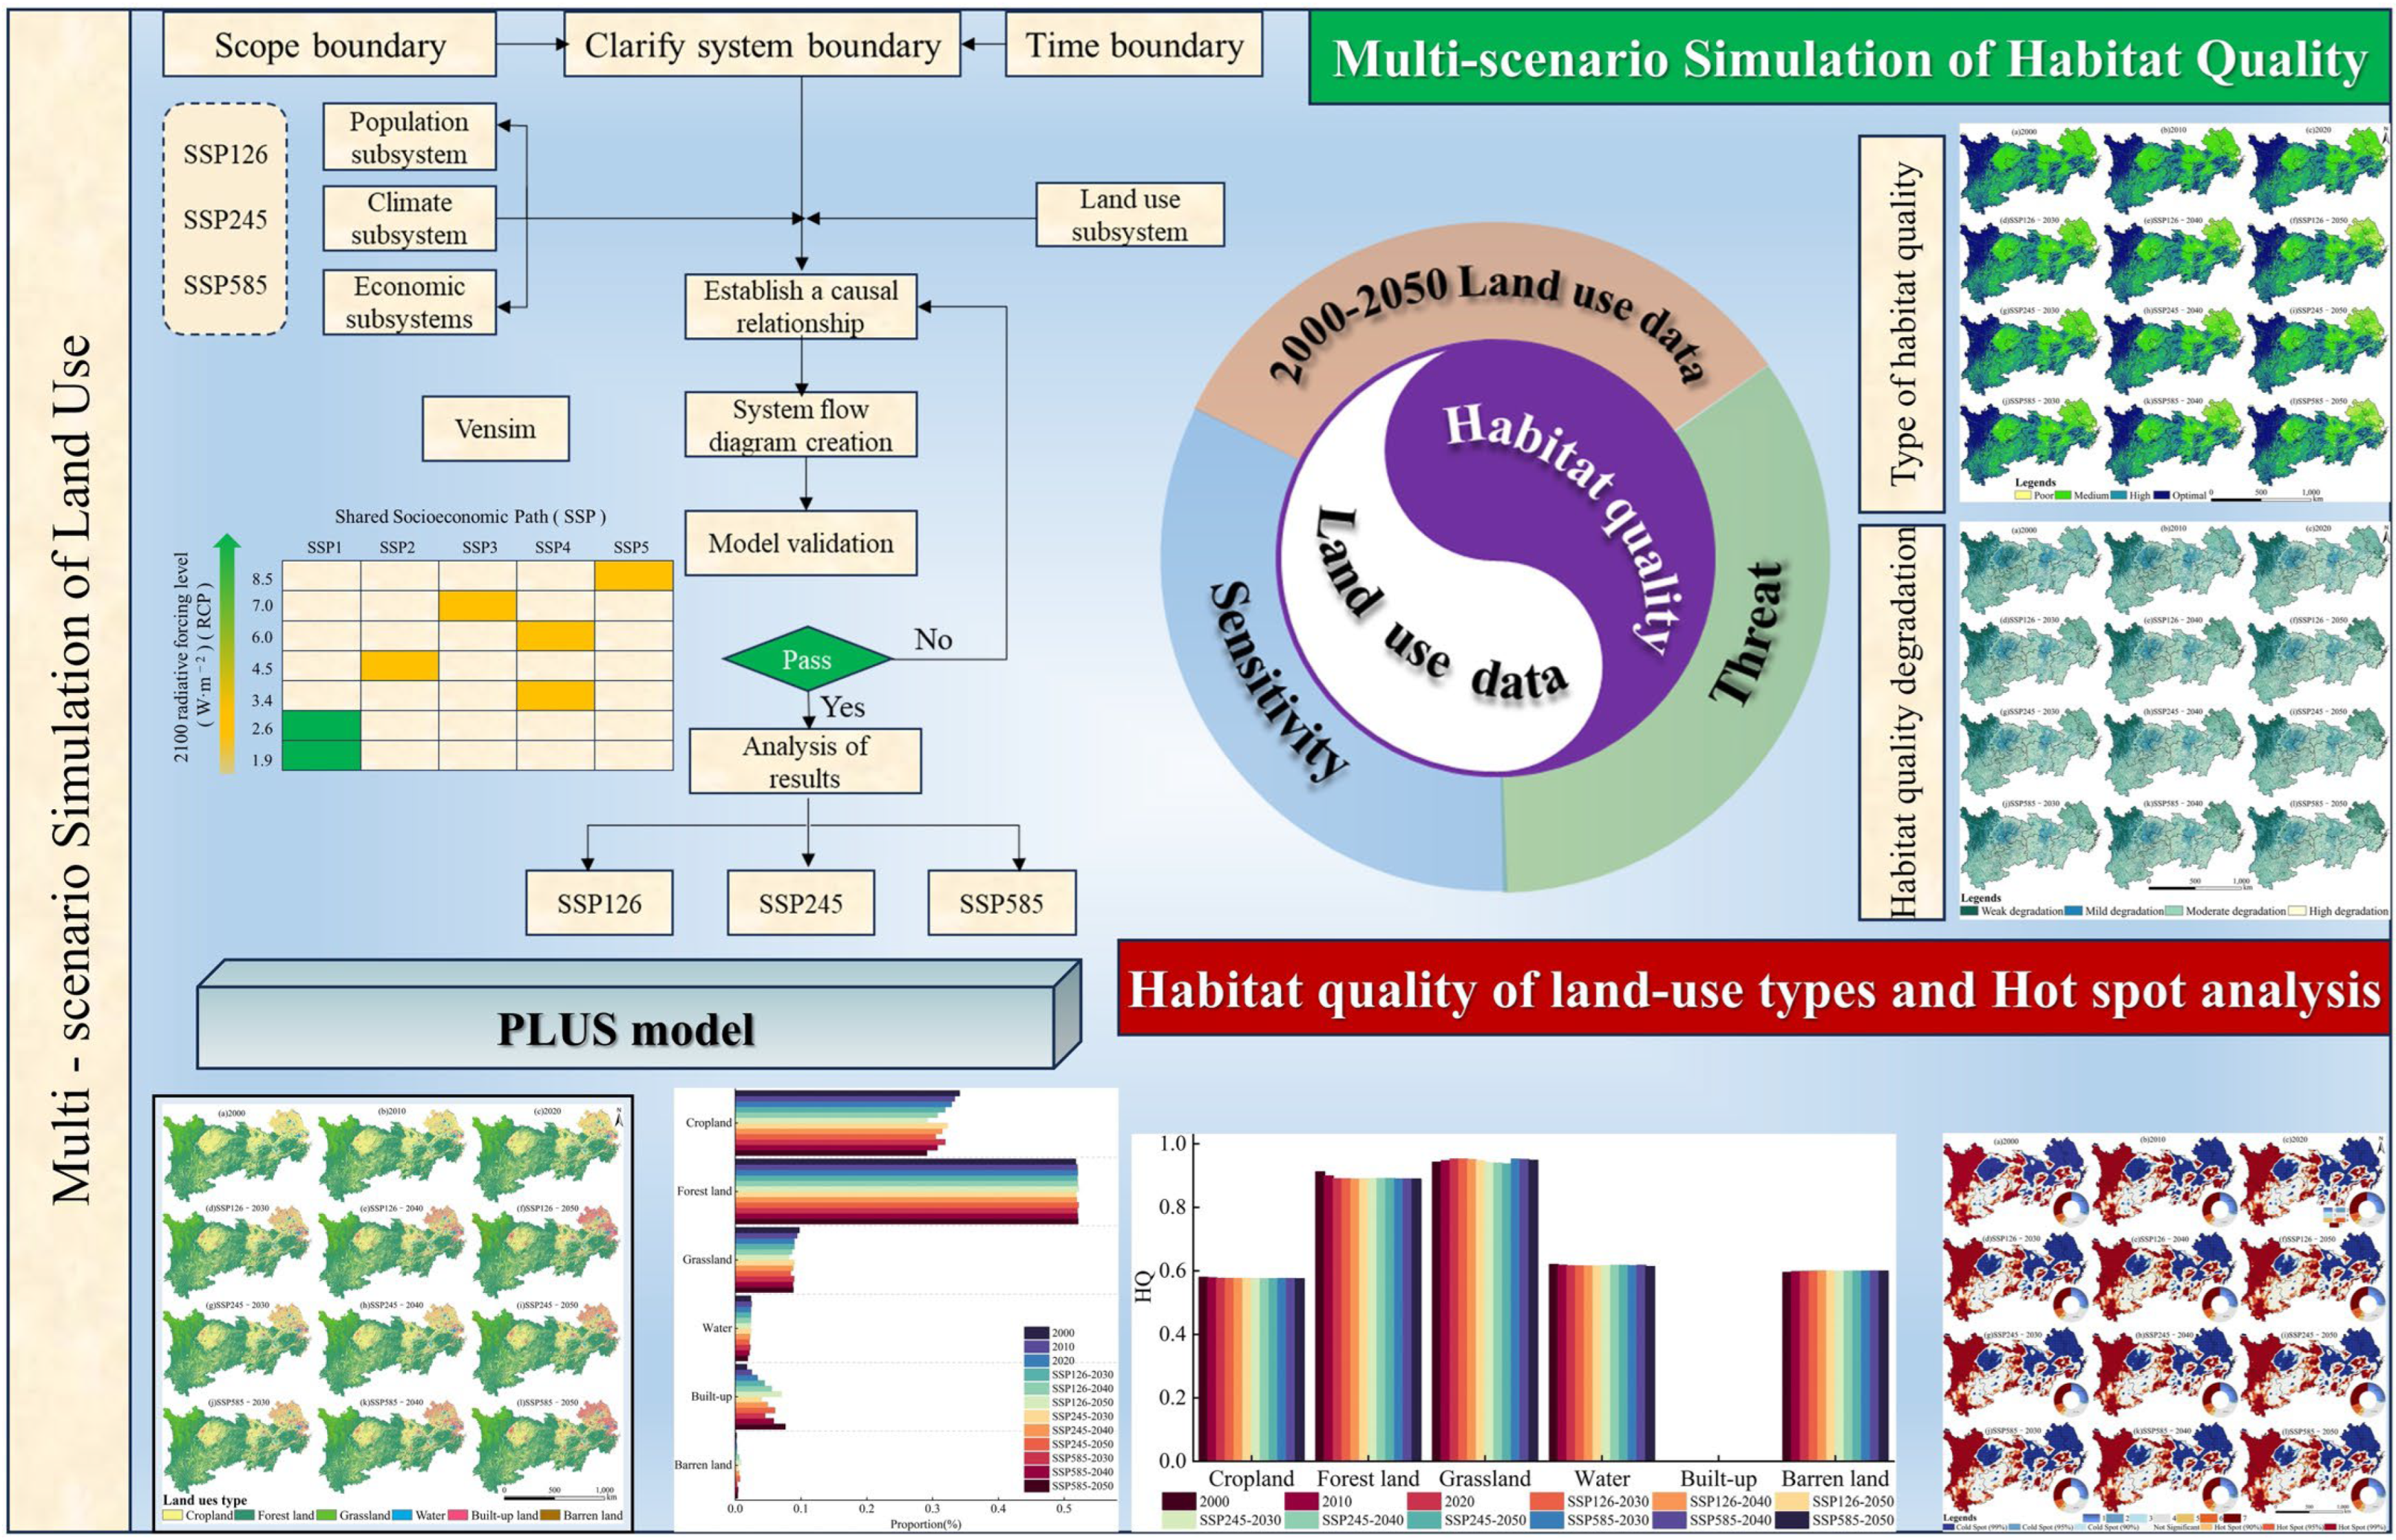
The research framework consists of four key components (
Figure 2). Firstly, multiple scenario simulation parameters are established based on socioeconomic and climate change projection data across various SSP-RCP scenarios. The SD model is employed to simulate land-use and cover demands for each scenario. Secondly, the PLUS model is applied to analyze the spatiotemporal distribution of land-use across three distinct scenarios. Thirdly, the InVEST model evaluates the spatiotemporal variations in regional HQ, elucidating the dynamics of HQ and its degradation process, while also examining the influence of different LUT on HQ. Finally, hotspot analysis techniques are utilized to explore the spatial clustering patterns of HQ.
3. Methodology
3.1. Invest Model
HQ is an index of an ecosystem’s potential to provide species with the ability to survive and reproduce. The HQ module quantitatively assesses the effects of different LUT on habitat suitability for both flora and fauna, while also evaluating the intensity of threats posed by various habitat stressors. This comprehensive approach enables the simulation of the spatial distribution of HQ. The specific formula employed in this analysis is as follows:
where
Qiy denotes the HQ index for grid cell
i within LUT
y;
Hiy represents the habitat suitability for grid cell
i within the same LUT; and
Diy indicates the level of HD for grid cell
i in LUT
y. The parameter
k signifies the semi-saturation parameter, while
z refers to the model’s default constant. This study establishes the year 2020 as the baseline for evaluating HQ. Given the specific conditions of the YREB, cropland, built-up land, and barren land are identified as the primary factors threatening HQ, as these LUT are significantly influenced by human activities. The values for the parameters are determined based on the recommended reference values provided in the InVEST model user manual and are further corroborated by findings from relevant literature [
22,
41,
42].
3.2. PLUS Model
The PLUS model is an advanced simulation tool designed for LUC, grounded in the principles of cellular automata (CA) [
35]. This model innovatively integrates a novel Land Expansion Analysis Strategy (LEAS) with a variety of random patch seeds (CARS) within the CA framework, with the objective of predicting and simulating the generation and evolution of diverse land type patches. Specifically, based on the land-use in the two historical periods, a map of the distribution of land-use development potential is produced through historical land-use expansion trends and influencing factors, and finally land-use projections for future years are obtained. See annex for details.
The study used land-use data from 2000 to 2020, coupled with 12 driving factors, to accurately simulate the LUT for the year 2020. Comparison of the simulated data with actual land-use data for 2020 showed a Kappa coefficient of 0.841 and a FoM of 0.184, indicating a high degree of prediction accuracy and validating the effectiveness of the predictive simulation methodology.
3.3. SD Coupled SSP-RCP Multi-Scenario
To examine the nonlinear relationship between socio-economic factors and LUC, we employed a SD model for land-use scenario simulation. This model comprises four primary components: the land-use, the population, the climate, and the economy. It has been extensively utilized in research related to LUC simulations across various future scenarios [
43], See annex for details.
An important distinction between scenario analysis and predictive models is that scenario analysis considers the inherent uncertainties of social and ecological systems from the outset, incorporating potential future states into a transparent problem-solving framework. In simulating possible changes in ecological systems, scenario analysis showcases unique advantages that can help decision-makers develop strategies more effectively. Currently, scenarios formed by combining SSPs and RCPs are applicable to ecological system analysis at different scales and across multiple fields, and can also be used for future land-use predictions and land cover modeling studies.
The scenarios in CMIP6 are combinations of various SSPs and RCPs, emphasizing the driving role of different socioeconomic development models in climate change and revealing the potential impacts of future socioeconomic development. To address future changes in climate and socioeconomic conditions, relying on a single future development scenario is no longer sufficient for current research needs. We selected three development scenarios from the SSP-RCP framework: SSP126, SSP245, and SSP585.
The SSP126 scenario is a combination of SSP1 and RCP1.9, representing sustainable socioeconomic development under low levels of greenhouse gas emissions. In this scenario, land is strictly regulated, and grassland and forest land remain intact, constituting the current lowest radiative forcing sustainable development scenario. The SSP245 scenario combines SSP2 with RCP4.5, representing a medium radiative forcing scenario, where land regulation is relatively strict and socioeconomic development continues in the current trajectory. Lastly, SSP585 is a combination of SSP5 and RCP8.5, representing a high radiative forcing scenario with moderate land regulation, reliance on substantial fossil fuel resources, and resulting in high levels of greenhouse gas emissions, thereby driving rapid socioeconomic development.
3.4. Hotspot Analysis
HQ hotspots are defined as regions within a designated area that exhibit a relatively high capacity for HQ, whereas cold spots are characterized by a diminished level of HQ. This study employs the Getis-Ord Gi
* module within ArcGIS software to conduct a comprehensive hotspot analysis of HQ. This module effectively delineates the spatial distribution and aggregation characteristics of areas with elevated HQ (hotspots) and those with reduced HQ (cold spots) [
44,
45].
where
Gi* represents the aggregation index for raster cell
i;
ai denotes the attribute value associated with raster cell
i;
Qij refers to the weight matrix;
n signifies the total number of units; and
aˉ represents the mean value of HQ across all pixels.
4. Results
4.1. Spatiotemporal Evolution Characteristics of Land-Use
4.1.1. Spatial Change of LUT
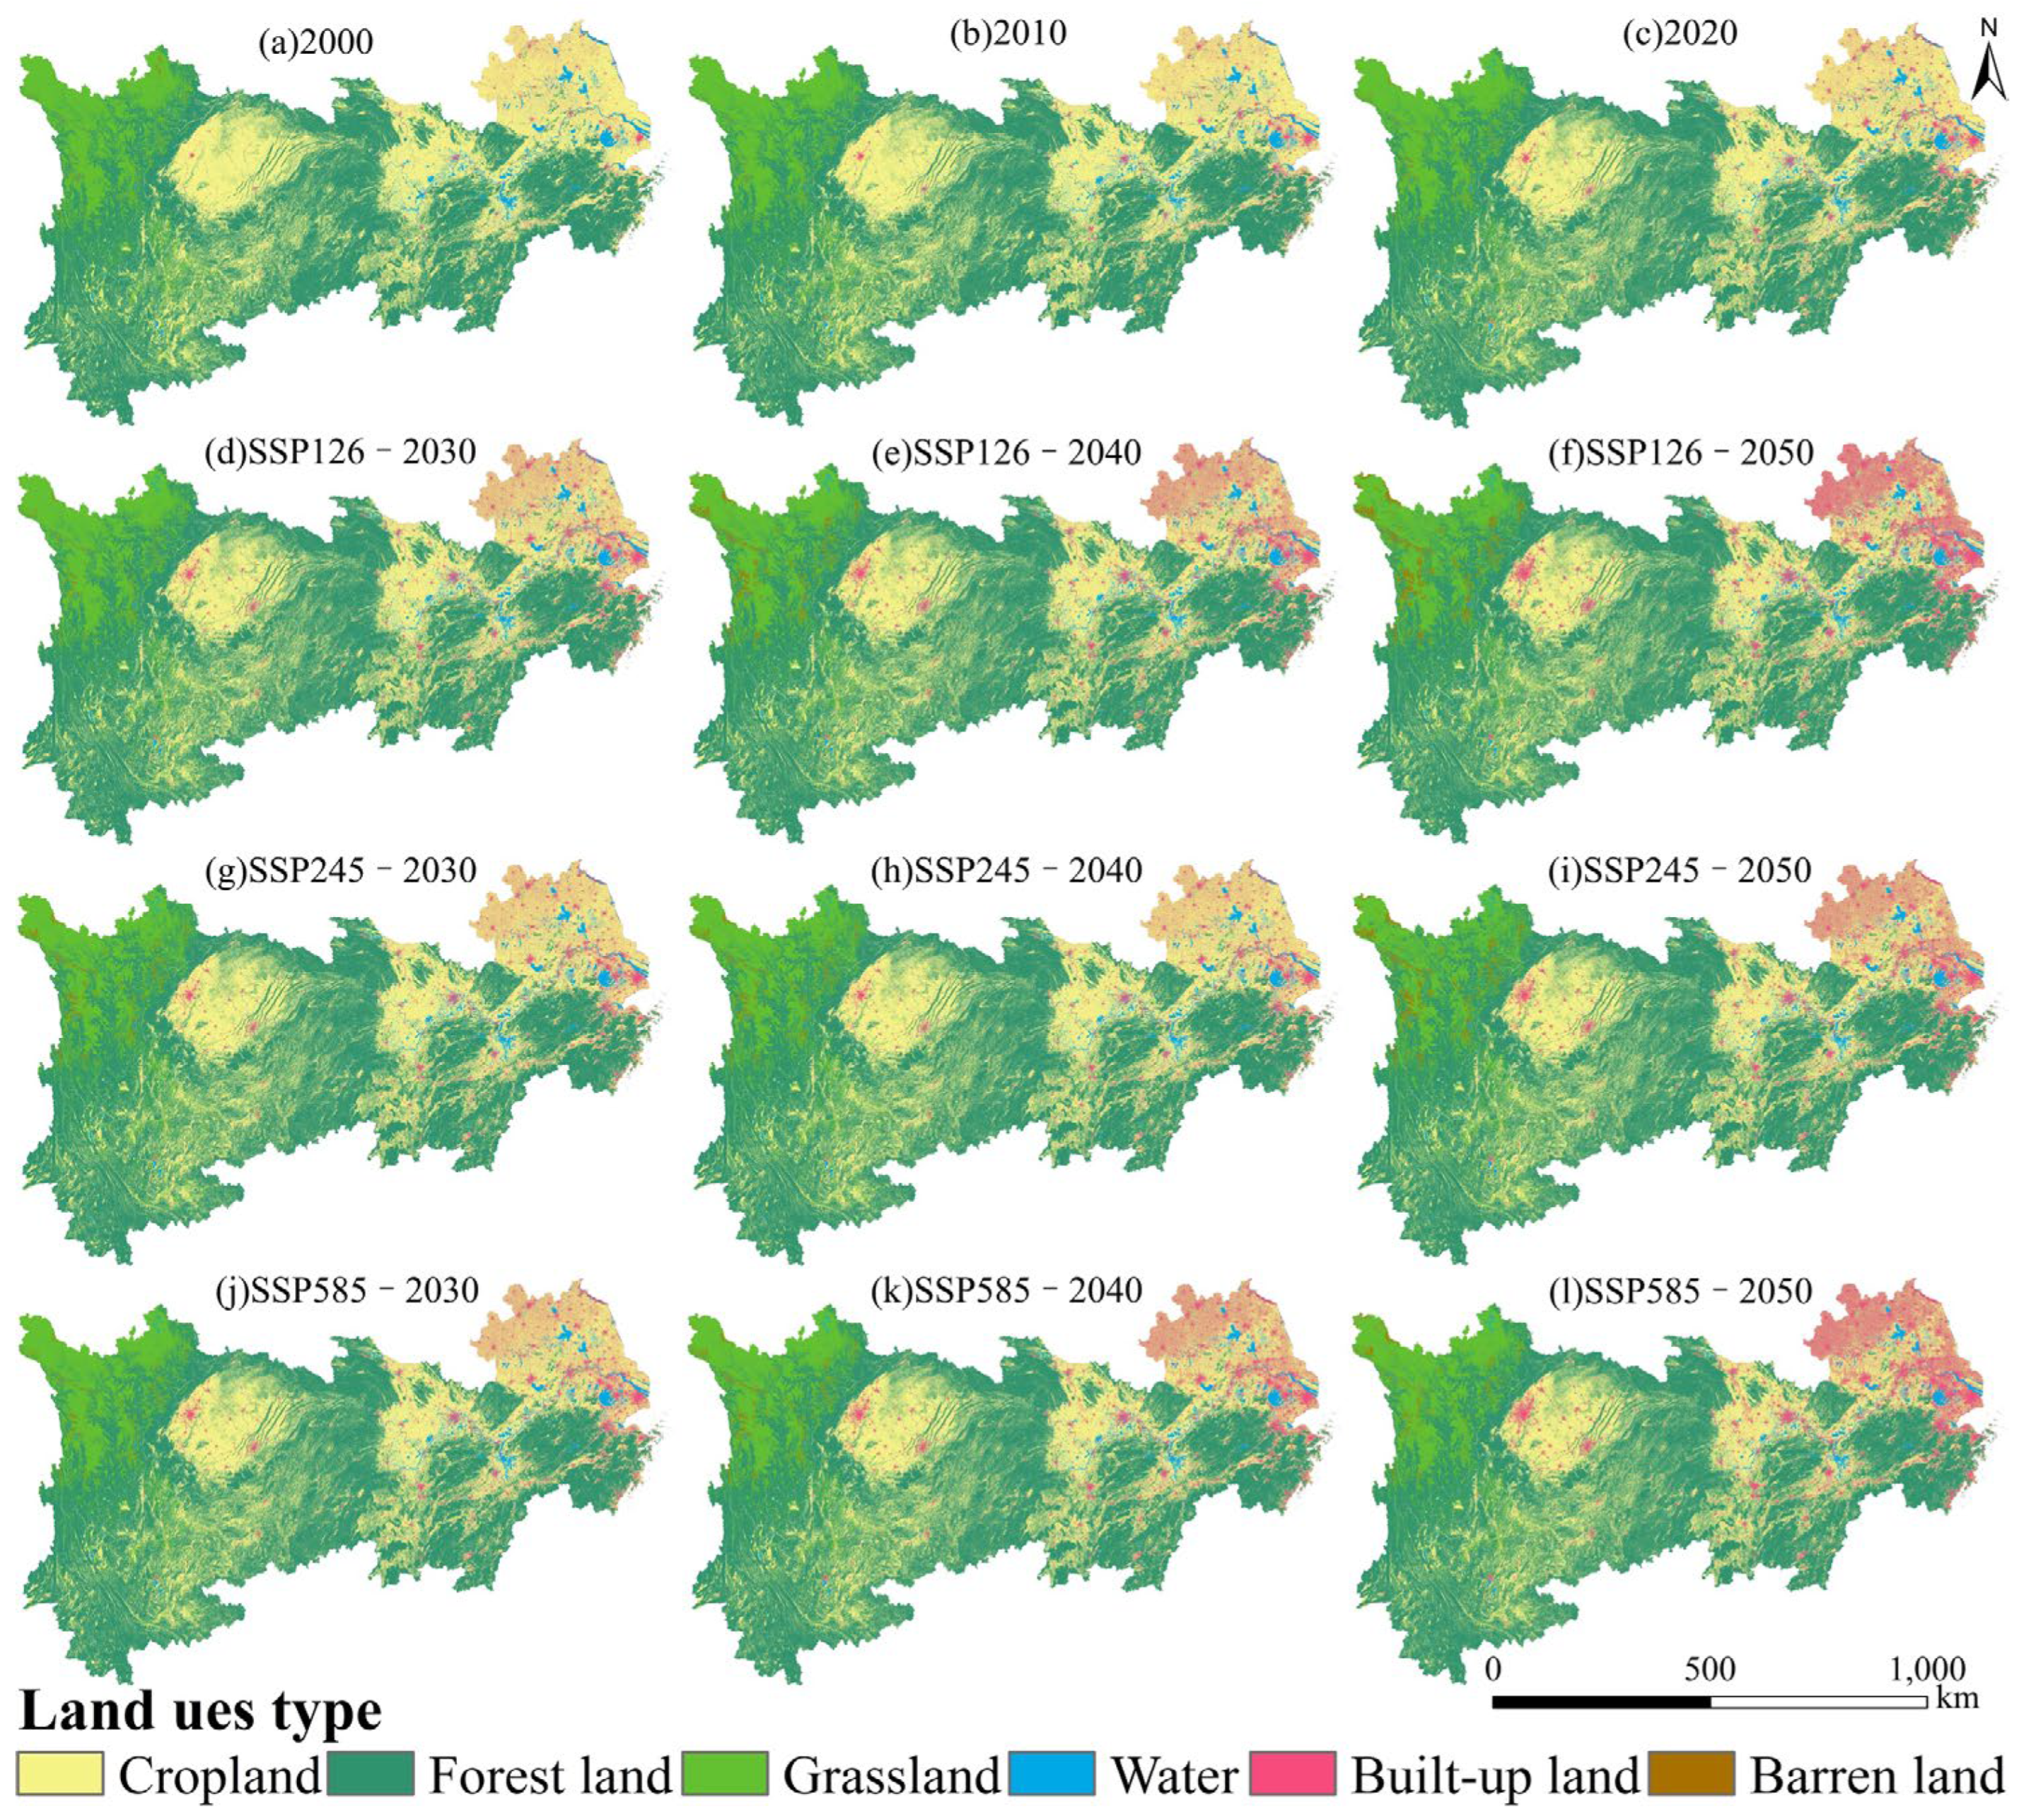
Between 2000 and 2020, the spatial distribution of land-use demonstrated a predominant presence of cropland, forest land, and grassland. In particular, the eastern region was characterized primarily by cropland, whereas the northwest was largely covered by grassland. The central and southern regions were predominantly composed of forest land. The eastern area, notably situated in the lower YREB plain, exhibited significant expanses of cropland. Conversely, the northwest remained dominated by grassland, while the central and southern areas were primarily characterized by forest land coverage. Water was predominantly located in the eastern region, and built-up land exhibited a radial distribution around the urban centers within the YREB, with a marked concentration in the east (
Figure 3).
Under the three scenarios, the spatial characteristics of land-use projected from 2030 to 2050 remain largely consistent (
Figure 3). Notably, the land-use distribution in 2030 is expected to be similar to that in 2020. By 2040, the area designated as built-up land in the east is anticipated to expand across all development pathways, while the west and centre will primarily comprise forest land and grassland systems. In 2050, built-up land in the east is projected to achieve a dominant position, continuing its outward expansion, with a discernible radial diffusion trend of built-up land also emerging in the centre. It is noteworthy that the rate of expansion of built-up land is significantly higher in the SSP126 and SSP585 compared to the SSP245.
4.1.2. Regional Land-Use Structure Change
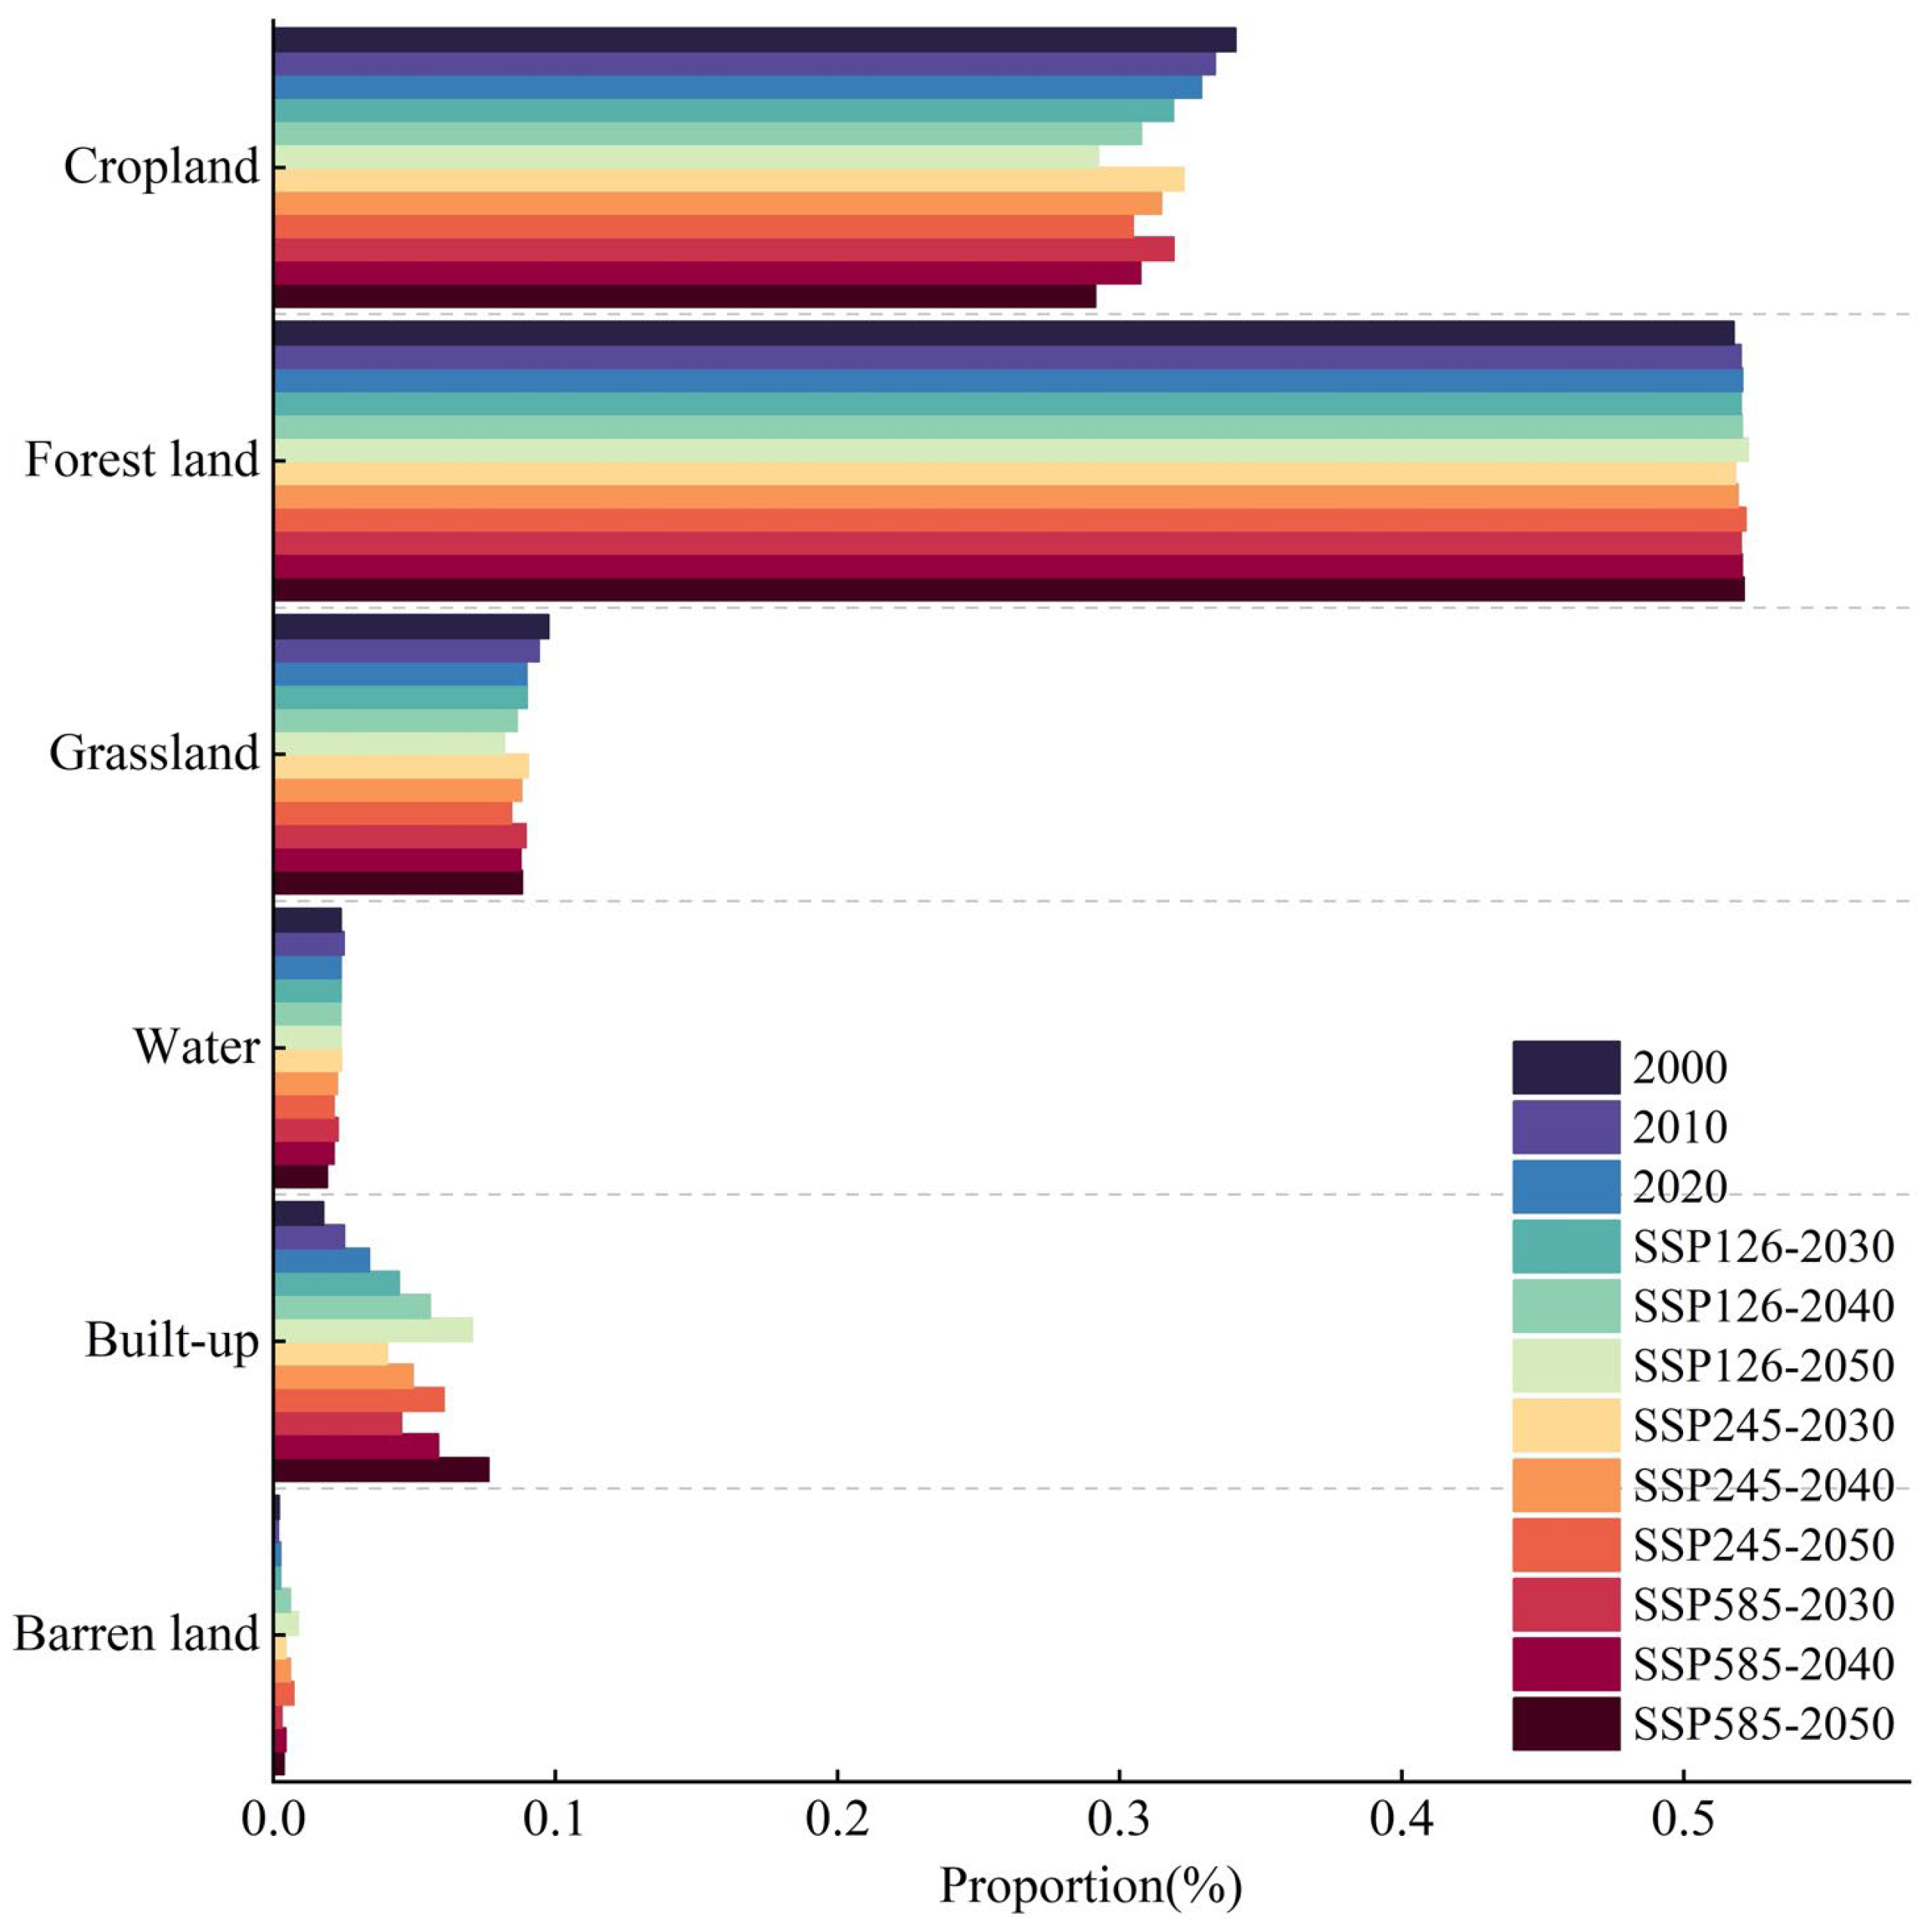
From 2000 to 2020, the predominant LUT in the YREB were forest land, which comprised an average of 51.96%, and cropland, accounting for an average of 33.46% (
Figure 4). Grassland constituted an average of 9.38%. In contrast, water (average proportion of 2.43%) and built-up land (average proportion of 2.56%) occupied relatively minor areas, while barren land represented the smallest fraction, averaging 0.21%. Notably, the areas designated as cropland and grassland experienced continuous declines, with proportion changes of -1.21% and -0.78%, respectively. Conversely, forest land and built-up land exhibited consistent growth, with proportion changes of 0.31% and 1.63%, respectively. Furthermore, both water (proportion change of 0.01%) and barren land (proportion change of 0.04%) showed a dynamic increase.
This study examines the land-use structure under three scenarios, revealing a continuity with patterns observed between 2000 and 2020 (
Figure 4). In the SSP126 scenario, both 2030 and 2050 demonstrate significant reductions in cropland (with a proportion change of -2.66%) and grassland (with a proportion change of -0.81%). Conversely, built-up land experiences a notable increase (with a proportion change of 2.59%). Furthermore, there are slight increases in forest land (with a proportion change of 0.25%), water (with a proportion change of 0.01%), and barren land (with a proportion change of 0.62%). In the SSP245 scenario for the same years, cropland (proportion change of -1.80%), grassland (proportion change of -0.60%), and water (proportion change of -0.27%) continue their downward trend. In contrast, forest land (proportion change of 0.38%), built-up land (proportion change of 2.01%), and barren land (proportion change of 0.27%) exhibit ongoing growth, with built-up land reflecting the most pronounced increase. Under the SSP585 scenario, the years 2030 and 2050 reveal the most significant changes in cropland (proportion change of -2.77%) and built-up land (proportion change of 3.10%). Additionally, grassland (proportion change of -0.14%) and water (proportion change of -0.38%) show declines, while forest land (proportion change of 0.10%) and barren land (proportion change of 0.09%) demonstrate slight increases.
4.1.3. Transfer of LUT
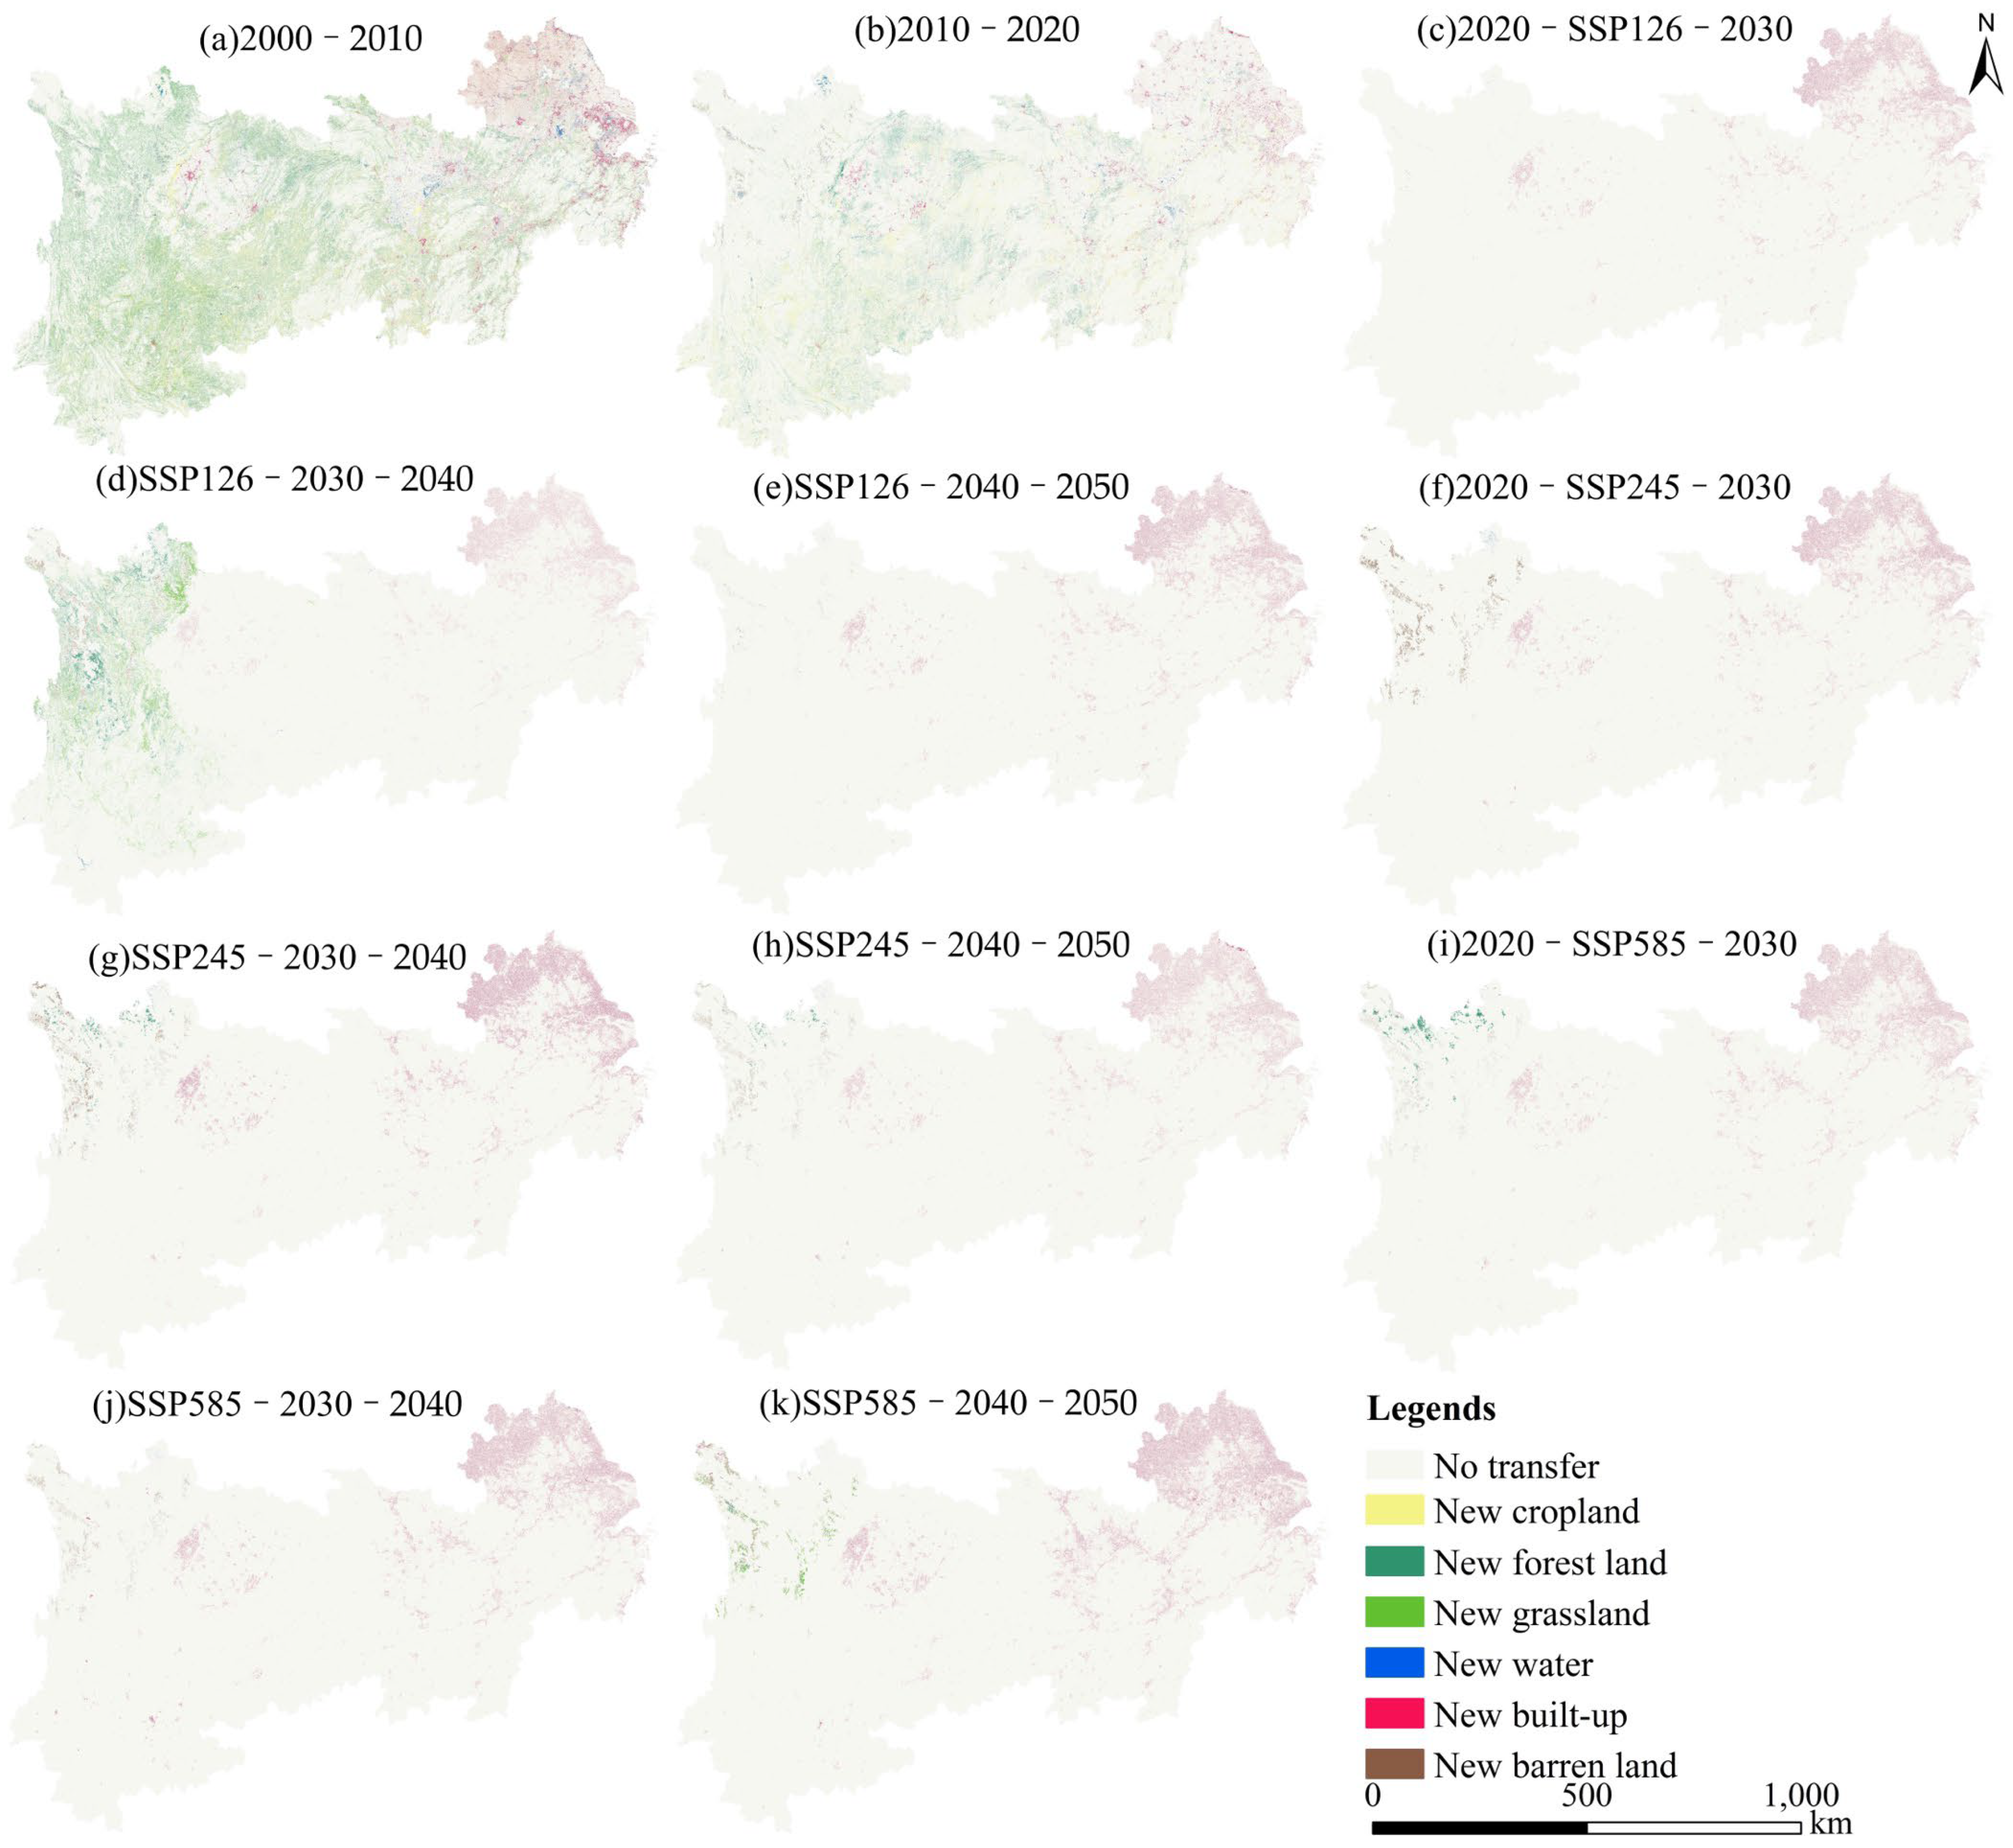
To improve the understanding of the relationships between different LUC, a quantitative assessment was conducted to analysis the spatial distribution patterns of land-use transitions under three scenarios from 2000 to 2050 (
Figure 5). The specific transition periods are categorized as follows: 2000-2010, 2010-2020, 2020-2030, 2030-2040, and 2040-2050. This analysis elucidates the transition characteristics of different LUT, thereby revealing the patterns of land-use evolution within the YREB.
In terms of spatial distribution, the characteristics of land-use transitions from 2000 to 2010 were marked by a predominant increase in built-up land in the east, accompanied by an expansion of forest land and grassland in the south. This transition was primarily driven by the conversion of cropland, forest land, and grassland. In the subsequent period from 2010 to 2020, built-up land in the east continued to dominate, while the distribution of forest land and grassland systems became increasingly dispersed. From 2020 to 2050, as indicated by the scenarios SSP126, SSP245, and SSP585, land-use transitions were characterized by a further increase in built-up land in the east, with only minor changes observed in other land types. Notably, during the period from 2030 (SSP126) to 2040 (SSP126), there was not only a significant increase in built-up land in the east but also substantial expansions of grassland and forest land in the west.
From 2000 to 2010, the cropland transferred to forest land was approximately equal to the forest land transferred back to cropland. In contrast, the cropland transferred to built-up land significantly exceeded the built-up land transferred back to cropland. Furthermore, the grassland transferred to forest land was greater than the forest land transferred to grassland, and the water transferred to cropland also surpassed the cropland transferred to water. The primary change in built-up land during this period was attributed to conversions from other land-uses, whereas barren land exhibited only minor fluctuations. The characteristics of land-use transitions from 2000 to 2010 were consistent with the overarching transition patterns of the period; however, the transition areas among cropland, forest land, grassland, and water remained relatively small, while the built-up land conversion showed a notable increase. Looking ahead to the period from 2020 to 2030 (for scenarios SSP126, SSP245, and SSP585), cropland, forest land, grassland, and barren land were primarily transferred to built-up land, with other land types remaining largely stable (
Figure 5). Similarly, during the subsequent periods from 2030 to 2040 and from 2040 to 2050 under the same scenarios, the patterns of land-use transition continued to be fundamentally consistent with those observed from 2020 to 2030, reflecting a predominant trend of converting other land types into built-up land.
4.2. Spatiotemporal Evolution Characteristics of HQ
4.2.1. Distribution Pattern Evolution of HQ
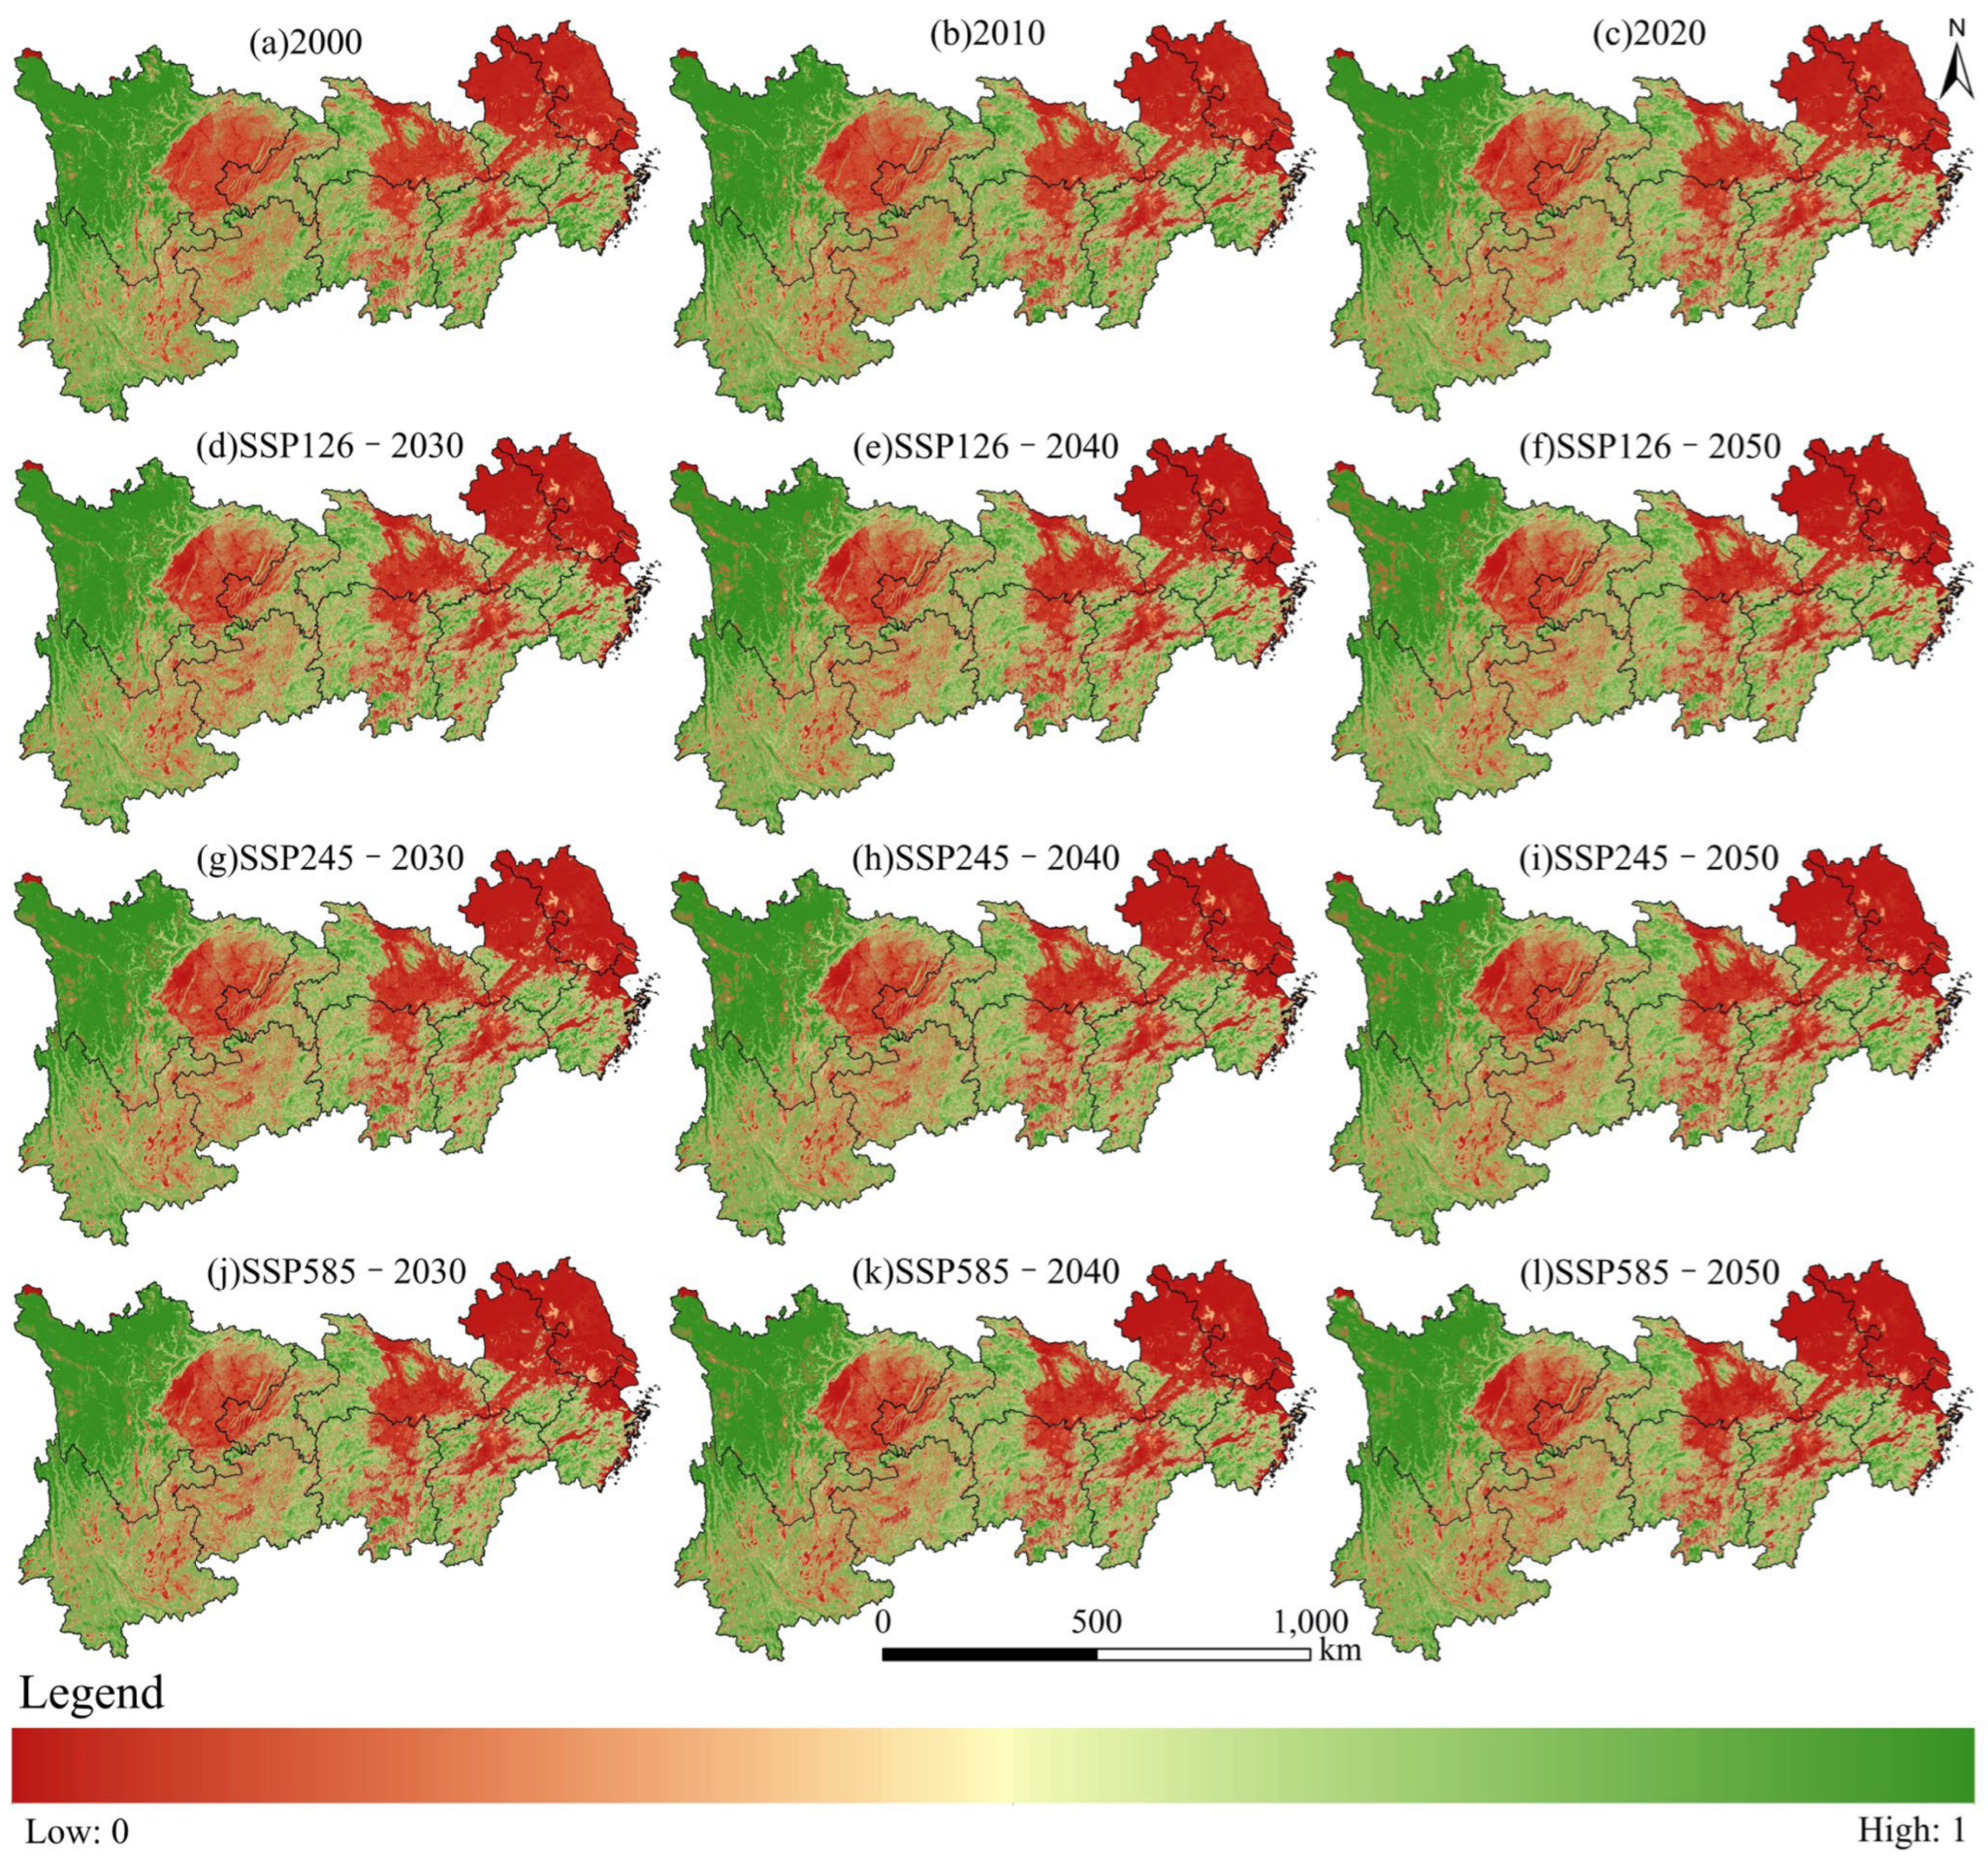
The multi-scenario analysis (SSP126, SSP245, SSP585) conducted from 2000 to 2050 reveals a spatial distribution of HQ within the YREB that increases from the northeast to the northwest (
Figure 6). Specifically, the provinces of Jiangsu and Anhui exhibit lower HQ, while Hubei, Hunan, and Jiangxi display moderately low levels. In contrast, the surrounding regions generally present relatively high HQ. Similarly, the eastern region of Sichuan and the Chongqing area are characterized by lower HQ, whereas western Sichuan demonstrates higher quality, with Yunnan and Guizhou reflecting intermediate levels.
Overall, the analysis indicates a persistent downward trend in HQ from 2000 to 2050 across all scenarios. Notably, HQ was highest in 2000, with a mean value of 0.770, which subsequently declined to 0.752 by 2020, reflecting a decrease of 2.34% over this period. From 2030 to 2050, the mean HQ continues to decline across all scenarios, with the lowest mean value recorded in 2025 (SSP585) at 0.726. Specifically, during the period from 2030 to 2050, HQ is projected to decrease by 2.28% under SSP126, by 1.74% under SSP245, and by 2.55% under SSP585.
4.2.2. Structural Changes of HQ
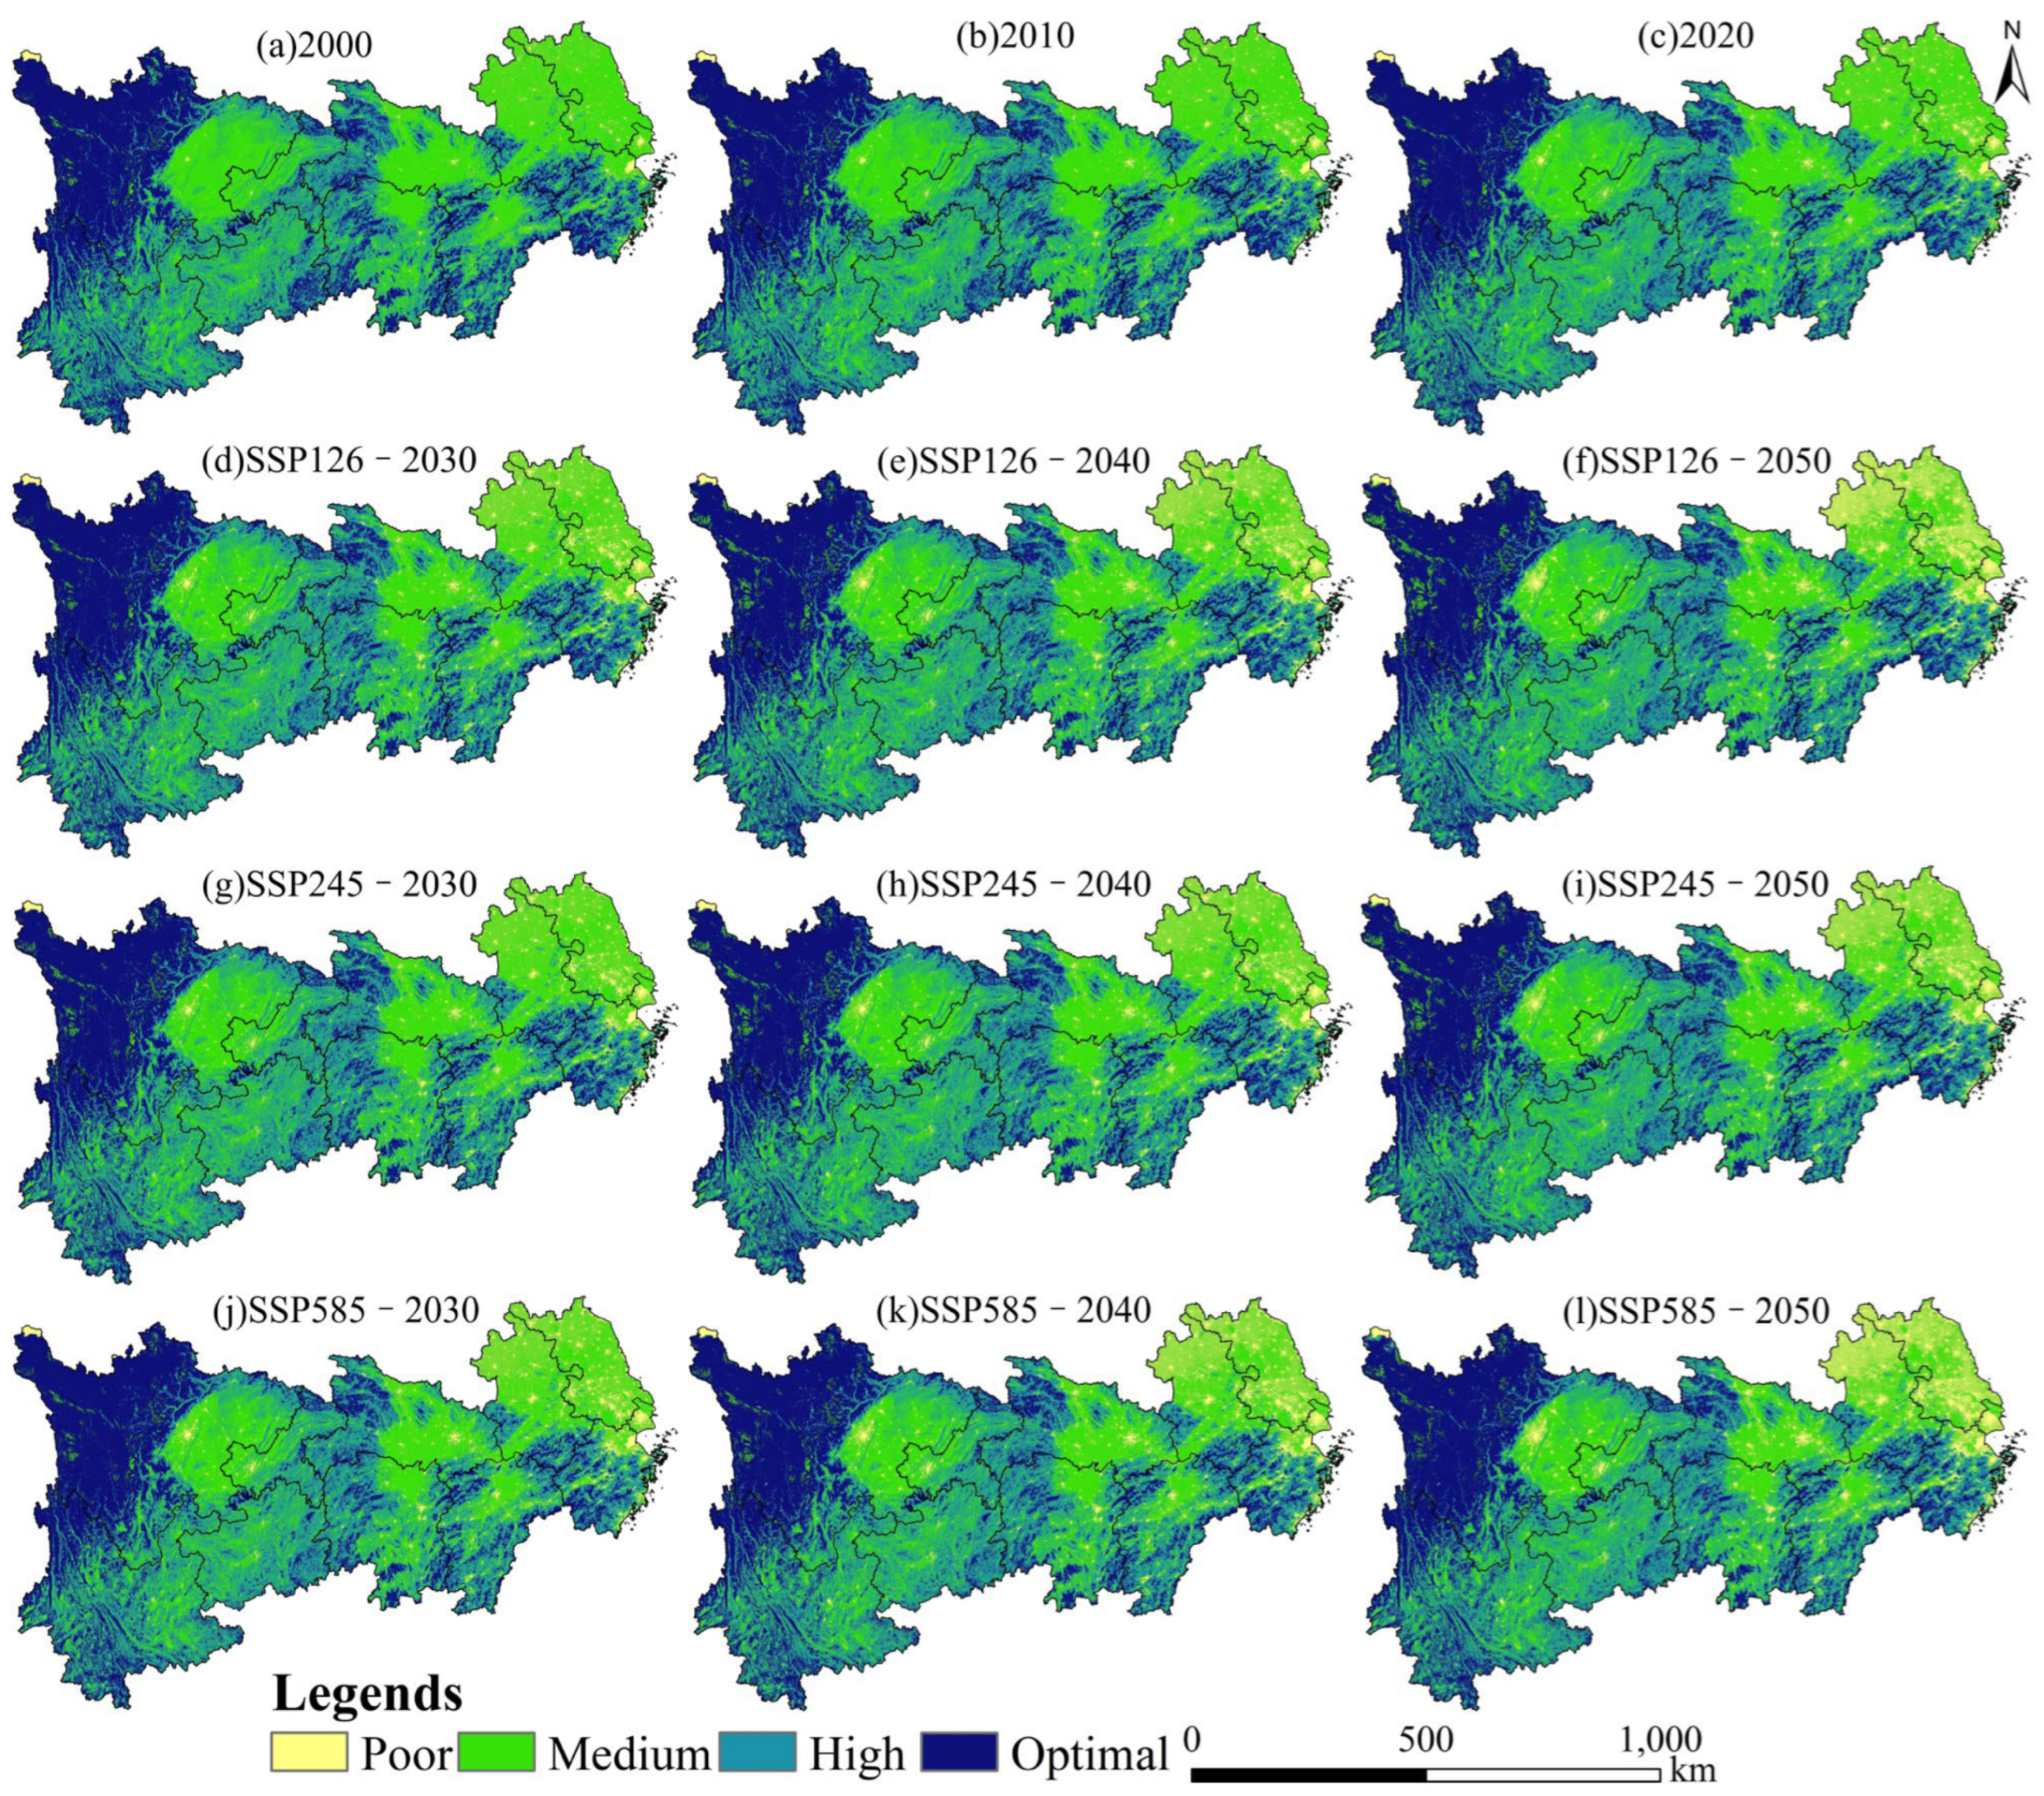
From 2000 to 2050, the HQ classification structure of the YREB shows a spatial distribution trend that gradually improves from east-west (
Figure 7). Specifically, from 2000 to 2020, the HQ in the eastern region was poor (average proportion 2.896%), the central region had medium HQ (average proportion 36.389%), the southern region had relatively high HQ (average proportion 33.778%), and the western region exhibited the optimal HQ (average proportion 26.937%).
During this period, the changes in HQ classifications manifested as a continuous increase in areas of poor HQ (proportion 1.624%) and high HQ (proportion 1.349%), while the medium HQ (proportion -1.21%) and optimal HQ (proportion -1.762%) continued to decrease. For the forecast period from 2030 to 2050, the HQ structure under the three development pathways (SSP126, SSP245, SSP585) remains largely consistent with that from 2000 to 2020.
In detail, during the years 2030 and 2050 under SSP126, the proportion of poor HQ (proportion 2.584%) continues to increase, the proportion of high HQ (proportion 0.077%) slightly rises, while the moderate HQ (proportion -2.041%) and optimal HQ (proportion -0.62%) continue to decline. During the periods 2030-2050 under both SSP245 and SSP585, the trends in HQ structural changes are consistent with those observed under SSP126. Among them, the reduction in medium HQ during the SSP245 period (proportion -1.804%) is the smallest, while the changes in poor HQ (proportion 3.087%) and medium HQ (proportion -3.068%) during the SSP585 period are the most pronounced.
4.2.3. Evolutionary Characteristics of HD
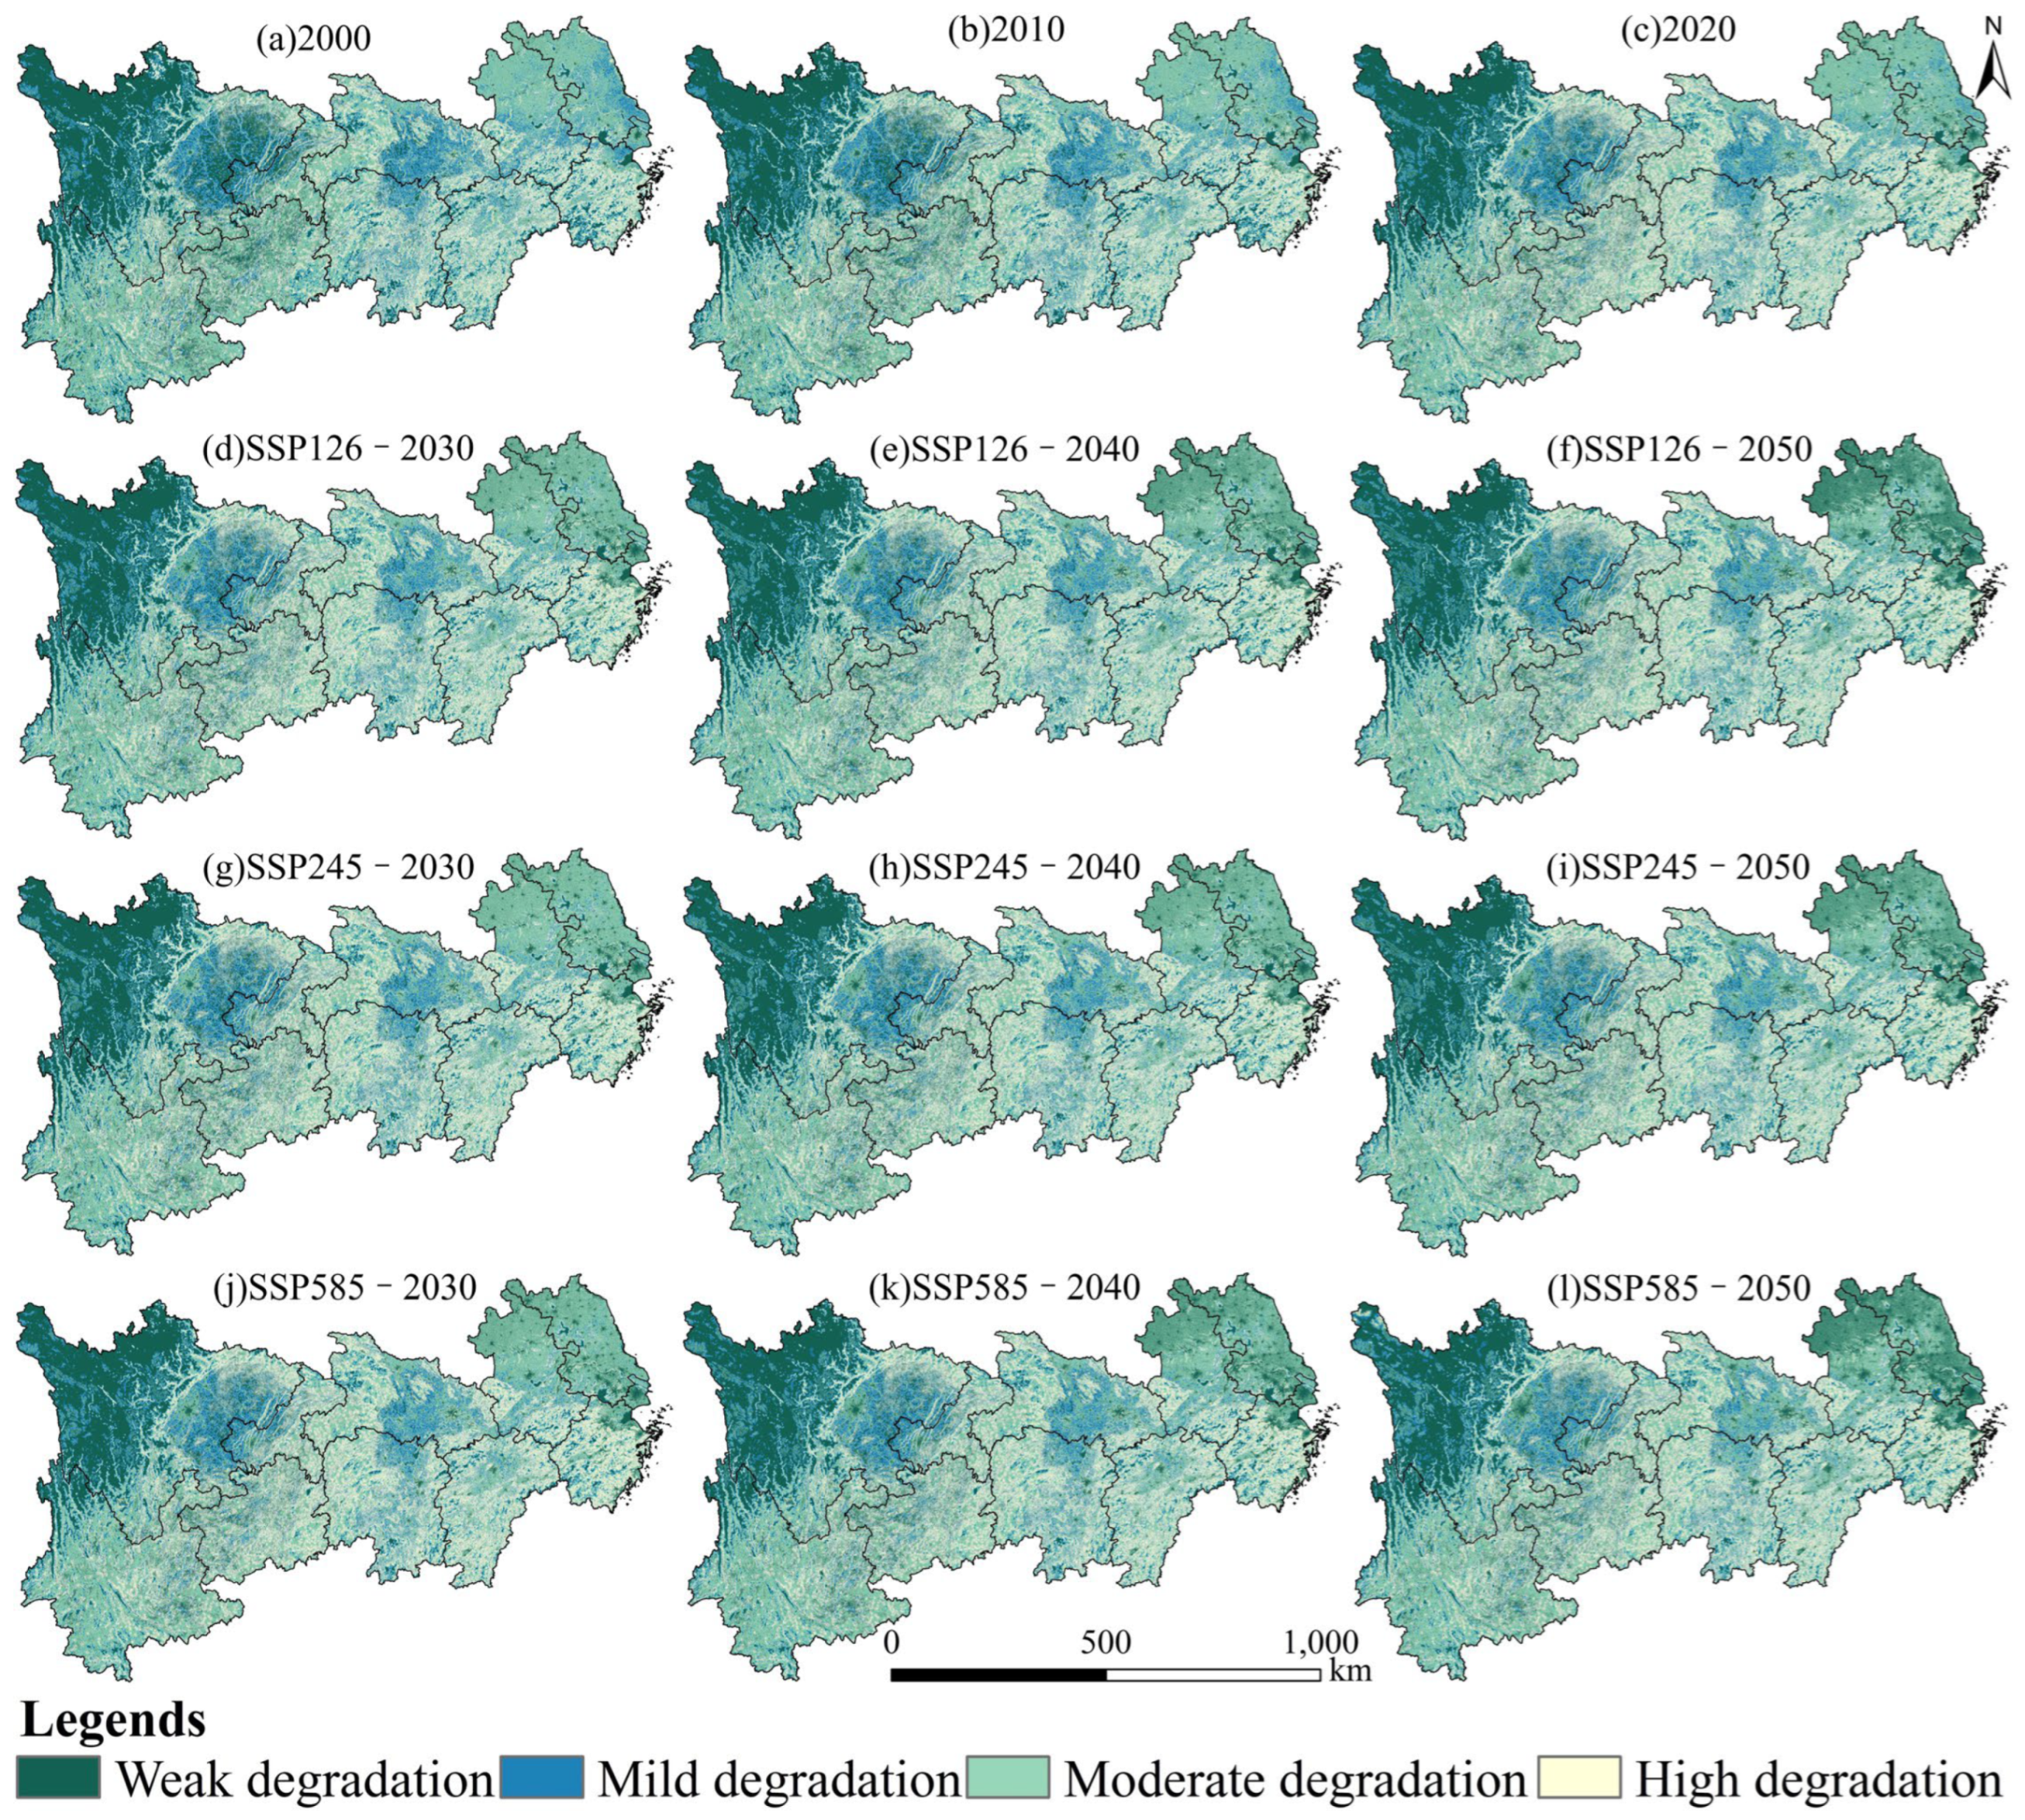
In the multi-scenario analysis conducted from 2000 to 2050, the overarching trend of HD reveals a pronounced gradient, intensifying from west to east (
Figure 8). Specifically, areas characterized by weak HD are predominantly situated in the northwestern section of the YREB, while the eastern and central regions of Sichuan demonstrate relatively weak HD. The eastern region exhibits moderate HD, whereas the southern and northern regions manifest higher degrees of HD, with these areas displaying an interwoven distribution pattern relative to those experiencing moderate HD.
Regarding the average characteristics of HD over the period from 2000 to 2050, a consistent increase in HD levels is observed between 2000 and 2020, culminating in a total rise of 5.54%. Across the various scenarios assessed, the most significant HD is projected under SSP126 (2030), accounting for 25.75% of the total area affected, closely followed by SSP585 (2030) at 25.57%. Conversely, the weak HD is anticipated under SSP126 (2050), representing 24.99%.
In terms of HD categories from 2000 to 2020, moderate HD emerges as the predominant classification, comprising 34.91% of the YREB. This is succeeded by weak HD at 23.25%, while the proportions of high (21.59%) and mild HD (20.25%) are notably smaller. During this interval, the area classified as experiencing high HD has steadily increased, now representing 6.02%, whereas the areas categorized as weak, mild, and moderate HD have seen respective reductions of -2.12%, -1.97%, and -1.94%.
The structural characteristics of HD projected for the period from 2030 to 2050 across multiple scenarios demonstrate a substantial degree of spatial consistency with those identified during the years 2000 to 2020, primarily indicating a prevalence of moderate HD. In both the SSP126 and SSP585 scenarios for 2030-2050, there is an observed increase in the proportions of weak and high HD, while the proportions of mild and moderate HD exhibit a corresponding decrease. Conversely, in the SSP245 scenario for the same period, the proportion of weak HD is found to increase, whereas the proportions of mild, moderate, and high HD decline. Notably, during the SSP126 phase, the most significant increase in weak HD is recorded, with a change of 1.90%, while moderate HD experiences the most pronounced decrease, amounting to -2.53%. Similarly, in the SSP585 phase, the most considerable reduction in mild HD is documented, reflecting a change of -1.16%.
4.3. Evolution of HQ with LUC
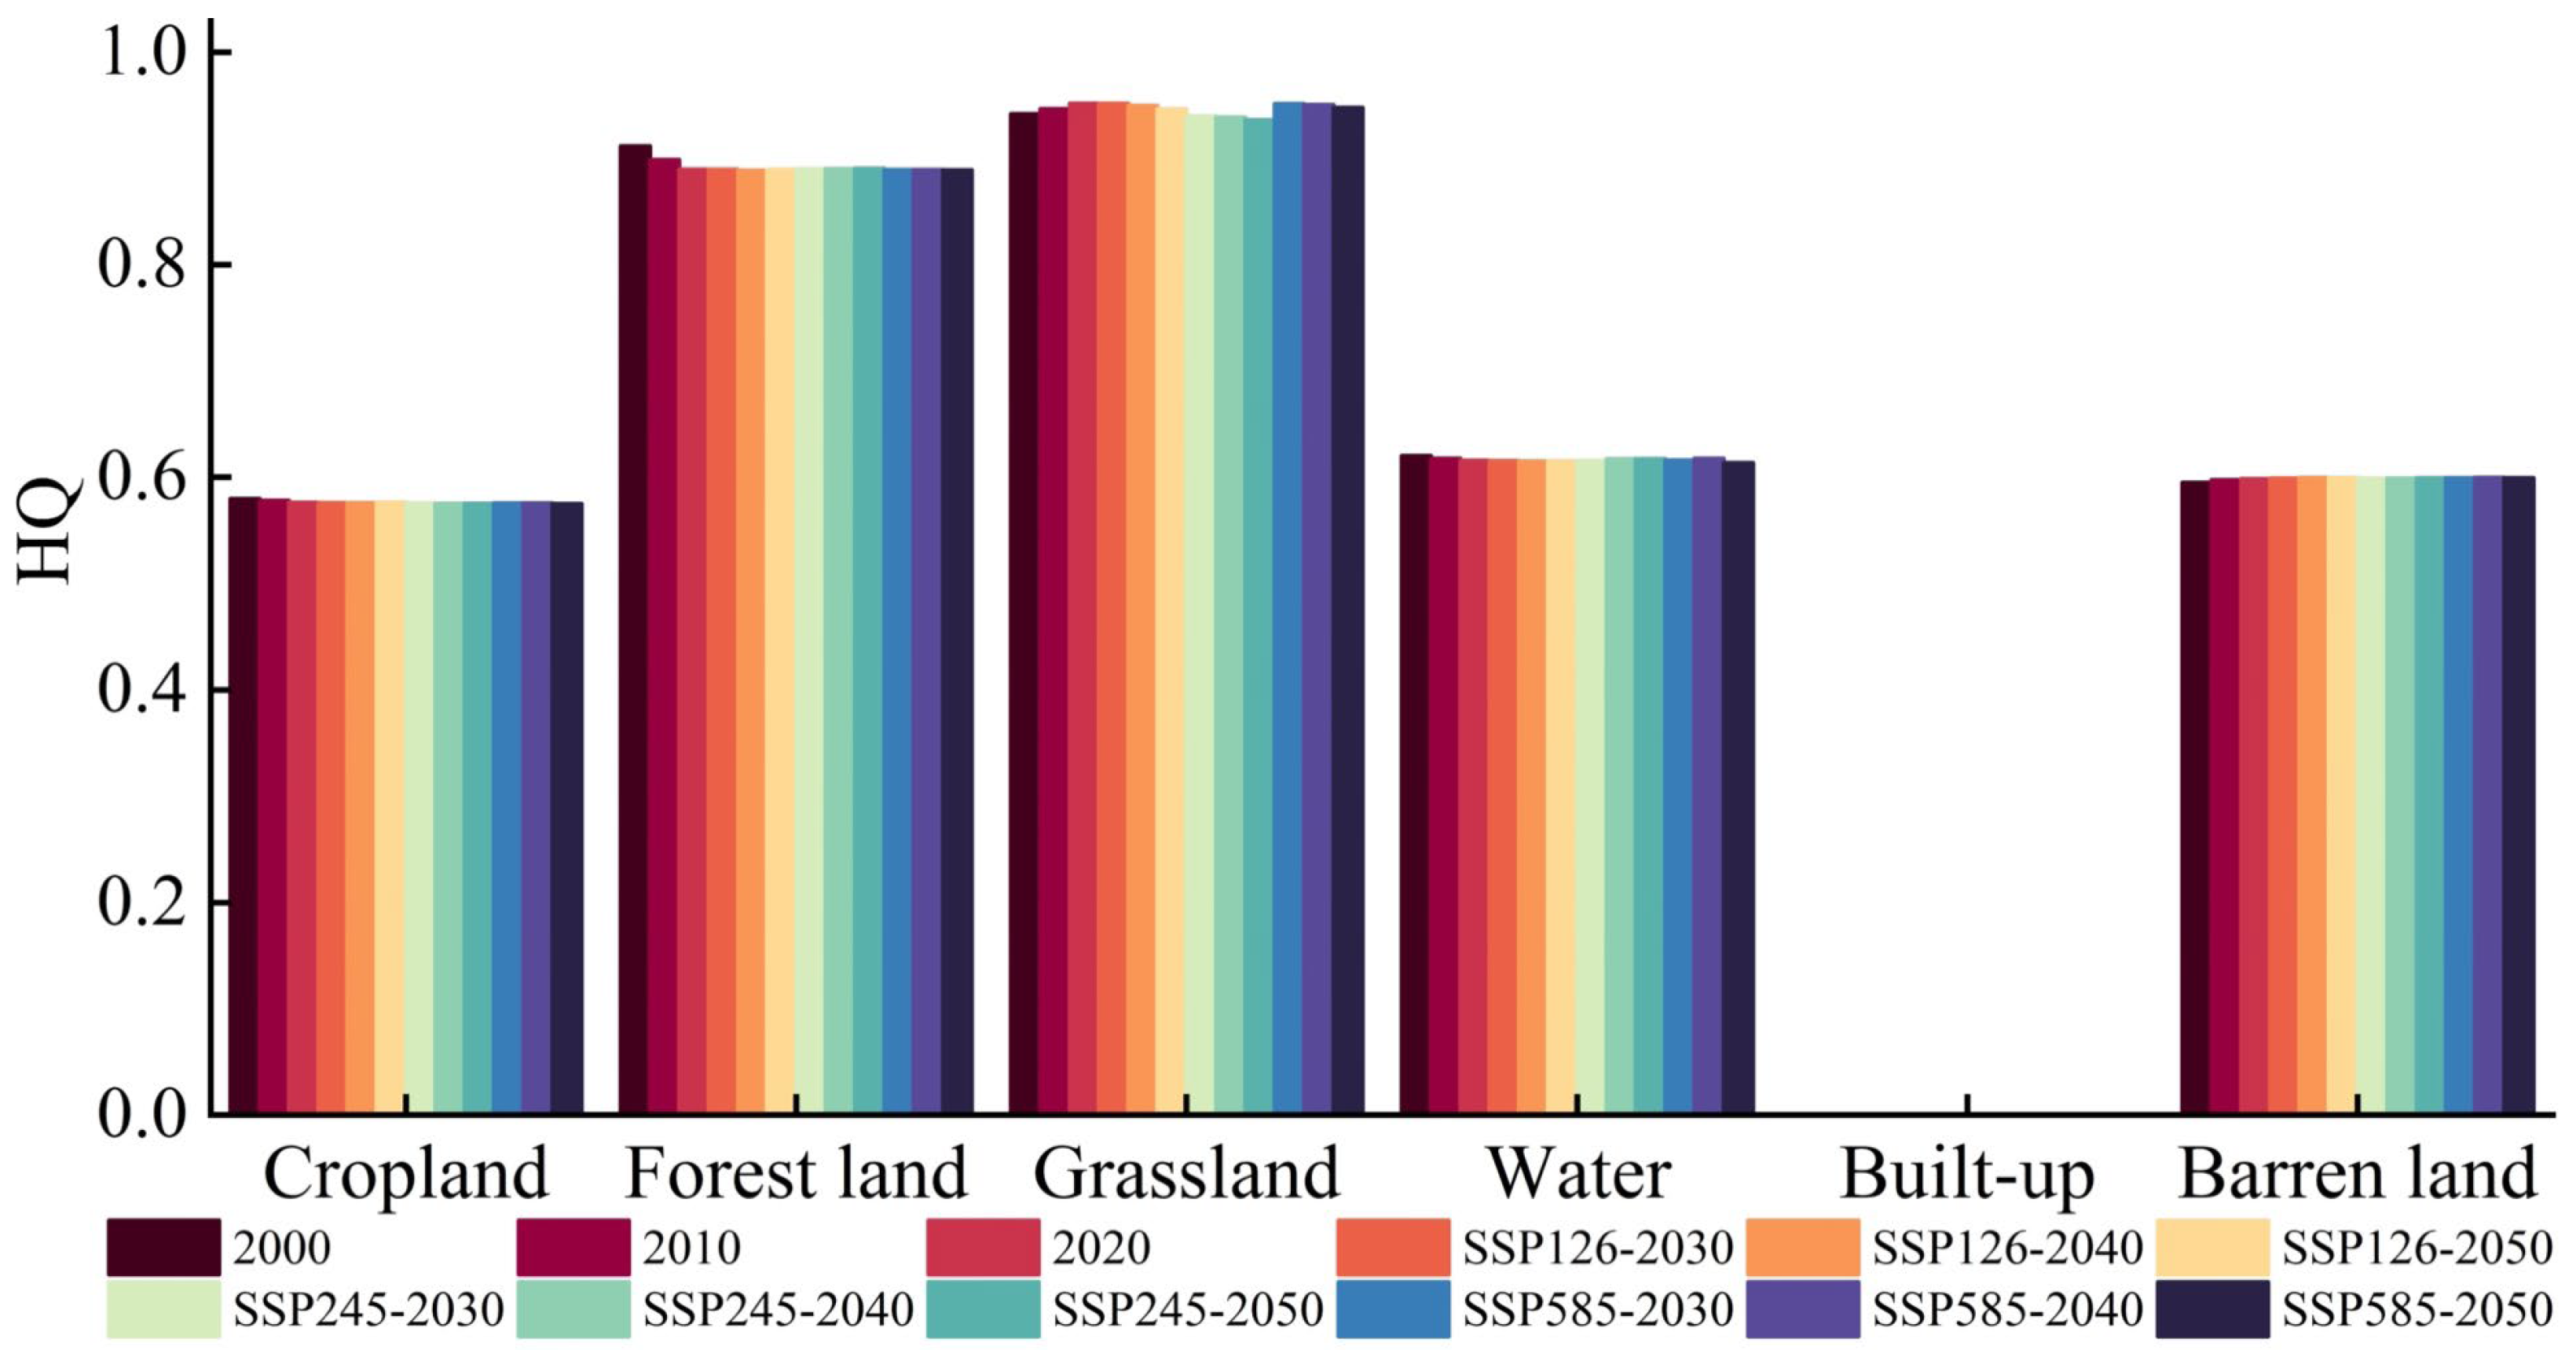
4.3.1. Impact of Different LUT on HQ
To elucidate the impact of various LUT on HQ changes, we conducted a quantitative assessment of HQ associated with each land-use category (
Figure 9). From 2000 to 2050, the characteristics of HQ changes across different LUT exhibited a high degree of consistency. The overall ranking of HQ was established as follows: grassland > forest land > water > barren land > cropland > built-up land. The average HQ values for each LUT were: cropland (0.576), forest land (0.893), grassland (0.947), water (0.617), built-up land (0), and barren land (0.599).
During this timeframe, HQ for cropland, forest land, and water was observed to be highest in 2000, whereas HQ for grasslands peaked in 2020. By 2050 (SSP126), a notable increase in HQ for barren land was documented. Throughout the period from 2030 to 2050, the HQ of cropland and forest land remained stable, with a balanced transition observed between the two categories. Additionally, in the 2030-2050 period (SSP585), both grassland and forest land demonstrated the highest levels of HQ.
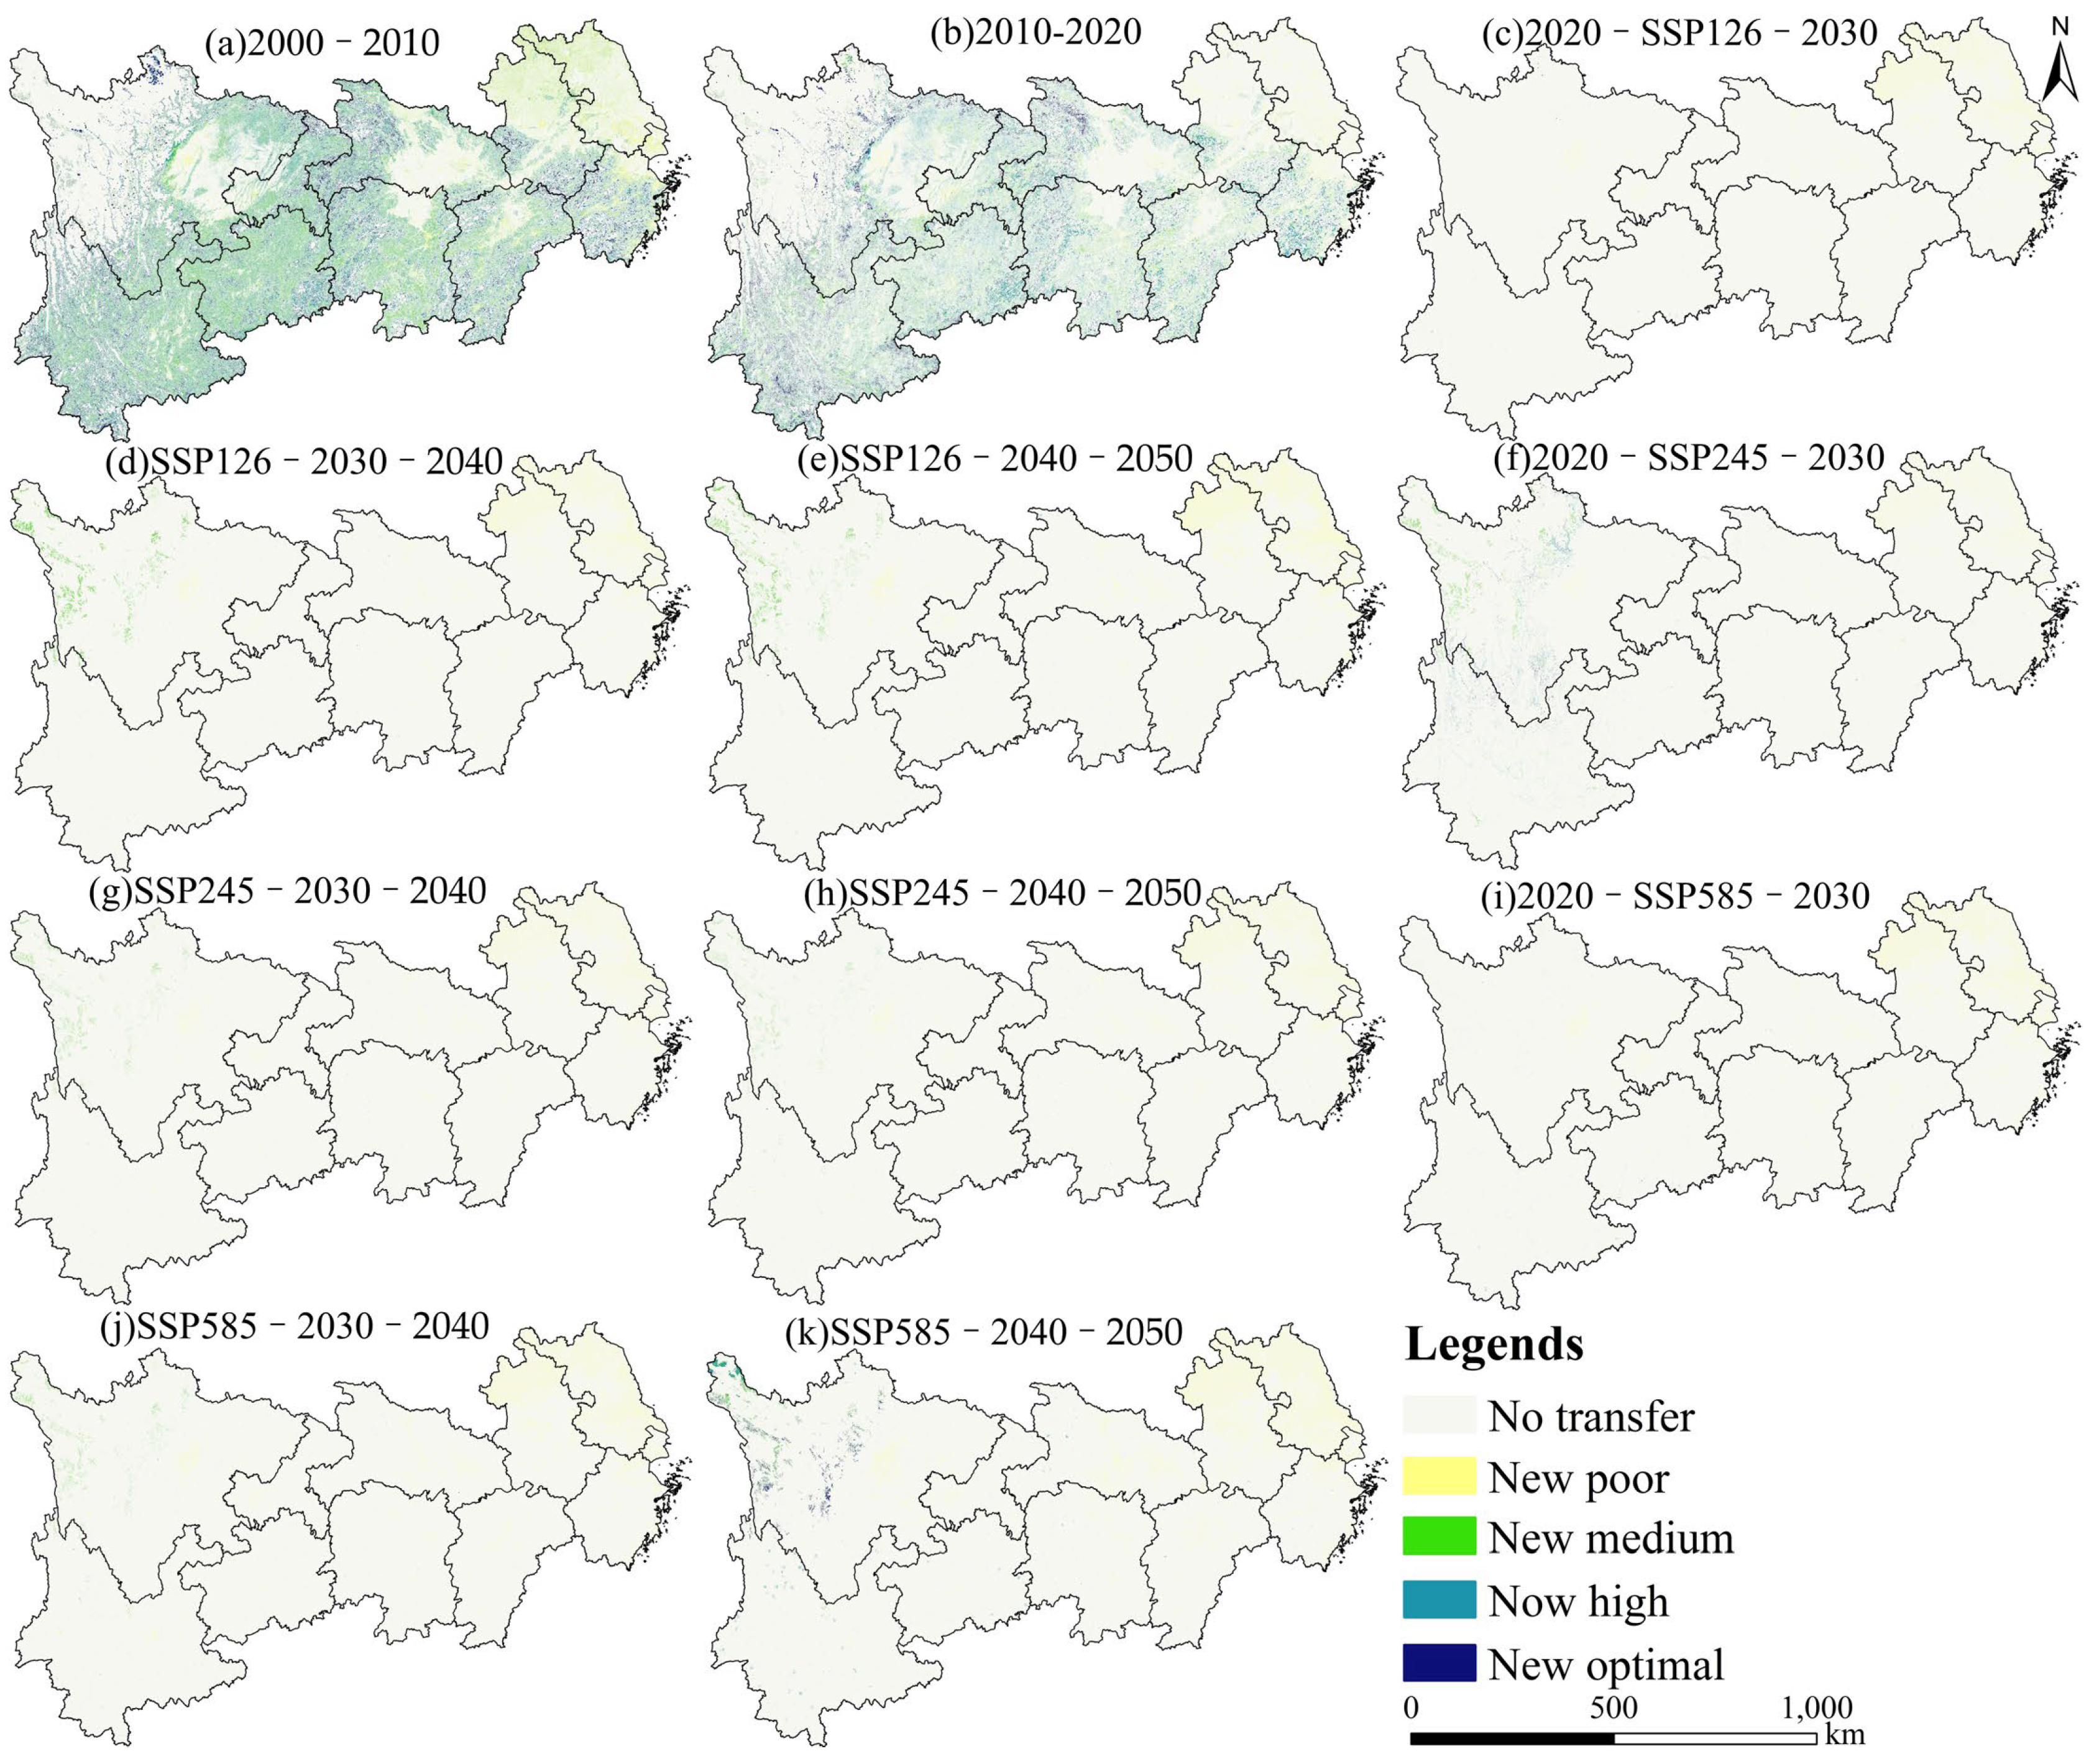
4.3.2. Transfer Analysis of HQ
To elucidate the relationships between changes in various HQ types, we undertook a quantitative assessment of the spatial distribution characteristics associated with HQ type transitions from 2000 to 2050 across multiple scenarios (
Figure 10). The temporal divisions for these transitions were specifically aligned with alterations in land-use structures. By analyzing the transition characteristics of different HQ types, we identified the evolving patterns of HQ within the YREB.
Regarding spatial distribution, the period from 2000 to 2010 revealed a notable increase in areas characterized by weak HQ in the eastern region. Simultaneously, there was an expansion in the areas classified as having medium and high HQ in the southern region, primarily driven by transitions toward medium HQ. The transition characteristics observed from 2010 to 2020 were largely consistent with those of the preceding decade, both reflecting a trend of higher HQ levels transitioning to lower ones. In the subsequent period from 2020 to 2050, the poor HQ in the eastern region continued to expand, while the medium and high HQ in the western region showed slight increases; other regions remained relatively stable.
From 2000 to 2010, the area exhibiting a transition from poor to medium HQ was significantly smaller than that reflecting the transition from medium to poor HQ. Furthermore, the areas involved in the transition from high to medium HQ were approximately equivalent to those associated with the transition from medium to high HQ. In contrast, the area corresponding to the transition from optimal to high HQ was substantially larger than that for the reverse transition from high to optimal. In the subsequent period from 2010 to 2020, the area transitioning from high to medium HQ remained consistent with that transitioning from medium to high HQ, while the area for the transition from optimal to high HQ continued to increase. During the period from 2020 to 2030, the predominant transition observed was from medium to poor HQ, followed closely by the transition from optimal to medium HQ. In the periods from 2030 to 2040 and from 2040 to 2050, the transition characteristics of HQ types closely mirrored those observed from 2020 to 2030, with the most significant transition occurring from medium to poor HQ between 2030 and 2040.
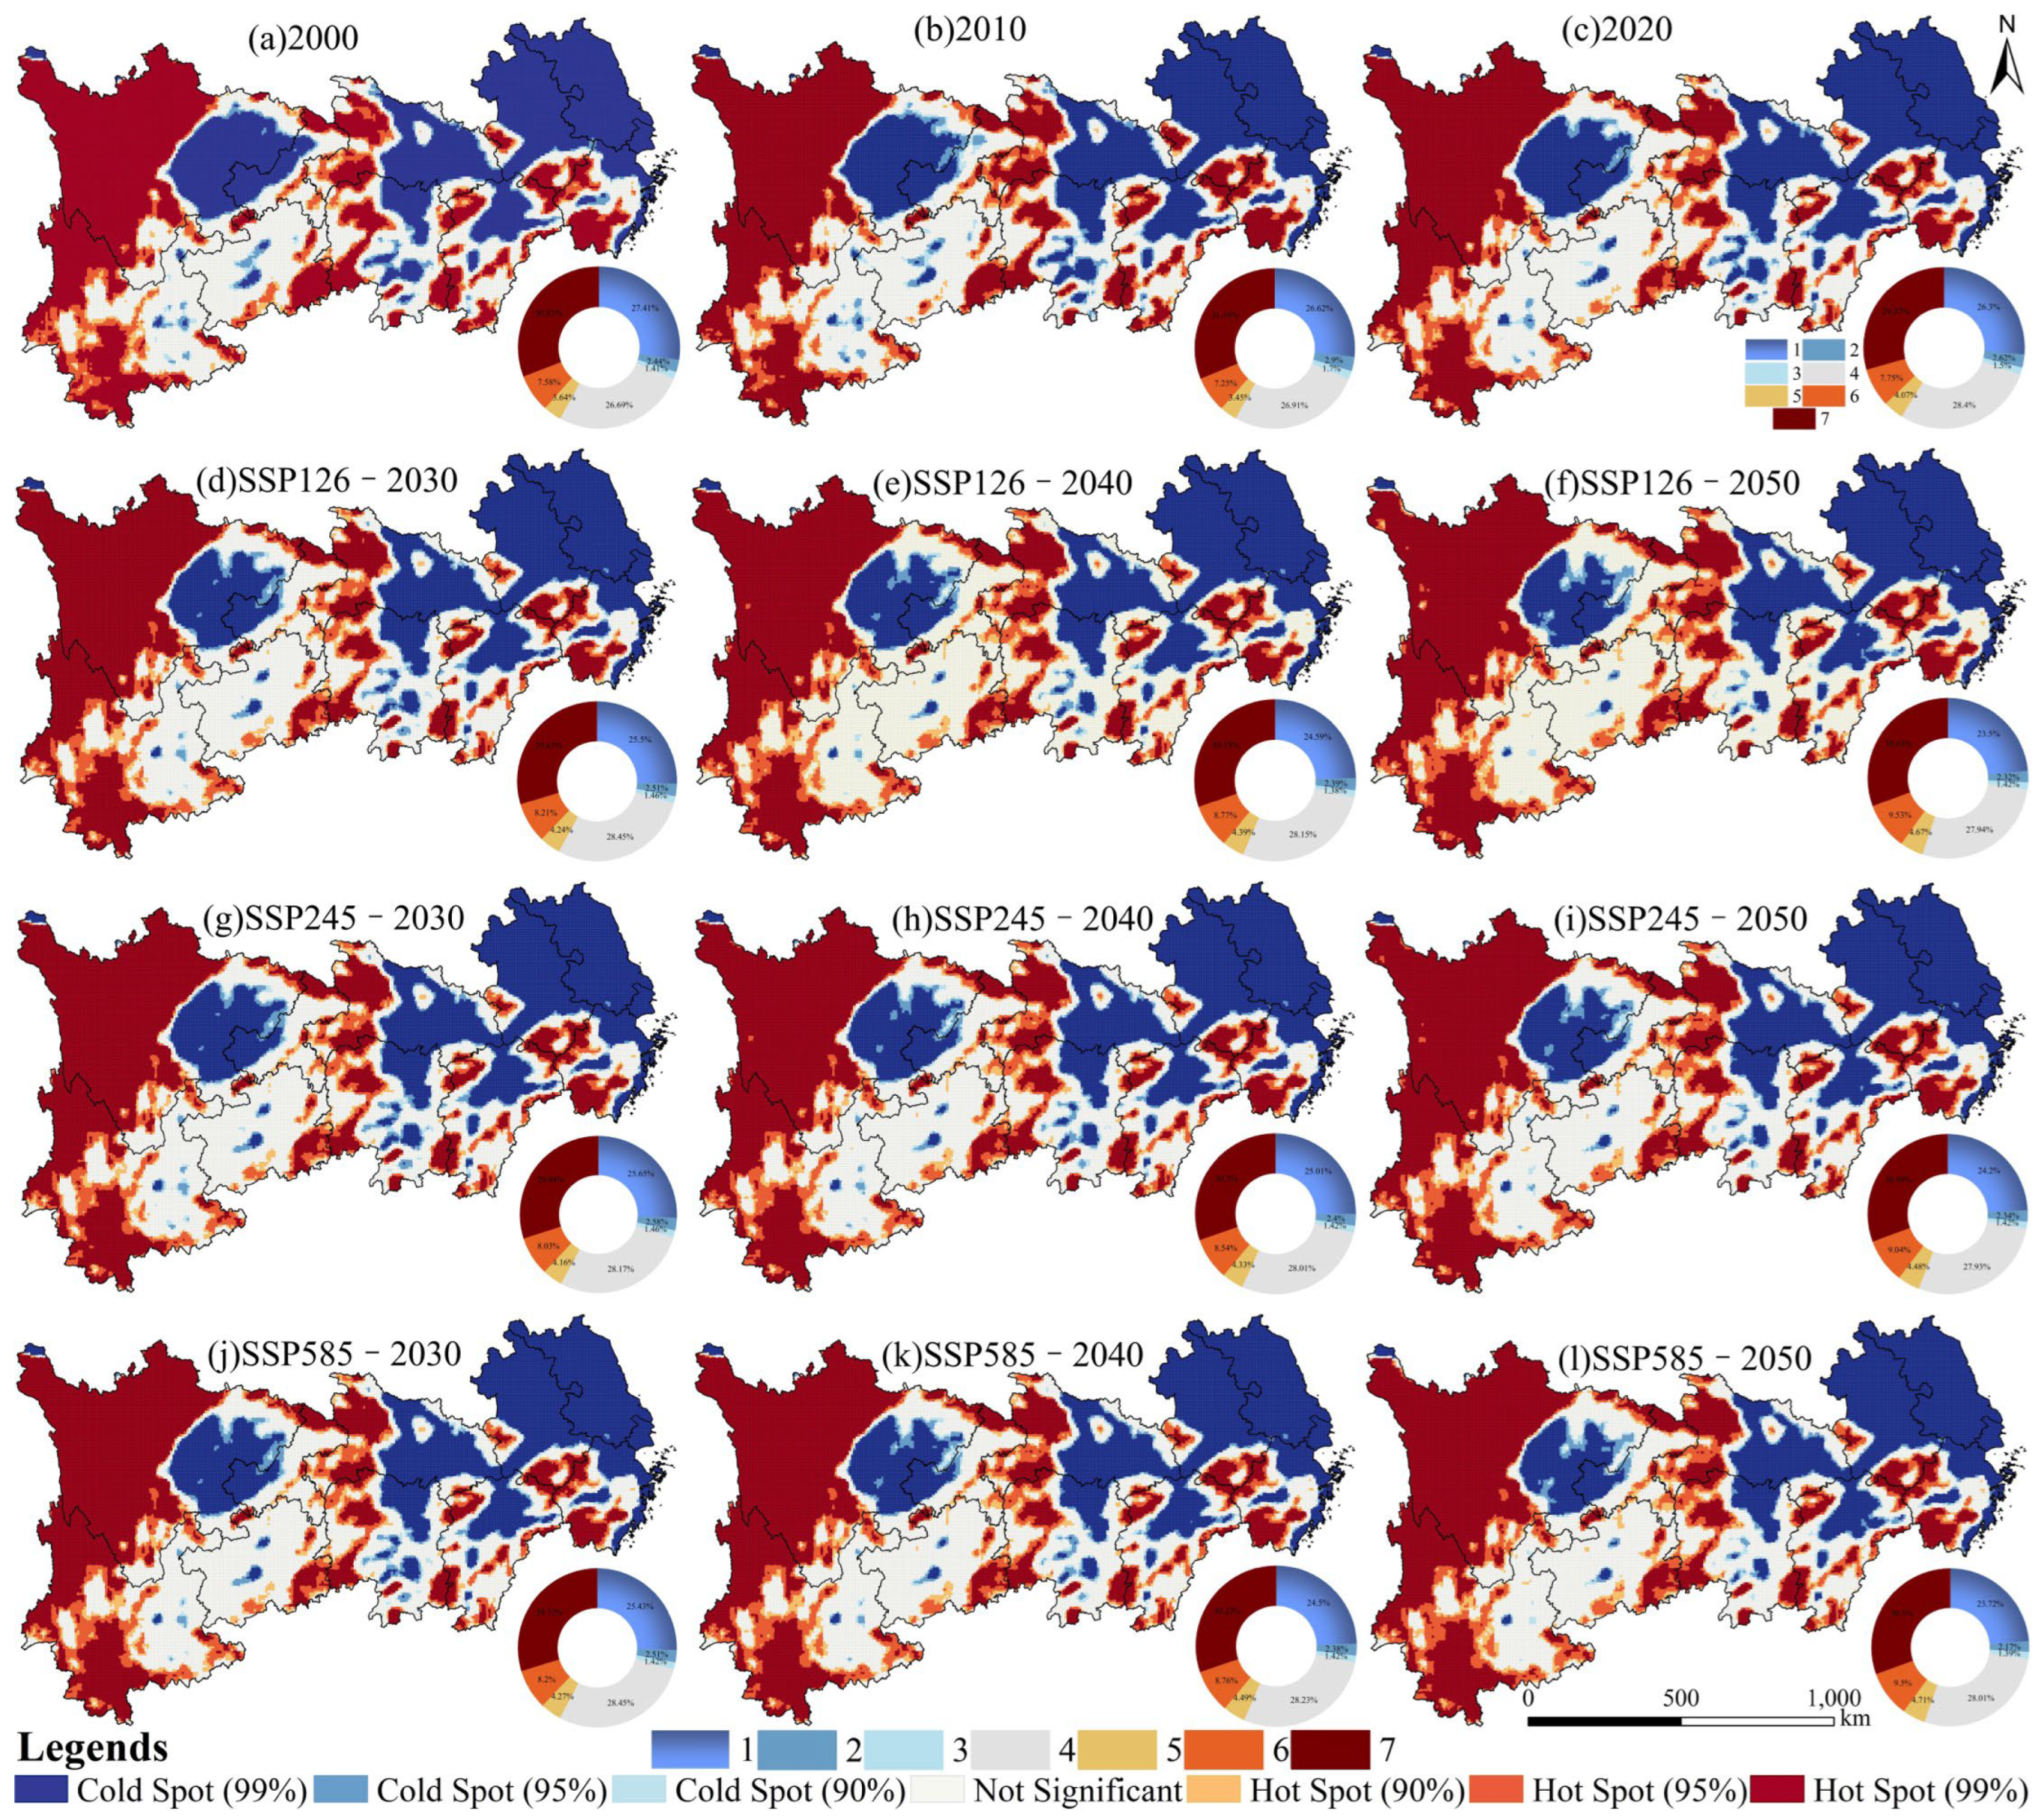
4.4. Hotspot Analysis of HQ
To elucidate the spatiotemporal distribution characteristics of HQ heterogeneity, we employed hotspot analysis to examine the spatiotemporal variations in HQ across multiple scenarios from 2000 to 2050 (
Figure 11). The analysis reveals a distinct distribution pattern, characterized by the presence of cold spots in the east, areas of negligible significance in the centre, and hot spots in the west. Furthermore, the south exhibits an alternating distribution of cold and hot spots, which is characterized by small, patchy dispersal patterns.
Specifically, in the eastern regions of Sichuan and Chongqing, the extent of cold spots shows a gradual decline over time. Projections indicate that by 2050 (SSP126, SSP245, SSP585), the area occupied by cold spots in this region will reach its minimum, reflecting a trend towards increasing fragmentation.
Between 2000 and 2050, the distribution of hotspots (>40%) constitutes a primary characteristic of the YREB, followed by cold spots (>30%), while the proportion of insignificant areas (<30%) remains the lowest. As time progresses, the area classified as hotspots (99%) exhibits a gradual decline, paralleled by a decreasing trend in cold spots (99%). Conversely, the insignificant zones show a consistent increase. Notably, under the SSP585 scenario for the period from 2030 to 2050, the hotspots (99%) begin to increase, while the cold spots (99%) continue to decline, and the insignificant zones further expands. This dynamic indicates that both cold and hotspot regions primarily undergo outward expansion or contraction based on their existing spatial distributions.
5. Discussion
5.1. Impact of LUC on HQ
The spatial distribution of HQ indices exhibits a high degree of correspondence with the spatial distribution of LUT [
44]. In the context of three distinct climatic scenarios projected for the future YREB, substantial alterations in HQ are anticipated, with the patterns of these changes closely associated with land-use transformations. Therefore, the accuracy of future HQ assessments will be contingent upon the precision of land-use simulations. This study demonstrates a high degree of simulation accuracy, with the predictive model developed being extensively applied in various contexts, including urban agglomerations [
38] and watersheds [
41]. The model has consistently exhibited superior simulation precision across these diverse regions. Furthermore, there has been an increase in regions experiencing HD, which coincides with the expansion of urban development, particularly in the economically advanced eastern areas [
46]. This expansion of built-up land has led to a significant reduction in cropland, which is identified as the primary driver of declining HQ. The HD is predominantly concentrated in regions characterized by high levels of urbanization and dense population clusters. This phenomenon is similarly evident within the Yellow River Basin [
41].
As a cornerstone of high-quality economic development in China, the YREB imposes significant pressures on the regional ecological environment throughout the processes of comprehensive urbanization-industrialization [
47,
48]. Within this context, land types exhibiting high habitat suitability—such as forest land, grassland, and water are increasingly being transformed into poor habitat suitability types, particularly built-up land, which results in a marked decline in HQ. Furthermore, the total population within the YREB constitutes over 40% of China’s, while its geographical area represents only 21.4% of the country’s total landmass. Accelerated urbanization has driven a substantial influx of people into urban centers, intensifying the demand for built-up land in both major urban districts and their surrounding counties [
49]. This phenomenon has not only facilitated the unplanned expansion of built-up land, encroaching upon cropland ecological spaces—such as forest land, grassland, and water—but has also led to severe disturbances and threats to the surrounding ecological environment, thereby contributing to the HD. This result aligns with the decline in ecosystem service functions associated with anticipated urban land expansion in the Yangtze River Delta urban agglomeration. Notably, it indicates that the rate of HD is occurring at an accelerated pace [
50]. Notably, regions of high HQ are predominantly located in the upstream areas of the YREB, particularly in Sichuan and Yunnan provinces. These areas, characterized by relatively high altitudes and abundant forest land and grassland resources, are less vulnerable to development pressures, resulting in comparatively minimal disturbances to their HQ [
51]. Our research findings are strongly corroborated by the analysis demonstrating that HQ in the upstream regions of the Yangtze River Basin is minimally affected by human activities. In contrast, the Sichuan Basin and western areas are identified as critical zones for HQ restoration [
29].
In contrast, the SSP245 scenario embodies a more gradual pace of sustainable development, characterized by a slowdown in economic growth and moderate rates of population increase and urbanization, which contribute to a continued decline in HQ. The social dynamics within this scenario evolve relatively rapidly, resulting in significant transformations in land-use patterns, particularly in the expansion of built-up land, which leads to a relative reduction in both cropland and forest land. In the western regions, only minimal increases in ecological land are anticipated, further exacerbating the decline in HQ. Conversely, the SSP585 scenario envisions a highly developed economy driven by energy-intensive growth that accelerates urban expansion. This growth results in a drastic reduction of ecological land and a disregard for ecological sustainability, culminating in severe HD. The escalating socioeconomic demands lead to substantial increases in built-up land, encroaching upon extensive areas of cropland. Furthermore, large-scale infrastructure development inflicts significant damage on the ecological lands surrounding urban centers, resulting in pronounced losses of grassland and water, thereby intensifying the decline in HQ. Consequently, in the pursuit of future social development, it is imperative to ensure high-quality economic growth while prioritizing the sustainability of ecological development.
5.2. Policy Implications
The transformation of land-use patterns is contributing to the significant loss of global biological habitats [
52]. In the downstream regions of the YREB, the dual pressures of rapid economic development and population concentration have resulted in severe ecological degradation, primarily due to large-scale infrastructure construction. This development has led to habitat fragmentation and a marked decline in biodiversity [
53,
54]. Furthermore, under various development scenarios, the rate of habitat loss continues to intensify. Consequently, to mitigate the adverse impacts on the ecological environment, it is imperative for planners and policymakers to acknowledge the habitat loss driven by LUC and its profound implications.
The coordination of socio-economic development, urban expansion, and ecological protection is of paramount importance. Among various land-use categories, ecological areas such as forest land, grassland, and water exhibit significantly higher HQ indices compared to built-up land, which registers the lowest indices. A detailed analysis of HD indicates that this HD is predominantly concentrated in the transition zones between cropland and forest land, where HQ progressively declines from higher to lower classifications. This phenomenon primarily results from the extensive encroachment of built-up land upon cropland. Over time, cropland is increasingly supplanting forests and other ecological land-uses, thereby exacerbating the negative impacts on HQ. Consequently, it is essential to adopt a comprehensive framework that integrates social, economic, and ecological considerations, employing a large-scale, dynamic, and spatially explicit assessment paradigm. Such an approach will facilitate a holistic perspective for the evaluation and decision-making processes regarding the ecological environment. To promote sustainable land management, it is essential to reduce incremental development, optimize existing resources, and enhance the efficiency of land resource allocation. Given that forest provide high HQ and possess extensive ecological connectivity, the delineation of ecological red lines is crucial to prevent large-scale deforestation associated with various construction projects. Firstly, in the Yangtze River Delta, where HQ is comparatively low, the strict implementation of land spatial ecological restoration initiatives is imperative to improve land-use efficiency. Secondly, in the central regions characterized by moderate HQ, it is vital to integrate the principles of ecological civilization into the development of a novel agricultural model that combines green productivity with landscape agriculture. Furthermore, the establishment of ecological parks along both banks of the Yangtze River is necessary to enhance HQ in urban peripheries. Finally, in the western and southern regions of the Yangtze Economic Belt, which exhibit high HQ, there is a critical need to strengthen the protection of natural forest ecosystems. Development activities in proximity to mountainous areas should be rigorously limited to preserve biodiversity, safeguard forest resources surrounding urban areas, and establish mountain-forest ecological functional zones. Special attention must be given to protecting scenic areas within these regions to mitigate HD resulting from overdevelopment.
In the future, the ecological environmental management of the YREB should prioritize three key objectives. Firstly, in the downstream YREB, it is imperative to establish a differentiated ecological redline management system, with particular emphasis on provincial capitals and other central cities. All development activities within the designated ecological redline must undergo stringent approval processes, and urban development boundaries should be restricted to mitigate land-use transfers and effectively safeguard ecological land-use. Second, addressing the ecological challenges arising from legacy mining sites necessitates the implementation of a protection and restoration strategy that prioritizes natural recovery, supplemented by controlled artificial interventions. This approach involves the continuous enhancement of vegetation coverage and net primary productivity to minimize human disturbances to natural ecosystems. Moreover, given the high intensity and scale of cropland reclamation, it is crucial to reform agricultural practices and promote the transition from conventional farming methods to ecologically sustainable agricultural systems. Finally, in the upstream regions of the YREB, which serve as vital ecological barrier zones and exhibit fragile ecosystems, it is essential to strengthen the development of the nature reserve system. This includes the establishment of ecological barriers and the construction of ecological corridors to maintain biodiversity networks and ensure ecological security.
5.3. Limitations and Uncertainties
This study integrates a top-down SD model with a bottom-up PLUS model, incorporating SSPs and RCPs scenarios to evaluate future trends in LUC from both socioeconomic and natural climate perspectives. Furthermore, the InVEST model is utilized to assess HQ across multiple scenarios from 2000 to 2050. Nevertheless, these models exhibit certain limitations. The SSP-RCP scenario data primarily focus on global and national levels, with relatively few studies addressing regional scales. To mitigate this issue, we have taken local development needs into account when establishing the SSP-RCP scenario parameters. Additionally, the InVEST model is frequently adjusted based on prior research, which introduces an element of subjectivity. Consequently, future studies should adopt a more rigorous approach to develop more accurate and reliable model parameters.
6. Conclusions
This study employs a coupled SD-PLUS model to simulate and predict land-use patterns in the YREB for the period from 2030 to 2050, based on scenarios that integrate SSP-RCP. In conjunction with the InVEST model, we conducted a comprehensive assessment of HQ across various scenarios from 2000 to 2050, elucidating the spatiotemporal dynamics of HQ and the associated degradation patterns. The results indicate a declining trend in HQ between 2000 and 2020, with a spatial distribution that demonstrates a gradient of increasing quality from east to west. HD is predominantly concentrated in agroforestry transition zones and urban, revealing a clustering pattern characterized by cold spots in the eastern region, negligible degradation in the centre, and hot spots in the west.
In the context of three future development scenarios projected for the period 2030–2050, HQ is expected to primarily shift from medium to poor, followed by a transition from high to medium. Specifically, in the SSP126, HQ is projected to decrease by 2.28%. In the SSP245, it is expected to decline by 1.74%; and in the SSP585, the decline is projected to be 2.55%. The pattern of HD remains largely consistent with the trends observed during the 2000–2020 period, with moderate HD being the dominant trend. Notably, the HQ of both cropland and forest land remains stable, and a balanced transition is evident between these land types. The YREB is characterized by the presence of hotspots (> 40%), followed by cold spots (> 30%), with areas exhibiting insignificant quality (< 30%) representing the smallest proportion. The distribution of these cold and hot spots is primarily driven by the expansion or contraction of existing regions.
Supplementary Materials
The following supporting information can be downloaded at the website of this paper posted on
Preprints.org.
Author Contributions
Conceptualization, B.D. and T.H.; methodology, B.D. and T.H; software, B.D.; validation, B.D., T.H. and T.T.; formal analysis, B.D.; investigation, B.D. and D.H; resources, B.D. and T.C.; data curation, B.D.; writing—original draft preparation, B.D.; writing—review and editing, B.D. and T.H.; visualization, B.D.; supervision, T.H. and T.T. All authors have read and agreed to the published version of the manuscript.
Funding
This study was funded by Major Project of Philosophy and Social Science Research in Hubei Higher Education Institutions (Grant No. 21ZD007).
Data Availability Statement
All relevant data sets in this study are described in the manuscript.
Acknowledgments
The authors would like to acknowledge all colleagues and friends who have voluntarily reviewed the translation of the survey and the manuscript of this study. The reviewers and editor are appreciated for their contributions to improve the manuscript.
Conflicts of Interest
The authors declare that the research was conducted in the absence of any commercial or financial relationships that could be construed as a potential conflict of interest.
References
- Tu, D.; Cai, Y.; Liu, M. Coupling coordination analysis and spatiotemporal heterogeneity between ecosystem services and new-type urbanization: A case study of the Yangtze River Economic Belt in China. Ecol Indic 2023, 154, 110535. [Google Scholar] [CrossRef]
- Zhao, J.; Yu, L.; Newbold, T.; Chen, X. Trends in habitat quality and habitat degradation in terrestrial protected areas. Conserv Biol 2024, e14348. [Google Scholar] [CrossRef] [PubMed]
- Palmer, E. Introduction: the 2030 agenda. Journal of Global Ethics 2015, 11, 262–269. [Google Scholar] [CrossRef]
- Kong, L.; Wu, T.; Xiao, Y.; Xu, W.; Zhang, X.; Daily, G.C.; Ouyang, Z. Natural capital investments in China undermined by reclamation for cropland. Nat Ecol Evol 2023, 7, 1771–1777. [Google Scholar] [CrossRef]
- Luan, W.; Li, X. Rapid urbanization and its driving mechanism in the Pan-Third Pole region. Sci Total Environ 2021, 750, 141270. [Google Scholar] [CrossRef]
- Luo, Q.; Zhou, J.; Zhang, Y.; Yu, B.; Zhu, Z. What is the spatiotemporal relationship between urbanization and ecosystem services? A case from 110 cities in the Yangtze River Economic Belt, China. J Environ Manage 2022, 321, 115709. [Google Scholar] [CrossRef]
- Haddad, N.M.; Brudvig, L.A.; Clobert, J.; Davies, K.F.; Gonzalez, A.; Holt, R.D.; Lovejoy, T.E.; Sexton, J.O.; Austin, M.P.; Collins, C.D. Habitat fragmentation and its lasting impact on Earth’s ecosystems. Sci Adv 2015, 1, e1500052. [Google Scholar] [CrossRef]
- Oliver, T.H.; Isaac, N.J.; August, T.A.; Woodcock, B.A.; Roy, D.B.; Bullock, J.M. Declining resilience of ecosystem functions under biodiversity loss. Nat Commun 2015, 6, 10122. [Google Scholar] [CrossRef]
- Li, G.; Fang, C.; Li, Y.; Wang, Z.; Sun, S.; He, S.; Qi, W.; Bao, C.; Ma, H.; Fan, Y. Global impacts of future urban expansion on terrestrial vertebrate diversity. Nat Commun 2022, 13, 1628. [Google Scholar] [CrossRef]
- O’Connor, B.; Bojinski, S.; Röösli, C.; Schaepman, M.E. Monitoring global changes in biodiversity and climate essential as ecological crisis intensifies. Ecol Inform 2020, 55, 101033. [Google Scholar] [CrossRef]
- Zhang, G.; Roslan, S.N.A.; Quan, L.; Yuan, P. Simulation of spatiotemporal patterns of habitat quality and driving mechanism in Anhui province, China. Front Env Sci-Switz 2023, 11, 1145626. [Google Scholar] [CrossRef]
- Hillard, E.M.; Nielsen, C.K.; Groninger, J.W. Swamp rabbits as indicators of wildlife habitat quality in bottomland hardwood forest ecosystems. Ecol Indic 2017, 79, 47–53. [Google Scholar] [CrossRef]
- Weber, D.; Schaepman-Strub, G.; Ecker, K. Predicting habitat quality of protected dry grasslands using Landsat NDVI phenology. Ecol Indic 2018, 91, 447–460. [Google Scholar] [CrossRef]
- Riedler, B.; Lang, S. A spatially explicit patch model of habitat quality, integrating spatio-structural indicators. Ecol Indic 2018, 94, 128–141. [Google Scholar] [CrossRef]
- Hall, L.S.; Krausman, P.R.; Morrison, M.L. The habitat concept and a plea for standard terminology. Wildlife Soc B 1997, 173–182. [Google Scholar]
- West, A.M.; Kumar, S.; Brown, C.S.; Stohlgren, T.J.; Bromberg, J. Field validation of an invasive species Maxent model. Ecol Inform 2016, 36, 126–134. [Google Scholar] [CrossRef]
- Dai, D.; Bo, M.; Ren, X.; Dai, K. Application and exploration of artificial intelligence technology in urban ecosystem-based disaster risk reduction: A scoping review. Ecol Indic 2024, 158, 111565. [Google Scholar] [CrossRef]
- Sherrouse, B.C.; Semmens, D.J.; Ancona, Z.H. Social Values for Ecosystem Services (SolVES): Open-source spatial modeling of cultural services. Environ Modell Softw 2022, 148, 105259. [Google Scholar] [CrossRef]
- Zhang, K.; Fang, B.; Zhang, Z.; Liu, T.; Liu, K. Exploring future ecosystem service changes and key contributing factors from a “past-future-action” perspective: A case study of the Yellow River Basin. Sci Total Environ 2024, 926, 171630. [Google Scholar] [CrossRef]
- Lin, Y.; Lin, W.; Wang, Y.; Lien, W.; Huang, T.; Hsu, C.; Schmeller, D.S.; Crossman, N.D. Systematically designating conservation areas for protecting habitat quality and multiple ecosystem services. Environ Modell Softw 2017, 90, 126–146. [Google Scholar] [CrossRef]
- Sallustio, L.; De Toni, A.; Strollo, A.; Di Febbraro, M.; Gissi, E.; Casella, L.; Geneletti, D.; Munafò, M.; Vizzarri, M.; Marchetti, M. Assessing habitat quality in relation to the spatial distribution of protected areas in Italy. J Environ Manage 2017, 201, 129–137. [Google Scholar] [CrossRef] [PubMed]
- Qin, X.; Yang, Q.; Wang, L. The evolution of habitat quality and its response to land use change in the coastal China, 1985–2020. Sci Total Environ 2024, 952, 175930. [Google Scholar] [CrossRef] [PubMed]
- Ren, Q.; He, C.; Huang, Q.; Shi, P.; Zhang, D.; Güneralp, B. Impacts of urban expansion on natural habitats in global drylands. Nat Sustain 2022, 5, 869–878. [Google Scholar] [CrossRef]
- Zheng, W.; Li, S.; Ke, X.; Li, X.; Zhang, B. The impacts of cropland balance policy on habitat quality in China: A multiscale administrative perspective. J Environ Manage 2022, 323, 116182. [Google Scholar] [CrossRef]
- Bai, L.; Xiu, C.; Feng, X.; Liu, D. Influence of urbanization on regional habitat quality: a case study of Changchun City. Habitat Int 2019, 93, 102042. [Google Scholar] [CrossRef]
- Wang, J.; Wu, Y.; Gou, A. Habitat quality evolution characteristics and multi-scenario prediction in Shenzhen based on PLUS and InVEST models. Front Env Sci-Switz 2023, 11, 1146347. [Google Scholar] [CrossRef]
- Gong, J.; Xie, Y.; Cao, E.; Huang, Q.; Li, H. Integration of InVEST-habitat quality model with landscape pattern indexes to assess mountain plant biodiversity change: A case study of Bailongjiang watershed in Gansu Province. J Geogr Sci 2019, 29, 1193–1210. [Google Scholar] [CrossRef]
- Li, X.; Zhang, X.; Feng, H.; Li, Y.; Yu, J.; Liu, Y.; Du, H. Dynamic evolution and simulation of habitat quality in arid regions: A case study of the Hexi region, China. Ecol Model 2024, 493, 110726. [Google Scholar] [CrossRef]
- Bian, C.; Yang, L.; Zhao, X.; Yao, X.; Xiao, L. The Impact of Human Activity Expansion on Habitat Quality in the Yangtze River Basin. Land-Basel 2024, 13, 908. [Google Scholar] [CrossRef]
- Brunner, L.; Pendergrass, A.G.; Lehner, F.; Merrifield, A.L.; Lorenz, R.; Knutti, R. Reduced global warming from CMIP6 projections when weighting models by performance and independence. Earth Syst Dynam 2020, 11, 995–1012. [Google Scholar] [CrossRef]
- Dong, N.; You, L.; Cai, W.; Li, G.; Lin, H. Land use projections in China under global socioeconomic and emission scenarios: Utilizing a scenario-based land-use change assessment framework. Global Environmental Change 2018, 50, 164–177. [Google Scholar] [CrossRef]
- Tian, L.; Tao, Y.; Fu, W.; Li, T.; Ren, F.; Li, M. Dynamic simulation of land use/cover change and assessment of forest ecosystem carbon storage under climate change scenarios in Guangdong Province, China. Remote Sens-Basel 2022, 14, 2330. [Google Scholar] [CrossRef]
- Lu, Z.; Li, W.; Yue, R. Investigation of the long-term supply–demand relationships of ecosystem services at multiple scales under SSP–RCP scenarios to promote ecological sustainability in China’s largest city cluster. Sustain Cities Soc 2024, 104, 105295. [Google Scholar] [CrossRef]
- Wang, Z.; Li, X.; Mao, Y.; Li, L.; Wang, X.; Lin, Q. Dynamic simulation of land use change and assessment of carbon storage based on climate change scenarios at the city level: A case study of Bortala, China. Ecol Indic 2022, 134, 108499. [Google Scholar] [CrossRef]
- Liang, X.; Guan, Q.; Clarke, K.C.; Liu, S.; Wang, B.; Yao, Y. Understanding the drivers of sustainable land expansion using a patch-generating land use simulation (PLUS) model: A case study in Wuhan, China. Computers, Environment and Urban Systems 2021, 85, 101569. [Google Scholar] [CrossRef]
- Shi, Z.; Zhou, S. A study on the dynamic evaluation of ecosystem health in the Yangtze river Basin of China. Ecol Indic 2023, 153, 110445. [Google Scholar] [CrossRef]
- Zhang, X.; Tian, Y.; Dong, N.; Wu, H.; Li, S. The projected futures of water resources vulnerability under climate and socioeconomic change in the Yangtze River Basin, China. Ecol Indic 2023, 147, 109933. [Google Scholar] [CrossRef]
- Chen, Q.; Ning, Y. Projecting LUCC dynamics and ecosystem services in an emerging urban agglomeration under SSP-RCP scenarios and their management implications. Sci Total Environ 2024, 949, 175100. [Google Scholar] [CrossRef]
- Liu, Y.; Yang, P.; Zhang, S.; Wang, W. Dynamic identification and health assessment of wetlands in the middle reaches of the Yangtze River basin under changing environment. J Clean Prod 2022, 345, 131105. [Google Scholar] [CrossRef]
- YangJie, H.X. The30 m annuallandcover datasetanditsdynamicsinChinafrom 1990to2019. Earthsystem Sciencedata 2021, 13, 3907–3925. [Google Scholar]
- Ji, X.; Sun, Y.; Guo, W.; Zhao, C.; Li, K. Land use and habitat quality change in the Yellow River Basin: A perspective with different CMIP6-based scenarios and multiple scales. J Environ Manage 2023, 345, 118729. [Google Scholar] [CrossRef] [PubMed]
- Zheng, L.; Wang, Y.; Li, J. Quantifying the spatial impact of landscape fragmentation on habitat quality: A multi-temporal dimensional comparison between the Yangtze River Economic Belt and Yellow River Basin of China. Land Use Policy 2023, 125, 106463. [Google Scholar] [CrossRef]
- Qiu, Y.; Shi, X. in A system dynamics modeling framework for urban logistics demand system with a view to society, economy and environment, LISS 2014: Proceedings of 4th International Conference on Logistics, Informatics and Service Science, 2015. Springer, 2015; pp. 299–303. [Google Scholar]
- Wu, J.; Luo, J.; Zhang, H.; Qin, S.; Yu, M. Projections of land use change and habitat quality assessment by coupling climate change and development patterns. Sci Total Environ 2022, 847, 157491. [Google Scholar] [CrossRef] [PubMed]
- Zhang, L.; Fang, C.; Zhao, R.; Zhu, C.; Guan, J. Spatial–temporal evolution and driving force analysis of eco-quality in urban agglomerations in China. Sci Total Environ 2023, 866, 161465. [Google Scholar] [CrossRef]
- Pan, Z.; Gao, G.; Fu, B.; Liu, S.; Wang, J.; He, J.; Liu, D. Exploring the historical and future spatial interaction relationship between urbanization and ecosystem services in the Yangtze River Basin, China. J Clean Prod 2023, 428, 139401. [Google Scholar] [CrossRef]
- Chen, D.; Jiang, P.; Li, M. Assessing potential ecosystem service dynamics driven by urbanization in the Yangtze River Economic Belt, China. J Environ Manage 2021, 292, 112734. [Google Scholar] [CrossRef]
- Ding, T.; Chen, J.; Fang, Z.; Chen, J. Assessment of coordinative relationship between comprehensive ecosystem service and urbanization: A case study of Yangtze River Delta urban Agglomerations, China. Ecol Indic 2021, 133, 108454. [Google Scholar] [CrossRef]
- Chen, W.; Wang, G.; Gu, T.; Fang, C.; Pan, S.; Zeng, J.; Wu, J. Simulating the impact of urban expansion on ecosystem services in Chinese urban agglomerations: A multi-scenario perspective. Environ Impact Asses 2023, 103, 107275. [Google Scholar] [CrossRef]
- Yang, H.; Wang, Y.; Tu, P.; Zhong, Y.; Huang, C.; Pan, X.; Xu, K.; Hong, S. Evaluating the effects of future urban expansion on ecosystem services in the Yangtze River Delta urban agglomeration under the shared socioeconomic pathways. Ecol Indic 2024, 160, 111831. [Google Scholar] [CrossRef]
- Sun, L.; Yu, H.; Sun, M.; Wang, Y. Coupled impacts of climate and land use changes on regional ecosystem services. J Environ Manage 2023, 326, 116753. [Google Scholar] [CrossRef]
- Li, G.; Fang, C.; Watson, J.E.; Sun, S.; Qi, W.; Wang, Z.; Liu, J. Mixed effectiveness of global protected areas in resisting habitat loss. Nat Commun 2024, 15, 8389. [Google Scholar] [CrossRef]
- Guan, X.; Wei, H.; Lu, S.; Dai, Q.; Su, H. Assessment on the urbanization strategy in China: Achievements, challenges and reflections. Habitat Int 2018, 71, 97–109. [Google Scholar] [CrossRef]
- Yu, B. Ecological effects of new-type urbanization in China. Renewable and Sustainable Energy Reviews 2021, 135, 110239. [Google Scholar] [CrossRef]
|
Disclaimer/Publisher’s Note: The statements, opinions and data contained in all publications are solely those of the individual author(s) and contributor(s) and not of MDPI and/or the editor(s). MDPI and/or the editor(s) disclaim responsibility for any injury to people or property resulting from any ideas, methods, instructions or products referred to in the content. |
© 2024 by the authors. Licensee MDPI, Basel, Switzerland. This article is an open access article distributed under the terms and conditions of the Creative Commons Attribution (CC BY) license (http://creativecommons.org/licenses/by/4.0/).