1. Introduction
Breast cancer remains a major global health challenge, and early and accurate diagnosis is crucial for improving survival [
1,
2,
3]. The current standard for detection relies on screening mammography and a standardized classification system developed by the American College of Radiology called Breast Imaging Reporting and Data System (BI-RADS) to interpret and report breast imaging findings [
4,
5]. The purpose of BI-RADS is to ensure consistent reporting and to provide clear management recommendations for patients, with a classification ranging from BI-RADS 1 up to BI-RADS 6. The rankings BI-RADS 1 (negative), 2 (benign) and 3 (probably benign) are generally associated with very low risk of cancer and do not require a follow-up tissue biopsy. Higher rankings such as BI-RADS 4 (suspicious abnormality) and 5 (highly suggestive of malignancy) strongly recommend a biopsy, while with BI-RADS 6 malignancy is already confirmed via biopsy.
While the BI-RADS system is effective at identifying lesions requiring further investigation, it presents a significant diagnostic dilemma, particularly for lesions classified as BI-RADS 4. This "suspicious" category recommends an invasive tissue biopsy as the standard practice across all its subcategories. However, the BI-RADS 4 category is so broad (with a malignancy risk ranging from just above 2% to as high as 95% [
6] across its subcategories 4A, 4B and 4C) that published data show that 70-80% of biopsies performed for these lesions ultimately yield a benign result [
7,
8,
9]. This ambiguous category is also where the BI-RADS system, despite its goal of standardization, is subject to the highest variability in how different radiologists interpret the same mammogram.
Although the BI-RADS 4 subcategories are intended to reflect a gradient of malignancy risk, this category remains a significant diagnostic challenge in clinical practice. Inter-reader variability in the interpretation and classification of imaging findings can lead to inconsistencies in subcategory assignment and subsequent management decisions. As a result, patients are subjected to the anxiety, pain, and potential complications of an invasive biopsy procedure that, in retrospect, could have been avoided. Furthermore, a study demonstrated that women who had a BI-RADS 4 assessment that turned out to be benign (given a subsequent negative biopsy result) are about 10% less likely to return for a subsequent screening [
10], demonstrating the potential for a false diagnosis to compromise long-term engagement in recommended cancer monitoring. These downstream effects of false-positive assessments not only places a heavy emotional and physical burden on patients [
11] but also imposes a substantial economic cost on the healthcare system [
12]. There is a clear and urgent need for a non-invasive tool to better stratify risk and reduce the number of unnecessary biopsies.
Our research addresses this challenge by exploring the diagnostic potential of Volatile Organic Compounds (VOCs) in exhaled breath. The distinctive metabolic processes of malignant tumors are known to produce a distinct profile of VOCs which are released into the bloodstream and subsequently expelled in the breath, creating a unique "breathprint" that can serve as a non-invasive biomarker [
13,
14,
15,
16,
17,
18]. This paper presents a proof-of-concept study using the DiagNoze breathalyzer (Noze Inc.) designed to differentiate between malignant and benign pathologies in the challenging BI-RADS 4 cohort. We hypothesize that a predictive model, developed using machine learning on a combination of breath data and BI-RADS classification, could more accurately stratify risk than using BI-RADS assessment alone.
2. Materials and Methods
2.1. Study Design and Population
2.1.1. Study Design
This study was conducted at the McGill University Health Centre (MUHC) Breast Center, a tertiary referral clinic specializing in breast cancer diagnosis and treatment. The study received full approval from the MUHC Research Ethics Board (REB), and written informed consent was obtained from all participants prior to enrollment. The study was guided by three core design principles: scientific rigor, respect for patient experience, and clinical workflow integration.
First, a subtype-agnostic approach was adopted, enrolling participants with any form of breast imaging abnormality requiring biopsy to ensure that the resulting VOC breathprint model would be broadly representative and clinically applicable across the disease spectrum. Second, stringent inclusion and exclusion criteria were implemented to control for known metabolic confounders, thereby enhancing the specificity of the breath VOC signature. Third, the protocol was designed to align seamlessly with standard clinical pathways, minimizing disruption to care and imposing no additional burden on participants.
2.1.2. Study Population
To ensure the integrity of the breath-based biomarker data, stringent eligibility criteria were applied to control for both internal metabolic and external environmental confounders. Inclusion criteria required participants to be biologically female, between 18 and 80 years of age, recently referred to the clinic for a suspicious breast imaging finding, and capable of providing informed consent. Exclusion criteria were implemented to eliminate factors known to influence breath VOC composition. Individuals were excluded if they had a medical history of asthma, chronic obstructive pulmonary disease (COPD), or diabetes — conditions known to significantly alter endogenous VOC profiles [
19,
20,
21]. Additional exclusions included current smoking [
22], recent use of alcohol, food consumption prior to sampling, or any physical limitation that would impair the ability to provide a high-quality exhaled breath specimen. These measures were essential to ensure that the collected data reflected physiological signals specific to breast pathology, free from confounding metabolic noise.
Eligible participants were recruited from among patients referred to the MUHC Breast Center following abnormal findings on screening mammography. Recruitment occurred during natural waiting periods within the standard diagnostic pathway, such as while awaiting imaging or consultation, allowing for a seamless integration into clinical workflows without disrupting care. Breath sampling was completed in a single visit and required no special preparation or follow-up. The target sample size was 176 participants, reflecting the typical diagnostic distribution observed at the clinic. Group 1 (Controls) included individuals with comprehensive diagnostic evaluation, who were confirmed via biopsy to have benign findings. Group 2 comprised individuals with biopsy-confirmed breast cancer. Importantly, the control group (patients presenting with comparable clinical suspicion but ultimately non-malignant outcomes) provided a highly relevant benchmark for evaluating model performance.
Each participant was asked to provide four to five replicate breath specimens using the DiagNoze breathalyzer, enabling generation of high-resolution VOC breathprint profiles. In parallel, clinical data were extracted from electronic medical records, including diagnostic outcomes from imaging and pathology, tumor characteristics, and relevant genetic information (e.g., BRCA1/2 mutation status).
2.2. Device Description
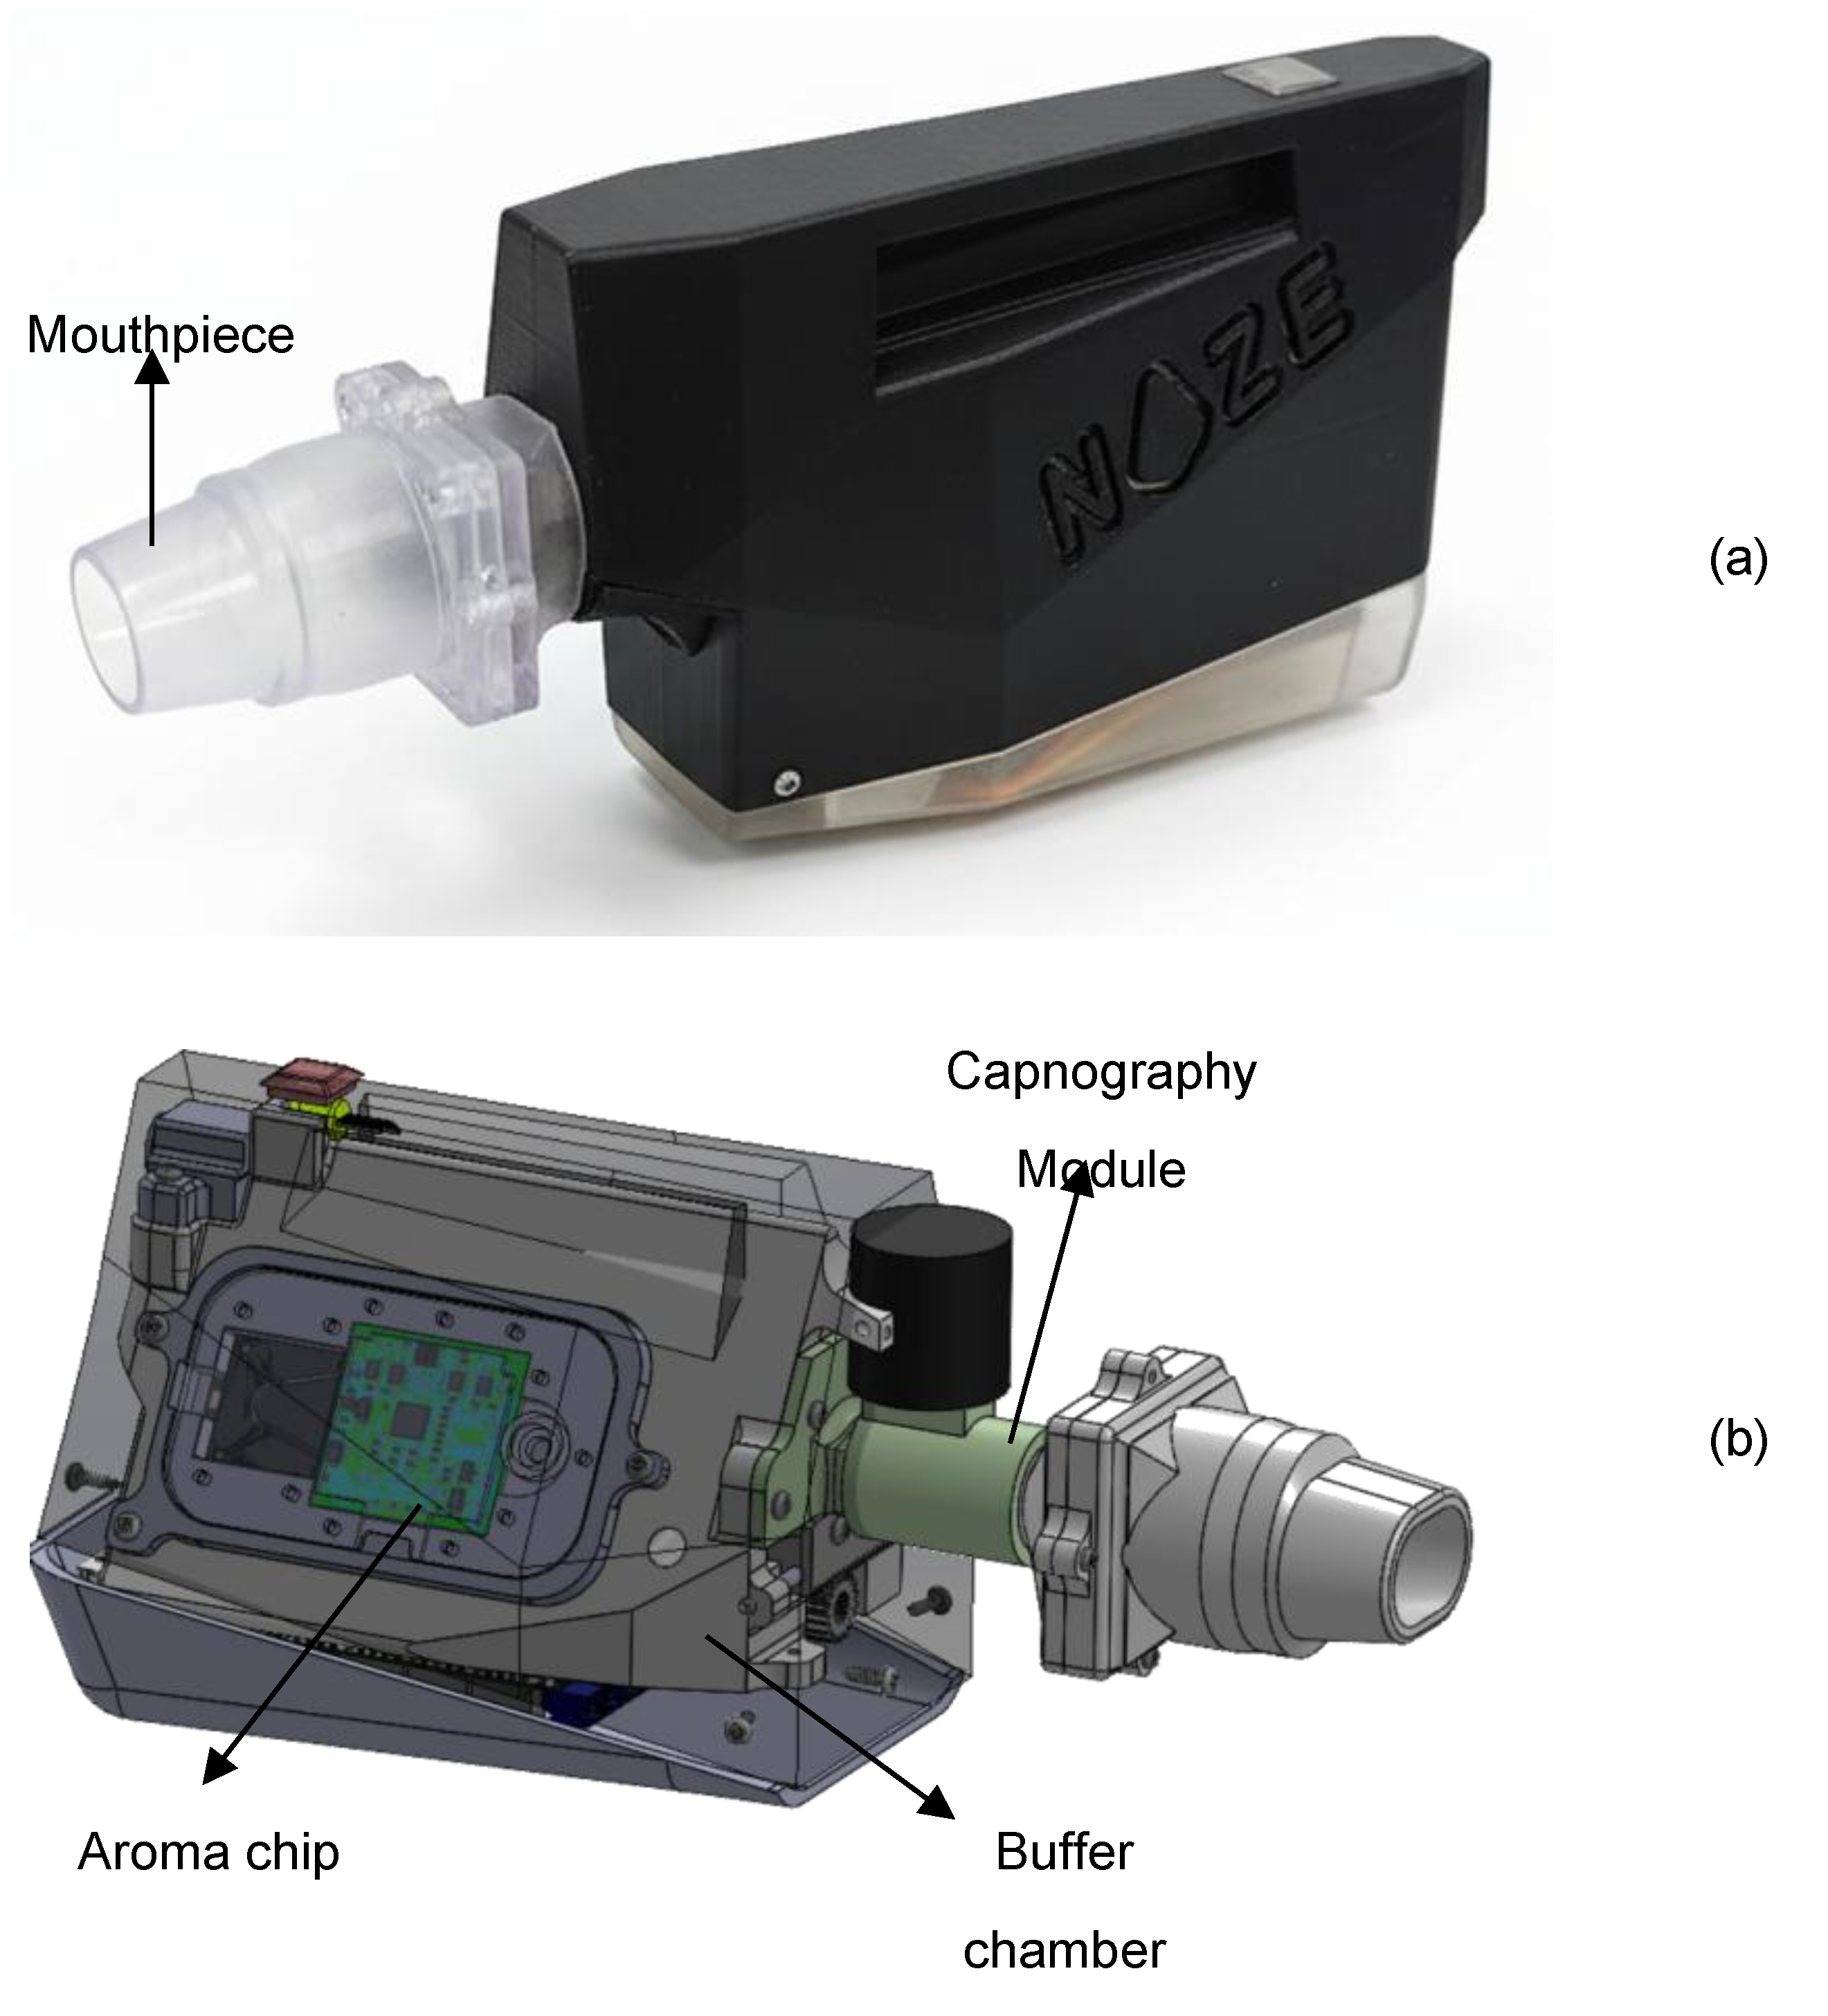
Breathprints were recorded from participants using the DiagNoze (manufactured by Noze Inc., Montreal, QC, Canada), an eNose powered breathalyzer device as shown in
Figure 1a that digitizes alveolar biomarkers including volatile organic compounds (VOCs) in an exhaled breath specimen . The breathalyzer is composed of two primary components: the mouthpiece and the main unit. The mouthpiece streamlines the exhaled breath into the device and filters humidity. The main unit contains three sequential modules: a capnography [
23] module, a buffer chamber, and the aroma chip module as shown in
Figure 1b.
To isolate the physiologically relevant portion of the breath, the device has integrated an in-line capnography logic to detect and discard the initial phase of exhalation (commonly referred to as dead space air) which originates from the upper airways and contains minimal metabolic information. Only the alveolar fraction, drawn from the deeper lungs and enriched in endogenous VOCs reflective of systemic metabolism [
24], gets retained in the subsequent buffer chamber for digitization. This selective sampling process enhances the reliability and biological relevance of the resulting VOC fingerprint.
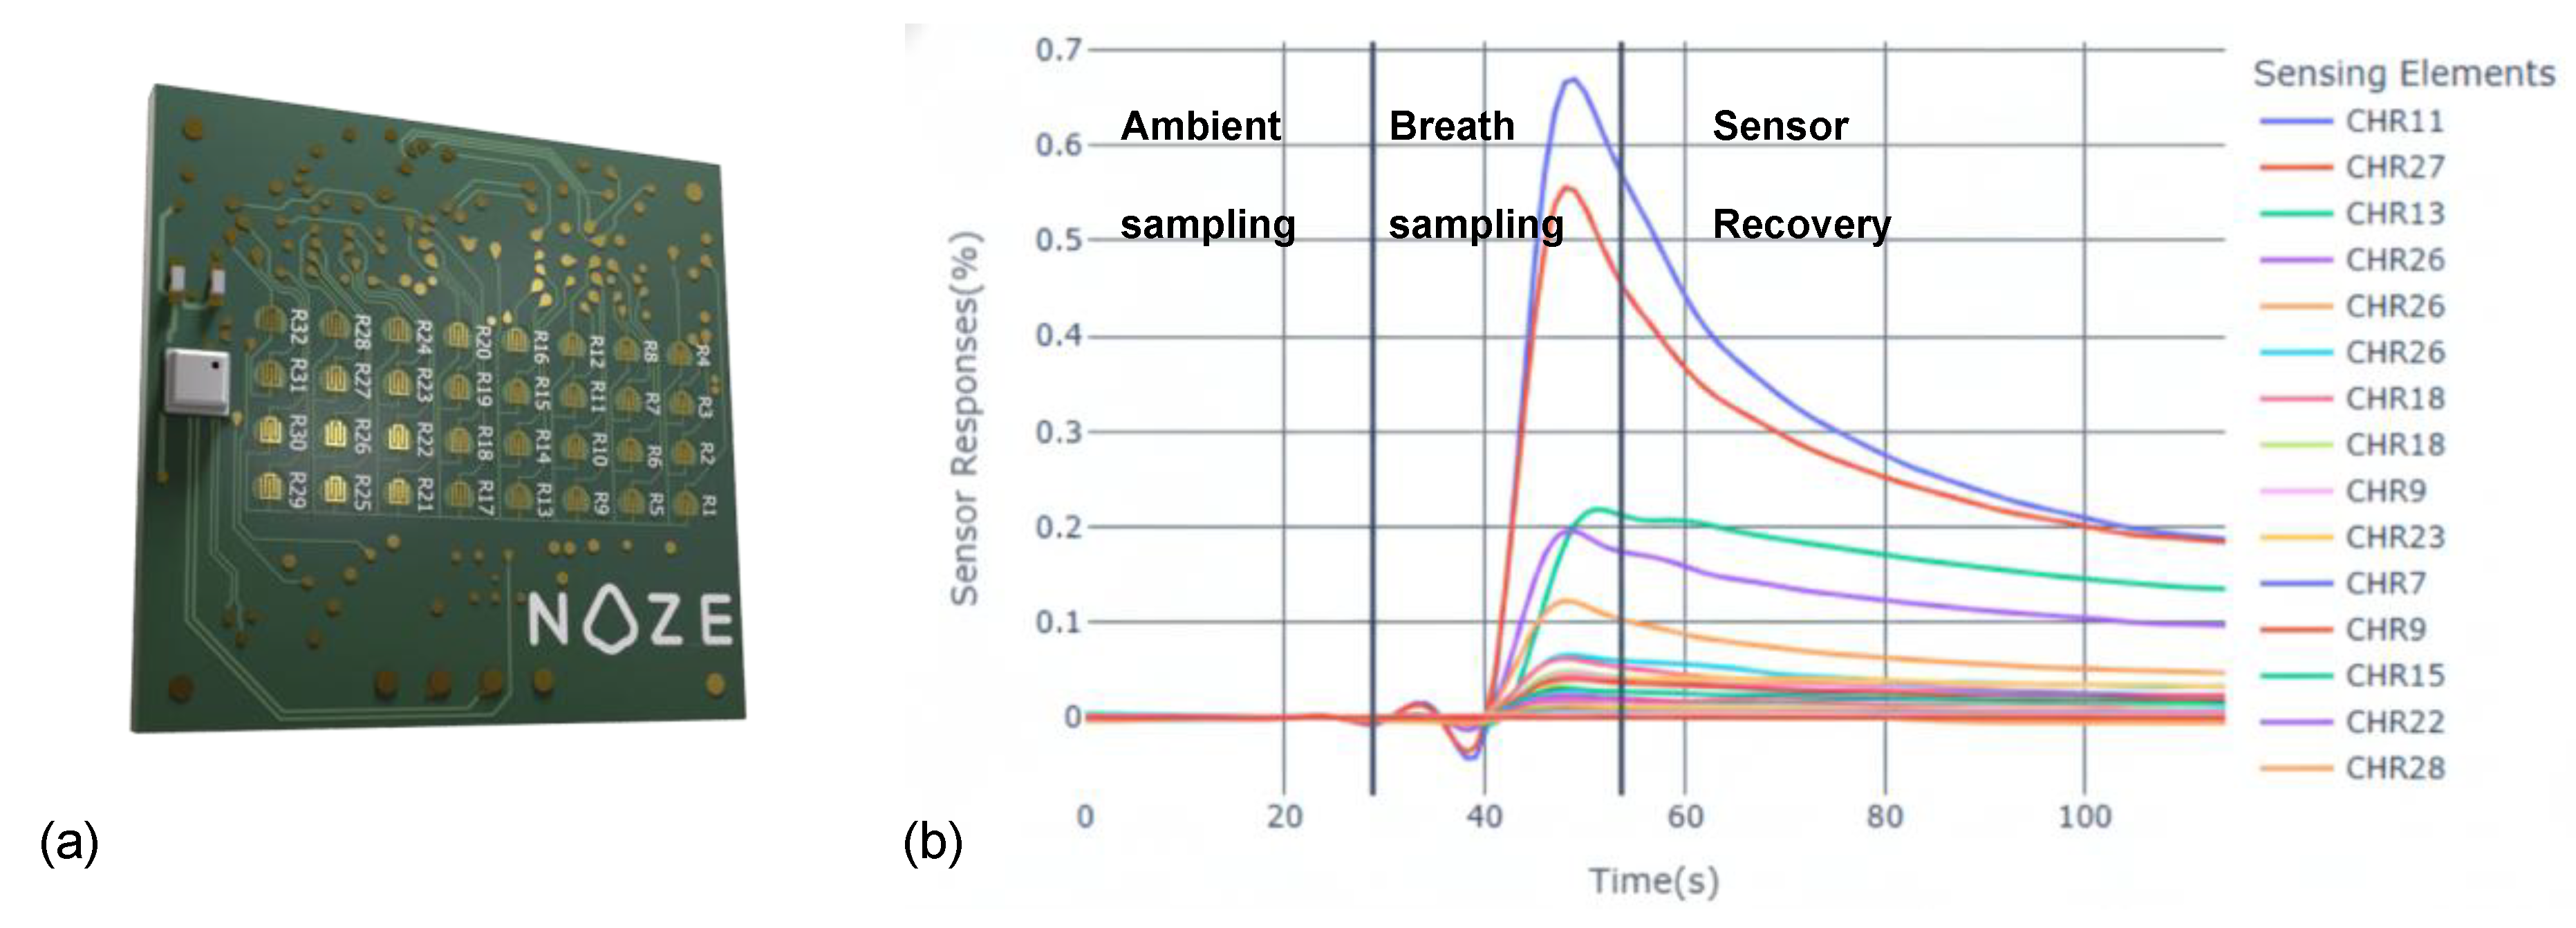
The alveolar breath specimen is then transferred from the buffer chamber to the Noze aroma chip [
25] (
Figure 2a). The aroma chip is a cross-reactive sensor array composed of 32 distinct chemiresistive elements, each broadly tuned to respond to different families of VOCs. As VOCs in the breath interact with the sensor surfaces, they induce specific changes in electrical impedance, which are captured in real time. The result is a high-dimensional, time-resolved dataset (“digital breathprint”) captured at a frequency of 1 Hz across all sensing elements simultaneously (
Figure 2b). This dynamic output reflects the full course of the breath-sensor interaction, including ambient-sampling, breath-sampling, and sensor-recovery phases. The multidimensional nature of this data provides a rich foundation for machine learning-based pattern recognition and classification.
2.3. Breath Sampling Protocol
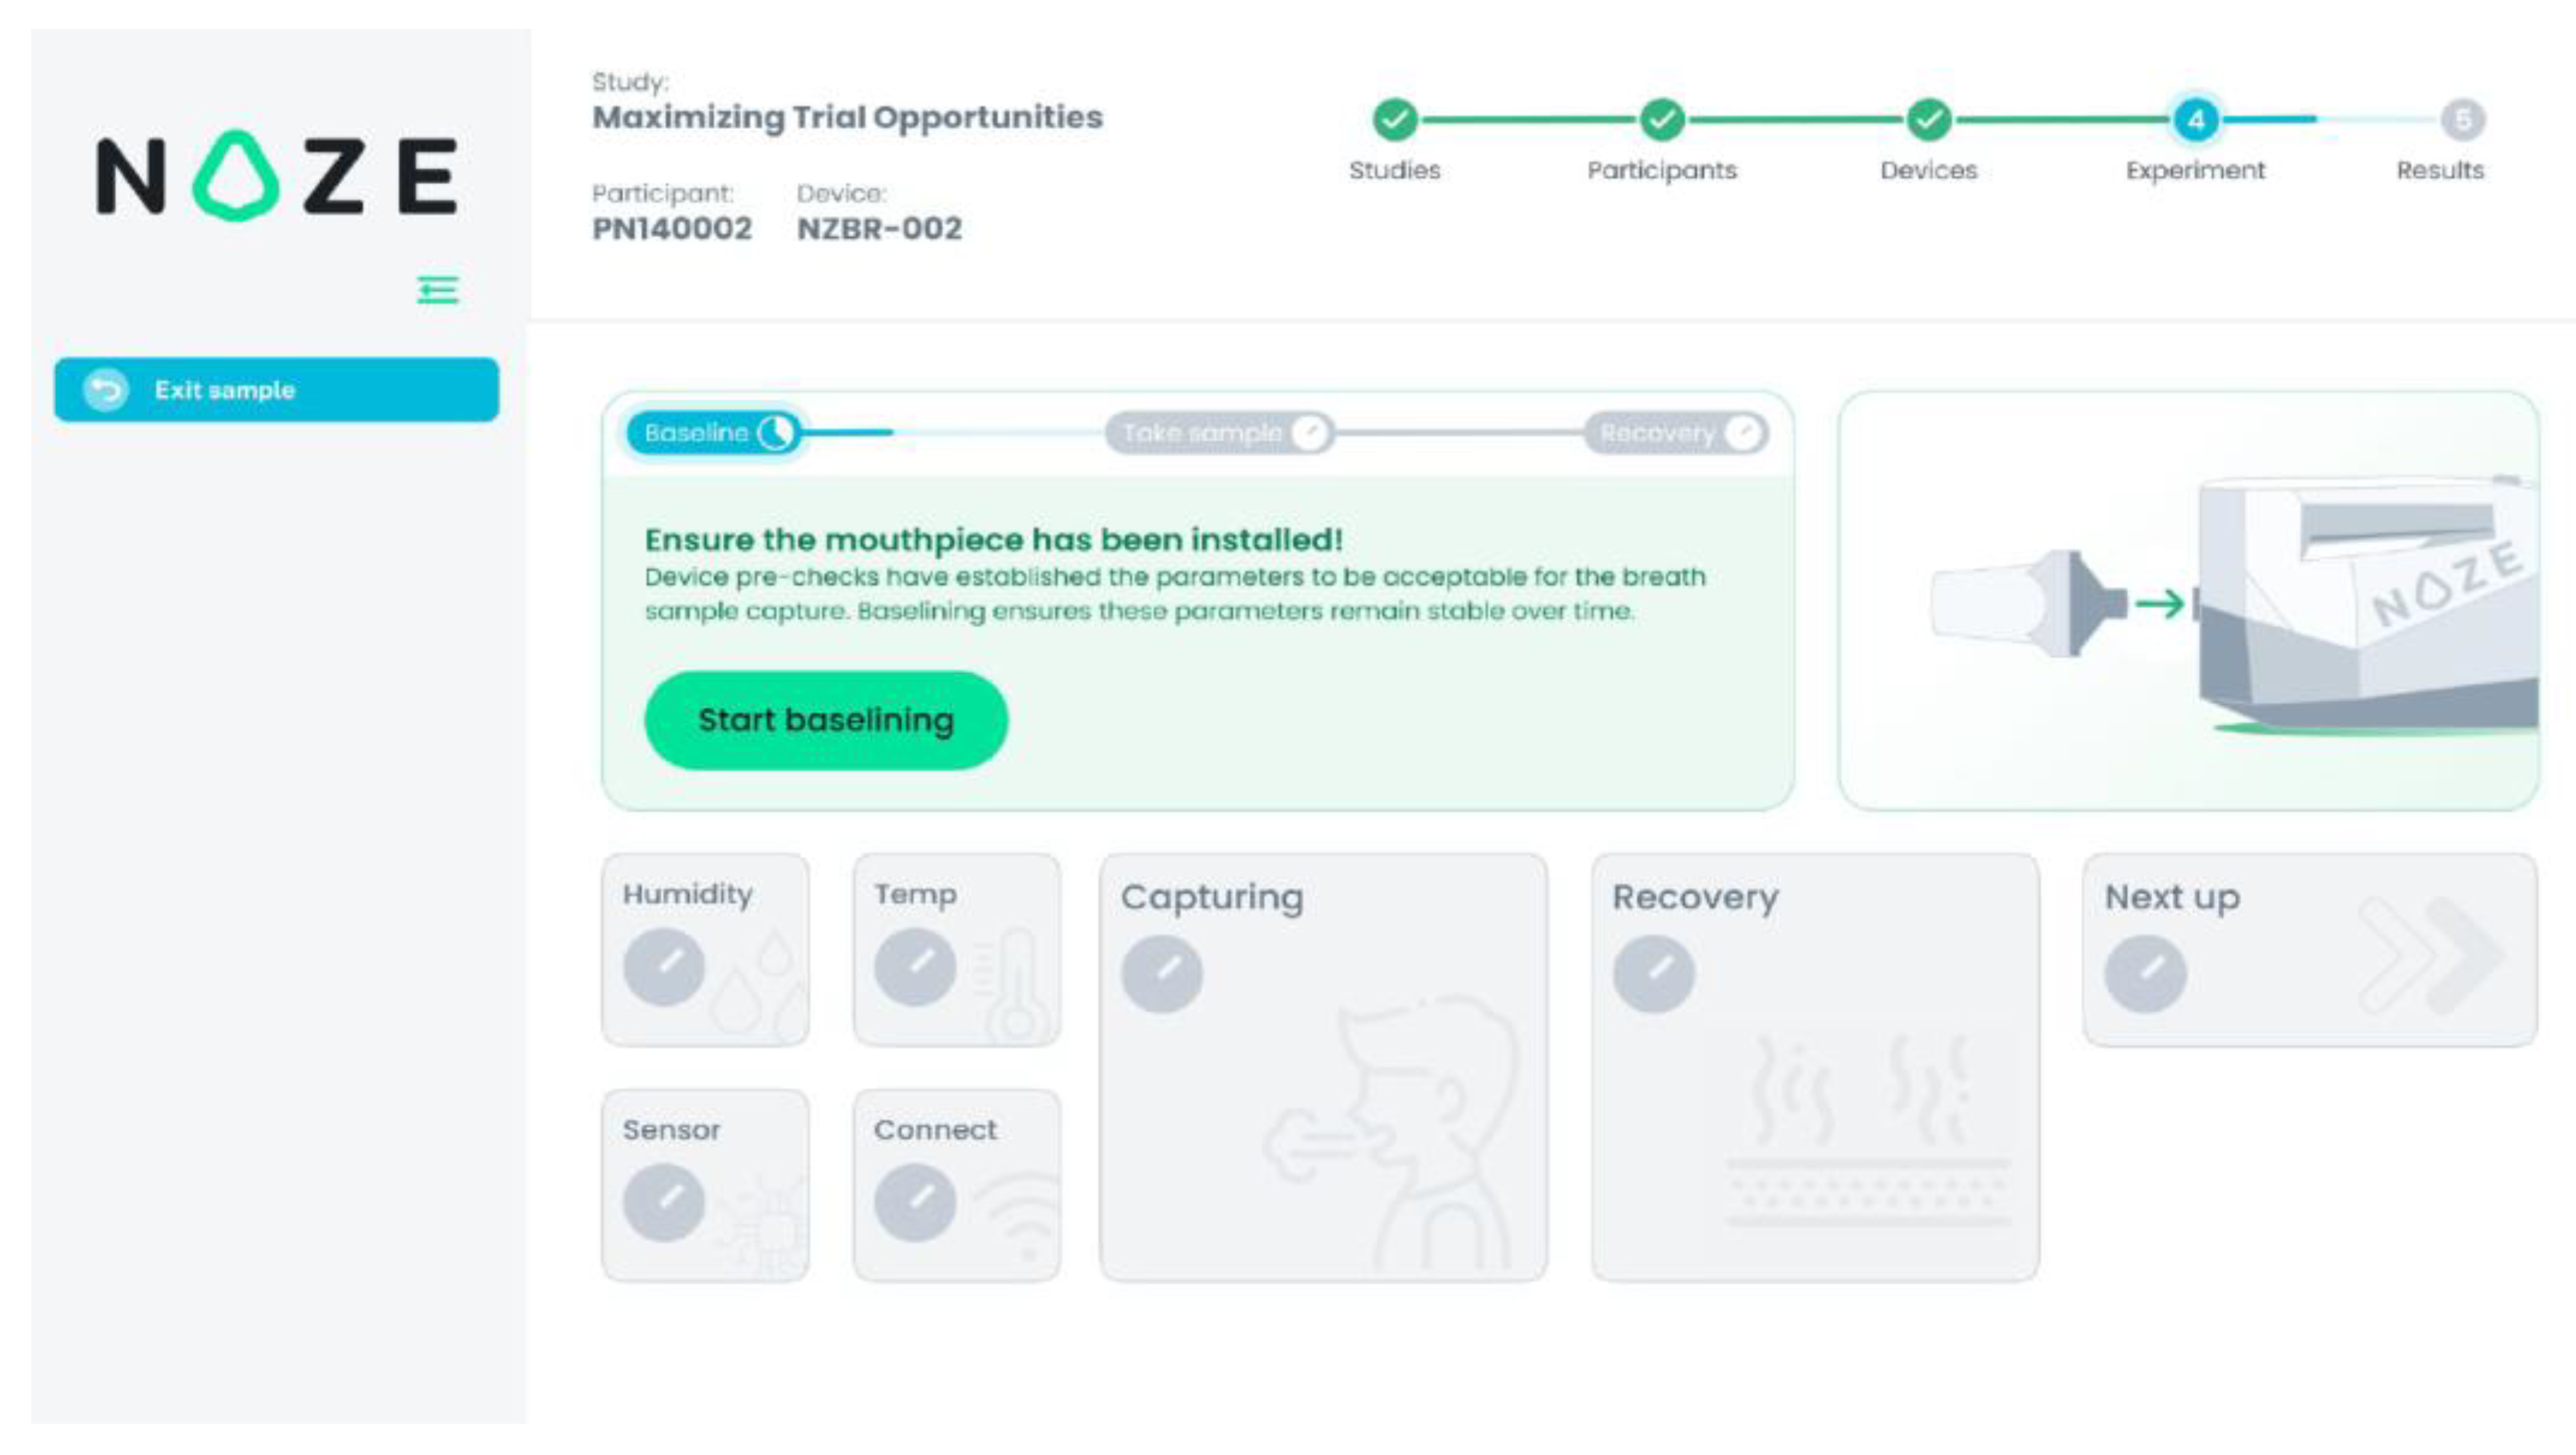
To ensure reproducibility and data integrity, breath collection was conducted using a standardized, operator-guided protocol via the DiagNoze web-based user interface (UI) (
Figure 3). Each participant was asked to provide four to five replicate breath specimens to account for natural physiological variability in the breath composition[
25].
For each replicate, the UI guided the clinical coordinator through a structured, three-phase measurement cycle:
Ambient Sampling Phase (30 seconds): The device initially sampled ambient air to establish a stable response with respect to the ambient. This step calibrates the sensor array to the room’s background VOC composition, ensuring accurate differential detection during breath-sampling. In
Figure 3 this phase is referred to as “Baselining”.
Breath Sampling Phase (5–15 seconds): With the participant’s nose gently occluded to prevent nasal breathing, a single full exhalation was performed into the mouthpiece. The integrated capnography [
23] module automatically identifies the end-tidal (alveolar) portion of the breath and triggers its capture in the buffer chamber. In
Figure 3 this phase is referred to as “Capturing”.
Sensor Recovery Phase (250 seconds): Following sample capture, ambient air was drawn through the system to facilitate desorption of VOCs from the sensor surfaces, allowing the array to return to the ambient state in preparation for the next measurement. In
Figure 3 this phase is referred to as “Recovery”.
Between adjacent specimens, a high-flow purge fan actively evacuated residual VOCs and moisture from the internal components, preventing signal carryover and ensuring full sensor recovery to its equilibrium with the ambient air as the reference state, prior to the next measurement. This automated cleaning process preserved the independence and integrity of each breathprint. The entire sampling workflow—including participant instructions, real-time monitoring, and device readiness—was orchestrated through the DiagNoze UI, streamlining operations and optimizing data quality across all replicates. All breathprint data were anonymized at the point of collection and transmitted securely to a managed-access cloud platform for analysis, in compliance with institutional data governance policies. Detailed security protocols are described in the Appendix section.
2.4. Data Preprocessing and Model Building
Developing a malignancy classifier model capable of interpreting complex breathprint data requires a structured, multi-phase approach. The methodology comprised three main stages: (1) preprocessing the raw sensor data into a standardized analytical format; (2) training a machine learning model optimized for clinical relevance; and (3) evaluating model performance using a rigorous, multilayered validation framework.
2.4.1. Data Preprocessing
To prepare the data for building an AI model, we applied a standardized preprocessing protocol involving time-series normalization with respect to the ambient air to account for environmental variability following [
26]. The dataset is then partitioned using stratification into multiple folds in order to enable a nested cross validation [
27] for evaluation of the model development process. To preserve clinical representativeness and avoid sampling bias, the folds are stratified by diagnostic category, including intermediate BI-RADS 4 subgroups, ensuring consistent outcome distribution across both sets.
2.4.2. Model Architecture and Clinically-Optimized Training
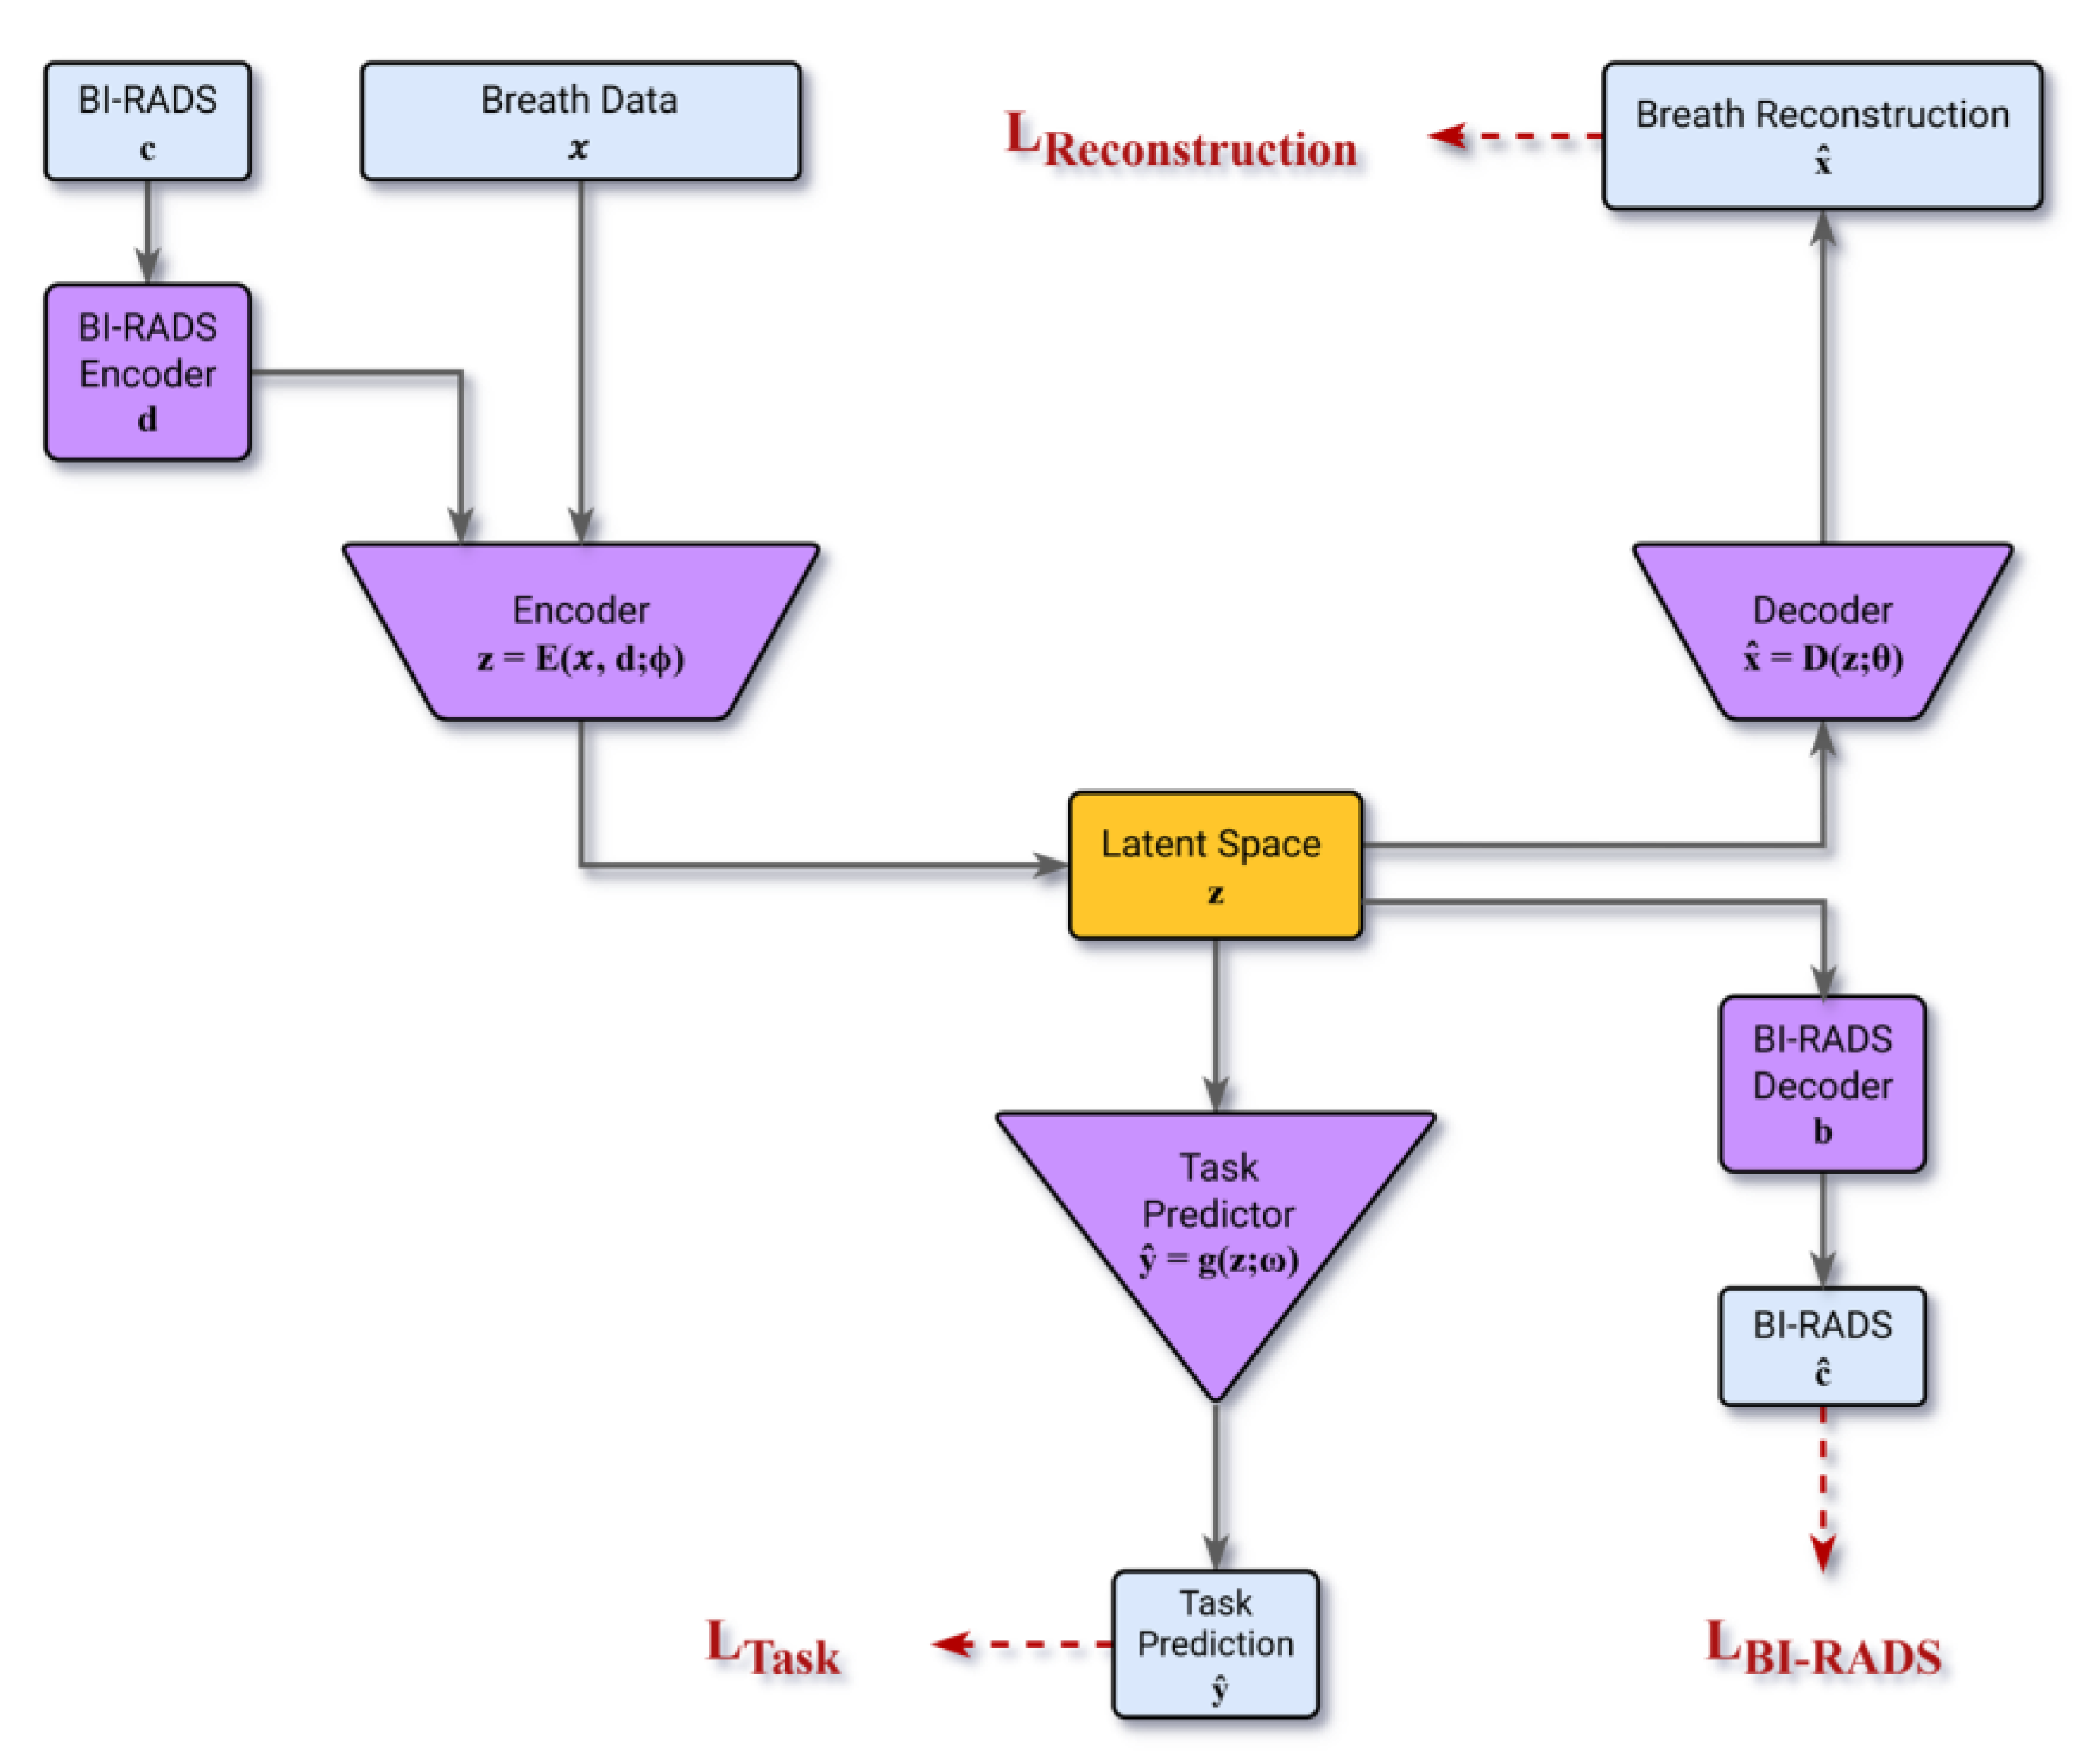
To learn the key attributes (features) of the digital breathprint that jointly represent its time-series dynamics, we engineered a semi-supervised model based on the Autoencoder (AE) architecture [
28]. The Autoencoder architecture facilitates the extraction of key features by compressing the information content of the data into a condensed vector representation within its latent space, Z. The modified architecture incorporates encoders designed to jointly map the breathprint time-series (d) and the associated BI-RADS score (c) into a shared latent vector (z). The encoders/decoders are learned to ensure the latent representation encapsulates the necessary information by reconstructing both the breathprint and the BI-RADS score from (z). Concurrently, a multi-layer-perceptron block optimizes the latent space Z, suited most for the malignancy classification task in a supervised fashion.
The model is optimized using a composite loss function comprising LTask, LReconstruction, and LBI-RADS respectively representing:
LTask : the error for performing the malignancy classification task
LReconstruction : the error for decoding the breathprint from the latent vector
LBI-RAD : the error for decoding the BI-RADS score from the latent vector
To ensure that the model is aligned with clinical priorities, the training process incorporated several safety-focused optimizations. First, a class-weighted loss function addressed the natural imbalance in the dataset, where benign findings were more prevalent than malignant ones. Second, we explicitly prioritized sensitivity by assigning higher penalties to false negatives (missed cancers), thereby reducing the likelihood of underdiagnosis. Third, model selection is based on a custom clinical utility metric that emphasized generalizability and diagnostic robustness over raw accuracy. A full description of the model architecture, loss functions, and training procedures is available in the Appendix.
) and BI-RADS score ().
Figure 4.
The Model Architecture that takes the BI-RADS category (c) and breath data (x) as inputs. Two encoders map these into a latent vector (z). From this latent vector, a task predictor predicts malignancy (ŷ), while two decoders reconstruct the original breath data (
Figure 4.
The Model Architecture that takes the BI-RADS category (c) and breath data (x) as inputs. Two encoders map these into a latent vector (z). From this latent vector, a task predictor predicts malignancy (ŷ), while two decoders reconstruct the original breath data (
2.4.3. Model Cross-Validation
To ensure a fair and clinically meaningful assessment of model performance, we implemented a robust evaluation framework emphasizing reproducibility and diagnostic safety. Rather than relying on a single train–test split, we used the nested cross validation [
27] framework to evaluate the model across multiple partitions of the dataset, reducing the risk of overfitting or optimistic bias. Model predictions were generated using an ensemble approach, where multiple independently trained models contributed to the final output via majority vote. In alignment with our safety-first principle, any vote ties were resolved conservatively in favor of a positive (malignant) classification.
Final performance metrics are reported as the mean and standard deviation across 100 independent runs, providing a stable and reliable estimate of the performance of the generated model following the model development process. During each run the folds were generated using the original dataset, independently. See the Appendix section for more details on cross-validation structure and the employed ensemble procedure.
3. Results
3.1. Study Population and Data Distribution
The study initially enrolled 176 participants. Four to five breath specimen digitization attempts were performed per patient, of which three breathprints were successfully recorded by average across the patients. 51 participants were excluded due to an inconclusive (n=15) or unreported (n=13) BI-RADS score or having BI-RADS score not among 3, 4A, 4B, 4C, or 5 (n=6). For 17 participants, sampling the digitized breath aroma failed across all the attempts.
The analysis included 125 participants who provided a total of 437 successful breathprints. Of these, 72 participants had confirmed benign findings, contributing 270 successfully recorded breathprints. The remaining 53 participants had biopsy-confirmed breast cancer, from whom 167 breathprints were successfully recorded.
The BI-RADS 4 group (A, B, and C) included 85 participants. Among these, 17 had biopsy-confirmed breast cancer, and 68 had biopsy-confirmed benign findings. A total of 53 and 256 successful breathprints were recorded from these participants, respectively.
Table 1 summarizes the distribution of these 309 successful breathprints.
3.2. Predictive Performance in the BI-RADS 4 Cohort
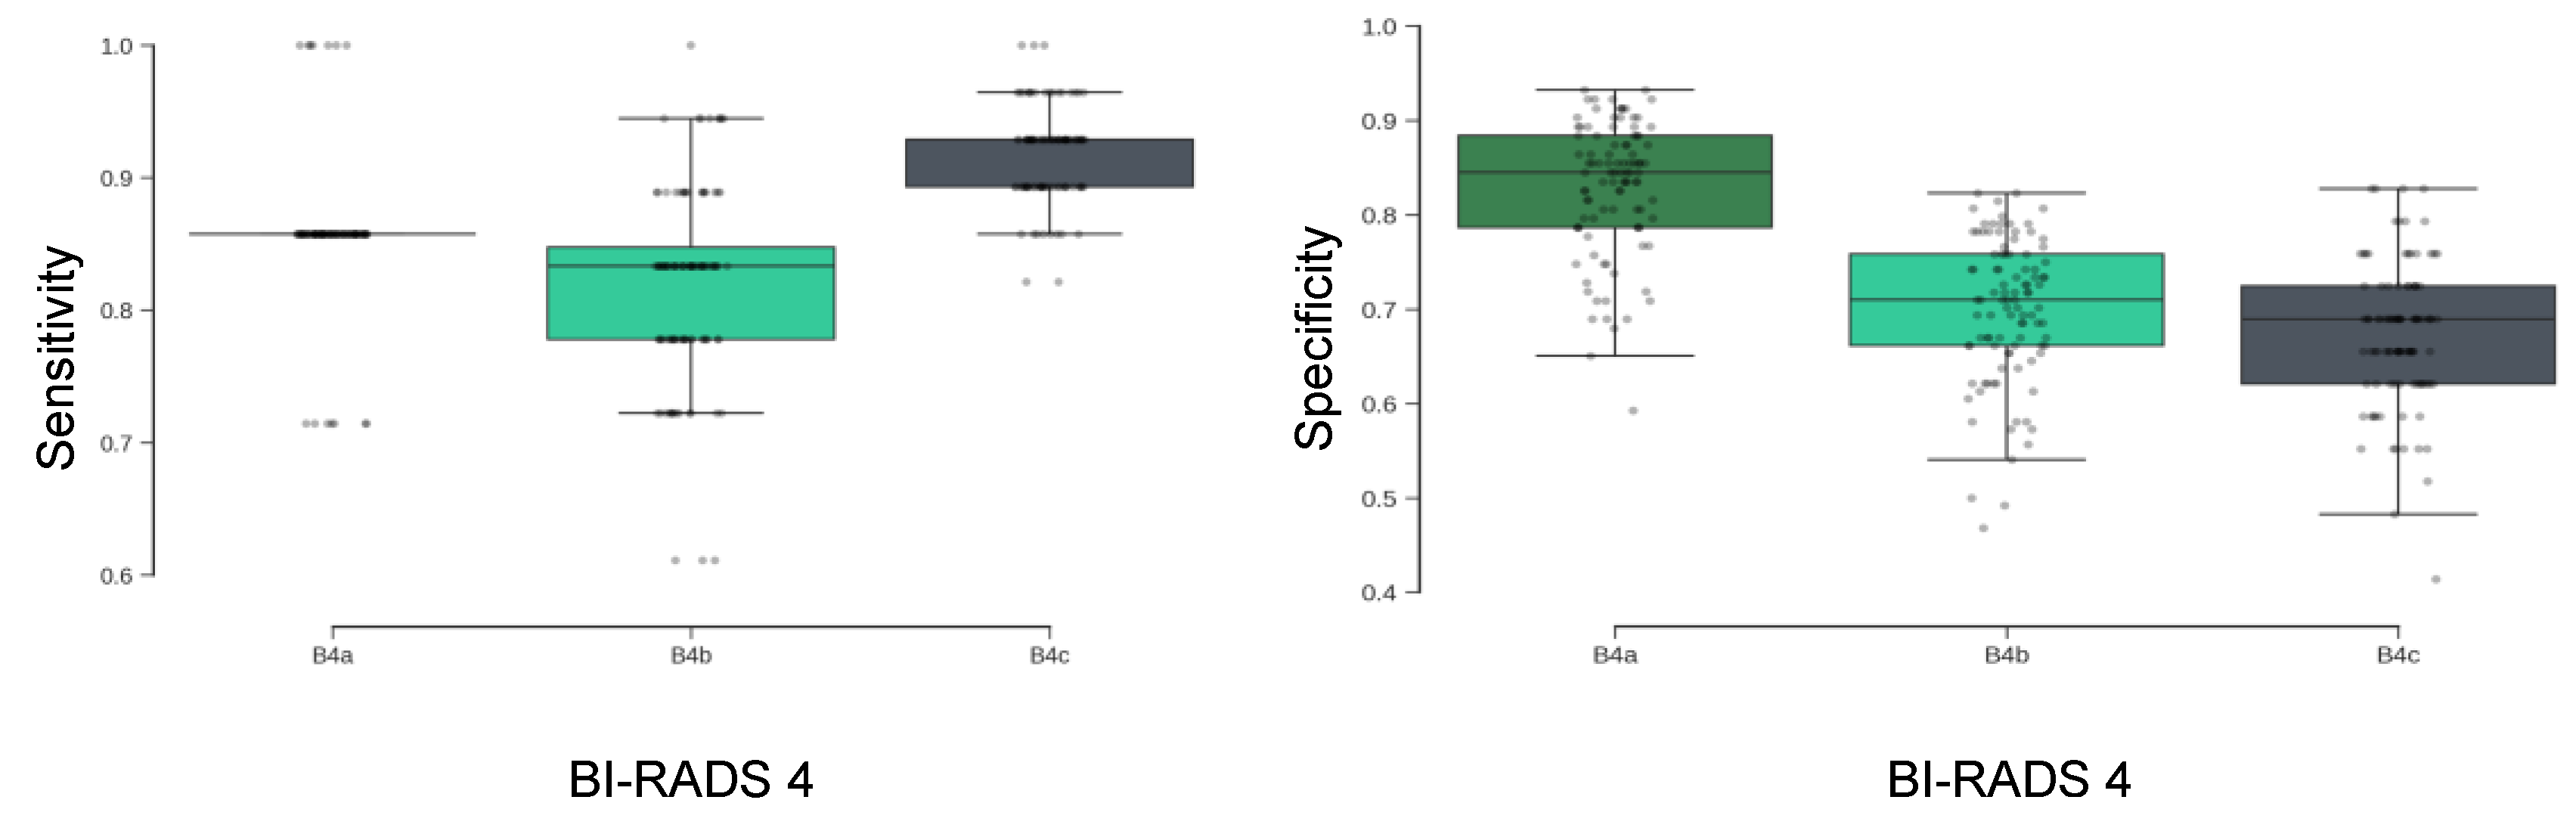
The primary analysis focused on participants categorized as BI-RADS 4 (A, B, and C), representing patients with suspicious imaging findings. Across the full BI-RADS 4 group, the model achieved a mean sensitivity of 88% ± 3% (
Table 2), indicating a high capacity to correctly identify malignant cases. The metric is consistent across BI-RADS 4 subcategories, with particularly high sensitivity maintained in the 4C group.The results are stable across the 100 randomized cross-validation runs. As shown in
Figure 5 (left), sensitivity distributions were tightly clustered across subgroups, suggesting minimal variance in model behavior across different partitions of the dataset.
3.2.1. Specificity and Sensitivity Trade-Offs Across Subcategories
Specificity is the ability of a test to correctly identify those without the disease. The model’s specificity demonstrated a decreasing trend from BI-RADS 4A to 4C subgroups (
Figure 5, right), with highest specificity observed in the 4A group. This pattern reflects the model’s sensitivity-focused training protocol, which prioritized the reduction of false negatives in higher-risk categories. While specificity was lower in BI-RADS 4B and 4c, this trade-off was made to preserve high sensitivity in patients with a higher pre-test probability of malignancy.
3.2.2. Summary Metrics and Negative Predictive Value
Table 2 presents comprehensive model performance across all BI-RADS 4 subgroups. The model achieved an overall NPV of 97% ± 1%, indicating a high level of confidence in negative test results. Specificity was maintained at 75% ± 7%, indicating that the model correctly identified approximately three out of four benign cases. This balance between high sensitivity and moderate specificity supports the model’s potential utility as a rule-out tool in diagnostic workflows.
4. Discussion
This proof-of-concept study demonstrates that exhaled breath contains a detectable and clinically informative signal capable of distinguishing between malignant and benign findings in women with BI-RADS 4 mammographic assessments. Using a digital olfaction platform and a machine learning model trained with clinically informed constraints, we achieved a mean sensitivity of 88% and an overall NPV of 97%. These results suggest that breath-based diagnostics may offer a promising non-invasive approach for stratifying risk in patients with indeterminate imaging findings.
The clinical implications are particularly relevant for managing BI-RADS 4A and 4B lesions, which account for a high volume of benign biopsies. A high NPV in this setting may enable more conservative management strategies, such as short-interval imaging follow-up, potentially reducing unnecessary procedures and associated patient anxiety. Additionally, according to a formerly published study [
29], performance remains strong in participants with dense breast tissue, a population in which mammographic sensitivity is known to be reduced. This suggests that a breath-based approach could serve as a complementary modality in cases where traditional imaging has limitations.
The model’s diagnostic behavior was shaped by a deliberate training strategy that prioritized sensitivity. Through the use of class weighting and penalty adjustments, we explicitly reduced the likelihood of false-negative results. This design choice aligns with clinical priorities, particularly in early cancer detection where the cost of a missed diagnosis is high. While this approach resulted in a moderate reduction in specificity, the observed trade-off is clinically appropriate in a rule-out context.
Importantly, the model’s performance was validated using a rigorous cross-validation framework, including 100 independent runs and ensemble-based predictions, ensuring robustness across multiple data partitions. However, the study is limited by its single-center design and the use of a single device platform. Although the results are internally consistent and statistically stable, external validation in multi-center cohorts will be essential to confirm generalizability. These findings support further investigation of breath-based diagnostics in breast cancer. Future studies should aim to evaluate the reproducibility of these results across different clinical settings, devices, and populations, and explore integration with existing diagnostic pathways.
The low positive predictive value (PPV) for categories 4a (28%) and 4b (29%) is largely attributed to the low prevalence of malignancy within these subgroups. For instance, the malignancy rate for BI-RADS 4a is only 6%, indicating that the majority of these cases are benign. This low prevalence inflates the false positive rate, thereby decreasing the PPV, as defined by the formula PPV = TP / (TP + FP). Conversely, the PPV for category 4c (73%) is considerably higher due to a significantly greater malignancy prevalence in that group, which increases the likelihood that a positive prediction is correct.
These results also open the door to a complementary diagnostic paradigm, in which breath analysis is used not as a standalone tool but as a tandem modality alongside mammography and ultrasound. In this scenario, the breath-based test could be administered immediately after a suspicious BI-RADS 4 mammogram, offering an additional layer of risk stratification prior to biopsy. For example, a negative breath test result in a BI-RADS 4A or 4B case, especially given the model’s high negative predictive value, could support a more conservative management approach such as short-term imaging follow-up rather than immediate biopsy. This combinatorial use of imaging and breath diagnostics may help reduce inter-reader variability, alleviate patient anxiety, and optimize clinical decision-making by tailoring biopsy recommendations to a more individualized risk profile.
5. Conclusions
This study establishes proof-of-concept that a non-invasive breath test, analyzed using a digital olfaction platform and a clinically optimized machine learning model, can differentiate benign from malignant breast lesions in women with BI-RADS 4 findings. The model achieved high sensitivity (88%) and a negative predictive value of 97%, supporting its potential use as a rule-out tool in the diagnostic workup of suspicious mammograms. Our findings demonstrate that this model achieves high sensitivity and an exceptionally high NPV. These results establish a strong foundation for a tool that could confidently rule out malignancy, potentially sparing a majority of women from an unnecessary biopsy.
By reducing reliance on invasive biopsy in low-risk cases, this technology could alleviate patient burden and streamline clinical decision-making and provide cost-savings to an already overburdened healthcare system. The results warrant further validation in larger, multi-center studies to confirm generalizability and evaluate integration into real-world diagnostic workflows.
Author Contributions
“Conceptualization, A.P.M., J.K.H., M.K.A. and S.M..; methodology, J.K.H. and M.K.A.; software, J.K.H.; validation, A.P.M., J.K.H., H.Y.L., M.K.A. and S.M.; investigation, A.P.M., R.P., P.K., G.G., M.K.A. and S.M..; resources, R.P. and P.K..; writing—original draft preparation, A.P.M., J.K.H, M.H.R. and H.Y.L.; writing—review and editing, P.K., M.K.A. and S.M.; visualization, J.K.H.; supervision, A.P.M., M.K.A. and S.M.; project administration, G.G. and S.M.; All authors have read and agreed to the published version of the manuscript.”.
Funding
This research received no external funding.
Institutional Review Board Statement
The study was conducted in accordance with the Declaration of Helsinki, and approved by the Research Ethics Board (REB) of the McGill University Health Centre (MUHC) (REB Number - 2024-9747, Date of approval - Oct 10, 2023).
Data Availability Statement
The datasets generated during and/or analyzed during the current study are not publicly available due to the terms of participant consent. Aggregated data supporting the findings are available within the article.
Conflicts of Interest
A.P.M., J.K.H., M.H.R., P.K., G.G., H.Y.L. and M.K.A. are employed by Noze. The remaining authors declare that the research was conducted in the absence of any commercial or financial relationships that could be construed as a potential conflict of interest.
Appendix A
Secure Data Transmission and Storage
When a breath specimen is successfully digitized into a breathprint, it is securely transmitted from the device to the Noze cloud for analysis. This process is governed by a multi-layered defense strategy designed to protect both the integrity of the data and the privacy of the participant. The first and most fundamental layer of this defense is immediate anonymization. Before any data leaves the device, all personal identifying information is stripped away. Each participant is represented solely by a non-identifiable Personal Unique Identifier (PUI), ensuring that the breathprint is intrinsically unlinked to the individual.
With privacy assured at the source, the anonymized data begins its real-time transfer. This transmission is protected by industry-standard Secure Sockets Layer/Transport Layer Security (SSL/TLS) encryption. This protocol creates a secure, encrypted tunnel between the device and the cloud, safeguarding the data from interception or tampering while in transit.
Upon arrival, the data is housed within a secure, managed-access cloud environment that acts as a digital vault. Here, the data remains encrypted at rest, adding another robust layer of protection. Access to this vault is strictly controlled and requires passing through two distinct security checkpoints: authorized personnel must first connect through a dedicated Virtual Private Network (VPN) and then authenticate with a unique username and password.
Data Preprocessing Details
The full dataset comprised 437 breathprints. Each sample consisted of a multivariate time-series signal acquired from the NOZE aroma chip. The preprocessing pipeline included two key steps:
Time-Series Truncation: Each signal was truncated to a uniform length of 256 seconds. This window was empirically determined to capture the most information-rich portion of the sensor response, including breath-sampling and sensor-recovery phases, while standardizing input dimensions.
Ambient Normalization: To control for variability in ambient background VOCs, each sample was normalized to its own 30-second ambient-sampling period collected prior to breath breath-sampling. This allowed the model to focus on biologically relevant signal changes rather than environmental noise.
After preprocessing, the dataset was split into an 80% training set and a 20% test set. To prevent class imbalance and ensure generalizability, this partitioning was stratified by diagnostic category—including benign, malignant, and the three BI-RADS 4 subgroups—maintaining consistent outcome distributions across both subsets.
Model Architecture and Training Strategy
The predictive model employs an autoencoder-based early fusion architecture to integrate multi-modal data [
30,
31]. This architecture consists of encoder–decoder structures designed to compress and fuse the information content from two distinct modalities: (i) the multivariate breath time series and (ii) the participant's Breast Imaging-Reporting and Data System (BI-RADS) score. This fusion occurs within a shared latent vector space (Z). The decoders are tasked with reconstructing the original breath signal and the BI-RADS input from the latent vector, thereby ensuring that Z retains the essential features of the input data. Concurrently, a malignancy classifier learns to estimate the likelihood of malignancy using the same latent vector (z). Consequently, the latent space is optimally developed to represent the combined information content of the breath print and the BI-RADS score in direct relevance to the clinical objective of malignancy prediction.
The model's training objective minimizes a combined loss function that includes the standard reconstruction loss (ensuring accurate representation of the breath signal and BI-RADS score) and the classification loss.
To introduce a crucial clinical bias toward detection, the classification loss employs class-weighted cross-entropy, which selectively up-weights the malignant class during training.
The models are penalized overfitting by subtracting the training–validation performance gaps while they are optimized to maximize F₂-score that prioritizes sensitivity (recall) over precision with a ratio of 2.0 for sensitivity and 0.8 for precision given the dataset skewness towards the biopsy-confirmed benign cases. The coefficients are chosen empirically.
Training is conducted using the AdamW optimizer with a dynamic learning rate scheduler. Regularization strategies included dropout layers and early stopping based on validation loss. This combination of architecture and training logic allowed the model to prioritize clinical safety while maintaining generalizability across a real-world diagnostic population.
Model Validation Protocol
To obtain an unbiased and robust estimate of generalization performance, a multi-seed, nested cross-validation framework was employed. The full modeling pipeline was repeated 100 times, each with a different random seed to vary the dataset partitioning and model initialization. We employed 7-fold nested cross-validation within each run. This choice was made instead of the more standard 10-fold nested-cross-validation due to the limited sample size within specific classes and subgroups, as detailed in
Table 1, which necessitated the use of seven folds to ensure proper stratification. Specifically, the Biopsy-confirmed Breast Cancer group for BI-RADS 4A had only seven breathprints. This required seven folds to guarantee that each fold contained at least one breathprint from every category/class, allowing each sample to serve in the test set across multiple rotations for a comprehensive performance assessment. For each test fold, predictions were made using a committee of 6 independently trained models. Final classifications were determined by majority vote across the ensemble. To reflect a safety-oriented diagnostic approach, any tied votes defaulted to a “positive” (malignant) prediction. The final reported performance (e.g., sensitivity, specificity, F2-score) reflects the mean and standard deviation across the 100 complete runs. This approach prioritizes clinical safety and methodological rigor, reducing the likelihood that reported outcomes result from favorable partitioning or statistical noise.
References
- Caswell-Jin, J.L.; Sun, L.P.; Munoz, D.; Lu, Y.; Li, Y.; Huang, H.; Hampton, J.M.; Song, J.; Jayasekera, J.; Schechter, C.; et al. Analysis of Breast Cancer Mortality in the US-1975 to 2019. JAMA 2024, 331, 233–241. [Google Scholar] [CrossRef] [PubMed]
- Ellison, L.F.; Saint-Jacques, N. Five-Year Cancer Survival by Stage at Diagnosis in Canada. Health Rep. 2023, 34, 3–15. [Google Scholar]
- Sung, H.; Ferlay, J.; Siegel, R.L.; Laversanne, M.; Soerjomataram, I.; Jemal, A.; Bray, F. Global Cancer Statistics 2020: GLOBOCAN Estimates of Incidence and Mortality Worldwide for 36 Cancers in 185 Countries. CA Cancer J. Clin. 2021, 71, 209–249. [Google Scholar] [CrossRef]
- Liberman, L.; Menell, J.H. Breast Imaging Reporting and Data System (BI-RADS). Radiol. Clin. North Am. 2002, 40, 409–430. [Google Scholar] [CrossRef]
- Spak, D.A.; Plaxco, J.S.; Santiago, L.; Dryden, M.J.; Dogan, B.E. BI-RADS® Fifth Edition: A Summary of Changes. Diagn. Interv. Imaging 2017, 98, 179–190. [Google Scholar] [CrossRef]
- Elezaby, M.; Li, G.; Bhargavan-Chatfield, M.; Burnside, E.S.; DeMartini, W.B. ACR BI-RADS Assessment Category 4 Subdivisions in Diagnostic Mammography: Utilization and Outcomes in the National Mammography Database. Radiology 2018, 287, 416–422. [Google Scholar] [CrossRef]
- Liu, C.; Sun, M.; Arefan, D.; Zuley, M.; Sumkin, J.; Wu, S. Deep Learning of Mammogram Images to Reduce Unnecessary Breast Biopsies: A Preliminary Study. Breast Cancer Res. 2024, 26, 82. [Google Scholar] [CrossRef] [PubMed]
- Meng, M.; Li, H.; Zhang, M.; He, G.; Wang, L.; Shen, D. Reducing the Number of Unnecessary Biopsies for Mammographic BI-RADS 4 Lesions through a Deep Transfer Learning Method. BMC Med. Imaging 2023, 23, 82. [Google Scholar] [CrossRef] [PubMed]
- Shen, Y.; Shamout, F.E.; Oliver, J.R.; Witowski, J.; Kannan, K.; Park, J.; Wu, N.; Huddleston, C.; Wolfson, S.; Millet, A.; et al. Artificial Intelligence System Reduces False-Positive Findings in the Interpretation of Breast Ultrasound Exams. Nat. Commun. 2021, 12, 5645. [Google Scholar] [CrossRef]
- Miglioretti, D.L.; Abraham, L.; Sprague, B.L.; Lee, C.I.; Bissell, M.C.S.; Ho, T.-Q.H.; Bowles, E.J.A.; Henderson, L.M.; Hubbard, R.A.; Tosteson, A.N.A.; et al. Association between False-Positive Results and Return to Screening Mammography in the Breast Cancer Surveillance Consortium Cohort. Ann. Intern. Med. 2024, 177, 1297–1307. [Google Scholar] [CrossRef]
- Brodersen, J.; Siersma, V.D. Long-Term Psychosocial Consequences of False-Positive Screening Mammography. Ann. Fam. Med. 2013. [Google Scholar] [CrossRef]
- Chubak, J.; Boudreau, D.M.; Fishman, P.A.; Elmore, J.G. Cost of Breast-Related Care in the Year Following False Positive Screening Mammograms. Med. Care 2010, 48, 815–820. [Google Scholar] [CrossRef] [PubMed]
- Sun, X.; Shao, K.; Wang, T. Detection of Volatile Organic Compounds (VOCs) from Exhaled Breath as Noninvasive Methods for Cancer Diagnosis. Anal. Bioanal. Chem. 2016, 408, 2759–2780. [Google Scholar] [CrossRef] [PubMed]
- Leemans, M.; Bauër, P.; Cuzuel, V.; Audureau, E.; Fromantin, I. Volatile Organic Compounds Analysis as a Potential Novel Screening Tool for Breast Cancer: A Systematic Review. Biomark. Insights 2022, 17, 11772719221100709. [Google Scholar] [CrossRef] [PubMed]
- Yockell-Lelièvre, H.; Philip, R.; Kaushik, P.; Masilamani, A.; Meterissian, S. Breathomics: A Non-Invasive Approach for the Diagnosis of Breast Cancer. Bioengineering (Basel) 2025, 12. [Google Scholar] [CrossRef]
- Haworth, J.J.; Pitcher, C.K.; Ferrandino, G.; Hobson, A.R.; Pappan, K.L.; Lawson, J.L.D. Breathing New Life into Clinical Testing and Diagnostics: Perspectives on Volatile Biomarkers from Breath. Crit. Rev. Clin. Lab. Sci. 2022, 59, 353–372. [Google Scholar] [CrossRef]
- Nakhleh, M.K.; Haick, H.; Humbert, M.; Cohen-Kaminsky, S. Volatolomics of Breath as an Emerging Frontier in Pulmonary Arterial Hypertension. Eur. Respir. J. 2017, 49, 1601897. [Google Scholar] [CrossRef]
- Nakhleh, M.K.; Amal, H.; Jeries, R.; Broza, Y.Y.; Aboud, M.; Gharra, A.; Ivgi, H.; Khatib, S.; Badarneh, S.; Har-Shai, L.; et al. Diagnosis and Classification of 17 Diseases from 1404 Subjects via Pattern Analysis of Exhaled Molecules. ACS Nano 2017, 11, 112–125. [Google Scholar] [CrossRef]
- Rufo, J.C.; Madureira, J.; Fernandes, E.O.; Moreira, A. Volatile Organic Compounds in Asthma Diagnosis: A Systematic Review and Meta-Analysis. Allergy 2016, 71, 175–188. [Google Scholar]
- Van Berkel, J.J.B.N.; Dallinga, J.W.; Möller, G.M.; Godschalk, R.W.L.; Moonen, E.J.; Wouters, E.F.M.; Van Schooten, F.J. A Profile of Volatile Organic Compounds in Breath Discriminates COPD Patients from Controls. Respir. Med. 2010, 104, 557–563. [Google Scholar] [CrossRef]
- Dixit, K.; Fardindoost, S.; Ravishankara, A.; Tasnim, N.; Hoorfar, M. Exhaled Breath Analysis for Diabetes Diagnosis and Monitoring: Relevance, Challenges and Possibilities. Biosensors 2021, 11. [Google Scholar] [CrossRef]
- Buszewski, B.; Ulanowska, A.; Ligor, T.; Denderz, N.; Amann, A. Analysis of Exhaled Breath from Smokers, Passive Smokers and Non-Smokers by Solid-Phase Microextraction Gas Chromatography/mass Spectrometry. Biomed. Chromatogr. 2009, 23, 551–556. [Google Scholar] [CrossRef] [PubMed]
- Gravenstein, J.S.; Jaffe, M.B.; Gravenstein, N. (Eds.) ). , P.D. Capnography. 2011. [Google Scholar]
- Lourenço, C.; Turner, C. Breath Analysis in Disease Diagnosis: Methodological Considerations and Applications. Metabolites 2014, 4, 465–498. [Google Scholar] [CrossRef]
- Rahman, M.H.; Hooper, J.K.; Wardeh, A.; Masilamani, A.P.; Yockell-Lelièvre, H.; Ozhi Kandathil, J.; Khomami Abadi, M. Confounder-Invariant Representation Learning (CIRL) for Robust Olfaction with Scarce Aroma Sensor Data: Mitigating Humidity Effects in Breath Analysis. Sensors (Basel) 2025, 25, 6839. [Google Scholar] [CrossRef]
- Ryan, M.A.; Manatt, K.S.; Gluck, S.; Shevade, A.V.; Kisor, A.K.; Zhou, H.; Lara, L.M.; Homer, M.L. The JPL Electronic Nose: Monitoring Air in the U. In S. Lab on the International Space Station. In Proceedings of the 2010 IEEE Sensors; IEEE, November 2010; pp. 1242–1247. [Google Scholar]
- Cawley, G.C.; Talbot, N.L. On over-Fitting in Model Selection and Subsequent Selection Bias in Performance Evaluation. The Journal of Machine Learning Research 2010, 11, 2079–2107. [Google Scholar]
- Hinton, G.E.; Salakhutdinov, R.R. Reducing the Dimensionality of Data with Neural Networks. Science 2006, 313, 504–507. [Google Scholar] [CrossRef]
- Meterissian, S.H.; Abadi, M.K.; Wardeh, A.; Kaushik, P.; Philip, R.; Bassel, M.A.; Graham, G.; Masilamani, A. Breast Cancer Detection Using a Realtime Breath Analyzer: A Pilot Study. J. Clin. Oncol. 2025, 43. [Google Scholar] [CrossRef]
- Baltrušaitis, T.; Ahuja, C.; Morency, L.-P. Multimodal Machine Learning: A Survey and Taxonomy. arXiv [cs.LG].
- Huang, S.-C.; Pareek, A.; Seyyedi, S.; Banerjee, I.; Lungren, M.P. Fusion of Medical Imaging and Electronic Health Records Using Deep Learning: A Systematic Review and Implementation Guidelines. NPJ Digit. Med. 2020, 3, 136. [Google Scholar] [CrossRef]
|
Disclaimer/Publisher’s Note: The statements, opinions and data contained in all publications are solely those of the individual author(s) and contributor(s) and not of MDPI and/or the editor(s). MDPI and/or the editor(s) disclaim responsibility for any injury to people or property resulting from any ideas, methods, instructions or products referred to in the content. |
© 2025 by the authors. Licensee MDPI, Basel, Switzerland. This article is an open access article distributed under the terms and conditions of the Creative Commons Attribution (CC BY) license (http://creativecommons.org/licenses/by/4.0/).