
Submitted:
28 February 2025
Posted:
04 March 2025
You are already at the latest version
Abstract
Background: Breast cancer is the second leading cause of cancer-related mortality among women, accounting for 12% of cases. Early diagnosis, based on the identifica-tion of radiological features such as masses and microcalcifications in mammograms, is crucial for reducing mortality rates. However, manual interpretation by radiologists is complex and subject to variability, emphasizing the need for automated diagnostic tools to enhance accuracy and efficiency. This study compares a radiomics workflow based on machine learning (ML) with a deep learning (DL) approach for classifying breast lesions as benign or malignant. Methods: matRadiomics was used to extract ra-diomics features from mammographic images of 1,219 patients from the CBIS-DDSM public database, including 581 cases of microcalcifications and 638 of masses. Among the ML models, linear discriminant analysis (LDA) demonstrated the best performance for both lesion types. External validation was conducted on a private dataset of 222 images to evaluate generalizability to an independent cohort. Additionally, a deep learning approach based on the EfficientNetB6 model was employed for comparison. Results: The LDA model achieved a mean validation AUC of 68.28% for microcalcifica-tions and 61.53% for masses. In external validation, AUC values of 66.9% and 61.5% were obtained, respectively. In contrast, the EfficientNetB6 model demonstrated supe-rior performance, achieving an AUC of 81.52% for microcalcifications and 76.24% for masses, highlighting the potential of DL for improved diagnostic accuracy. Conclu-sions: This study underscores the limitations of ML-based radiomics in breast cancer diagnosis. Deep learning proves to be a more effective approach, offering enhanced accuracy and supporting clinicians in improving patient management.
Keywords:
Mammography
; Radiomics
; Deep learning
; Automated diagnostic systems
; Breast lesion classification
1. Introduction
Breast cancer is the most common malignancy among women worldwide, second only to lung cancer, affecting approximately 10–12% of the female population and causing around 500,000 deaths annually [1]. The highest incidence occurs in women aged 40–49 years (41%), with a lower prevalence in those over 71 (21%). Risk factors include genetic predisposition (e.g., BRCA1/BRCA2 mutations), lifestyle, prolonged hormone therapy, therapeutic radiation, and benign proliferative breast diseases [2]. Early stages are often asymptomatic, but initial signs may include hard lesions, breast shape alterations, nipple changes, or unexplained weight loss. Advancements in therapeutic strategies and screening programs have progressively reduced mortality rates. The World Health Organization (WHO) revised its 2003 classification to improve lesion characterization, distinguishing categories such as intraductal proliferative lesions, papillary lesions, mesenchymal and fibroepithelial tumours, and rarer malignancies like lymphomas and metastases [3,4]. Additionally, abnormalities such as masses and microcalcifications, while not strictly histological, are key mammographic indicators of breast cancer risk [5]. Accurate diagnosis begins with medical history, clinical examination, and imaging techniques. Mammography remains the gold standard for early detection, particularly in asymptomatic cases, but tissue overlap can hinder interpretation, leading to false positives or negatives [6,7,8]. To address these limitations, tomosynthesis provides a near 3D breast reconstruction, reducing tissue superimposition and improving lesion detection [9,10]. Ultrasound complements mammography by distinguishing solid from cystic formations, particularly in dense breast tissue, where mammography is less effective [11,12]. MRI further enhances sensitivity (up to 92%) but has lower specificity (~60%) due to challenges in lesion characterization [13,14]. The Breast Imaging Reporting and Data System (BI-RADS) ensures standardized reporting, aiding risk assessment and clinical decision-making [15]. Computer-aided diagnosis (CAD) systems refine mass classification, improving diagnostic precision [16]. Radiomics is gaining prominence for its ability to extract high-dimensional quantitative features (e.g., shape, texture, intensity) from medical images, correlating them with clinical outcomes [17,18,19,20]. The radiomics workflow includes image acquisition, preprocessing, tumour segmentation, feature extraction, and machine learning (ML)-based model development. Deep learning (DL) advancements have expanded radiomics applications, enabling predictive modelling for cancer prognosis and treatment response [21,22,23,24]. Convolutional neural networks (CNNs) have demonstrated high accuracy in cancer risk assessment and prognosis prediction [25,26].
This study evaluates a radiomics-based predictive workflow implemented using matRadiomics [27,28] integrating preprocessing techniques to enhance mammographic image quality. ML classifiers were tested for their ability to classify breast masses and microcalcifications, with a comparative analysis against the DL approach. A private dataset was used for external validation, emphasizing the importance of model generalization in breast lesion classification. By juxtaposing ML-based radiomics with DL, this research highlights the potential of advanced methodologies to improve the accuracy and reliability of diagnosis. By addressing key challenges such as methodological standardization and clinical applicability [29], this work contributes to the evolving role of image processing in automated breast cancer diagnosis.
2. Materials and Methods
This section outlines the tools and methodologies used for radiomics and DL analysis. The CBIS-DDSM database (Curated Breast Imaging Subset of Digital Database for Screening Mammography) [30] containing mammographic images and lesion segmentation masks, was used. The analysis used matRadiomics [31] with the integration of pre-processing techniques implemented specifically for this type of images. Furthermore, the EfficientNetB6 convolutional neural network was used to explore the potential of DL and compare it with traditional ML methods for lesion classification.
2.1. Datasets
2.1.1. Dataset for Internal Validation
The CBIS-DDSM database comprises mammographic images, available for public download from the Cancer Imaging Archive (TCIA), a repository of medical images of cancer. This dataset divided the images into microcalcifications (1,872 images) and masses (1,696 images), representing 753 and 891 patients, respectively. Among these 3,568 images, 2,111 cases are benign, while 1,457 are malignant. Each patient has multiple IDs corresponding to scans from different projections (e.g., craniocaudal -CC- or mediolateral oblique -MLO) and specific anomalies, identified by unique codes. For each patient, there are at least two series of images: a full mammogram and additional images highlighting the lesion, including a segmented region of interest (ROI) and a cropped image of the affected area. Some patients exhibit both types of anomalies. All images are in DICOM (Digital Imaging and Communications in Medicine) format with digital breast tomosynthesis extensions. The database includes comprehensive metadata in CSV files, detailing breast density (based on the BI-RADS system), breast side (left or right), image view (CC or MLO), anomaly identifiers, anomaly type (mass or calcification), and specific characteristics such as mass shape, calcification type, margins, distribution, BI-RADS assessment, pathology (benign or malignant), and anomaly subtlety (graded from 1 to 5). These details offer a rich dataset for exploring breast cancer imaging [30].
2.1.2. Dataset for External Validation
The external validation of the model was conducted using a database provided by the Fondazione Istituto “G. Giglio” of Cefalù. This dataset consists of 222 images from 180 patients, including 149 cases with calcifications and 73 with masses. It was utilized to assess the performance of the proposed radiomics workflow and validate the model in an independent setting, ensuring its generalizability beyond the training data. This retrospective study was approved by the local ethical review board.
2.2. Toolbox for Radiomics Analysis: matRadiomics
matRadiomics is a user-friendly, Image Biomarker Standardization Initiative (IBSI)-compliant framework designed to optimize and simplify the radiomics workflow in both clinical and preclinical contexts [27,28]. Built on MATLAB and Python, it integrates several powerful tools for medical image analysis, including the PyRadiomics library for feature extraction [32], ComBat for data harmonization [33], and various ML algorithms for predictive modeling. The platform supports the processing of medical images from different modalities, such as Positron Emission Tomography (PET) [34,35,36], CT (Computed Tomography) [37], and MRI (Magnetic Resonance Imaging) [38], and facilitates lesion classification and differentiation, including benign vs. malignant lesions. Key functionalities of matRadiomics include the ability to create and import radiomics studies, perform target segmentation, and extract radiomics features. To enhance image quality before feature extraction, we incorporated image preprocessing algorithms like Contrast Limited Adaptive Histogram Equalization (CLAHE) and Median Filter.
2.3. Preprocessing
Two preprocessing techniques were applied to improve mammographic image quality and optimize lesion classification: CLAHE and Median Filtering. These methods enhance image quality, leading to more accurate feature extraction and predictive modeling [39,40]. CLAHE effectively increases contrast in low-contrast mammographic images while minimizing noise amplification, whereas the Median Filter excels at noise reduction while preserving critical image structures, outperforming traditional mean filters [41].
Specifically, CLAHE is an advanced histogram equalization technique designed to enhance local contrast while preventing excessive noise amplification and artifacts in high-intensity regions. Unlike traditional histogram equalization, which operates on the entire image, CLAHE divides the image into small, non-overlapping tiles and computes a local histogram for each tile. The histogram is then clipped at a predefined limit to avoid over-amplification of certain intensity levels. After clipping, the modified histogram is normalized and used to remap pixel intensities, enhancing local contrast. To ensure smooth transitions between adjacent tiles and avoid visible artifacts at the edges, bilinear interpolation is applied, blending intensity values between neighboring regions. Additionally, a non-linear median filtering technique can be used to further refine contrast enhancement, particularly in the presence of impulsive noise, such as salt-and-pepper noise, while preserving important edge details [42].
The mathematical formulation of CLAHE is presented through the following steps::
- Histogram calculation for each tile:
- 2.
- Clip limit application:
where the sum of the pixel intensity values does not exceed the C threshold, limiting the number of occurrences.
- 3.
- Local equalization:
where is the intensity transformation in the tile and is the clipped histogram. The total sum of values is normalized so that the intensity is evenly distributed, improving contrast [43]. To avoid visible artifacts along the edges of adjacent regions, linear interpolation is applied between tiles, ensuring smooth transitions. In addition, taking into account the characteristics of the images and the noise that often degrading visual quality and obscuring critical details, among denoising techniques emerges the median filter, particularly effective for removing impulsive noise, while preserving edges and fine details. Unlike linear filters, which average pixel values and may blur edges, the median filter operates non-linearly, replacing each pixel with the median value of its surrounding neighborhood. To formalize this process, consider a window of size NxN (e.g. 3x3) that slides across the image and the pixel values within that window. The median filter, or median(X) replaces the value of the pixel with the median of its neighbors in the window:
By selecting the median rather than the mean, this method effectively removes outlier values caused by noise, preventing excessive blurring and preserving the structural integrity of the image. Together, these preprocessing techniques enhance image contrast and reduce noise, highlighting areas of interest while maintaining the integrity of the image's structural details [44].
2.4. Radiomics Features
Radiomics features are quantitative attributes extracted from medical images, providing critical insights into tissue properties and lesion morphology. These features, derived through advanced algorithms, form the implementation of predictive and diagnostic models, making their selection essential for improving accuracy and reliability in radiomics, [45,46]. Radiomics features are typically classified into three categories:
- First-order features describe the intensity distribution within the region of interest (ROI), including metrics such as mean, standard deviation, skewness, and kurtosis.
- Second-order features analyze texture by assessing the spatial relationships between voxel intensities, capturing patterns that reflect tissue heterogeneity.
- Shape features define the geometry and morphology of the ROI, including volume, surface area, and sphericity. These are particularly useful for distinguishing lesions, as benign ones tend to be more regular, while malignant ones often exhibit irregular shapes.
2.4.1. Feature Extraction
In this study, the workflow was carefully designed to maximize feature diversity and discriminative power. Three image transformations were applied—Original, Wavelet, and LoG (Laplacian of Gaussian)—to capture a broader range of structural details. While original images preserve raw data, wavelet transformations decompose images into low- and high-frequency components, enhancing fine textures. LoG filtering improves edge detection and highlights local intensity variations, aiding in the identification of subtle patterns. To balance texture preservation and noise reduction, discretization was set to 64 bins, a value supported by previous studies as an effective trade-off [47].
2.4.2. Feature Selection
Feature selection is a crucial step in the radiomics pipeline, reducing redundancy and non-informative features to enhance model performance, lower computational costs, and improve generalization [48,49,50]. Common approaches include filter, wrapper, and embedded methods [51,52]. In this study, we used the mixed descriptive-inferential sequential approach as described in [53]. For each feature, the point biserial correlation (PBC) index between features and the dichotomic outcome was calculated, sorting the features in PBC descending order. The PBC ranks features based on their correlation with the binary target variable (e.g., benign vs. malignant tumors). It serves as a pre-filtering step, ordering features by correlation strength before stepwise logistic regression selects the most relevant ones. This approach is particularly effective in high-dimensional datasets with non-standard distributions [54,55,56].
2.5. Machine Learning Predictive Models
The ML methods used in this work belong to the supervised learning category, in which there is a set of labeled training data (benign tumor labeled 1 and malignant tumor labeled 0) used to estimate or map the input data to the desired output. Based on matRadiomics, after the features selection process, Linear Discriminant Analysis (LDA) and Support Vector Machine (SVM) were used through k cross-validation.
2.5.1. Linear Discriminant Analysis
LDA is a statistical ML technique primarily used for supervised classification. The goal of LDA is to project high-dimensional data onto a lower-dimensional space while maximizing the separation between classes. Specifically, LDA identifies a projection direction that maximizes the separation between class means while minimizing the variance within each class.
LDA relies on two key scatter matrices:
- Within-class scatter matrix (Sw): measures the variance within each class and should be minimized for optimal classification.
- Between-class scatter matrix (Sb): measures the variance between class means and should be maximized.
The optimal projection direction will be the one that maximizes the ratio between the Sb and the Sw. It will be given by the following formula:
where and are the centroids of the various classes.
The Sw is found as:
The method is straightforward to implement and computationally efficient, making it a popular choice in many practical applications. By reducing the dimensionality of a dataset, LDA simplifies complex problems and helps in visualizing data in a two- or three-dimensional space. Additionally, the focus on maximizing the separation between classes ensures that LDA often provides robust performance for problems where the classes are well separated, and the underlying assumptions of normality and equal variance are satisfied. LDA is particularly effective in cases where the number of features is high compared to the number of samples, as it reduces the feature space to the most discriminative dimensions. Its mathematical foundation also provides clear interpretability, allowing practitioners to understand how the model achieves its classification decisions [57,58].
2.5.2. Support Vector Machine
SVM is a supervised learning algorithm primarily used for binary classification. Its objective is to identify a hyperplane that best separates the two classes by maximizing the margin, i.e. the minimum distance between the data points of each class and the hyperplane itself. This ensures that the classification is robust and less sensitive to small variations in the data [59].
A hyperplane can be described by the equation:
where w is the normal vector to the hyperplane, b is the bias, and x represents the data points. To find the optimal hyperplane, the aim is to solve the problem:
With the constraint:
where is plane normal vector, is the bias and are the labels of the data (+1 or -1).
After finding the hyperplane, a new point x is classified with:
2.6. Performance Metrics
The final step in radiomics analysis is assessing the trained model's performance in classifying mammographic lesions. This assessment relies on performance metrics that evaluate the model’s predictive accuracy and reliability. In this study, two critical metrics are examined: the Area Under the Curve (AUC) of Receiver Operator Characteristic (ROC) curve and Accuracy. These metrics are widely used in medical applications as they provide complementary insights into the classifier's ability to distinguish between classes and make reliable predictions. To understand these metrics, the starting point is the confusion matrix, which summarizes the classifier’s predictions against the true labels. The components of the confusion matrix are defined as follows:
- True Positives (TP): Positive examples correctly classified as positive.
- True Negatives (TN): Negative examples correctly classified as negative.
- False Positives (FP): Negative examples incorrectly classified as positive.
- False Negatives (FN): Positive examples incorrectly classified as negative.
From the confusion matrix, it is possible to calculate key rates such as the True Positive Rate (TPR) and False Positive Rate (FPR), which serve as the axes of the ROC curve. These two rates are described as follows:
Sensitivity, i.e. the TPR, that is the ratio between cases correctly classified as positive and all true positives and measures the ability of a model to correctly identify positives.
The False Positive Rate represents the x-axis of the ROC space and is the ratio between the negative classes classified as positive and the true negatives.
These rates define the ROC curve, where TPR is plotted against FPR at various classification thresholds. An ideal classifier would achieve TPR = 1 (perfect sensitivity) and FPR = 0 (no false positives), placing it in the top-left corner of the ROC space. To compare the performance of multiple classifiers and to summarize the performance of a classifier across all possible thresholds, the AUC is calculated, a numerical parameter that represents the classifier’s performance. AUC quantifies the overall ability of the classifier, its value ranges is [0; 1]:
- An AUC of 1 indicates perfect classification, where the model distinguishes all positive from negative instances.
- An AUC of 0 suggests a completely inverted classifier.
- An AUC of 0.5 indicates random guessing, with no predictive power.
Thus, the AUC provides a useful numerical summary of classifier performance, allowing for direct comparison across different models and thresholds. In addition, from the confusion matrix, it is possible to derive Total Actual Positives (P) and Total Actual Negatives (N):
These two metrics allow accuracy to be derived, as follows:
Accuracy represents the proportion of correctly classified instances among all observations and provides a measure of overall correctness, complementing the ROC curve and AUC. The choice of evaluation metrics depends on the clinical application. In this study, the primary goal is to determine whether a breast lesion is benign or malignant from a clinical decision support perspective. High sensitivity is crucial for the accurate identification of malignant cases, thereby minimizing false negatives. On the other hand, precision is especially important in situations with imbalanced datasets. Combining multiple metrics provides a more comprehensive evaluation of radiomics features and model effectiveness [60,61,62].
2.7. Deep Radiomics
In addition to the conventional radiomics workflow, a Deep Radiomics approach was implemented using the EfficientNetB6 convolutional neural network (CNN). The selection of EfficientNetB6 was motivated by its unique compound scaling capability, which optimizes the network’s depth, width, and resolution simultaneously. This joint scaling strategy enables EfficientNet to achieve an optimal trade-off between performance and resource efficiency, reducing the number of parameters and computational operations (measured as FLOPS) compared to traditional architectures such as ResNet. The foundational architecture of EfficientNet, known as EfficientNetB0, incorporates Mobile Inverted Bottleneck Convolutions (MBConv), a design optimized for computational efficiency. Additionally, it integrates Squeeze-and-Excitation (SE) blocks, which enhance the model's ability to capture relevant features by recalibrating channel-wise feature responses. These architectural innovations collectively improve both the accuracy and efficiency of the network. In this study, the EfficientNetB6 variant was chosen due to its balanced combination of computational complexity and predictive performance. Compared to other networks, EfficientNetB6 offers superior accuracy with a comparable number of parameters, making it particularly suitable for tasks that demand high performance without excessive computational cost. This balance is especially critical in medical imaging applications, where both precision and efficiency are paramount [63].
2.7.1. Implementation of EfficientnetB6
The EfficientNetB6 network was pre-trained on the ImageNet dataset to leverage optimized weights, enhancing generalization on smaller datasets. The adaptation process included two phases: transfer learning and fine-tuning. The original classification head of the pre-trained model was replaced with a custom head that included fully connected layers. During this phase, only the new head was trained, while the weights of the convolutional layers were kept frozen to retain the knowledge acquired during pre-training. In the fine-tuning phase, the entire model was refined. All weights, including those in the convolutional layers, were updated, allowing the model to adapt to the specific task while preserving the valuable features learned during the initial pre-training. In case of masses classification, the head was replaced with a Global Average Pooling operation, followed by a Dense Layer of 1024 neurons and RELU activation function, a Dropout layer (percentage = 0.3), and a final Dense Layer of 1 neuron and Sigmoid activation function. While, for calcifications classification, the head was replaced with a Global Average Pooling operation, followed by a Dense Layer of 256 neurons and RELU activation function, a Dropout layer (percentage = 0.3), and a final Dense Layer of 1 neuron and Sigmoid activation function.
2.7.2. Dataset Preparation for the Neural Network
The dataset used for training was derived from the CBIS-DDSM database, focusing exclusively on images containing masses. The following steps were applied: i) Images were cropped to 512x512 pixels using a bounding box to isolate the lesion of interest. Padding was applied using image values rather than zeros to retain critical information; ii) the same pre-processing techniques (CLAHE and Median Filtering) as in the classical radiomics workflow were used; iii) To mitigate overfitting due to limited sample size, augmentation techniques were applied with random probabilities:
- Horizontal and vertical flips.
- Random translations and rotations (±20°).
- Brightness and contrast adjustments.
- Gaussian filtering and elastic deformations.
2.7.3. Model Training Configuration
For masses classification the initial learning rate for the transfer phase was set to 1 × 10⁻⁴ and decreased to 1 × 10⁻⁷ by Polynomial Decay with power 0.9. Training was scheduled for a total of 50 epochs. During fine-tuning, initial learning rate was set to 5 × 10⁻⁶ and decreased to 1 × 10⁻⁸ by Polynomial Decay with power equal to 1. and training was scheduled for 20 epochs. For calcifications classification same settings were used except for the scheduled number of epochs during transfer and fine tuning, which were set both to 50.
Loss Function measures the extent to which a model's predictions differ from the desired output, and this deviation needs to be minimized during the training process. In this context, the loss function consists of two components [64,65].
Binary Cross-Entropy (BCE) represents a measure of error in binary classification problems and is based on a heavy penalty for incorrect forecasts. Its formulation is as follows:
where is the probability predicted by the model for class 1, is the label (0 or 1) and is the number of examples [66]. During Transfer learning and fine-tuning phases, Area Under Curve values were tracked and models were saved only when AUC improved to prevent overfitting. In this case the final models aro those based on maximum validation AUC. Models were trained leveraging Google Colab Pro+ resources, Python, Tensorflow and Keras libraries.
3. Results
This section presents the results of the breast lesion classification model based on matRadiomics. The evaluation was performed using stratified k-fold cross validation with k=10, and the percentage of data reserved for internal testing was set at 30% (Test set). The external validation was performed using the database of the Fondazione G. Giglio Institute in Cefalù. Finally, the results obtained through DL are also presented.
3.1. CBIS-DDSM Database
In this study the database used is the CBIS-DDSM, that contains mammographic images representative of the two types of lesions (mass and calcifications) accompanied by appropriate ROI masks, identifying the lesions. In particular, as regards calcifications, those masks that did not represent the lesion, for example that covered the entire breast, were excluded from the study. In Figure 1, an example of a mammographic image containing a microcalcification accompanied by its ROI mask and its cropped image is shown, while in Figure 2 there is a similar example, but with an image containing a mass.
3.2. Preprocessing
The results discussed in this section are based on the cascade application of the CLAHE method and the Median Filter. An example of implementation of these techniques on a mammographic image is shown in Figure 3.
3.3. Machine Learning-Based Radiomics
The selected features are fundamental in evaluating the effectiveness of the model implemented in matRadiomics. Analyzing these features provides insight into how the model operates during classification, identifying the most discriminative aspects of the images. As an initial step, the distinction between masses and calcifications was examined using the entire dataset, which includes 1,219 images (638 masses and 581 microcalcifications). Through PBC analysis, the shape feature original_shape2D_sphericity was identified as a key discriminative factor. This finding is particularly relevant, as it confirms that the model distinguishes lesions based on their shape—masses tend to be more rounded and spherical, whereas calcifications often appear elongated or thread-like.
The results presented in Table 1 highlight the strong differentiation capability of the LDA model, while Figure 4 illustrates the corresponding ROC curve (a) and accuracy metrics (b), further validating the model’s performance.
In the context of lesion classification, the model is designed to differentiate between benign and malignant cases. Compared to the previous task, the selected features evolve, reflecting the need for different types of information.
For masses, the key selected feature is wavelet_LL_firstorder_Energy, which is no longer related to shape but to texture. This shift indicates that the model requires more in-depth information beyond morphology, as benign and malignant masses often exhibit similar shapes. Texture analysis enables the detection of subtle variations in intensity distribution, thereby enhancing classification accuracy.
Conversely, for calcifications, the selected feature is original_shape2D_perimeter, emphasizing the role of shape in classification. This suggests that benign and malignant calcifications exhibit more pronounced morphological differences than masses, making perimeter a critical distinguishing factor.
Regarding masses, the LDA model achieved:
- -
- A mean validation ROC AUC of 61.53%,
- -
- A test ROC AUC of 67.14%,
- -
- A mean accuracy of 57.43%,
- -
- A test accuracy of 62.67% (see Figure 5).
For calcifications, the results were notably higher:
- -
- Mean validation ROC AUC: 68.28%,
- -
- Test ROC AUC: 75.81%,
- -
- Mean accuracy: 65.50%,
- -
- Test accuracy: 68% (see Figure 6).
For masses, the SVM model achieved:
- -
- Mean validation ROC AUC: 60.22%
- -
- Test ROC AUC: 66.7%
- -
- Mean accuracy: 57.14%
- -
- Test accuracy: 62% (see Figure 7).
For calcifications, the model performed better, with:
- -
- Mean validation ROC AUC: 63.26%
- -
- Test ROC AUC: 74.31%
- -
- Mean accuracy: 65.99%
- -
- Test accuracy: 68% (see Figure 8).
These results indicate that SVM struggles with mass classification, likely due to the similarity in morphological patterns between benign and malignant lesions. However, calcifications appear to be more effectively distinguished, reinforcing the idea that shape-related features play a crucial role in their classification.
3.4. Deep Learning
Through deep radiomics, performance metrics superior to those obtained with the traditional radiomics flow were obtained, confirming the power of CNN networks that work directly on images. As shown in Table 3 and Figure 10, DL masse classification resulted in an AUC of 81.52%, accuracy of 78%, recall of 66.70%, precision of 74.24% and F1-Score of 70.25%, while DL calcification classification resulted in an AUC of 76.24%, accuracy of 71.10%, recall of 85.78%, precision of 81.96%, F1-Score of 70.25%.
4. Discussion
This study aimed to compare a radiomics workflow based on ML with a DL approach for the differentiation and classification of breast lesions. In both cases, preprocessing techniques were applied to enhance lesion detection and classification accuracy [67] by reducing noise and artifacts. The adoption of radiomics aligns with recent advancements in automated diagnostic tools for medical imaging [68]. The results obtained from ML-based breast lesion classification showed suboptimal performance. The LDA model performed better than SVM with an average validation AUC of 68.28% for microcalcifications and 61.53% for masses. We employed a private dataset, offering an external validation framework to investigate the generalization to independent cohorts. In this case, an AUC of 66.9% and 61.5% were obtained, respectively. However, our results were notably lower compared to a study based on a different public dataset, in which the authors in [69] reported an AUC of 88% using LDA, with SVM providing slightly worse performance, as in our case. However, a direct comparison is not feasible due to the differences in datasets. Given the limitations observed in our study with traditional ML techniques, a second phase of development was undertaken to explore the potential of DL models. This phase aimed to determine whether advanced neural networks could enhance classification performance in distinguishing between benign and malignant lesions. In this context, the EfficientNetB6 model outperformed the radiomics approach, demonstrating its potential for improved diagnostic accuracy, with an AUC of 81.52% and 76.24%, respectively.
In the literature, Gerbasi et al [70] achieved remarkable results in breast lesion classification using the same dataset (CBIS-DDSM), obtaining an AUC of 89% through a fully automated pipeline. Specifically, their approach, DeepMiCa, consisted of: (1) preprocessing of raw scans, (2) automatic patch-based semantic segmentation using a U-Net-based network, and (3) classification of detected lesions through a deep transfer-learning approach. The most significant difference compared to our work lies in the segmentation strategy. Unlike our study, DeepMiCa performed a new segmentation of the target lesions. Since CBIS-DDSM is a public dataset, many segmentations may contain substantial errors, negatively impacting classification performance. Future research efforts will be aimed at overcoming this limitation by automating the segmentation process. The study [71] proposes an advanced technique for breast cancer classification by combining a CNN with an enhanced metaheuristic optimization algorithm. To overcome existing limitations, the authors modified the Ant Colony Optimization (ACO) algorithm by integrating it with opposition-based learning (OBL), creating the Enhanced Ant Colony Optimization (EACO). This method was used to optimize hyperparameters in the CNN architecture, specifically combining ResNet101 with the EACO algorithm, resulting in the EACO–ResNet101 model. Experimental analyses conducted on the CBIS-DDSM dataset demonstrated that the proposed model achieved an accuracy of 98.63%, outperforming traditional methods. Finally, a hybrid system combining ResNet50 with SVM achieved an AUC of 98.46%, on a small subset of 330 cases of the CBIS-DDSM dataset demonstrating the potential of integrating deep learning with traditional machine learning approaches [72]. These findings underscore the potential of DL methodologies in enhancing diagnostic accuracy for breast cancer detection.
Given these considerations, future developments will focus on enhancing the radiomics pipeline by integrating DL models capable of leveraging raw imaging data directly. The use of EfficientNetB6 in forthcoming studies aims to explore the synergy between radiomics and neural networks, potentially improving classification accuracy while preserving the interpretability of handcrafted features. Moreover, incorporating image rotation, and multi-view image fusion could further optimize lesion characterization. Beyond preprocessing improvements, the adoption of ensemble learning techniques and more sophisticated feature selection strategies could significantly enhance classification robustness and reliability. The growing trend of hybrid models, which combine traditional ML with DL architectures, represents a promising direction for achieving higher diagnostic accuracy and clinical integration. Ultimately, while radiomics remains a powerful tool for lesion characterization, its full potential can be un-locked by bridging the gap between feature engineering and data-driven DL approaches. By refining the proposed workflow and incorporating state-of-the-art AI techniques, this research lays the groundwork for more accurate, reliable, and clinically applicable tools in breast cancer detection.
5. Conclusions
The proposed study highlights the significant potential of artificial intelligence models for breast lesion classification. Traditional models such as LDA and SVM have shown promising results. The use of a proprietary dataset has strengthened the model's generalizability, ensuring its clinical applicability. However, DL approaches promise to further improve classification accuracy and robustness, providing an exciting direction for future research with the potential to significantly enhance diagnostic tools in clinical settings.
Author Contributions
Conceptualization, A.S., F.B and M.D.; methodology, E.G and G.P.; software, E.G. and G.P.; validation, G.P.; formal analysis, E.G., D.N., N.L. and G.P.; investigation, E.G. and G.P.; resources, M.D., and D.N.; data curation, N.L.; writing—original draft, A.S., E.G., N.L. and G.P.; writing—review and editing, F.B. and M.D.; visualization, E.G., N.L. and G.P.; supervision, F.B., F.M., G.R. and I.D.; Project administration A.S., F.B, F.M., G.R., M.D. and I.D.; Funding acquisition F.B. All authors have read and agreed to the published version of the manuscript.
Funding
This research received no external funding.
Institutional Review Board Statement
The data used in this study was downloaded from a public database, so this study did not require the approval of the ethics committee.
Informed Consent Statement
Not applicable as the data used in this study was downloaded from a public database.
Data Availability Statement
Not applicable.
Conflicts of Interest
The authors declare no conflicts of interest.
References
- Benson, J.R.; Jatoi, I.; Keisch, M.; Esteva, F.J.; Makris, A.; Jordan, V.C. Early Breast Cancer. The Lancet 2009, 373, 1463–1479. [CrossRef]
- Carlson, R.W.; Allred, D.C.; Anderson, B.O.; Burstein, H.J.; Carter, W.B.; Edge, S.B.; Erban, J.K.; Farrar, W.B.; Forero, A.; Giordano, S.H.; et al. Invasive Breast Cancer. Journal of the National Comprehensive Cancer Network 2011, 9, 136–222. [CrossRef]
- Tan, P.H.; Ellis, I.; Allison, K.; Brogi, E.; Fox, S.B.; Lakhani, S.; Lazar, A.J.; Morris, E.A.; Sahin, A.; Salgado, R.; et al. The 2019 World Health Organization Classification of Tumours of the Breast. Histopathology 2020, 77, 181–185. [CrossRef]
- Muller, K.; Jorns, J.M.; Tozbikian, G. What’s New in Breast Pathology 2022: WHO 5th Edition and Biomarker Updates. J Pathol Transl Med 2022, 56, 170–171. [CrossRef]
- Kim, S.; Tran, T.X.M.; Song, H.; Park, B. Microcalcifications, Mammographic Breast Density, and Risk of Breast Cancer: A Cohort Study. Breast Cancer Research 2022, 24, 96. [CrossRef]
- Calisto, F.M.; Nunes, N.; Nascimento, J.C. BreastScreening. In Proceedings of the Proceedings of the International Conference on Advanced Visual Interfaces; ACM: New York, NY, USA, September 28 2020; pp. 1–5.
- Sternlicht, M.D. Key Stages in Mammary Gland Development: The Cues That Regulate Ductal Branching Morphogenesis. Breast Cancer Research 2005, 8, 201. [CrossRef]
- Biswas, S.K.; Banerjee, S.; Baker, G.W.; Kuo, C.-Y.; Chowdhury, I. The Mammary Gland: Basic Structure and Molecular Signaling during Development. Int J Mol Sci 2022, 23, 3883. [CrossRef]
- Gao, Y.; Moy, L.; Heller, S.L. Digital Breast Tomosynthesis: Update on Technology, Evidence, and Clinical Practice. RadioGraphics 2021, 41, 321–337. [CrossRef]
- Richman, I.B.; Long, J.B.; Hoag, J.R.; Upneja, A.; Hooley, R.; Xu, X.; Kunst, N.; Aminawung, J.A.; Kyanko, K.A.; Busch, S.H.; et al. Comparative Effectiveness of Digital Breast Tomosynthesis for Breast Cancer Screening Among Women 40-64 Years Old. JNCI: Journal of the National Cancer Institute 2021, 113, 1515–1522. [CrossRef]
- Wang, Y.; Li, Y.; Song, Y.; Chen, C.; Wang, Z.; Li, L.; Liu, M.; Liu, G.; Xu, Y.; Zhou, Y.; et al. Comparison of Ultrasound and Mammography for Early Diagnosis of Breast Cancer among Chinese Women with Suspected Breast Lesions: A Prospective Trial. Thorac Cancer 2022, 13, 3145–3151. [CrossRef]
- Lee, S.E.; Yoon, J.H.; Son, N.-H.; Han, K.; Moon, H.J. Screening in Patients With Dense Breasts: Comparison of Mammography, Artificial Intelligence, and Supplementary Ultrasound. American Journal of Roentgenology 2024, 222. [CrossRef]
- Chang, A.Y.; Joe, B.N. Breast MRI Finds More Invasive Cancers than Digital Breast Tomosynthesis in Women with Dense Breasts Undergoing Screening. Radiol Imaging Cancer 2020, 2, e204023. [CrossRef]
- Bancroft, A.; Santa Cruz, J.; Levett, K.; Nguyen, Q.D. Incidental Breast Hemangioma on Breast MRI: A Case Report. Cureus 2024. [CrossRef]
- Magny, S.J.; S.R.; K.A.L. Breast Imaging Reporting and Data System. National Library of Medicine 2023.
- Esposito, D.; Paternò, G.; Ricciardi, R.; Sarno, A.; Russo, P.; Mettivier, G. A Pre-Processing Tool to Increase Performance of Deep Learning-Based CAD in Digital Breast Tomosynthesis. Health Technol (Berl) 2024, 14, 81–91. [CrossRef]
- Balma, M.; Liberini, V.; Buschiazzo, A.; Racca, M.; Rizzo, A.; Nicolotti, D.G.; Laudicella, R.; Quartuccio, N.; Longo, M.; Perlo, G.; et al. The Role of Theragnostics in Breast Cancer: A Systematic Review of the Last 12 Years. Current Medical Imaging Formerly Current Medical Imaging Reviews 2023, 19, 817–831. [CrossRef]
- Laudicella, R.; Comelli, A.; Spataro, A.; Stefano, A.; Vento, A.; Liberini, V.; Popescu, C.; Arico, D.; Ippolito, M.; Burger, I.A. Response Prediction to PRRT in Progressing and Metastatic GEP-NET Undergoing Restaging 68Ga-DOTA PETICT: A Preliminary Multicenter Radiomics Study. In Proceedings of the JOURNAL OF NEUROENDOCRINOLOGY; WILEY 111 RIVER ST, HOBOKEN 07030-5774, NJ USA, 2021; Vol. 33, p. 189.
- Perniciano, A.; Loddo, A.; Di Ruberto, C.; Pes, B. Insights into Radiomics: Impact of Feature Selection and Classification. Multimed Tools Appl 2024, 1–27. [CrossRef]
- Marinov, S.; Buliev, I.; Cockmartin, L.; Bosmans, H.; Bliznakov, Z.; Mettivier, G.; Russo, P.; Bliznakova, K. Radiomics Software for Breast Imaging Optimization and Simulation Studies. Physica Medica 2021, 89, 114–128. [CrossRef]
- Najjar, R. Redefining Radiology: A Review of Artificial Intelligence Integration in Medical Imaging. Diagnostics 2023, 13, 2760. [CrossRef]
- Jha, A.K.; Mithun, S.; Sherkhane, U.B.; Dwivedi, P.; Puts, S.; Osong, B.; Traverso, A.; Purandare, N.; Wee, L.; Rangarajan, V.; et al. Emerging Role of Quantitative Imaging (Radiomics) and Artificial Intelligence in Precision Oncology. Explor Target Antitumor Ther 2023, 569–582. [CrossRef]
- Zhang, W.; Guo, Y.; Jin, Q. Radiomics and Its Feature Selection: A Review. Symmetry (Basel) 2023, 15, 1834. [CrossRef]
- Vial, A.; Stirling, D.; Field, M.; Ros, M.; Ritz, C.; Carolan, M.; Holloway, L.; Miller, A.A. The Role of Deep Learning and Radiomic Feature Extraction in Cancer-Specific Predictive Modelling: A Review. Transl Cancer Res 2018, 7, 803–816. [CrossRef]
- Carriero, A.; Groenhoff, L.; Vologina, E.; Basile, P.; Albera, M. Deep Learning in Breast Cancer Imaging: State of the Art and Recent Advancements in Early 2024. Diagnostics 2024, 14, 848. [CrossRef]
- Ferro, A.; Bottosso, M.; Dieci, M.V.; Scagliori, E.; Miglietta, F.; Aldegheri, V.; Bonanno, L.; Caumo, F.; Guarneri, V.; Griguolo, G.; et al. Clinical Applications of Radiomics and Deep Learning in Breast and Lung Cancer: A Narrative Literature Review on Current Evidence and Future Perspectives. Crit Rev Oncol Hematol 2024, 203, 104479. [CrossRef]
- Pasini, G.; Bini, F.; Russo, G.; Marinozzi, F.; Stefano, A. MatRadiomics: From Biomedical Image Visualization to Predictive Model Implementation; 2022; Vol. 13373 LNCS; ISBN 9783031133206.
- Bini, F.; Missori, E.; Pucci, G.; Pasini, G.; Marinozzi, F.; Forte, G.I.; Russo, G.; Stefano, A. Preclinical Implementation of MatRadiomics: A Case Study for Early Malformation Prediction in Zebrafish Model. J Imaging 2024, 10, 290. [CrossRef]
- Stefano, A. Challenges and Limitations in Applying Radiomics to PET Imaging: Possible Opportunities and Avenues for Research. Comput Biol Med 2024, 179, 108827. [CrossRef]
- Sawyer-Lee, R., G.F., H.A., & R.D. Curated Breast Imaging Subset of Digital Database for Screening Mammography (CBIS-DDSM). DataCite Commons 2016.
- Pasini, G.; Bini, F.; Russo, G.; Comelli, A.; Marinozzi, F.; Stefano, A. MatRadiomics: A Novel and Complete Radiomics Framework, from Image Visualization to Predictive Model. J Imaging 2022, 8. [CrossRef]
- Pyradiomics Documentation Release v3.0.Post5+gf06ac1d Pyradiomics Community. 2020.
- Horng, H.; Singh, A.; Yousefi, B.; Cohen, E.A.; Haghighi, B.; Katz, S.; Noël, P.B.; Shinohara, R.T.; Kontos, D. Generalized ComBat Harmonization Methods for Radiomic Features with Multi-Modal Distributions and Multiple Batch Effects. Sci Rep 2022, 12, 1–12. [CrossRef]
- Bauckneht, M.; Pasini, G.; Di Raimondo, T.; Russo, G.; Raffa, S.; Donegani, M.I.; Dubois, D.; Peñuela, L.; Sofia, L.; Celesti, G.; et al. [18F]PSMA-1007 PET/CT-Based Radiomics May Help Enhance the Interpretation of Bone Focal Uptakes in Hormone-Sensitive Prostate Cancer Patients. Eur J Nucl Med Mol Imaging 2025, 1–11. [CrossRef]
- Stefano, A.; Mantarro, C.; Richiusa, S.; Pasini, G.; Sabini, G.; Cosentino, S.; Ippolito, M.-S. Prediction of High Pathological Grade in Prostate Cancer Patients Undergoing [ 18 F]-PSMA PET/CT: A Preliminary Radiomics Study;
- Pasini, G.; Russo, G.; Mantarro, C.; Bini, F.; Richiusa, S.; Morgante, L.; Comelli, A.; Russo, G.I.; Sabini, M.G.; Cosentino, S.; et al. A Critical Analysis of the Robustness of Radiomics to Variations in Segmentation Methods in 18F-PSMA-1007 PET Images of Patients Affected by Prostate Cancer. Diagnostics 2023, 13. [CrossRef]
- Pasini, G.; Stefano, A.; Russo, G.; Comelli, A.; Marinozzi, F.; Bini, F. Phenotyping the Histopathological Subtypes of Non-Small-Cell Lung Carcinoma: How Beneficial Is Radiomics? Diagnostics 2023, 13. [CrossRef]
- Vernuccio, F.; Arnone, F.; Cannella, R.; Verro, B.; Comelli, A.; Agnello, F.; Stefano, A.; Gargano, R.; Rodolico, V.; Salvaggio, G.; et al. Diagnostic Performance of Qualitative and Radiomics Approach to Parotid Gland Tumors: Which Is the Added Benefit of Texture Analysis? British Journal of Radiology 2021, 94. [CrossRef]
- Sukassini, M.P.; V.T. Noise Removal Using Morphology and Median Filter Methods in Mammogram Images. In Proceedings of the The 3rd International Conference on Small & Medium Business; 2016.
- Nguyen, H.T.P.; C.Z.; N.K.; K.S.; S.N.; P.M. Pre-Processing Image Using Brightening, CLAHE and RETINEX. Electrical Engineering and Systems Science > Image and Video Processing 2020.
- Erwin Improving Retinal Image Quality Using the Contrast Stretching, Histogram Equalization, and CLAHE Methods with Median Filters. International Journal of Image, Graphics and Signal Processing 2020, 12, 30–41. [CrossRef]
- Pisano, E.D.; Zong, S.; Hemminger, B.M.; DeLuca, M.; Johnston, R.E.; Muller, K.; Braeuning, M.P.; Pizer, S.M. Contrast Limited Adaptive Histogram Equalization Image Processing to Improve the Detection of Simulated Spiculations in Dense Mammograms. J Digit Imaging 1998, 11, 193–200. [CrossRef]
- Sanagavarapu, S.; Sridhar, S.; Gopal, T.V. COVID-19 Identification in CLAHE Enhanced CT Scans with Class Imbalance Using Ensembled ResNets. In Proceedings of the 2021 IEEE International IOT, Electronics and Mechatronics Conference (IEMTRONICS); IEEE, April 21 2021; pp. 1–7.
- Gonzalez, R.C.; W.R.E. Digital Image Processing; 2009;
- Teng, X.; Wang, Y.; Nicol, A.J.; Ching, J.C.F.; Wong, E.K.Y.; Lam, K.T.C.; Zhang, J.; Lee, S.W.-Y.; Cai, J. Enhancing the Clinical Utility of Radiomics: Addressing the Challenges of Repeatability and Reproducibility in CT and MRI. Diagnostics 2024, 14, 1835. [CrossRef]
- Mayerhoefer, M.E.; Materka, A.; Langs, G.; Häggström, I.; Szczypiński, P.; Gibbs, P.; Cook, G. Introduction to Radiomics. Journal of Nuclear Medicine 2020, 61, 488–495. [CrossRef]
- van Griethuysen, J.J.M.; Fedorov, A.; Parmar, C.; Hosny, A.; Aucoin, N.; Narayan, V.; Beets-Tan, R.G.H.; Fillion-Robin, J.-C.; Pieper, S.; Aerts, H.J.W.L. Computational Radiomics System to Decode the Radiographic Phenotype. Cancer Res 2017, 77, e104–e107. [CrossRef]
- Rajpoot, C.S.; Sharma, G.; Gupta, P.; Dadheech, P.; Yahya, U.; Aneja, N. Feature Selection-Based Machine Learning Comparative Analysis for Predicting Breast Cancer. Applied Artificial Intelligence 2024, 38. [CrossRef]
- Antunes, A.R.; Matos, M.A.; Costa, L.A.; Rocha, A.M.A.C.; Braga, A.C. Feature Selection Optimization for Breast Cancer Diagnosis. In; 2021; pp. 492–506.
- Matharaarachchi, S.; Domaratzki, M.; Muthukumarana, S. Assessing Feature Selection Method Performance with Class Imbalance Data. Machine Learning with Applications 2021, 6, 100170. [CrossRef]
- Hong, S.; Hong, S.; Oh, E.; Lee, W.J.; Jeong, W.K.; Kim, K. Development of a Flexible Feature Selection Framework in Radiomics-Based Prediction Modeling: Assessment with Four Real-World Datasets. Sci Rep 2024, 14, 29297. [CrossRef]
- Li, Y.; Mansmann, U.; Du, S.; Hornung, R. Benchmark Study of Feature Selection Strategies for Multi-Omics Data. BMC Bioinformatics 2022, 23, 412. [CrossRef]
- Saeys, Y.; Inza, I.; Larrañaga, P. A Review of Feature Selection Techniques in Bioinformatics. Bioinformatics 2007, 23, 2507–2517. [CrossRef]
- Molina, L.C.; Belanche, L.; Nebot, A. Feature Selection Algorithms: A Survey and Experimental Evaluation. In Proceedings of the 2002 IEEE International Conference on Data Mining, 2002. Proceedings.; IEEE Comput. Soc; pp. 306–313.
- Barone, S.; Cannella, R.; Comelli, A.; Pellegrino, A.; Salvaggio, G.; Stefano, A.; Vernuccio, F. Hybrid Descriptive-inferential Method for Key Feature Selection in Prostate Cancer Radiomics. Appl Stoch Models Bus Ind 2021, 37, 961–972. [CrossRef]
- Guyon, I.; E.A. An Introduction of Variable and Feature Selection. CrossRef Listing of Deleted DOIs 2000, 1. [CrossRef]
- Comelli, A.; Stefano, A.; Bignardi, S.; Russo, G.; Sabini, M.G.; Ippolito, M.; Barone, S.; Yezzi, A. Active Contour Algorithm with Discriminant Analysis for Delineating Tumors in Positron Emission Tomography. Artif Intell Med 2019, 94, 67–78. [CrossRef]
- Adebiyi, M.O.; Arowolo, M.O.; Mshelia, M.D.; Olugbara, O.O. A Linear Discriminant Analysis and Classification Model for Breast Cancer Diagnosis. Applied Sciences 2022, 12, 11455. [CrossRef]
- Egwom, O.J.; Hassan, M.; Tanimu, J.J.; Hamada, M.; Ogar, O.M. An LDA–SVM Machine Learning Model for Breast Cancer Classification. BioMedInformatics 2022, 2, 345–358. [CrossRef]
- Carrington, A.M.; Manuel, D.G.; Fieguth, P.W.; Ramsay, T.; Osmani, V.; Wernly, B.; Bennett, C.; Hawken, S.; Magwood, O.; Sheikh, Y.; et al. Deep ROC Analysis and AUC as Balanced Average Accuracy, for Improved Classifier Selection, Audit and Explanation. IEEE Trans Pattern Anal Mach Intell 2023, 45, 329–341. [CrossRef]
- Fawcett, T. An Introduction to ROC Analysis. Pattern Recognit Lett 2006, 27, 861–874. [CrossRef]
- Hajian-Tilaki, K. Receiver Operating Characteristic (ROC) Curve Analysis for Medical Diagnostic Test Evaluation. Caspian J Intern Med 2013, 4, 627–635.
- Tan, M.; L.Q.V. EfficientNet: Rethinking Model Scaling for Convolutional Neural Networks. In Proceedings of the Proceedings of the 36th International Conference on Machine Learning, PMLR; 2019; pp. 6105–6114.
- Ding, Y. The Impact of Learning Rate Decay and Periodical Learning Rate Restart on Artificial Neural Network. In Proceedings of the 2021 2nd International Conference on Artificial Intelligence in Electronics Engineering; ACM: New York, NY, USA, January 15 2021; pp. 6–14.
- Mahmoud Smaida, M.; Y.S.; S.A.Y.B. Learning Rate Optimization in CNN for Accurate Ophthalmic Classification. International Journal of Innovative Technology and Exploring Engineering (IJITEE) 2021, 10.
- Zadeh, S.G.; Schmid, M. Bias in Cross-Entropy-Based Training of Deep Survival Networks. IEEE Trans Pattern Anal Mach Intell 2021, 43, 3126–3137. [CrossRef]
- Elahi, R.; N.M. An Updated Overview of Radiomics-Based Artificial Intelligence (AI) Methods in Breast Cancer Screening and Diagnosis. Electrical Engineering and Systems Science > Image and Video Processing 2024.
- Sierra-Franco, C.A.; Hurtado, J.; de A. Thomaz, V.; da Cruz, L.C.; Silva, S. V.; Silva-Calpa, G.F.M.; Raposo, A. Towards Automated Semantic Segmentation in Mammography Images for Enhanced Clinical Applications. Journal of Imaging Informatics in Medicine 2024. [CrossRef]
- Fusco, R.; Piccirillo, A.; Sansone, M.; Granata, V.; Rubulotta, M.R.; Petrosino, T.; Barretta, M.L.; Vallone, P.; Di Giacomo, R.; Esposito, E.; et al. Radiomics and Artificial Intelligence Analysis with Textural Metrics Extracted by Contrast-Enhanced Mammography in the Breast Lesions Classification. Diagnostics 2021, 11, 815. [CrossRef]
- Gerbasi, A.; Clementi, G.; Corsi, F.; Albasini, S.; Malovini, A.; Quaglini, S.; Bellazzi, R. DeepMiCa: Automatic Segmentation and Classification of Breast MIcroCAlcifications from Mammograms. Comput Methods Programs Biomed 2023, 235, 107483. [CrossRef]
- Thirumalaisamy, S.; Thangavilou, K.; Rajadurai, H.; Saidani, O.; Alturki, N.; Mathivanan, S. kumar; Jayagopal, P.; Gochhait, S. Breast Cancer Classification Using Synthesized Deep Learning Model with Metaheuristic Optimization Algorithm. Diagnostics 2023, 13, 2925. [CrossRef]
- Salama, W.M.; Elbagoury, A.M.; Aly, M.H. Novel Breast Cancer Classification Framework Based on Deep Learning. IET Image Process 2020, 14, 3254–3259. [CrossRef]
Figure 1.
(a) Full mammography showing microcalcification within the ROI - Patient P_00038, (b) ROI cropped image.
Figure 1.
(a) Full mammography showing microcalcification within the ROI - Patient P_00038, (b) ROI cropped image.
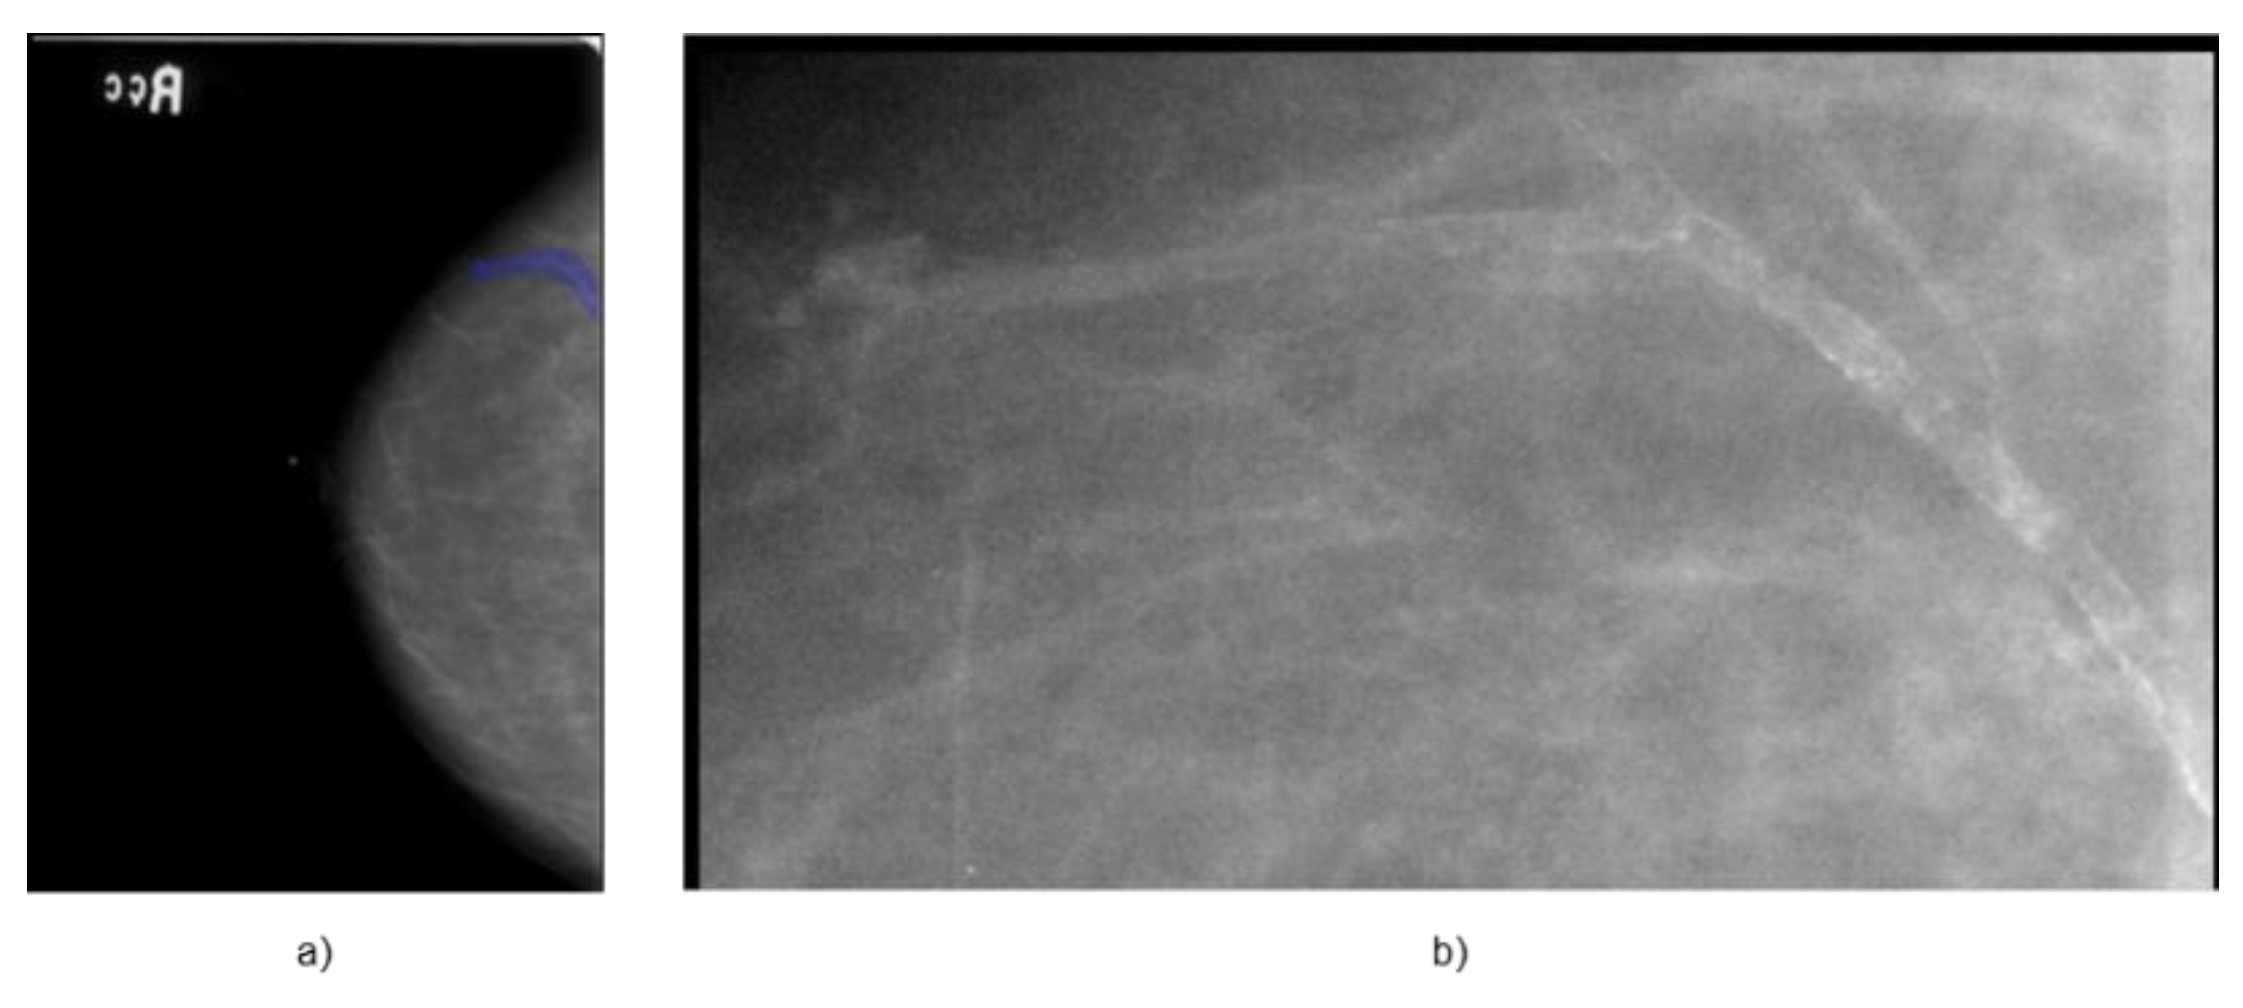
Figure 2.
(a) Full mammography showing mass within the ROI - Patient P_00612, (b) ROI cropped image.
Figure 2.
(a) Full mammography showing mass within the ROI - Patient P_00612, (b) ROI cropped image.
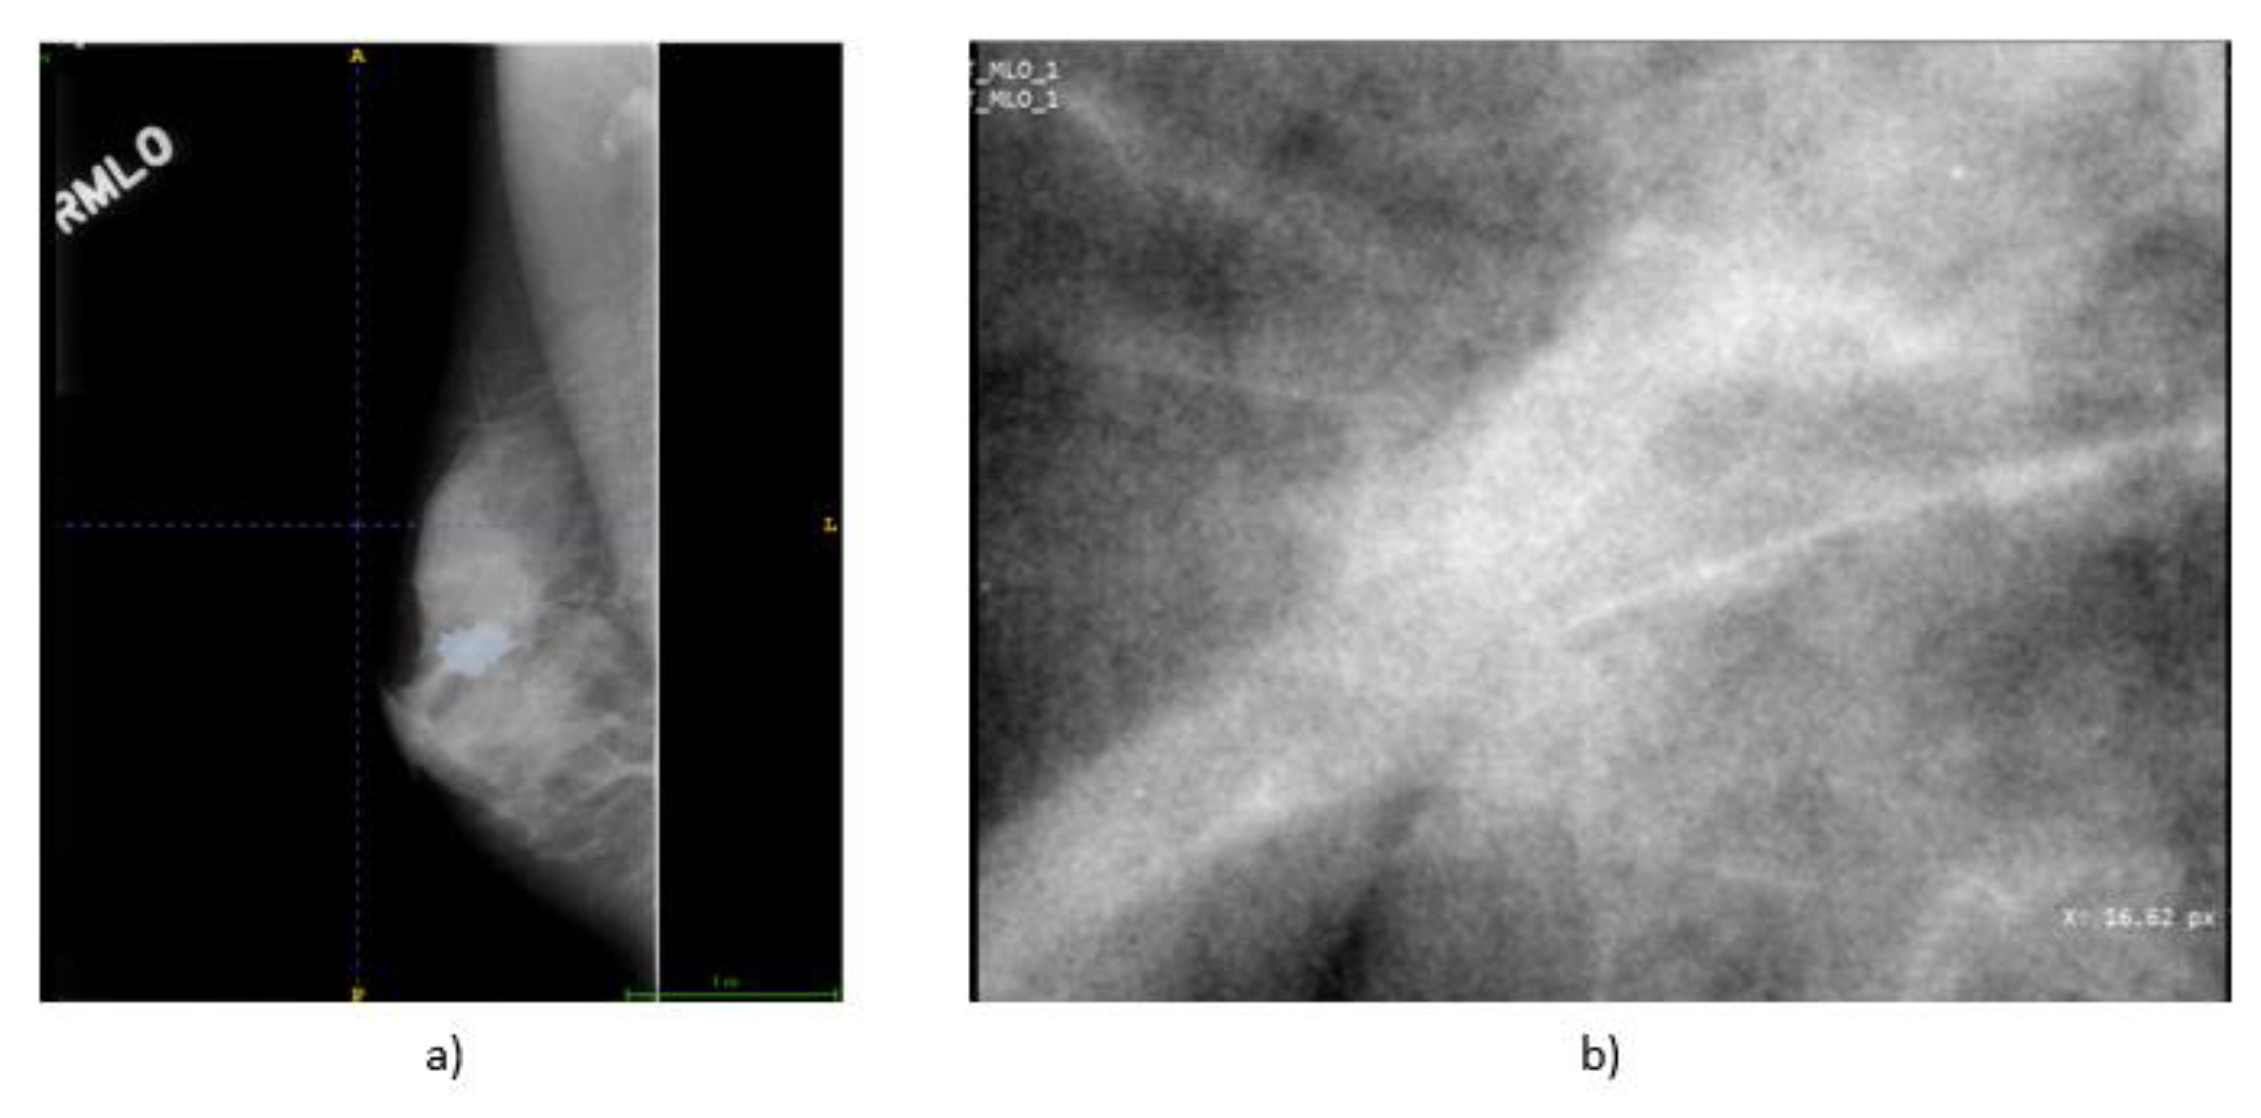
Figure 3.
Example of application of CLAHE and Median Filter in cascade on a mammographic image.
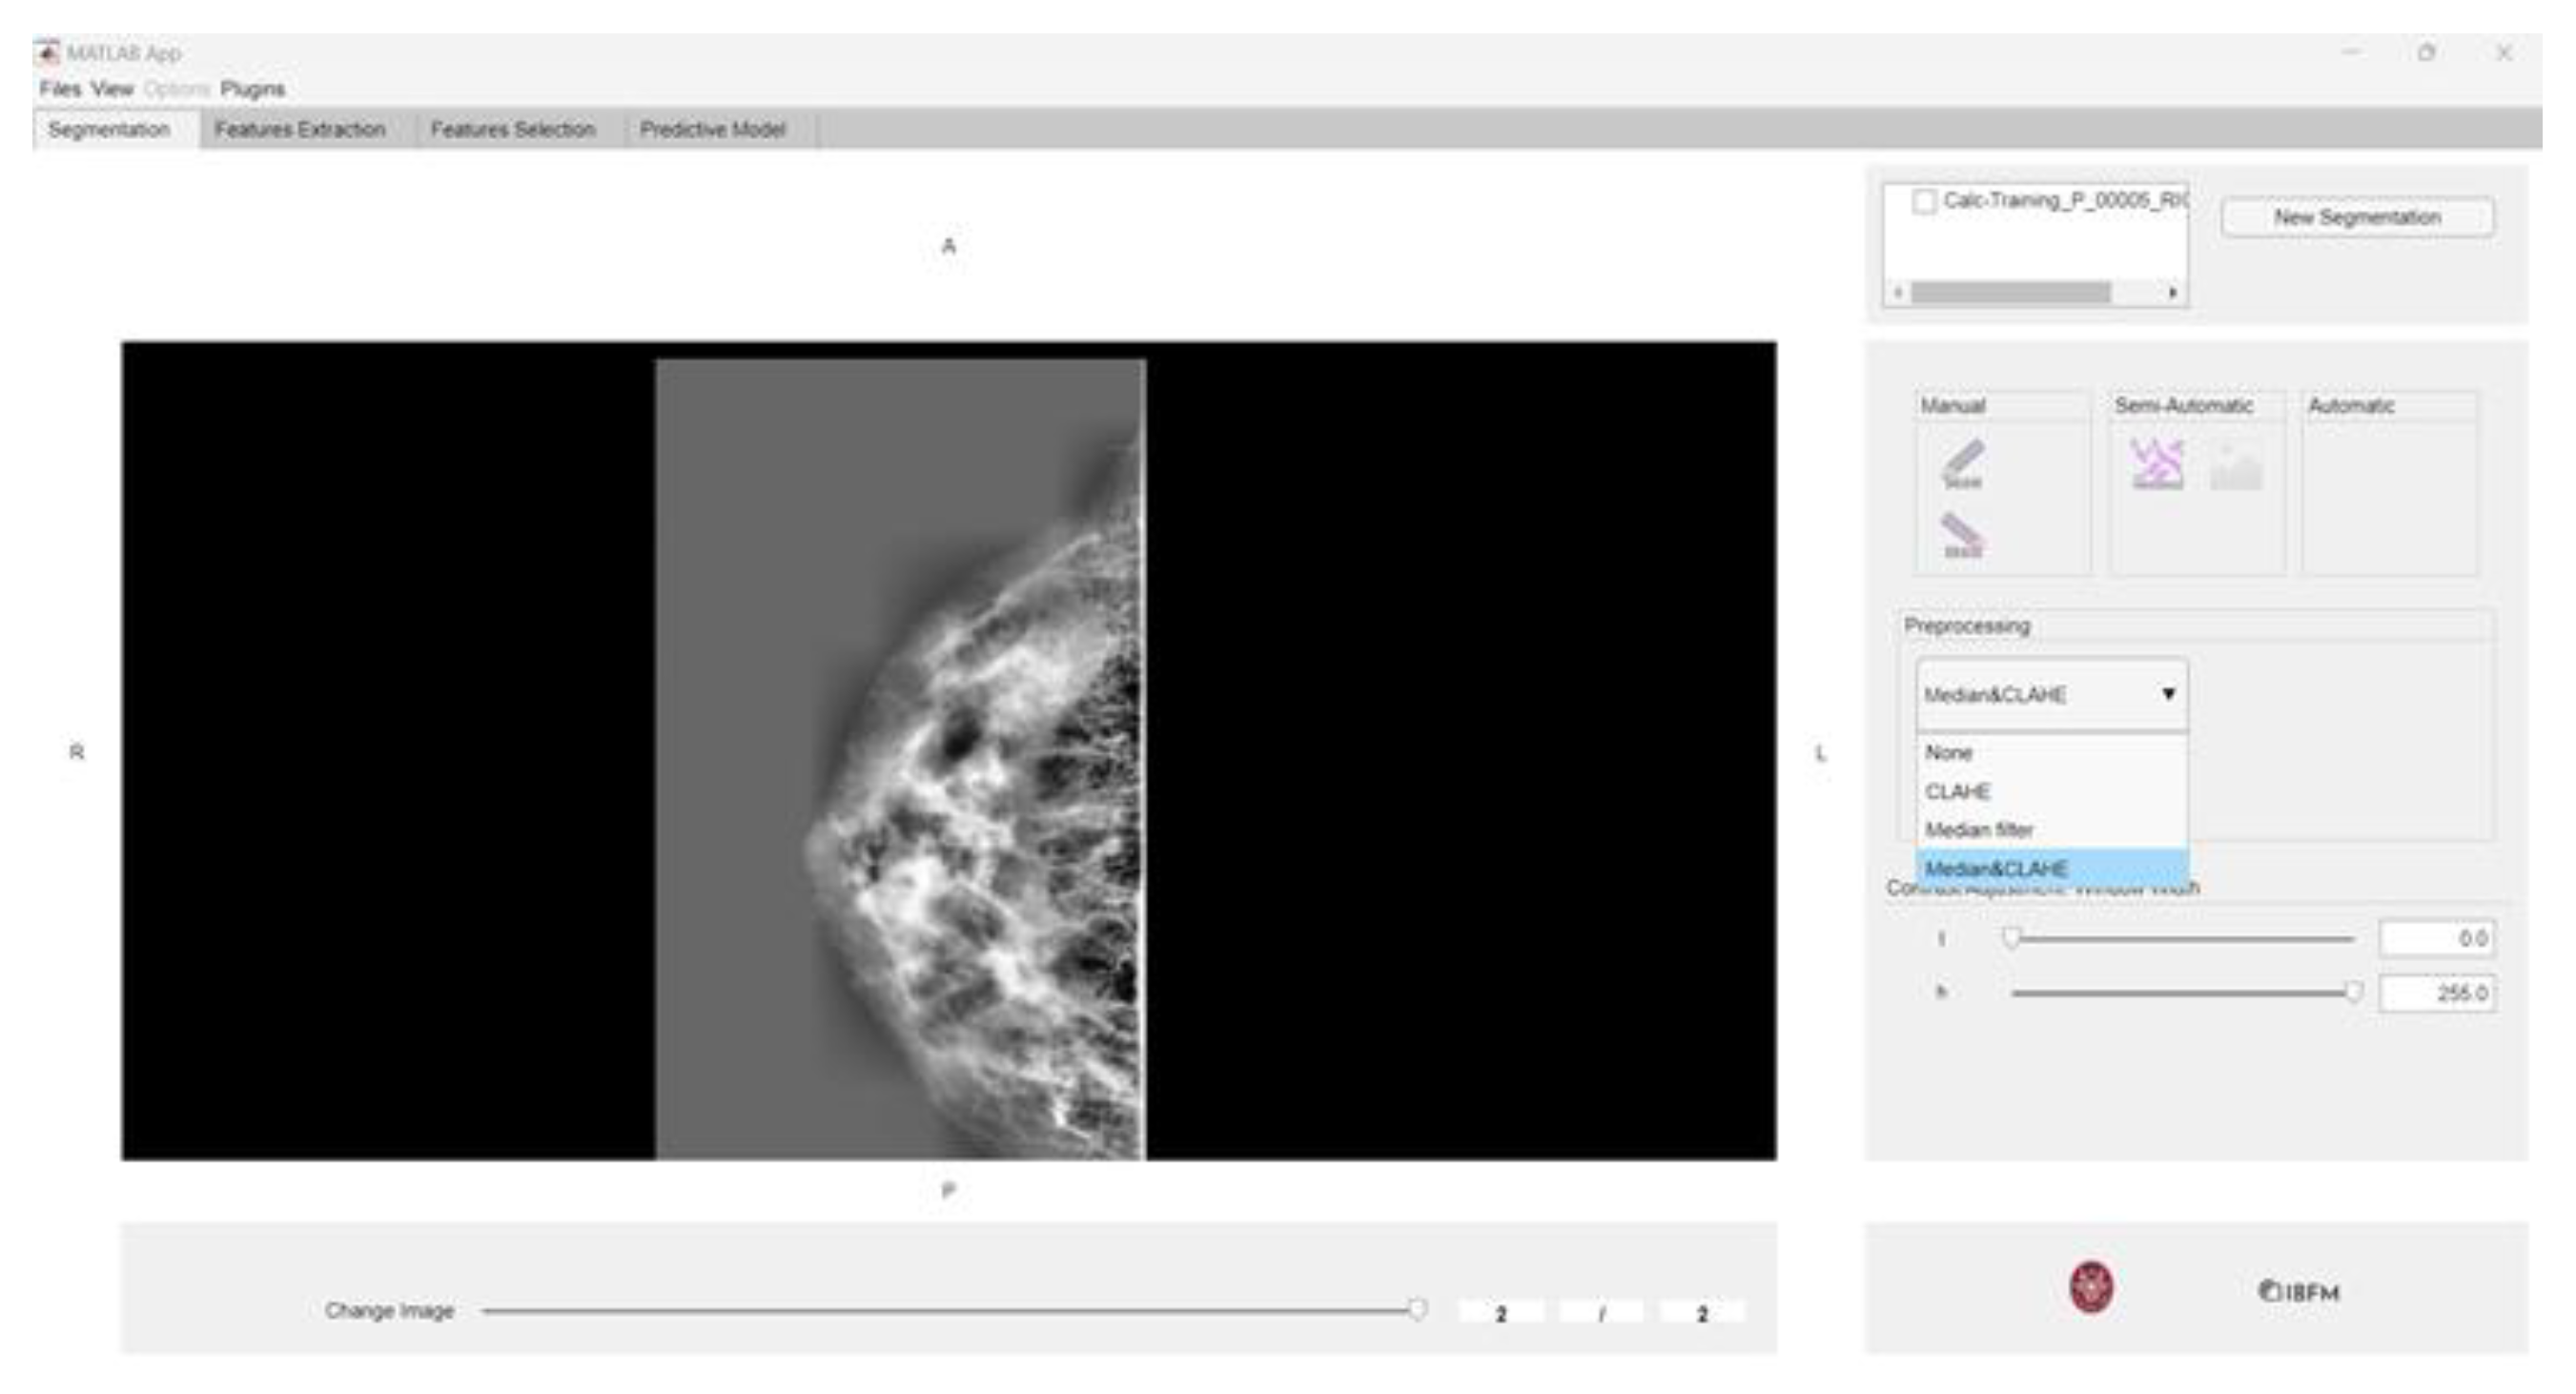
Figure 4.
Lesion differentiation task (a) ROC curve (b) Accuracies.
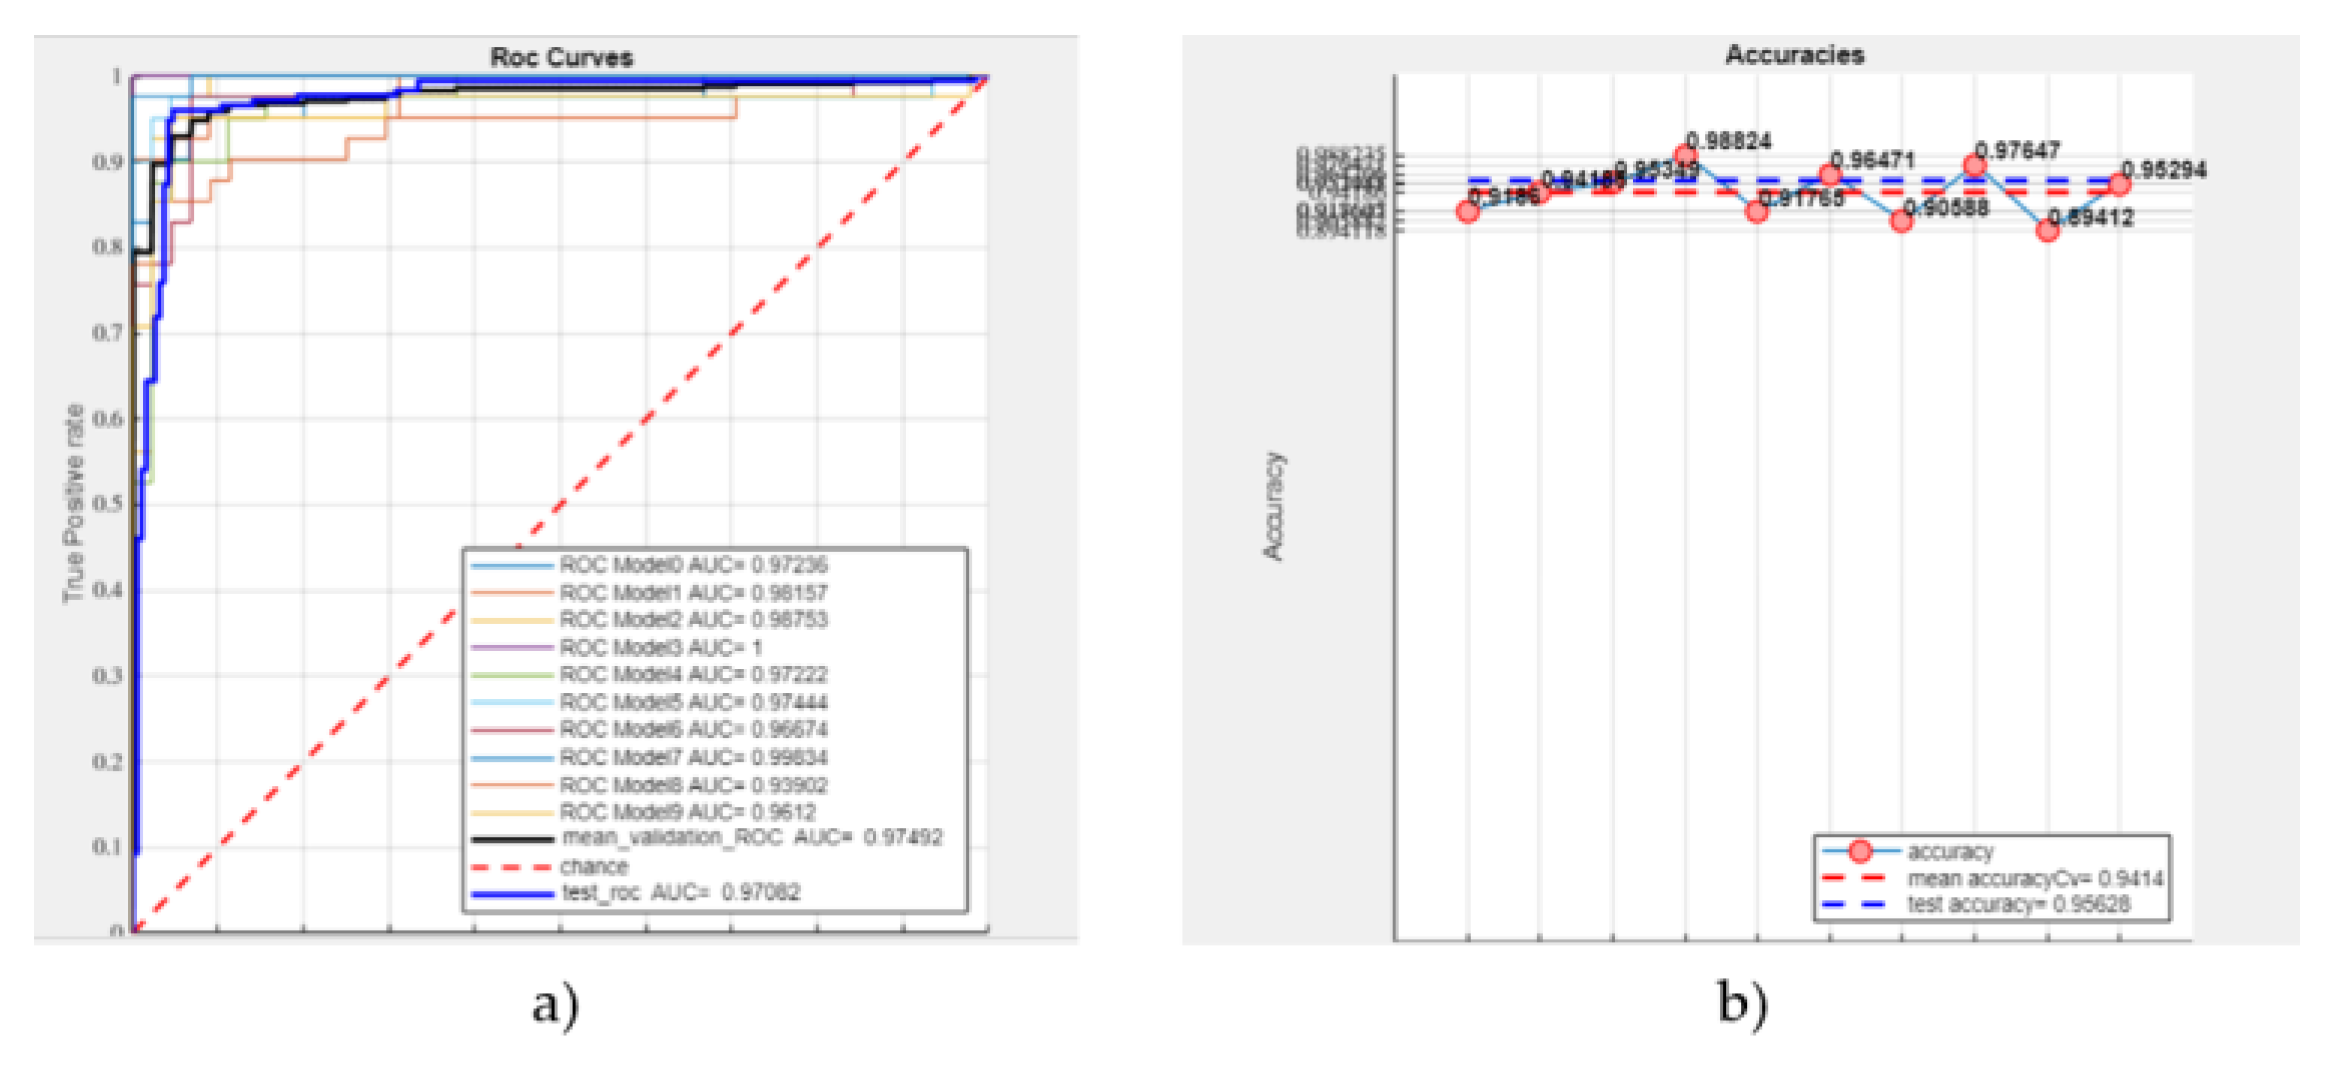
Figure 5.
LDA classification of masses: (a) ROC curve (b) Accuracies (sample: 638 masses).
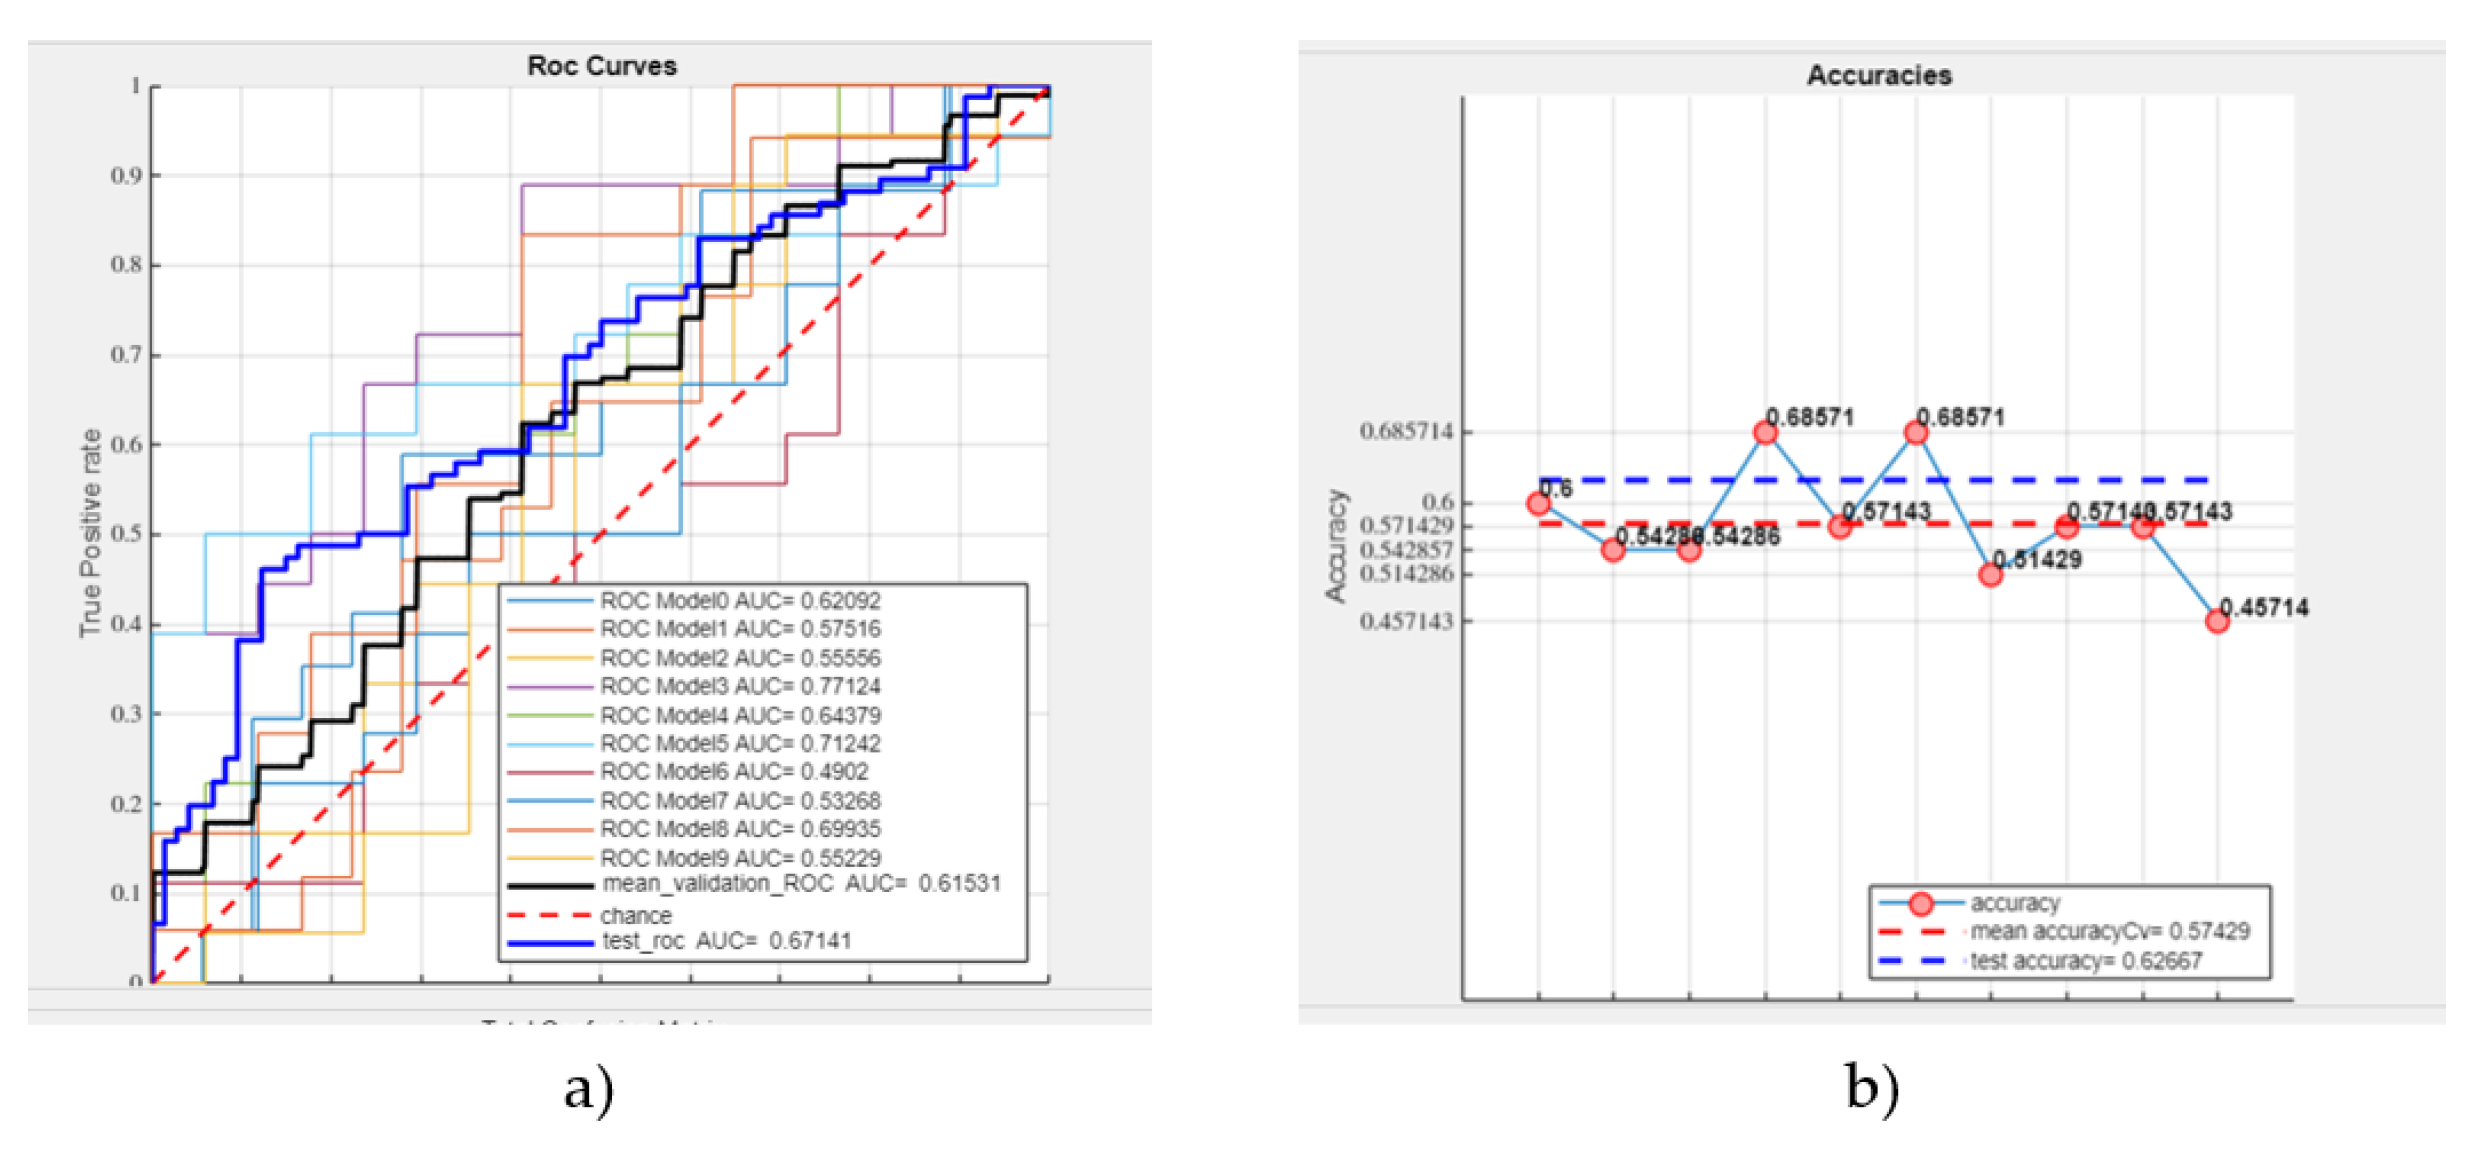
Figure 6.
LDA classification of calcifications: (a) ROC curve (b) Accuracies (sample: 581 calcifications).
Figure 6.
LDA classification of calcifications: (a) ROC curve (b) Accuracies (sample: 581 calcifications).
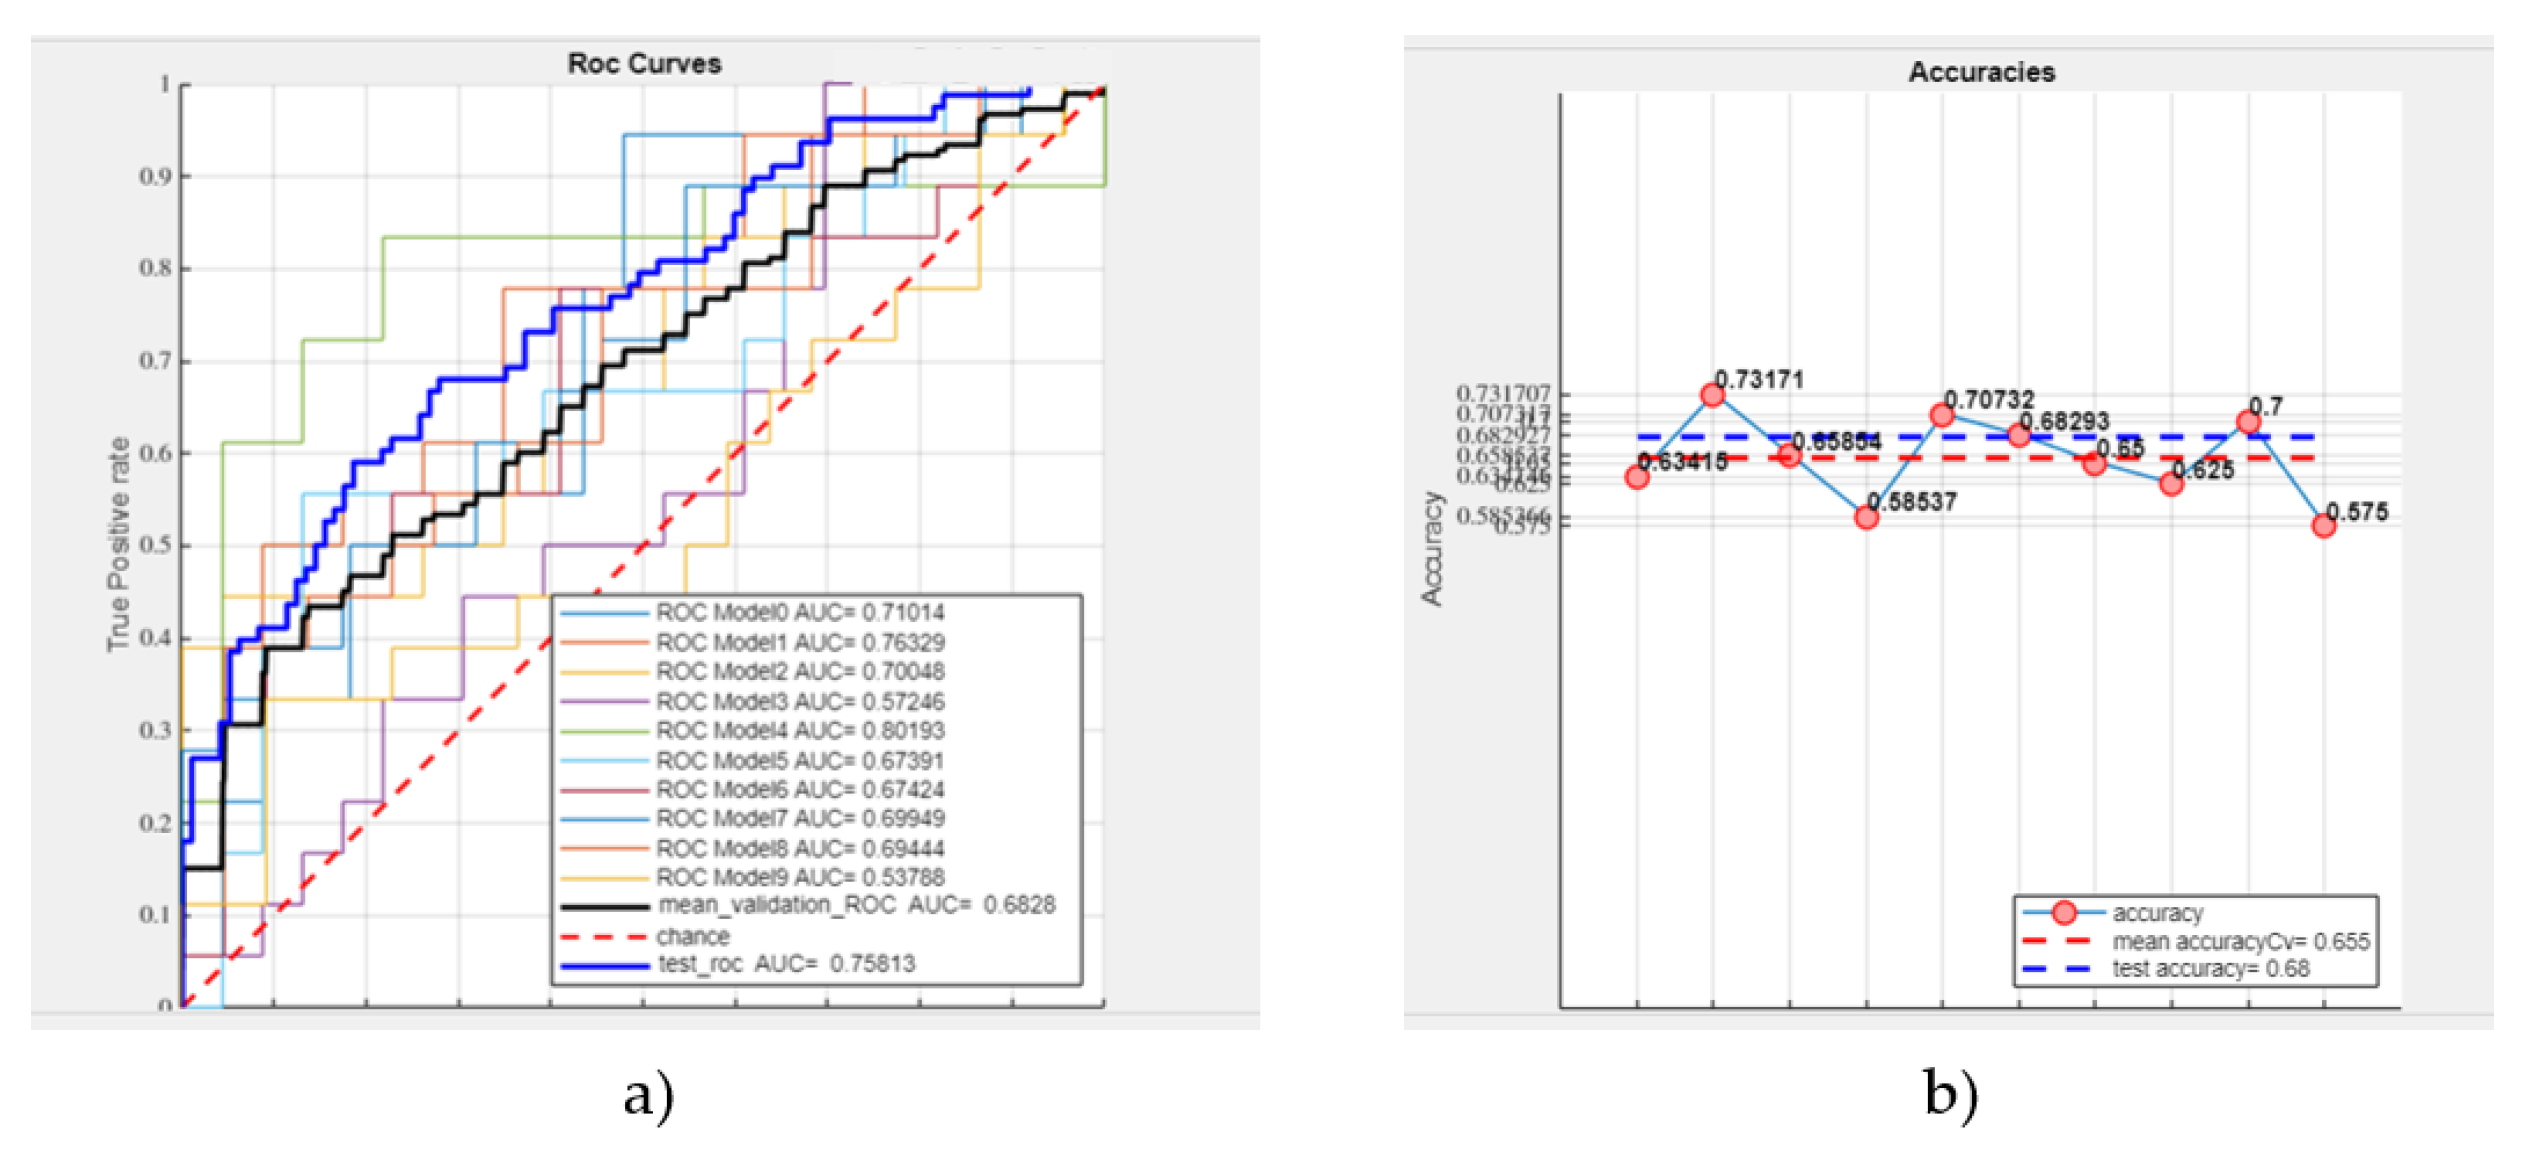
Figure 7.
SVM classification of masses: (a) ROC curve (b) Accuracies (sample: 638 masses).
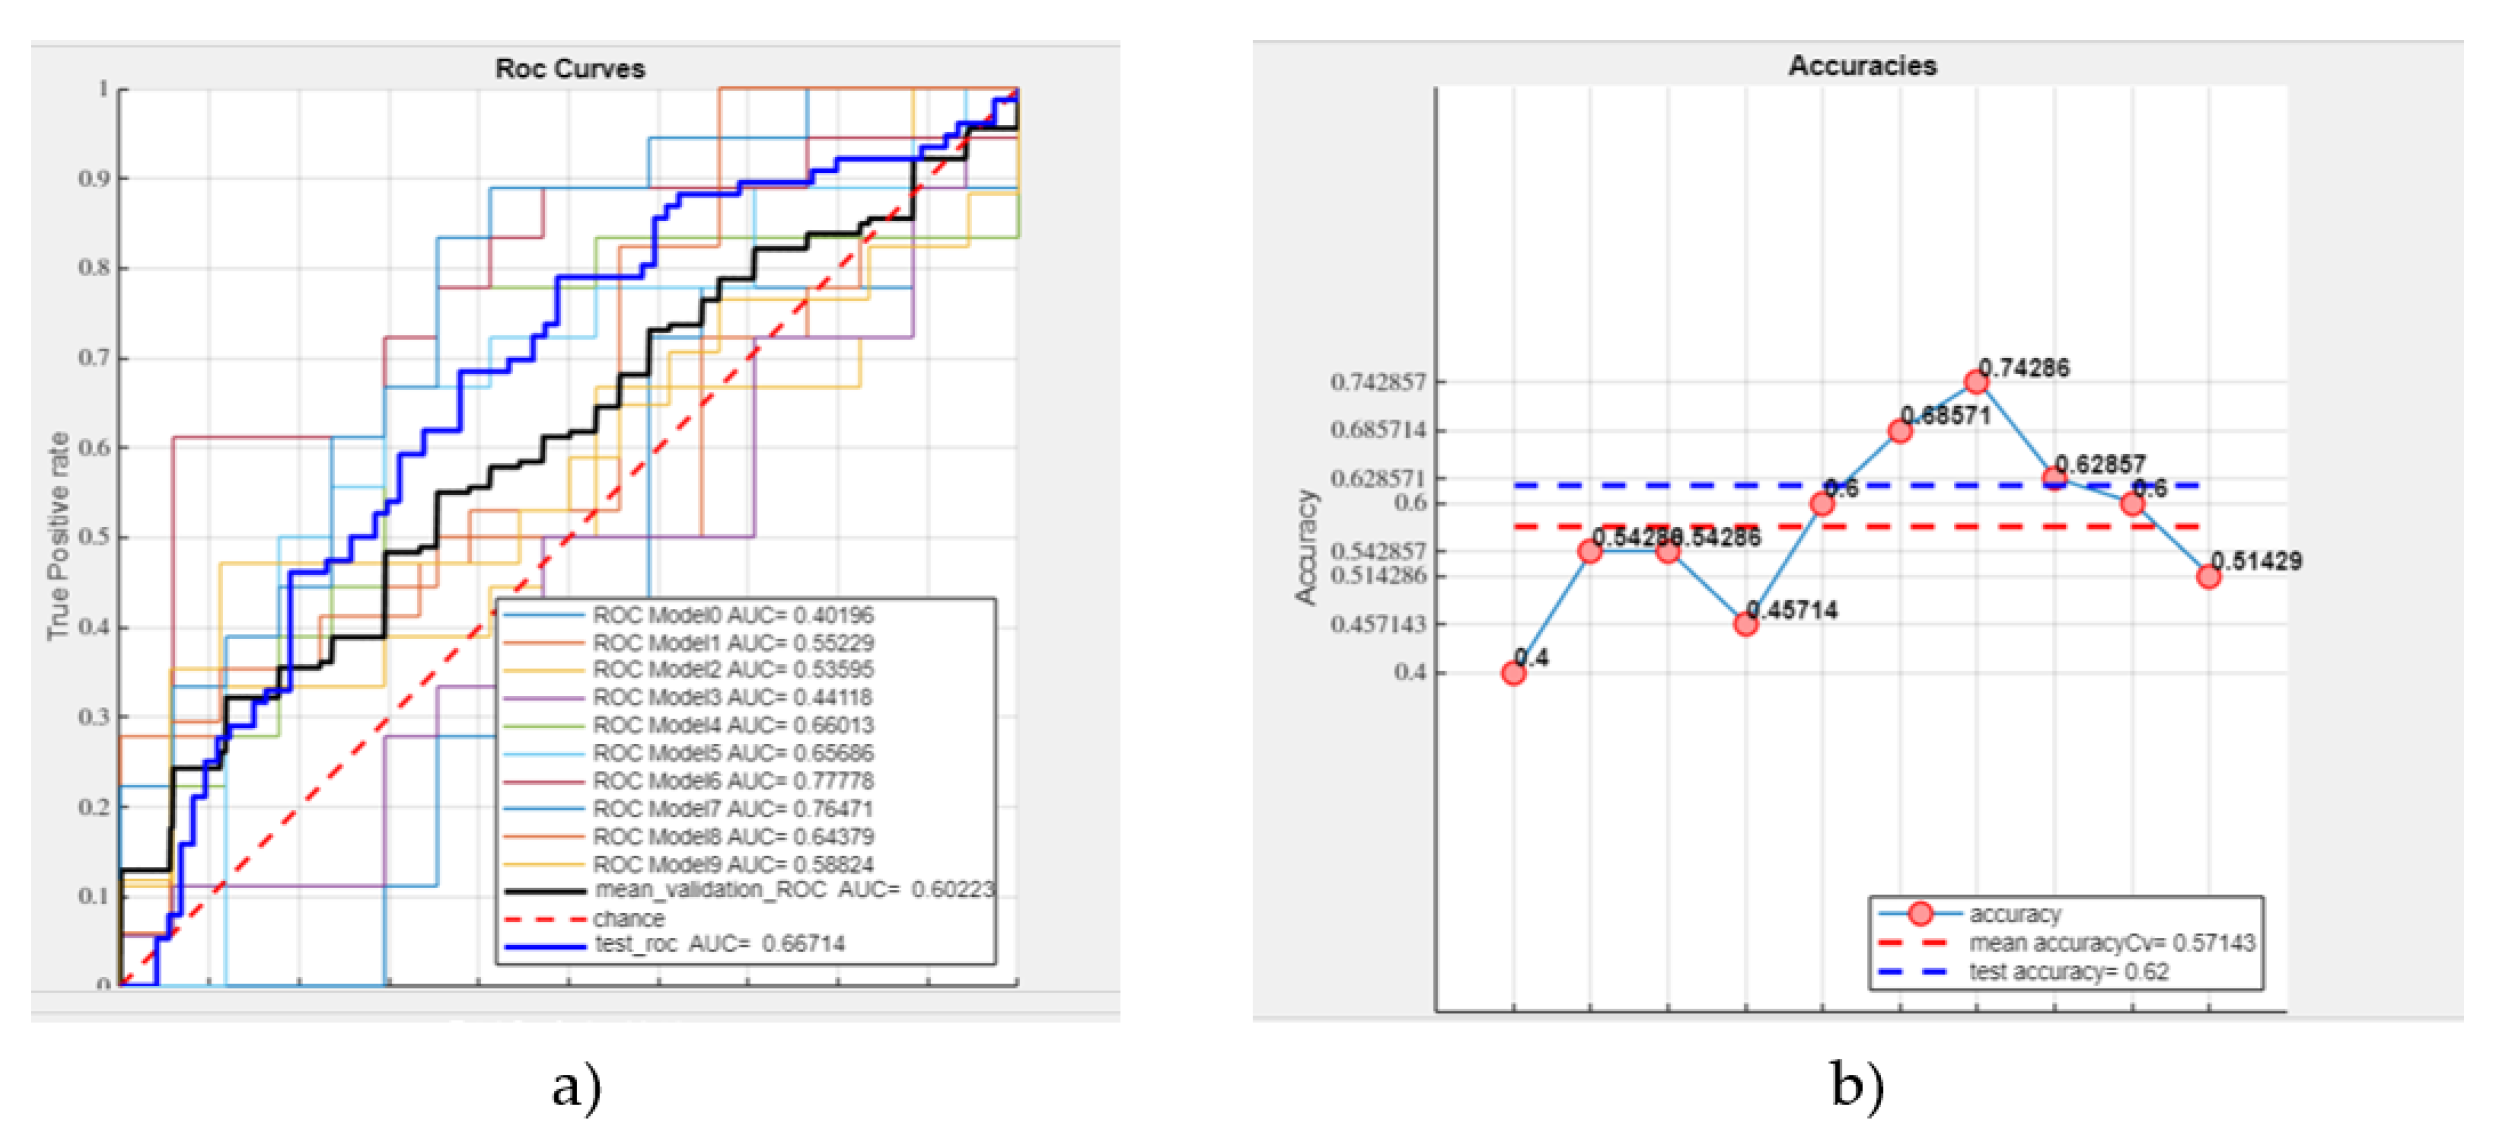
Figure 8.
SVM classification of microcalcifications (a) ROC curve (b) Accuracies (sample: 581 microcalcifications).
Figure 8.
SVM classification of microcalcifications (a) ROC curve (b) Accuracies (sample: 581 microcalcifications).
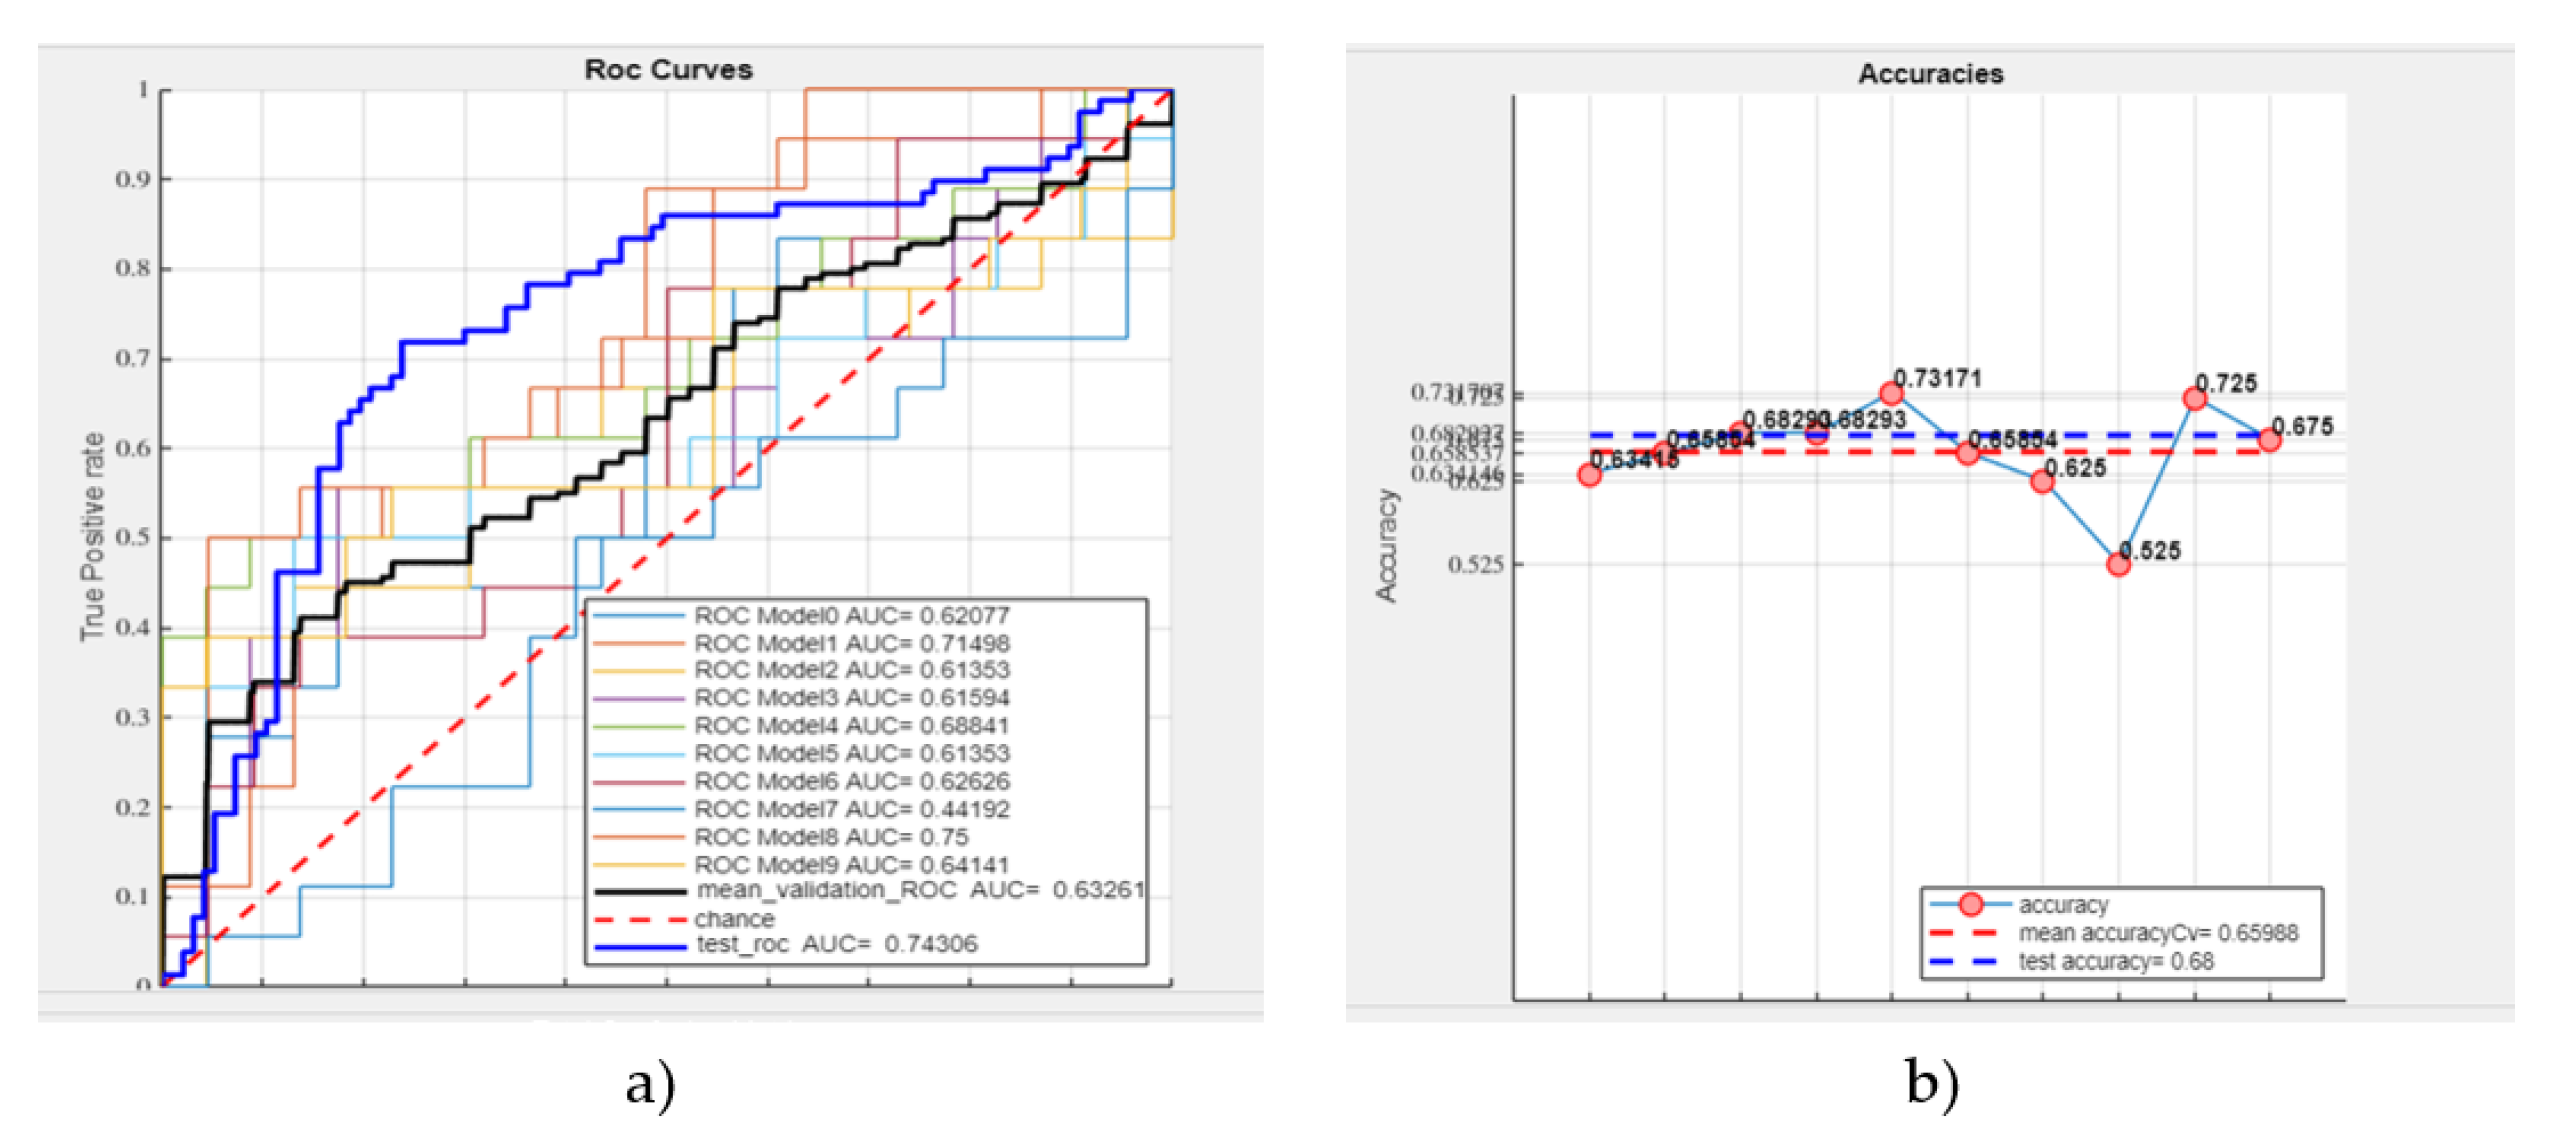
Figure 9.
External validation for (a) masses, and (b) calcifications.
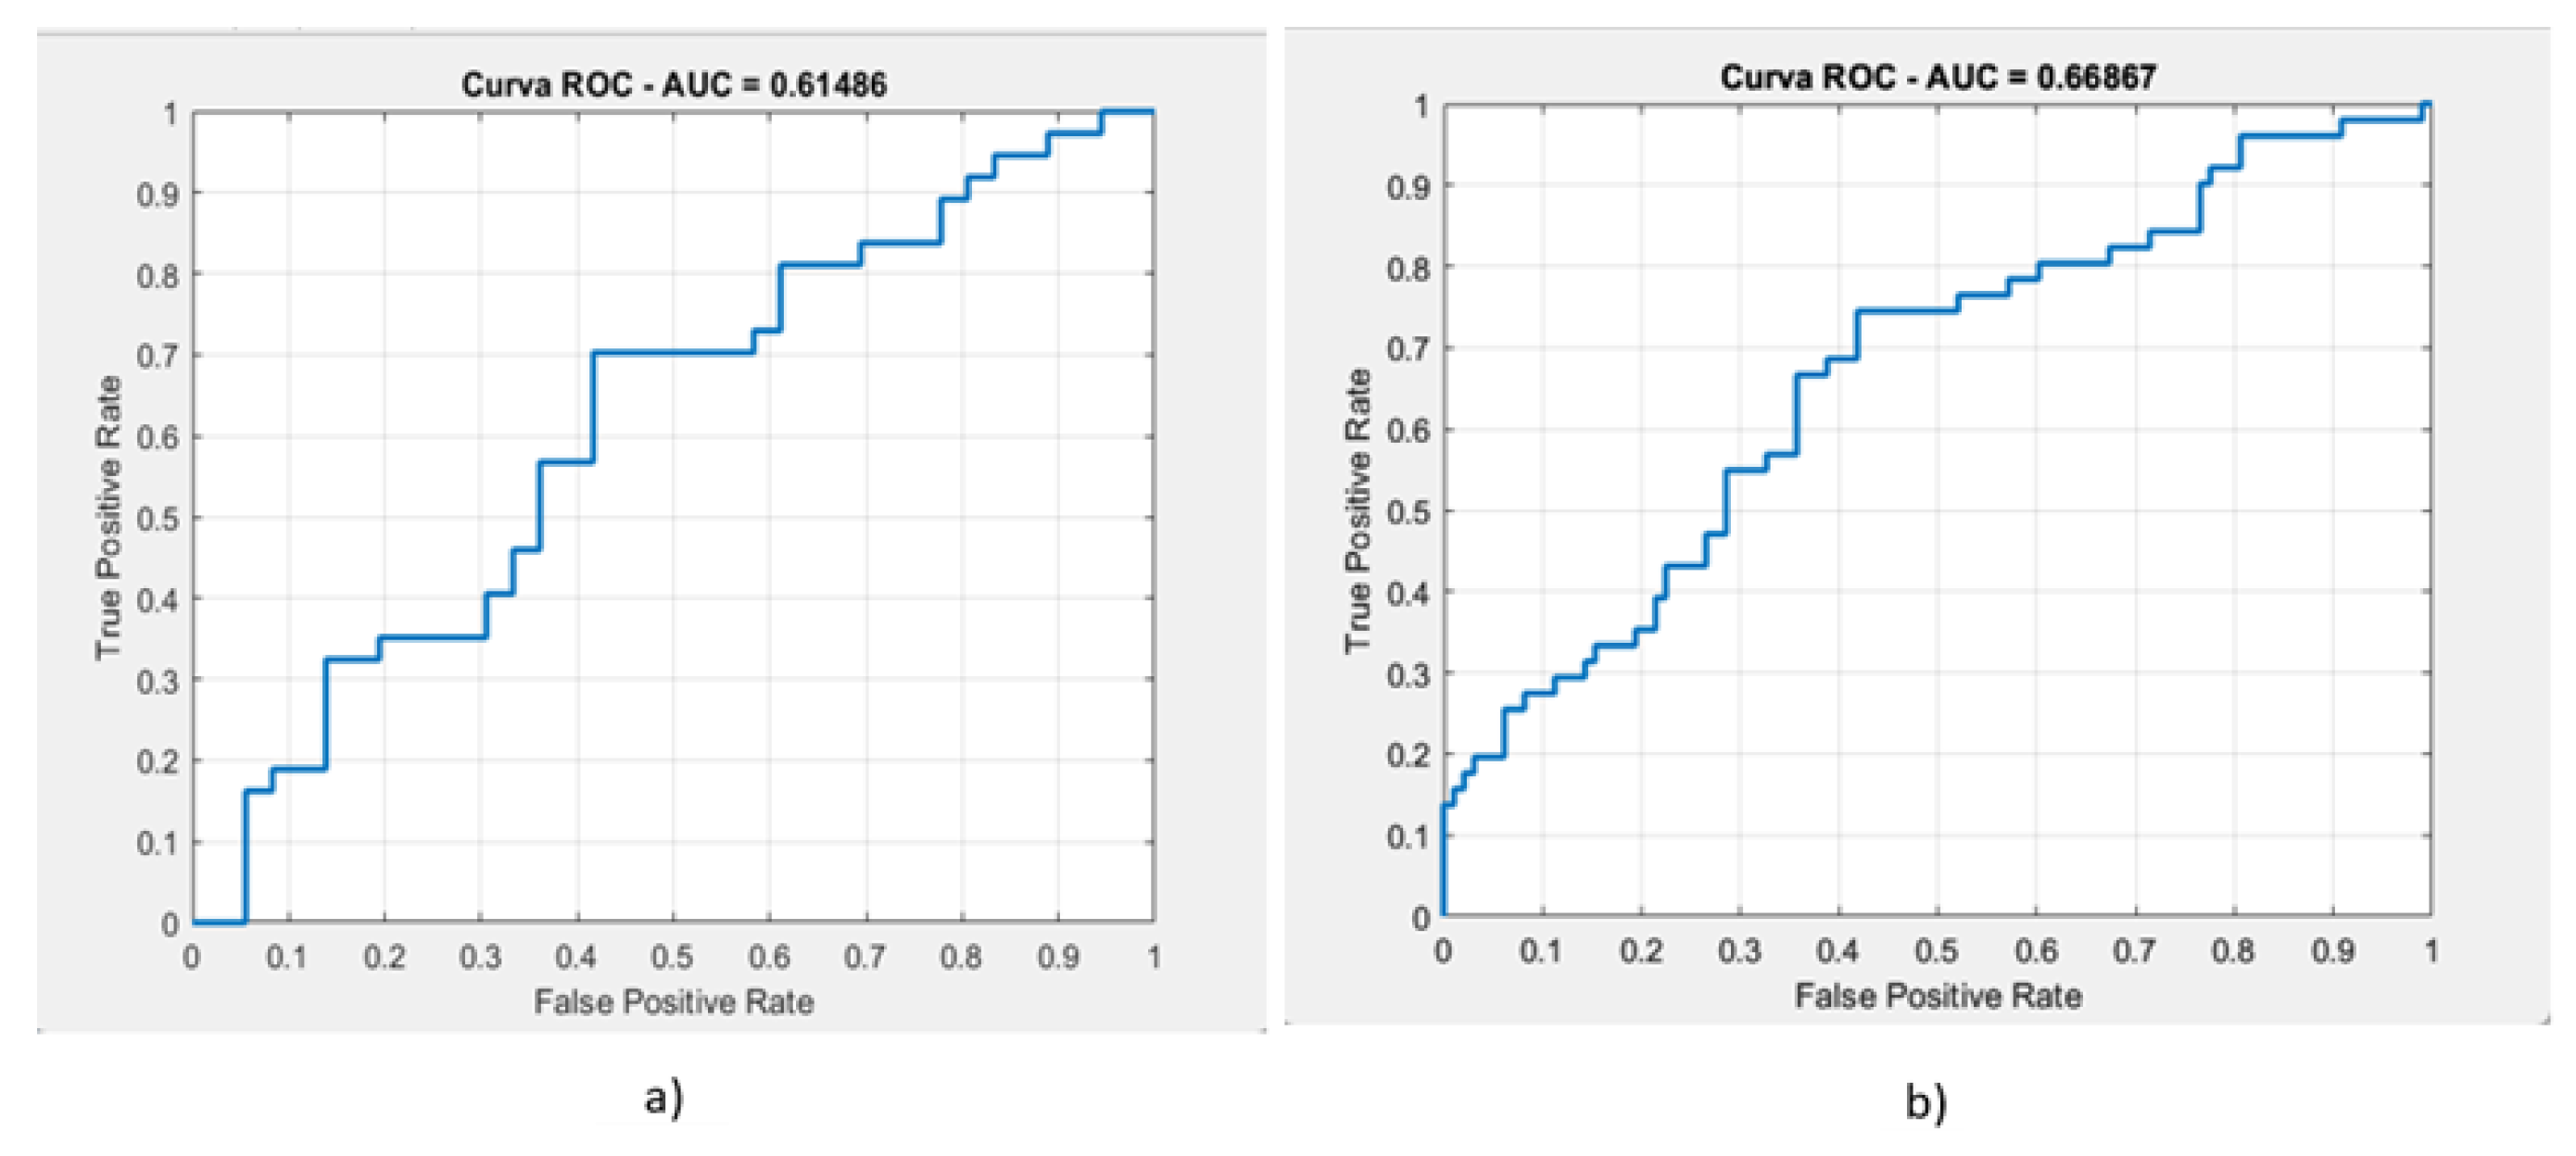
Figure 10.
ROC Curve for masse (on the left) and calcification (on the right) classification using DL.
Figure 10.
ROC Curve for masse (on the left) and calcification (on the right) classification using DL.
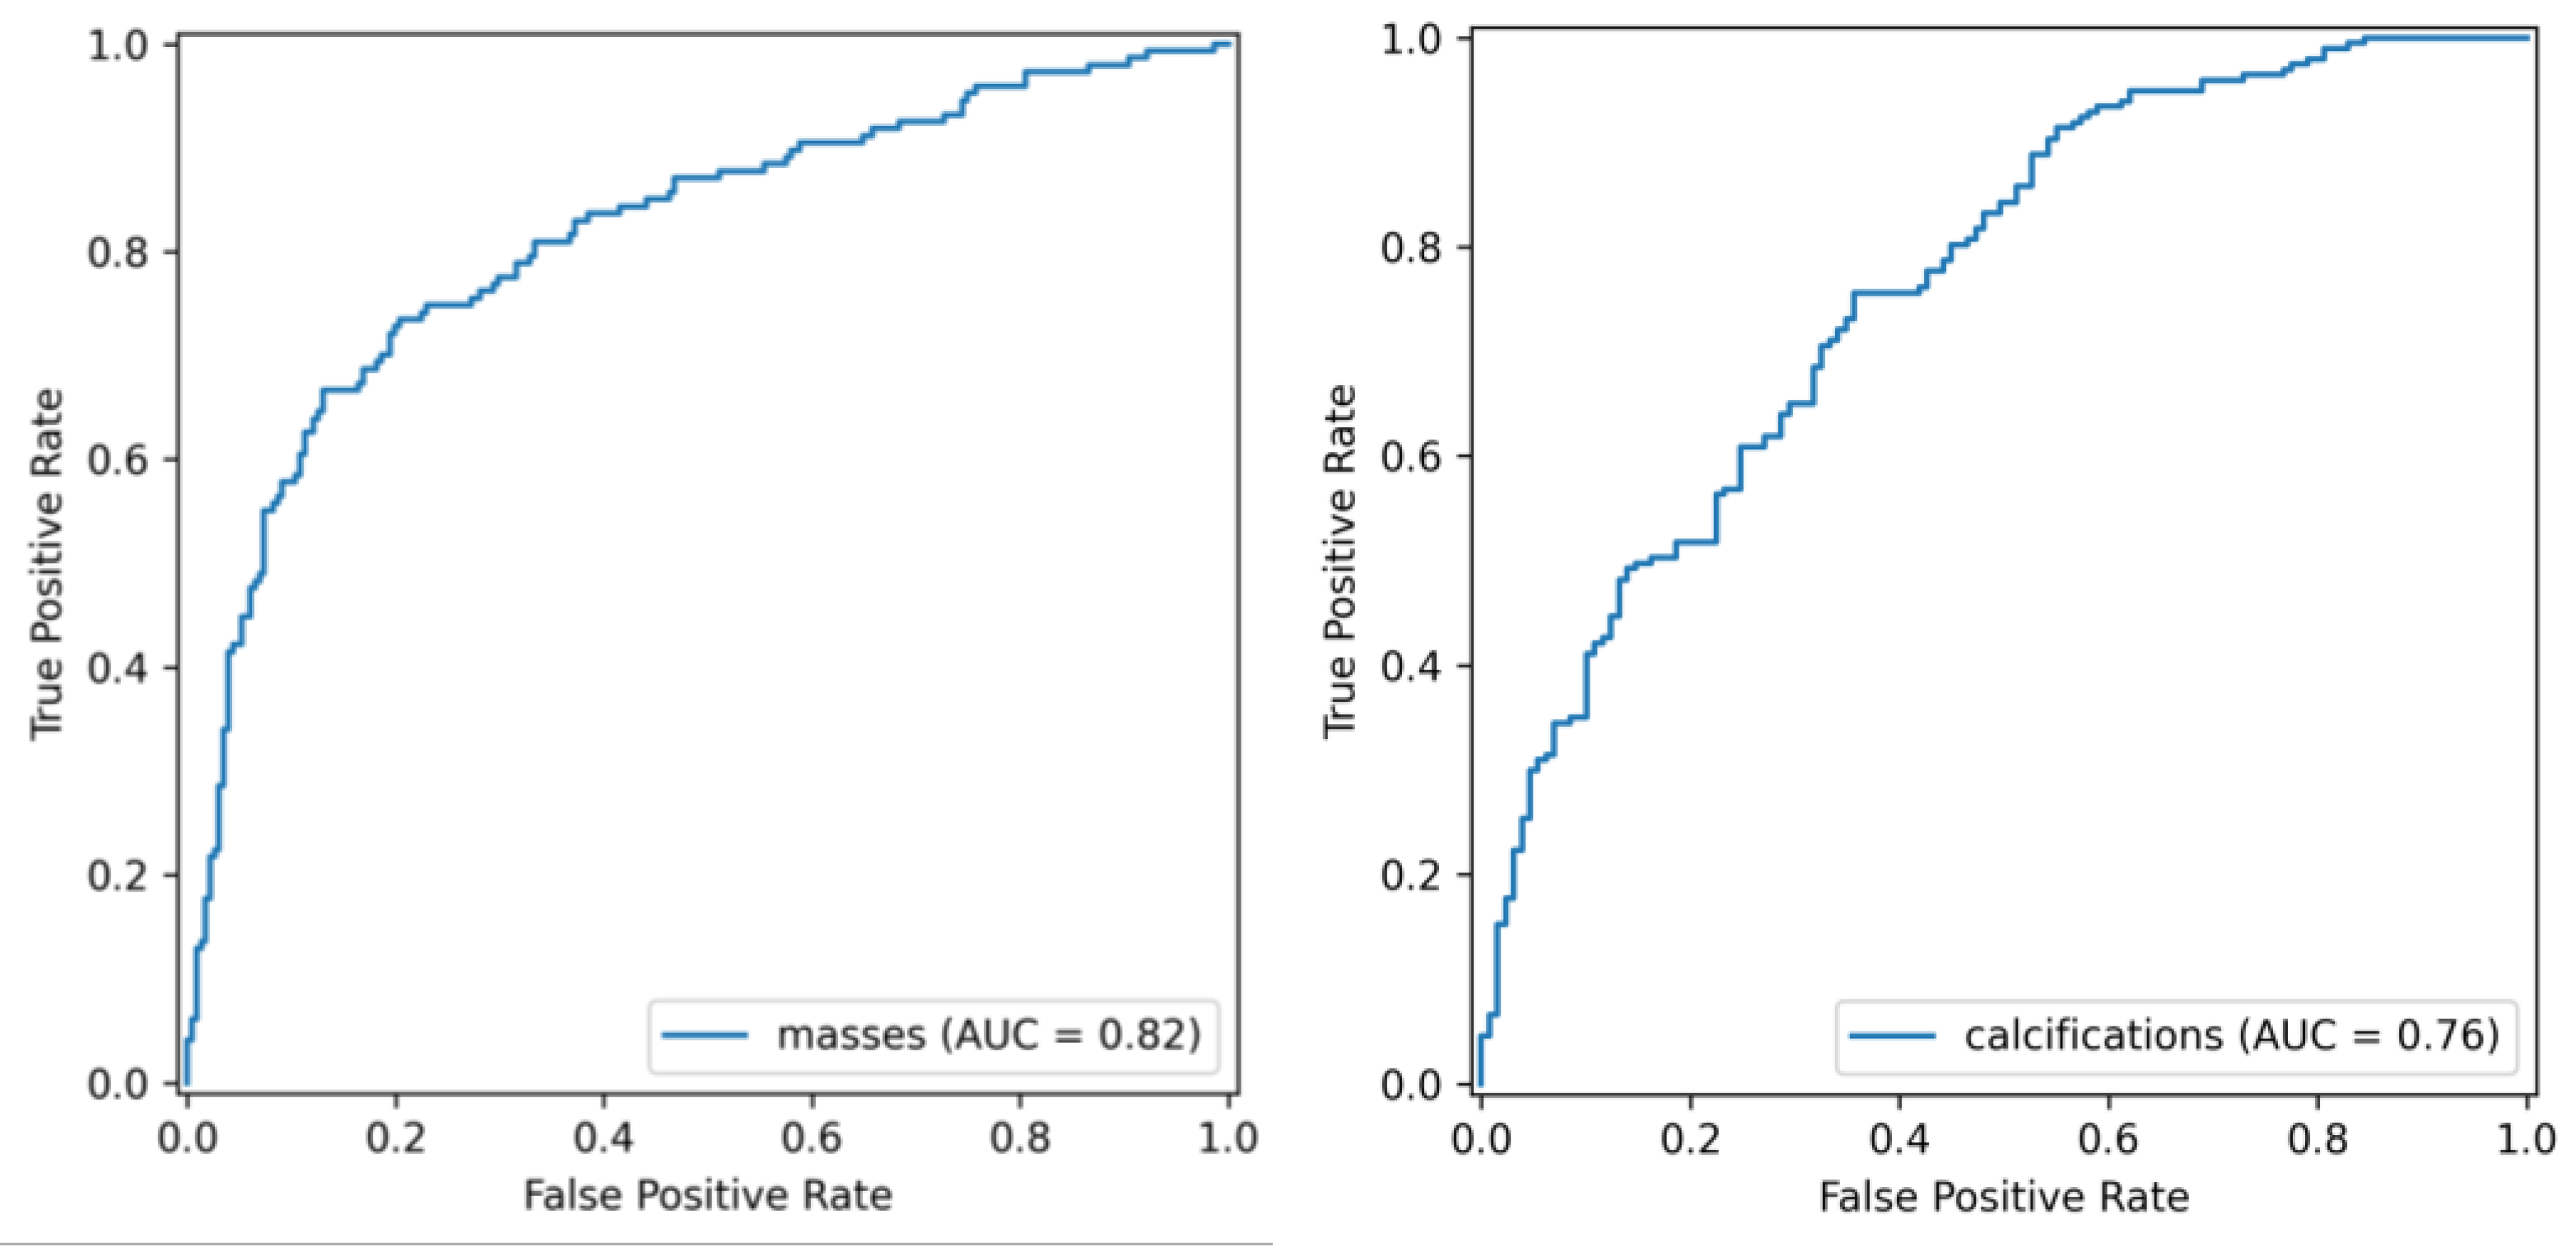

Table 1.
Results for discrimination between masses and calcifications.
| ROC AUC | Test ROC AUC | Accuracy | Test Accuracy |
| 97.42% | 97.08% | 94.14% | 95.63% |
Table 2.
External validation.
| Classification type | AUC | Accuracy | Recall | Precision | F1-Score |
|---|---|---|---|---|---|
| masses | 61.48% | 56.73% | 56% | 59.36% | 57.4% |
| calcifications | 66.86% | 63.1% | 71.4% | 72.2% | 71.8% |
Table 3.
Results obtained using Deep Radiomics for masse and calcification classification.
| Classification type | AUC | Accuracy | Recall | Precision | F1-Score |
|---|---|---|---|---|---|
| masses | 81.52% | 78% | 66.70% | 74.24% | 70.25% |
| calcifications | 76.24% | 71.1% | 85.78% | 81.96% | 78.24% |
Disclaimer/Publisher’s Note: The statements, opinions and data contained in all publications are solely those of the individual author(s) and contributor(s) and not of MDPI and/or the editor(s). MDPI and/or the editor(s) disclaim responsibility for any injury to people or property resulting from any ideas, methods, instructions or products referred to in the content. |
© 2025 by the authors. Licensee MDPI, Basel, Switzerland. This article is an open access article distributed under the terms and conditions of the Creative Commons Attribution (CC BY) license (http://creativecommons.org/licenses/by/4.0/).
Copyright: This open access article is published under a Creative Commons CC BY 4.0 license, which permit the free download, distribution, and reuse, provided that the author and preprint are cited in any reuse.


