Preprint
Article

This version is not peer-reviewed.

Three Cases Revealing Remarkable Genetic Similarity Between Vent-Endemic Rimicaris Shrimps Across Distant Geographic Regions: Toward a New Conservation Perspective

  † These authors contributed equally to this work.

Submitted:

27 November 2025

Posted:

28 November 2025

You are already at the latest version

Abstract

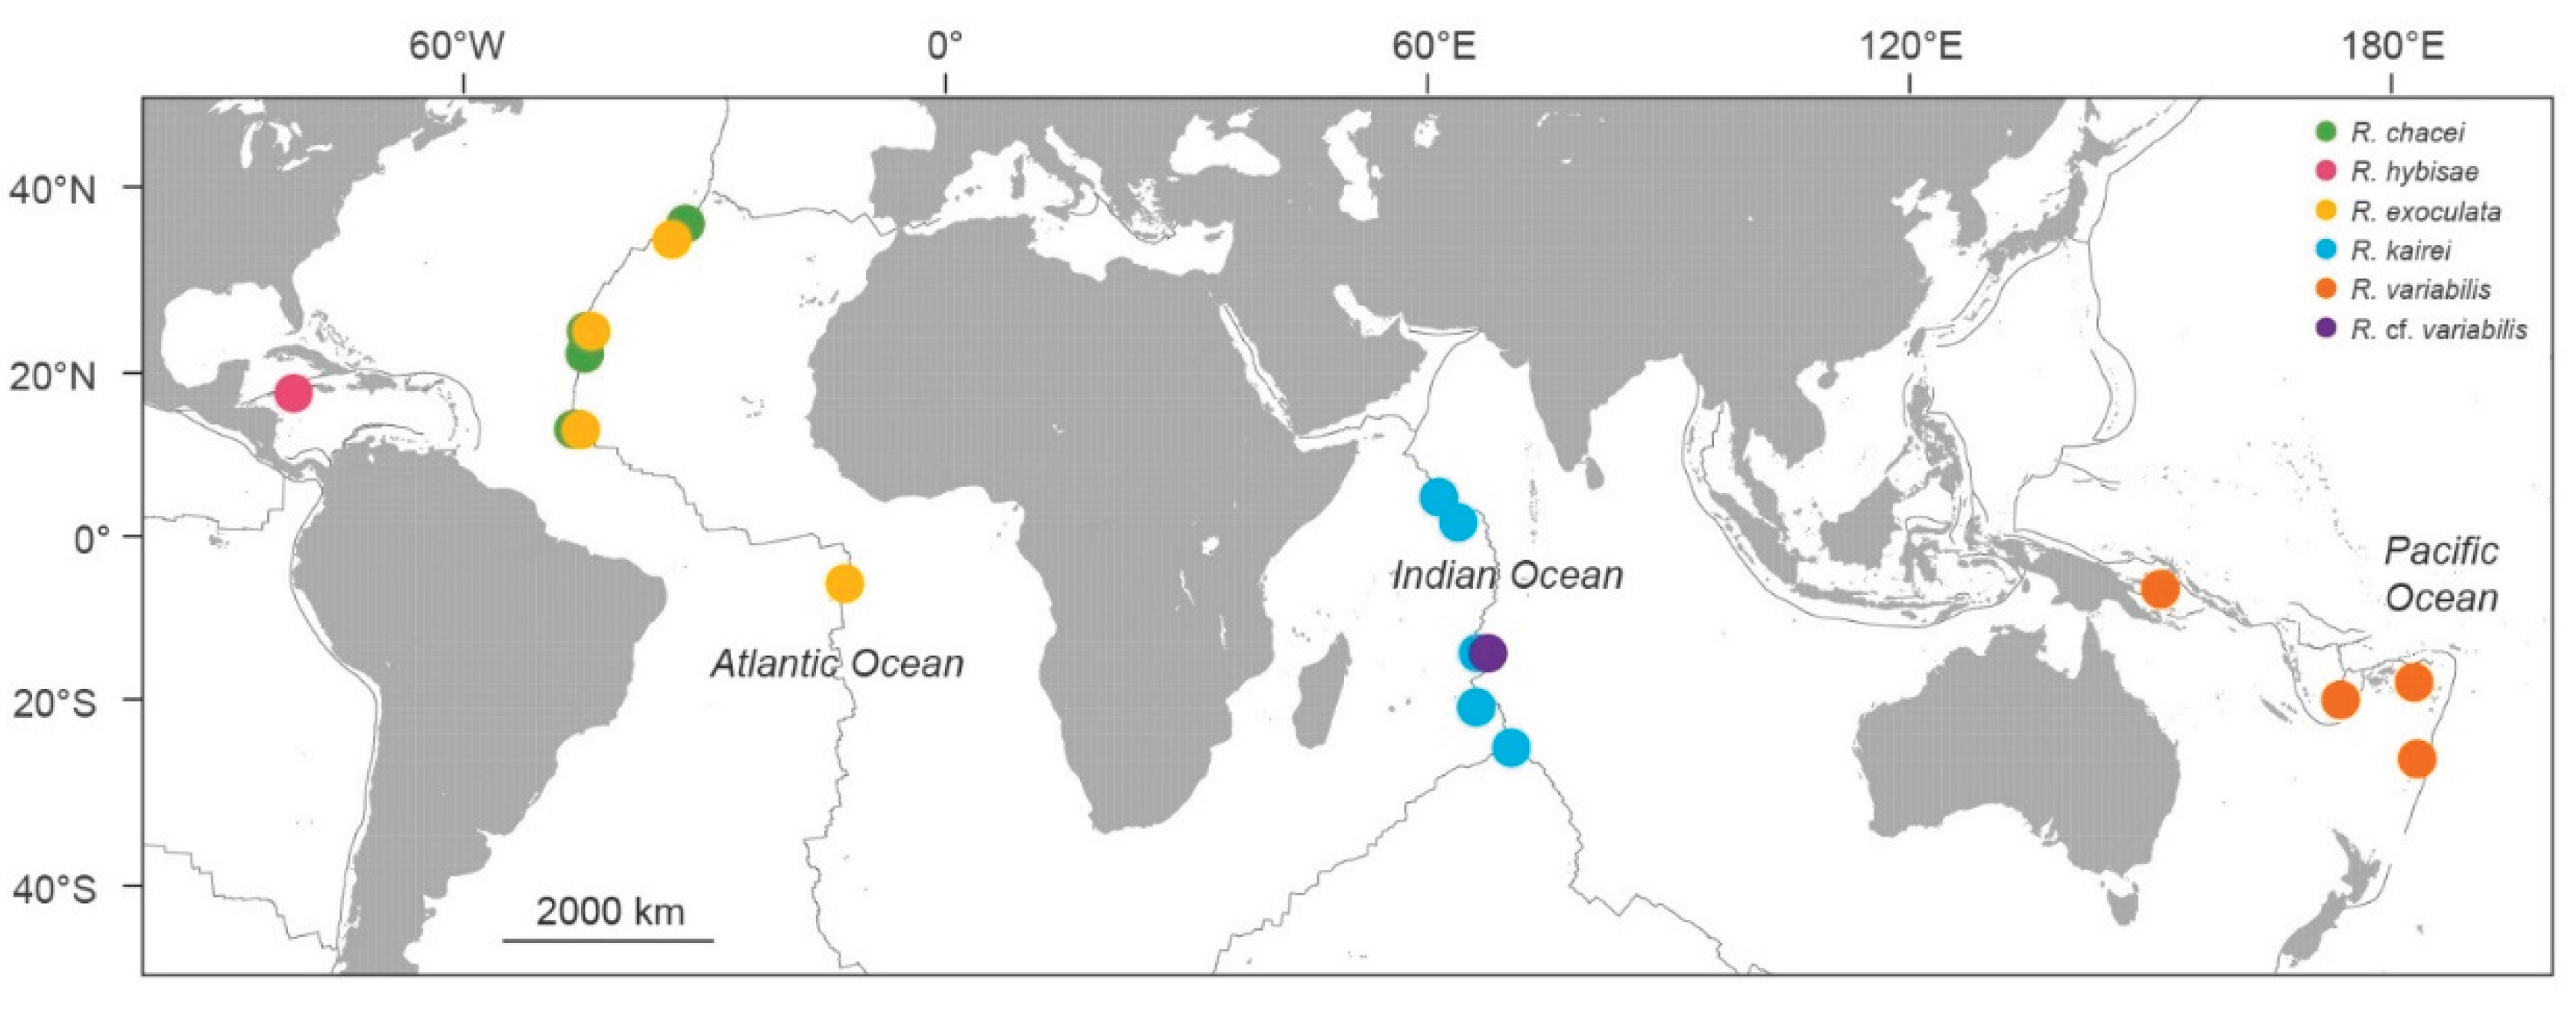
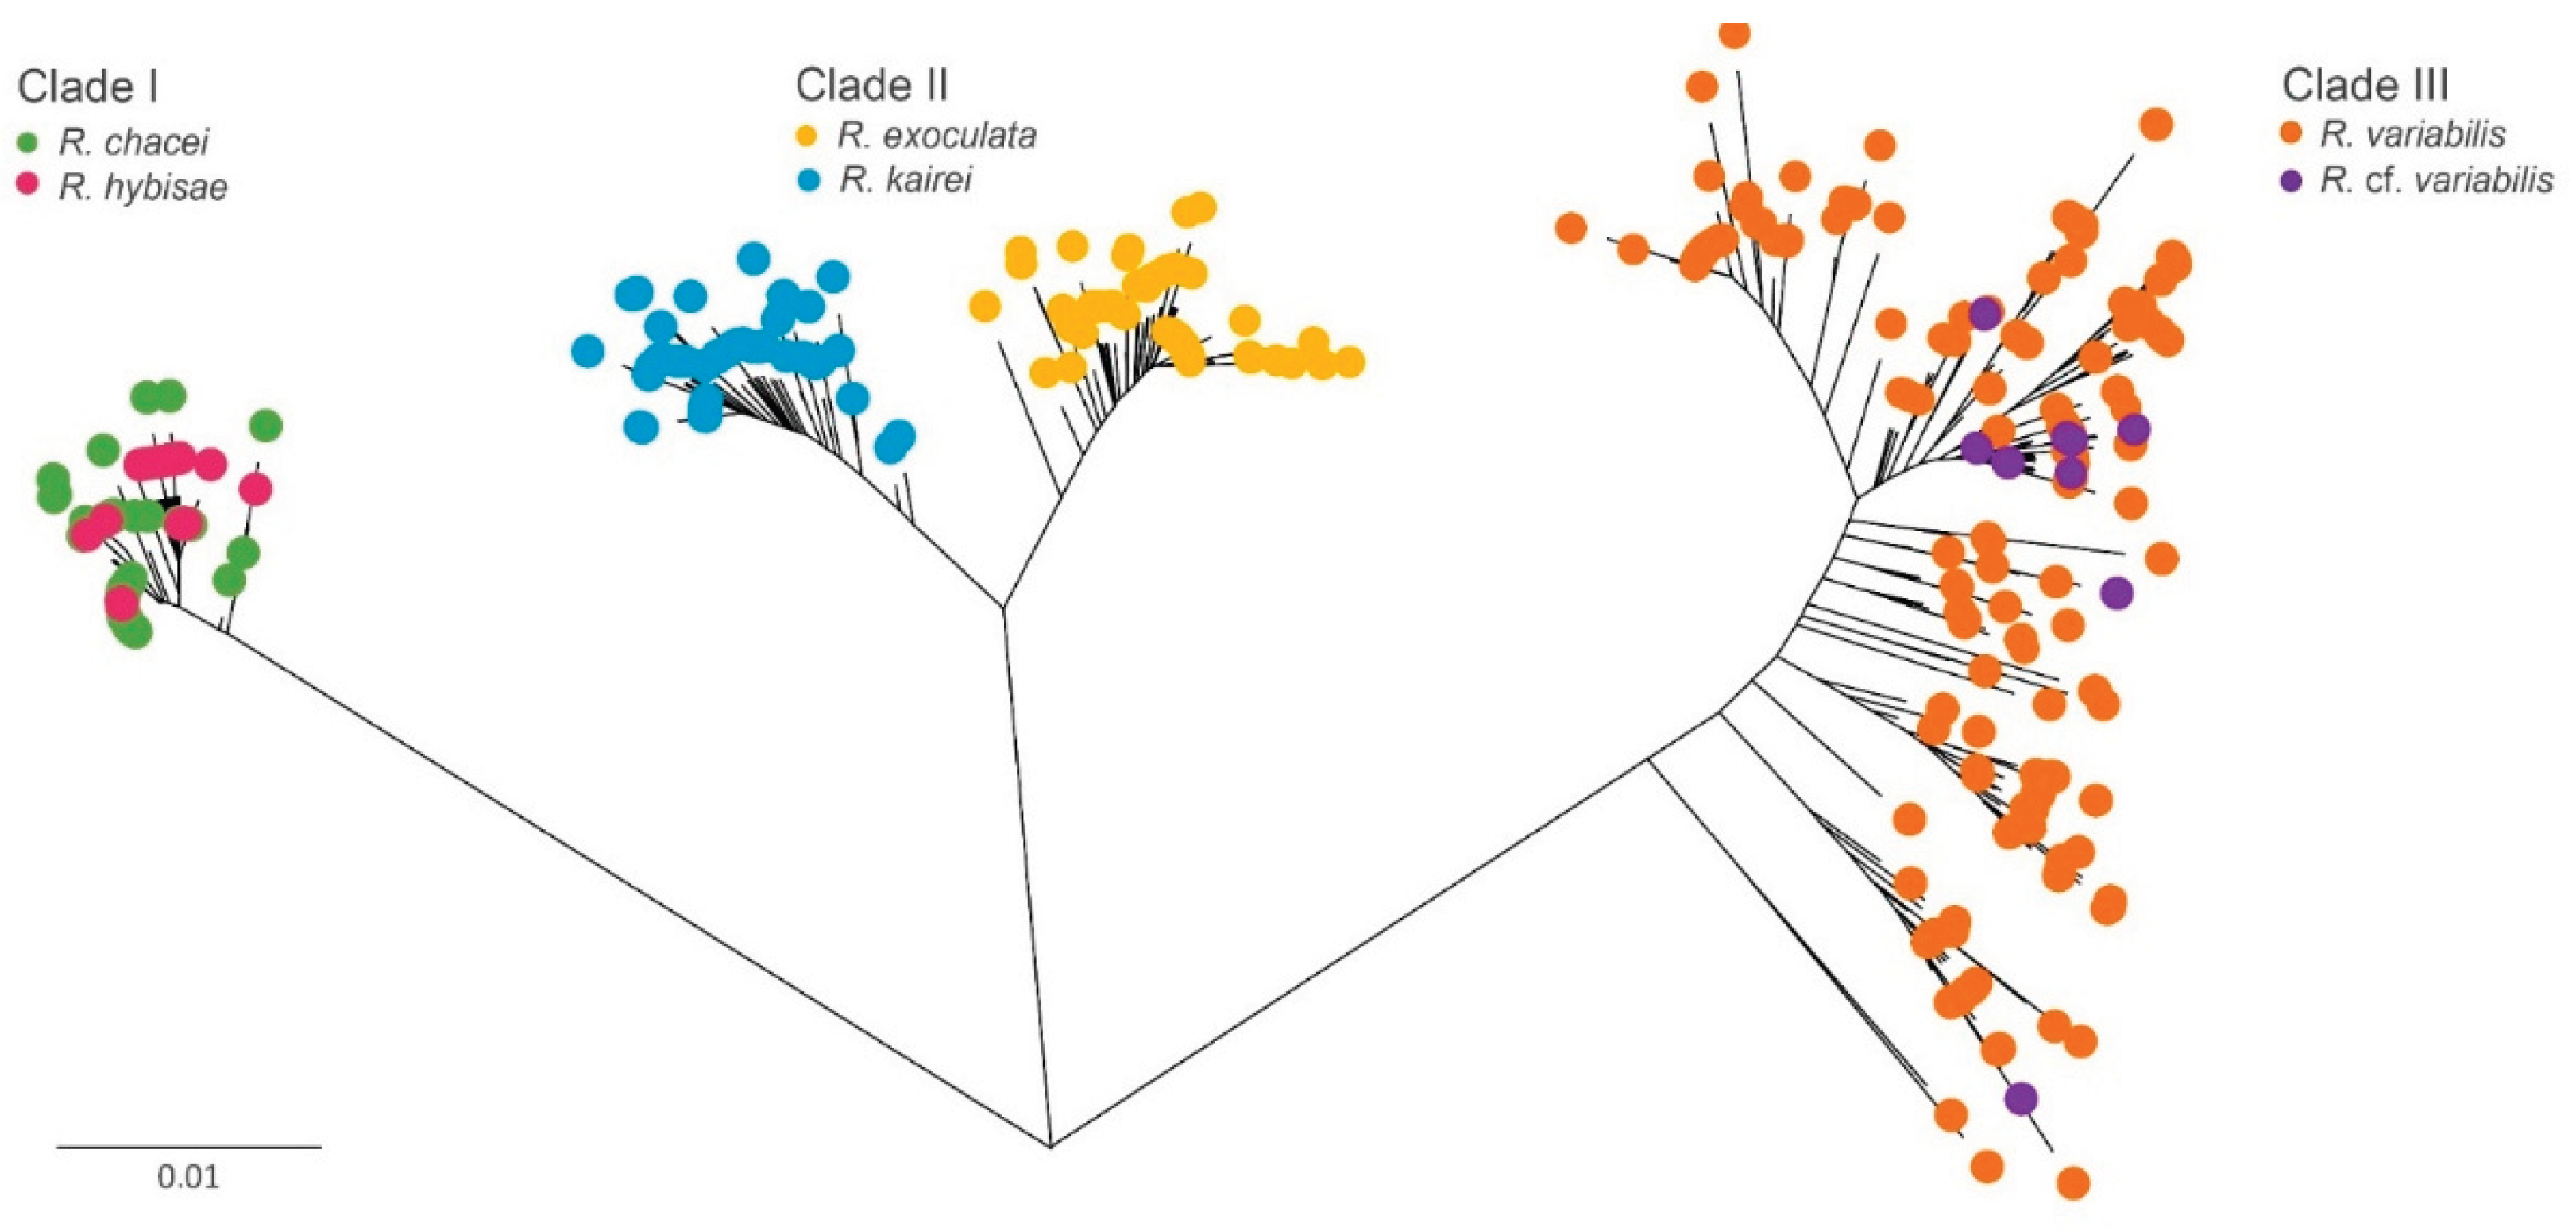
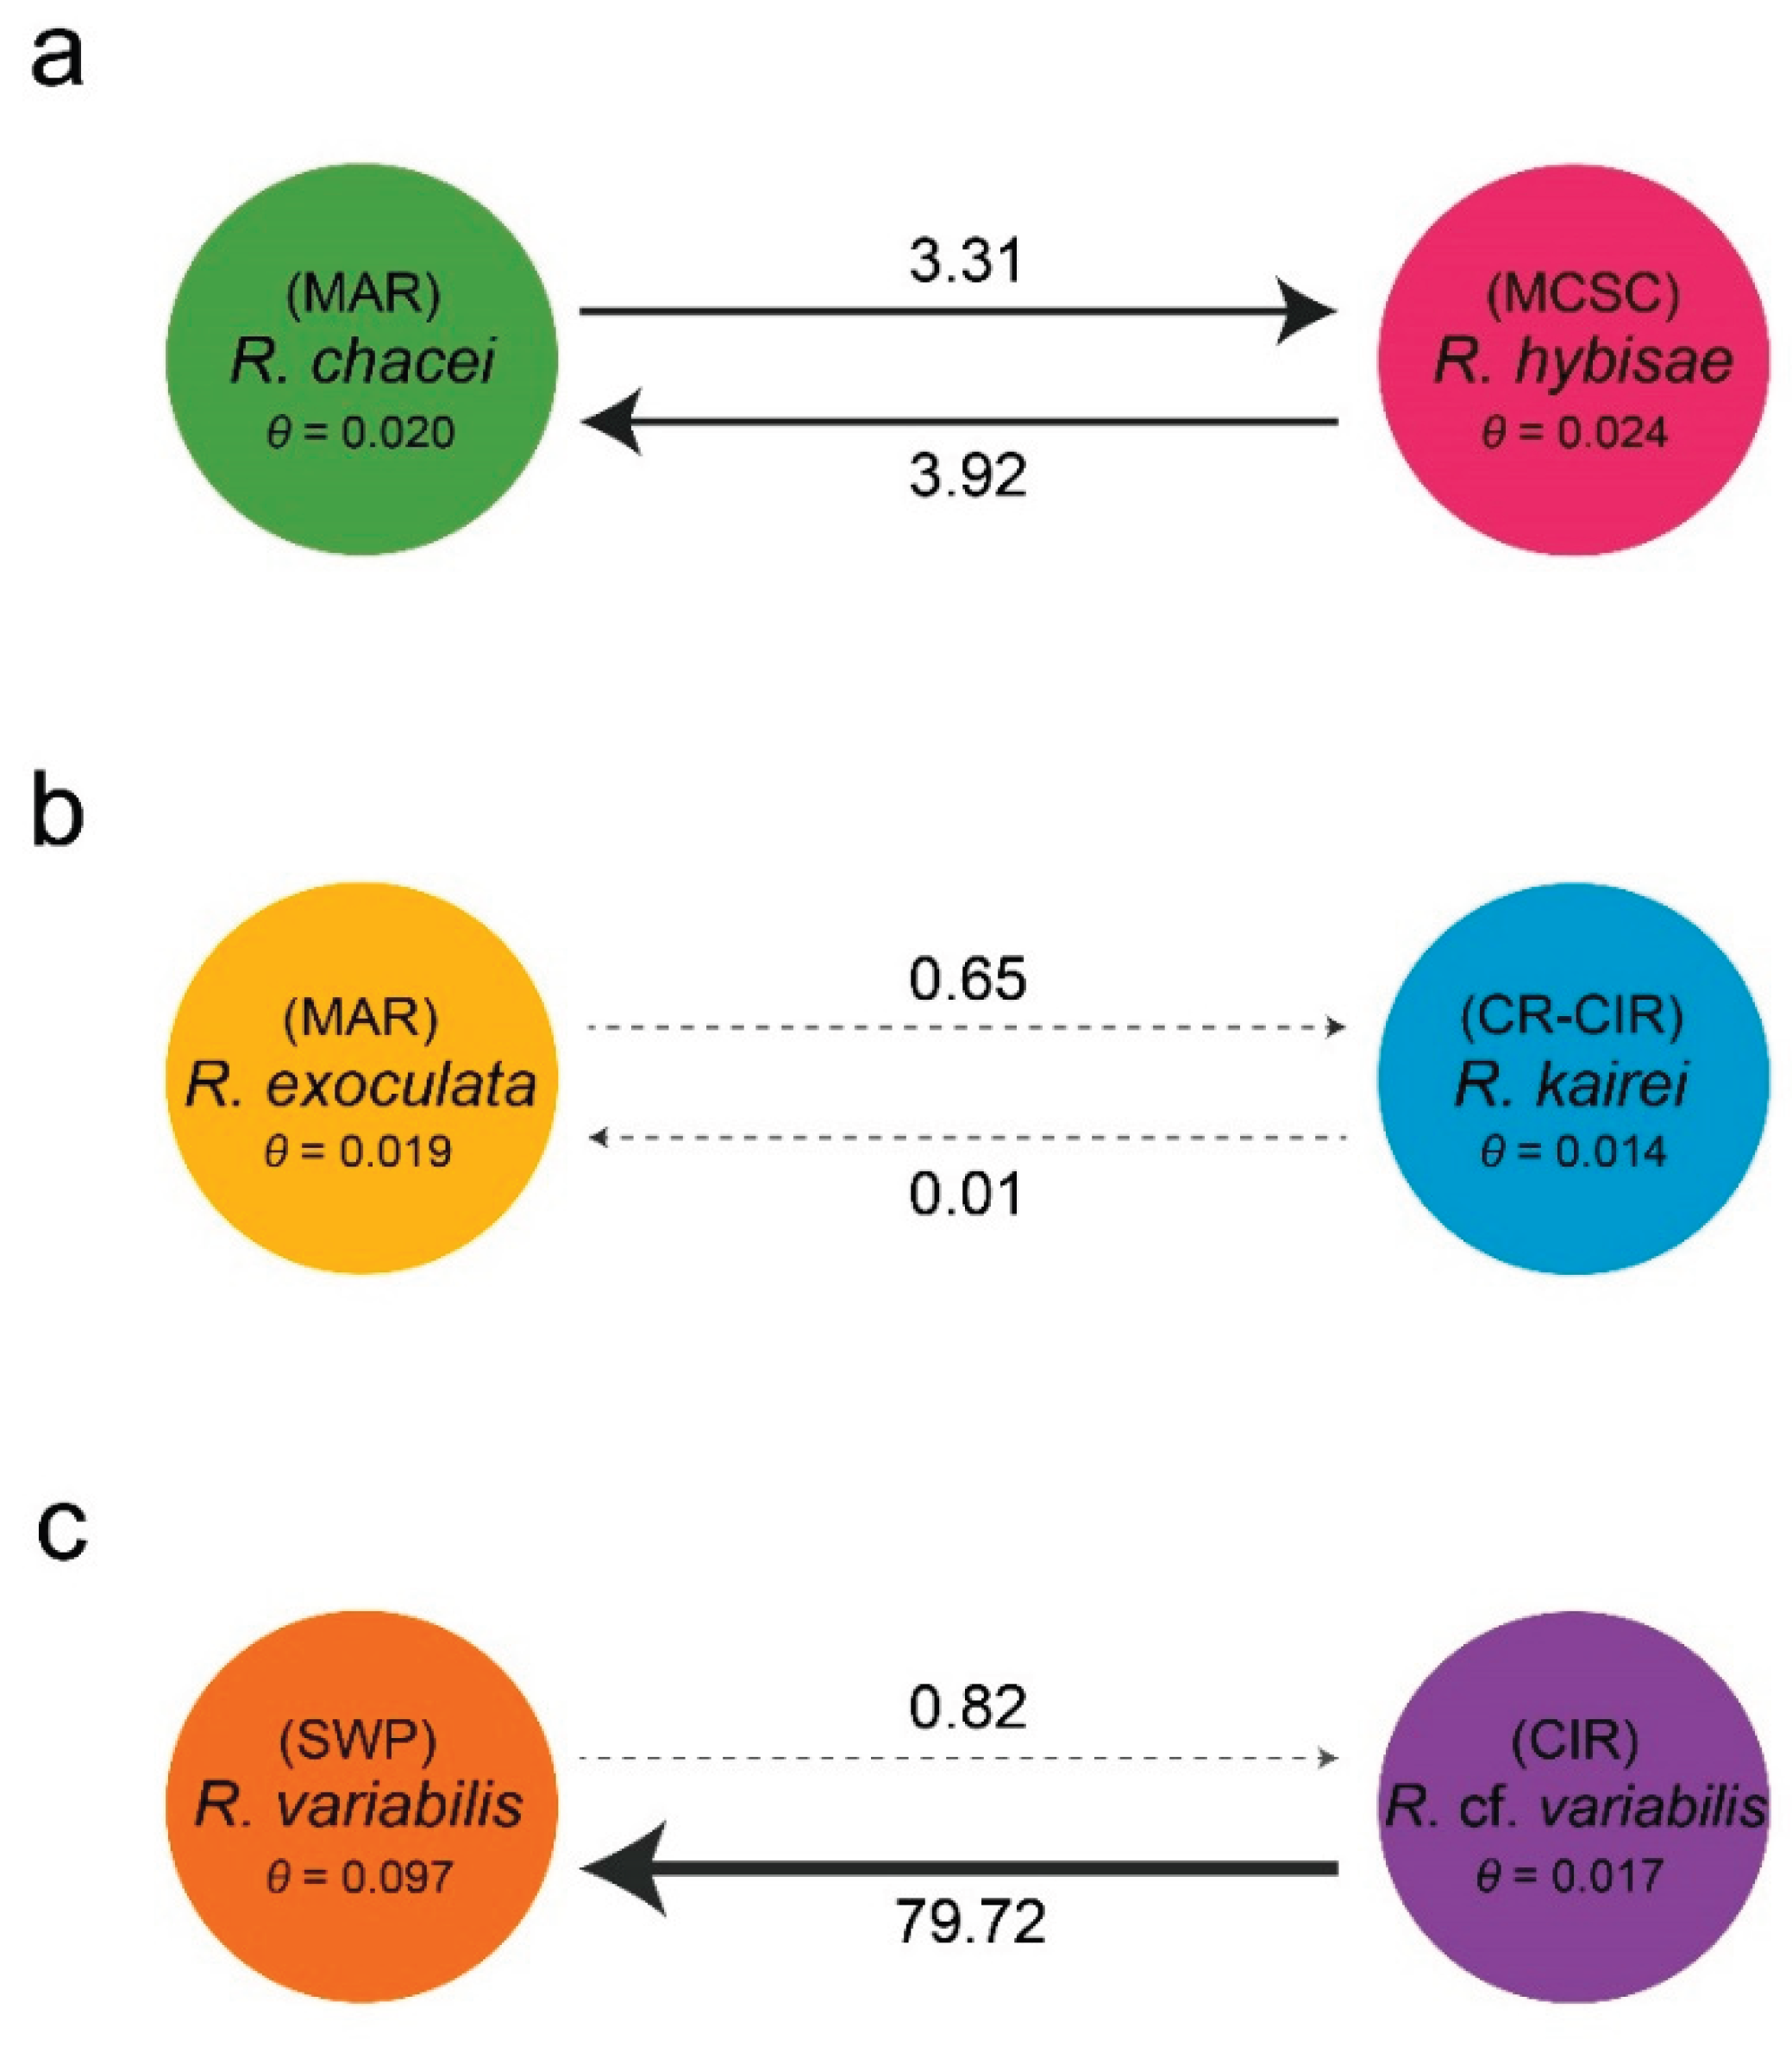
Deep-sea hydrothermal vent fauna is often regarded as highly endemic, although exceptions have been reported. We examined genetic connectivity across broad spatial scales within the alvinocaridid genus Rimicaris, which has undergone substantial adaptive radiation worldwide. We analyzed six Rimicaris species using three genetic markers (COI, 16S, and H3) and complete mitogenomes, using newly generated sequences combined with publicly available sequence data. Genetic tree and haplotype networks were constructed, and divergence analyses were performed. As a result, three clades of paired Rimicaris species were identified, each comprising taxa from different oceanic regions, but showing relatively low COI divergence (0.35–1.90%). In Clade I, Rimicaris chacei and Rimicaris hybisae are morphologically similar and exhibit bidirectional gene flow, suggesting a dispersal route between the Mid-Atlantic Ridge and Mid-Cayman Spreading Center. In Clade II, Rimicaris exoculata and Rimicaris kairei are morphologically, genetically, and ecologically distinct, reflecting restricted connectivity between the Mid-Atlantic Ridge and Carlsberg Ridge–Central Indian Ridge. In Clade III, Rimicaris variabilis and Rimicaris cf. variabilis differ in nutritional strategies, showing a unidirectional dispersal route from the northern Central Indian Ridge to the southwestern Pacific, but morphological data to distinguish them are currently lacking. Some Rimicaris lineages maintain connectivity across distinct oceanic regions while others still form unique regional populations. This finding highlights the need for conservation strategies that incorporate both global-scale connectivity and regional endemism, rather than treating vent ecosystems as a single homogeneous management unit.

Keywords: 
;  ;  ;  ;  

1. Introduction

Deep-sea hydrothermal vents, which are found along mid-ocean ridges and back-arc basins, are characterized by darkness, temperatures over 300°C, and chemically enriched fluids (Ramirez-Llodra et al., 2007; Vrijenhoek, 2010; Sogin et al., 2021). These environments host unique ecosystems sustained by chemosynthetic microbiomes as primary producers, supporting high biodiversity and considerable biomass (McArthur and Tunnicliffe, 1998; Van Dover et al., 2002; Fisher et al., 2007; Moalic et al., 2012; Tunnicliffe et al., 2024). Notably, these ecosystems are shaped by evolutionary forces that promote symbiotic adaptations between chemosynthetic bacteria and vent invertebrates, contributing to the high levels of endemism observed among vent-inhabiting invertebrates (Won et al., 2003; Cavanaugh et al., 2006; Dubilier et al., 2008; Mullineaux et al., 2018; Breusing et al., 2022, 2023). While often regarded as remote and isolated, these ecosystems are attracting growing commercial interest due to the potential of deep-sea mineral resources.
Hydrothermally active vents are both biologically rich and geochemically significant, and are also sites of polymetallic sulfide deposits containing valuable metals such as copper, zinc, gold, silver, and rare earth elements (German et al., 2016; Van Dover et al., 2018; Fuchs et al., 2019). As interest in deep-sea mineral extraction grows, these habitats face increasing threats from human activities, particularly commercial deep-sea mining. Despite their ecological and economic importance, our understanding of how such disturbances will affect hydrothermal vent biodiversity remains limited, and uncertainties persist regarding species connectivity, gene flow barriers, dispersal capacity, and the potential for population recovery following habitat degradation (Van Dover, 2014; Mullineaux et al., 2020; van der Most et al., 2023). Expanding our knowledge in these areas is essential for developing effective conservation strategies prior to the commencement of large-scale exploitation. Elucidating the genetic structures within and between dominant vent species is a critical step toward informed management and effective conservation of hydrothermal vent ecosystems.
Among the dominant members of vent communities, the caridean family Alvinocarididae is a key indicator of genetic connectivity and ecosystem resilience (Teixeira et al., 2013; Sun et al., 2018; Dai et al., 2025). This family is one of the most abundant crustacean taxa in hydrothermal vent ecosystems worldwide, comprising 35 species in five genera: Alvinocaris, Rimicaris, Mirocaris, Nautilocaris, and Keldyshicaris (Komai and Segonzac, 2005; Martin and Haney, 2005; WoRMS Editorial Board, 2025). Rimicaris currently includes 15 valid species, all of which are geographically restricted to specific vent regions (Nye et al., 2012; Vereshchaka et al., 2015; Methou et al., 2024b). To understand the apparent endemism of Rimicaris species, previous studies have examined their trophic strategies and symbiotic associations with chemoautotrophic microbial communities (Assié, 2016; Apremont et al., 2018; Lee et al., 2021; Methou et al., 2023, 2024b). This genus also exhibits substantial morphological diversity and has recently undergone major taxonomic revisions, with six formerly distinct genera now synonymized under Rimicaris (Vereshchaka et al., 2015; Methou et al., 2024a). Despite the morphological and ecological diversity within Rimicaris, our pilot study revealed unexpectedly high genetic similarity between some species from geographically distant ocean basins, indicating that their gene flow and dispersal patterns may be more complex than previously understood. However, the mechanisms driving these patterns, particularly those related to genetic divergence, larval dispersal, and migration, remain poorly understood.
The COI barcode is an approximately 700-bp region of the mitochondrial cytochrome c oxidase I (COI) gene that has been widely used for species identification and population genetic studies in metazoans due to its high substitution rate and the availability of universal primers (Hebert et al., 2003a). However, in cases where closely related congeners have recently diverged from a common ancestor, COI barcoding may fail to distinguish species due to insufficient sequence divergence (Shearer and Coffroth, 2008; Matzen da Silva et al., 2011; Ranasinghe et al., 2022). To address these limitations, researchers have increasingly adopted multi-locus approaches such as incorporating additional mitochondrial and nuclear gene regions or analyzing whole mitogenomes or nuclear genomes (Hinsinger et al., 2015; Chagas et al., 2020; Nymoen et al., 2024).
In this study, we first confirmed three cases of paired Rimicaris species exhibiting high genetic affinity based on COI barcode sequences. Then, we assessed the sequence similarity and genetic connectivity within each species pair. To validate these affinity data at broader genetic levels, we conducted comparative analyses using the mitochondrial 16S rRNA (16S) gene, nuclear histone 3 (H3) gene, and all 13 mitochondrial protein-coding genes (PCGs). Our findings are anticipated to have implications relating to genetic connectivity, potential migration pathways, and speciation processes.

2. Materials and Methods

2.1. Ethics Approval

The Korea Institute of Ocean Science and Technology obtained permission to collect vent fauna, including shrimps, from hydrothermal vent regions in the Southwestern Pacific Ocean located within the Exclusive Economic Zones of Fiji and Tonga. Approval was granted by the Ministry of Land and Natural Resources of the Republic of Fiji and the Ministry of Lands, Survey and Natural Resources of the Kingdom of Tonga. Shrimps from the Manus Basin, which were loaned to Duke University, were collected with permission from the Government of Papua New Guinea.

2.2. Vent Shrimp Sampling and Identification

Alvinocaridid shrimp specimens were collected using suction samplers mounted on remotely operated vehicles from nine vent sites in the southwestern Pacific (SWP) and two vent sites in the northern Central Indian Ridge (nCIR) (Figure 1). On board the research vessel, all specimens were immediately preserved in 95% ethanol or stored at –80°C for genetic analysis. The specimens were identified based on morphological characteristics and COI barcodes (Hebert et al., 2003a; Komai and Tsuchida, 2015). Detailed information on the specimens is provided in Table S1.

2.3. DNA Extraction, Partial Gene and Mitogenome Sequencing, and Sequence Data Preprocessing

A small amount of muscle tissue was dissected from a pereopod of each specimen for DNA extraction. Total genomic DNA was extracted using the QIAamp Fast DNA Tissue kit (Qiagen, Hilden, Germany).
Partial sequences of the COI, 16S, and H3 genes were amplified using published universal primers (Table S2). Polymerase chain reaction (PCR) amplification was performed in a total volume of 50 μL containing 1 μL of genomic DNA, 4 μL of dNTP mixture (2.5 mM each), 1 μL of each primer (10 pmol), 5 μL of 10× Ex Taq Buffer (Mg2+ plus), and 1.25 U of Takara Ex Taq DNA Polymerase (Takara Bio, Kusatsu, Japan), with an initial denaturation at 94°C for 2 min, followed by 35 cycles of denaturation at 95°C for 10 s, primer annealing at 48°C for COI, 46°C for 16S rRNA, and 50°C for H3 for 30 s, and extension at 72°C for 1 min, and a final 5-min extension at 72°C. The PCR products were sequenced by Macrogen (Seoul, Korea) using an ABI 3730xl Analyzer (Applied Biosystems, Waltham, MA, USA) with BigDye Terminator v3.1 Cycle Sequencing Kits (Applied Biosystems). Newly obtained sequences were trimmed, annotated, and aligned with Geneious Prime v2023.0.1 (Biomatters, Auckland, New Zealand) and adjusted manually by visual inspection.
For mitogenome sequencing, mitochondrial DNA was amplified using the REPLI-g Mitochondrial DNA Kit (Qiagen). Libraries were prepared with a TruSeq Nano DNA Kit (Illumina, San Diego, CA, USA) and short-read sequencing was performed using the Illumina HiSeq 4000 platform at Macrogen. The mitogenome was assembled using NOVOPlasty v4.3.1 (Dierckxsens et al., 2017), annotated using MITOS2 (Bernt et al., 2013), and curated manually in Geneious Prime v2023.0.1 (Biomatters).
The newly generated sequences were registered in GenBank (Table S3).

2.4. Tree Construction, Nucleotide Divergence, Haplotype Network, and Gene Flow

Based on both newly generated sequences and those retrieved from GenBank, genetic divergence was calculated using the p-distance method, and a neighbor-joining (NJ) tree was constructed with MEGA 11 (Tamura et al., 2021).
To visualize genetic similarities and dissimilarities among samples, principal coordinate analysis (PCoA) was performed based on distance matrices using GenAlEx v6.503 (Peakall and Smouse, 2006).
The number of polymorphic sites, number of haplotypes, haplotype diversity, nucleotide diversity, Tajima’s D, Fu’s FS, and fixation index based on pairwise differences (FST) were estimated using DnaSP v5.10.01 and Arlequin v3.5.2.2 (Librado and Rozas, 2009; Excoffier and Lischer, 2010). To determine the genetic relationships between paired species within each clade, haplotype networks were created using TCS and visualized with Hapsolutely v0.2.2 (Templeton et al., 1992; Vences et al., 2024).
The gene flow between closely related species was estimated as the number of migrants per generation (Nm) using MIGRATE-N 5.0.4 (Beerli, 2006; Beerli et al., 2019). Nm was calculated as Nm = θ × M, where N is the effective population size, m is the migration rate, θ is the mutation-scaled population size, and M is the mutation-scaled migration rate.

2.5. Mitogenome Sequence Comparison

The nucleotide and amino acid sequence similarities of mitochondrial genes were calculated using Geneious Prime v2023.0.1 (Biomatters). The ratio of nonsynonymous to synonymous substitutions (Ka/Ks) was measured using KaKs_Calculator v3.0 with the Yang–Nielsen model (Zhang, 2022).

3. Results

3.1. Datasets Prepared from Multi-Gene Sequences

We generated new sequences of the COI and 16S mitochondrial genes and H3 nuclear gene, as well as complete mitogenome sequences for Rimicaris variabilis and Rimicaris cf. variabilis (Tables S3).
Each gene was aligned individually using both the newly obtained sequences and those of Rimicaris chacei, Rimicaris hybisae, Rimicaris exoculata, and Rimicaris kairei retrieved from GenBank (Table S3). We were unable to include H3 sequences for R. exoculata and R. kairei, and mitogenome sequences for R. chacei and R. hybisae in our analyses because they were not available in public sequence databases.

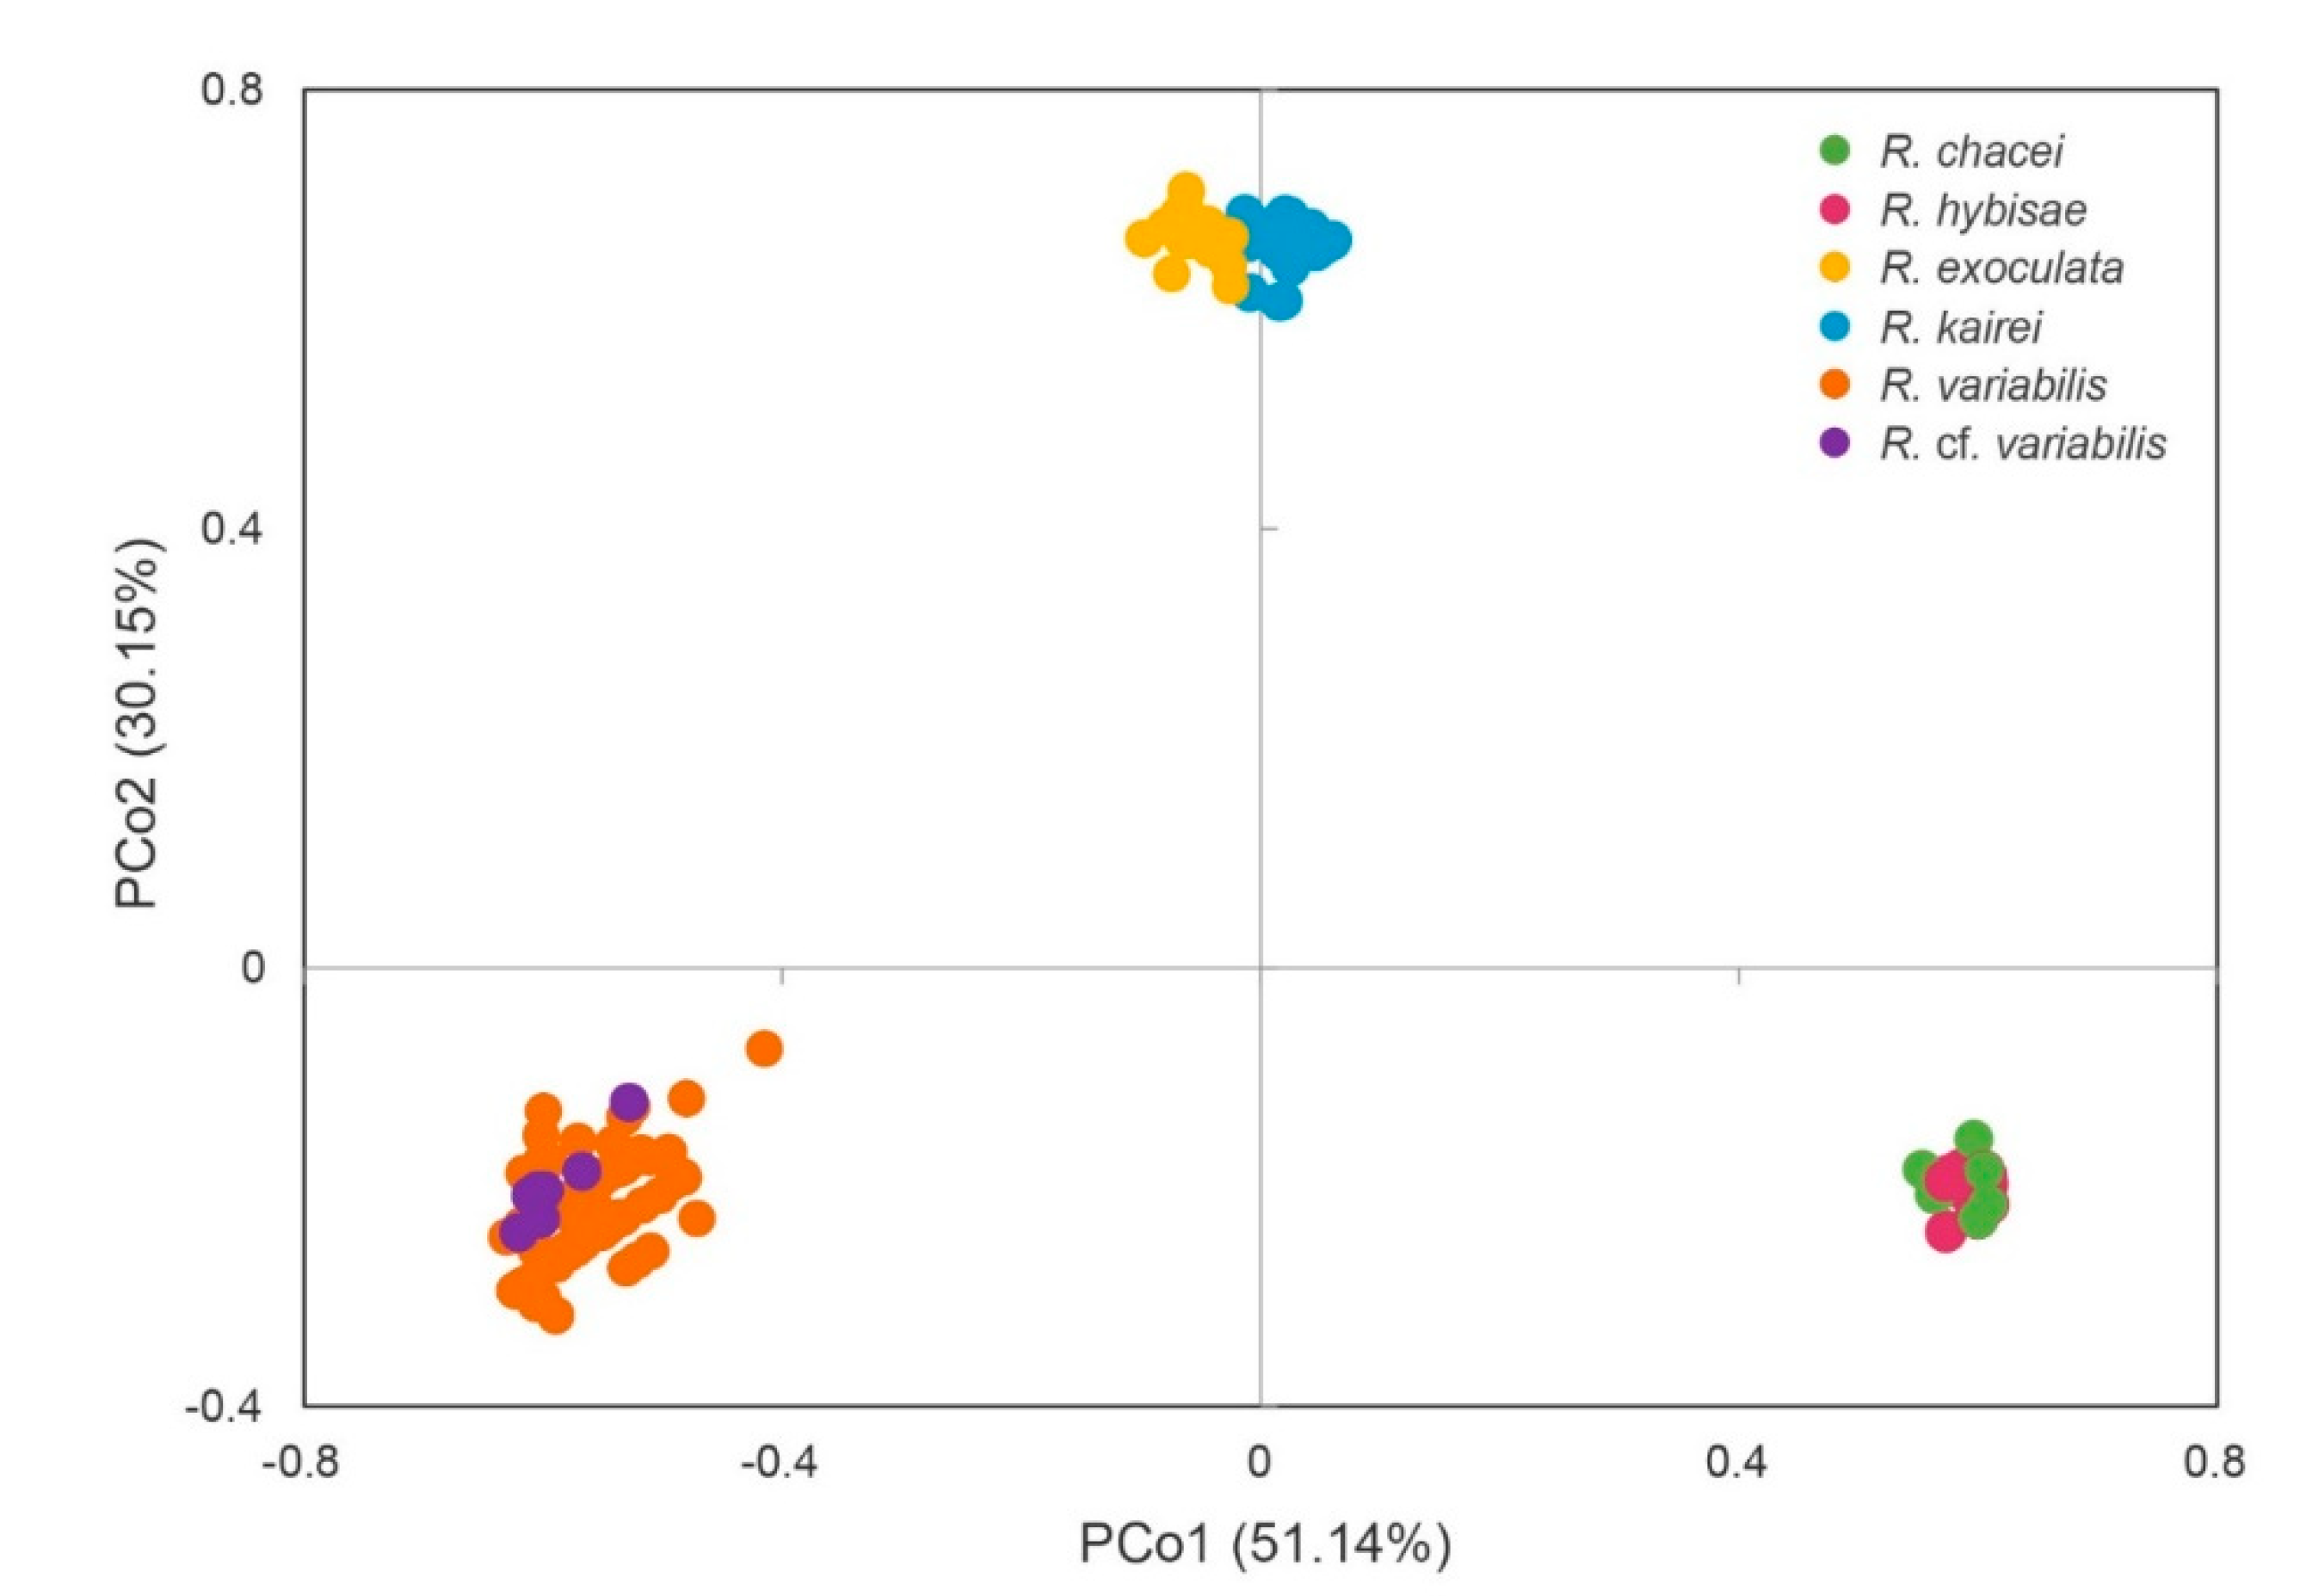
3.2. Genetic Clusters of Rimicaris Species

Based on the NJ tree constructed from the partial gene datasets for six Rimicaris species, three distinct clades were identified (Figure 2). In each clade, the paired species originated from geographically distant oceanic regions or ridge systems: Clade I included R. chacei from the Mid-Atlantic Ridge (MAR) and R. hybisae from the Mid-Cayman Spreading Center (MCSC); Clade II included R. exoculata from MAR and R. kairei from the Carlsberg Ridge–Central Indian Ridge (CR-CIR); and Clade III included R. variabilis from SWP and R. cf. variabilis from nCIR.
The genetic divergence between paired species within each clade was 0.35–1.90% for COI and 0.04–0.30% for 16S (Table 1). By contrast, inter-clade divergences were substantially higher, at 6.95–8.74% for COI and 0.30–1.10% for 16S. The H3 marker lacked sufficient resolution to distinguish genetic divergence within or between clades, showing only a single nucleotide difference at the same position across all Rimicaris sequences.
PCoA based on distance matrices of COI revealed that the first principal coordinate (PCo1) accounted for 51.14% of the total genetic variance, and the second (PCo2) accounted for 30.15%. The resulting PCoA plot clearly separated the three clades, supporting the NJ tree topologies (Figure 3).

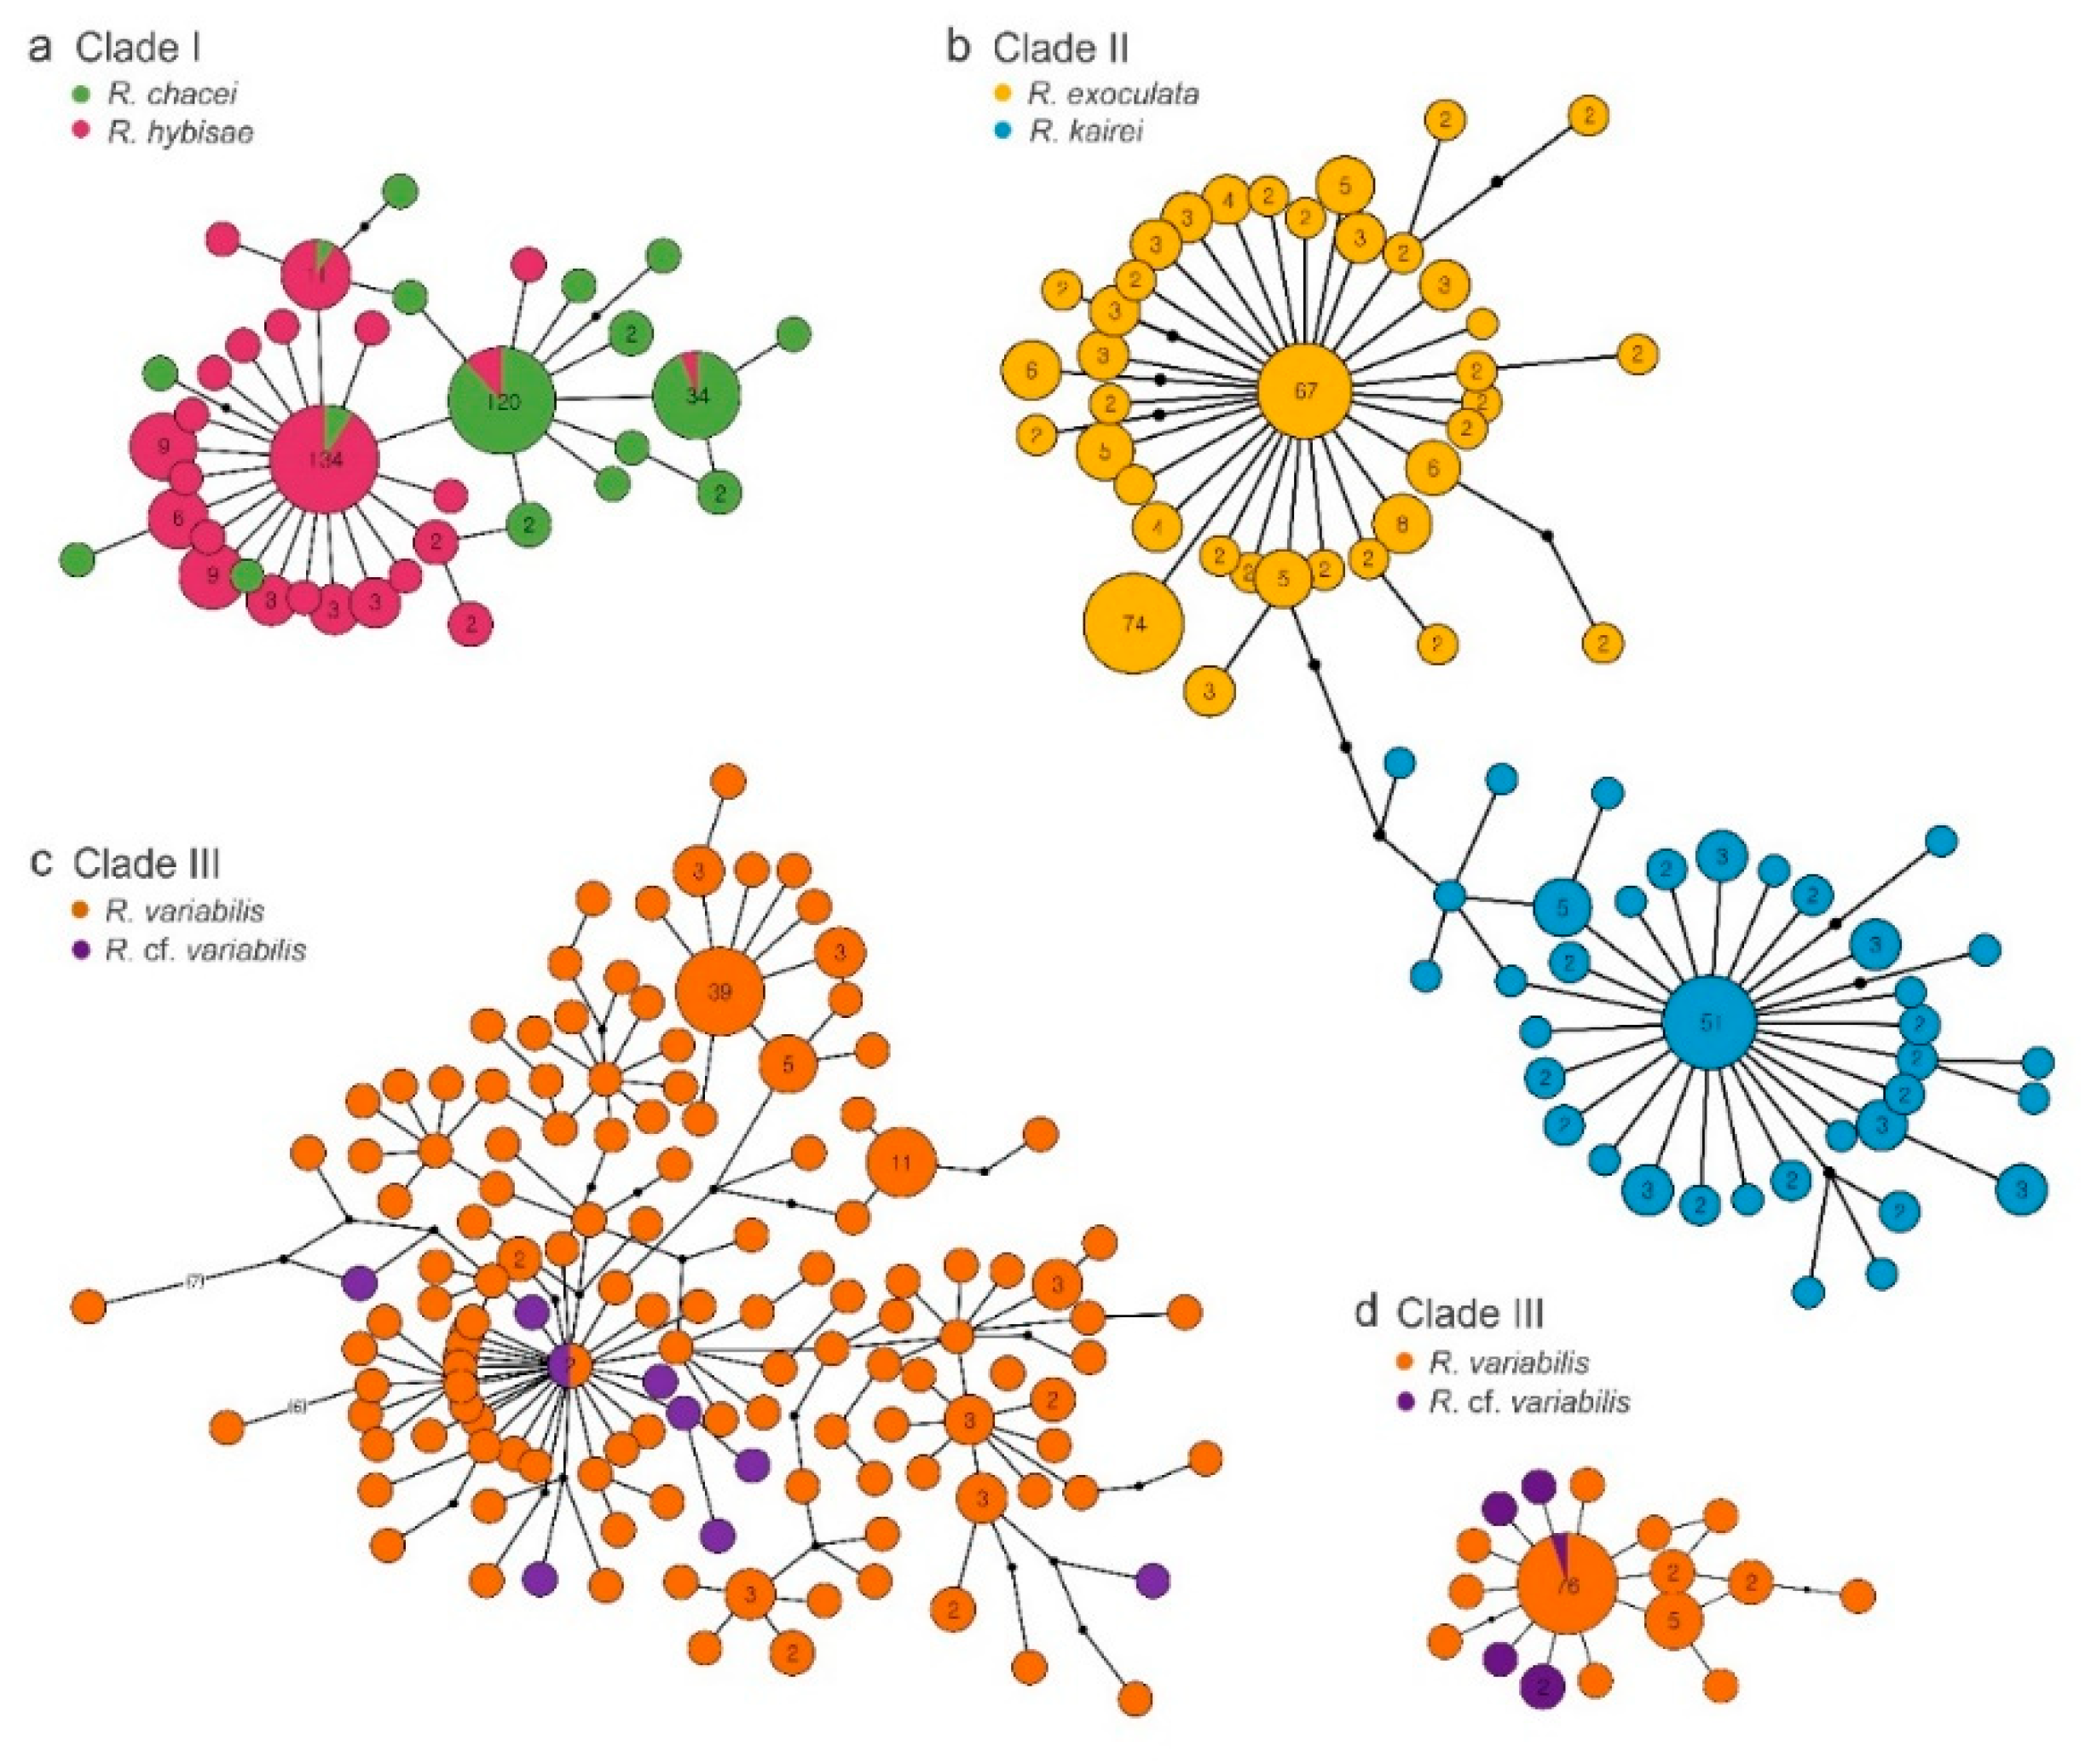
3.3. Genetic Connectivity Between Paired Rimicaris Species Within Each Clade

Based on COI sequence divergence, paired Rimicaris species within each clade fell within the range of intraspecific variation, as defined by species delimitation thresholds in DNA barcoding studies (Hebert et al., 2003b). To assess whether the paired species in each clade should be considered conspecific, we examined genetic clustering using haplotype networks, genetic structures, and gene flow estimates (Figure 4 and Figure 5, Table 2).
In Clade I, the haplotype network revealed four dominant haplotypes shared between R. chacei and R. hybisae, indicating overlapping genetic pools (Figure 4a). This result was supported by gene flow estimates, which showed moderate bidirectional exchange between the two species (Nm = 3.31 and 3.92; Figure 5a). Despite their shared haplotypes, the two species showed substantial genetic differentiation, with a pairwise FST of 0.47 (Table 2). Both species also had negative Tajima’s D and Fu’s FS values, consistent with recent independent population expansion.
In Clade II, the haplotype network revealed no shared haplotypes between R. exoculata and R. kairei, indicating clear genetic separation (Figure 4b). This result was supported by gene flow estimates, which showed low bidirectional gene flow between the two species (Nm = 0.65 and 0.01; Figure 5b), and by genetic differentiation analyses, which yielded a high pairwise FST of 0.82 (Table 2). Both species also had negative Tajima’s D and Fu’s FS values, suggesting recent independent population expansion. Notably, in each species, expansion appears to have occurred from a distinct ancestral haplotype.
In Clade III, the COI haplotype network had limited resolution in distinguishing R. variabilis and R. cf. variabilis, likely due to high haplotype diversity (~1.0) at the COI marker (Figure 4c, Table 2). Nevertheless, we detected a haplotype cluster shared by the two species. By contrast, the 16S haplotype network revealed a clearer structure, with a single dominant haplotype shared by both species and additional haplotypes restricted to R. variabilis (Figure 4d). The two species showed low genetic differentiation, with a pairwise FST of 0.10 (Table 2). Gene flow analysis revealed strong asymmetry, as migration from R. cf. variabilis (nCIR) to R. variabilis (SWP) was exceptionally high (Nm = 79.92) and the reverse flow was very low (Nm = 0.82; Figure 5c). Furthermore, R. variabilis in the SWP showed evidence of recent rapid population expansion, with θ = 0.097 (the highest value among the six Rimicaris species), negative Tajima’s D and Fu’s FS values, and very high haplotype diversity (Hd = 0.96).

3.4. Mitogenomic Similarity Between Paired Rimicaris Species

Mitogenomic-level genetic similarities between the paired Rimicaris species within each clade were examined (Table 3). Within Clade II and Clade III, the amino acid sequences of all PCGs were nearly identical, with consistent gene lengths, start and stop codons, and overall sequence composition. Most nucleotide differences between paired species were synonymous substitutions, with a few notable non-synonymous changes observed in ND3 and ND6 between R. exoculata and R. kairei in Clade II.

4. Discussion

4.1. Clade-Specific Patterns of Genetic Similarity in Rimicaris

On longer geological timescales, tectonic processes, including the formation and subsequent breakup of Pangaea from the Paleozoic to Mesozoic eras, are thought to have profoundly influenced deep-sea migration, diversification, persistence, and extinction patterns in marine lineages (McClain and Hardy, 2010; Lins et al., 2012). The discontinuous distribution of deep-sea hydrothermal vents along mid-ocean ridges reinforces geographic isolation among vent communities (Bachraty et al., 2009; Vrijenhoek, 2010; Mullineaux et al., 2018). As a result, vent ecosystems exhibit remarkable regional endemism, with more than 85% of the approximately 700 known species considered endemic (McArthur and Tunnicliffe, 1998; Wolff, 2005). However, there are exceptions to these regional endemic patterns. For example, the vent mussel Bathymodiolus septemdierum and vent barnacle Leucolepas longa occur in widely separated vent fields (Watanabe et al., 2018; Mao et al., 2025). We also observed similar cross-regional connectivity in Rimicaris species. Each genetic clade of Rimicaris comprised two species originating from different oceanic regions or ridges, rather than from the same geographic area (Figure 2). Moreover, the three clades had distinct biological and ecological traits (Table 4).
In Clade I, R. chacei (MAR) and R. hybisae (MCSC) are morphologically similar in the adult stage, particularly in the final stomach volume and surface area of their mouthparts, suggesting that they represent a single species (Teixeira et al., 2013; Methou et al., 2024b). These two taxa share four haplotypes, two putatively originating from MAR and two from MCSC, and show bidirectional gene flow, indicating some genetic overlap (Figures 4a and 5a). A potential dispersal route connecting the MCSC and MAR is the Windward Passage of the Caribbean Sea (Connelly et al., 2012; Yearsley et al., 2020). However, the comprehensive genetic and ecological data analyzed in this study did not support uninterrupted bidirectional gene flow between the two regions, suggesting the presence of barriers to genetic exchange (Table 2 and Table 5). Thus, while the shared haplotypes suggest either historical connectivity or limited ongoing gene flow, the overall genetic structure implies partial reproductive isolation. At a finer local scale, the Snake Pit vent field on MAR appears to act as a keystone site, facilitating gene flow to other MAR sites and MCSC, but not in the reverse direction (Figure S2). Notably, the two MCSC-derived haplotypes were not included in specimens from the Snake Pit, whereas the two MAR-derived haplotypes were found in specimens from all sampled regions. This asymmetric pattern of gene flow and haplotype distribution resembles a ring species model, in which adjacent populations can interbreed, but the terminal populations become reproductively isolated due to geographic separation or asynchronous mating behaviors (Irwin, 2000; Irwin et al., 2005). However, further data on mating timing, larval dispersal, and reproductive compatibility are needed to confirm whether this system truly fits a ring species dynamic.
In Clade II, R. exoculata (MAR) and R. kairei (CR-CIR) are morphologically, genetically, ecologically, and biogeographically distinct (Figures 4b and 5b, Table 2 and Table 4). Morphologically, they differ in the conspicuousness of the surface setae on the carapace, and in the size of the pereopods and antennal flagellae (Watabe and Hashimoto, 2002). Genetically, they share no COI haplotypes, exhibit low bidirectional gene flow (Nm < 1), and show significant differentiation in pairwise FST values. However, while the COI and 16S markers indicate some divergence, this evidence is insufficient for species-level separation, and the mitogenome sequences of these two species are very similar, differing only by a few synonymous substitutions (Table 3). This limited sequence variation suggests that R. exoculata and R. kairei are likely in the early stages of speciation, i.e., incipient speciation. Divergence time estimates based on mitogenomes indicate that their common ancestor split into the two lineages approximately 5.38 Mya, whereas Alvinocarididae and Rimicaris originated much earlier, at 69.36 and 28.50 Mya, respectively (Sun et al., 2024). During the Miocene, the closure of the Tethys Ocean, which once connected the Mediterranean and Indian Oceans, has been implicated in driving vicariant speciation among marine taxa with Atlantic–Mediterranean–Indian distributions (Hrbek and Meyer, 2003; Hou and Li, 2018; Liu et al., 2018; Bialik et al., 2019; Agiadi et al., 2024). A plausible scenario for Clade II is that its common ancestor dispersed freely through the Tethys Sea, and its descendants became isolated in the Atlantic and Indian Oceans following the closure of the sea, initiating their subsequent divergence.

4.2. Adaptive Divergence, Eastward Dispersal, and Regional Barriers in Clade III

In Clade III, Rimicaris variabilis (SWP) and R. cf. variabilis (nCIR) exhibit a more complex evolutionary trajectory than those in Clades I and II. Notably, R. variabilis in the SWP utilizes a distinct energy source, reflected in its markedly low δ¹³C value, which is clearly separated from the other five Rimicaris species (Figure S4). This separation likely reflects differences in the chemosynthetic carbon fixation pathways of their symbionts and associated trophic interactions—specifically, Calvin–Benson–Bassham (CBB) cycle-based versus the reductive tricarboxylic acid (rTCA) cycle-based primary production (Suh et al., 2022b). These metabolic differences further suggest adaptive divergence in nutritional strategies driven by symbiotic associations: R. variabilis derives only partial nutrition from its cephalothoracic epibionts, whereas R. cf. variabilis depends on them entirely (Table 4; Lee et al., 2021).
However, we could not find any noticeable differences in rostrum or tail morphology between the Manus and other SWP populations of R. variabilis (unpublished data). In addition, we were unable to assess the morphological characteristics of R. cf. variabilis because the available specimens were damaged. Although sequence data from only nine R. cf. variabilis specimens were used in this study, 19 individuals were examined in total. Despite this limited sample size, our COI, 16S, and complete mitogenome analysis results consistently supported their classification as a single species (Table 1, Table 2 and Table 3). A notable finding is the highly asymmetric gene flow between regions; migration from nCIR to SWP was strong, whereas that in the reverse direction was almost negligible (Figure 5c). This asymmetry, combined with higher genetic diversity in SWP than in nCIR, suggests a historical or ongoing unidirectional dispersal route from nCIR into the SWP, followed by genetic expansion within the SWP population. Importantly, this eastward dispersal contrasts previous hypotheses proposing westward migration from the Pacific to the Indian Ocean, including the Pacific origins of alvinocaridid shrimps, neolepadid barnacles, and the vent mussel Bathymodiolus septemdierum (Moalic et al., 2012; Sun et al., 2018; Watanabe et al., 2018; Mao et al., 2025).
At a finer local scale, more complex genetic structures are evident within the SWP, particularly between the Manus Basin and other SWP sites such as the North Fiji Basin, Tonga Arc, and Futuna Arc. In the 16S haplotype network, haplotypes observed only in R. variabilis found predominantly in Manus Basin individuals (Figure 4d), and this population consistently showed the highest genetic diversity (Figures S1 and S3). Based on COI sequences, both the highest θ value and greatest intraspecific variation within R. variabilis were attributed to the Manus Basin population. Remarkably, only a single haplotype was shared between the Manus Basin and other SWP sites, a pattern that may reflect parallel mutations arising independently in each region rather than true connectivity. Similar trends have been reported in other vent-endemic taxa, including the gastropod Ifremeria nautilei, limpet Lepetodrilus aff. schrolli and Austinograea crabs (Thaler et al., 2011, 2014; Lee et al., 2019; Plouviez et al., 2019). These findings indicate the presence of a strong regional biogeographic barrier between the Manus Basin and other SWP vent systems, shaped by dispersal limitations imposed by the tectonic history and ocean circulation (Mitarai et al., 2016; Tunnicliffe et al., 2024).
Overall, these results support a plausible scenario for Clade III in which CIR was the source population, with dispersal proceeding along two routes: a strong direct pathway into the Manus Basin, and a weaker pathway through the Southern Ocean toward other SWP sites. These two lineages appear to have remained largely unconnected, with the Manus Basin lineage accumulating extensive genetic diversity, whereas populations along the latter route remained more interconnected across other SWP vent fields.

4.3. New Perspective on Vent Organism Conservation

Endemism in vent and seep fauna is thought to have occurred since the Paleozoic (Little et al., 1998; Campbell, 2006; Kiel, 2010). Much of the contemporary biogeographic endemism observed in vent and seep invertebrates is thought to have been shaped by Cenozoic tectonic events and changes in oceanic circulation (< 100 Mya; Van Dover et al., 2002). Within these groups, the alvinocaridid genus Rimicaris is among the most recently diversified lineages, with 16 described species originating since the Paleocene (Sun et al., 2024). Most of these species are distributed across hydrothermal vent fields in the Pacific and Indian Oceans, reflecting diversification over a relatively short tectonic history (Vereshchaka et al., 2015; Komai et al., 2016; Komai and Giguère, 2019; Methou et al., 2024a).
Understanding species diversity, distribution, genetic diversity, and connectivity provides a critical foundation in developing effective conservation strategies for hydrothermal vent ecosystems (Van Dover et al., 2002; Van Dover, 2012; Breusing et al., 2023; Tunnicliffe et al., 2024). Historically, migrations, distribution ranges, and the biogeographic structuring of vent fauna have been inferred largely from the faunal compositions of local communities (Mullineaux et al., 2018; Perez et al., 2021; Zhou et al., 2022). In the context of potential seabed mining, conservation plans have therefore emphasized the low connectivity among vent networks and the high degree of endemism, as species recruitment is unlikely to extend across vent system boundaries (Thomas et al., 2021; Tunnicliffe et al., 2024).
However, the present study reveals evidence of cross-regional connectivity among alvinocaridid shrimps spanning different oceanic regions and ridges. This finding challenges the prevailing view that vent species are strictly confined within provincial boundaries, and instead highlights that while some taxa are strongly constrained by dispersal barriers, others maintain connectivity on broader scales.
Our results suggest that effective conservation of vent ecosystems should be framed from a global perspective, rather than being restricted to single species or narrowly defined provinces. Treating vent ecosystems as a single homogeneous management unit risks overlooking their complex evolutionary and ecological dynamics. Effective conservation strategies should also recognize the importance of distinct biogeographic provinces, ensuring that management simultaneously addresses both global-scale connectivity and local-scale endemism.

Supplementary Materials

The following supporting information can be downloaded at the website of this paper posted on Preprints.org.

Author Contributions

Won-Kyung Lee was involved in investigation, writing-original draft, and visualization. Soo-Yeon Cho were involved in investigation, writing-original draft, visualization, and formal analysis. Se-Jong Ju was involved in writing-review and editing. Se-Joo Kim was involved in conceptualization, writing-original draft, funding acquisition, and supervision. All authors edited and approved the final manuscript.

Data Availability Statement

The newly obtained sequences in this study can be found in GenBank with the accession numbers in Table S3.

Acknowledgments

We thank Dr. Cindy Lee Van Dover for her advice on vent ecosystems and for providing Manus Basin samples, which were loaned to Duke University by the Government of Papua New Guinea for baseline studies associated with the Solwara 1 Project. This work was supported by the Korea Research Institute of Bioscience and Biotechnology (KRIBB) Research Initiative Program (KGM5392521); Basic Science Research Program through the National Research Foundation of Korea funded by the Ministry of Education (RS-2021-NR065789); R & D projects by the Korean Ministry of Ocean and Fisheries (‘Exploration of Seafloor Hydrothermal Deposits in Tongan Waters (PM57063)’, and KIMST #19992001; #20170411); and Women In Science, Engineering and Technology (WISET) Grant funded by the Ministry of Science and ICT(MSIT) under the Program for Returners into R&D (WISET 계약 제2024-719호). We also thank the captain and crew of the R/V ISABU and the technical team of ROV ROPOS for their invaluable sampling efforts.

Conflicts of Interest

The authors declare no conflicts of interest.

References

  1. Agiadi, K., N. Hohmann, E. Gliozzi, D. Thivaiou, F. R. Bosellini, M. Taviani, G. Bianucci, et al. 2024. Late Miocene transformation of Mediterranean Sea biodiversity. Science Advances 10: eadp1134.
  2. Apremont, V., M.-A. Cambon-Bonavita, V. Cueff-Gauchard, D. François, F. Pradillon, L. Corbari, and M. Zbinden. 2018. Gill chamber and gut microbial communities of the hydrothermal shrimp Rimicaris chacei Williams and Rona 1986: A possible symbiosis C.-H. Kuo [ed.],. PLOS ONE 13: e0206084.
  3. Assié, A. 2016. Deep Se(a)quencing: A study of deep sea ectosymbioses using next generation sequencing. [Doctoral dissertion, Universität Bremen].
  4. Bachraty, C., P. Legendre, and D. Desbruyères. 2009. Biogeographic relationships among deep-sea hydrothermal vent faunas at global scale. Deep Sea Research Part I: Oceanographic Research Papers 56: 1371–1378.
  5. Beerli, P. Beerli, P. 2006. Comparison of Bayesian and maximum-likelihood inference of population genetic parameters. Bioinformatics 22: 341–345.
  6. Beerli, P., S. Mashayekhi, M. Sadeghi, M. Khodaei, and K. Shaw. 2019. Population Genetic Inference With MIGRATE. Current Protocols in Bioinformatics 68: e87.
  7. Bernt, M. Bernt, M., A. Donath, F. Jühling, F. Externbrink, C. Florentz, G. Fritzsch, J. Pütz, et al. 2013. MITOS: Improved de novo metazoan mitochondrial genome annotation. Molecular Phylogenetics and Evolution 69: 313–319.
  8. Bialik, O. M., M. Frank, C. Betzler, R. Zammit, and N. D. Waldmann. 2019. Two-step closure of the Miocene Indian Ocean Gateway to the Mediterranean. Scientific Reports 9: 8842.
  9. Breusing, C., M. Genetti, S. L. Russell, R. B. Corbett-Detig, and R. A. Beinart. 2022. Horizontal transmission enables flexible associations with locally adapted symbiont strains in deep-sea hydrothermal vent symbioses. Proceedings of the National Academy of Sciences 119: e2115608119.
  10. Breusing, C., S. B. Johnson, S. Mitarai, R. A. Beinart, and V. Tunnicliffe. 2023. Differential patterns of connectivity in Western Pacific hydrothermal vent metapopulations: A comparison of biophysical and genetic models. Evolutionary Applications 16: 22–35.
  11. Campbell, K. A. 2006. Hydrocarbon seep and hydrothermal vent paleoenvironments and paleontology: Past developments and future research directions. Palaeogeography, Palaeoclimatology, Palaeoecology 232: 362–407.
  12. Cavanaugh, C. M., Z. P. McKiness, I. L. G. Newton, and F. J. Stewart. 2006. Marine Chemosynthetic Symbioses. In M. Dworkin, S. Falkow, E. Rosenberg, K.-H. Schleifer, and E. Stackebrandt [eds.], The Prokaryotes, 475–507. Springer New York, New York, NY.
  13. Chagas, A. T. D. A., S. Ludwig, J. D. S. M. Pimentel, N. L. De Abreu, D. L. Nunez-Rodriguez, H. G. Leal, and E. Kalapothakis. 2020. Use of complete mitochondrial genome sequences to identify barcoding markers for groups with low genetic distance. Mitochondrial DNA Part A 31: 139–146.
  14. Colgan, D. J., A. McLauchlan, G. D. F. Wilson, S. P. Livingston, G. D. Edgecombe, J. Macaranas, G. Cassis, and M. R. Gray. 1998. Histone H3 and U2 snRNA DNA sequences and arthropod molecular evolution. Australian Journal of Zoology 46: 419–437.
  15. Connelly, D. P., J. T. Copley, B. J. Murton, K. Stansfield, P. A. Tyler, C. R. German, C. L. Van Dover, et al. 2012. Hydrothermal vent fields and chemosynthetic biota on the world’s deepest seafloor spreading centre. Nature Communications 3: 620.
  16. Dai, Q., T. Xu, Y. Li, Y. Sun, Y. Lin, T. Yahagi, M. Perez, et al. 2025. Comparative Population Genetics of Two Alvinocaridid Shrimp Species in Chemosynthetic Ecosystems of the Western Pacific. Integrative Zoology n/a.
  17. Dierckxsens, N., P. Mardulyn, and G. Smits. 2017. NOVOPlasty: de novo assembly of organelle genomes from whole genome data. Nucleic Acids Research 45: e18.
  18. Dubilier, N., C. Bergin, and C. Lott. 2008. Symbiotic diversity in marine animals: the art of harnessing chemosynthesis. Nature Reviews Microbiology 6: 725–740.
  19. Excoffier, L., and H. E. L. Lischer. 2010. Arlequin suite ver 3.5: a new series of programs to perform population genetics analyses under Linux and Windows. Molecular Ecology Resources 10: 564–567.
  20. Fisher, C., K. Takai, and N. Le Bris. 2007. Hydrothermal Vent Ecosystems. Oceanography 20: 14–23.
  21. Folmer, O., M. Black, W. Hoeh, R. Lutz, and R. Vrijenhoek. 1994. DNA primers for amplification of mitochondrial cytochrome c oxidase subunit I from diverse metazoan invertebrates. Molecular Marine Biology and Biotechnology 3: 294–299.
  22. Fuchs, S., M. D. Hannington, and S. Petersen. 2019. Divining gold in seafloor polymetallic massive sulfide systems. Mineralium Deposita 54: 789–820.
  23. German, C. R., S. Petersen, and M. D. Hannington. 2016. Hydrothermal exploration of mid-ocean ridges: Where might the largest sulfide deposits be forming? Chemical Geology 420: 114–126.
  24. Hebert, P. D. N., A. Cywinska, S. L. Ball, and J. R. deWaard. 2003a. Biological identifications through DNA barcodes. Proceedings. Biological Sciences 270: 313–321.
  25. Hebert, P. D. N., S. Ratnasingham, and J. R. deWaard. 2003b. Barcoding animal life: cytochrome c oxidase subunit 1 divergences among closely related species. Proceedings. Biological Sciences 270 Suppl 1: S96-99.
  26. Hinsinger, D., R. Debruyne, M. Thomas, G. Denys, M. I. Mennesson, J. Utage, and A. Dettaï. 2015. Fishing for barcodes in the Torrent: from COI to complete mitogenomes on NGS platforms. DNA Barcodes 3: 170.
  27. Hou, Z., and S. Li. 2018. Tethyan changes shaped aquatic diversification. Biological Reviews 93: 874–896.
  28. Hrbek, T., and A. Meyer. 2003. Closing of the Tethys Sea and the phylogeny of Eurasian killifishes (Cyprinodontiformes: Cyprinodontidae). Journal of Evolutionary Biology 16: 17–36.
  29. Irwin, D. E. 2000. SONG VARIATION IN AN AVIAN RING SPECIES. Evolution 54: 998–1010.
  30. Irwin, D. E., S. Bensch, J. H. Irwin, and T. D. Price. 2005. Speciation by Distance in a Ring Species. Science 307: 414–416.
  31. Jan, C., J. M. Petersen, J. Werner, H. Teeling, S. Huang, F. O. Glöckner, O. V. Golyshina, et al. 2014. The gill chamber epibiosis of deep-sea shrimp Rimicaris exoculata: an in-depth metagenomic investigation and discovery of Zetaproteobacteria. Environmental Microbiology 16: 2723–2738.
  32. Kiel, S. 2010. The Fossil Record of Vent and Seep Mollusks. In S. Kiel [ed.], The Vent and Seep Biota, Topics in Geobiology, 255–277. Springer Netherlands, Dordrecht.
  33. Komai, T., and T. Giguère. 2019. A new species of alvinocaridid shrimp Rimicaris Williams & Rona, 1986 (Decapoda: Caridea) from hydrothermal vents on the Mariana Back Arc Spreading Center, northwestern Pacific. Journal of Crustacean Biology 39: 640–650.
  34. Komai, T., L. Menot, and M. Segonzac. 2016. New records of caridean shrimp (Crustacea: Decapoda) from hydrothermally influenced fields off Futuna Island, Southwest Pacific, with description of a new species assigned to the genus Alvinocaridinides Komai & Chan, 2010 (Alvinocarididae). Zootaxa 4098: 298–310.
  35. Komai, T., and M. Segonzac. 2005. A revision of the genus Alvinocaris Williams and Chace (Crustacea: Decapoda: Caridea: Alvinocarididae), with descriptions of a new genus and a new species of Alvinocaris. Journal of Natural History 39: 1111–1175.
  36. Komai, T., and S. Tsuchida. 2015. New records of Alvinocarididae (Crustacea: Decapoda: Caridea) from the southwestern Pacific hydrothermal vents, with descriptions of one new genus and three new species. Journal of Natural History 49: 1789–1824.
  37. Lee, W.-K., S. K. Juniper, M. Perez, S.-J. Ju, and S.-J. Kim. 2021. Diversity and characterization of bacterial communities of five co-occurring species at a hydrothermal vent on the Tonga Arc. Ecology and Evolution 11: 4481–4493.
  38. Lee, W.-K., S.-J. Kim, B. K. Hou, C. L. Van Dover, and S.-J. Ju. 2019. Population genetic differentiation of the hydrothermal vent crab Austinograea alayseae (Crustacea: Bythograeidae) in the Southwest Pacific Ocean J. A. Eble [ed.],. PLOS ONE 14: e0215829.
  39. Librado, P., and J. Rozas. 2009. DnaSP v5: a software for comprehensive analysis of DNA polymorphism data. Bioinformatics 25: 1451–1452.
  40. Lins, L. S. F., S. Y. W. Ho, G. D. F. Wilson, and N. Lo. 2012. Evidence for Permo-Triassic colonization of the deep sea by isopods. Biology Letters 8: 979–982.
  41. Little, C. T. S., R. J. Herrington, V. V. Maslennikov, and V. V. Zaykov. 1998. The fossil record of hydrothermal vent communities. Geological Society, London, Special Publications 148: 259–270.
  42. Liu, H., S. Li, A. Ugolini, F. Momtazi, and Z. Hou. 2018. Tethyan closure drove tropical marine biodiversity: Vicariant diversification of intertidal crustaceans. Journal of Biogeography 45: 941–951.
  43. Mao, Q., C. Chen, J. Sun, J. Liang, Y. Sun, Y. Wang, C. Zeng, et al. 2025. Genetic Structure in a Trans-Oceanic Hot Vent Mussel Reveals Four Metapopulations With Implications for Conservation. Journal of Biogeography n/a: e70017.
  44. Martin, J. W., and T. A. Haney. 2005. Decapod crustaceans from hydrothermal vents and cold seeps: a review through 2005. Zoological Journal of the Linnean Society 145: 445–522.
  45. Matzen da Silva, J., S. Creer, A. dos Santos, A. C. Costa, M. R. Cunha, F. O. Costa, and G. R. Carvalho. 2011. Systematic and Evolutionary Insights Derived from mtDNA COI Barcode Diversity in the Decapoda (Crustacea: Malacostraca). PLOS ONE 6: e19449.
  46. McArthur, A. G., and V. Tunnicliffe. 1998. Relics and antiquity revisited in the modern vent fauna. Geological Society, London, Special Publications 148: 271–291.
  47. McClain, C. R., and S. M. Hardy. 2010. The dynamics of biogeographic ranges in the deep sea. Proceedings of the Royal Society B: Biological Sciences 277: 3533–3546.
  48. Methou, P., C. Chen, and T. Komai. 2024a. Revision of the alvinocaridid shrimp genus Rimicaris Williams & Rona, 1986 (Decapoda: Caridea) with description of a new species from the Mariana Arc hydrothermal vents. Zootaxa 5406: 501–518.
  49. Methou, P., V. Cueff-Gauchard, L. N. Michel, N. Gayet, F. Pradillon, and M. Cambon-Bonavita. 2023. Symbioses of alvinocaridid shrimps from the South West Pacific: No chemosymbiotic diets but conserved gut microbiomes. Environmental Microbiology Reports 15: 614–630.
  50. Methou, P., M. Guéganton, J. T. Copley, H. Kayama Watanabe, F. Pradillon, M.-A. Cambon-Bonavita, and C. Chen. 2024b. Distinct development trajectories and symbiosis modes in vent shrimps M. Kronforst, and M. Zelditch [eds.],. Evolution 78: 413–422.
  51. Methou, P., I. Hernández-Ávila, C. Cathalot, M. Cambon-Bonavita, and F. Pradillon. 2022a. Population structure and environmental niches of Rimicaris shrimps from the Mid-Atlantic Ridge. Marine Ecology Progress Series 684: 1–20.
  52. Methou, P., M. Hikosaka, C. Chen, H. K. Watanabe, N. Miyamoto, H. Makita, Y. Takahashi, and R. G. Jenkins. 2022b. Symbiont Community Composition in Rimicaris kairei Shrimps from Indian Ocean Vents with Notes on Mineralogy K. N. Johnson [ed.],. Applied and Environmental Microbiology 88: e00185-22.
  53. Mitarai, S., H. Watanabe, Y. Nakajima, A. F. Shchepetkin, and J. C. McWilliams. 2016. Quantifying dispersal from hydrothermal vent fields in the western Pacific Ocean. Proceedings of the National Academy of Sciences 113: 2976–2981.
  54. Moalic, Y., D. Desbruyères, C. M. Duarte, A. F. Rozenfeld, C. Bachraty, and S. Arnaud-Haond. 2012. Biogeography Revisited with Network Theory: Retracing the History of Hydrothermal Vent Communities. Systematic Biology 61: 127.
  55. van der Most, N., P.-Y. Qian, Y. Gao, and S. Gollner. 2023. Active hydrothermal vent ecosystems in the Indian Ocean are in need of protection. Frontiers in Marine Science 9.
  56. Mullineaux, L. S., A. Metaxas, S. E. Beaulieu, M. Bright, S. Gollner, B. M. Grupe, S. Herrera, et al. 2018. Exploring the Ecology of Deep-Sea Hydrothermal Vents in a Metacommunity Framework. Frontiers in Marine Science 5: 49.
  57. Mullineaux, L. S., S. W. Mills, N. Le Bris, S. E. Beaulieu, S. M. Sievert, and L. N. Dykman. 2020. Prolonged recovery time after eruptive disturbance of a deep-sea hydrothermal vent community. Proceedings of the Royal Society B: Biological Sciences 287: 20202070.
  58. Nye, V., J. Copley, and S. Plouviez. 2012. A new species of Rimicaris (Crustacea: Decapoda: Caridea: Alvinocarididae) from hydrothermal vent fields on the Mid-Cayman Spreading Centre, Caribbean. Journal of the Marine Biological Association of the United Kingdom 92: 1057–1072.
  59. Nymoen, A. R., J. A. Kongsrud, E. Willassen, and T. Bakken. 2024. When standard DNA barcodes do not work for species identification: intermixed mitochondrial haplotypes in the Jaera albifrons complex (Crustacea: Isopoda). Marine Biodiversity 54: 43.
  60. Palumbi, S. R. 1991. The simple fool’s guide to PCR. Version 2.0. Dept. of Zoology and Kewalo Marine Laboratory, University of Hawaii, Honolulu, HI.
  61. Peakall, R., and P. E. Smouse. 2006. genalex 6: genetic analysis in Excel. Population genetic software for teaching and research. Molecular Ecology Notes 6: 288–295.
  62. Perez, M., J. Sun, Q. Xu, and P.-Y. Qian. 2021. Structure and Connectivity of Hydrothermal Vent Communities Along the Mid-Ocean Ridges in the West Indian Ocean: A Review. Frontiers in Marine Science 8: 744874.
  63. Plouviez, S., A. L. LaBella, D. W. Weisrock, F. A. B. Von Meijenfeldt, B. Ball, J. E. Neigel, and C. L. Van Dover. 2019. Amplicon sequencing of 42 nuclear loci supports directional gene flow between South Pacific populations of a hydrothermal vent limpet. Ecology and Evolution 9: 6568–6580.
  64. Ramirez-Llodra, E., T. M. Shank, and C. R. German. 2007. Biodiversity and Biogeography of Hydrothermal Vent Species: Thirty Years of Discovery and Investigations. Oceanography 20: 30–41.
  65. Ranasinghe, U. G. S. L., J. Eberle, J. Thormann, C. Bohacz, S. P. Benjamin, and D. Ahrens. 2022. Multiple species delimitation approaches with COI barcodes poorly fit each other and morphospecies – An integrative taxonomy case of Sri Lankan Sericini chafers (Coleoptera: Scarabaeidae). Ecology and Evolution 12: e8942.
  66. Shearer, T. L., and M. A. Coffroth. 2008. DNA BARCODING: Barcoding corals: limited by interspecific divergence, not intraspecific variation. Molecular Ecology Resources 8: 247–255.
  67. Sogin, E. M., M. Kleiner, C. Borowski, H. R. Gruber-Vodicka, and N. Dubilier. 2021. Life in the Dark: Phylogenetic and Physiological Diversity of Chemosynthetic Symbioses. Annual Review of Microbiology 75: 695–718.
  68. Suh, Y. J., M.-S. Kim, S.-J. Kim, D. Kim, and S.-J. Ju. 2022a. Carbon sources and trophic interactions of vent fauna in the Onnuri Vent Field, Indian Ocean, inferred from stable isotopes. Deep Sea Research Part I: Oceanographic Research Papers 182: 103683.
  69. Suh, Y. J., M.-S. Kim, W.-K. Lee, H. Yoon, I. Moon, J. Jung, and S.-J. Ju. 2022b. Niche partitioning of hydrothermal vent fauna in the North Fiji Basin, Southwest Pacific inferred from stable isotopes. Marine Biology 169: 149.
  70. Sun, S., Z. Sha, and Y. Wang. 2018. Phylogenetic position of Alvinocarididae (Crustacea: Decapoda: Caridea): New insights into the origin and evolutionary history of the hydrothermal vent alvinocarid shrimps. Deep Sea Research Part I: Oceanographic Research Papers 141: 93–105.
  71. Sun, Y., W. Liu, J. Chen, J. Li, Y. Ye, and K. Xu. 2024. Sequence comparison of the mitochondrial genomes of five caridean shrimps of the infraorder Caridea: phylogenetic implications and divergence time estimation. BMC Genomics 25: 968.
  72. Tamura, K., G. Stecher, and S. Kumar. 2021. MEGA11: Molecular Evolutionary Genetics Analysis Version 11. Molecular Biology and Evolution 38: 3022–3027.
  73. Teixeira, S., K. Olu, C. Decker, R. L. Cunha, S. Fuchs, S. Hourdez, E. A. Serrão, and S. Arnaud-Haond. 2013. High connectivity across the fragmented chemosynthetic ecosystems of the deep Atlantic Equatorial Belt: efficient dispersal mechanisms or questionable endemism? Molecular Ecology 22: 4663–4680.
  74. Templeton, A. R., K. A. Crandall, and C. F. Sing. 1992. A cladistic analysis of phenotypic associations with haplotypes inferred from restriction endonuclease mapping and DNA sequence data. III. Cladogram estimation. Genetics 132: 619–633.
  75. Thaler, A. D., S. Plouviez, W. Saleu, F. Alei, A. Jacobson, E. A. Boyle, T. F. Schultz, et al. 2014. Comparative Population Structure of Two Deep-Sea Hydrothermal-Vent-Associated Decapods (Chorocaris sp. 2 and Munidopsis lauensis) from Southwestern Pacific Back-Arc Basins E. Sotka [ed.],. PLoS ONE 9: e101345.
  76. Thaler, A. D., K. Zelnio, W. Saleu, T. F. Schultz, J. Carlsson, C. Cunningham, R. C. Vrijenhoek, and C. L. Van Dover. 2011. The spatial scale of genetic subdivision in populations of Ifremeria nautilei, a hydrothermal-vent gastropod from the southwest Pacific. BMC Evolutionary Biology 11: 372.
  77. Thomas, E. A., A. Molloy, N. B. Hanson, M. Böhm, M. Seddon, and J. D. Sigwart. 2021. A Global Red List for Hydrothermal Vent Molluscs. Frontiers in Marine Science 8.
  78. Tunnicliffe, V., C. Chen, T. Giguère, A. A. Rowden, H. K. Watanabe, and O. Brunner. 2024. Hydrothermal vent fauna of the western Pacific Ocean: Distribution patterns and biogeographic networks. Diversity and Distributions 30: e13794.
  79. Van Dover, C. L. 2012. Hydrothermal Vent Ecosystems and Conservation. Oceanography 25: 313–316.
  80. Van Dover, C. L. 2014. Impacts of anthropogenic disturbances at deep-sea hydrothermal vent ecosystems: A review. Marine Environmental Research 102: 59–72.
  81. Van Dover, C. L. 2002. Trophic relationships among invertebrates at the Kairei hydrothermal vent field (Central Indian Ridge). Marine Biology 141: 761–772.
  82. Van Dover, C. L., S. Arnaud-Haond, M. Gianni, S. Helmreich, J. A. Huber, A. L. Jaeckel, A. Metaxas, et al. 2018. Scientific rationale and international obligations for protection of active hydrothermal vent ecosystems from deep-sea mining. Marine Policy 90: 20–28.
  83. Van Dover, C. L., C. R. German, K. G. Speer, L. M. Parson, and R. C. Vrijenhoek. 2002. Evolution and Biogeography of Deep-Sea Vent and Seep Invertebrates. Science 295: 1253–1257.
  84. Vences, M., S. Patmanidis, J.-C. Schmidt, M. Matschiner, A. Miralles, and S. S. Renner. 2024. Hapsolutely: a user-friendly tool integrating haplotype phasing, network construction, and haploweb calculation. Bioinformatics Advances 4: vbae083.
  85. Vereshchaka, A. L., D. N. Kulagin, and A. A. Lunina. 2015. Phylogeny and New Classification of Hydrothermal Vent and Seep Shrimps of the Family Alvinocarididae (Decapoda) A. Hejnol [ed.],. PLOS ONE 10: e0129975.
  86. Versteegh, E. A. A., C. L. Van Dover, L. Van Audenhaege, and M. Coleman. 2023. Multiple nutritional strategies of hydrothermal vent shrimp (Rimicaris hybisae) assemblages at the Mid-Cayman Rise. Deep Sea Research Part I: Oceanographic Research Papers 192: 103915.
  87. Vrijenhoek, R. C. 2010. Genetic diversity and connectivity of deep-sea hydrothermal vent metapopulations: HYDROTHERMAL VENT METAPOPULATIONS. Molecular Ecology 19: 4391–4411.
  88. Watabe, H., and J. Hashimoto. 2002. A New Species of the Genus Rimicaris (Alvinocarididae: Caridea: Decapoda) from the Active Hydrothermal Vent Field, “Kairei Field,” on the Central Indian Ridge, the Indian Ocean. Zoological Science 19: 1167–1174.
  89. Watanabe, H. K., C. Chen, D. P. Marie, K. Takai, K. Fujikura, and B. K. K. Chan. 2018. Phylogeography of hydrothermal vent stalked barnacles: a new species fills a gap in the Indian Ocean ‘dispersal corridor’ hypothesis. Royal Society Open Science 5: 172408.
  90. Williams, A. B., and P. A. Rona. 1986. Two New Caridean Shrimps (Bresiliidae) From a Hydrothermal Field on the Mid-atlantic Ridge. Journal of Crustacean Biology 6: 446–462.
  91. Wolff, T. 2005. Composition and endemism of the deep-sea hydrothermal vent fauna. CBM-Cahiers de Biologie Marine. 46: 97–104.
  92. Won, Y., S. J. Hallam, G. D. O’Mullan, and R. C. Vrijenhoek. 2003. Cytonuclear disequilibrium in a hybrid zone involving deep-sea hydrothermal vent mussels of the genus Bathymodiolus. Molecular Ecology 12: 3185–3190.
  93. WoRMS Editorial Board. 2025. World Register of Marine Species. Available from https://www.marinespecies.org at VLIZ. Accessed 2025-09-09.
  94. Yearsley, J. M., D. M. Salmanidou, J. Carlsson, D. Burns, and C. L. Van Dover. 2020. Biophysical models of persistent connectivity and barriers on the northern Mid-Atlantic Ridge. Deep Sea Research Part II: Topical Studies in Oceanography 180: 104819.
  95. Zhang, Z. 2022. KaKs_Calculator 3.0: Calculating Selective Pressure on Coding and Non-Coding Sequences. Genomics, Proteomics & Bioinformatics 20: 536–540.
  96. Zhou, Y., C. Chen, D. Zhang, Y. Wang, H. K. Watanabe, J. Sun, D. Bissessur, et al. 2022. Delineating biogeographic regions in Indian Ocean deep-sea vents and implications for conservation. Diversity and Distributions 28: 2858–2870.
Figure 1. Geographic sampling sites of sequenced specimens of the six Rimicaris species used in this study.
Preprints 187036 g001
Figure 2. Neighbor-joining (NJ) tree based on cytochrome c oxidase I (COI) sequences of six Rimicaris species.
Preprints 187036 g002
Figure 3. Principle coordinate analysis plot based on COI sequences of six Rimicaris species.
Preprints 187036 g003
Figure 4. TCS haplotype networks constructed based on (a–c) COI and (d) 16S haplotypes for paired Rimicaris species within each clade, as defined by the COI-based NJ tree. Circle sizes reflect haplotype frequency (values shown for frequencies >1), and colors denote individual species. Dots or numbers on branches indicate the number of nucleotide substitutions between haplotypes.
Preprints 187036 g004
Figure 5. Gene flow estimates between paired Rimicaris species within (a) Clade I, (b) Clade II, and (c) Clade III, as defined by the COI-based NJ tree. Numbers on arrows indicate the mean number of migrants per generation. θ, mutation-scaled population size; CR-CIR, Carlsberg Ridge–Central Indian Ridge; MAR, Mid-Atlantic Ridge; MCSC, Mid-Cayman Spreading Center; SWP, Southwestern Pacific Ocean.
Preprints 187036 g005
Table 1. Genetic divergence among six Rimicaris species. Interspecific variation is shown for the cytochrome c oxidase I (COI, bottom) and 16S (top) genes.
Species
(no., %)
R. chacei
(5, 0.00)
R. hybisae
(6, 0.08)
R. exoculata
(10, 0.09)
R. kairei
(1, –)
R. variabilis
(90, 0.13)
R. cf. variabilis
(9, 0.25)
Clade I R. chacei
(167, 0.19)
0.04 0.30 0.50 0.50 0.61
R. hybisae
(197, 0.19)
0.35 0.34 0.54 0.55 0.65
Clade II R. exoculata
(246, 0.35)
7.47 7.70 0.30 0.79 0.90
R. kairei
(112, 0.33)
7.09 6.97 1.90 0.99 1.10
Clade III R. variabilis
(196, 1.47)
8.60 8.74 7.47 8.05 0.18
R. cf. variabilis
(9, 0.98)
8.59 8.73 6.95 7.75 1.34
Number of sequences and intraspecific variation.
Table 2. Genetic structures of the CO1 and 16S sequences of six Rimicaris species.
Gene Species N S H Hd Nd (%) D FS Pairwise FST
COI Clade Ⅰ R. chacei 167 18 17 0.56 0.19 –2.02* –14.99*
R. hybisae 197 23 24 0.61 0.19 –2.18* –28.13*
Overall 364 35 37 0.75 0.27 –2.16* –27.75* 0.472*
Clade II R. exoculata 246 36 38 0.83 0.35 –2.13* –27.10*
R. kairei 112 36 37 0.79 0.33 –2.43* –28.56*
Overall 358 56 75 0.90 1.02 –1.45* –25.15* 0.819*
Clade III R. variabilis 196 93 128 0.96 1.47 –1.89* –24.86*
R. cf. variabilis 9 15 9 1.00 0.98 –1.21 –5.58*
Overall 205 95 136 0.96 1.46 –1.91* –24.82* 0.100*
16S Clade III R. variabilis 90 12 13 0.36 0.13 –2.07* –13.35*
R. cf. variabilis 9 4 5 0.81 0.25 –1.15 –2.36*
Overall 99 16 17 0.41 0.14 –2.25* –20.51* 0.089*
Between paired species within each clade, as defined by the COI-based neighbor-joining tree. * Significant values (P < 0.05). D, Tajima’s D; FS, Fu’s FS; FST, fixation index; H, total number of haplotypes; Hd, haplotype diversity; N, sample size; Nd, nucleotide diversity (%); S, polymorphic site.
Table 3. Comparison of nucleotide and amino acid sequences of mitochondrial genes between paired Rimicaris species in Clade II and Clade III, as defined by the COI-based neighbor-joining tree.
Gene Clade II(no. of mitogenomes) Clade III (no. of mitogenomes)
R. exoculata(1) vs. R. kairei (1) R. variabilis(4) vs. R. cf. variabilis (1)
Nucleotide Amino acid Substitution ratio
(Ka/Ks)
Nucleotide Amino acid Substitution ratio
(Ka/Ks)*
Length
(bp)
Similarity (%) Length
(no.)
Similarity (%) Length
(bp)†, *
Similarity (%)* Length
(no.)*
Similarity (%)*
ATP6 672/672 97.62 224/224 99.55 0.06 672/672 99.00 224/224 100.00 0.00
ATP8 156/156 98.72 52/52 100.00 0.00 156/156 100.00 52/52 100.00 0.00
COXI 1536/1536 98.24 512/512 100.00 0.00 1536/1536 98.23 512/512 100.00 0.00
COXII 690/690 98.99 230/230 100.00 0.00 690/690 99.35 230/230 100.00 0.00
COXIII 786/786 99.11 262/262 100.00 0.00 786/786 99.75 262/262 100.00 0.00
CYTB 1134/1134 98.59 378/378 99.47 0.06 1134/1134 98.48 378/378 99.60 0.00
ND1 939/939 97.76 313/313 100.00 0.00 939/939 98.90 313/313 99.60 0.03
ND2 993/993 97.89 331/331 99.40 0.05 993/993 98.36 331/331 99.62 0.03
ND3 351/351 99.15 117/117 99.15 0.16 351/351 99.86 117/117 100.00 0.00
ND4 1338/1338 97.82 446/446 99.55 0.02 1338/1338 98.41 446/446 99.78 0.02
ND4L 297/297 99.00 99/99 100.00 0.00 297/297 99.50 99/99 100.00 0.00
ND5 1728/1728 97.14 576/576 99.31 0.02 1728/1728 98.24 576/576 99.44 0.04
ND6 513/513 96.78 171/171 97.69 0.11 513/513 98.78 171/171 99.71 0.04
13 PCGs 11133/11133 98.04 3711/3711 99.57 0.03 11133/11133 98.70 3711/3711 99.76 0.03
12S rRNA 865/865 99.42 866/866 99.25
16S rRNA 1310/1310 99.47 1310/1309 99.62
Control Region 1005/1004 93.84 1008/1008 97.07
Length excludes the stop codon; * mean value.
Table 4. Major ecological features of the six Rimicaris species.
Species Distribution Density* Cephalothorax Reference
Volume Symbiotic diet Symbiont
Clade I R. chacei MAR Low Non-enlarged Partially dependent C > G Apremont et al. (2018)
Methou et al. (2024b)
R. hybisae MCSC High or low Enlarged Dependent C Assié (2016)
Versteegh et al. (2023)
Methou et al. (2024b)
Clade II R. exoculata MAR High Enlarged Dependent C > G Williams and Rona (1986)
Jan et al. (2014)
Methou et al. (2022a)
Methou et al. (2024b)
R. kairei CR-CIR High Enlarged Dependent C > D > B Watabe and Hashimoto (2002)
Van Dover (2002)
Methou et al. (2022b)
Clade III R. variabilis SWP High or low Non-enlarged Partially dependent G > C Komai and Tsuchida (2015)
Lee et al. (2021)
Suh et al. (2022b)
Methou et al. (2023)
R. cf. variabilis CIR Low Non-enlarged Dependent N/A Suh et al. (2022a)
This study
* Population density around a chimney (high, ≥ 1000 individuals per m2; low, < 1000 individuals per m2). Dominant symbiont taxa in the cephalothorax representing > 20% of the community, listed in order of relative abundance. B, Bacteroidia; C, Campylobacteria; CR-CIR, Carlsberg Ridge–Central Indian Ridge; D, Desulfobulbia; G, Gammaproteobacteria; MAR, Mid-Atlantic Ridge; MCSC, Mid-Cayman Spreading Center; SWP, Southwestern Pacific Ocean.
Disclaimer/Publisher’s Note: The statements, opinions and data contained in all publications are solely those of the individual author(s) and contributor(s) and not of MDPI and/or the editor(s). MDPI and/or the editor(s) disclaim responsibility for any injury to people or property resulting from any ideas, methods, instructions or products referred to in the content.
Copyright: This open access article is published under a Creative Commons CC BY 4.0 license, which permit the free download, distribution, and reuse, provided that the author and preprint are cited in any reuse.
Prerpints.org logo

Preprints.org is a free preprint server supported by MDPI in Basel, Switzerland.

Subscribe

Disclaimer

Terms of Use

Privacy Policy

Privacy Settings

© 2025 MDPI (Basel, Switzerland) unless otherwise stated