
Submitted:
29 October 2025
Posted:
29 October 2025
You are already at the latest version
Abstract
Limpets are marine gastropod molluscs well adapted to intertidal rocky environments, yet their taxonomic resolution remains challenging due to extensive morphological convergence and the presence of cryptic species. In this study, we applied an integrative taxonomic framework combining multi-locus DNA barcoding and fine-scale morphological characterization to clarify species boundaries within three families of limpets—Nacellidae, Lottiidae, and Siphonariidae. A total of 132 individuals collected from six coastal sites in Shenzhen and adjacent areas of southern China were analyzed using four mitochondrial and nuclear markers (COI, 16S rRNA, Cytb, and 28S rRNA), together with scanning electron microscopy (SEM) observations of radular morphology. Molecular analyses identified nine distinct species across five genera. Kimura two-parameter (K2P) distance analyses revealed clear barcode gaps in 16S rRNA, Cytb, and 28S rRNA genes, particularly among Cellana and Nipponacmea, whereas COI exhibited stronger discriminatory power within Siphonaria. Moreover, our study provides newly generated Cytb sequences for Lottia luchuana, Siphonaria atra, Siphonaria sp. and Siphonaria sirius, enriching the public genetic reference database and explaining the lack of corresponding records in previous BLAST searches. SEM-based radular features displayed consistent interspecific variation that corroborated molecularly defined clades, offering reliable morphological evidence for species delimitation. Collectively, our findings highlight the value of integrating lineage-specific molecular markers with detailed morphological analyses to resolve taxonomic ambiguities in morphologically conservative marine gastropods. Furthermore, this approach strengthens molecular reference resources essential for future biodiversity and evolutionary research on intertidal limpets.
Keywords:
limpets
; DNA barcoding
; integrative taxonomy
; SEM morphology
; species delimitation
1. Introduction
Limpets, a polyphyletic assemblage of intertidal gastropods, play crucial ecological roles in coastal ecosystems and have long attracted attention in taxonomic and evolutionary studies, while also serving as an arguable molluscan model organism for genetic and developmental research [1]. However, species delimitation in limpets remains challenging due to extensive morphological convergence and the presence of cryptic species [2,3], which hinders its application in various researches. Traditional morphological approaches often fail to discriminate closely related taxa, particularly in groups such as Patelloida, Cellana, and Siphonaria, due to features of their shells are evolutionarily labile and prone to homoplasy[2]. As a result, accurate identification and assessment of the diversity of limpets demand more robust, integrative methodology.
DNA barcoding has become a widely adopted molecular tool for species identification and delineation, particularly in taxonomically challenging groups [4]. It involves the use of standardized gene regions to generate molecular signatures for individual taxa [4,5]. In molluscs, several mitochondrial and nuclear loci have demonstrated high discriminatory power and are frequently used in integrative taxonomy [6].
In this study, we employed four commonly used DNA barcode markers: mitochondrial cytochrome c oxidase subunit I (COI), 16S ribosomal RNA (16S rRNA), cytochrome b (Cyt b), and nuclear 28S ribosomal RNA (28S rRNA). COI gene is the most established animal barcode, known for its high variability and effectiveness in distinguishing closely related marine invertebrates [7,8]. 16S rRNA provides complementary phylogenetic signal and is particularly useful in resolving relationships at higher taxonomic levels or when COI shows saturation [9]. Cytb, another mitochondrial gene, offers additional resolution in certain molluscan lineages due to its moderate mutation rate [9,10]. Meanwhile, 28S rRNA, a nuclear-encoded marker, evolves more slowly and is valuable for corroborating mitochondrial results and mitigating potential biases [10,11,12].
While single-locus barcoding can be effective for species identification, its resolution is often limited by locus-specific evolutionary constraints, such as substitution saturation or incomplete lineage sorting [4]. Multiple DNA barcode markers enhance taxonomic resolution by integrating complementary genetic signals and minimizing biases associated with individual genes [13]. In order to enhance the accuracy of DNA-based species delimitation, mitochondrial barcodes should be supplemented with nuclear markers. This approach mitigates the limitations of single-locus analyses and helps detect potential mito-nuclear incongruence, particularly in recently diverged or cryptic taxa [9,14,15].
While molecular data are essential, morphological traits—particularly internal features such as radular morphology—remain valuable for species delimitation [16]. In limpets, external characters like shell shape are often influenced by environmental variation and are thus unreliable. In contrast, radular traits observed via scanning electron microscopy (SEM) offer stable diagnostic features for distinguishing closely related or cryptic species. Integrating multi-locus genetic data with such morphological evidence has proven effective in several recent studies, enabling more robust taxonomic resolution [17,18,19,20].
To clarify species boundaries among intertidal limpets of the orders Patellida and Siphonariida from six coastal sites in South China, we employed an integrative taxonomic framework. We combined four DNA barcode markers with SEM analysis of radular morphology to resolve taxonomic identities and uncover potential cryptic lineages. This multi-locus and morphological approach allowed us to assess the relative discriminatory power of each marker across genera and detect previously unrecognized genetic diversity.
2. Materials and Methods
2.1. Sample Acquisition and Preprocessing
Sample collections were conducted across six coastal sites in Shenzhen and its neighboring cities, Huizhou and Shanwei in China. Sites were selected based on the presence of extensive intertidal zones with abundant rocky substrates, relatively pristine marine environments, and minimal anthropogenic disturbance. Sampling was performed during low tide, when water levels were below 50 cm, to optimize exposure of the intertidal habitat. A systematic strategy was employed to cover the full extent of the rocky intertidal zone, with preference given to larger-sized individuals to obtain sufficient biological material. Immediately after collection, muscle tissues were dissected on-site and preserved at −20 °C to maintain sample integrity.
2.2. Genomic DNA Extraction
Genomic DNA was extracted from approximately 50 mg of limpet muscle tissue using a modified CTAB protocol [21]. Samples were first incubated in 500 μL of STE buffer (100 mM NaCl, 10 mM Tris-HCl, 1 mM EDTA, pH 8.0), followed by the addition of 125 μL of 10% SDS and 5 μL of proteinase K. The mixture was incubated at 60 °C for 90 minutes in a water bath to ensure complete lysis and protein digestion. After incubation, samples were centrifuged at 5000 rpm for 5 minutes at room temperature, and the supernatant was transferred to a fresh tube.
To the supernatant, 100 μL of 5 M NaCl and 80 μL of CTAB/NaCl solution were added, followed by incubation at 65 °C for 30 minutes. An equal volume of chloroform:isoamyl alcohol (24:1, v/v) was then added, and the mixture was centrifuged at 6000 rpm for 5 minutes. The upper aqueous phase was transferred to a new tube and extracted twice with an equal volume of phenol, each followed by centrifugation at 6000 rpm for 5 minutes. This was followed by a final chloroform:isoamyl alcohol extraction step under the same conditions.
DNA was precipitated by adding an equal volume of isopropanol to the final supernatant and incubating at room temperature for 30 minutes. The precipitated DNA was pelleted by centrifugation at 12,000 rpm for 10 minutes, then washed twice with 150–500 μL of 80% ethanol, each followed by centrifugation at 12,000 rpm for 5 minutes. The DNA pellet was air-dried until all ethanol had evaporated and finally resuspended in ~30 μL of TE buffer (10 mM Tris-HCl, 1 mM EDTA, pH 8.0). DNA quality and concentration were assessed using a spectrophotometer.
2.3. SEM Images Acquisition and Processing
Radulae were dissected from the buccal mass under a binocular microscope, cleaned with a diluted NaOH solution, and rinsed thoroughly with double-distilled water. The samples were air-dried overnight, mounted on glass slides, sputter-coated with gold at 60 mA, and examined under a scanning electron microscope KYKY-EM6200 operated at 15–16 kV under vacuum.
2.4. PCR Reactions and Pre-Sequencing Preparation
The mtDNA cytochrome c oxidase I (COI), cytochrome b (Cytb), the large-subunit ribosomal RNA (16S rRNA) and small-subunit ribosomal RNA (28S rRNA) were used as molecular markers in this study. PCR products of each gene were amplified with universal primers (Table S1). PCR amplification was performed in a reaction volume of 25 μL containing 9.5μL ddH2O, 1μL of each primer, 12.5 μL of Taq polymerase Takara, and 1 μL of template DNA. The amplification cycle consisted of an initial denaturation for 3 min at 94 °C, followed by 30 cycles of denaturation for 45 s at 94 °C, annealing for 90 s at a gene-specific annealing temperature (50℃ for COI, 52 °C for Cytb, 51 °C for the 16S and 48℃ for 28S) and extension for 120 s at 72 °C, followed by a 5 min final extension at 72 °C.
2.5. Sequence Data Filtering and BLASTn
Sanger sequencing results were quality-filtered to remove ambiguous reads, including those with overlapping peaks or other anomalies. High-quality sequences were subsequently subjected to batch BLASTn searches against the NCBI nucleotide database. Corresponding species identifications were retrieved in bulk using the Batch Entrez tool(https://www.ncbi.nlm.nih.gov/sites/batchentrez).
2.6. Genetic Distance Calculation and Hierarchical Clustering
To assess the genetic divergence among samples, aligned DNA barcode sequences were processed using the ape package [22] in R. For each marker, pairwise genetic distances were calculated using the Kimura 2-parameter (K80) substitution model via the dist.dna() function. For the COI gene, the resulting distance matrix was subjected to hierarchical clustering using the hclust() function with the complete linkage method. This approach groups sequences based on the furthest distance between any pair of samples across clusters, allowing for robust discrimination among lineages. The clustering order derived from the COI marker was subsequently applied to the distance matrices of other barcode genes to ensure consistent comparison across loci.
2.7. ASAP Delimitation
2.8. Multiple Sequence Alignment and Phylogenetic Tree Construction
Genetic analysis was performed using Galaxy Pasteur (https://galaxy.pasteur.fr/). Multiple sequence alignment was conducted with MAFFT, employing the BLOSUM -62 substitution matrix for optimal alignment accuracy. Phylogenetic inference was carried out using the maximum likelihood (ML) method, with bootstrap support values calculated from 1,000 replicates (BS = 1,000) to assess the robustness of the tree topology.
3. Results
3.1. Cross-Regional Sampling of Limpets in Shenzhen and Adjacent Coastal Cities
Following standardized sampling protocols, a substantial number of limpet specimens were collected at each site in Shenzhen, Huizhou and Shantou cities. After rigorous screening based on shell size and external morphological features, 36, 32, 36, 10, 2, and 16 high-quality specimens were retained from the six respective sites (Figure 1A) for subsequent experimental assays and phylogenetic analysis pipeline (Figure 1B).
3.2. Conflicting Species Delimitations Within Different DNA Markers
From six sampling sites, 132 individuals were collected. These samples were subjected to PCR amplification and subsequent sequencing, and valid sequences of all four barcode genes were obtained from 92 of them for further analysis. Initially, the BLAST-based species identifications obtained using all four DNA barcode genes CO1, 16S rRNA, 28S rRNA and Cytb yielded e-values well below the commonly accepted threshold of 0.05, indicating highly reliable and accurate sequence alignments (Figure S1).
Species identification results based on each barcode gene were visualized in the outer four concentric layers of the phylogenetic tree (Figure 2). NCBI BLAST results revealed a high frequency of discordant species assignments among different barcodes for the same specimens. Specifically, out of these 92 valid specimens, 66 samples exhibited inconsistent identifications results across the four markers. Totally, nine confirmed limpet species—Cellana toreuma, Nipponacmea fuscoviridis, Nipponacmea schrenckii, Patelloida saccharinoides, Lottia luchuana, Siphonaria sirius, Siphonaria sp., Siphonaria japonica, and Siphonaria atra—belonging to three families (Nacellidae, Lottiidae, and Siphonariidae) and five genera (Cellana, Lottia, Nipponacmea, Patelloida and Siphonaria) were successfully identified through integrative analyses combining morphological characteristics and multi-locus DNA barcoding (Figure 2).
Among the four DNA barcodes evaluated, the COI gene—commonly regarded as a universal barcode—successfully identified 45 out of 92 specimens in full agreement with the final integrative species assignments. However, a notable proportion of misassignments occurred between C. toreuma and N. schrenckii, likely due to both the high conservation of the COI gene and possible inconsistencies in publicly available reference sequences. To exclude potential issues with our samples, we retrieved annotated sequences from NCBI. The MSA revealed a mean similarity of 82.58%, indicating a high level of sequence resemblance, which may explain the observed misassignment (Figure S2). In contrast, COI exhibited perfect sensitivity toward N. fuscoviridis, correctly identifying 12 specimens without conflict. Pairwise K2P distances were calculated for all COI sequences and subsequently visualized in the form of a heatmap (Figure 3A). Analysis of K2P distances revealed that 75 samples exhibited COI gene distances below 0.05, encompassing all instances of misidentification between C. toreuma and N. fuscoviridis. These results indicate that the low COI divergence between the two species may preclude reliable discrimination. Despite its broad utility, the COI marker demonstrated limited taxonomic resolution within the genera Siphonaria, Patelloida, and Lottia, identifying only four Siphonaria specimens correctly, while failing to accurately assign any specimens from Patelloida or Lottia.
Within the four DNA barcode genes evaluated, the 16S rRNA gene exhibited the highest identification success rate. Of the 92 specimens analyzed, 83 were successfully assigned to species based on 16S data alone, representing the highest resolution among all markers. Notably, 16S rRNA was able to resolve species-level distinctions between C. toreuma and N. schrenckii. Although both 16S and COI showed limited resolution for species within the genus Siphonaria, the 16S marker demonstrated superior discriminatory power for Patelloida species and provided relatively accurate assignments for specimens within Lottia. Similarly, the K2P distances for the 16S gene support this conclusion (Figure 3b). Most values range from 1.0 to 1.5, indicating substantial divergence and thereby facilitating species identification by BLAST. ASAP delimitation based on p-distance was also performed, through which all distinct species were consistently identified. Unexpectedly, sample A-29, which had been consistently identified as N. fuscoviridis, clustered within the P. saccharinoides group. Re-analysis by BLAST generated the same species assignment. This anomaly may be attributable to the very small K2P distance between the two taxa (≈0.5) as well as possible inaccuracies within the NCBI reference dataset (Figure 3B). These results suggest that the 16S rRNA gene harbors substantial interspecific variation and displays clearer divergence patterns both within and between species, making it a robust and suitable marker for limpet species identification.
The 28S rRNA gene successfully identified 56 out of the 92 specimens, representing a moderate level of resolution compared to other 3 barcodes. Notably, it demonstrated strong discriminatory power for C. toreuma, effectively distinguishing it from N. schrenckii, thereby avoiding the misidentification issues encountered with the COI marker. However, similar to COI, the 28S rRNA gene exhibited limited resolution for species within the genera Siphonaria, Patelloida, and Lottia. This reduced effectiveness is likely due to the relatively conserved nature of the 28S rRNA sequences within and among these genera, resulting in insufficient sequence divergence for accurate species-level discrimination. This is also supported by the K2P analysis (Figure 3C), where interspecific distances were all below 0.5, a level insufficient to reliably distinguish species.
Cytb barcode gene demonstrated a relatively high accuracy, correctly identifying 64 out of 92 specimens. However, similar to COI and 28S, it showed limited discriminatory power for species within the genera Lottia, Patelloida, and Siphonaria, and in some cases even yielded evidently erroneous assignments. This reduced resolution may be attributed to the functional constraints of the cytb gene, which encodes cytochrome b—a key component of the mitochondrial electron transport chain. Due to its essential role in cellular respiration, the cytb gene tends to be evolutionarily conserved across closely related species, thereby limiting the accumulation of sequence divergence necessary for precise species-level discrimination. Unlike the other three genes, Cytb yielded BLAST hits to 22 species outside of gastropod limpets (e.g., Dinophilus vorticoides). Even after repeated BLAST searches, we were unable to match the sequences to any limpet species. A comprehensive search of the NCBI database further revealed that Cytb records for several relevant species (L. luchuana, S. atra, S. sp., S. japonica and S. sirius) are currently unavailable, which explains why the corresponding species could not be identified by BLAST. Importantly, our dataset helps to fill this gap.
Species identified through our comprehensive analysis could be reliably mapped using at least one barcode gene. However, discrepancies occasionally arose when multiple barcodes for the same gene produced inconsistent results. These inconsistencies likely stem from the small genetic distances between species as well as variable data quality in the NCBI database. Therefore, incorporating evidence from multiple barcodes provides the more robust and accurate species identification.
3.3. SEM-Based Morphological Insights of Patellida and Siphonariida
SEM-based morphological analyses were incorporated alongside traditional documentation for further identification. All samples were measured for size parameters (Figure 4, Table S2), and representative individuals from each species were photographed to document external shell morphology (Figure 5). For each species, diagnostic morphological traits were described in detail, highlighting features that clearly distinguish species.
The length, width, and height of each collected samples were measured through vernier caliper to quantify overall shell morphology. The dimensional ratios derived from these parameters revealed distinct morphometric patterns among species (Figure 4). Notably, the proportional differences in shell height relative to length and width provide additional morphological evidence that aids in the preliminary differentiation of species [9]. The individuals belonging to the same species (dots of identical color) tended to cluster closely together in the plot. These findings demonstrate that shell morphometrics, when visualized in three-dimensional space, may serve as an insight for preliminary identification within the Patellogastropoda.
Detailed morphological examination of all collected limpet specimens were conducted, documenting both external and internal shell characteristics (Figure 5, Table 1). Key diagnostic traits, including shell shape, height, coloration, rib morphology, and shell transparency were systematically recorded for each single species. Specimens with an H/L ratio ≥ 0.3 were defined as high-domed, whereas those with an H/L ratio < 0.3 were considered low-domed [25]. Comparative observations were compiled into a comprehensive table to facilitate interspecific comparison. The resulting dataset provides a robust morphological framework and serves as a valuable reference for distinguishing closely related taxa within the families Nacellidae, Lottiidae, and Siphonariidae.
In Nacellidae, the shell of C. toreuma [26] is cap-shaped with a low convex profile, exhibiting an anteriorly positioned apex. The exterior surface is primarily rust-yellow, ornamented with fine radial riblets and irregular purple to brown cloud-like bands that radiate from the apex toward the margin. These radial ribs are delicate yet distinct, giving the shell a subtly sculptured texture. The inner surface is silvery gray with a pronounced nacreous luster, and the shell is relatively thin and translucent. Such a combination of fine radial ribs, low shell height, and irregular color banding distinguishes C. toreuma from other congeners within the genus Cellana, although moderate intraspecific variation in color and rib prominence has been reported [6].
In Lottiidae, species generally show high-domed, oval to irregularly shaped shells, but vary in color and rib expression. L. luchuana is high-domed, which has a brown and beige pattern with irregular dark bands. N. fuscoviridis features distinct black radial stripes and a lustrous yellow interior, differing from N. schrenckii [9], which bears diffuse brown cloud-like spots. P. saccharinoides is unique within this family, exhibiting an irregularly hexagonal outline and seven prominent white radial ribs on a gray-green background.
Among Siphonariidae, all examined Siphonaria species possess thin, translucent shells, yet exhibit distinct interspecific variation in outline, rib morphology, and pigmentation patterns. S.sp displays a broad-ovate, low-domed shell of gray-green coloration, ornamented with fine radial ribs and darker streaks along the surface, while the shell margins appear reddish-brown. S. sirius is elevated and elongated-ovate, characterized by prominent primary and fine secondary ribs, with a distinct dark-to-light gradient across the shell. In contrast, S. japonica possesses a symmetrically ovate, high-domed shell with uniform radial ribs and a striking “stripe + patch” color pattern on a grayish-brown to pale background. S. atra is readily distinguished by its broad, low-domed shell with sparse yet robust radial ribs and uniformly dark brown to blackish-brown coloration. These morphological differences—particularly in rib density, shell convexity, and pigmentation—are consistent with diagnostic features previously reported for Siphonaria species [27,28,29], which provide reliable criteria for species delimitation within this genus.
Overall, the most diagnostic characters distinguishing closely related species are color distribution, rib morphology, and shell shape. Species with similar overall shell forms can still be reliably identified by detailed observation of color patterns and rib structures, which provide the most consistent morphological cues for recognizing morphologically similar taxa.
Radular morphology is a valuable diagnostic feature for the classification and differentiation of patellogastropod species [30,31,32]. To obtain detailed structural information, high-resolution scanning electron microscopy (SEM) was employed to examine the radulae of the collected limpets (Figure 6). Due to handling and specimen availability, SEM observations were not obtained for all examined species.
In the SEM images (Figure 6), the radulae of the 5 species (P. saccharinoides, L. luchuana, N. schrenckii, N. fuscoviridis, C. toreuma) reveal two distinct morphotypes of radular teeth, consistent with our prior measurements: small anterior teeth (~100 µm) densely packed, and larger posterior teeth (~150 ± 25 µm) sparsely arranged. In P. saccharinoides, the tooth rows appear regular, with a clear delineation between small and large teeth (Figure 6A), comparable to other Patelloida SEM descriptions [33].
In L. luchuana (Figure 6B), the posterior large teeth are more elongate and inclined, with a smoother transition from mid-tooth rows, similar to patterns seen in other Lottia species in prior limpet radula surveys. In N. schrenckii (Figure 6C) and N. fuscoviridis (Figure 6D), the larger posterior teeth are more robust and show somewhat steeper spacing, consistent with the known variation within Nipponacmea [9]. For N. fuscoviridis, previous studies have used radular sac configuration as an auxiliary morphological character [34].
4. Discussion
Our integrative analysis highlights the limitations of single-locus barcoding and emphasizes the value of multi-locus approaches in resolving taxonomic complexity among intertidal limpets. While COI has been widely adopted as the standard DNA barcode, our results demonstrate that 16S, Cytb, and 28S markers often provided clearer interspecific boundaries within Cellana and Nipponacmea, whereas COI retained greater discriminatory power in Siphonaria. This lineage-specific resolution underscores the necessity of tailoring marker choice to evolutionary dynamics rather than relying on a universal standard. Moreover, SEM-based radular traits provided crucial morphological support, reinforcing molecularly defined clades and enabling the recognition of otherwise cryptic taxa. Together, these findings affirm the effectiveness of integrating multi-locus molecular data with fine-scale morphological evidence for species delimitation in morphologically conservative marine gastropods.
Several constraints inherent to our sampling design should be noted. All specimens were collected from Shenzhen and adjacent coastal sites, which may introduce geographic bias and limit the broader applicability of our findings. The relatively narrow latitudinal and longitudinal range of sampling may not fully capture the extent of genetic and morphological diversity across wider distributions. Future studies incorporating broader geographic coverage will be essential to validate species boundaries, assess phylogeographic structure, and provide a more comprehensive framework for limpets in the region and beyond.
5. Conclusions
By integrating multi-locus barcoding (COI, 16S, Cytb, 28S) with SEM-based radular morphology, this study robustly delineates intertidal limpet species across six coastal sites in southern China. Among 132 individuals analyzed, multiple misidentified lineages were uncovered. Marker-specific resolution varied: 16S, Cytb, and 28S provided clearer interspecific gaps (>10%) for Cellana and Nipponacmea, while COI was more effective for Siphonaria. SEM analysis further validated molecular clades, revealing consistent radular distinctions among closely related taxa. Furtheremore, we also provided realiable Cytb sequences for Lottia luchuana, Siphonaria atra, Siphonaria japonica, Siphonaria sp. and Siphonaria Sirius which enriched public database for future researches. These results underscore the necessity of marker complementarity and morphological integration in resolving taxonomic complexity within morphologically conservative marine gastropods.
Supplementary Materials
The following supporting information can be downloaded at the website of this paper posted on Preprints.org, Figure S1: BLAST e-value distribution across four DNA barcode genes (CO1, 16S rRNA, 28S rRNA, Cytb); Figure S2: MUSCLE multiple sequence alignment of annotated COI sequences from NCBI. The first three entries correspond to Nipponacmea fuscoviridis, while the last three correspond to Cellana toreuma.; Table S1: Primers applied in this study.; Table S2: Detailed of sampling sites: locations, coordinates, and counts of collected samples.; Table S3: Shell measurements and morphological ratios of limpets collected from six plots.
Author Contributions
J.L.: Investigation, Writing—original draft, Methodology and Software. K.Z.: Investigation, Writing—original draft, Data curation, SEM imaging and analysis. X.M.: Investigation, Writing—original draft, SEM imaging and analysis. J.Z.: Investigation, Resources. W.G.: Conceptualization, Supervision, SEM imaging and analysis. R.Z.: Writing—review and editing, Project administration, Supervision, Conceptualization. All authors have read and agreed to the published version of the manuscript. J.L., K.Z., and X.M. contributed equally to this work. R.Z. is the corresponding author.
Funding
This research was funded by the Characteristic Innovation Project of Guangdong Provincial Department of Education, 2023KTSCX162.
Acknowledgments
We gratefully acknowledge Shenzhen MSU-BIT University for providing laboratory facilities and instrument support. We also thank Dr. Dimitry Schepetov for valuable scientific guidance and insightful discussions throughout this research.
Conflicts of Interest
The authors declare no conflicts of interest.
References
- Branch, G.; Trueman, E.; Clarke, M. Limpets: Evolution and Adaptation. The Mollusca 1985, 10, 187–220. [Google Scholar]
- Sung, R.M.; Tsao, Y.-F.; Nakano, T.; Chan, B.K.K. An Integrative Taxonomy Approach in Studying the Biodiversity of Intertidal Limpets in Taiwan. Mar. Biodivers. 2025, 55, 45. [Google Scholar] [CrossRef]
- Nakano, T.; Spencer, H.G. Simultaneous Polyphenism and Cryptic Species in an Intertidal Limpet from New Zealand. Molecular Phylogenetics and Evolution 2007, 45, 470–479. [Google Scholar] [CrossRef]
- Kress, W.J.; García-Robledo, C.; Uriarte, M.; Erickson, D.L. DNA Barcodes for Ecology, Evolution, and Conservation. Trends in ecology & evolution 2015, 30, 25–35. [Google Scholar]
- Kress, W.J.; Erickson, D.L. DNA Barcodes: Methods and Protocols. In DNA barcodes: Methods and protocols; Springer, 2012; pp. 3–8.
- Nakano, T.; Ozawa, T. Worldwide Phylogeography of Limpets of the Order Patellogastropoda: Molecular, Morphological and Palaeontological Evidence. Journal of Molluscan Studies 2007, 73, 79–99. [Google Scholar] [CrossRef]
- Feng, J.; Guo, Y.; Yan, C.; Ye, Y.; Li, J.; Guo, B.; Lü, Z. Comparative Analysis of the Complete Mitochondrial Genomes in Two Limpets from Lottiidae (Gastropoda: Patellogastropoda): Rare Irregular Gene Rearrangement within Gastropoda. Sci Rep 2020, 10, 19277. [Google Scholar] [CrossRef] [PubMed]
- Nakano, T.; Sasaki, T. Recent Advances in Molecular Phylogeny, Systematics and Evolution of Patellogastropod Limpets. Journal of Molluscan Studies 2011, 77, 203–217. [Google Scholar] [CrossRef]
- Teruya, S.; Setiamarga, D.H.E.; Nakano, T.; Sasaki, T. Molecular Phylogeny of Nipponacmea (Patellogastropoda, Lottiidae) from Japan: A Re-Evaluation of Species Taxonomy and Morphological Diagnosis. ZK 2022, 1087, 163–198. [Google Scholar] [CrossRef]
- Ekimova, I.; Deart, Y.; Antokhina, T.; Mikhlina, A.; Schepetov, D. Stripes Matter: Integrative Systematics of Coryphellina Rubrolineata Species Complex (Gastropoda: Nudibranchia) from Vietnam. Diversity 2022, 14, 294. [Google Scholar] [CrossRef]
- Yu, S.-S.; Wang, J.; Wang, Q.-L.; Huang, X.-W.; Dong, Y.-W. DNA Barcoding and Phylogeographic Analysis of Nipponacmea Limpets (Gastropoda: Lottiidae) in China. Journal of Molluscan Studies 2014, 80, 420–429. [Google Scholar] [CrossRef]
- Mazón-Suástegui, J.M.; Fernández, N.T.; Valencia, I.L.; Cruz-Hernández, P.; Latisnere-Barragán, H. 28S rDNA as an Alternative Marker for Commercially Important Oyster Identification. Food Control 2016, 66, 205–214. [Google Scholar] [CrossRef]
- Liu, J.; Jiang, J.; Song, S.; Tornabene, L.; Chabarria, R.; Naylor, G.J.P.; Li, C. Multilocus DNA Barcoding – Species Identification with Multilocus Data. Sci Rep 2017, 7, 16601. [Google Scholar] [CrossRef]
- Fazekas, A.J.; Burgess, K.S.; Kesanakurti, P.R.; Graham, S.W.; Newmaster, S.G.; Husband, B.C.; Percy, D.M.; Hajibabaei, M.; Barrett, S.C. Multiple Multilocus DNA Barcodes from the Plastid Genome Discriminate Plant Species Equally Well. PloS one 2008, 3, e2802. [Google Scholar] [CrossRef]
- Dasmahapatra, K.; Mallet, J. DNA Barcodes: Recent Successes and Future Prospects. Heredity 2006, 97, 254–255. [Google Scholar] [CrossRef]
- Yang, J.; Zhang, S. The Radular Morphology of Nassariidae (Gastropoda: Caenogastropoda) from China. Chinese Journal of Oceanology and Limnology 2011, 29, 1023–1032. [Google Scholar] [CrossRef]
- Lin, X.-L.; Stur, E.; Ekrem, T. DNA Barcodes and Morphology Reveal Unrecognized Species in Chironomidae (Diptera). Insect Systematics & Evolution 2018, 49, 329–398. [Google Scholar] [CrossRef]
- Will, K.W.; Rubinoff, D. Myth of the Molecule: DNA Barcodes for Species Cannot Replace Morphology for Identification and Classification. Cladistics 2004, 20, 47–55. [Google Scholar] [CrossRef]
- Chan, A.; Chiang, L.-P.; Hapuarachchi, H.C.; Tan, C.-H.; Pang, S.-C.; Lee, R.; Lee, K.-S.; Ng, L.-C.; Lam-Phua, S.-G. DNA Barcoding: Complementing Morphological Identification of Mosquito Species in Singapore. Parasites & vectors 2014, 7, 569. [Google Scholar]
- Cao, X.; Liu, J.; Chen, J.; Zheng, G.; Kuntner, M.; Agnarsson, I. Rapid Dissemination of Taxonomic Discoveries Based on DNA Barcoding and Morphology. Scientific Reports 2016, 6, 37066. [Google Scholar] [CrossRef]
- Porebski, S.; Bailey, L.G.; Baum, B.R. Modification of a CTAB DNA Extraction Protocol for Plants Containing High Polysaccharide and Polyphenol Components. Plant Molecular Biology Reporter 1997, 15, 8–15. [Google Scholar] [CrossRef]
- Paradis, E.; Schliep, K. Ape 5.0: An Environment for Modern Phylogenetics and Evolutionary Analyses in R. Bioinformatics 2019, 35, 526–528. [Google Scholar] [CrossRef]
- Katoh, K.; Standley, D.M. MAFFT Multiple Sequence Alignment Software Version 7: Improvements in Performance and Usability. Molecular biology and evolution 2013, 30, 772–780. [Google Scholar] [CrossRef]
- Puillandre, N.; Brouillet, S.; Achaz, G. ASAP: Assemble Species by Automatic Partitioning. Molecular Ecology Resources 2021, 21, 609–620. [Google Scholar] [CrossRef]
- Paulo Cabral, J. Shape and Growth in European Atlantic Patella Limpets (Gastropoda, Mollusca). Ecological Implications for Survival. Web Ecology 2007, 7, 11–21. [Google Scholar] [CrossRef]
- Reeve, L.A.; Brooks, V.; Reeve, F.; Sowerby, G.B. (George B.; Sowerby, G.B. (George B.; Taylor, J.E.; Reeve, B., and Reeve.; Savill, E. and Co.; Spottiswoode & Co.; Vincent Brooks, D.& S. Conchologia Iconica, or, Illustrations of the Shells of Molluscous Animals; Reeve, Brothers: London, 1855; Vol. v.8 (1855).
- Kim, Y.; Park, J.; Hwang, U.W.; Park, J.-K. Taxonomic Review of Korean Siphonaria Species (Mollusca, Gastropoda, Siphonariidae). BDJ 2025, 13, e139388. [Google Scholar] [CrossRef]
- Ruthensteiner, B. Redescription and 3D Morphology of Williamia Gussonii (Gastropoda: Siphonariidae). Journal of Molluscan Studies 2006, 72, 327–336. [Google Scholar] [CrossRef]
- Hodgson, A.N. The Biology of Siphonariid Limpets (Gastropoda: Pulmonata). In Oceanography and marine biology; CRC Press, 2002; pp. 253–322.
- SASAKI, T.; OKUTANI, T. New Genus Nipponacmea (Gastropoda, Lottiidae): A Revision of Japanese Limpets Hitherto Allocated in Notoacmea. Venus (Japanese Journal of Malacology) 1993, 52, 1–40. [Google Scholar]
- Lindberg, D.R.; JH, M. Tropical Eastern Pacific Limpets of the Family Acmaeidae (Mollusca, Archaeogastropoda): Generic Criteria and Descriptions of Six New Species from the Mainland and the Galápagos Islands. Proceedings of the California Academy of Sciences 1981, 42, 323–339. [Google Scholar]
- Ponder, W.F.; Creese, R.G. A Revision of the Australian Species of Notoacmea, Collisella and Patelloida (Mollusca : Gastropoda : Acmaeidae). Journal of the Malacological Society of Australia 1980, 4, 167–208. [Google Scholar] [CrossRef]
- Paran FJ, Sasaki T, Asakura A, Nakano T. 2025. Description of a new species of the intertidal limpet Patelloida (Patellogastropoda: Lottiidae) from Wakayama and Kochi, Japan. Zool Stud 2025, 64:26.
- Sasaki, T.; Nakano, T. The Southernmost Record of Nipponacmea fuscoviridis (Patellogastropoda : Lottiidae) from Iriomote Island, Okinawa. Venus (Journal of the Malacological Society of Japan) 2007, 66, 99–102. [Google Scholar]
- Willassen, E.; Williams, A.; Oskars, T. New Observations of the Enigmatic West African Cellana Limpet (Mollusca: Gastropoda: Nacellidae). Marine Biodiversity Records 2016, 9, 60. [Google Scholar] [CrossRef]
Figure 1.
Sample position map and workflow. (A) Collection sites of intertidal limpets along the coast of Guangdong Province, southern China. Six coastal locations in Shenzhen and adjacent cities (Huizhou and Shanwei) were sampled for this study: A. Beizaijiao Beach, B. Judiaosha Beach, C. Guanhu Beach, D. Dongchong Beach, E. Reef Park, and F. Baian Beach. Sites were selected based on the presence of extensive intertidal zones with abundant rocky substrates, relatively pristine marine environments, and minimal anthropogenic disturbance. (B) Experimental and computational pipeline of whole research.
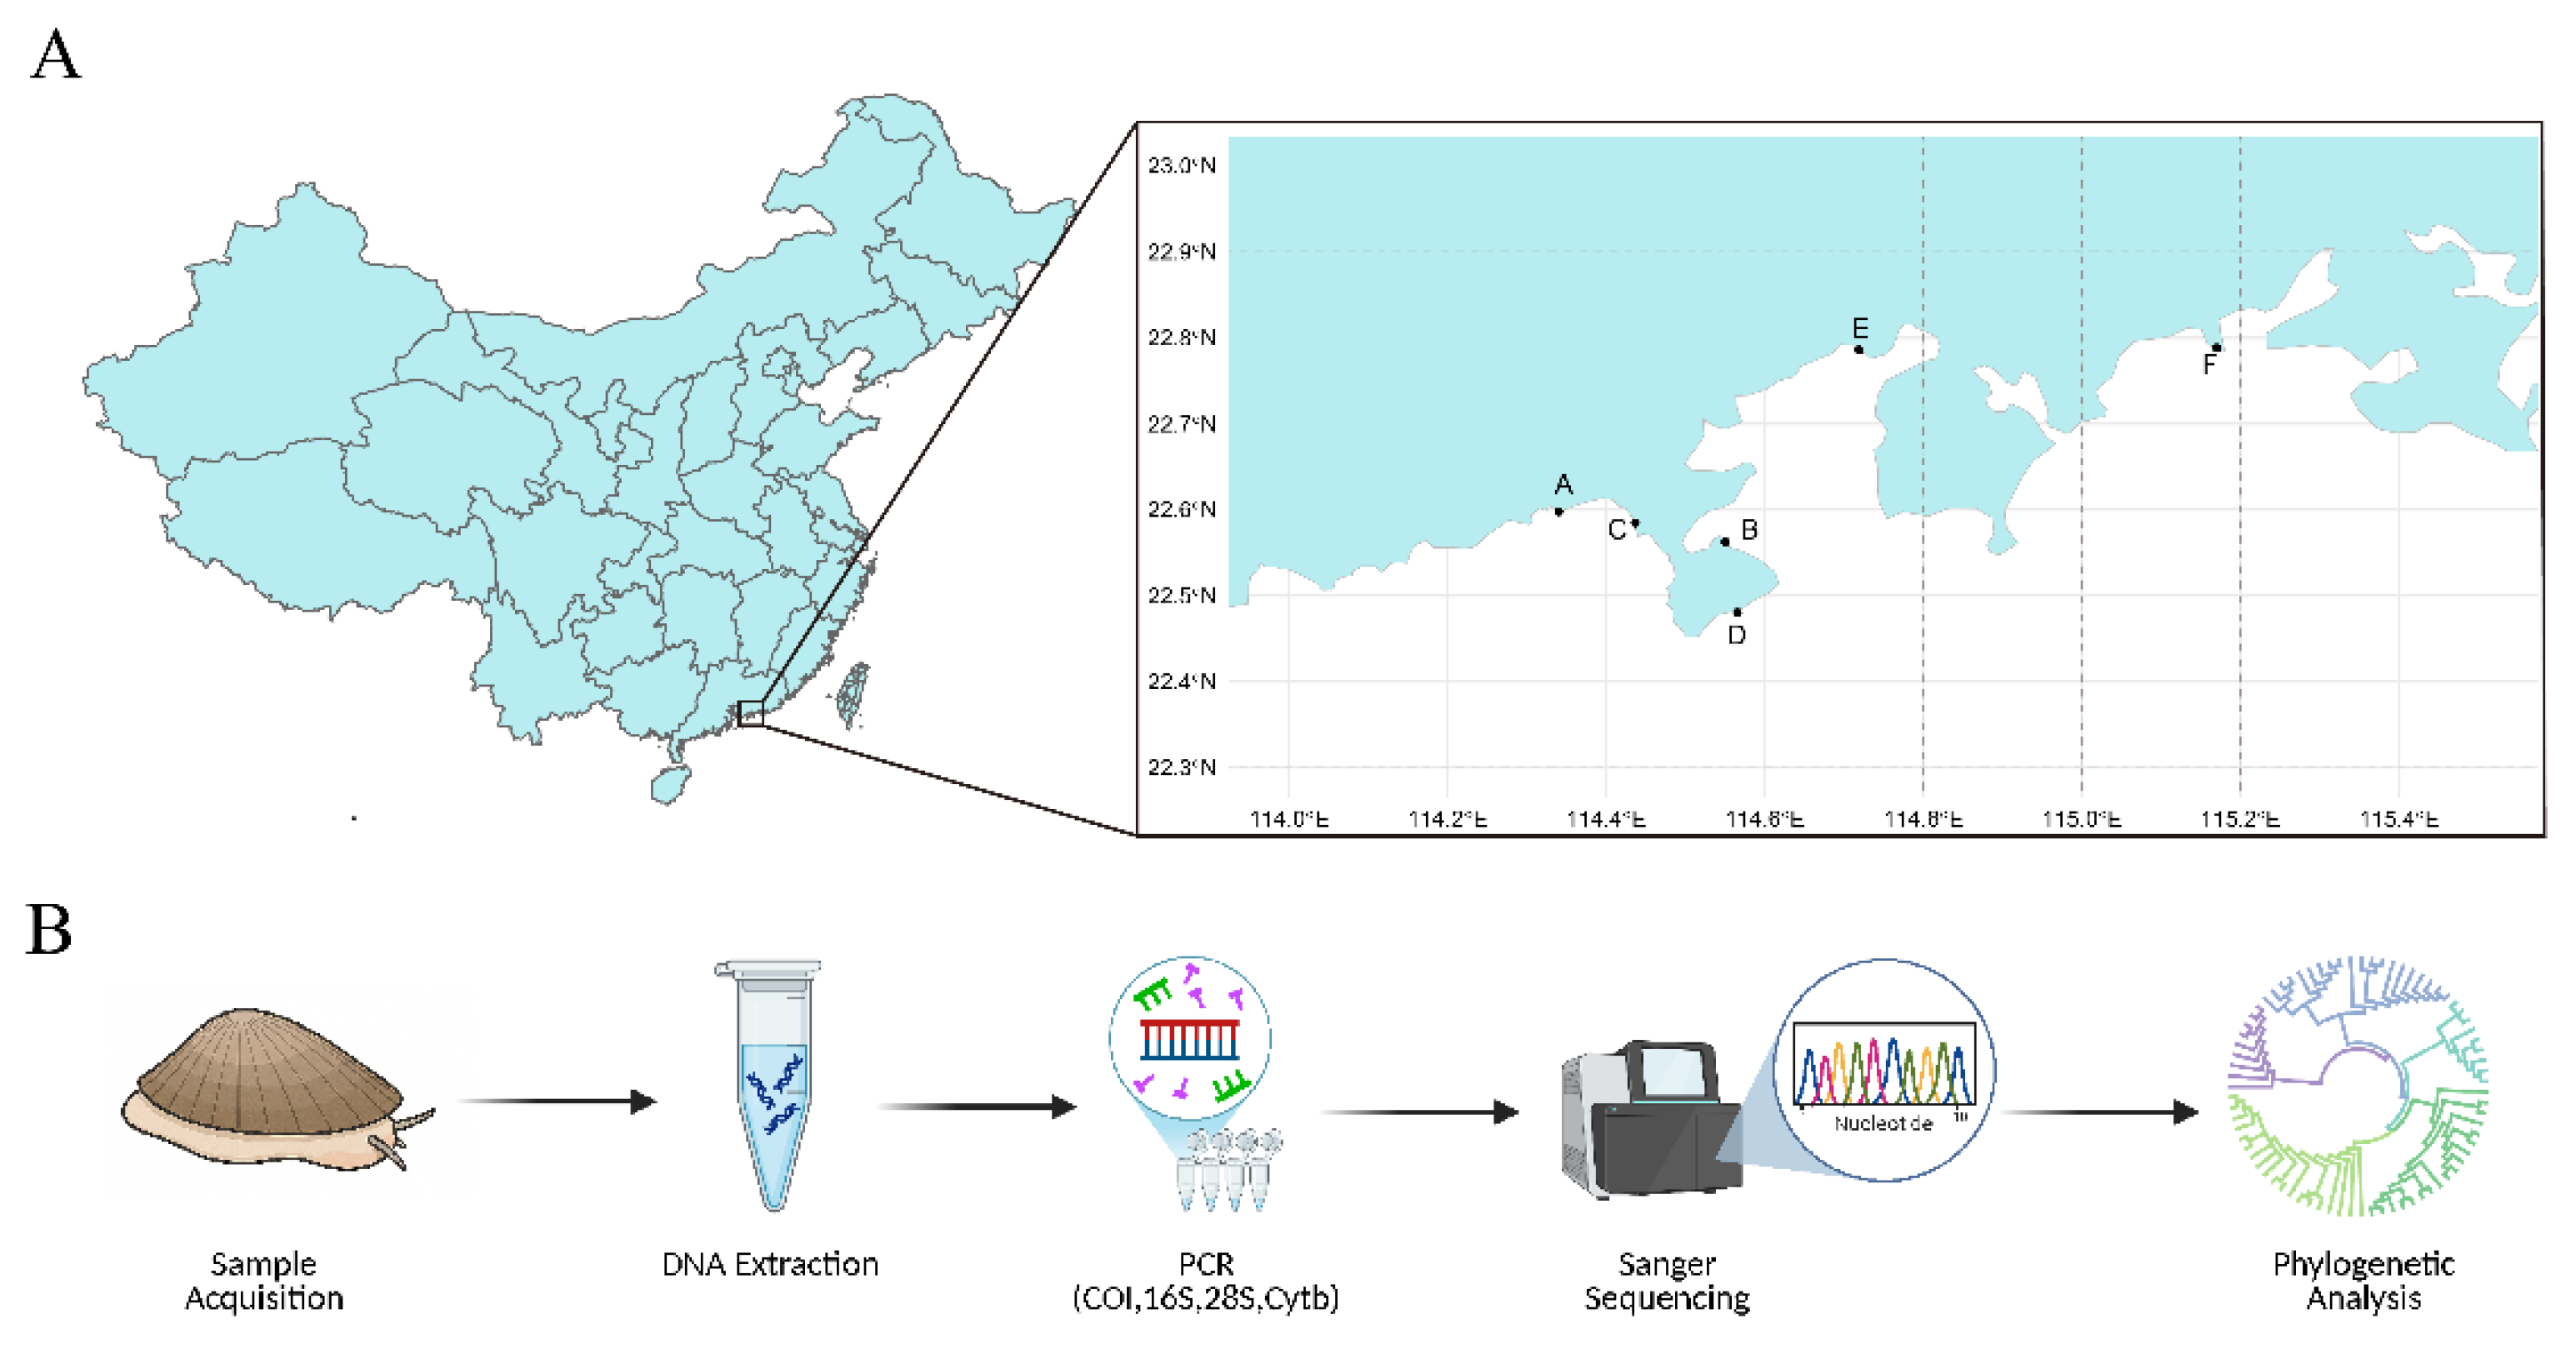
Figure 2.
Concatenated Maximum Likelihood Phylogenetic Tree Based on Four Markers. ML phylogenetic tree constructed from the concatenated sequences of four DNA barcode genes (COI, 16S rRNA, 28S rRNA, and Cytb), using 1000 bootstrap replicates for branch support. Branches with bootstrap support values greater than 80% are highlighted in bold. From the second inner to outer rings, each ring represents the ASAP results inferred from one barcode gene. The first color strip represents the final species identification based on integrative approaches. Labels marked as “other” denote obviously incorrect BLAST identification species. Hiatula diphos was selected as outgroup.
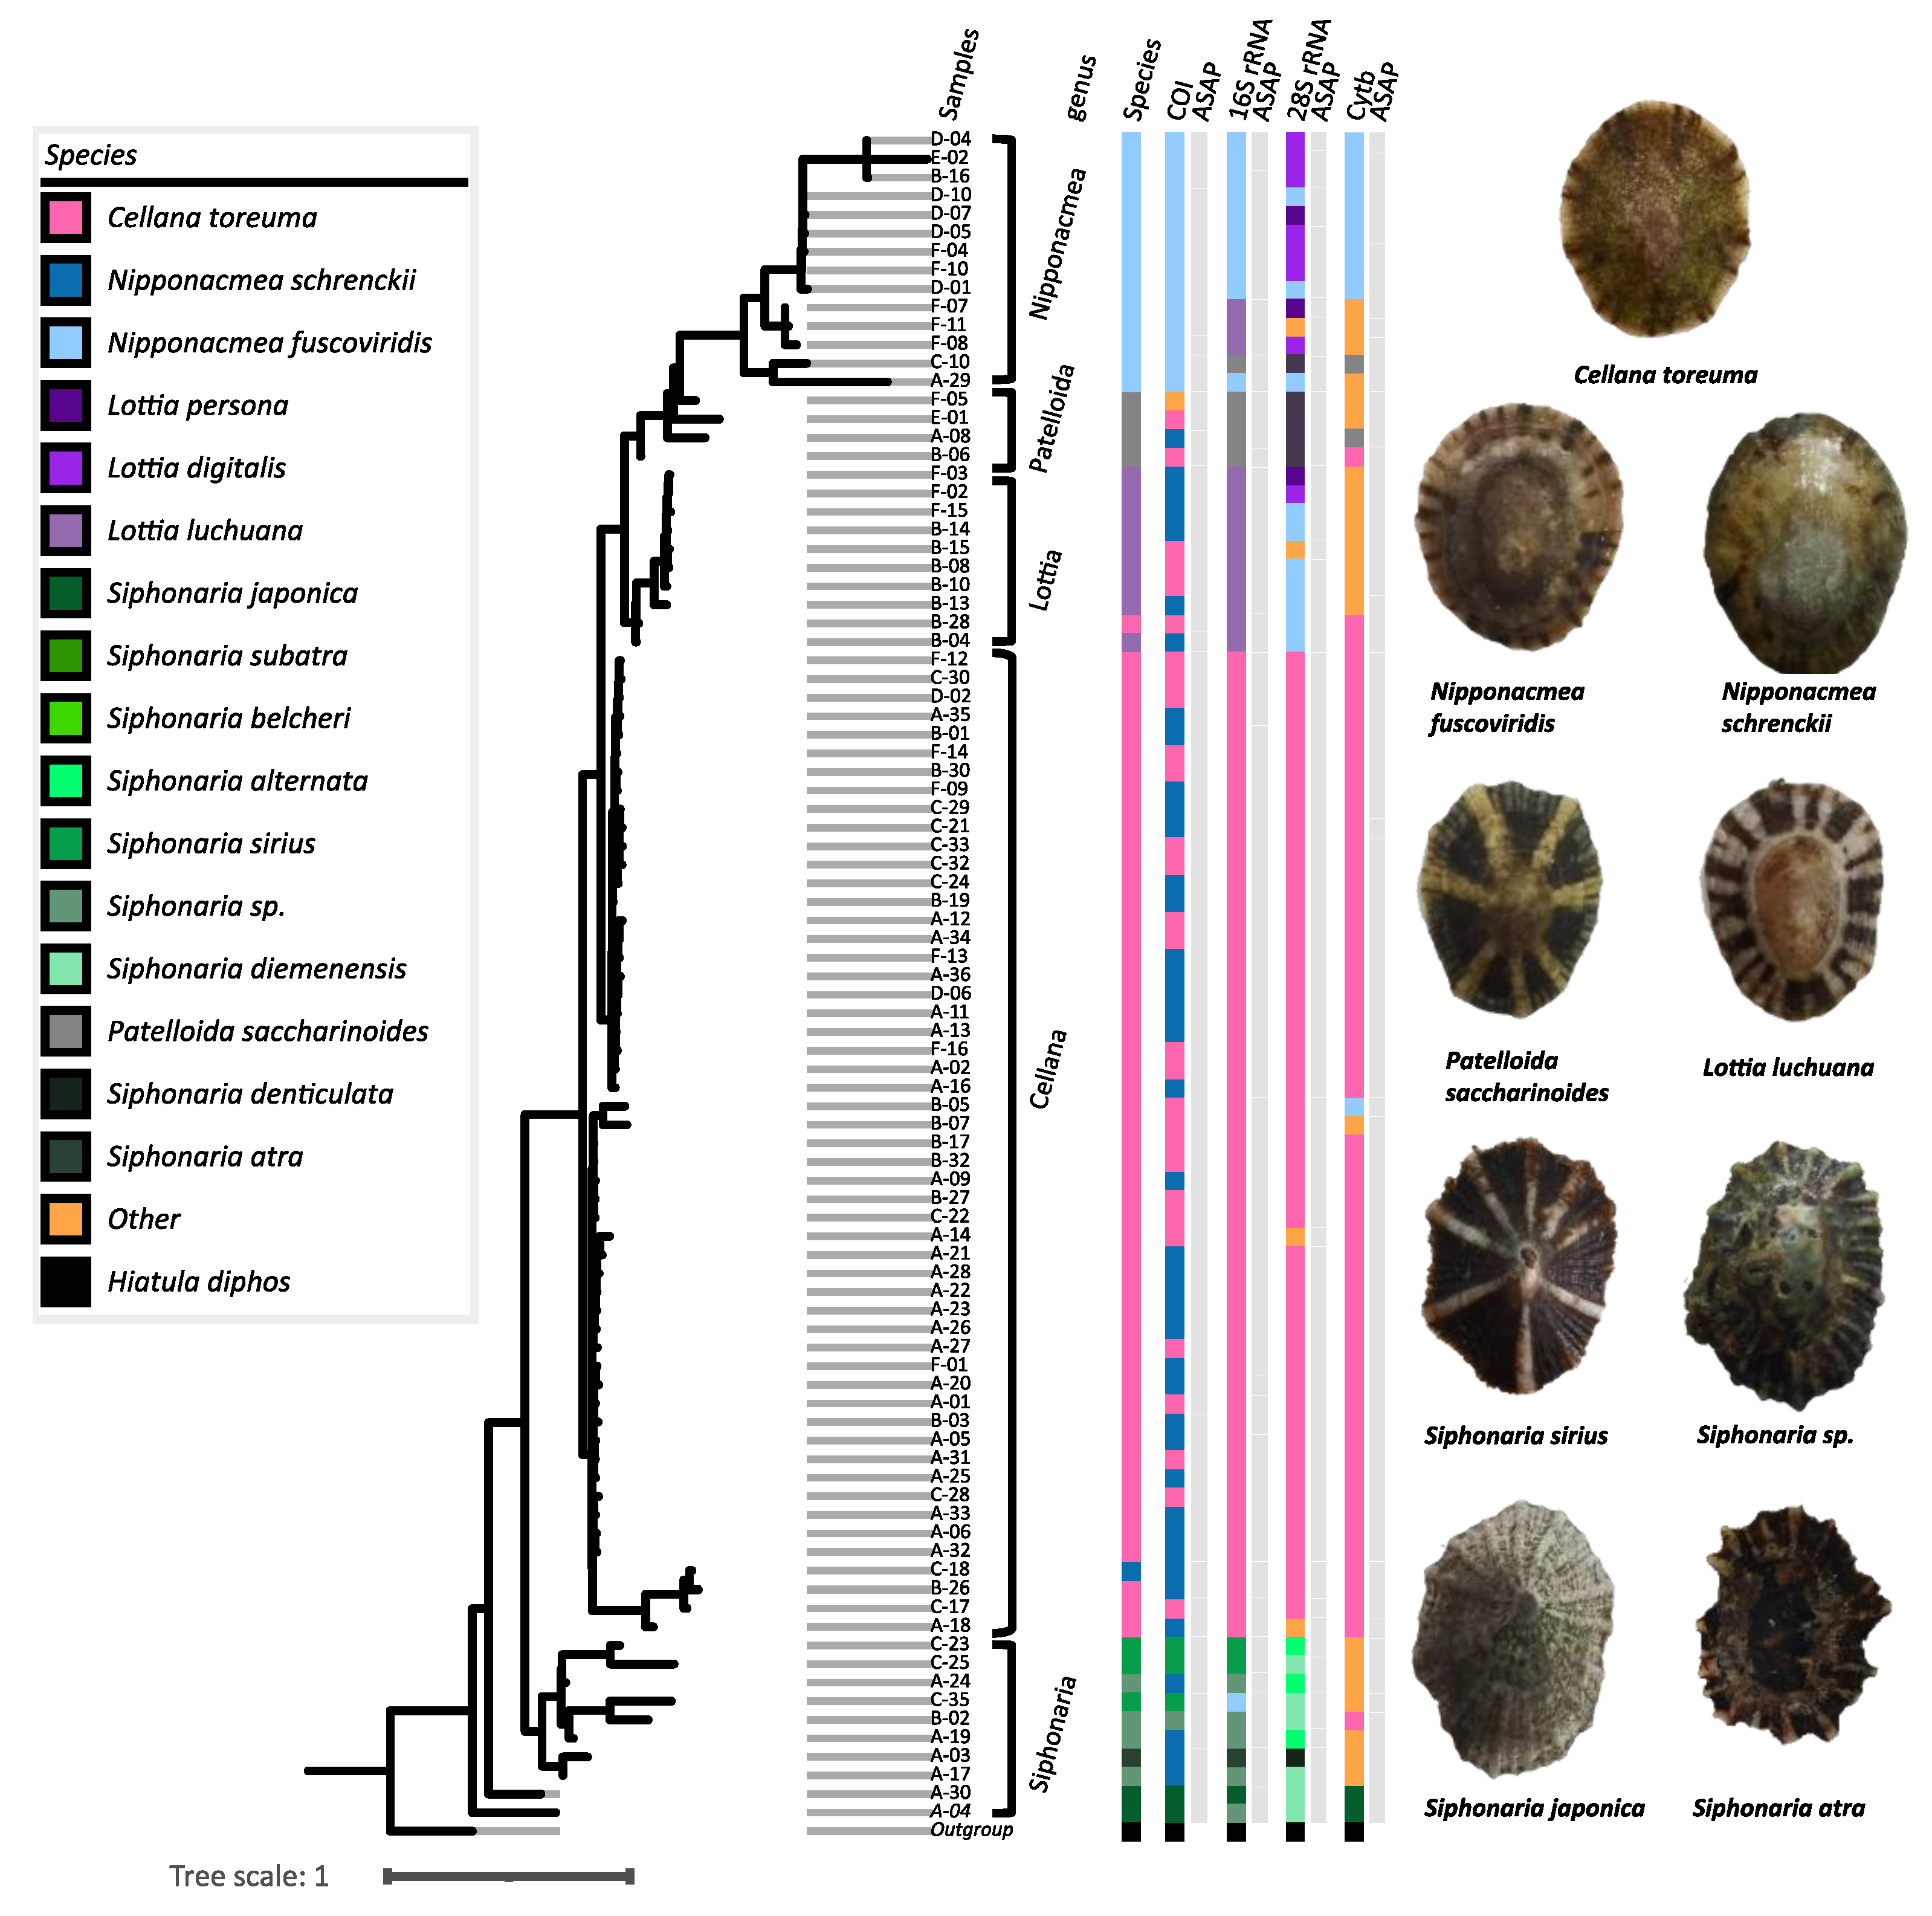
Figure 3.
Comparative heatmaps of pairwise genetic distances among intertidal limpet samples across four DNA barcode loci. Heatmaps depict pairwise genetic distances estimated under the Kimura 2-parameter (K80) substitution model for A. COI, B. 16S rRNA, C. 28S rRNA, and D. Cytb sequences. Hierarchical clustering was performed based on COI genetic distances, and the resulting dendrogram was applied to the other three loci (16S rRNA, 28S rRNA, and Cytb) to enable cross-locus comparison of phylogenetic patterns.
Figure 4.
3-dimensional morphometric plot illustrated the relationships between shell length, width and height. Each point represents an individual sample and the color corresponds to species assignments that are consistent with the phylogenetic tree.
Figure 4.
3-dimensional morphometric plot illustrated the relationships between shell length, width and height. Each point represents an individual sample and the color corresponds to species assignments that are consistent with the phylogenetic tree.
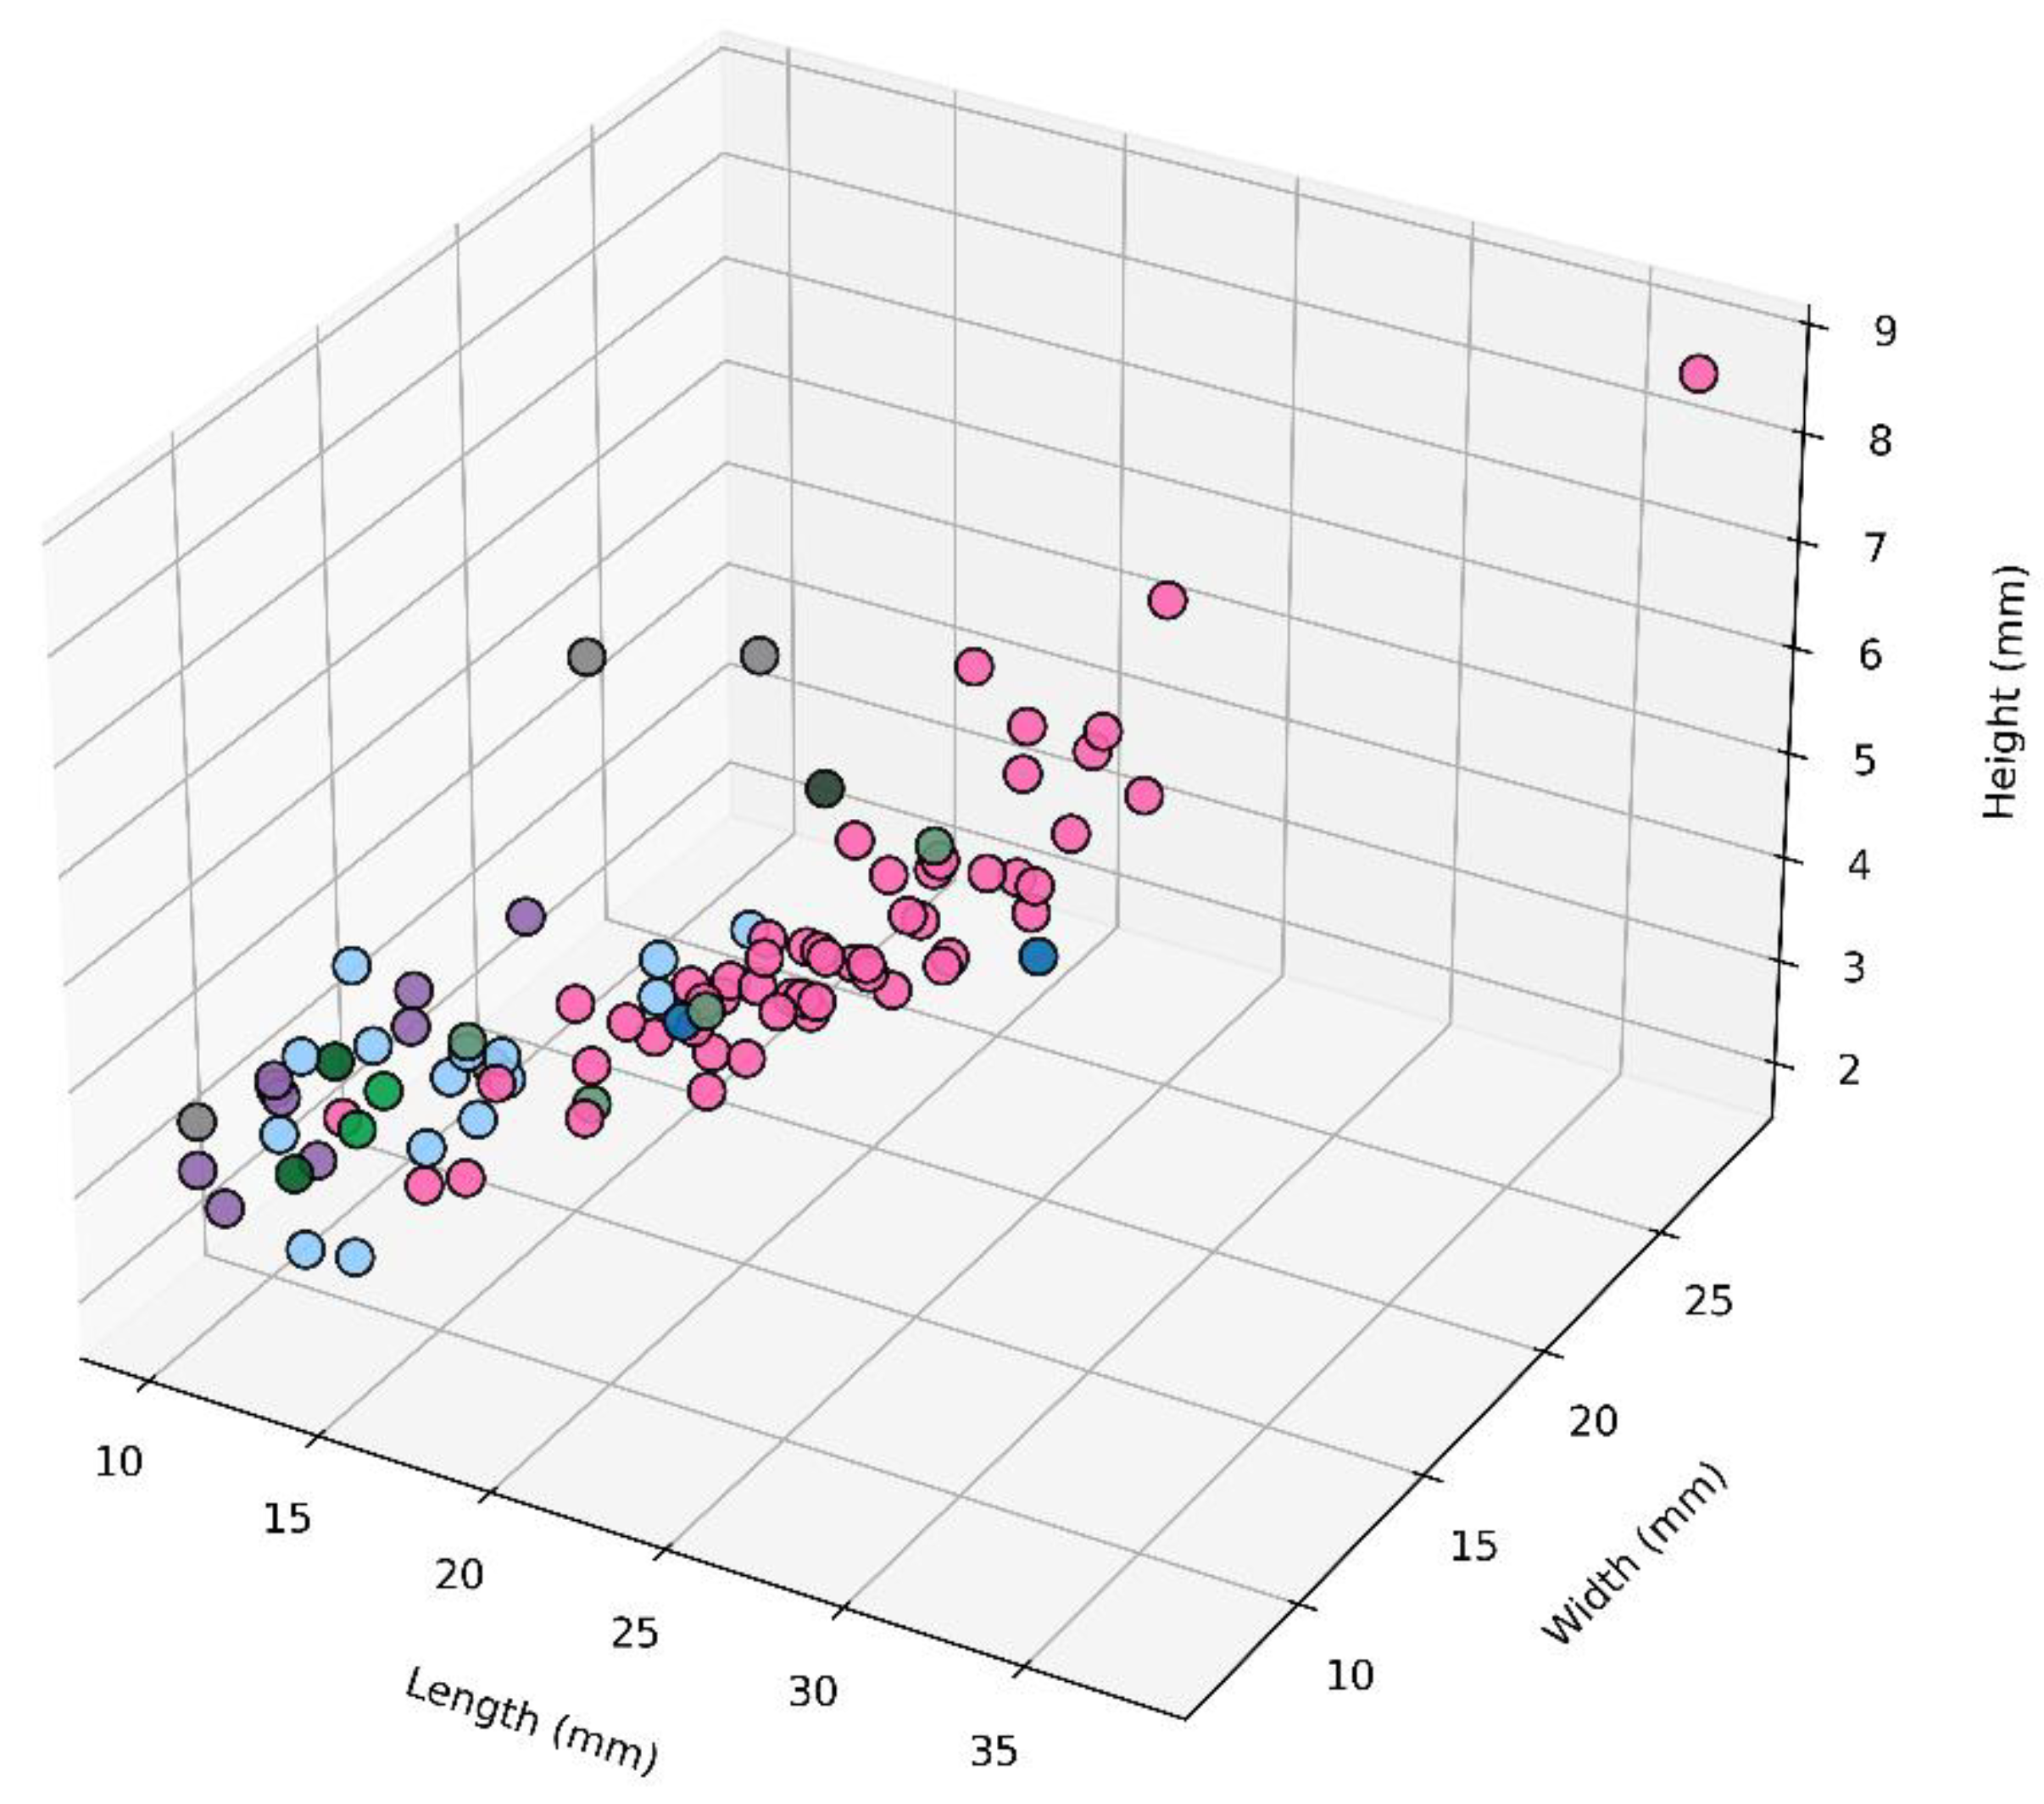
Figure 5.
High-resolution images of external and lateral morphological features of limpets from multiple perspectives. A. Cellana toreuma B. Lottia luchuana C. Nipponacmea fuscoviridis D. Nipponacmea schrenckii E. Patelloida saccharinoides F. Siphonaria sp. G. Siphonaria sirius H. Siphonaria japonica I. Siphonaria atra.
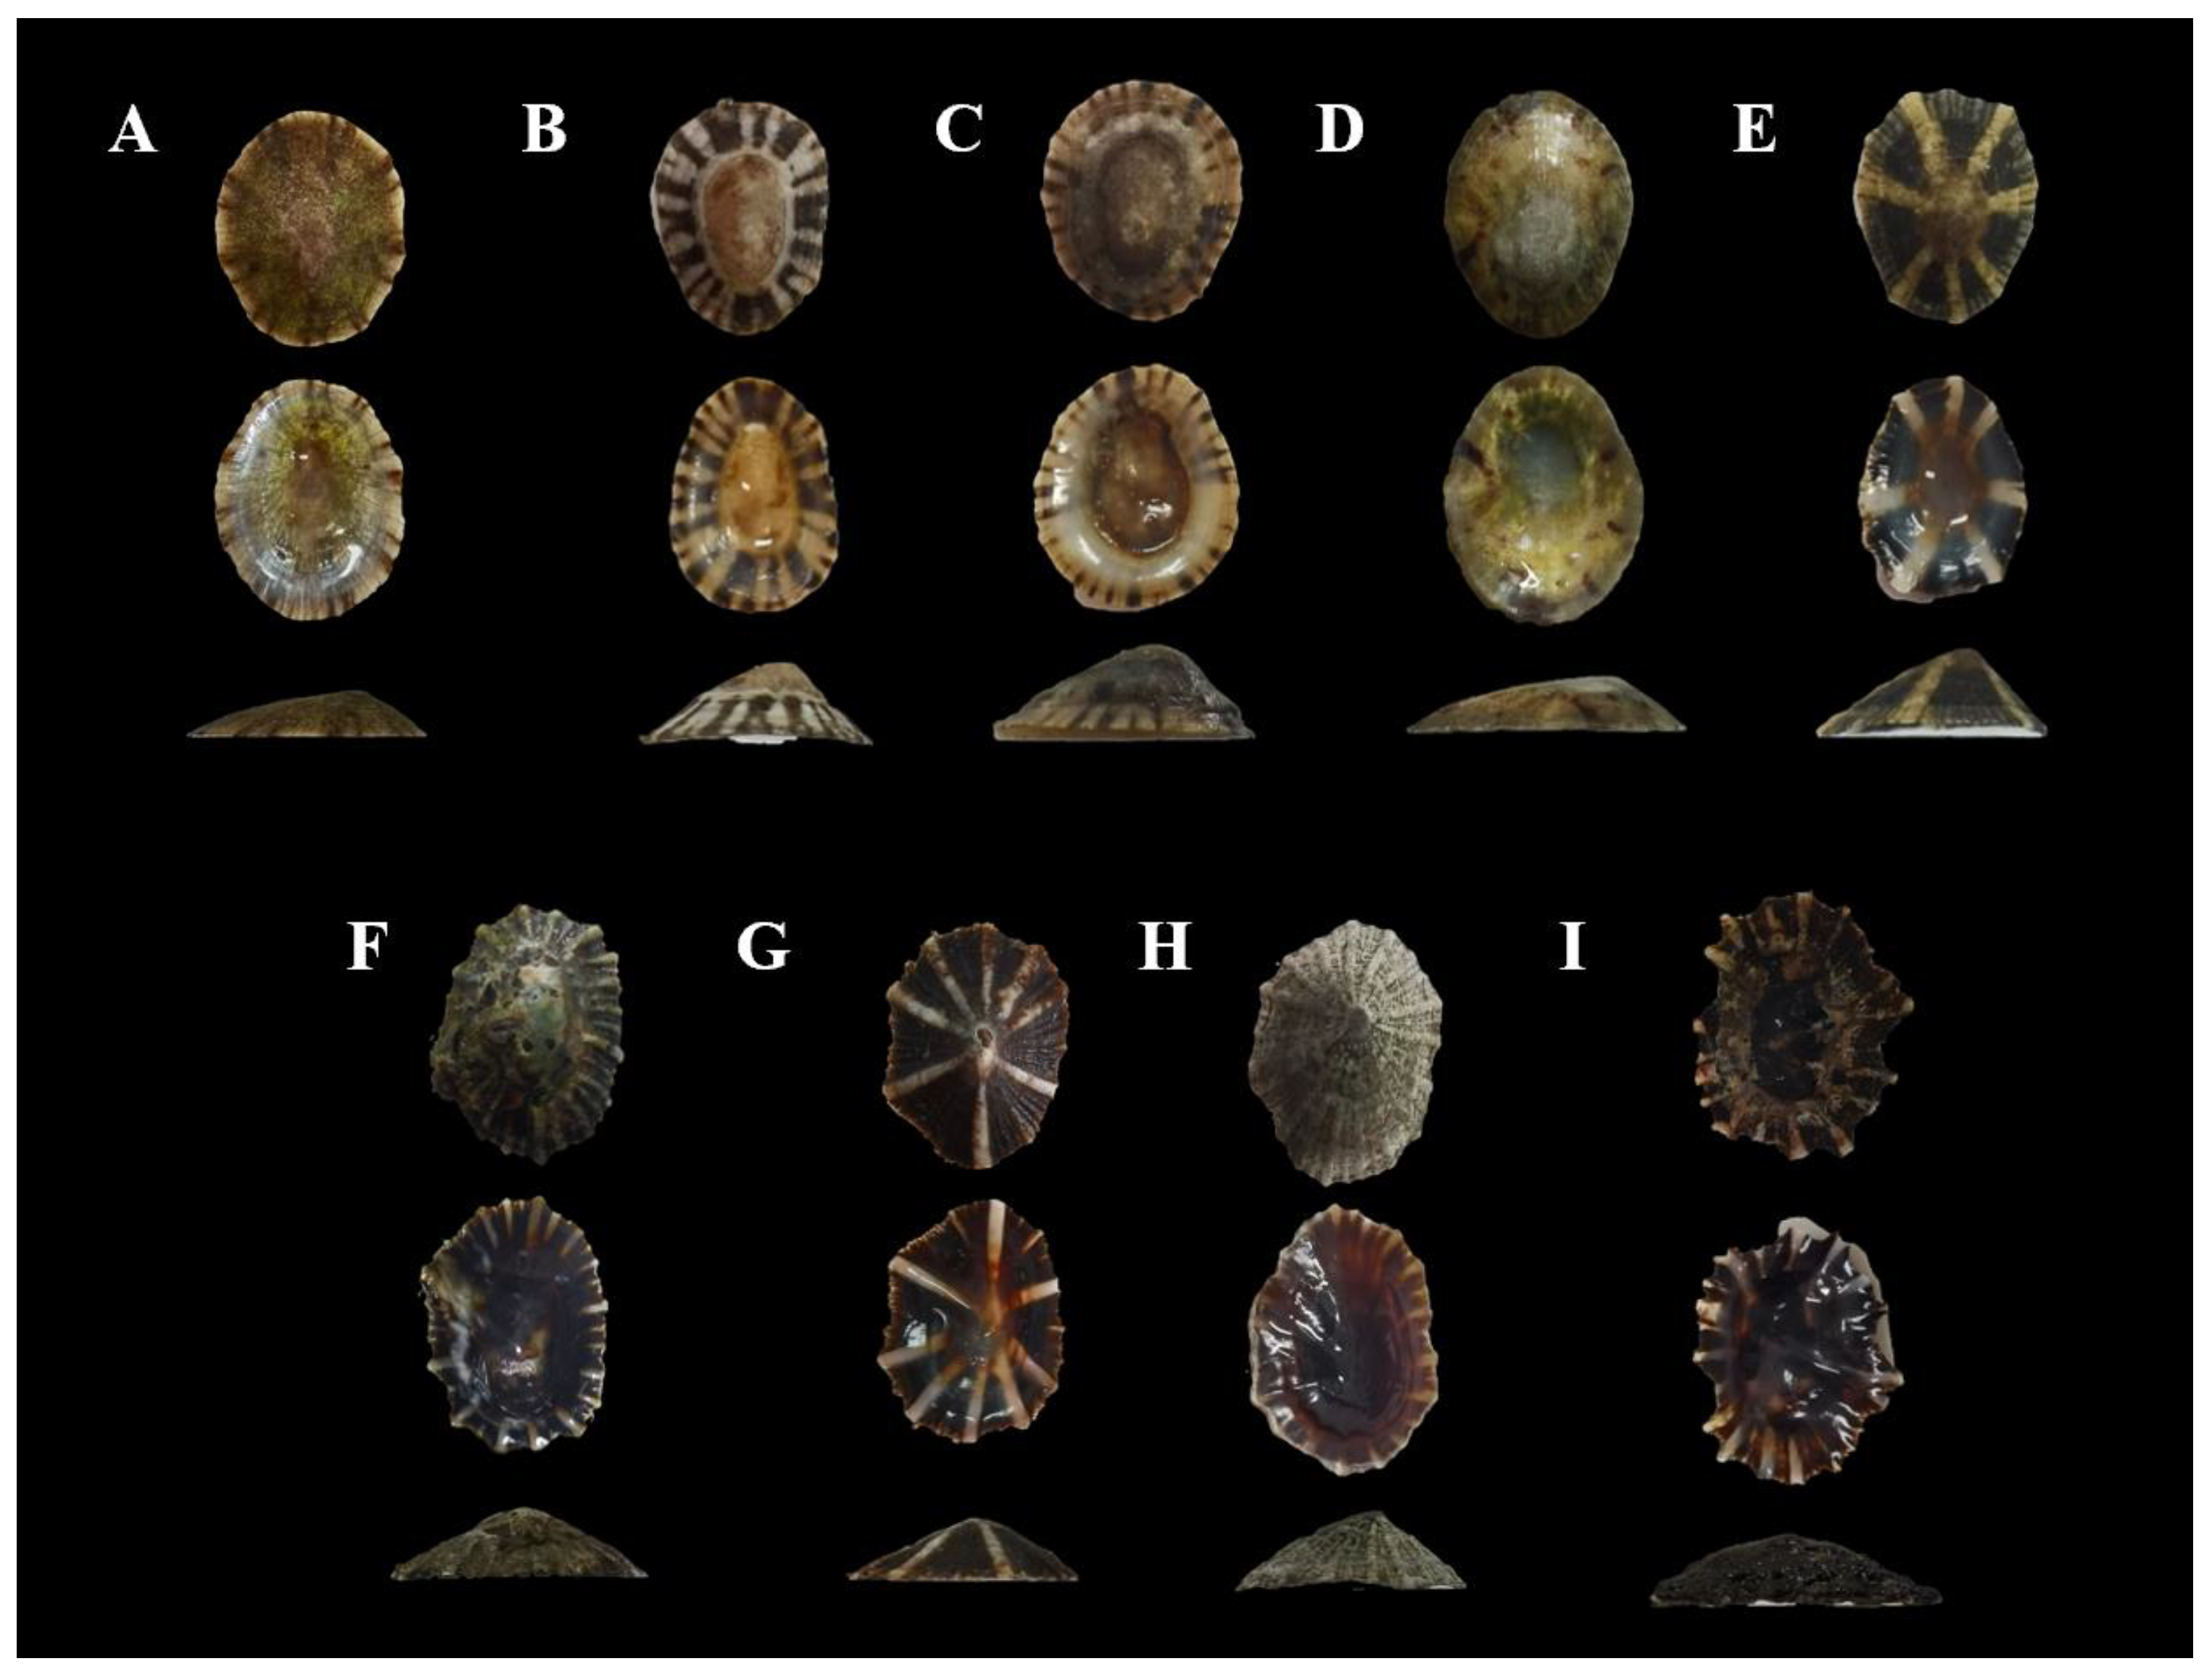
Figure 6.
Scanning electron microscopy images of radula from available species. A. Patelloida saccharinoides. B. Lottia luchuana .C. Nipponacmea schrenckii. D. Nipponacmea fuscoviridis. E. Cellana toreuma.
Figure 6.
Scanning electron microscopy images of radula from available species. A. Patelloida saccharinoides. B. Lottia luchuana .C. Nipponacmea schrenckii. D. Nipponacmea fuscoviridis. E. Cellana toreuma.
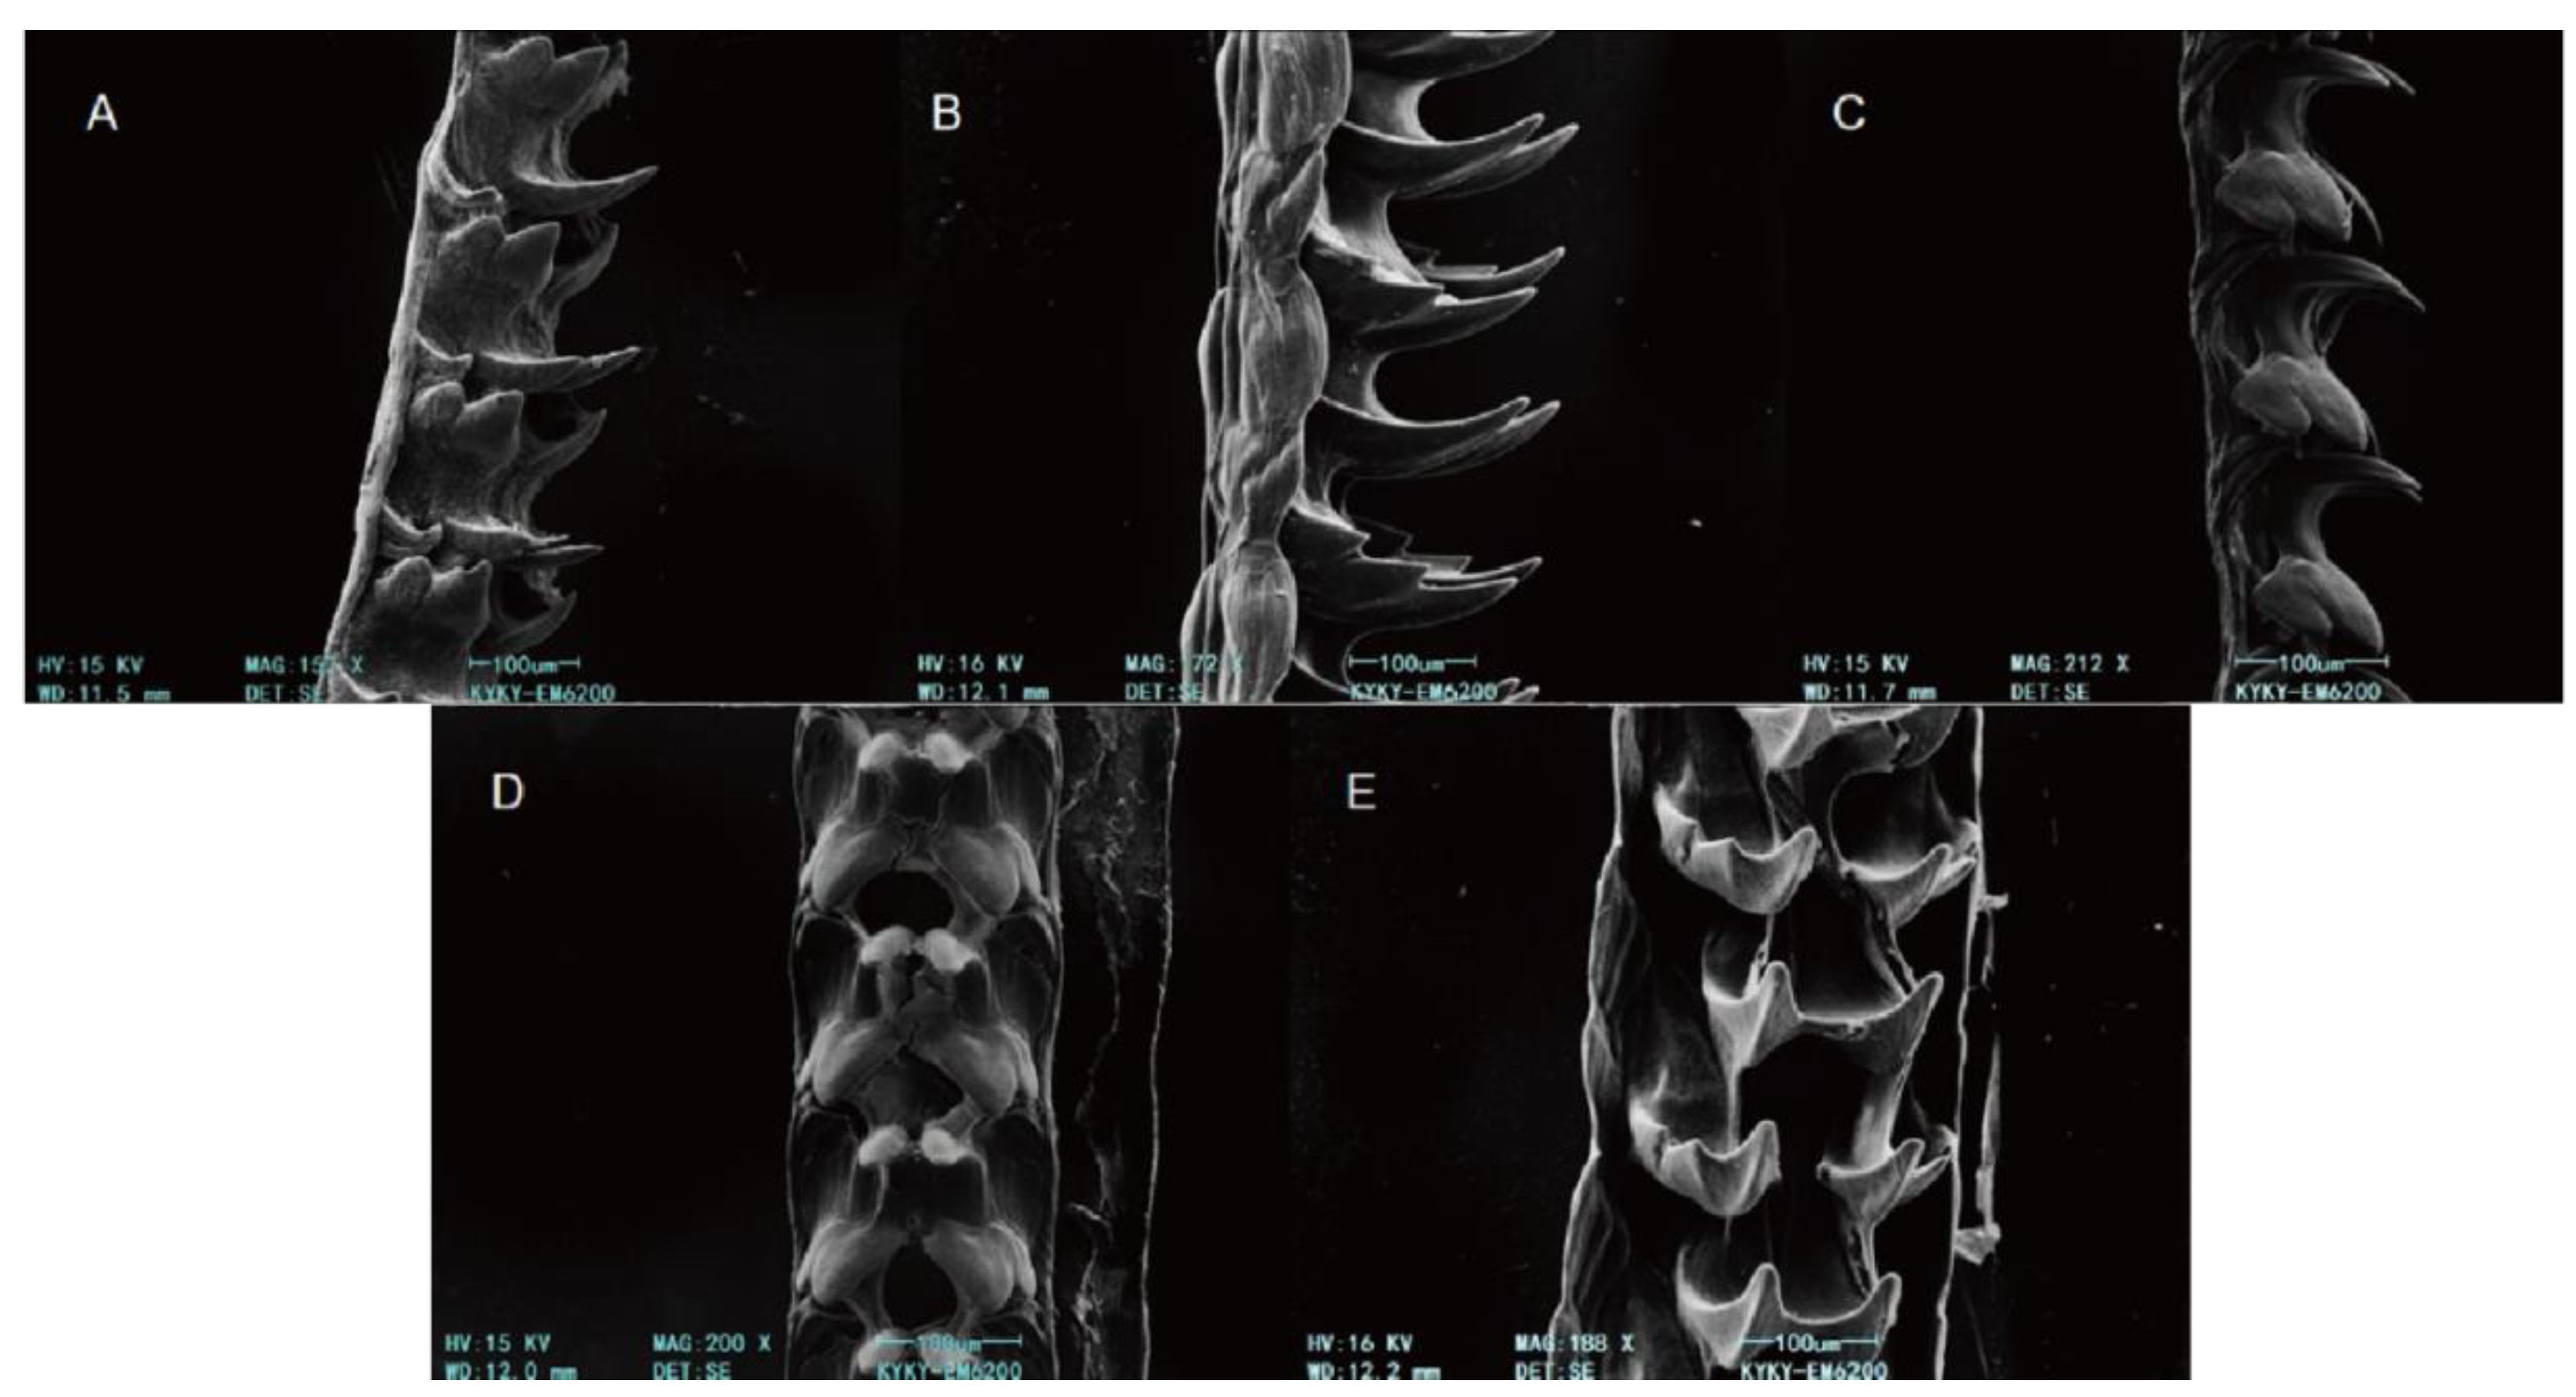

Table 1.
Comparative morphological characteristics of the examined limpet species across the families Nacellidae, Lottiidae, and Siphonariidae.
Table 1.
Comparative morphological characteristics of the examined limpet species across the families Nacellidae, Lottiidae, and Siphonariidae.
| Family | Species | Shape | Height | Exterior shell | Interior shell | |||
|---|---|---|---|---|---|---|---|---|
| Color | Riblets | Color | Transparency | |||||
| Nacellidae | C. toreuma | Cap-shaped | Low-domed | Rust yellow | Fine radial ribs + irregular brown bands | Silvery gray, lustrous | Translucent | |
| Lottiidae | L. luchuana | Elongated oval | High-domed | Brown + beige | Irregular dark brown bands | Rust yellow | Slightly transparent | |
| N.fuscoviridis | Cockle-hat shaped | High-domed | Black, black-yellow | Dark black radial stripes | Yellow, lustrous | Slightly transparent | ||
| N. schrenckii | Ovoid | Low-domed | Light yellow-brown | Dark brown spots | Light yellow-brown | Translucent | ||
| P.saccharinoides | Irregularly hexagonal | High-domed | Gray-green |
7 white radial ribs | Light purple | Translucent | ||
| Siphonariidae | S.sp | Broad-ovate | Low-domed | Gray-green |
Fine radial ribs + dark streaks | Reddish-brown margins | Translucent | |
| S. sirius | Elevated, elongated-ovate | Low-domed | Dark brown | Robust radial ribs + fine secondary ribs | Dark to light gradient |
Translucent | ||
| S. japonica | Symmetrically ovate | High-domed | Grayish-brown to brown | Uniform radial ribs + bright “stripe + patch” | Pale brown to off-white | Translucent | ||
| S.atra | Broad-ovate | Low-domed | Dark brown to blackish-brown | Sparse robust radial ribs | Dark coloration | Translucent | ||
Disclaimer/Publisher’s Note: The statements, opinions and data contained in all publications are solely those of the individual author(s) and contributor(s) and not of MDPI and/or the editor(s). MDPI and/or the editor(s) disclaim responsibility for any injury to people or property resulting from any ideas, methods, instructions or products referred to in the content. |
© 2025 by the authors. Licensee MDPI, Basel, Switzerland. This article is an open access article distributed under the terms and conditions of the Creative Commons Attribution (CC BY) license (http://creativecommons.org/licenses/by/4.0/).
Copyright: This open access article is published under a Creative Commons CC BY 4.0 license, which permit the free download, distribution, and reuse, provided that the author and preprint are cited in any reuse.


