1. Introduction
In our previous studies, we demonstrated how statistical analyses [
1,
2] and Principal Component Analysis (PCA) [
3] could be performed using graphical user interface (GUI) freeware. Traditionally, these tools are also taught through programming languages such as Python, [
4,
5,
6,
7,
8,
9] which offers powerful resources for implementing both supervised and unsupervised methods. However, this approach requires prior programming experience, which can be a barrier for many students.
Recent advances in artificial intelligence have introduced conversational agents, or chatbots, capable of performing complex data analysis tasks through natural language interaction. Tools such as ChatGPT and Microsoft Copilot leverage Python in the background to execute high-level operations, including data visualization, statistical analysis, and chemometric modeling. Unlike traditional coding workflows, these platforms allow users to upload datasets and request analyses through simple prompts, significantly reducing the need for programming expertise and making advanced analytical techniques more accessible in educational and research settings.
Unsupervised Methods
Unsupervised machine learning methods comprise a class of algorithms that analyze unlabeled data to reveal underlying patterns and intrinsic structures. In contrast to supervised approaches, which rely on predefined labels for model training, unsupervised algorithms independently identify relationships and organize data based on their inherent characteristics. Among these, Principal Component Analysis (PCA) is one of the most common unsupervised methods, while Partial Least Squares (PLS) is widely used as a supervised method. [
10]
The ability of chatbots to perform unsupervised analyses offers a particularly valuable tool in the classroom. Undergraduate and graduate chemometrics courses often struggle to provide graphical user interface (GUI) software for these applications, [
3] and while robust free options exist through coding platforms such as Python and R, [
5,
6,
11] many students lack programming experience. By enabling students to explore complex datasets through natural-language prompts rather than code, chatbots can democratize access to unsupervised methods and facilitate hands-on learning for a broader range of learners.
Supervised Methods
Supervised methods are those that use labeled data (i.e., the target variable is known during training) to learn a mapping from inputs to outputs. In the context of our breast cancer dataset, the label is the diagnosis (benign or malignant). Supervised methods were also known as machine learning.
Supervised learning methods are extensively utilized in chemometrics and vibrational spectroscopy for both classification and predictive modeling, and are frequently implemented using Python-based workflows. [
12] These approaches have been successfully applied to group identification in vibrational spectra [
13] and to determine the regioisomerism of disubstituted benzene derivatives solely from infrared spectral data. [
14]. [
15] evaluated the performance of multiple machine learning algorithms in accurately classifying spectra from diverse sample sets, including fruits, whiskies, and teas. Similarly, [
16] demonstrated the application of supervised models for predicting polymer solubility, introducing essential methodological concepts such as cross-validation and confusion matrix analysis. Collectively, these studies highlight the versatility and robustness of supervised learning techniques in extracting meaningful patterns from complex spectral datasets and in supporting reliable predictive analytics.
Among supervised learning techniques, Partial Least Squares (PLS) regression has been one of the most widely employed approaches. For instance, PLS has been successfully applied to predict the relative concentrations of
p-cymene and limonene based on spectral data acquired through attenuated total reflectance–Fourier transform infrared (ATR-FTIR) spectroscopy. [
17]
Data Processing
PCA is a parametric method that assumes data are homogeneous and approximately normally distributed. To meet these conditions, preprocessing is essential. In the Wisconsin Breast Cancer dataset. For example, in this dataset, worst perimeter can range in the hundreds, while mean fractal dimension is typically less than 0.2. If PCA is applied directly, the large numerical range of worst perimeter will dominate the variance structure, causing the first principal component to align almost entirely with this feature. Such dominance reflects differences in scale rather than the true underlying relationships among variables. [
15,
18,
19,
20,
21]
To address this, data can first be log-transformed to reduce skewness and approximate normality. Subsequently, standardization is applied, rescaling each feature to have a mean of zero and a standard deviation of one. This step ensures all variables contribute equally to PCA, allowing components to reflect true underlying patterns rather than arbitrary measurement scales. Standardization is widely recognized as a fundamental step in PCA workflows, ensuring methodological rigor and interpretability. [
22,
23]
Log transformation is a simple mathematical technique used to reduce skewness and make data more closely approximate a normal distribution. It works by applying a logarithmic function (e.g., log base 10 or natural log) to each value in a feature. This compresses large values and spreads out smaller ones, reducing the impact of extreme outliers and stabilizing variance.
For example, in the Wisconsin Breast Cancer dataset, features like worst perimeter can have a wide range and strong right skew. Applying a log transform makes these distributions more symmetric, which is important because PCA and many parametric methods assume data are roughly normal. After log transformation, standardization (mean = 0, standard deviation = 1) is applied so all features contribute equally to PCA
Methods
The study, conducted in October 2025, employed Microsoft M365 Copilot (GPT-5) as an interactive tool for chemometric analysis. Students interacted with Copilot through natural language prompts within a chat interface, uploading the spreadsheet (WBCD; Supporting Information) and requesting specific analytical tasks.
The publicly available Wisconsin Diagnostic Breast Cancer (
WBCD.csv) dataset, obtained from the UCI Machine Learning Repository, was used as an example. It comprises 569 observations, each corresponding to a digitized image of a fine needle aspirate of a breast mass. The dataset includes 30 numerical features extracted from these images (each described in detail in Wisconsin.docx; supporting information), which quantify various morphological characteristics of the cell nuclei in each sample. [
24,
25,
26,
27].
These features are derived from ten original measurements—radius, texture, perimeter, area, smoothness, compactness, concavity, concave points, symmetry, and fractal dimension—each reported as the mean, standard error, and worst-case value (i.e., the largest measurement). All features are continuous and were scaled prior to analysis.
Each sample is labeled as malignant or benign based on clinical diagnosis, with the dataset comprising 357 benign and 212 malignant cases.
Students prompted the questions listed in
Table 1 into different LLMs and compared the responses obtained. For questions Q1–Q9, the outputs from the LLMs were also compared with those generated by Jamovi, a freeware statistical software previously introduced in our earlier studies. [
1,
2,
28,
29,
30]
Table 1 outlines a multi-step analytical workflow combining exploratory data analysis, statistical comparisons, dimensionality reduction techniques (PCA and PLS-DA), and classification performance assessment. The plan is specifically designed to compare the impact of log transformation on feature distributions, multivariate discrimination, and final model predictive performance (using PLS-DA)
The LLMs used in this study were Microsoft 365 Copilot (GPT-5) and the Gemini family. The Gemini models were accessed directly through the Microsoft Edge browser.
Overview
Three graduate students worked on the questions listed in
Table 1 during October 2025. The initial objective was to use Microsoft 365 Copilot (GPT-5)—available free of charge to Brazilian universities—and compare its performance with Jamovi. However, since most students also had access to the Gemini family of models (available in Brazil for approximately 25 reais, or about 4 U.S. dollars), Gemini was included as an additional tool.
The inclusion of Gemini provided a basis for comparing the responses from Copilot for questions Q11–Q15, as Jamovi does not support PLS-DA analysis. Students were first introduced to key statistical concepts using Jamovi and then to the principles of PLS-DA. They also received additional guidance by querying the LLMs (for example, “What is the difference between score plots in PCA and PLS-DA?” or “What is PLS-DA?”).
The exercise was administered to students enrolled in a graduated analytical chemistry course that featured a strong emphasis on statistical methods. Students were tasked with independently solving the complete set of problems presented in
Table 1 during a dedicated 200-minute lab session. Recognizing that the course enrollment included students from non-chemistry backgrounds, the instructional material utilized a publicly available dataset on cancer diagnosis. This selection provided a statistically rich yet inherently appealing and relatable subject matter to foster broader engagement with the principles of data analysis.
Results and Discussion
Checking Data Normality and Comparing Variables
It is important for students to become familiar with different types of data distributions. Although they were accustomed to working with normally distributed datasets, they encountered cases in which the data were not normally distributed.
In Q1, students explored how to assess data normality. Both the LLM and Jamovi applied the Shapiro–Wilk test, demonstrating that none of the variables followed a normal distribution.
In Q2, students examined which variables differed between malignant and benign diagnoses. Since Q1 revealed that the data were not normally distributed, comparisons between the two groups were performed using the Mann–Whitney test (the nonparametric equivalent of the t-test) in Jamovi. The LLM also applied the Mann–Whitney test, and both tools reached the same conclusion: all variables differed significantly between malignant and benign diagnoses (p < 0.001), except for Mean Fractal Dimension, Texture Error, and Smoothness Error (p > 0.05), while Symmetry Error showed a p-value of 0.023.
Through Q1 and Q2, students learned how to evaluate data normality and how to compare two independent groups using appropriate statistical tests.
Building Histograms
Histograms illustrate the frequency distribution of a single variable by grouping data into bins, providing insight into the overall shape of the data—whether skewed, uniform, or approximately normal— [
2,
31] and are effective for identifying patterns such as clustering or gaps within malignant and benign tumor measurements.
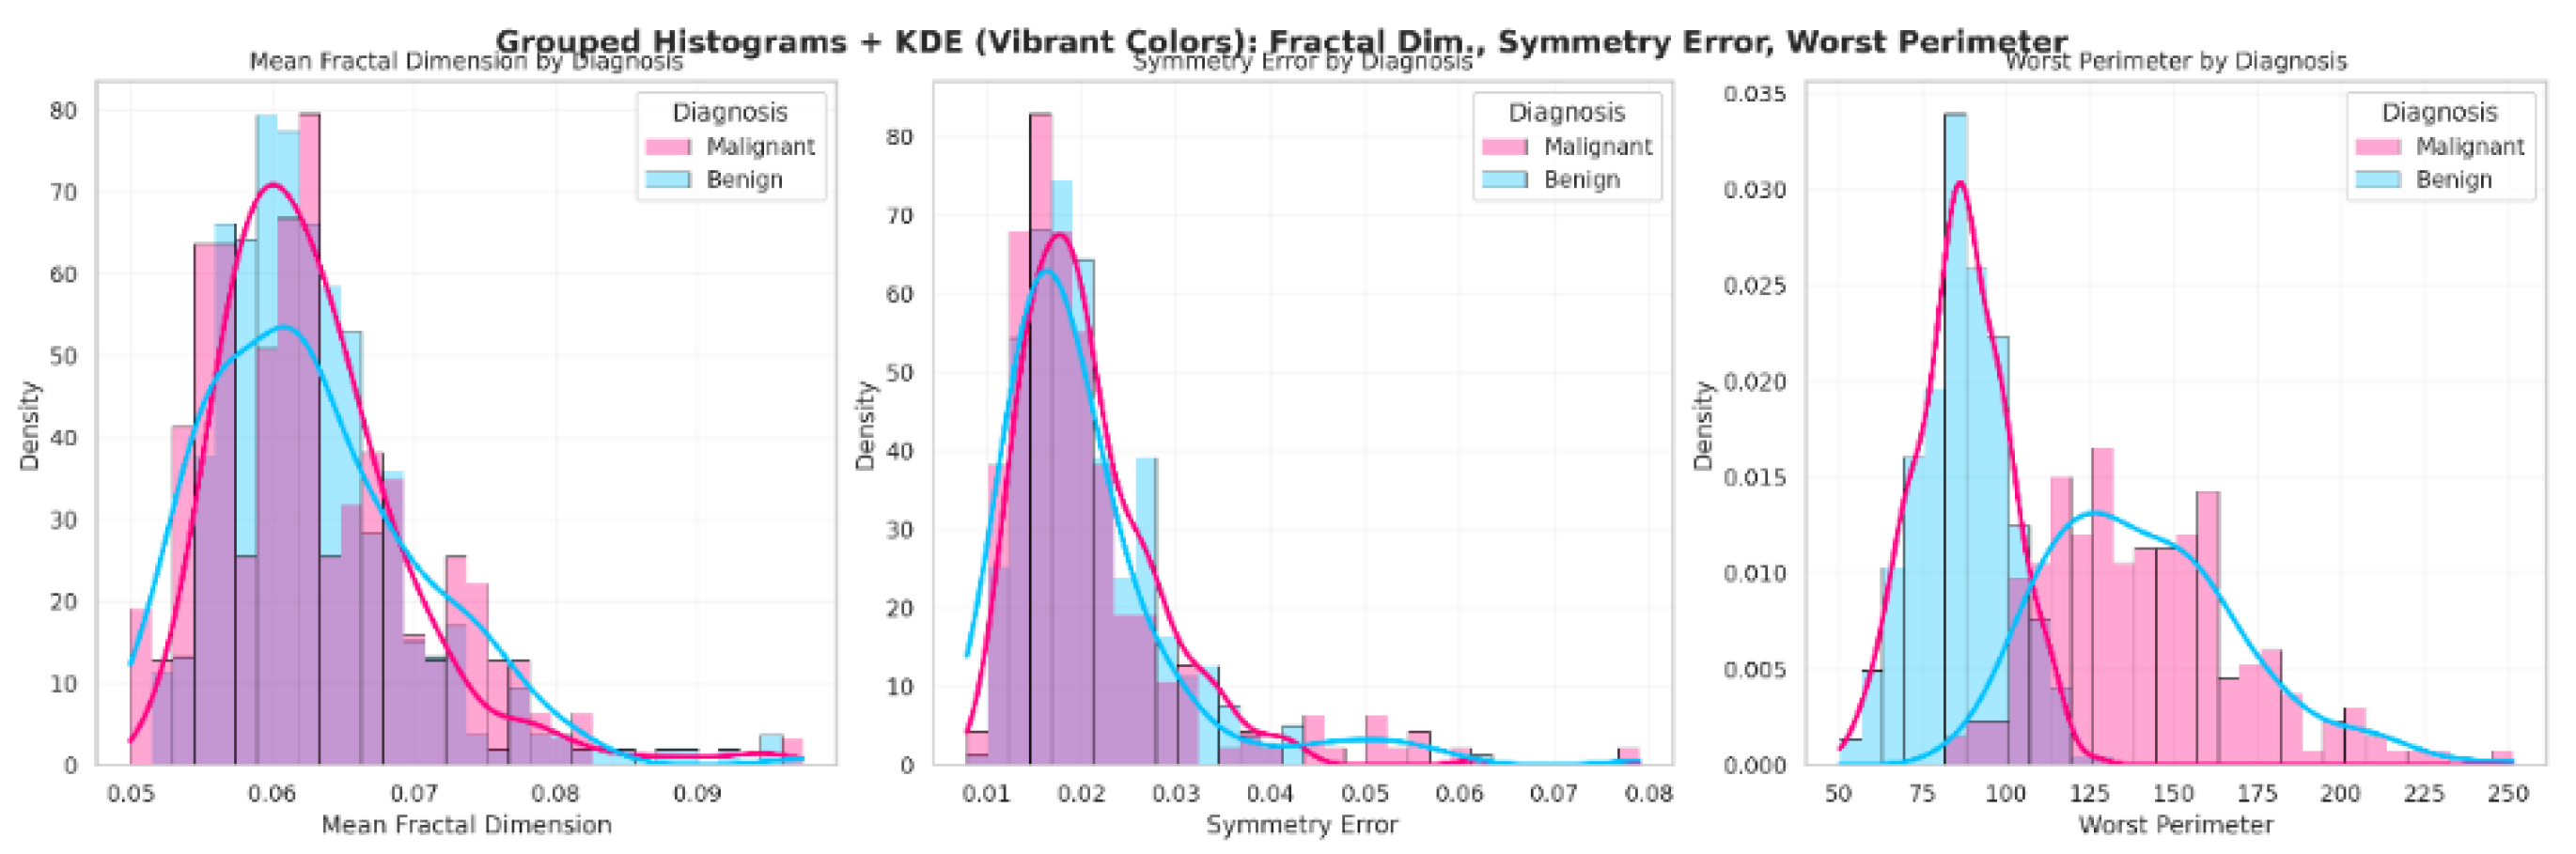
In the statistical analysis of the dataset, mean fractal dimension did not differ significantly between diagnoses (p = 0.537), whereas symmetry error and worst perimeter showed significant differences (p = 0.023 and p < 0.001, respectively). Therefore, these variables were further explored using histograms. When “Q3” was prompted, Copilot generated the visualizations shown in
Figure 1, where each diagnostic group is represented by a distinct color for clarity. Students noted that the histograms for mean fractal dimension were largely overlapping between malignant and benign cases, indicating similar distributions. For symmetry error, the histograms were partially overlapping, while for worst perimeter, the distributions were clearly distinct. These visual patterns reinforce the significance levels reported in “Q2.” Additionally, the shape of the histograms confirms that the data are not normally distributed, consistent with the Shapiro–Wilk normality test results presented in “Q1.” The LLM and JAMOVI provided equivalent plots.
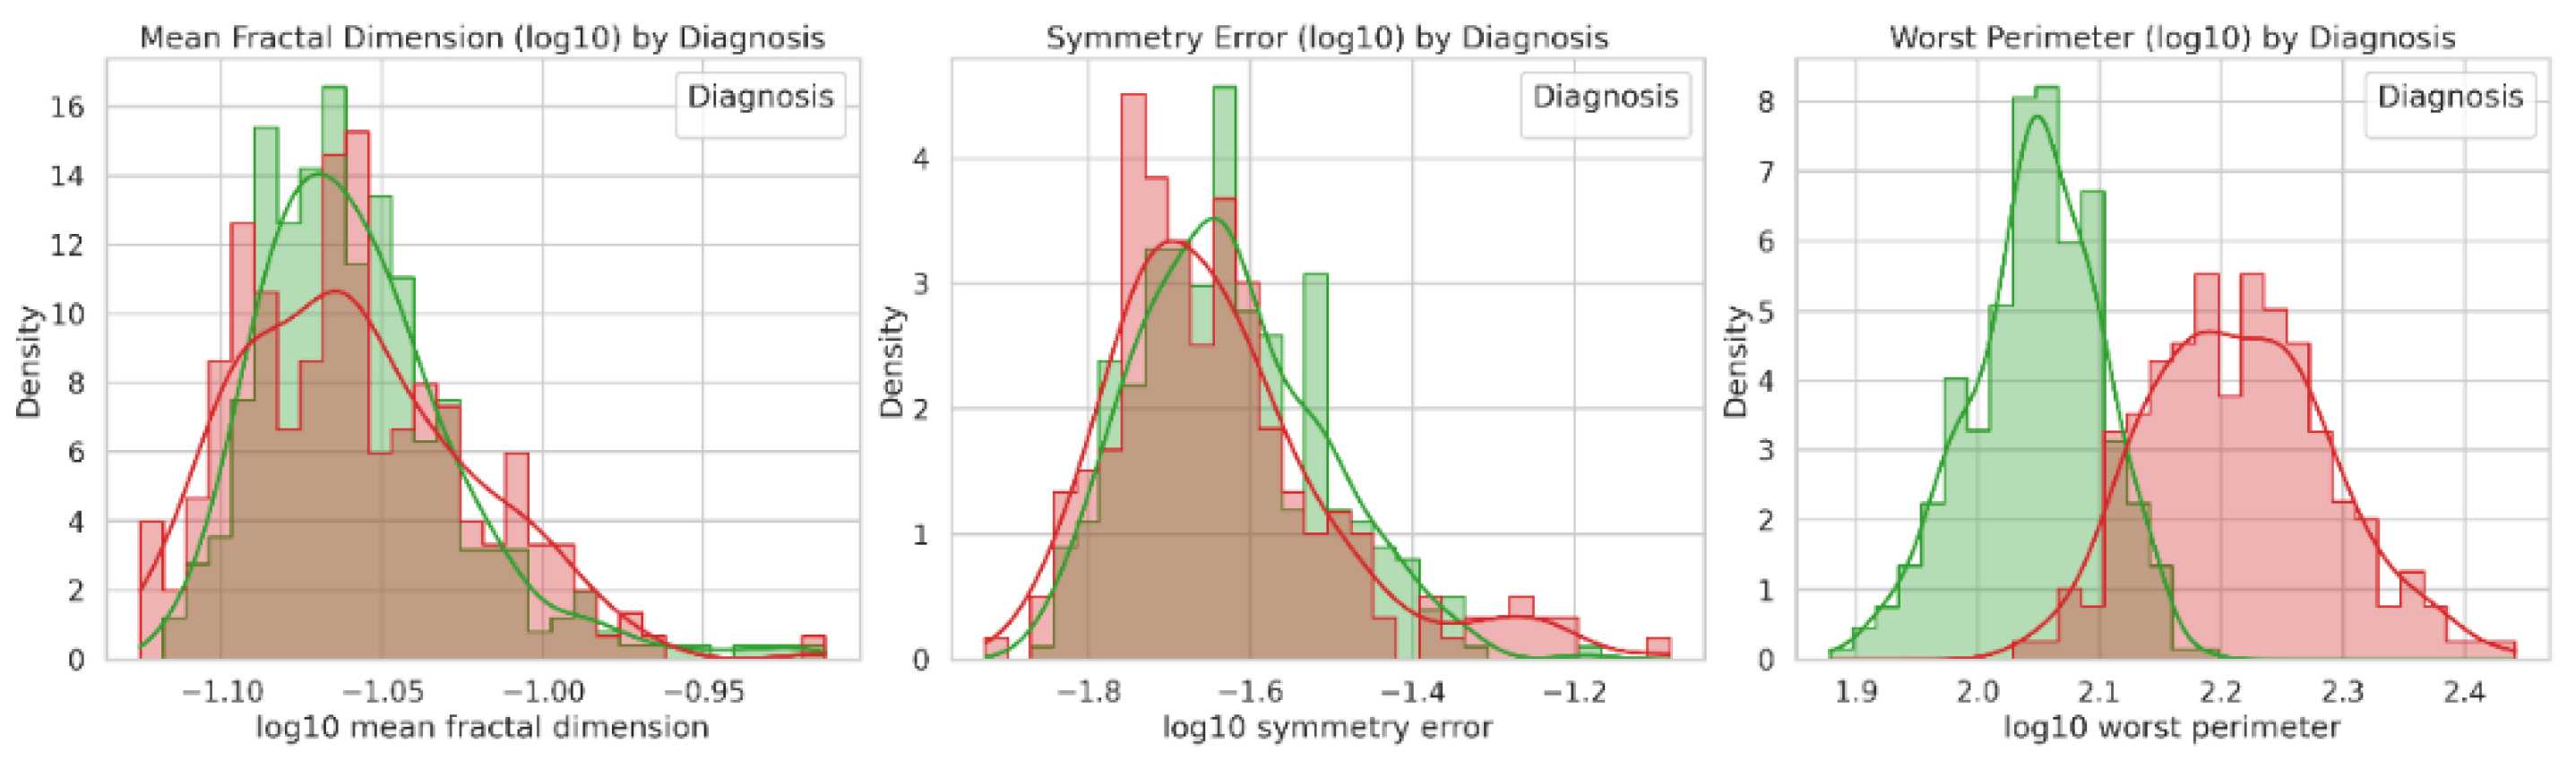
In Q3, students noted that the non-normal distribution could be adjusted through log transformation (
Figure 2). The LLM generated a log-transformed version of the WBCD dataset (WBCDlog.csv, Supporting Information), and both the LLM and Jamovi produced comparable plots for Q3 and Q4. Furthermore, students emphasized the relevance of histograms in assessing data distribution and group composition.
Building Box Plots
Box plots are statistical visualizations that summarize the distribution of a dataset by displaying its median, quartiles, and potential outliers. [
32,
33,
34] They are particularly useful for comparing groups, such as malignant and benign tumor classifications, by highlighting differences in central tendency and variability across features like mean radius, texture, and perimeter.
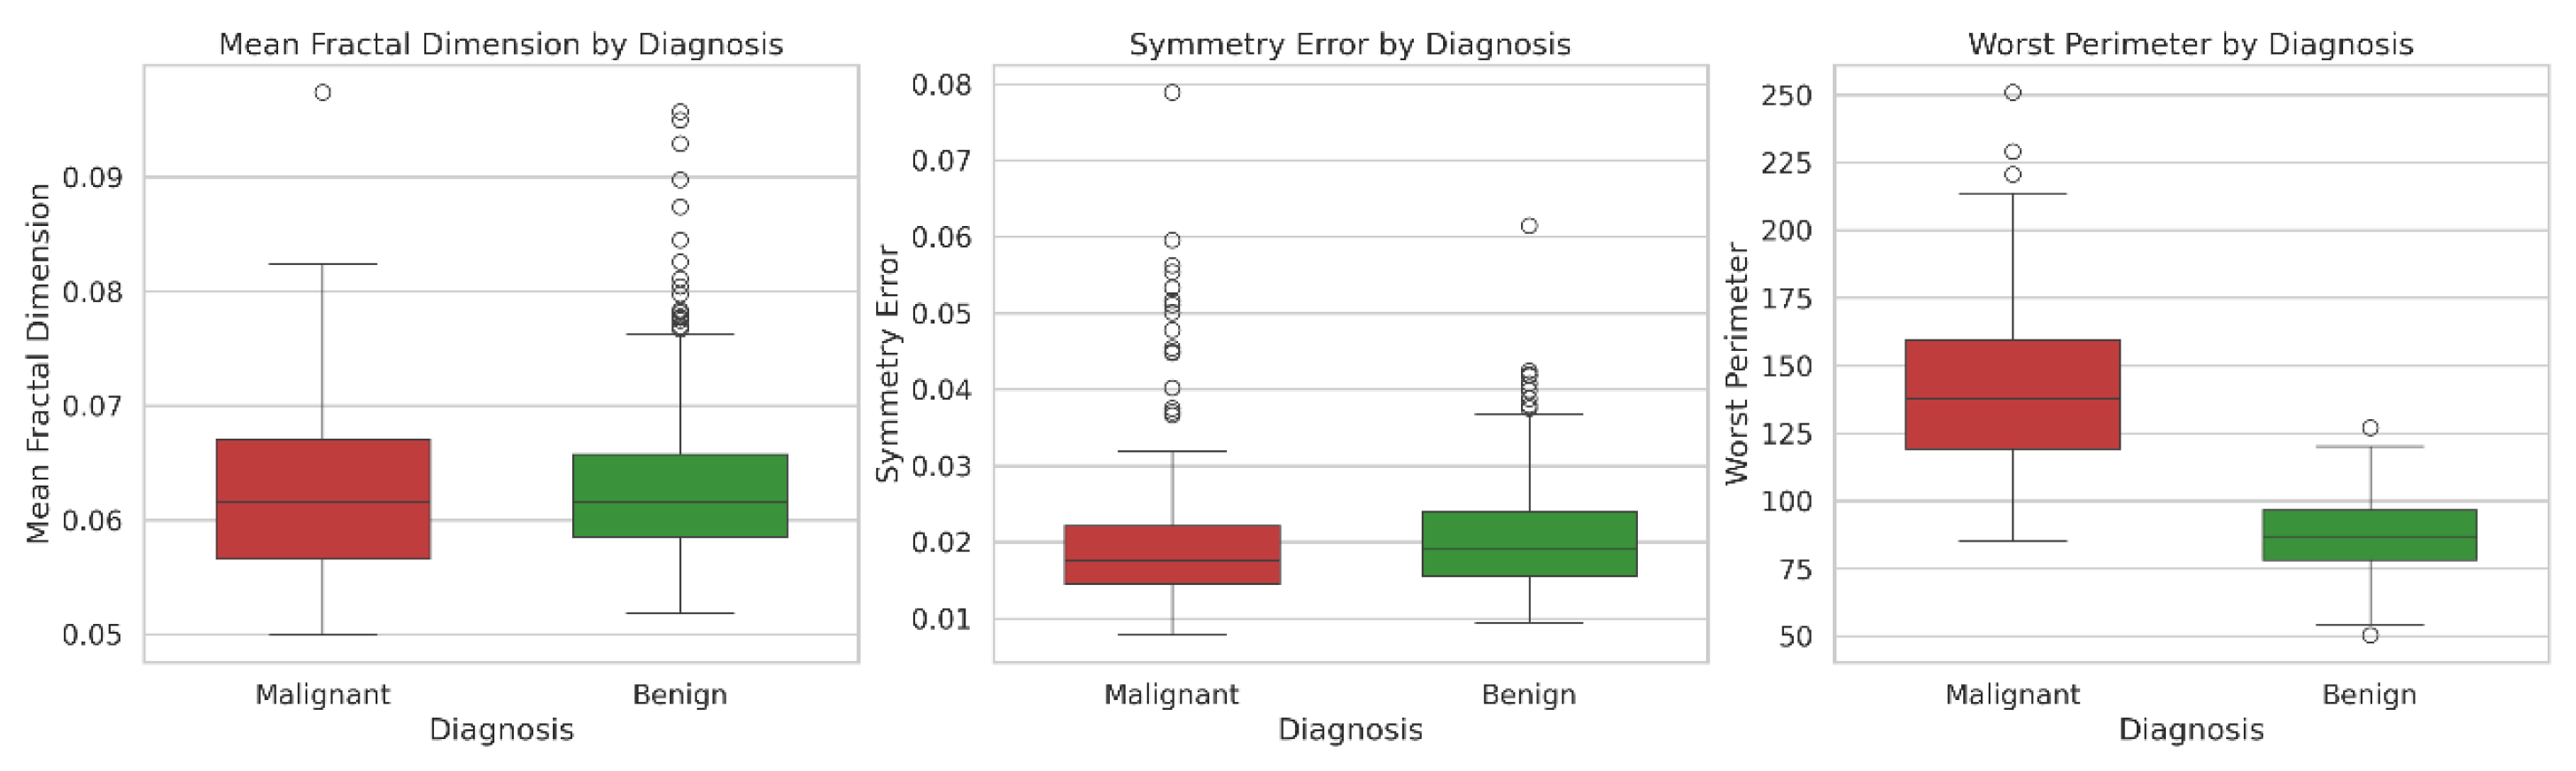
In Q5, the box plot (
Figure 3) generated by Copilot indicated that the data were not normally distributed due to the large number of outliers. This visual evidence supported the conclusion obtained from the Mann–Whitney test (Q2) and students observed that box plots were effective to compare groups in addition to hypothesis tests. The Mean Fractal Dimension and Symmetry Error were similar between benign and malignant diagnoses, whereas the Worst Perimeter differed significantly between the two groups.
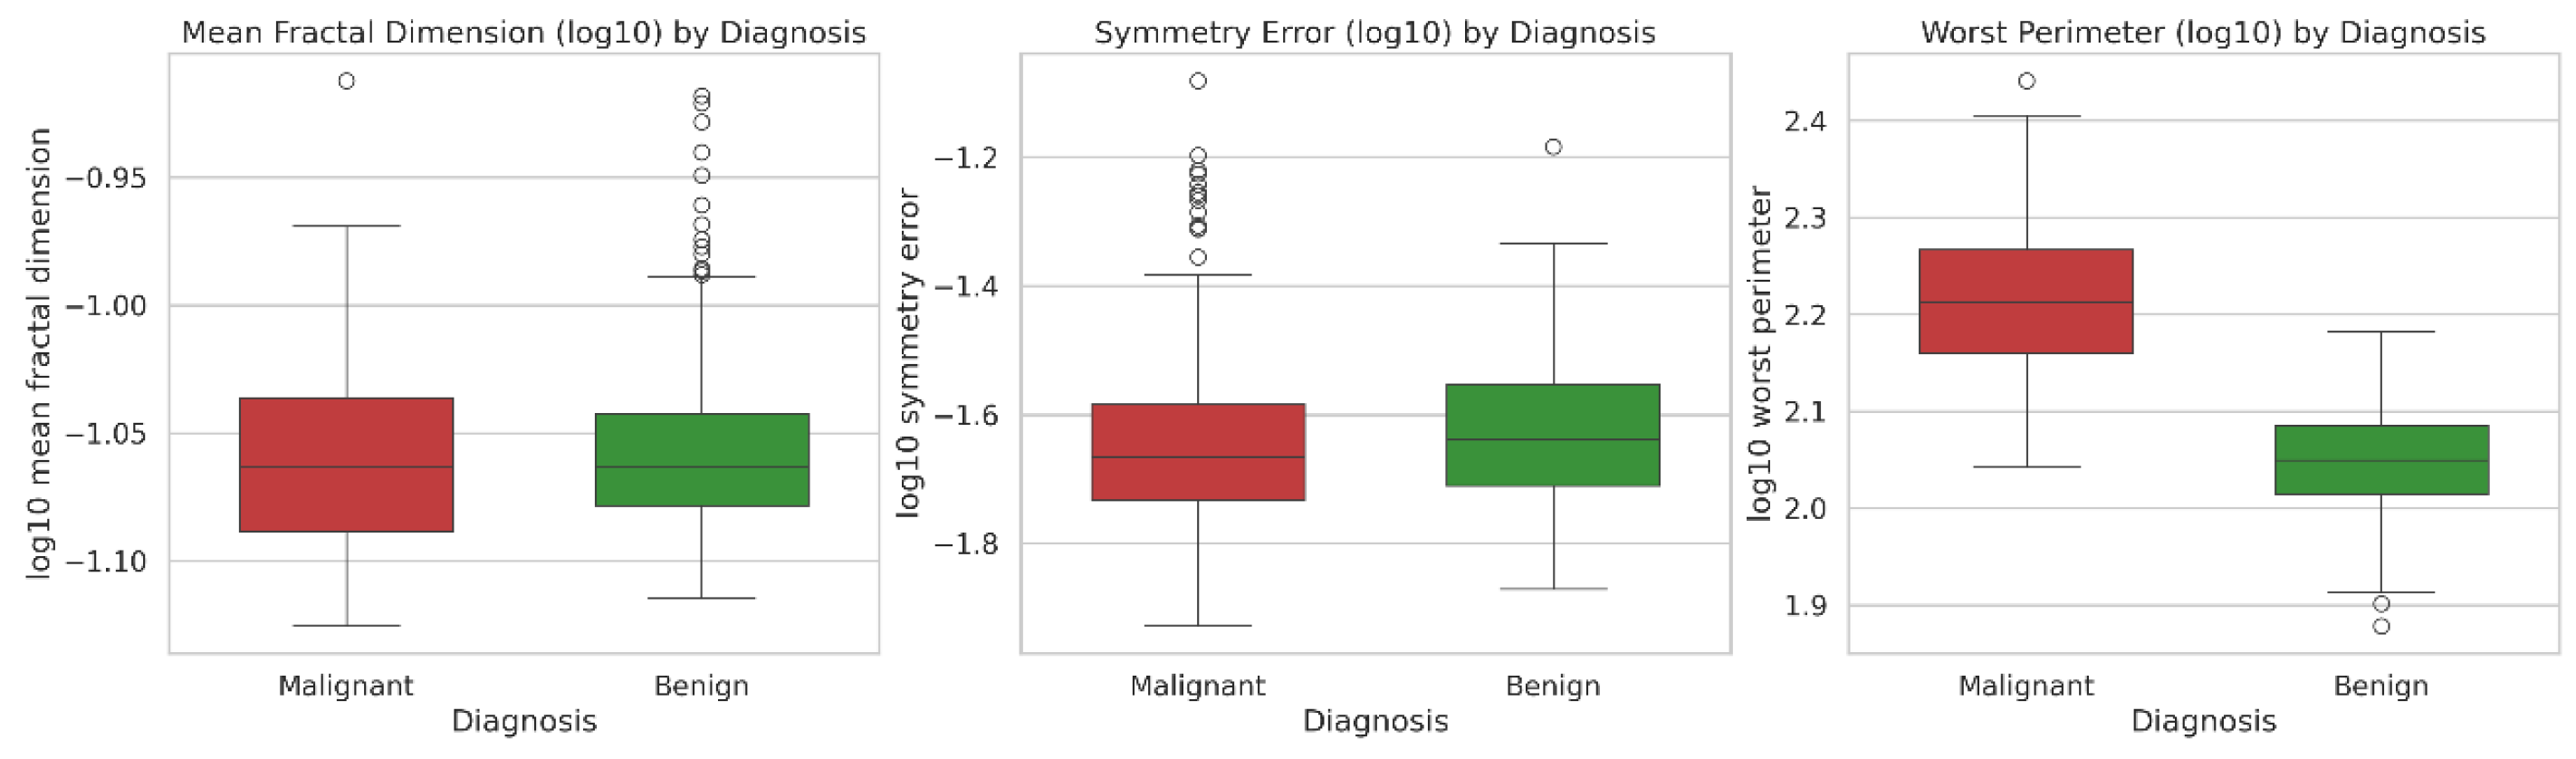
In Q6, the log-transformed data continued to display outliers (
Figure 4), consistent with the skewed distribution observed in the histogram of
Figure 1. Both the LLM and JAMOVI generated comparable plots for Q5 and Q6.
Principal Component Analysis (PCA)
PCA is a technique used to simplify complex datasets by finding the directions (called
principal components, PC) where the data varies the most. These directions help us understand patterns and reduce the number of features while keeping the most important information. [
23,
35,
36] PCA is an unsupervised multivariate technique widely employed for dimensionality reduction in high-dimensional datasets. Its primary objective is to transform the original correlated variables into a smaller set of uncorrelated variables, termed
principal components, which capture the maximum possible variance in the data. [
1,
3,
22,
23,
31,
37,
38] By projecting observations onto these new orthogonal axes, PCA facilitates visualization and interpretation of complex datasets while minimizing information loss. [
19]
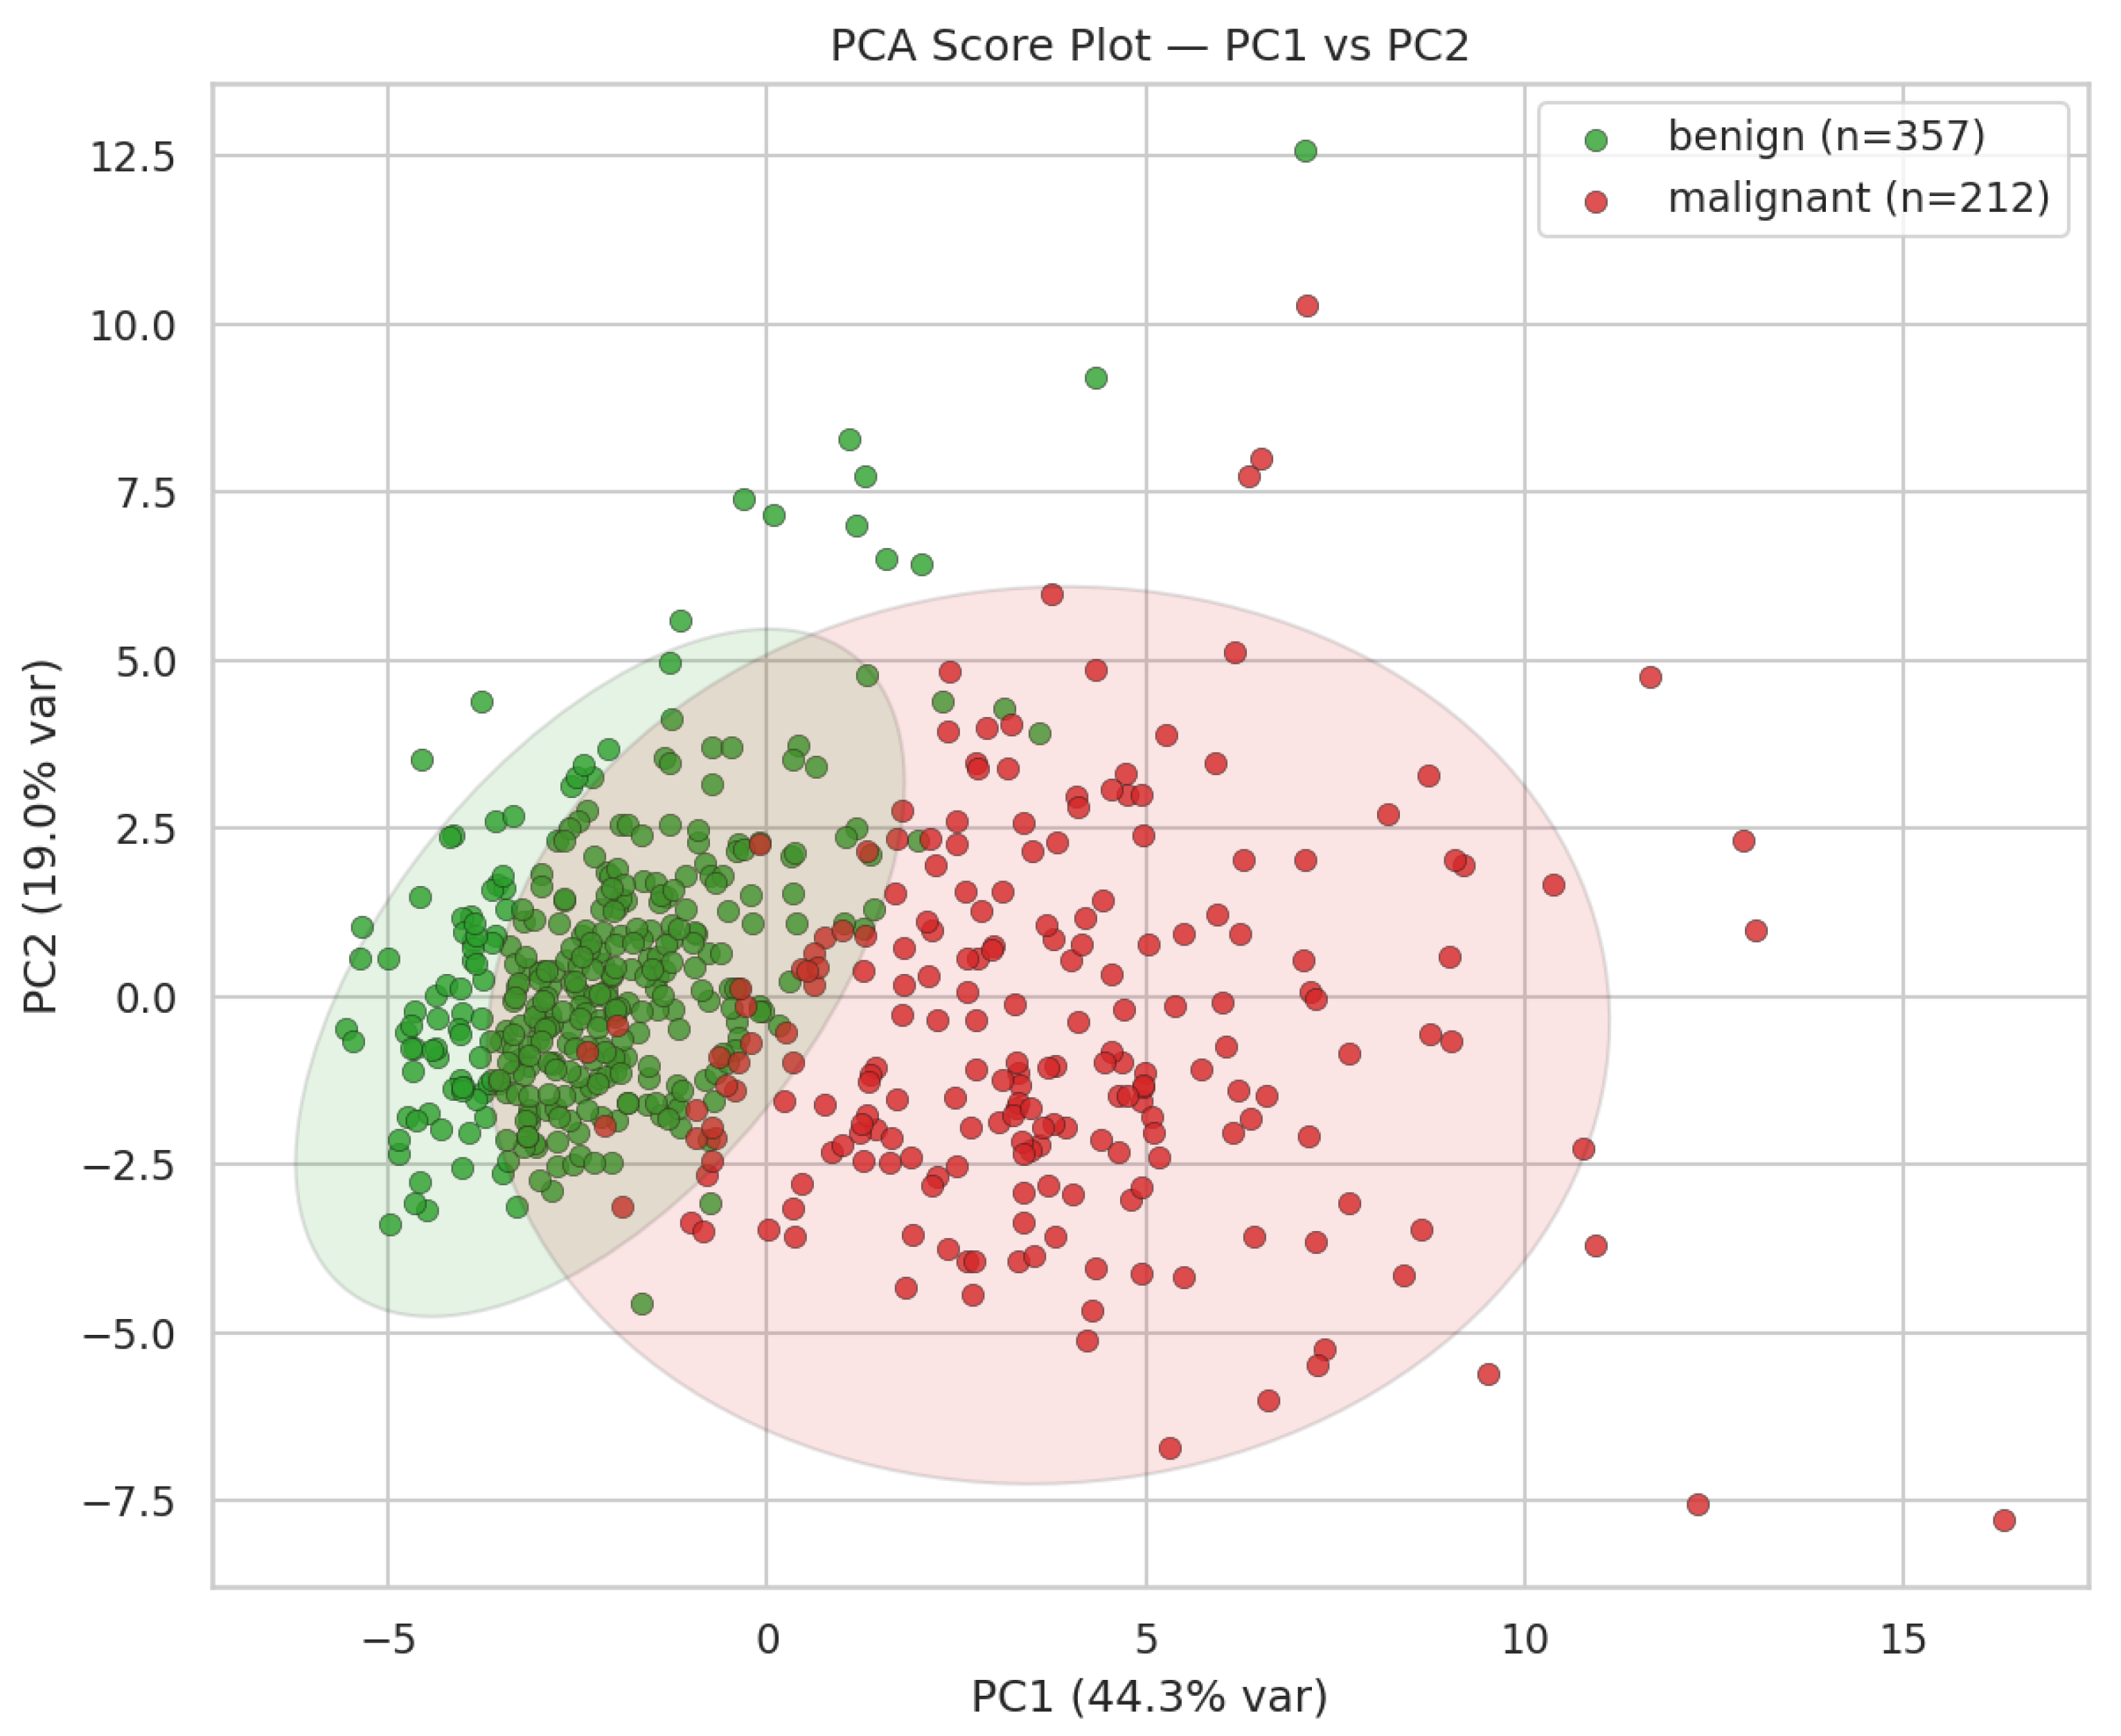
To demonstrate PCA’s application, the prompt “Q7” was submitted to Microsoft Copilot, which generated the visualization shown in
Figure 5. In this score plot, benign and malignant breast cancer samples were represented in distinct colors (green and red, respectively). A clear separation between the two diagnostic groups is evident: malignant samples cluster predominantly on the right, whereas benign samples occupy the left region of the plot. This separation indicates that the first two principal components effectively capture the discriminatory structure of the dataset. Specifically, Principal Component 1 (PC1) explains 44.3% of the total variance, and Principal Component 2 (PC2) accounts for 19.0%, together representing approximately 63% of the overall variability.
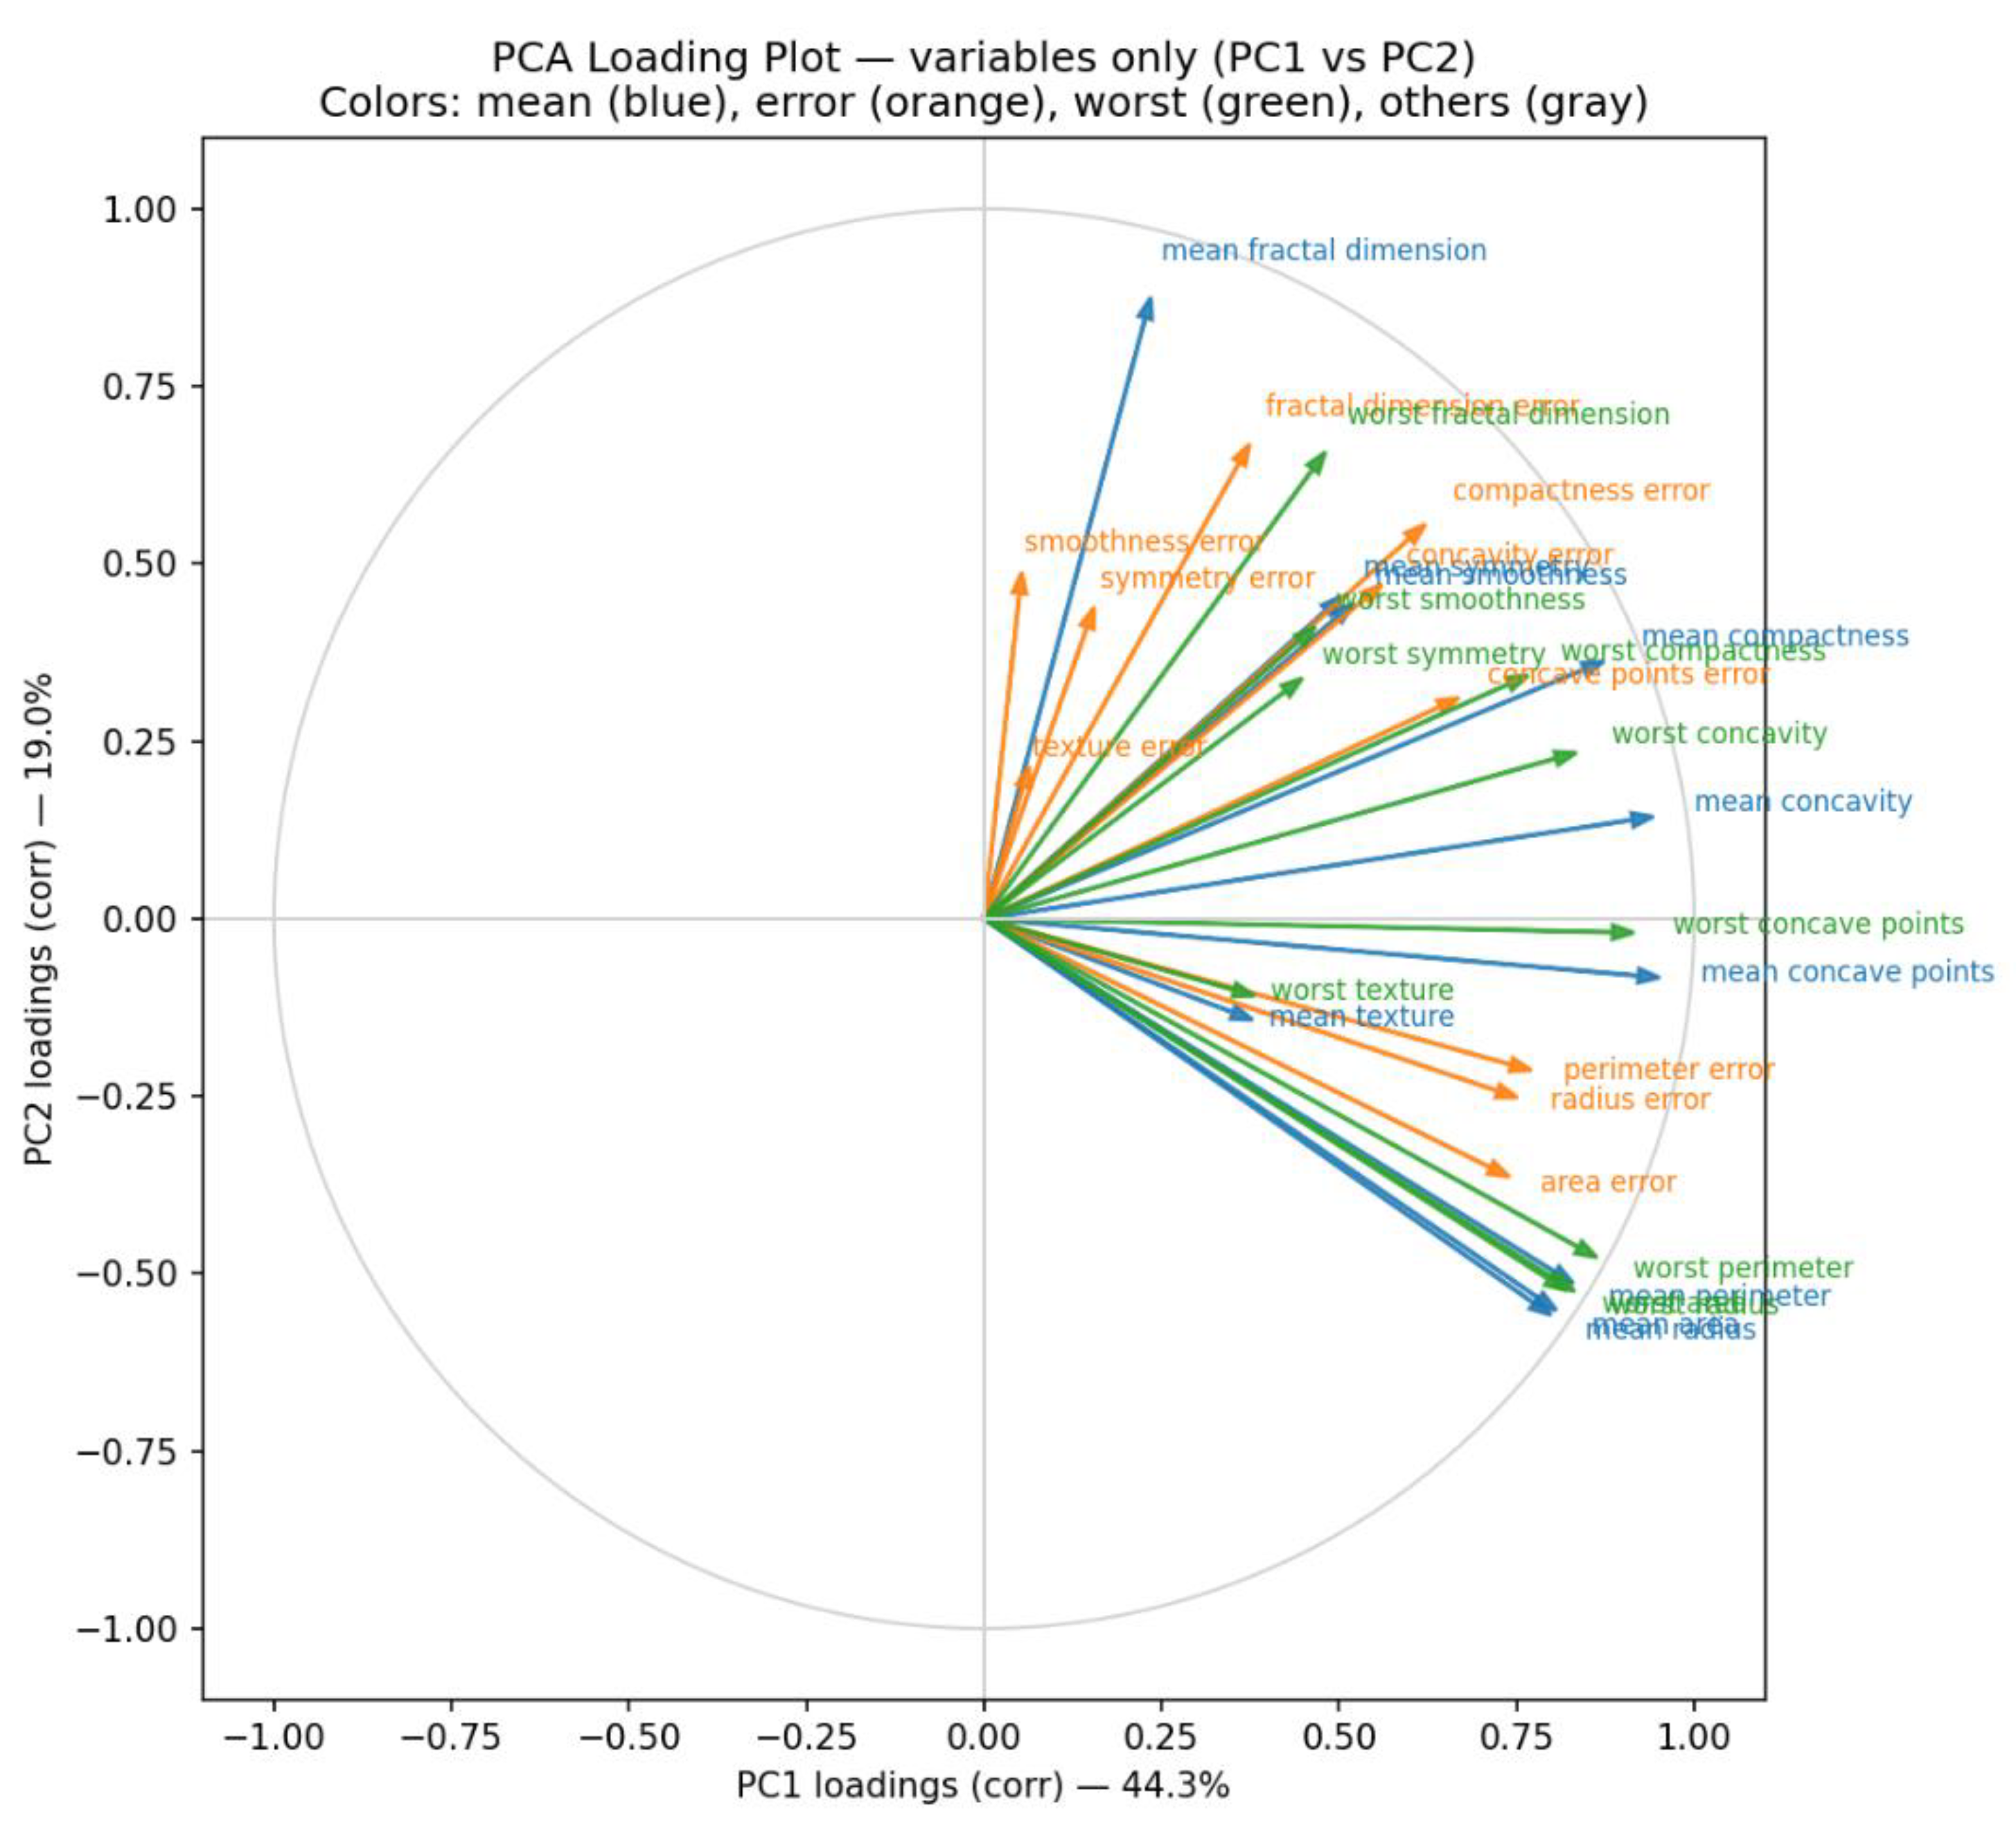
Complementing the score plot, the PCA loading plot (
Figure 6)—generated by prompting “Q8”—illustrates the contribution of individual variables to the principal components. Variables with longer vectors exert greater influence on the corresponding component. For instance,
mean concave points exhibits the highest loading on PC1, while
mean fractal dimension dominates PC2. Consequently, samples positioned on the right side of the score plot tend to have higher
mean concave points values, whereas those located toward the top exhibit elevated
mean fractal dimension values. Copilot enhanced interpretability by color-coding variables according to feature type (blue = mean features, orange = error features, green = worst features, gray = others). This visualization underscores that malignant samples generally present higher values for the most influential variables compared with benign samples.
The loading plot also provides insight into inter-variable relationships. Vectors pointing in similar directions indicate strong positive correlations (e.g., worst concave points and mean concave points), whereas vectors oriented 180° apart denote negative correlations, and those at approximately 90° suggest negligible association (e.g., mean fractal dimension vs. mean concave points).
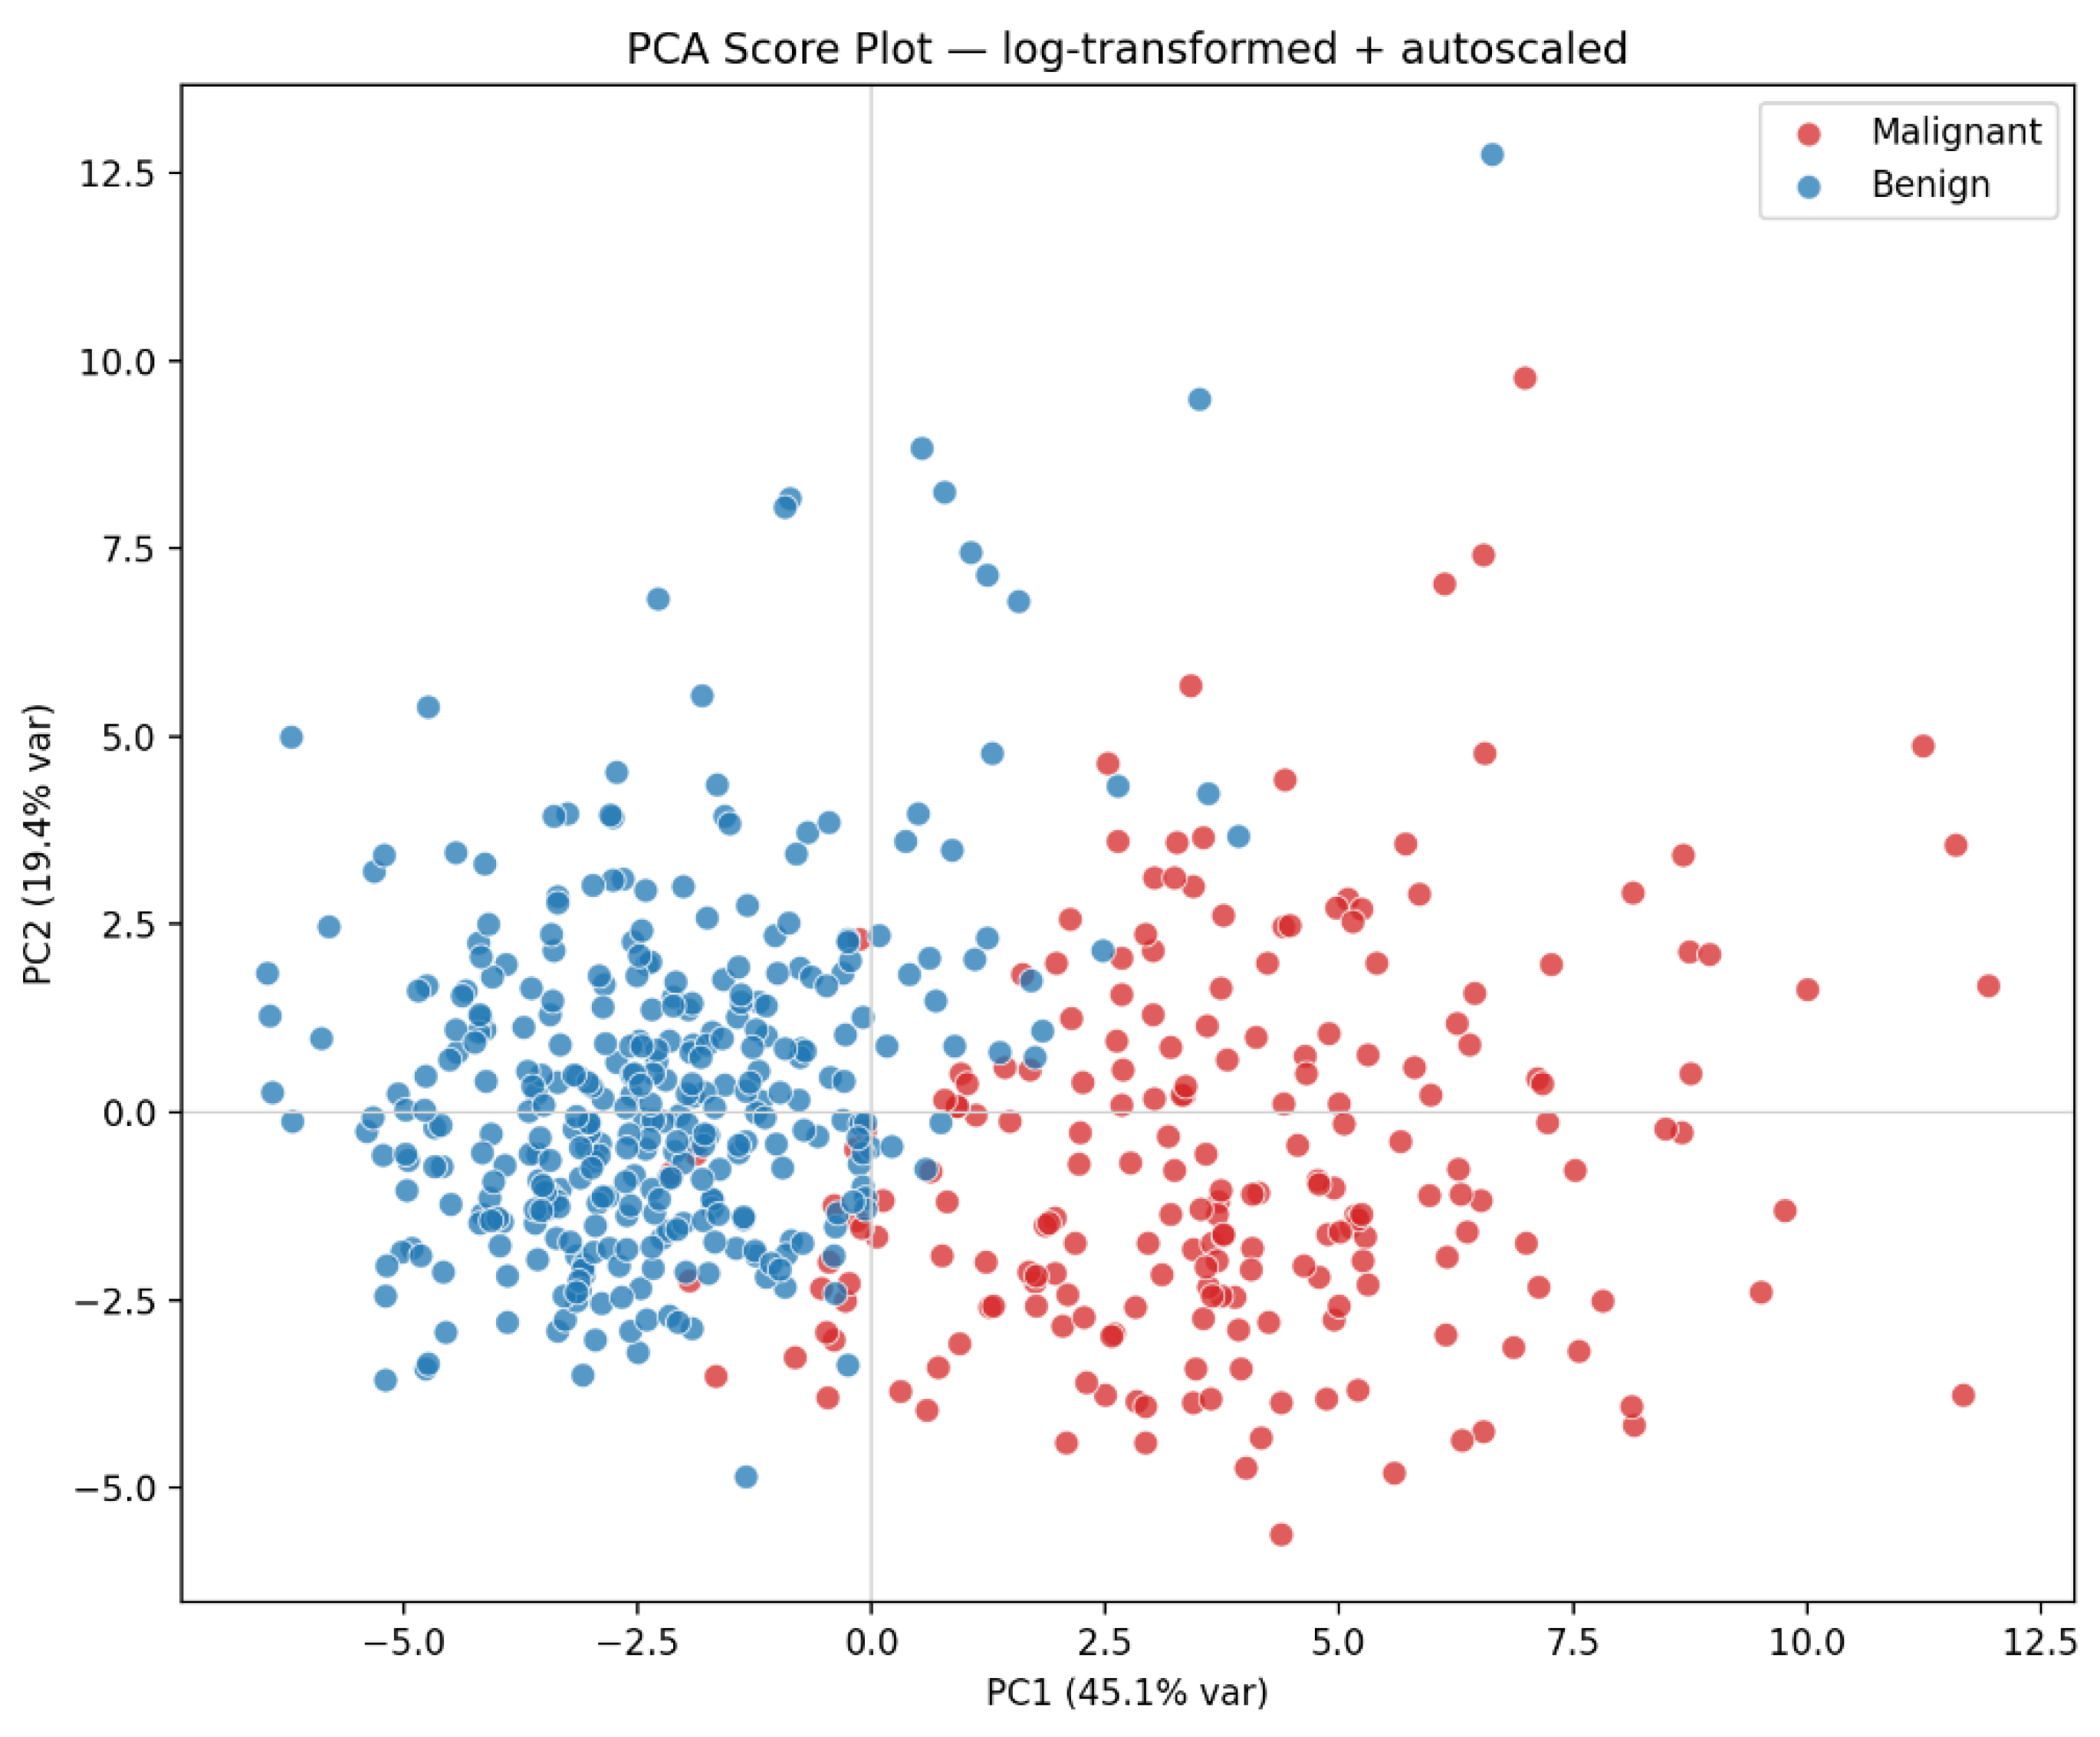
PCA requires that the data be approximately normal, linear, and homogeneous, and it is sensitive to outliers. To address these conditions, students applied a log transformation followed by autoscaling to the dataset. When they prompted “Q9,” Copilot generated the score plot for the log-transformed data (
Figure 7).
When PCA was performed on the autoscaled raw and log-transformed datasets, the overall structure of the score plots remained similar (compare
Figure 7 with
Figure 5). However, the log transformation slightly enhanced class separation, particularly along PC1. Malignant samples became more compact, reducing within-class variance, whereas benign samples showed a modest increase in spread, resulting in a larger mean difference and higher effect size on PC1. A marginal improvement was also observed along PC2.
This improvement stems from the log transformation’s ability to compress dynamic range, reduce skewness, and lessen the impact of outlier samples while preserving the overall geometry of the data. Consequently, PCA captured relative rather than absolute differences, producing clearer margins between benign and malignant groups without altering the principal directions. In Q10, the students observed how LLM compare both data treatment.
Gemini also produced a similar score plot when prompted to “apply a log transformation to the dataset and provide it for download.” The resulting file, WCBDlog.csv, was made available as Supporting Information. When this file was loaded into Jamovi, the resulting score plot closely resembled those generated by the LLM.
Partial Least Squares Discriminant Analysis (PLS-DA)
Partial Least Squares Discriminant Analysis (PLS-DA) is a supervised classification method derived from PLS regression and adapted for categorical outcomes. It reduces high-dimensional, collinear predictor data (e.g., spectra) into a latent space that maximizes class separation, making it particularly suitable for spectroscopic datasets. In this section, students applied PLS-DA to classify samples as benign or malignant. [
39,
40,
41]
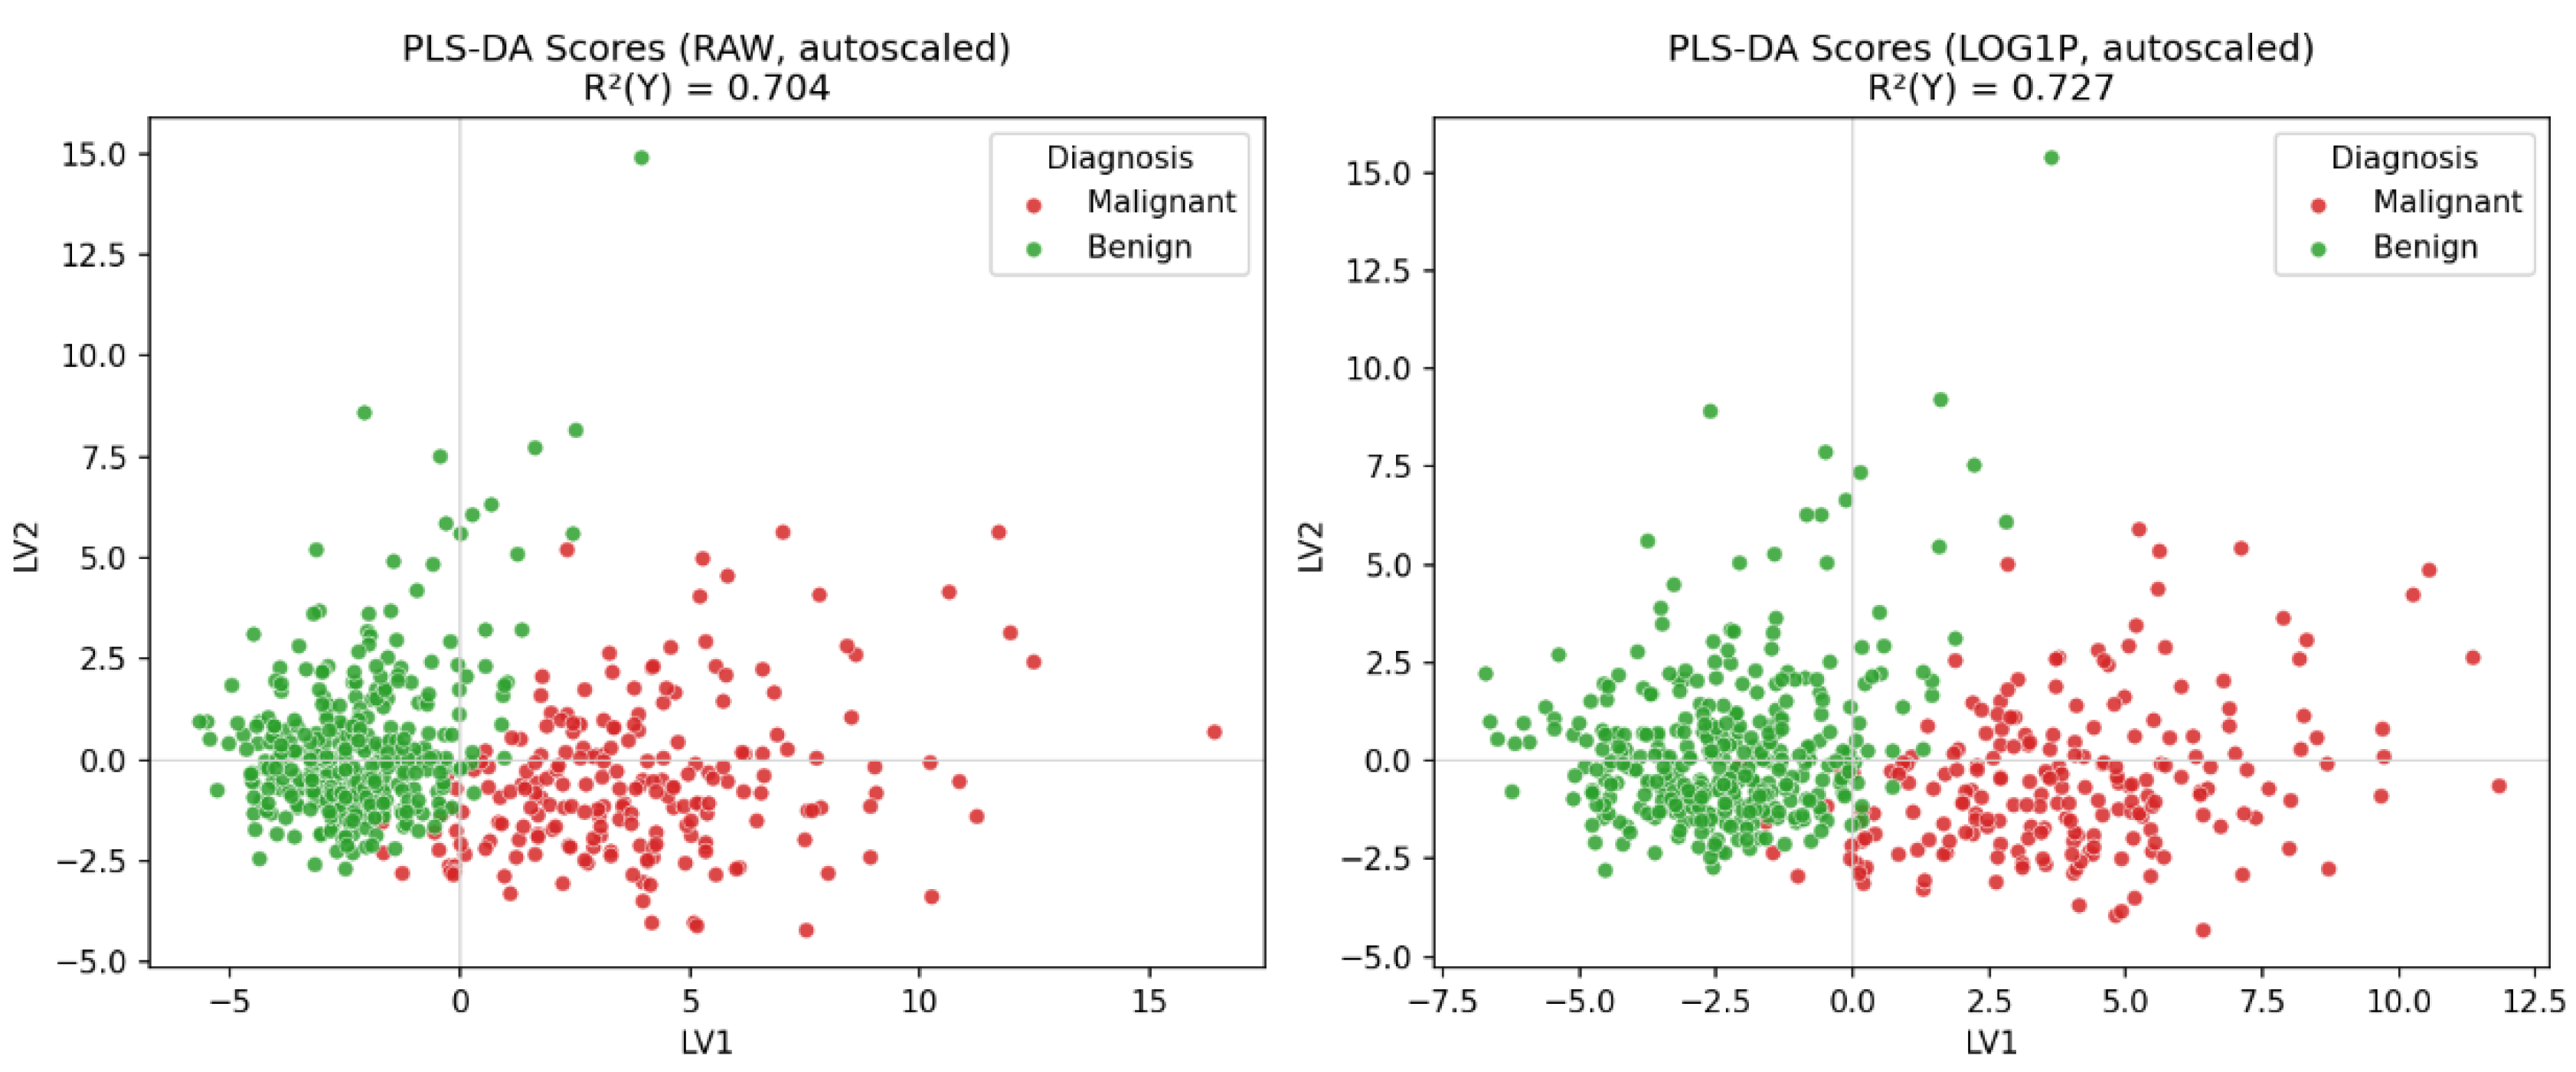
Students evaluated how data preprocessing affected the PLS-DA model. When they prompted
Q11, Copilot generated
Figure 8, which showed that the PLS-DA applied to the raw dataset provided clear and well-defined class separation. The model based on the log-transformed data also exhibited excellent separation, with clusters appearing slightly more compact and spherical than in the raw data. In
Q12, students compared how both LLMs handled the preprocessing steps; both produced equivalent score plots.
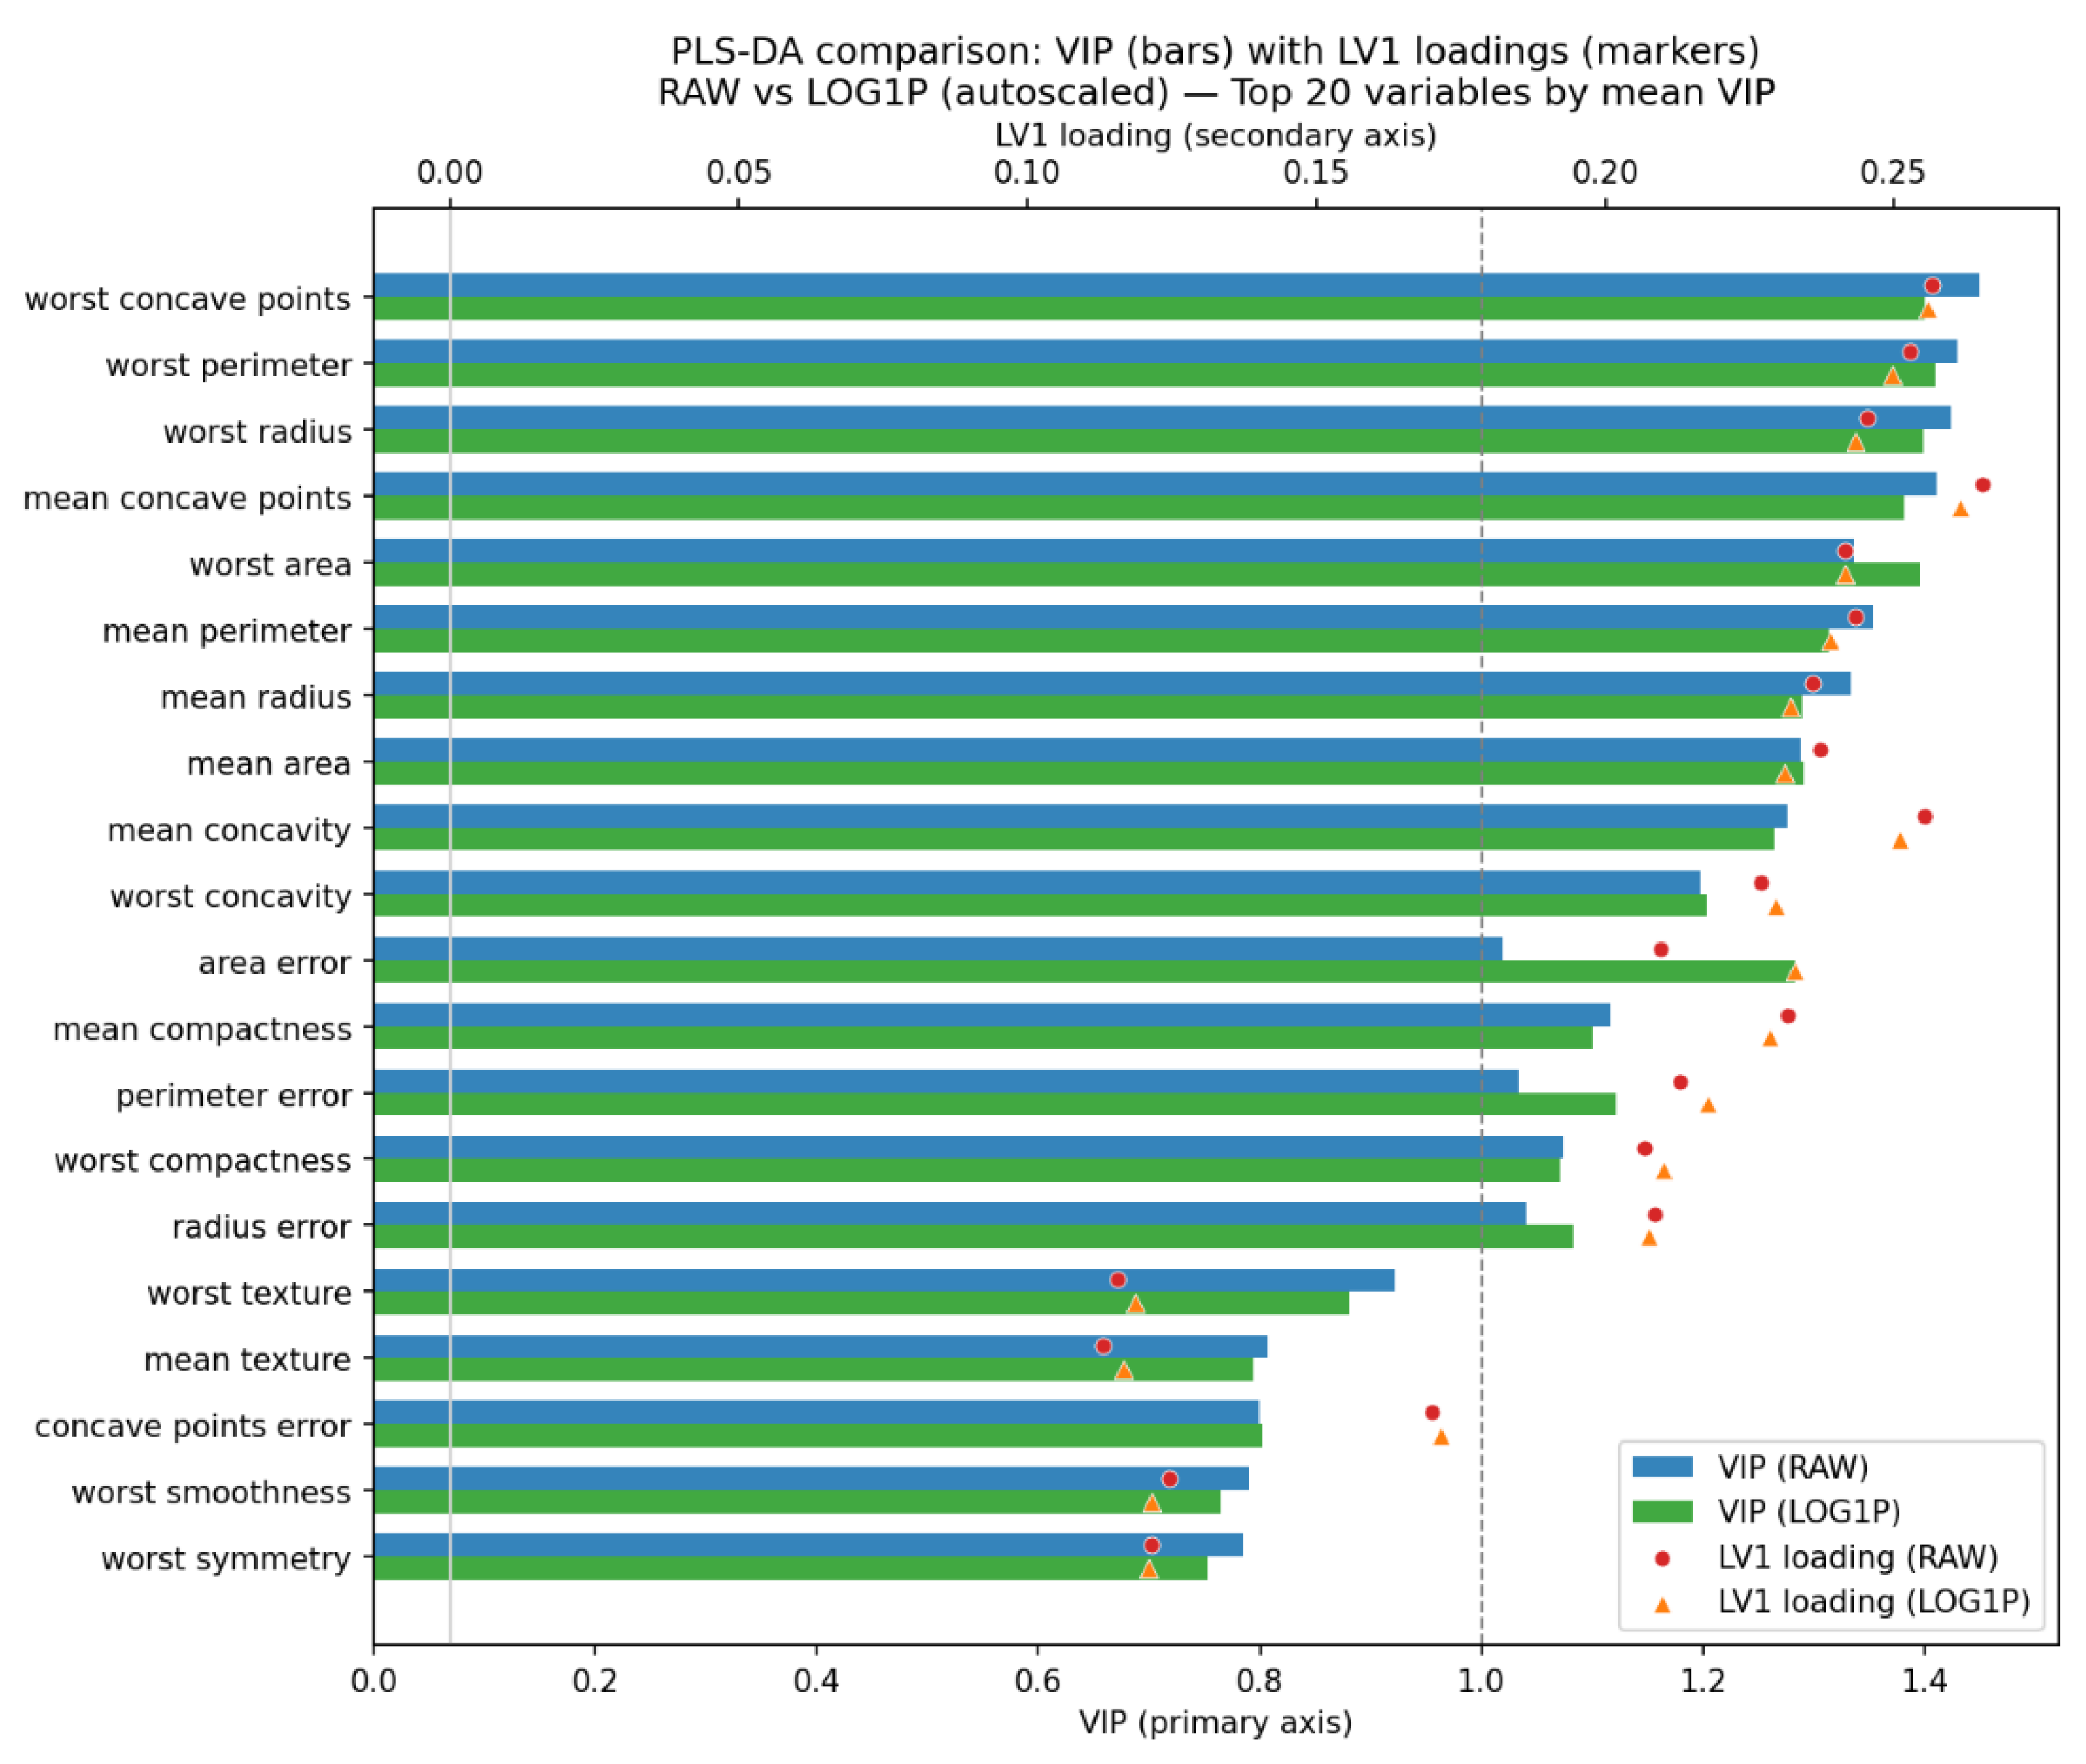
Students examined the variable importance in each PLS-DA model using the VIP score plot, obtained by prompting “Q13.” In
Figure 9, the log-transformed data produced a VIP profile highly similar to that of the raw dataset, confirming that the transformation does not fundamentally alter the biological or statistical relevance ranking of the features. The log transformation slightly lowered the VIP scores of the most influential variables, suggesting a more even distribution of discriminatory power and a reduced influence of extreme values.
In
Figure 9, markers on the twin x-axis represent LV1 loadings for the same features (red circles = RAW; orange triangles = LOG1P), with vertical reference lines at VIP = 1 (common importance threshold) and Loading = 0 (sign change). Models were constructed after mean-centering and unit variance scaling in both workflows. Together, the bars (importance) and markers (direction and magnitude on LV1) reveal which variables most strongly drive class separation and how the log transformation subtly modifies their relative contributions or directional associations with the malignant class. Both LLM provided equivalent VIP plots and observed that the variables with great contribution to the PLS-DA model build raw data were close to those build using log transformed data.
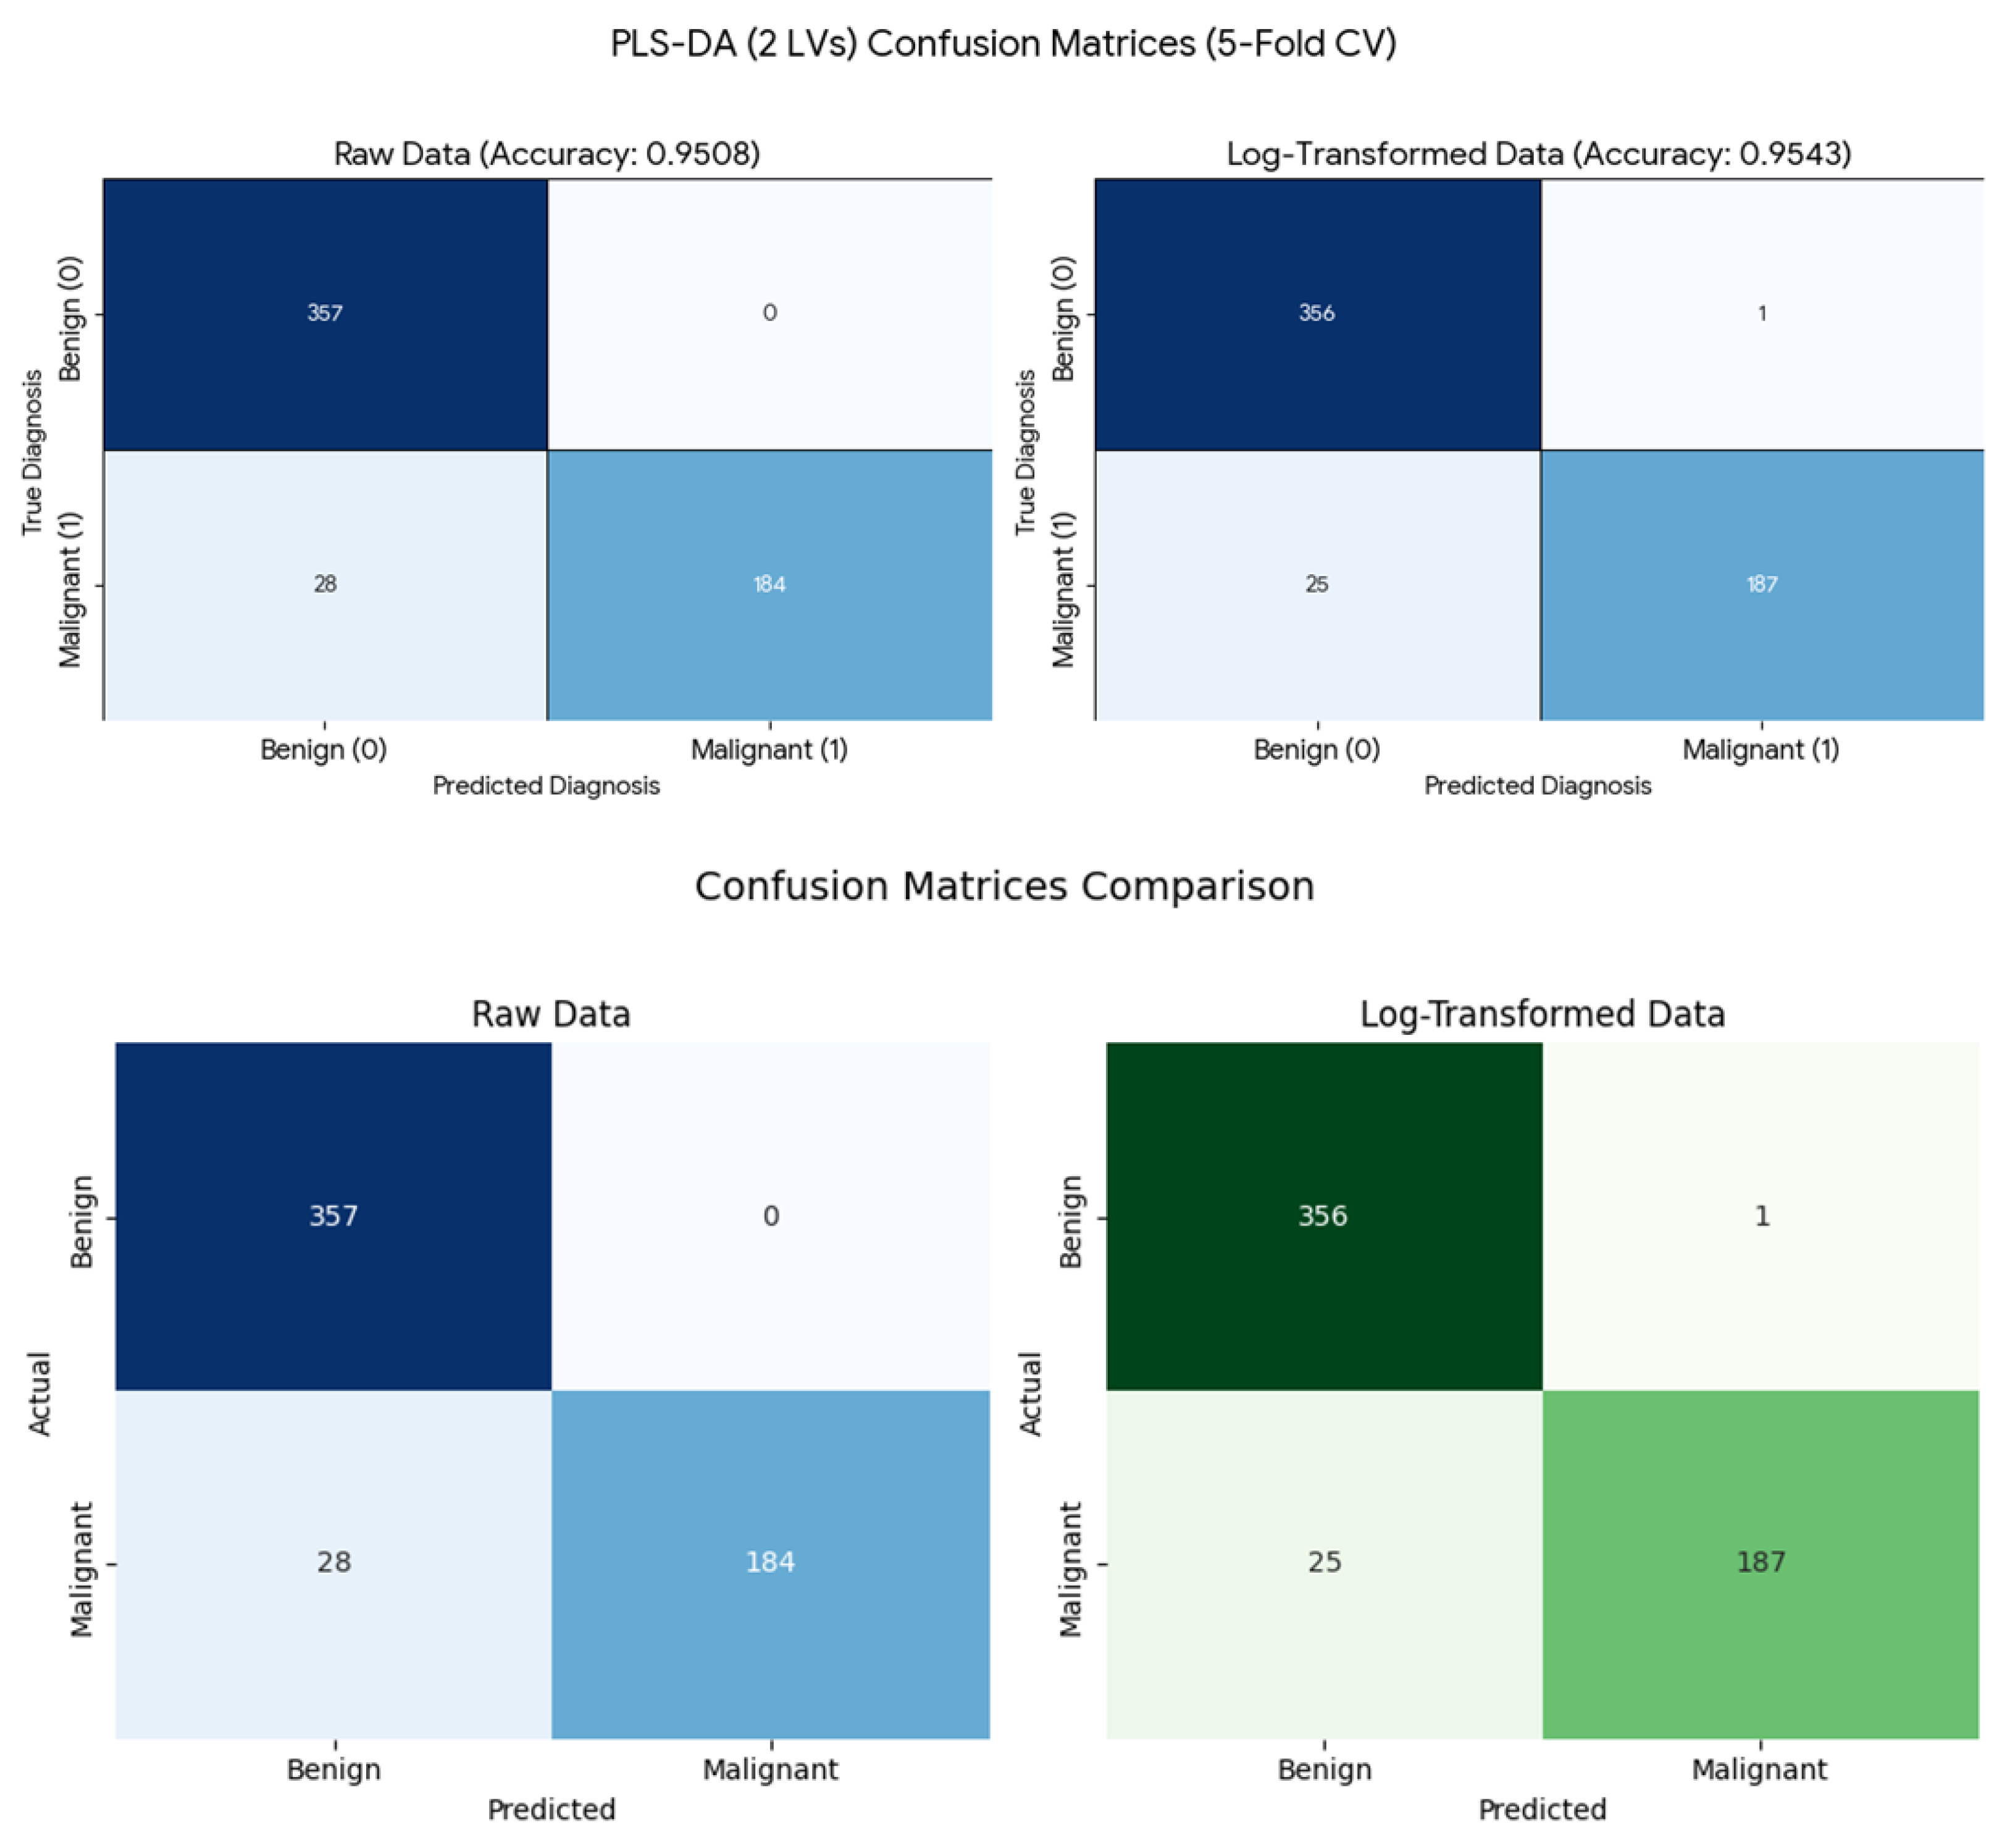
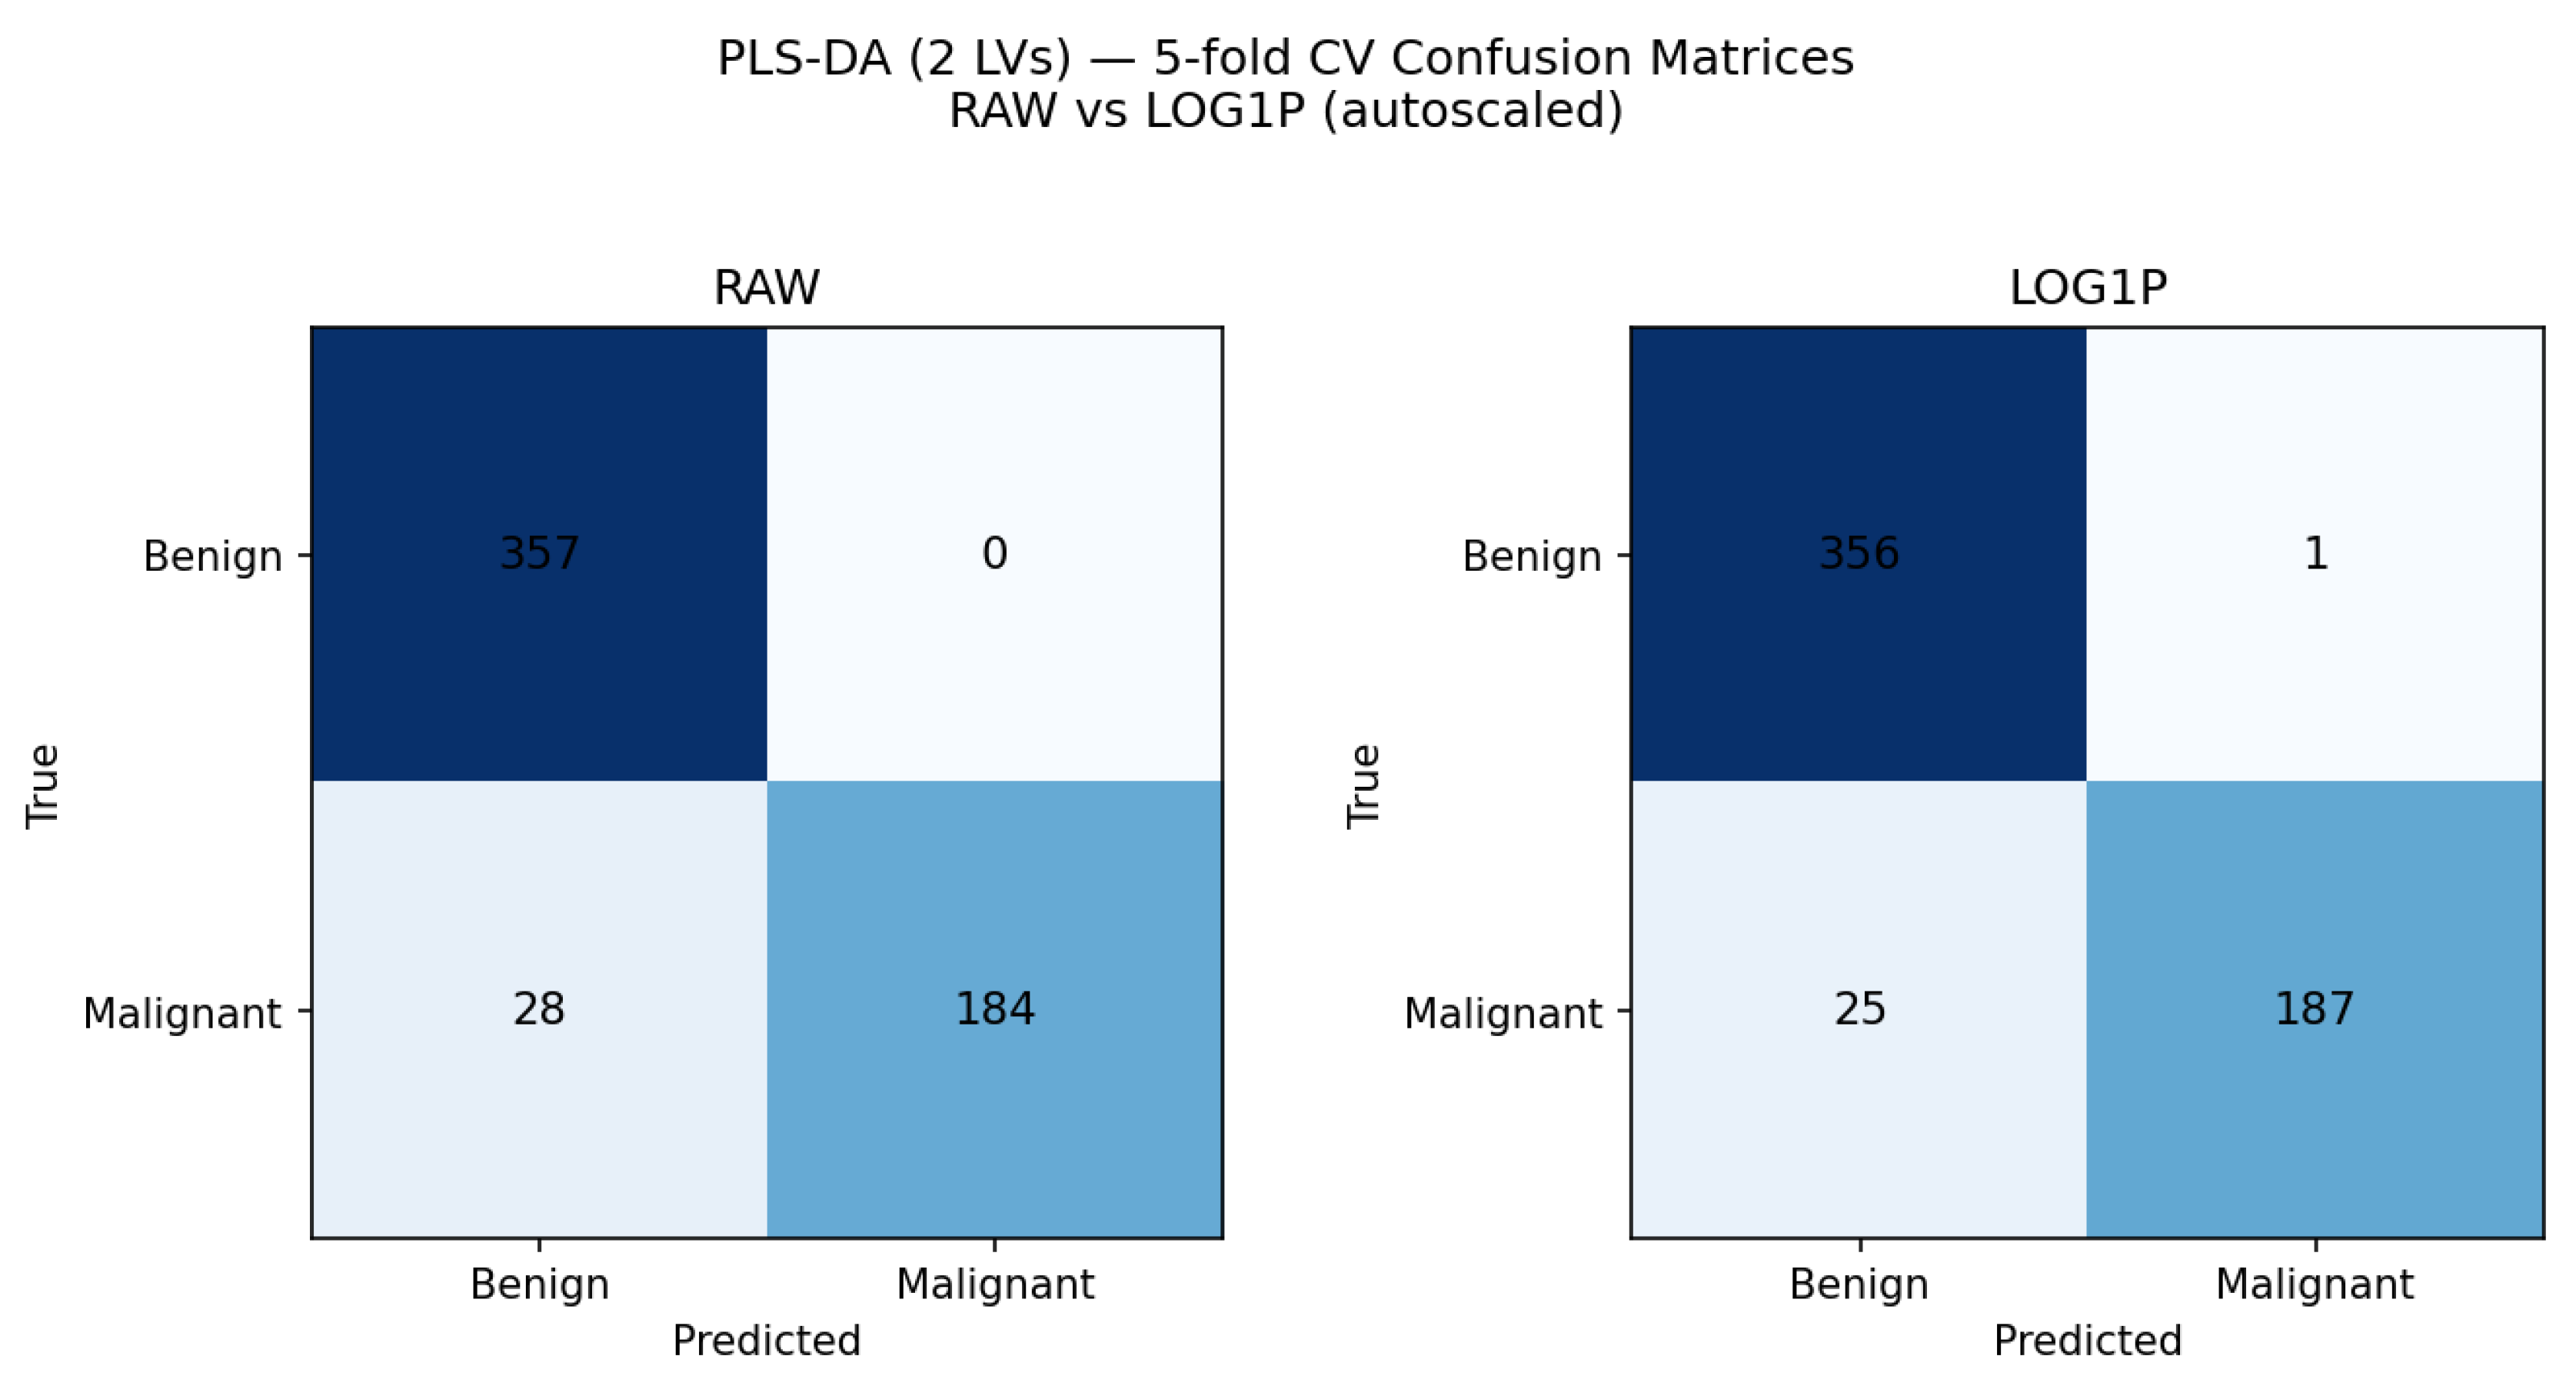
In Q14, students explored the parameters used to evaluate the effectiveness of a PLS-DA model in the context of the Wisconsin Breast Cancer Dataset. In Q15, they compared the performance of models built using two latent variables (LVs) through a confusion matrix (eq. 1), illustrated in
Figure 10. Both models achieved high overall accuracy (>95%), with the log-transformed data showing slightly higher sensitivity for malignant cases (0.882 vs. 0.868). For the raw dataset, there were no false positives (FP = 0) and 28 false negatives (FN = 28), whereas the log-transformed dataset produced one false positive (FP = 1) and 25 false negatives (FN = 25).
The choice of two LV was pragmatic, as it efficiently captures the majority of the variance necessary for class separation while minimizing model complexity for a rapid comparative analysis
Students’ Assessment
Students interacted with LLMs by submitting the prompts listed in
Table 1. Through this process, they gained conceptual understanding of supervised and unsupervised methods, supported by explanations from the instructor and additional clarifications provided by the LLMs.
After the initial guided tasks, students engaged actively by proposing modifications to the workflow. For example, they suggested applying a log transformation to approximate normality, recognizing—based on instructor guidance and LLM feedback—that PCA and PLS-DA assume data to be approximately normally distributed. This demonstrated their ability to connect preprocessing steps with methodological requirements.
Prior to this activity, students had been introduced to Jamovi [
28,
29,
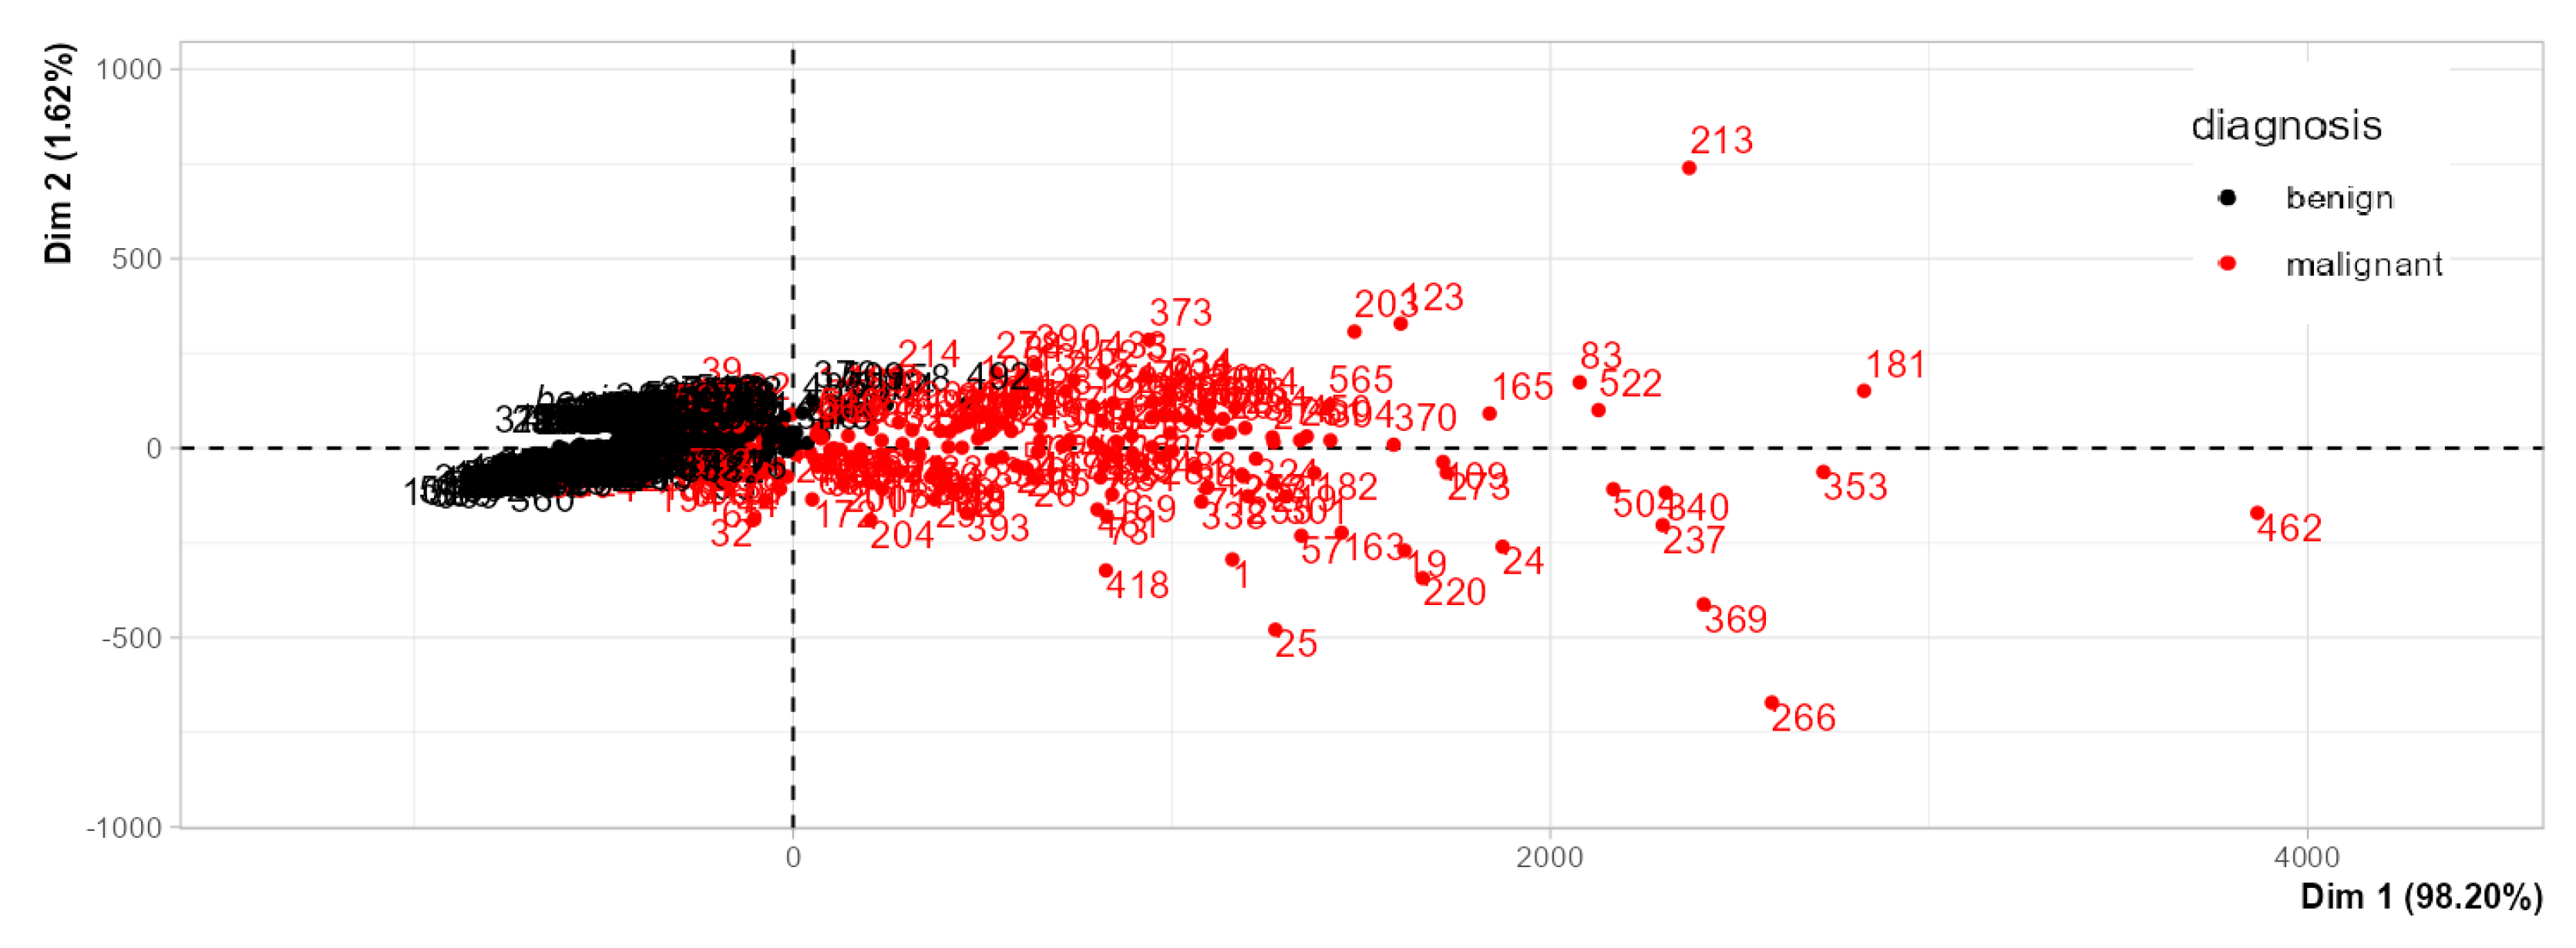
30] and had worked with non-normally distributed datasets. During the LLM-based exercise, they observed that autoscaling is essential for PCA and PLS-DA. When they constructed a PCA score plot without preprocessing (
Figure 11), where just the two variables with larger numerical values accounted for all variance described in PCA. They noted that variables with larger numerical ranges dominated the variance structure, retaining almost all the information (mean area and worst are). Applying autoscaling corrected this imbalance, and log transformation further improved interpretability by reducing skewness and approximating normality. Students concluded that these steps were critical for meaningful multivariate analysis.
Research involving generative AI provides only a momentary view of a rapidly evolving and continuously advancing field. [
42] For example, studies assessing the analytical or problem-solving performance of earlier models such as GPT-3.5 quickly became outdated following the release of GPT-4 and subsequent versions. As an illustration, GPT-3.5 was unable to compute pH values, [
43] whereas GPT-4 successfully performs these calculations. [
44] This highlights a critical challenge: evaluating the performance of generative models resembles aiming at a moving target. As these systems are continuously updated and inherently stochastic—producing slightly different outputs with each run—results from any single study must be interpreted with caution. While such evaluations remain valuable, they require careful experimental design, transparent reporting, and statistical validation to ensure meaningful comparison. [
44,
45] In this case, comparison with a classical software (Jamovi) and other LLM.
It is also important to remain mindful that GenAI tools can sometimes produce inaccurate or “hallucinated” results. [
46,
47] Therefore, a central question guiding this activity was:
Are the results generated by LLMs reproducible and realistic? To address this, students evaluated and verified the answers provided by the models. They tested questions Q1–Q9 (
Table 1) using Jamovi, Gemini, and Copilot, obtaining reproducible outcomes across platforms. Although Jamovi could not generate score plots or confusion matrices for PLS-DA, the numerical and interpretive results provided by both LLMs were consistent, as documented in
Copilot.docx and
Jamovi.docx (Supporting Information). A Jamovi file contains the answers for questions Q1-Q9 was also provided (Jamovi.omv; Supporting Information)
Students demonstrated strong engagement throughout the activity and confirmed that LLMs and Jamovi produced equivalent results—differences appeared only in formatting and presentation style, while the plots themselves were identical. Out of curiosity, students also experimented with the free version of Grok (Grok-4 Fast). Although Grok could not generate graphical outputs, it successfully answered Q1 and Q2, yielding results consistent with those obtained from Jamovi and the other LLMs (Grok.docx; supporting information). Students noted, for example, that maintaining reproducibility in PLS-DA required setting model parameters consistently—specifically, applying autoscaling beforehand and using two latent variables (LVs).
In addition to comparing the figures presented in the manuscript with those provided in the supporting information (Jamovi, Gemini, Grok.docx), we include
Figure 11, which shows the confusion matrices obtained from Gemini (top) and Copilot (bottom). These figures illustrate representative examples of the confusion matrices generated by the students during the class.
Figure 12.
Confusion matrices for the PLS-DA models obtained using the raw data (left) and the log-transformed data (right). The figures in the top row were generated by Gemini, while those in the bottom row were generated by Copilot. In all cases, the data were autoscaled, and the PLS-DA models were constructed using two latent variables (LVs).
Figure 12.
Confusion matrices for the PLS-DA models obtained using the raw data (left) and the log-transformed data (right). The figures in the top row were generated by Gemini, while those in the bottom row were generated by Copilot. In all cases, the data were autoscaled, and the PLS-DA models were constructed using two latent variables (LVs).
Conclusion
This study demonstrates the pedagogical potential of LLMs as interactive tools for teaching chemometrics and data analysis in chemistry education. By employing Microsoft 365 Copilot (GPT-5) and Gemini, students were able to perform complete analytical workflows—including statistical tests, PCA, and PLS-DA—through natural language prompts without requiring any programming experience. The activity highlighted the importance of preprocessing steps such as log transformation and autoscaling, reinforcing core principles of multivariate analysis.
Results obtained from LLMs were reproducible and comparable to those generated by conventional software (Jamovi), confirming the analytical reliability of these generative AI systems. Moreover, the conversational interface fostered engagement, curiosity, and conceptual understanding of supervised and unsupervised learning methods.
Overall, LLMs represent an accessible, low-barrier resource for integrating machine learning into chemistry curricula. Their ability to combine data visualization, statistical reasoning, and critical interpretation within a single platform supports active learning and broadens opportunities for digital literacy in analytical and computational chemistry education.
Supplementary Materials
The following supporting information can be downloaded at: Preprints.org.
Funding
The authors acknowledge financial support and fellowships from the Brazilian agencies FAPESC (Fundação de Amparo a Pesquisa do Estado de Santa Catarina), CNPq (Conselho Nacional de Desenvolvimento Científico e Tecnológico), and CAPES (Coordenação de Aperfeiçoamento de Pessoal de Nível Superior).
Data Availability Statement
The data may be found in the supporting information
Acknowledgments
The authors acknowledge financial support and fellowships from the Brazilian agencies FAPESC (Fundação de Amparo a Pesquisa do Estado de Santa Catarina), CNPq (Conselho Nacional de Desenvolvimento Científico e Tecnológico), and CAPES (Coordenação de Aperfeiçoamento de Pessoal de Nível Superior).
Conflicts of Interest
The authors declare no conflicts of interest
Abbreviations
The following abbreviations are used in this manuscript:
| I |
Artificial Intelligence |
| ATR-FTIR |
Attenuated Total Reflectance – Fourier Transform Infrared Spectroscopy |
| CAPES |
Coordenação de Aperfeiçoamento de Pessoal de Nível Superior |
| CSV |
Comma-Separated Values |
| DOCX |
Microsoft Word Open XML Document |
| FAPESC |
Fundação de Amparo à Pesquisa e Inovação do Estado de Santa Catarina |
| FN |
False Negative |
| FP |
False Positive |
| FURB |
Universidade Regional de Blumenau |
| GPT |
Generative Pre-trained Transformer |
| GUI |
Graphical User Interface |
| JAMOVI |
Jamovi Statistical Software |
| KDE |
Kernel Density Estimate |
| LLMs |
Large Language Models |
| LV |
Latent Variable |
| PC |
Principal Component |
| PCA |
Principal Component Analysis |
| PLS |
Partial Least Squares |
| PLS-DA / PLSDA |
Partial Least Squares – Discriminant Analysis |
| RAW |
Unprocessed (Raw) Dataset |
| SC |
Santa Catarina (Brazil) |
| UCI |
University of California, Irvine (Machine Learning Repository) |
| VIP |
Variable Importance in Projection |
| WBCD / WDBC |
Wisconsin Breast Cancer Dataset / Wisconsin Diagnostic Breast Cancer Dataset |
References
- Sequeira, C.A.; Borges, E.M. Enhancing Statistical Education in Chemistry and STEAM Using JAMOVI. Part 2. Comparing Dependent Groups and Principal Component Analysis (PCA). J Chem Educ 2024, 101, 5040–5049. [Google Scholar] [CrossRef]
- de Souza, R.S.; Sequeira, C.A.; Borges, E.M. Enhancing Statistical Education in Chemistry and STEAM Using JAMOVI. Part 1: Descriptive Statistics and Comparing Independent Groups. J Chem Educ 2024. [CrossRef]
- Sidou, L.F.; Borges, E.M. Teaching Principal Component Analysis Using a Free and Open Source Software Program and Exercises Applying PCA to Real-World Examples. J Chem Educ 2020, 97, 1666–1676. [Google Scholar] [CrossRef]
- Mahjour, B.; McGrath, A.; Outlaw, A.; Zhao, R.; Zhang, C.; Cernak, T. Interactive Python Notebook Modules for Chemoinformatics in Medicinal Chemistry. J Chem Educ 2023, 100, 4895–4902. [Google Scholar] [CrossRef]
- Menke, E.J. Series of Jupyter Notebooks Using Python for an Analytical Chemistry Course. J Chem Educ 2020, 97, 3899–3903. [Google Scholar] [CrossRef]
- Lafuente, D.; Cohen, B.; Fiorini, G.; García, A.A.; Bringas, M.; Morzan, E.; Onna, D. A Gentle Introduction to Machine Learning for Chemists: An Undergraduate Workshop Using Python Notebooks for Visualization, Data Processing, Analysis, and Modeling. J Chem Educ 2021, 98, 2892–2898. [Google Scholar] [CrossRef]
- Wise, B.M. Teaching Chemometrics in Short Course Format. J Chemom 2022, 36, e3399. [Google Scholar] [CrossRef]
- Heras-Domingo, J.; Garay-Ruiz, D. Pythonic Chemistry: The Beginner’s Guide to Digital Chemistry. J Chem Educ 2024, 101, 4883–4891. [Google Scholar] [CrossRef]
- Saldivar-González, F.I.; Prado-Romero, D.L.; Cedillo-González, R.; Chávez-Hernández, A.L.; Avellaneda-Tamayo, J.F.; Gómez-García, A.; Juárez-Rivera, L.; Medina-Franco, J.L. A Spanish Chemoinformatics GitBook for Chemical Data Retrieval and Analysis Using Python Programming. J Chem Educ 2024, 101, 2549–2554. [Google Scholar] [CrossRef]
- Hupp, A.M.; Kovarik, M.L.; McCurry, D.A. Emerging Areas in Undergraduate Analytical Chemistry Education: Microfluidics, Microcontrollers, and Chemometrics. Annual Review of Analytical Chemistry 2024, 17, 197–219. [Google Scholar] [CrossRef] [PubMed]
- Kim, S.-Y.; Jeon, I.; Kang, S.-J. Integrating Data Science and Machine Learning to Chemistry Education: Predicting Classification and Boiling Point of Compounds. J Chem Educ 2024, 101, 1771–1776. [Google Scholar] [CrossRef]
- Hagg, A.; Kirschner, K.N. Open-Source Machine Learning in Computational Chemistry. J Chem Inf Model 2023, 63, 4505–4532. [Google Scholar] [CrossRef]
- Thrall, E.S.; Lee, S.E.; Schrier, J.; Zhao, Y. Machine Learning for Functional Group Identification in Vibrational Spectroscopy: A Pedagogical Lab for Undergraduate Chemistry Students. J Chem Educ 2021, 98, 3269–3276. [Google Scholar] [CrossRef]
- Cahill, S.T.; Young, J.E.B.; Howe, M.; Clark, R.; Worrall, A.F.; Stewart, M.I. Assignment of Regioisomers Using Infrared Spectroscopy: A Python Coding Exercise in Data Processing and Machine Learning. J Chem Educ 2024, 101, 2925–2932. [Google Scholar] [CrossRef]
- Grant St James, A.; Hand, L.; Mills, T.; Song, L.; S. J. Brunt, A.; E. Bergstrom Mann, P.; F. Worrall, A.; I. Stewart, M.; Vallance, C. Exploring Machine Learning in Chemistry through the Classification of Spectra: An Undergraduate Project. J Chem Educ 2023, 100, 1343–1350. [Google Scholar] [CrossRef]
- Amrihesari, M.; Brettmann, B. Introducing Data-Driven Materials Informatics into Undergraduate Courses through a Polymer Science Workshop. J Chem Educ 2025. [Google Scholar] [CrossRef]
- Dumancas, G.G.; Carreto, N.; Generalao, O.; Ke, G.; Bello, G.; Lubguban, A.; Malaluan, R. Chemometrics for Quantitative Determination of Terpenes Using Attenuated Total Reflectance–Fourier Transform Infrared Spectroscopy: A Pedagogical Laboratory Exercise for Undergraduate Instrumental Analysis Students. J Chem Educ 2023. [Google Scholar] [CrossRef]
- Nunes, C.A.; Alvarenga, V.O.; de Souza Sant’Ana, A.; Santos, J.S.; Granato, D. The Use of Statistical Software in Food Science and Technology: Advantages, Limitations and Misuses. Food Research International 2015, 75, 270–280. [Google Scholar] [CrossRef]
- Granato, D.; Santos, J.S.; Escher, G.B.; Ferreira, B.L.; Maggio, R.M. Use of Principal Component Analysis (PCA) and Hierarchical Cluster Analysis (HCA) for Multivariate Association between Bioactive Compounds and Functional Properties in Foods: A Critical Perspective. Trends Food Sci Technol 2018, 72, 83–90. [Google Scholar] [CrossRef]
- Zielinski, A.A.F.; Haminiuk, C.W.I.; Nunes, C.A.; Schnitzler, E.; van Ruth, S.M.; Granato, D. Chemical Composition, Sensory Properties, Provenance, and Bioactivity of Fruit Juices as Assessed by Chemometrics: A Critical Review and Guideline. Compr Rev Food Sci Food Saf 2014, 13, 300–316. [Google Scholar] [CrossRef]
- Lackey, H.E.; Sell, R.L.; Nelson, G.L.; Bryan, T.A.; Lines, A.M.; Bryan, S.A. Practical Guide to Chemometric Analysis of Optical Spectroscopic Data. J Chem Educ 2023, 100, 2608–2626. [Google Scholar] [CrossRef]
- Bro, R.; Smilde, A.K. Principal Component Analysis. Anal. Methods 2014, 6, 2812–2831. [Google Scholar] [CrossRef]
- Yeh, T.-S. Open-Source Visual Programming Software for Introducing Principal Component Analysis to the Analytical Curriculum. J Chem Educ 2025, 102, 1428–1435. [Google Scholar] [CrossRef]
- Hameed Alsaedi, N.R.; Akay, M.F. Effective Breast Cancer Classification Using Deep MLP, Feature-Fused Autoencoder and Weight-Tuned Decision Tree. Applied Sciences 2025, 15, 7213. [Google Scholar] [CrossRef]
- Dubey, A.K.; Gupta, U.; Jain, S. Analysis of K-Means Clustering Approach on the Breast Cancer Wisconsin Dataset. Int J Comput Assist Radiol Surg 2016, 11, 2033–2047. [Google Scholar] [CrossRef]
- Gurcan, F.; Soylu, A. Learning from Imbalanced Data: Integration of Advanced Resampling Techniques and Machine Learning Models for Enhanced Cancer Diagnosis and Prognosis. Cancers (Basel) 2024, 16, 3417. [Google Scholar] [CrossRef]
- Hameed Alsaedi, N.R.; Akay, M.F. Effective Breast Cancer Classification Using Deep MLP, Feature-Fused Autoencoder and Weight-Tuned Decision Tree. Applied Sciences 2025, 15, 7213. [Google Scholar] [CrossRef]
- Sequeira, C.A.; de Souza Júnior, R.S.; Borges, E.M. A STEAM-Based Laboratory Approach: Evaluating Vitamin C Content with Multiple Titration and Statistical Methods. J Chem Educ 2025, 102, 3018–3026. [Google Scholar] [CrossRef]
- Malschitzky, M.E.T.; Sequeira, C.A.; Borges, E.M. Innovative 96-Well Plate Imaging for Quantifying Hydrogen Peroxide in Cow’s Milk: A Practical Teaching Tool for Analytical Chemistry. J Chem Educ 2025, 102, 1651–1661. [Google Scholar] [CrossRef]
- Deucher, N.C.; Silva de Souza, R.; Borges, E.M. Teaching Precipitation Titration Methods: A Statistical Comparison of Mohr, Fajans, and Volhard Techniques. J Chem Educ 2025, 102, 364–371. [Google Scholar] [CrossRef]
- Borges, E.M. Hypothesis Tests and Exploratory Analysis Using R Commander and Factoshiny. J Chem Educ 2023, 100, 267–278. [Google Scholar] [CrossRef]
- Marcel Borges, E. Data Visualization Using Boxplots: Comparison of Metalloid, Metal, and Nonmetal Chemical and Physical Properties. J Chem Educ 2023, 100, 2809–2817. [Google Scholar] [CrossRef]
- Chiarelli, J.; St. Hilaire, M.A.; Baldock, B.L.; Franco, J.; Theberge, S.; Fernandez, A.L. Calculating the Precision of Student-Generated Datasets Using RStudio. J Chem Educ 2025, 102, 909–916. [CrossRef]
- Ferreira, J.E. V.; Miranda, R.M.; Figueiredo, A.F.; Barbosa, J.P.; Brasil, E.M. Box-and-Whisker Plots Applied to Food Chemistry. J Chem Educ 2016, 93, 2026–2032. [Google Scholar] [CrossRef]
- Pérez-Arribas, L.V.; León-González, M.E.; Rosales-Conrado, N. Learning Principal Component Analysis by Using Data from Air Quality Networks. J Chem Educ 2017, 94, 458–464. [Google Scholar] [CrossRef]
- Xu, L.; Bai, Z.; Li, H.; Chen, D.D.Y. Instrumental Analysis Experiment: Direct Surface Analysis of Personal Protective Equipment. J Chem Educ 2025, 102, 1258–1266. [Google Scholar] [CrossRef]
- Pereira de Quental, A.G.; Firmino do Nascimento, A.L.; de Lelis Medeiros de Morais, C.; de Oliveira Neves, A.C.; Seixas das Neves, L.; Gomes de Lima, K.M. Periodic Table’s Properties Using Unsupervised Chemometric Methods: Undergraduate Analytical Chemistry Laboratory Exercise. J Chem Educ 2025, 102, 1237–1244. [Google Scholar] [CrossRef]
- Shao, L. Teaching Principal Component Analysis in the Course of Analytical Chemistry: A Q&A Based Heuristic Approach. J Chem Educ 2025, 102, 155–163. [Google Scholar] [CrossRef]
- Zeng, L.; Huang, M.; Shi, C.; Wang, C.; Zhang, J.; Peng, Y.; Zheng, Y.; Wang, S.; Hong, J.; Gao, Y.; et al. Transgenerational Aging Induced by Tris(1,3-Dichloro-2-Propyl)Phosphate via Disruption of Lipid Homeostasis and Mitochondrial Function. Environ Sci Technol Lett 2025. [Google Scholar] [CrossRef]
- Ben, S.; Zheng, Q.; Zhao, Y.; Xia, J.; Mu, W.; Yao, M.; Yan, B.; Jiang, Q. Tear Fluid-Based Metabolomics Profiling in Chronic Dacryocystitis Patients. J Proteome Res 2025, 24, 224–233. [Google Scholar] [CrossRef]
- Van, Q.N.; Issaq, H.J.; Jiang, Q.; Li, Q.; Muschik, G.M.; Waybright, T.J.; Lou, H.; Dean, M.; Uitto, J.; Veenstra, T.D. Comparison of 1D and 2D NMR Spectroscopy for Metabolic Profiling. J Proteome Res 2008, 7, 630–639. [Google Scholar] [CrossRef]
- Yuriev, E.; Orgill, M.; Holme, T. Generative AI in Chemistry Education: Current Progress, Pedagogical Values, and the Challenge of Rapid Evolution. J Chem Educ 2025, 102, 3773–3776. [Google Scholar] [CrossRef]
- Clark, T.M.; Anderson, E.; Dickson-Karn, N.M.; Soltanirad, C.; Tafini, N. Comparing the Performance of College Chemistry Students with ChatGPT for Calculations Involving Acids and Bases. J Chem Educ 2023, 100, 3934–3944. [Google Scholar] [CrossRef]
- Schrier, J. Comment on “Comparing the Performance of College Chemistry Students with ChatGPT for Calculations Involving Acids and Bases. ” J Chem Educ 2024, 101, 1782–1784. [Google Scholar] [CrossRef]
- Mirza, A.; Alampara, N.; Kunchapu, S.; Ríos-García, M.; Emoekabu, B.; Krishnan, A.; Gupta, T.; Schilling-Wilhelmi, M.; Okereke, M.; Aneesh, A.; et al. A Framework for Evaluating the Chemical Knowledge and Reasoning Abilities of Large Language Models against the Expertise of Chemists. Nat Chem 2025, 17, 1027–1034. [Google Scholar] [CrossRef] [PubMed]
- Sigot, M.; Tassoti, S. An Investigation of Change in Prompting Strategies in a Semester-Long Course on the Use of GenAI. J Chem Educ 2025, 102, 2507–2513. [Google Scholar] [CrossRef]
- Young, J.D.; Dawood, L.; Lewis, S.E. Chemistry Students’ Artificial Intelligence Literacy through Their Critical Reflections of Chatbot Responses. J Chem Educ 2024, 101, 2466–2474. [Google Scholar] [CrossRef]
Figure 1.
Distribution of mean fractal dimension, symmetry error, and worst perimeter in breast cancer cases, stratified by diagnosis (Malignant vs. Benign). Histograms with overlaid KDE curves illustrate differences in feature distributions between the two diagnostic groups.
Figure 1.
Distribution of mean fractal dimension, symmetry error, and worst perimeter in breast cancer cases, stratified by diagnosis (Malignant vs. Benign). Histograms with overlaid KDE curves illustrate differences in feature distributions between the two diagnostic groups.
Figure 2.
Log-transformed distributions of mean fractal dimension, symmetry error, and worst perimeter for malignant (red) and benign (green) breast tumors. Histograms show density estimates with overlaid KDE curves, highlighting differences in scale and spread after log10 transformation.
Figure 2.
Log-transformed distributions of mean fractal dimension, symmetry error, and worst perimeter for malignant (red) and benign (green) breast tumors. Histograms show density estimates with overlaid KDE curves, highlighting differences in scale and spread after log10 transformation.
Figure 3.
The box plots comparing Mean Fractal Dimension, Symmetry Error, and Worst Perimeter, stratified by Diagnosis (Benign vs. Malignant). Figure build using Copilot.
Figure 3.
The box plots comparing Mean Fractal Dimension, Symmetry Error, and Worst Perimeter, stratified by Diagnosis (Benign vs. Malignant). Figure build using Copilot.
Figure 4.
log-transformed box plots comparing the three requested features—mean fractal dimension, symmetry error, and worst perimeter—stratified by Diagnosis (Benign vs. Malignant). I.
Figure 4.
log-transformed box plots comparing the three requested features—mean fractal dimension, symmetry error, and worst perimeter—stratified by Diagnosis (Benign vs. Malignant). I.
Figure 5.
PCA score plot of the Wisconsin Breast Cancer dataset showing the first two principal components (PC1 and PC2). Benign samples (green) and malignant samples (red). The shaded ellipses represent the 95% confidence regions for each class.
Figure 5.
PCA score plot of the Wisconsin Breast Cancer dataset showing the first two principal components (PC1 and PC2). Benign samples (green) and malignant samples (red). The shaded ellipses represent the 95% confidence regions for each class.
Figure 6.
PCA Loading Plot (PC1 vs PC2) for the Wisconsin Diagnostic Breast Cancer dataset. Arrows represent variable contributions to the first two principal components.
Figure 6.
PCA Loading Plot (PC1 vs PC2) for the Wisconsin Diagnostic Breast Cancer dataset. Arrows represent variable contributions to the first two principal components.
Figure 7.
PC1 vs PC2 scores from PCA on the log10-transformed and autoscaled numeric features of the Wisconsin Breast Cancer dataset. Each point is a tumor sample, colored by diagnosis (green = Benign, red = Malignant).
Figure 7.
PC1 vs PC2 scores from PCA on the log10-transformed and autoscaled numeric features of the Wisconsin Breast Cancer dataset. Each point is a tumor sample, colored by diagnosis (green = Benign, red = Malignant).
Figure 8.
PLS-DA score plots comparing raw and log-transformed predictor sets after autoscaling. Each point represents a sample projected onto the first two latent variables (LV1 and LV2). Colors indicate diagnosis (red = malignant, green = benign).
Figure 8.
PLS-DA score plots comparing raw and log-transformed predictor sets after autoscaling. Each point represents a sample projected onto the first two latent variables (LV1 and LV2). Colors indicate diagnosis (red = malignant, green = benign).
Figure 9.
PLS-DA VIP–loading comparison for RAW vs LOG1P pipelines (autoscaled). Horizontal bars show variable importance in projection (VIP) for the top 20 features ranked by mean VIP across models (blue = RAW; green = LOG1P).
Figure 9.
PLS-DA VIP–loading comparison for RAW vs LOG1P pipelines (autoscaled). Horizontal bars show variable importance in projection (VIP) for the top 20 features ranked by mean VIP across models (blue = RAW; green = LOG1P).
Figure 10.
Confusion matrices and performance comparison for PLS-DA models (2 latent variables) using 5-fold cross-validation.
Figure 10.
Confusion matrices and performance comparison for PLS-DA models (2 latent variables) using 5-fold cross-validation.
Figure 11.
PCA score plot obtained using Jamovi without applying any data preprocessing.
Figure 11.
PCA score plot obtained using Jamovi without applying any data preprocessing.
Table 1.
Comprehensive Data Analysis Plan for the Wisconsin Breast Cancer Dataset.
Table 1.
Comprehensive Data Analysis Plan for the Wisconsin Breast Cancer Dataset.
| Number |
Content |
Questions |
| 1. |
Data normality checking |
Perform a normality test for each variable and report the results |
| 2. |
Hypothesis tests |
Compare all variables between Malignant and Benign groups using appropriate statistical tests. |
| 3. |
Histograms |
Generate grouped histograms comparing the mean fractal dimension, symmetry error, and worst perimeter, stratified by diagnosis (Malignant vs. Benign). show (KDE) curves |
| 4. |
Histograms |
Apply log transformations and generate grouped histograms comparing the mean fractal dimension, symmetry error, and worst perimeter, stratified by diagnosis (Malignant vs. Benign). show (KDE) curves |
| 5. |
Box plots |
Generate box plots comparing the mean fractal dimension, symmetry error, and worst perimeter, stratified by diagnosis (Malignant vs. Benign). |
| 6. |
Box plots |
Apply log transformations and generate box plots comparing the mean fractal dimension, symmetry error, and worst perimeter, stratified by diagnosis (Malignant vs. Benign). |
| 7. |
PCA |
Build the PCA score plot for the raw data, ensure data scaling |
| 8. |
PCA |
Build the PCA score plot |
| 9. |
PCA |
Build the PCA score plot for log transformed data |
| 10. |
PCA |
In this case, what are the main differences observed between the PCA results obtained using the raw data and those obtained using the log-transformed data? |
| 11. |
PLS-DA |
Perform PLS-DA on both the raw and log-transformed datasets, ensuring autoscaling (mean-centering and unit variance scaling) is applied before model construction, and visualize the resulting score plots. |
| 12. |
PLS-DA |
Compare the PLS-DA score plots obtained from the raw and log-transformed datasets, with autoscaling applied to each prior to analysis. |
| 13. |
PLS-DA |
Construct VIP score plots for the PLS-DA models derived from both the raw and log-transformed datasets. Autoscaling (mean-centering and unit variance scaling) should be applied before model construction to ensure comparability, and the resulting variable importance profiles should be visualized. |
| 14. |
PLS-DA |
Explain the concepts of True Positive (TP), True Negative (TN), False Positive (FP), False Negative (FN), Accuracy, Sensitivity, Specificity, and Precision in the context of the Wisconsin Breast Cancer Dataset. |
| 15. |
PLS-DA |
Construct the confusion matrix using 5-fold cross-validation for both the raw and log-transformed datasets, employing two latent variables (LVs) in each PLS-DA model. Compare the classification performance between the two preprocessing approaches. |
|
Disclaimer/Publisher’s Note: The statements, opinions and data contained in all publications are solely those of the individual author(s) and contributor(s) and not of MDPI and/or the editor(s). MDPI and/or the editor(s) disclaim responsibility for any injury to people or property resulting from any ideas, methods, instructions or products referred to in the content. |
© 2025 by the authors. Licensee MDPI, Basel, Switzerland. This article is an open access article distributed under the terms and conditions of the Creative Commons Attribution (CC BY) license (http://creativecommons.org/licenses/by/4.0/).