
Submitted:
06 August 2024
Posted:
07 August 2024
You are already at the latest version
Abstract
Statistics modules are included in most university degrees, independent of the degree area. They have an important role in preparing students for the real world. The overall goal of this paper is to identify the common statistical issues students face during the transition from secondary education to tertiary education. Drawing upon data from the University College Dublin (UCD) Math Support Center (MSC) and Universidad Rey Juan Carlos (URJC), our approach aims to optimize learning experiences while advancing sustainability objectives. In this paper, we conducted a categorization of statistical concepts taught in university (based on URJC). Using this categorization, UCD MSC tutor comments were categorized and validated, and subsequently descriptive analyses and text mining were used on the UCD MSC comments to achieve a deeper understanding of the statistical issues. Building on this study, we plan to develop a suite of evidence-based sustainable educational applications and games to support undergraduate students internationally in first-and second-year statistical modules. Our findings on students’ main statistical issues contribute to the cultivation of lasting statistical literacy among students. This research advances the sustainability agenda within statistical education.
Keywords:
mathematics and statistics support
; higher education
; text mining
; international networking
; resource optimization
; quality education
1. Introduction
The development of an information society, the growth of technology and the need to face, interpretate and analyze information from different sources, makes knowledge of statistics essential in making and communicating decisions, both in private life and professionally [1]. This knowledge of statistics, which may be referred to as the concept of “statistical literacy”, refers to the minimum statistics knowledge required to understand the world [1]. One of the pillars of acquiring “statistical literacy” is education, and therefore, statistics as a subject is present in the majority of university degrees independent of the degree area or discipline. Based on one of the main goals of third-level education, which is to prepare individuals to be able to face the real world, statistical education should focus in the first instance on enriching the base of statistical knowledge and continue promoting its growth through reasoning and statistical thinking and then converting that competence into knowledge that can be put into practice in real-life situations [2].
However, it has been identified that statistics is poorly taught in formal education teaching [3]. Some of the problems detected are that the basic statistical concepts are not understood; integration of statistics as a subject in school is not yet a fact (in certain countries); in order to go through statistics inference, teachers may need to speed up previous explanations, and; also, students have short and restricted time to assimilate the concepts [4]. Other issues highlighted by research include that statistical concepts are treated in isolation without considering the relationship that must be established between them, or the relationship of the statistics concepts with those of other subjects. This manifests itself as situations in the classroom may not sufficiently relate to the professional profile of the students or are not related to real-life experiences [5,6,7].
The lack of accurate knowledge in statistics by students of Social Sciences, Sciences of Behavior or Education, among others, is a recurring topic faced by lecturers and researchers for at least thirty years [2]. Additionally, not only are there theorical issues but also negative emotional reactions, attitudes and beliefs have been reported towards statistics by some students with little interest in the area [8]. Behar y Grima [9] stated that, when talking about the problems in teaching statistics, the following should be considered: high levels of anxiety in students who face this subject, negative attitudes towards it, the content of the course (excessively focused on probability and mathematics), lack of motivation in students, frustration by some teachers for not seeing results from their efforts and the influence of the technology on the teaching methods. Subsequently, statistics teaching has become a broad field of research and development [10]. Furthermore, Estrella [11] states that this emerging field provides results on how statistics can be taught in the school classrooms, and extending this to higher levels such as university, in order to promote functional, deep and sustainable learning. An educator may improve the effectiveness of the teaching-learning process by adapting the content and material used in the classroom. In this context, the negative attitude of the student facing statistics and the adaption of the teaching-learning process, require the identification of what are the main statistical issues faced by students, e.g., meaning of statistics, goal of statistics, basic concepts, statistic formulas, probability, etc.
In this study, in order to identify students’ statistical issues, a sustainable approach is taken whereby data is drawn from two international universities (University College Dublin (UCD) in Ireland and University Rey Juan Carlos (URJC) from Spain). These universities involve differences in cultures, in the ways of facing education, and in general, different point of views related to statistics and University education. UCD is one of Europe’s leading research-intensive universities where undergraduate education, masters and Phd training, research, innovation and community engagement form a dynamic spectrum of activity. UCD is also Ireland’s most globally engaged university with over 38,000 students drawn from 152 countries, including over 5,000 students based at locations outside of Ireland. The UCD data is sourced from the UCD Maths Support Centre (MSC). This opened in 2004 and is a free tutoring support service for all UCD students studying a mathematics or statistics related modules. University Rey Juan Carlos (URJC) is the second-biggest public university in the community of Madrid. It offers a wide range of degrees including 88 Bachelor’s degrees, 9 English-degrees, 9 Bachelor’s degrees online and 75 dual degrees, as well as a wide range of official master’s degrees and Phd programs. Bachelor’s degrees are organized in five knowledge areas (Social Sciences and Law, Sciences, Health Sciences, Engineering and Architecture and Art & Humanities) with statistics modules present across the five areas. Ottaviani [12] suggests that statistics research cannot be done in isolation and interdisciplinary work needs to be applied, with this being even more beneficial if it is cross border and creates international community. This international approach of examining statistical issues across international borders gives us an added value in time, in money and in effort for future international initiatives, and this collaboration constitutes a pillar for the beginning of a stronger networking between the countries. In financial terms, this collaboration will enhance internal resources’ movement from one country to another. From a tech perspective, this collaboration will improve international cooperation and increase knowledge exchange, including promoting the development of new educational technologies.
To identify what are the statistical topics taught in the entry levels of University, and for international appeal, in this study we analyzed the statistical topics taught across the URJC curriculum and created URJC categories of statistical concepts. In order to identify what are the main statistics problems for students in the transition between secondary level and third level, we have collected, used and analyzed data from the students who have visited the UCD MSC - a free tutoring service for UCD students. When a tutor finishes a session with a student, the tutor records the main statistical topics taught from a drop-down menu (UCD MSC categories of statistics concepts), and they also record an open-text comment on the issues/areas that the student struggled with. This categorization process in the UCD Math Support is a manual activity completed by tutors. The categorization for statistical issues has not been validated before, and therefore, it could have errors. For example, tutors may not have enough information about the student problem to identify the category, categories are subjective as tutors may consider different categories for the same student issue, and tutors may be under time pressure and select a random category. Also, there is a standard category called Other and it may be used in cases where the tutor does not know what category to assign the issue to. We manually categorized the open-text comments according to the defined URJC categories and then conducted a comment-specific evaluation of the statistical challenges to determine which issues are common across multiple modules/Universities (UCD and URJC). We have conducted a sustainable descriptive analysis to identify statistical topics students struggle with internationally. Additionally, we have applied eco-friendly text mining to the open-ended tutor comments to identify the statistical topics that students struggle with. Building on this study, we plan to develop a suite of sustainable educational applications and games to support undergraduate students in first-and second-year statistical modules. This analysis will contribute to the cultivation of lasting statistical literacy among students. Combining the structure of the MSC data and the URJC categories, we address the following research questions:
- 1)
- What are the recurring statistical issues posing challenges to students?
- 2)
- What are the similarities between UCD MSC categories and URJC categories?
- 3)
- How can text mining extract insights from open-text responses to uncover specific statistical difficulties?
2. Materials and Methods
In this section we go through the methodology used to develop the URJC categories, explain how the UCD MSC works and how its data are collected, how the MSC tutor comments were classified under the URJC categories, and the techniques applied to analyze the data.
2.1. Methodology for Categorization of URJC Modules
With the goal of categorization of statistical issues, before working with the UCD Math Support Centre data, every statistics module description webpage for every degree taught in the URJC were collected and reviewed. Next the statistics concepts were extracted and analyzed in order to create the URJC categories of statistical issues. Our methodology to create the categories is composed of the following steps:
-
Accessed the URJC website and identified every School:
- Social Sciences and Law
- Sciences
- Health Sciences
- Engineering and Architecture
- Art & Humanities
- Identified every degree inside every School in which a statistics module is taught.
- Downloaded every module webpage for every statistics module and identified the statistical Lessons for each module.
- Summarized, compared and matched the statistical Lessons across the modules.
- Checked what Lessons were consistent across different modules and identified what are the main Lessons that statistic covers.
- Created a description for each Lesson.
From this review process, we define three Topics and five Lessons (see Table 1). These will be referred to as the URJC categories and represent the main categorization used in this study.
2.2. Description of UCD MSC data
The main data set for this study is the data from UCD students who have accessed the UCD MSC since 2015/16 for statistics support and have consented for their data to be used for research purposes. The ethics application was approved by the UCD Office of Research Ethics. Between January 2015 and September 2023, there have been approximately 32,000 visits to the MSC. The MSC provides support for various mathematics related subjects (e.g., mathematics, applied and computational mathematics, physics, and economics), and statistics visitors are the second largest cohort of visitors.
The UCD MSC uses a session management system to electronically record details of a student’s visit to the MSC, for example, date of visit and module code that the student is visiting in reference to. Using the system, each MSC tutor can categorize the student’s presenting issue from a drop-down list and record an open-text response for the session. In the open-text response, tutors are asked to identify the mathematical problem the student requested help with and describe how they helped the student. In addition, since CoVid-19, students can provide an open-text response describing the issue they are requesting help with when booking a MSC session (if they choose to book an appointment rather than drop into the MSC without booking). The following video link shows how the UCD MSC system works and how a student takes part in it: https://youtu.be/pbswG50OuCs.
For each MSC visit for statistics support, the following data were provided (see Table 2 for examples):
1) Code: the module code that the student sought help for,
2) Name and Description: the presenting issue as categorized by the tutor for the session,
3) Time: time stamp of student’s entry to the MSC,
4) Comment: the tutor’s open-text response outlining the statistical issue that the student needed help with and how they helped the student, or, in some cases it could also include an open-text response by the student describing the statistical issue they are requesting help with. Students’ comments are indicated by quotation marks, for example, Student Query: “sampling distributions”.
2.3. Classification of Tutor Comments in the UCD MSC Data
The data for the UCD MSC consisted of 3,570 data entries collected from student visits to the MSC from January 2015 to September 2023. A key feature of the data are the tutors’ comments (see Comment variable in Table 2) because these provide a rich source of information on statistical issues. As Topics and Lessons were already defined, the next step was to match the tutor comments with the Lessons. This was a manually process which started with a sample of 49 unique comments for which the first author and third author analyzed separately according to the URJC categories. After that, the categorization between the authors was cross tabulated in order to validate it. There was a high percentage of similarities in the comparison, with the same result in 48 out of 49 comments in total (an agreement of 95%). Disagreements were discussed and classifications agreed upon. Subsequently, the first author and third author continued doing the manual coding, with the first author manually coding the majority of cases. As coding of the comments progressed, and through discussions between the authors, it became clear that additional Topics and Lessons beyond the initial five Lessons were needed. Therefore, more Lessons were added. The first new category was “High Level”; this was added because of comments related to Topics which were not considered related to introductory or service level statistics. The second new Lesson related to Statistics Software problems because there were many students with problems in software. Last but not least, was a new category called Other. This was for students whose problems were not related with statistics or there was not enough information to determine Lesson categorization. Categorization of the comments were examined a second time by the first author to ensure consistency.
Once the initial categorization of the UCD MSC tutors’ comments based on the URJC classification was completed, several issues were identified. Students whose comments matched with two or more Lessons (n=73) were split into as many Lessons as they had matched. This strategy is based on the main goal of the paper: to identify the statistical issues that students present with as opposed to the number of students visits with statistical issues. An important consideration here is that the data set does not include any identifying features, i.e., student name and number, and students can go into the UCD MSC once, twice or many more times. As a result, the same student could have multiple entries in the data set, so we consider data entries (visits) instead of the number of students. The strategy mentioned above converted n=3,570 data entries to n=3,674 (n being the number of statistical issues).
Another pre-processing task was to add two news categories:
- Module II: for those students who have issues in Lesson 3 and Lesson 4.
- Module I & Module II & Module III: for those students who have issues in all Lessons.
The final URJC categorization is shown in Table 3.
2.4. Statistical Analysis
Once data were collected and Lessons were defined, the next step was to identify statistical issues or Topics that students struggle with. With that goal, data analyses was composed of several data treatments: data wrangling, descriptive analytics, and text mining. RQ1 and RQ2 were addressed using data wrangling, descriptive statistics and graphical analysis. To achieve it, the R ggplot2 package [13] and the R tidyverse package [14] were used.RQ3 was addressed through analyzing the open-response text comments using Natural Language Processing (NLP). Within NPL, word clouds have become one of the most common approaches to analyze text or what is known as text mining. Word clouds are a method to quickly show visualizations of the most common terms based on the frequency of their appearance in the text. Before implementing word clouds, it is necessary to conduct text cleaning and preprocessing. This consisted of using tm package in R [15] to remove prepositions, special characters, numbers, whitespace, convert all the words to lowercase, remove punctuation and remove words that do not give value to this analysis (empty words). The final step before creating the word clouds is to convert the text into a database which allows us to calculate the frequencies of any word in the text.
3. Results
3.1. RQ1: Lesson Data Descriptive Analysis
After the data pre-processing, the next step is to respond to the first research question (RQ1) concerning what Lessons student are struggling with. To achieve this, we conducted an eco-conscious analysis of the Topic categories to identify the recurring statistical themes that pose challenges to students. By applying descriptive statistics to the frequency of these categories, we determined which Lessons present most difficulties for students (see Figure 1).
Figure 1 shows that the largest number of issues are concentrated in Lesson 5: Statistic Inference (n=709) and Lesson 4: Random Variables (n = 609), and the lowest number of issues are in Lesson 6: Statistic Software (n=96). Following the sequential ordering of the Lessons, we can see that the difficulty level goes from the basic to the more advanced level (or complex). In this analysis, the difference between Lesson 1 to Lesson 2 to Lesson 3 does not present as big jumps between each other, but the transition between Lesson 3 to Lesson 4 presents the biggest difference (n= 254). Interestingly, as the level increases, the jumps between the Lessons are also increasing. It is important to consider the numbers of students with issues in Lesson 3 & 4, all of them face problems in Topic II: Probability. If we include them in Lesson 3 and Lesson 4, we increase the number of issues from n=355 to n=459 in Lesson 3 and from n=609 to n=713 in Lesson 4. In that case, it means a big jump in the number of statistical issues from Lesson 2 to Lesson 3 as well, and also, Lesson 4 becomes the main challenge for students. Lesson 6 can be viewed as a subset of the rest of the Lessons because statistics software can be used to implement the statistical methods in any Lesson, so Lesson 6 is not directly related to a level of difficulty.
In our analysis, we focus on the categories related to numbered Lessons. The Other category does not provide information about students’ statistical issues, and High Level is not in our level scope so both are not considered for this research question analysis. Therefore, Figure 2 provides an overview of the proportions only for the Lessons’ categories (without “Other” and “Higher Level”). The percentage of each Lesson in relation to the total is represented to help provide an overview of the proportions. Considering this, we can recognize important statistical issues in Lesson 4 (25.1%) and Lesson 5 (29.2%), and if we merge both of these proportions, it would represent more than half of the statistical issues of our sample.
3.2. RQ2: Similarities between UCD MSC Categories and URJC Categories
Once the URJC categorization was completed, this could be validated by comparing the categorization with the categories (see Name and Description in Table 2) that tutors from UCD made for the same comments (henceforth known as UCD MSC categories). Initial analysis involved analyzing what are the UCD MSC categories and how many times each of them appears. There are 77 categories in total, however, many of them appear only once, for example “Complex Numbers, Vectors and Indices”. Consequently, we consider that the categories which appear less than six times do not have relevance for this validation analysis. Therefore, these categories were deleted, and we have a new subset with 37 categories.
With this preprocessing in UCD MSC categories, there are 9 categories in URJC and in UCD, there are 37 categories so it could witness inconsistency owing to the differences in the number of categories. In fact, the UCD MSC categorization process has not been validated before and it could have errors (see Section 1). The next step undertaken was to merge different UCD MSC categories which could be refer to the same problem (Table 3).

Table 4.
Table to show New Categories after merging UCD Categories.
| New Merged Category | UCD Categories | N | Merged N |
|---|---|---|---|
| Other | Other | 403 | 1184 |
| Other (please specify topic) | 665 | ||
| Word Problem | 79 | ||
| Student working alone for now | 21 | ||
| Other (please specify topic): | 17 | ||
| Basic Statistics | Basic Statistics | 843 | |
| Standard deviation or variance | 44 | 902 | |
| Graphs (reading, sketching & interpreting) | 15 | ||
| Basic Probability | Basic Probability | 196 | 263 |
| Basics of Probability theory | 67 | ||
| Random Vectors & Distributions | Continuous distributions (normal, exponential, uniform) | 167 | 325 |
| Discrete distributions (binomial, poisson, hypergeometric) | 82 | ||
| Random Vectors | 29 | ||
| Continuous Probability Distributions: | 19 | ||
| Properties of Random Samples | 16 | ||
| Functions | 6 | ||
| Functions (exponential and logarithmic) | 6 | ||
| Hypothesis Testing & Confidence Intervals | Hypothesis Testing | 224 | |
| Confidence Intervals | 199 | ||
| Hypothesis test – One sample | 27 | ||
| Hypothesis test - Two samples | 19 | ||
| Statistical Inference | 17 | 507 | |
| Inference about linear regression | 9 | ||
| Confidence interval – One sample | 6 | ||
| Confidence interval – Two samples | 6 | ||
| Linear Regression | Linear Regression | 35 | 35 |
| Integration | Integration | 88 | 88 |
| Arithmetic | Arithmetic | 76 | 76 |
| Statistical Software e.g Minitab, Excel SPSS, R | Statistical Software e.g Minitab, Excel SPSS, R | 37 | 37 |
| Differentation Rules | Differentation Rules | 9 | 9 |
| Differentation | Differentation | 7 | 7 |
| Construction of Estimators | Construction of Estimators | 13 | 13 |
| Basic Algebra | Basic Algebra | 8 | 8 |
| Asymptotics | Asymptotics | 7 | 7 |
| Advanced | Advanced | 36 | 36 |
| Matrices | Matrices | 8 | 8 |
After the merging process, there are 17 UCD MSC categories. The frequency or behavior of the UCD MSC categories can be examined (see Figure 3). As a first interpretation and before going deeper into the comparison, Figure 3 shows that the top categories are related with the Topics considered in the URJC categories, for example “Basic Statistics” could be related with Lesson 1; and “Hypothesis Testing & Confidence Intervals” with Lesson 5, and; Random Vectors & Distributions” with Lesson 4. On the other hand, the bottom categories are not clearly related with any URJC Lesson. This could be a good indicator since, based on the URJC descriptions, all of those bottom categories should be matched with the Other category in URJC.
Having cleaned and preprocessed the UCD MSC categories, we apply the comparison between the categorization of URJC with the categorization of UCD. This match allows us to validate both of the categorizations (see Figure 4).
Delving deeper into the comparison between the UCD MSC categories and the URJC categories, the heatmap allows us to identify data density between categories. It shows that there is a moderately strong agreement between all the URJC Lessons (except Lesson 1) with the same topic category for UCD. For example, we can that Lesson 2: Bivariate Data Description matches 46% with Linear Regression and 50% with Matrices and both are part of the Lesson 2 description. Lesson 3: Probability has a 29% match with Basic Probability; Lesson 4: Random Variables & Special Random Variables has a 49% match with “Linear Regression”, Lesson 5: Statistic Inference has a 67% match with Hypothesis Testing & Confidence Intervals. And last but not least, Lesson 6: Statistical Software presents a 46% match with Statistical Software e.g Minitab, Excel, SPSS, R.
Another example is the match of the “Asymptotics” UCD Category. It matches 29% with “High Level” and 43% with “Lesson 5”: Inference Statistics. In Statistics, asymptotic theory is a framework for assessing properties of estimators and statistical test, and extrapolating that to this research, issues relating to estimators are considered as Higher Level, and statistical test issues are considered as part of Lesson 5: Statistic Inference. Hence, as a result, it makes sense to present the percentages for both these relations.
But, on the other side, there are also values in Figure 4 which suggest that some of the issues have not been well categorized. Lesson 5: Inference Statistics has also a moderately strong agreement (46%) with Linear Regression, which, considering the URJC categorization, should be in Lesson 2 only. The MSC category of Basic Statistics presents a similar relation with different URJC Lessons (Lesson 1: 15%, Lesson 2: 12%, Lesson 4: 18% and Lesson 5: 21%). This last point matches a UCD basic concept category with any URJC Lesson level and even, with any URJC Lesson topic.
In summary, we can see that the most common UCD categories have the same topic that the Lesson defined in URJC. Regarding data validation between the UCD and URJC categories, Figure 4 shows that each URCJ Lesson presents its highest percent with a UCD category making sense. Despite it, we can see that some relation needs to be deeper analyzed to understand the clear meaning of the percentage.
3.3. RQ3: Insights from open-text responses
Lessons analysis give us the category where the issue is, but there are several descriptions inside any Lesson. Based on it, we find out in detail what are the main issue descriptions using text mining in the UCD comment text. After pre-processing of the Comment data (see Section 2.4), word clouds were generated for the UCD MSC Comment data, filtered by each URJC Lesson category (see Figure 5, Figure 6, Figure 7, Figure 8, Figure 9 and Figure 10). The word clouds offer a quick snapshot or overview of the most frequently occurring issues cross UCD MSC comments (and across Lessons).
If we go deeper into any word cloud, we can see that in all of them the biggest word has a strong relation with one of the main descriptors of the Lesson. For example, in Lesson 1 word cloud, “standard”, “deviation” and “mean” are the most popular words; in Lesson 2, “regression”, “correlation” and “covariance”; in Lesson 3, “conditional” and “probability”; Lesson 4, “distribution”; Lesson 5, “hypothesis”, “test” and “confidence” and Lesson 6, “query”, “help”, “rstudio”, “code” and “excel”.
Drilling down into the word cloud on Lesson 1 (see Figure 5), provides further detailed information beyond that of the “Description” section in the URJC categorization. The URJC description for Lesson 1 includes: “basic concepts,” “variable types,” “summary of graphics data,” and “summary of numerical data.” The word cloud reveals a finer scale within basic concepts, highlighting terms like “standard deviation,” “mean,” “sample,” and “median.” It also offers more detail about graphical issues, mentioning terms such as “histogram.” Similarly, the other word clouds provide information on students’ statistical issues beyond the URJC category descriptions.
As discussed in the introduction, students struggle not only with theoretical issues but also with emotional ones. Across all word clouds, concepts related to feelings and emotions can be viewed, such as “confused,” “unsure,” and “unclear”.
4. Discussion
The overall goal of this paper is to identify the most common issues students face during the transition from secondary education to tertiary education. At the beginning of this paper, it is presented that statistics modules are included in the majority of degrees independent of degrees area [2], and in some cases that statistics has been poorly taught in formal education teaching [4]. Research has aimed to identify what are the main problems in this teaching statistics. Batanero [5] confirmed that some of the problems detected are understanding the basic statistical concepts, integration of statistics as a subject in school, statistical inference and the limited time to assimilate the concepts [5].
Following this context, our descriptive analysis provides an overview of the frequently occurring issues across URJC Lessons and UCD MSC categories. Addressing RQ1, statistical graphics indicate that probability and statistical inference are areas where students commonly encounter issues. As presented in the introduction, secondary education generally covers basic statistics and descriptive statistics, both related to Lesson 1: Data Description and Lesson 2: Bivariate Data Description. This suggests that students arrive at tertiary education with fewer issues in these areas but struggle more with the new content taught at university level e.g., probability distributions and statistical inference.
One of the key highlights of this study is the establishment of international collaboration in the identification of statistical issues and the associated categorization validation (RQ2). This involved reviewing the taught modules at URJC, categorizing the content into different Lessons, and analyzing the UCD data according to the URJC categories. A heatmap provided deeper insights into the relationship between the URJC Lessons and UCD MSC categories. Overall, there is a moderately strong agreement between the two categorizations. On a more granular level, several interpretations can be drawn from the heatmap, such as the case with the UCD MSC category “Basic Statistics.” The highest percentage of relation is 21% with Lesson 5. However, this category is related to all URJC Lessons, which might indicate that the tutor’s categorization is subjective, based on what they consider basic statistics, or that they are uncertain about the appropriate category. We recommend that the UCD MSC categories are further defined and discussed with the MSC tutors. In addition, the number of categories should be reduced as 40 categories appeared less than 6 times across the 7-year time period of the data.
On a more detailed level, to help address RQ3, word clouds helped identify specific problems within each Lesson. For each word cloud, the most representative word is the main descriptor inside each lesson and, as a first picture and overview, it has positive relation with the categorization. This comprehensive analysis provides an evidence base for developing statistical support for first- and second-year undergraduate students. To develop educational games or apps that benefit students, this analysis helps identify the main statistical Topics taught and the areas where students struggle.
An important gap is the relation between how to teach statistics, the content in the statistics subject and the knowledge of the lecturers. If quality education is not provided, there will be inequality in students’ knowledge level, and they may have negative emotions facing this subject. In addition, students will learn statistics just to pass their examinations, and afterwards, they will forget their module knowledge. Hence, they will be unprepared for real life. This can be addressed through strong networking, collaboration and knowledge sharing of statistics education approaches across universities.
As the future supports (e.g., games, dashboards and apps) will be applicable across international borders and will be evidenced-based, they will reduce the need for repetition in resource creation, reduce redundancy in resource creation (creating resources for topics that are not statistical issues), and therefore reduce resources (time, money and energy). With these future international resources, we will achieve stronger networking between countries and universities, reduce the need for independent work related to the duplication of resources, and the most important thing, provide attractive resources for this subject to make the knowledge sustainable and long-lasting for students.
Author Contributions
Antonio de la Hoz: Conceptualization, Methodology, Software, Validation, Formal Analysis, Writing – Original Draft, Writing – Review & Editing, Visualization. Raquel Hijón: Conceptualization, Methodology, Writing – Review & Editing, Supervision, Project Administration. Emma Howard: Conceptualization, Methodology, Software, Validation, Writing – Review & Editing, Visualization, Supervision, Project Administration.
Funding
This research was funded by research grants PID2022-137849OB-I00 funded by MICIU/AEI/10.13039/501100011033 and by the ERDF, EU.
Institutional Review Board Statement
The study was conducted in accordance with the Declaration of Helsinki, and approved by the Institutional Review Board (or Ethics Committee) of University College Dublin (protocol code LS-C-23-221-Cronin and date of approval 20th of September 2023). for studies involving humans.
Consent Statement: Consent was obtained from all subjects involved in the study.
Data Availability Statement
Restrictions apply to the availability of these data. Data were obtained from Associate Professor Anthony Cronin, manager of the UCD MSC.
Acknowledgments
We would like to thank the manager of the UCD Maths Support Centre, Associate Professor Anthony Cronin, for providing the MSC data and liaising with us on this project. We would also like to thank the students who attended the MSC and consented to having their data analyzed for research purposes.
Conflicts of Interest
The authors declare no conflicts of interest.
References
- Ruiz López, N. The teaching of Statistics in Latin America Primary Education. REICE. Revista Iberoamericana sobre Calidad. Efic. Y Cambio En Educ. 2015, 13, 103–121. [Google Scholar]
- Blanco, A. Blanco, A. Una revisión crítica de la investigación sobre las actitudes de los estudiantes universitarios hacia la estadística. Revista https://revistas.ucm.es/index.php/RCED/article/view/RCED0808220311A.
- Cuétara Hernández, Y.; Salcedo Estrada, I.M.; Hernández Díaz, M. La enseñanza de la estadística: antecedentes y actualidad en el contexto internacional y nacional. Atenas 2016, 3, 125–140. [Google Scholar]
- Batanero, C. Sentido estadístico: componentes y desarrollo. En J. M. Contreras, G. R. Cañadas, M. M. Gea y P. Arteaga (Eds.), Actas de las Jornadas Virtuales en Didáctica de la Estadística, Probabilidad y Combinatoria (pp. 55-61). Granada, Departamento de Didáctica de la Matemática de la Universidad de Granada.
- Batanero, C. y Godino, J. (2001). Análisis de datos y su didáctica. Material Digital publicado en:www.ugr.es/local/batanero(Consultado 23- 04-2010).
- Batanero, C.; Castro, A.; Godino, J. (2014). Evolution of students, understanding of statistical association in a computer-based teaching environment. Material digital. Universidad de Granada.
- Ben-Zvi; Garfield. (2008). Developing students’ statistical reasoning. research and teaching practice. Material impreso. pp. 57–69.
- Blanco, A. (2004). Enseñar y aprender Estadística en las titulaciones universitarias de Ciencias Sociales: apuntes sobre el problema desde una perspectiva pedagógica. En Torre, J.C. y Gil, E. (Eds.). Hacia una enseñanza universitaria centrada en el aprendizaje (pp. 143-190). Madrid: Servicio de publicaciones de la Universidad Pontificia Comillas.
- Behar, R.; Grima, P. La estadística en la educación superior ¿Formamos pensamiento estadístico? Ing. Compet. 2004, 5, 84–90. [Google Scholar] [CrossRef]
- Ramos, L. La educación estadística en el nivel universitario: retos y oportunidades. Rev. Digit. De Investig. En Docencia Univ. 2019, 13, 67–82. [Google Scholar] [CrossRef]
- Estrella, S. (2017). Enseñar estadística para alfabetizar estadísticamente y desarrollar el razonamiento estadístico. En: Salcedo, A. (Comp.). Alternativas Pedagógicas para la Educación Matemática del Siglo XXI, (173 – 194). Caracas: Centro de Investigaciones Educativas, Escuela de Educación. Universidad Central de Venezuela. Recuperado de https://goo.gl/tUFF5Y.
- Ottaviani, M. G. (2002). 1982-2002: From the past to the future. En B. Phillips (Ed.), Proceedings of the Sixth International Conference on Teaching of Statistics. Ciudad del Cabo: IASE. CD ROM.
- Hadley, W.; Chang, W.; Henry, L.; Pedersen, T.L.; Takahashi, K.; Wilke, C.; Woo, K.; Yutani, H.; Dunnington, D.; ven den Brand, T. gplot2: Create elegant data visualisations using the grammar of graphics. Available online: https://cran.r-project.org/web/packages/ggplot2/index.html (accessed on 4 August 2024).
- Wickham, H. tidyverse: Easily install and load the ‘tidyverse’. Available online: https://cran.r-project.org/web/packages/tidyverse/index.html (accessed on 4 August 2024).
- Feinerer, I.; Hornik, K.; Artifex Software, Inc. tm: Text mining package. Available online: https://cran.r-project.org/web/packages/tm/index.html (accessed on 4 August 2024).
Figure 1.
Frequency of Lessons.
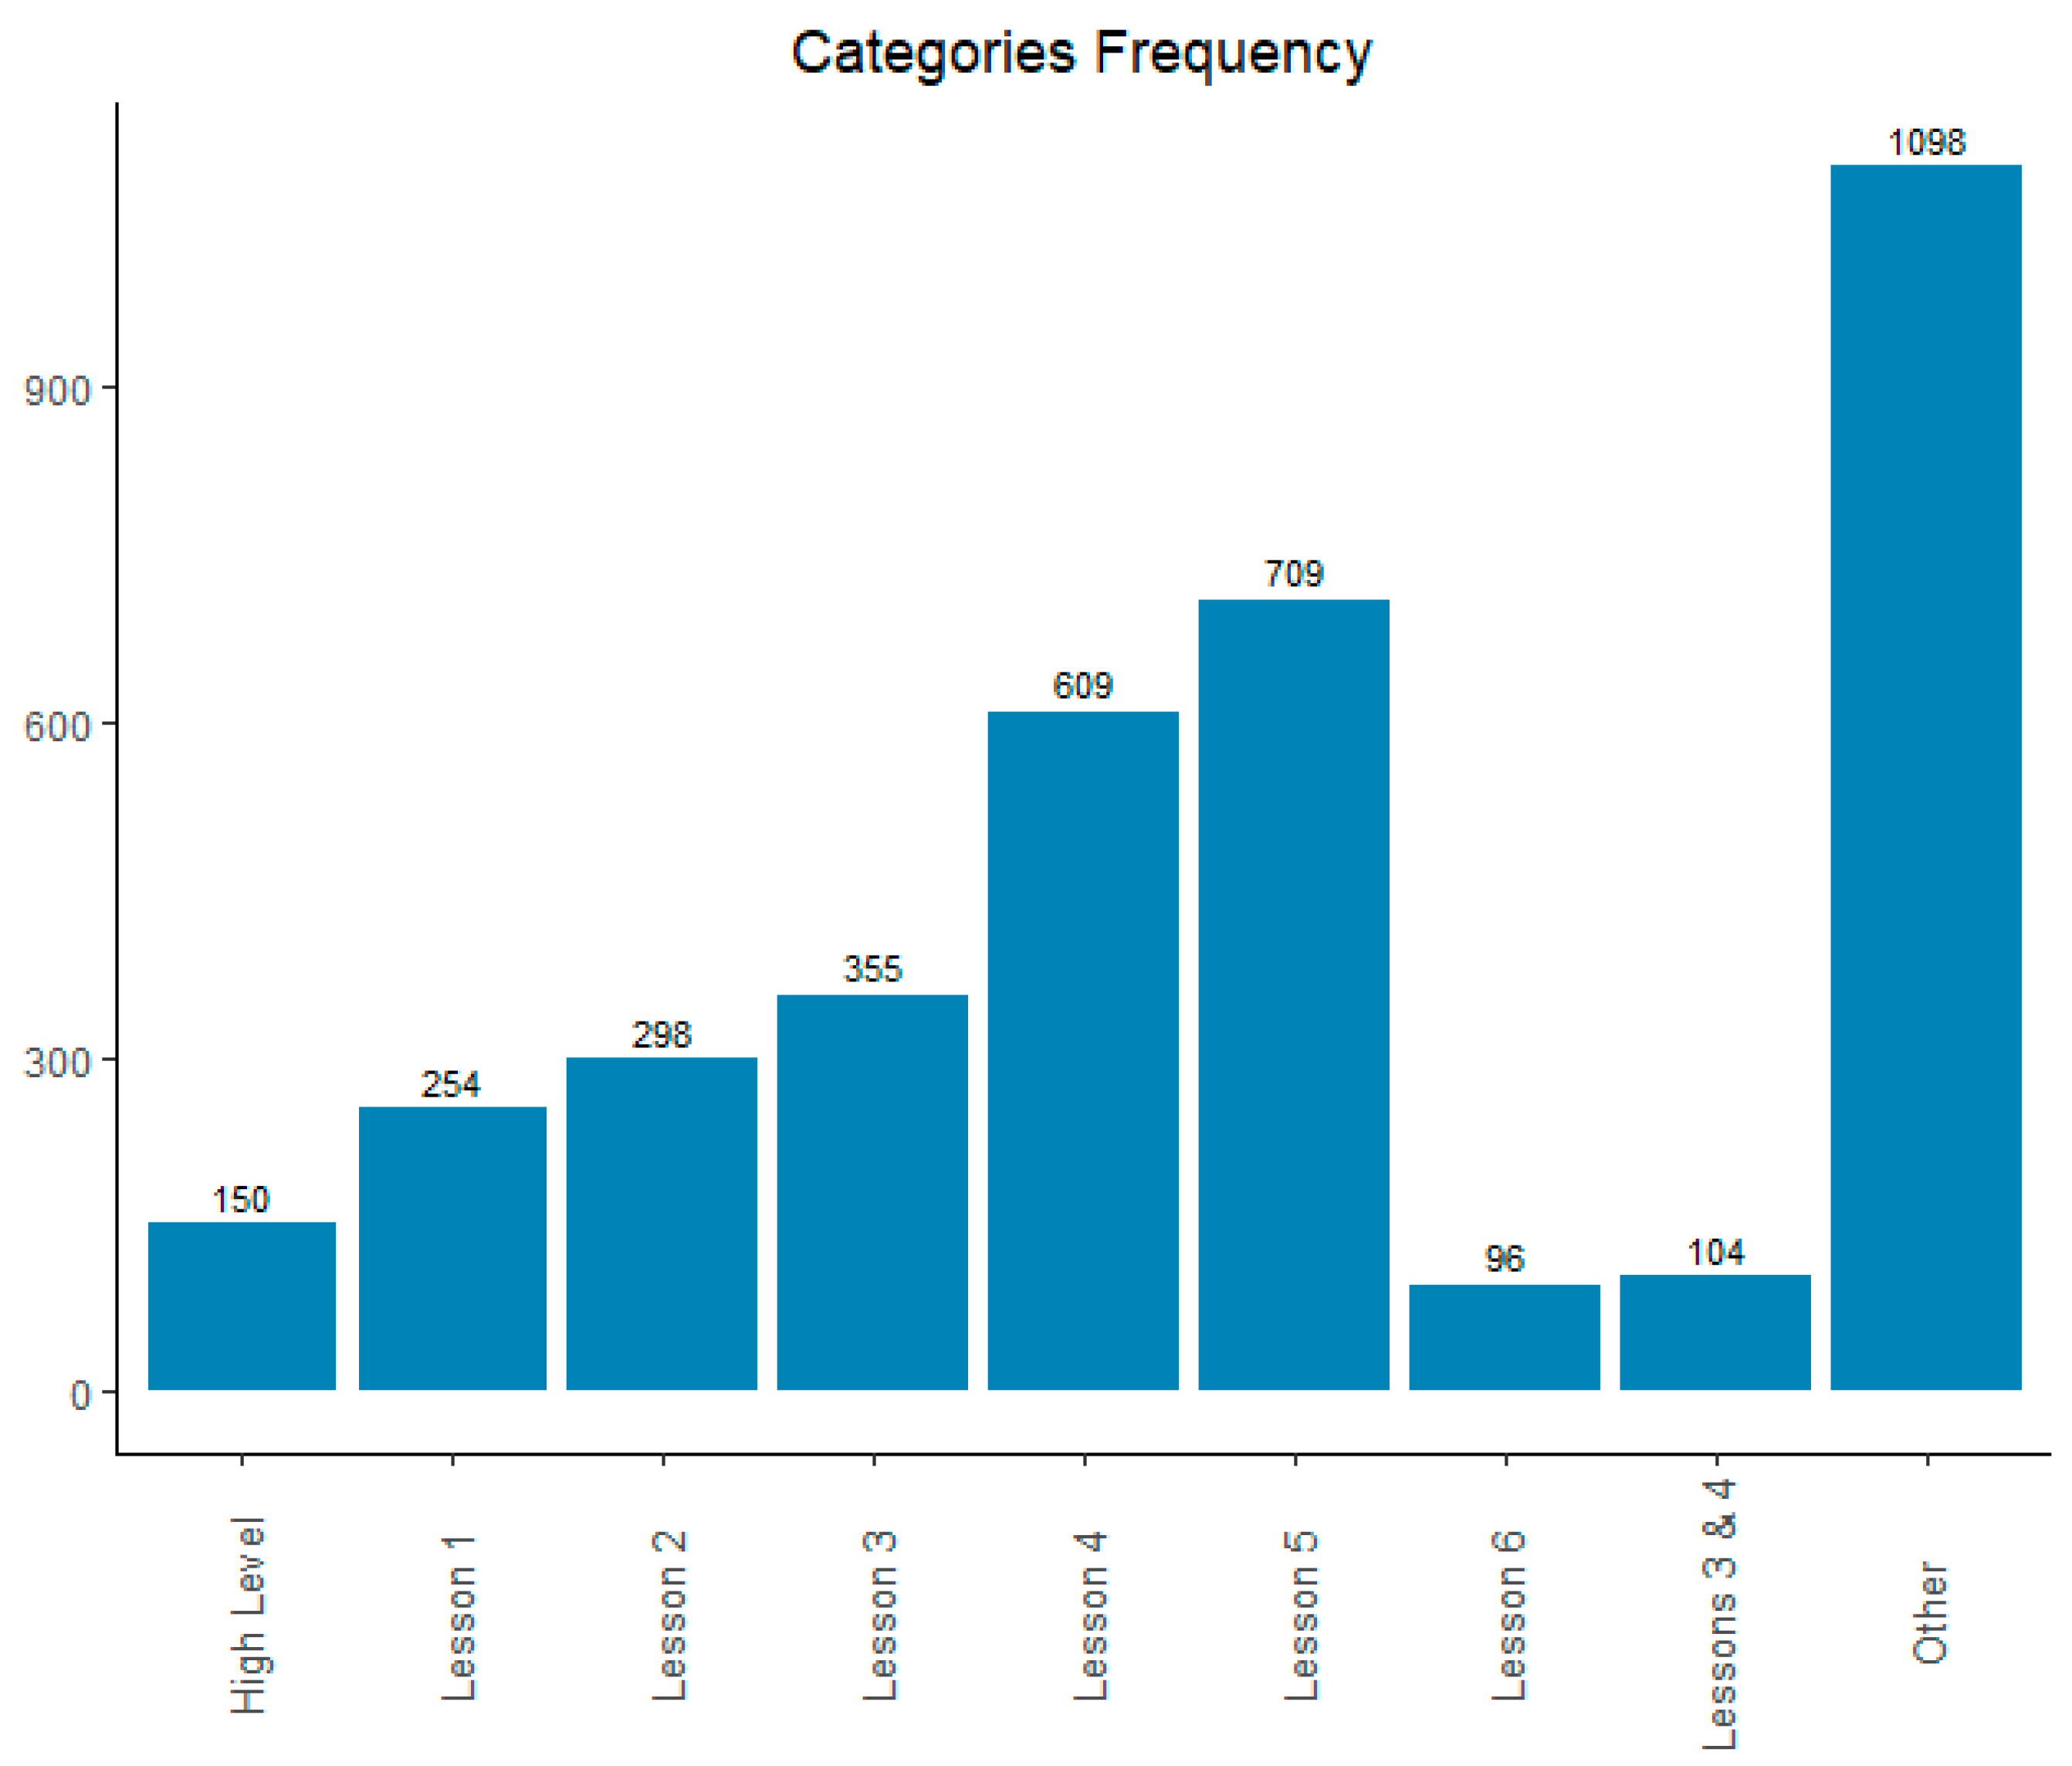
Figure 2.
Lessons’ Proportion.
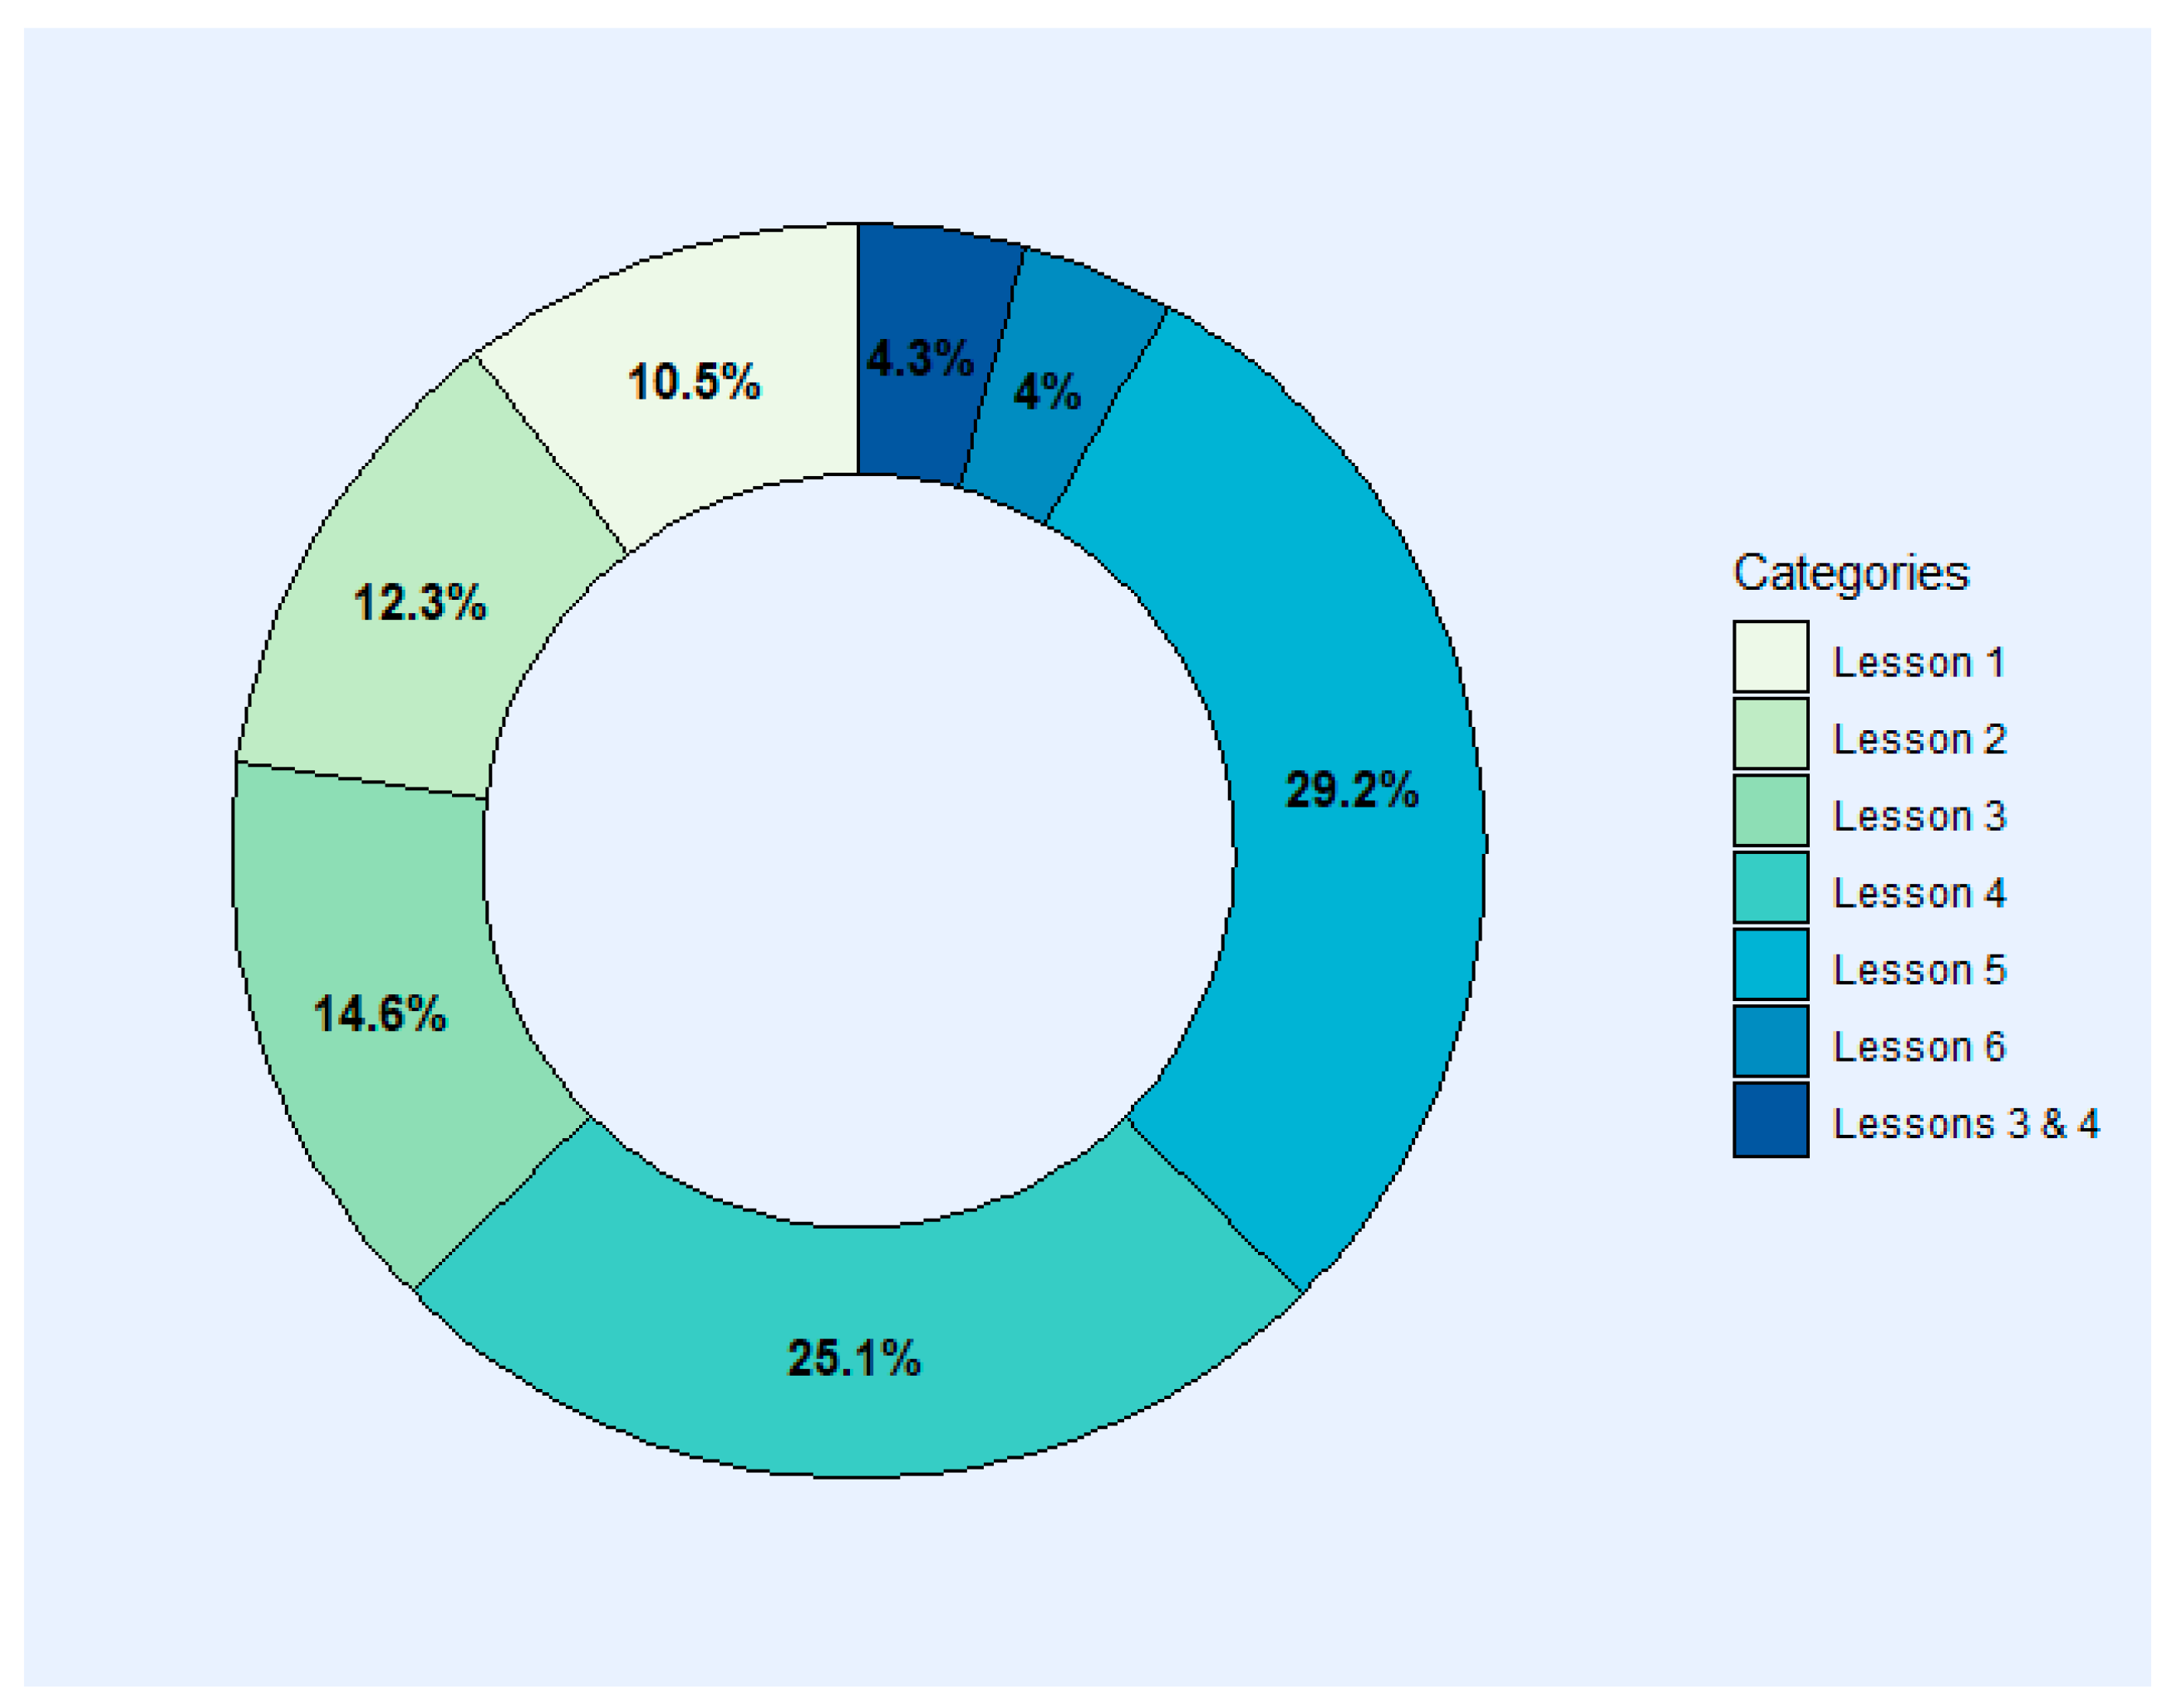
Figure 3.
Frequency of eight top UCD MSC categories and five least UCD MSC categories.
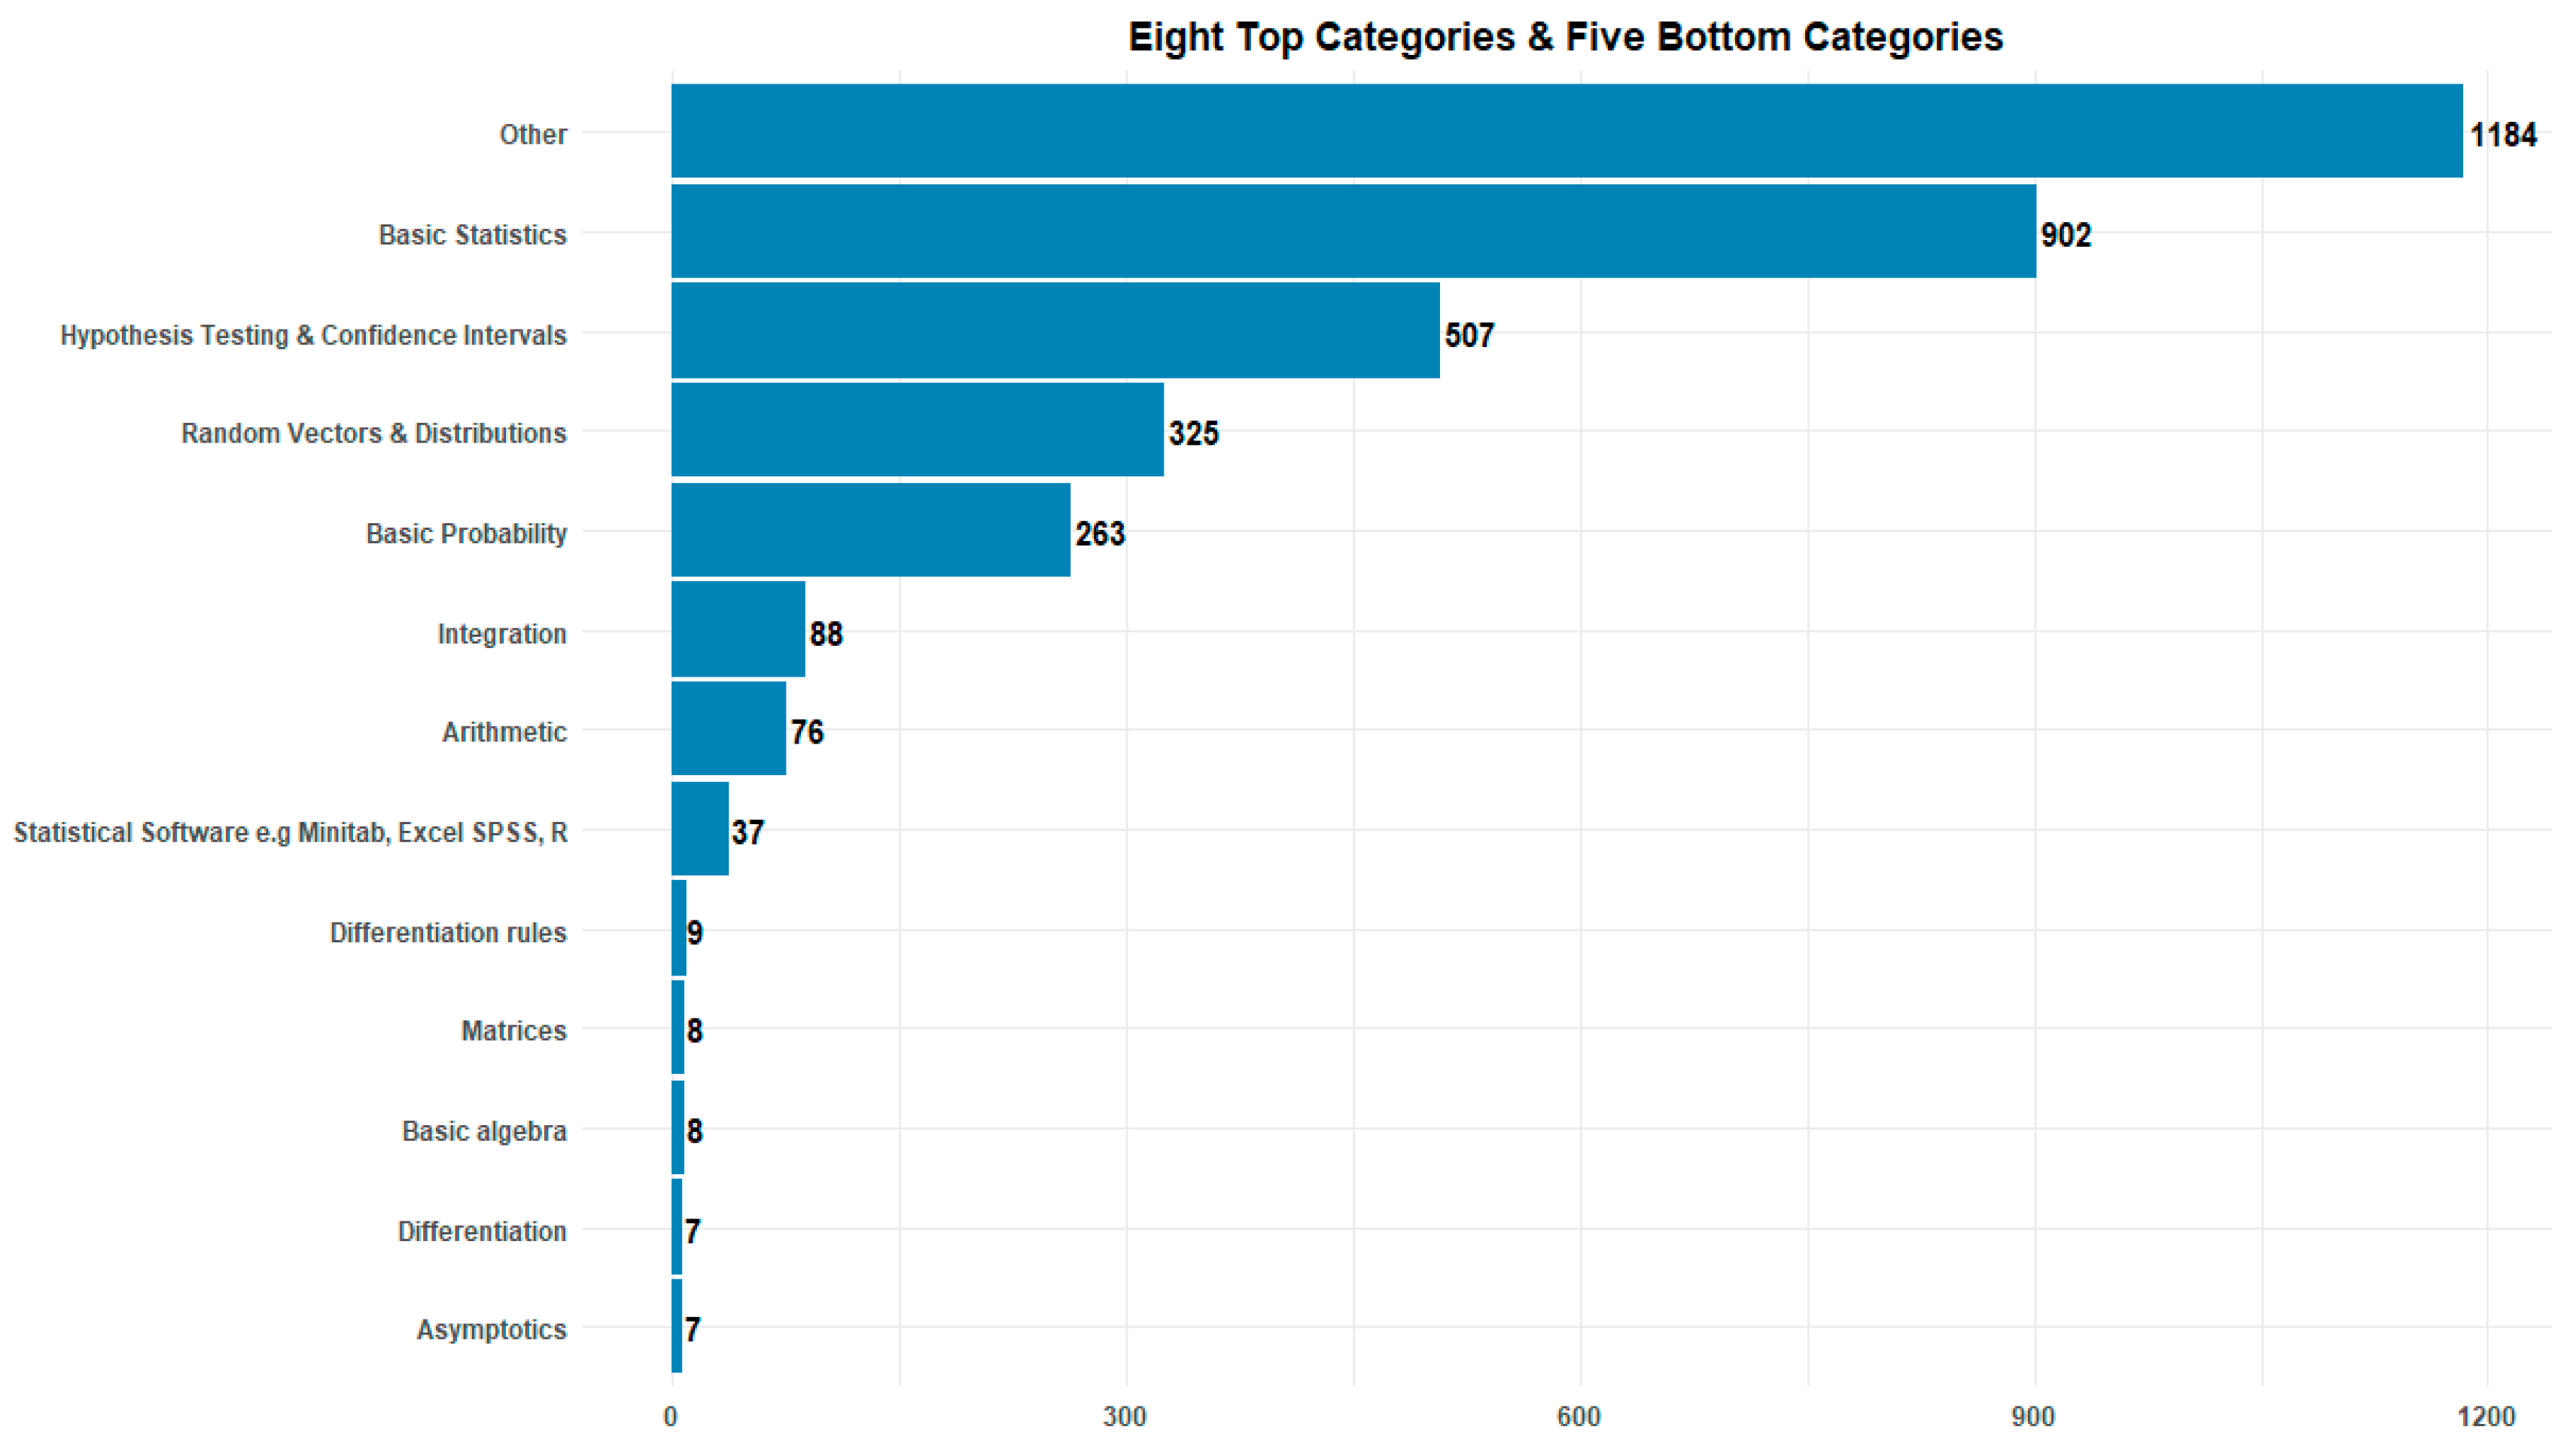
Figure 4.
Heatmap of UCD MSC categories and URJC categories.
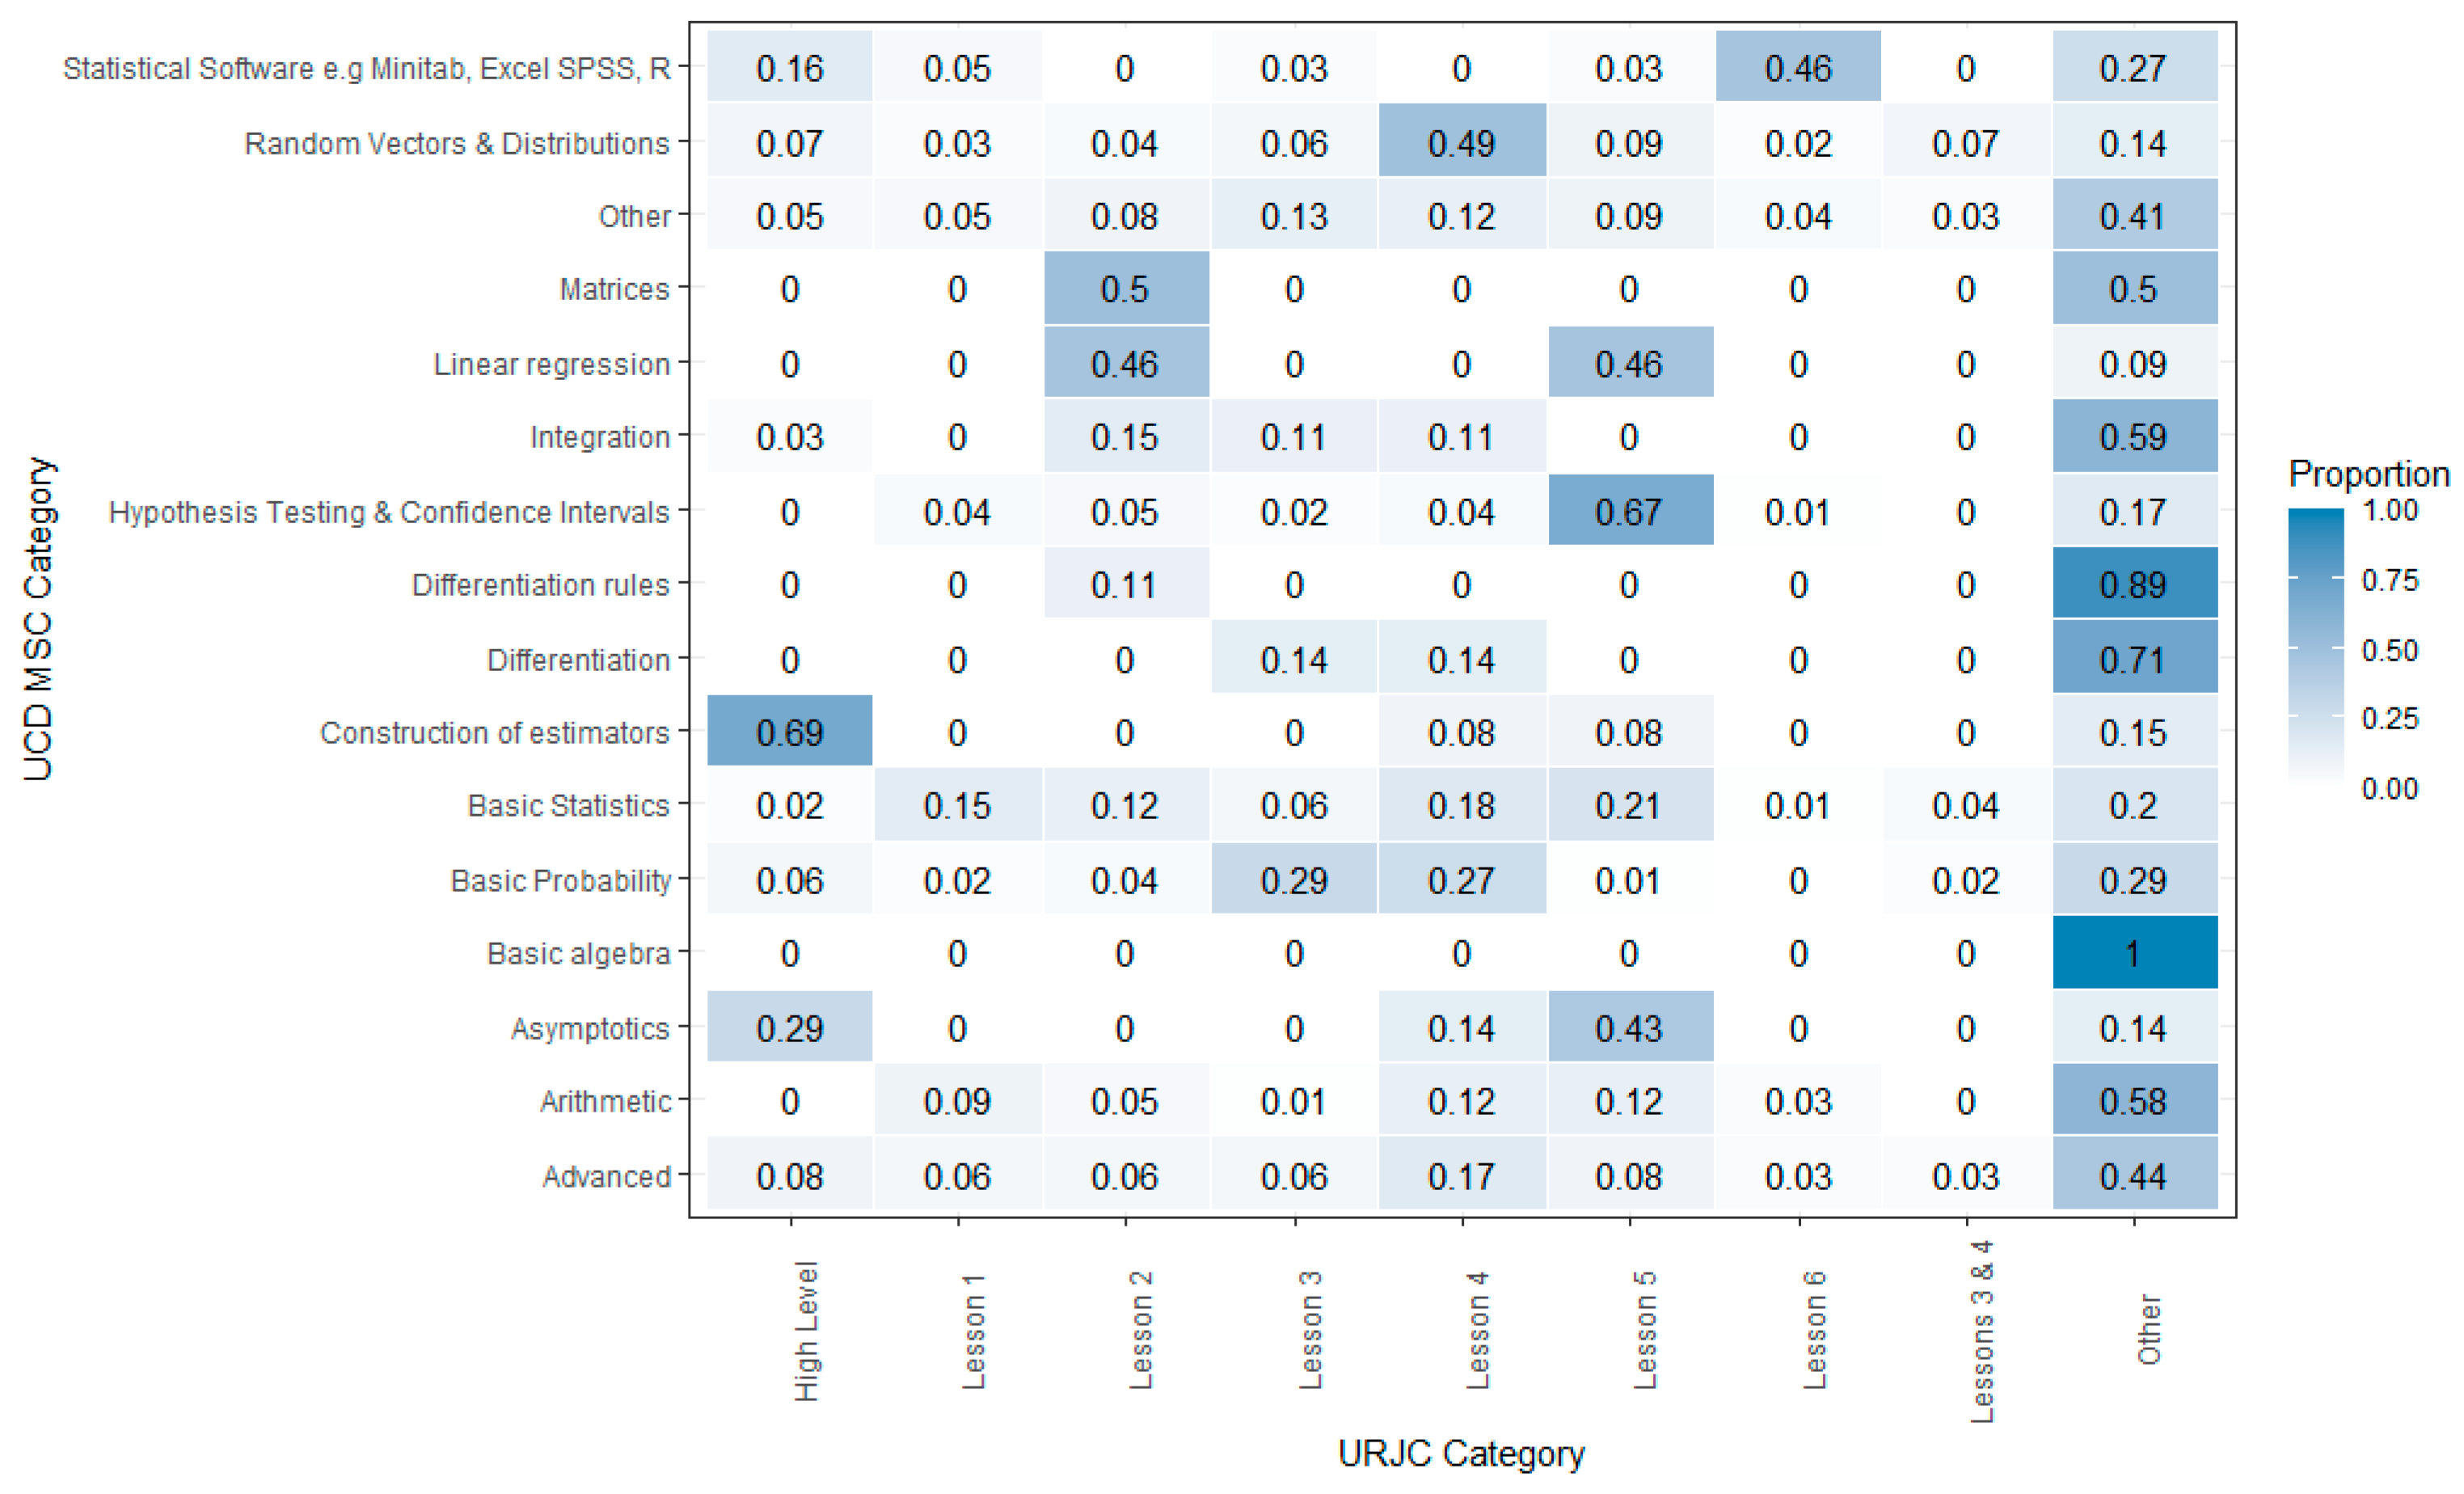
Figure 5.
Word cloud for Lesson 1
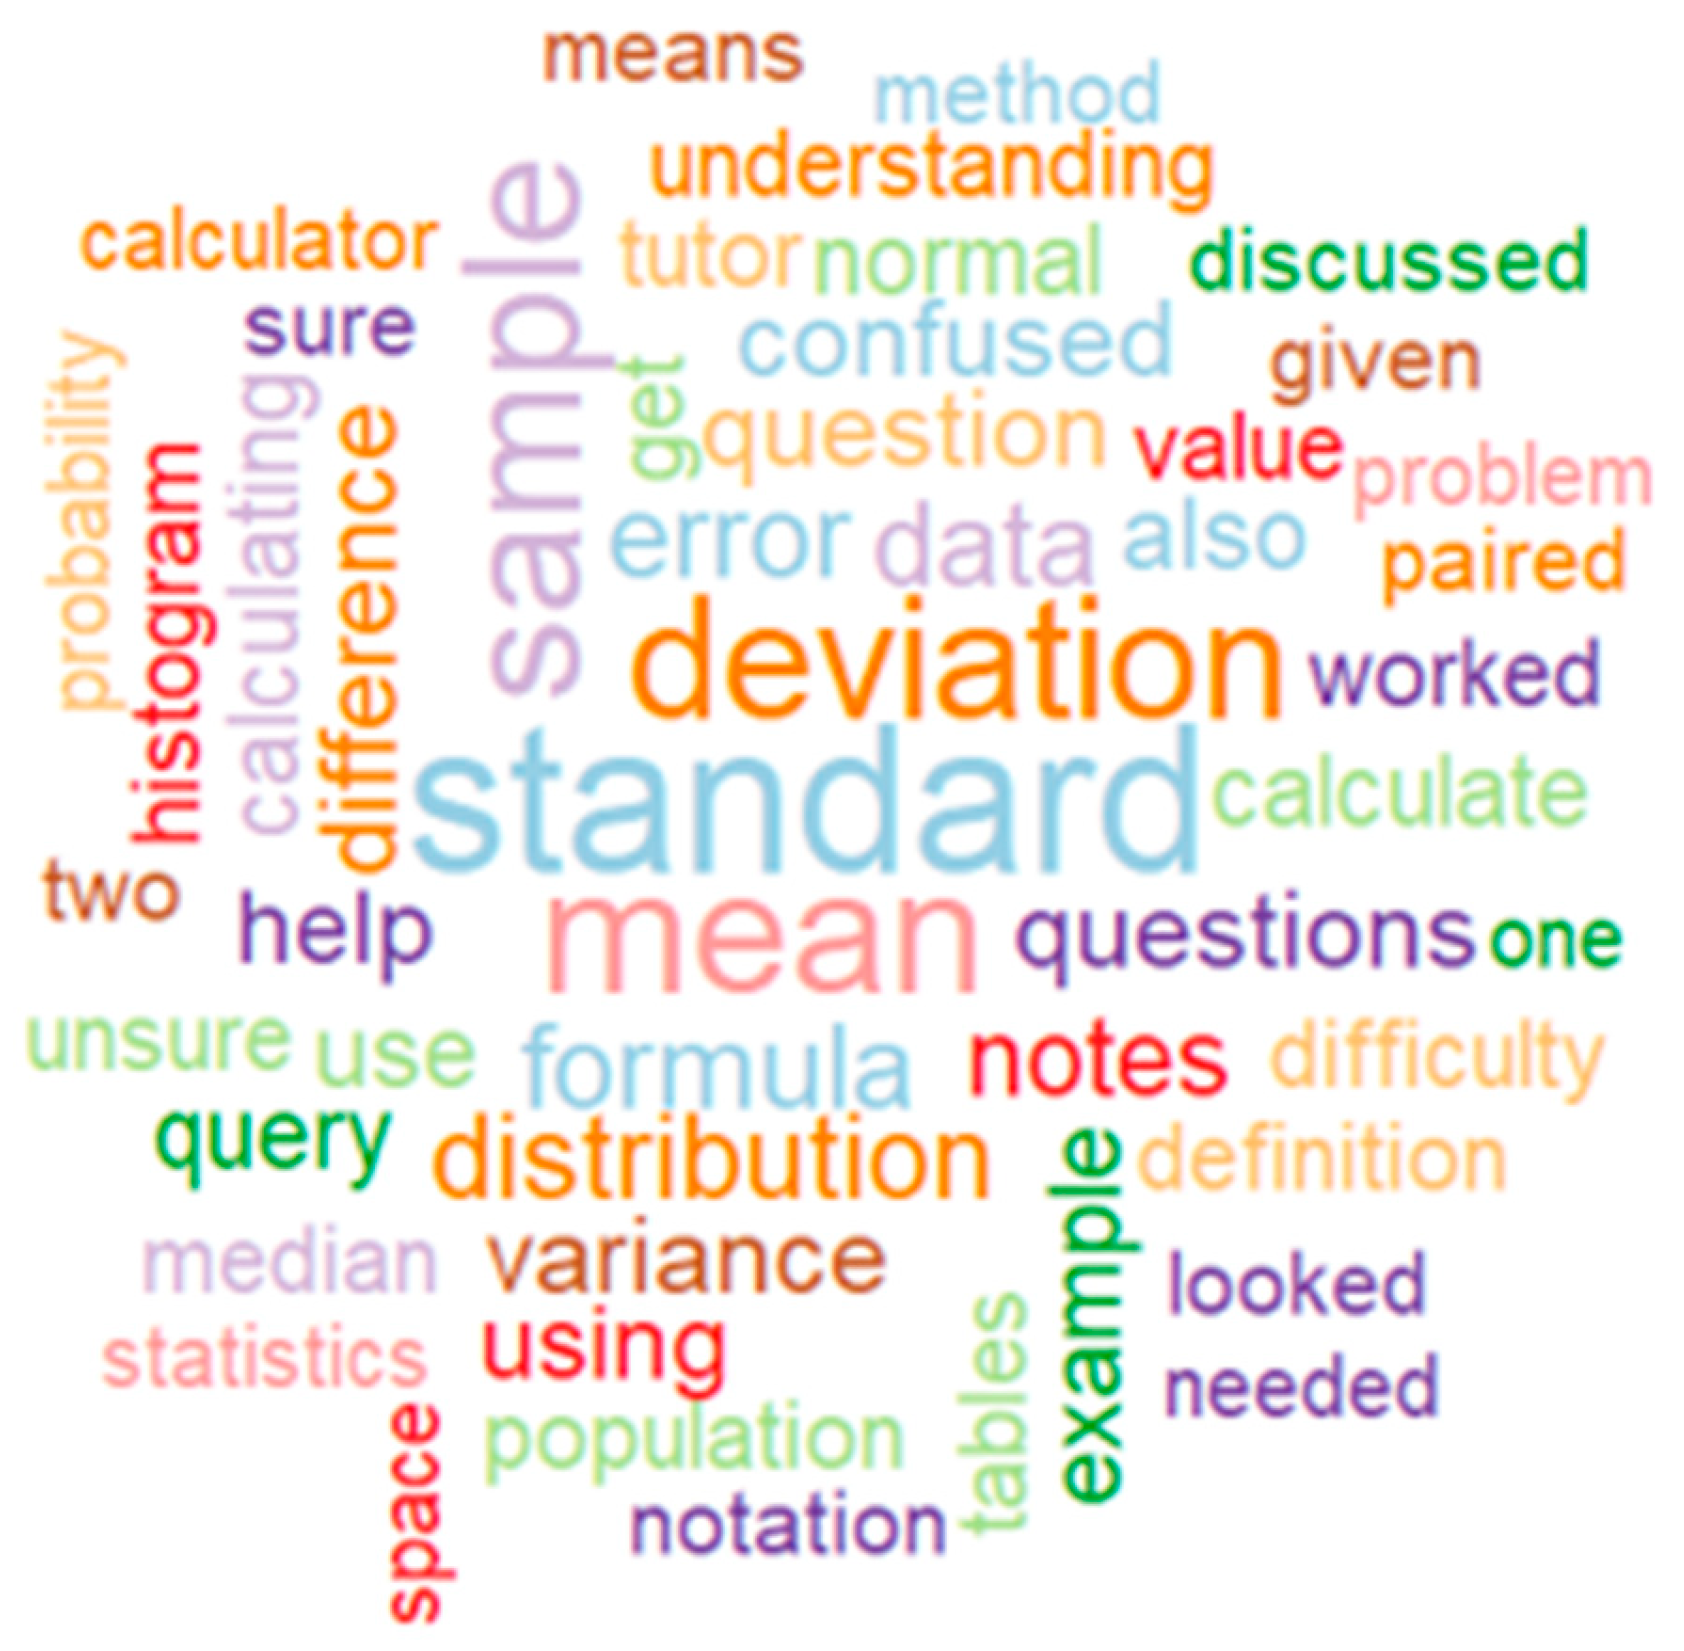
Figure 6.
Word cloud Lesson for 2.
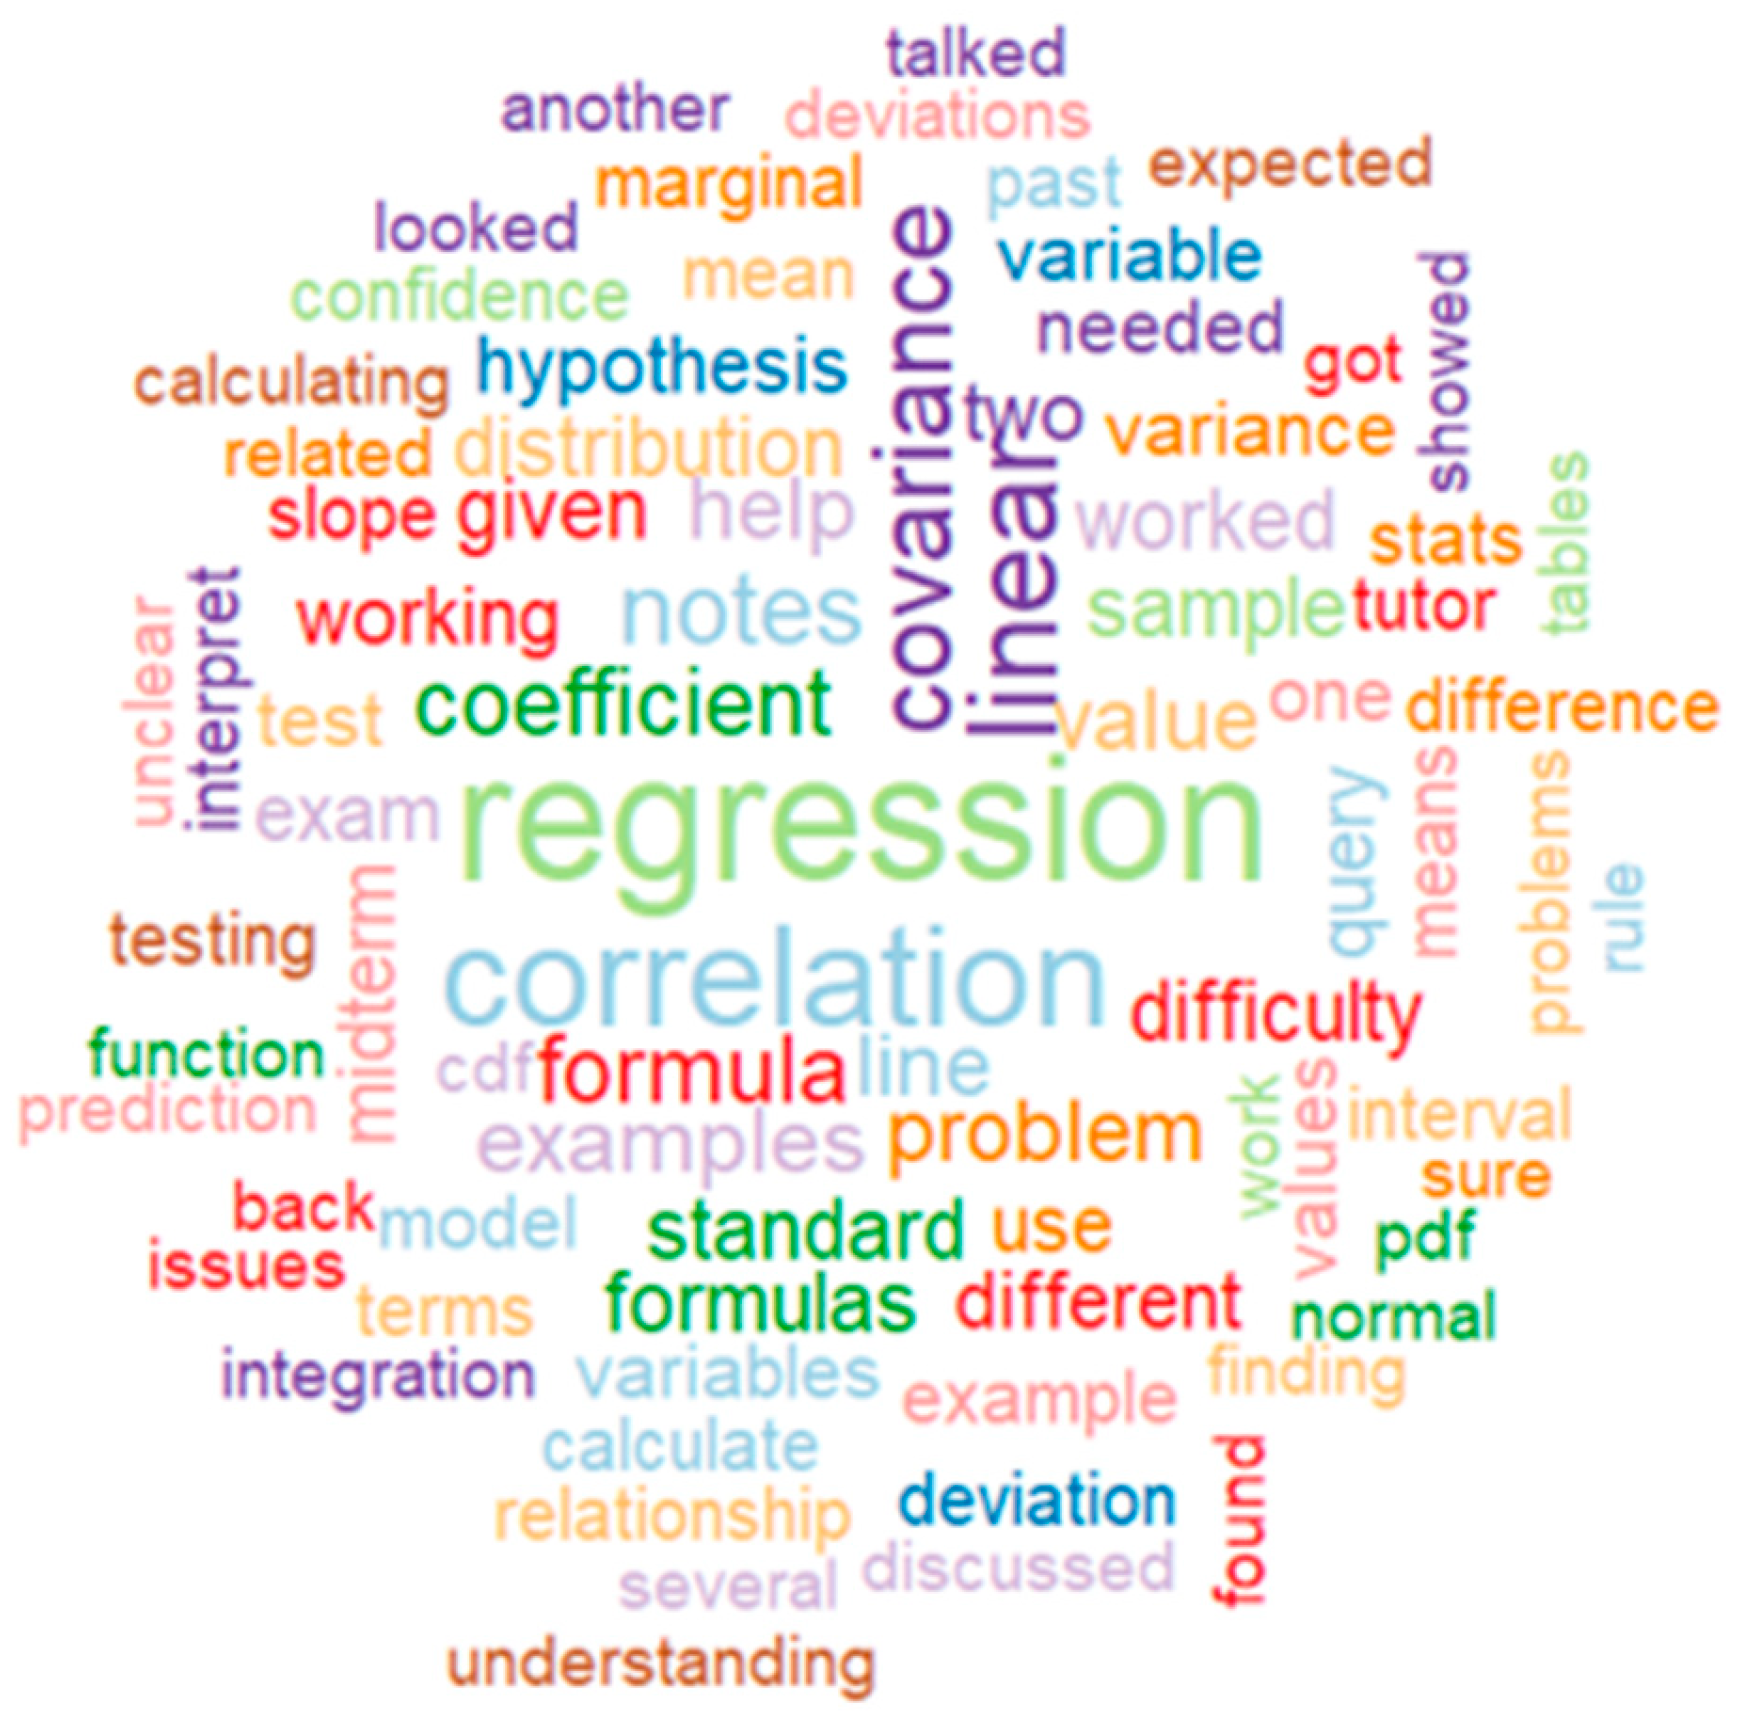
Figure 7.
Word cloud for Lesson 3.
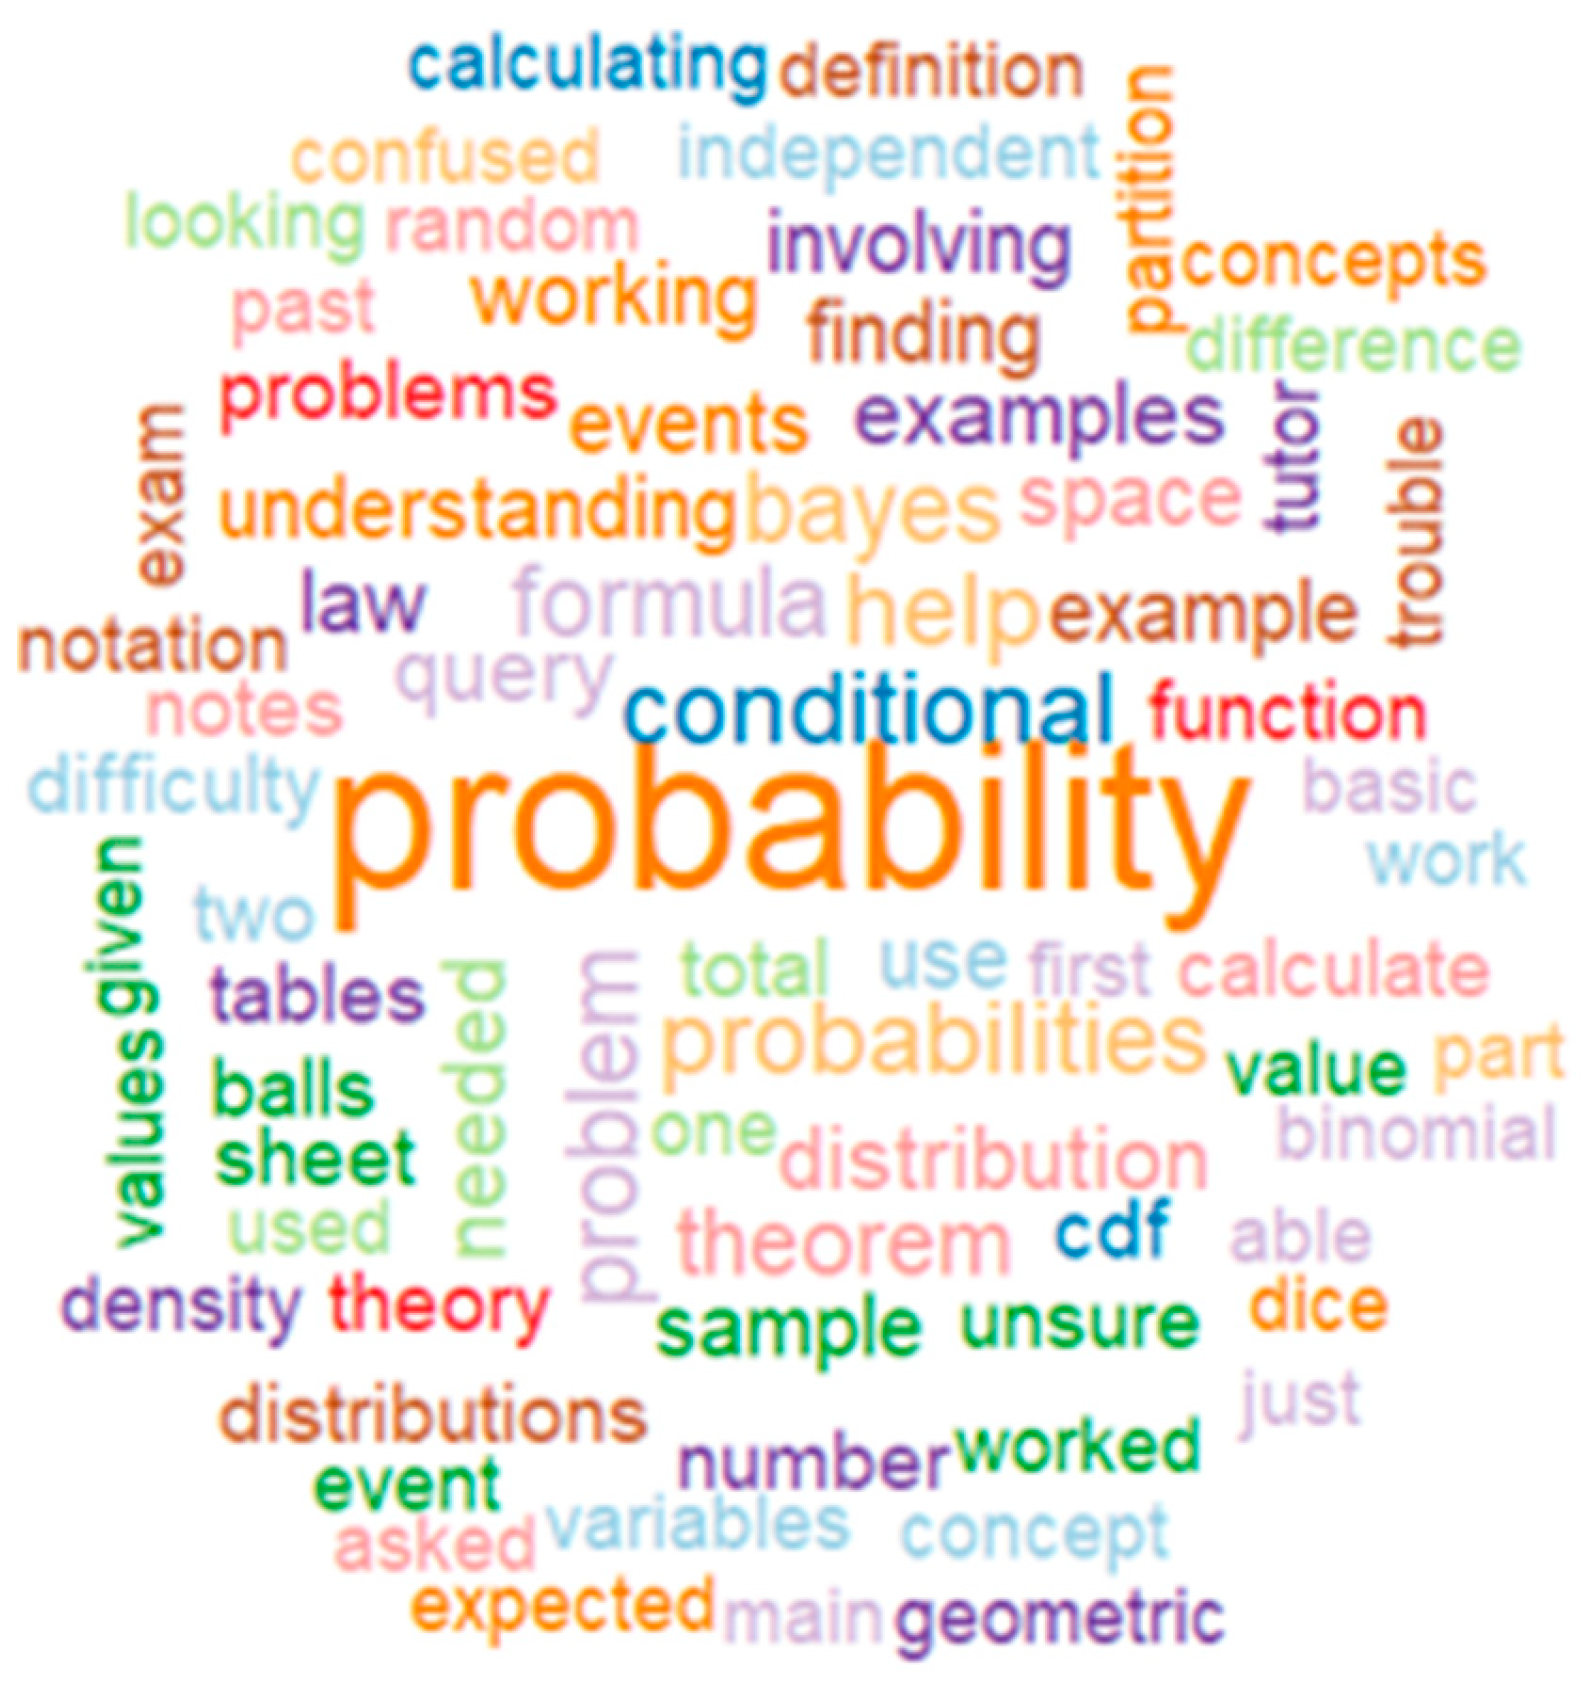
Figure 8.
Word cloud for Lesson 4.
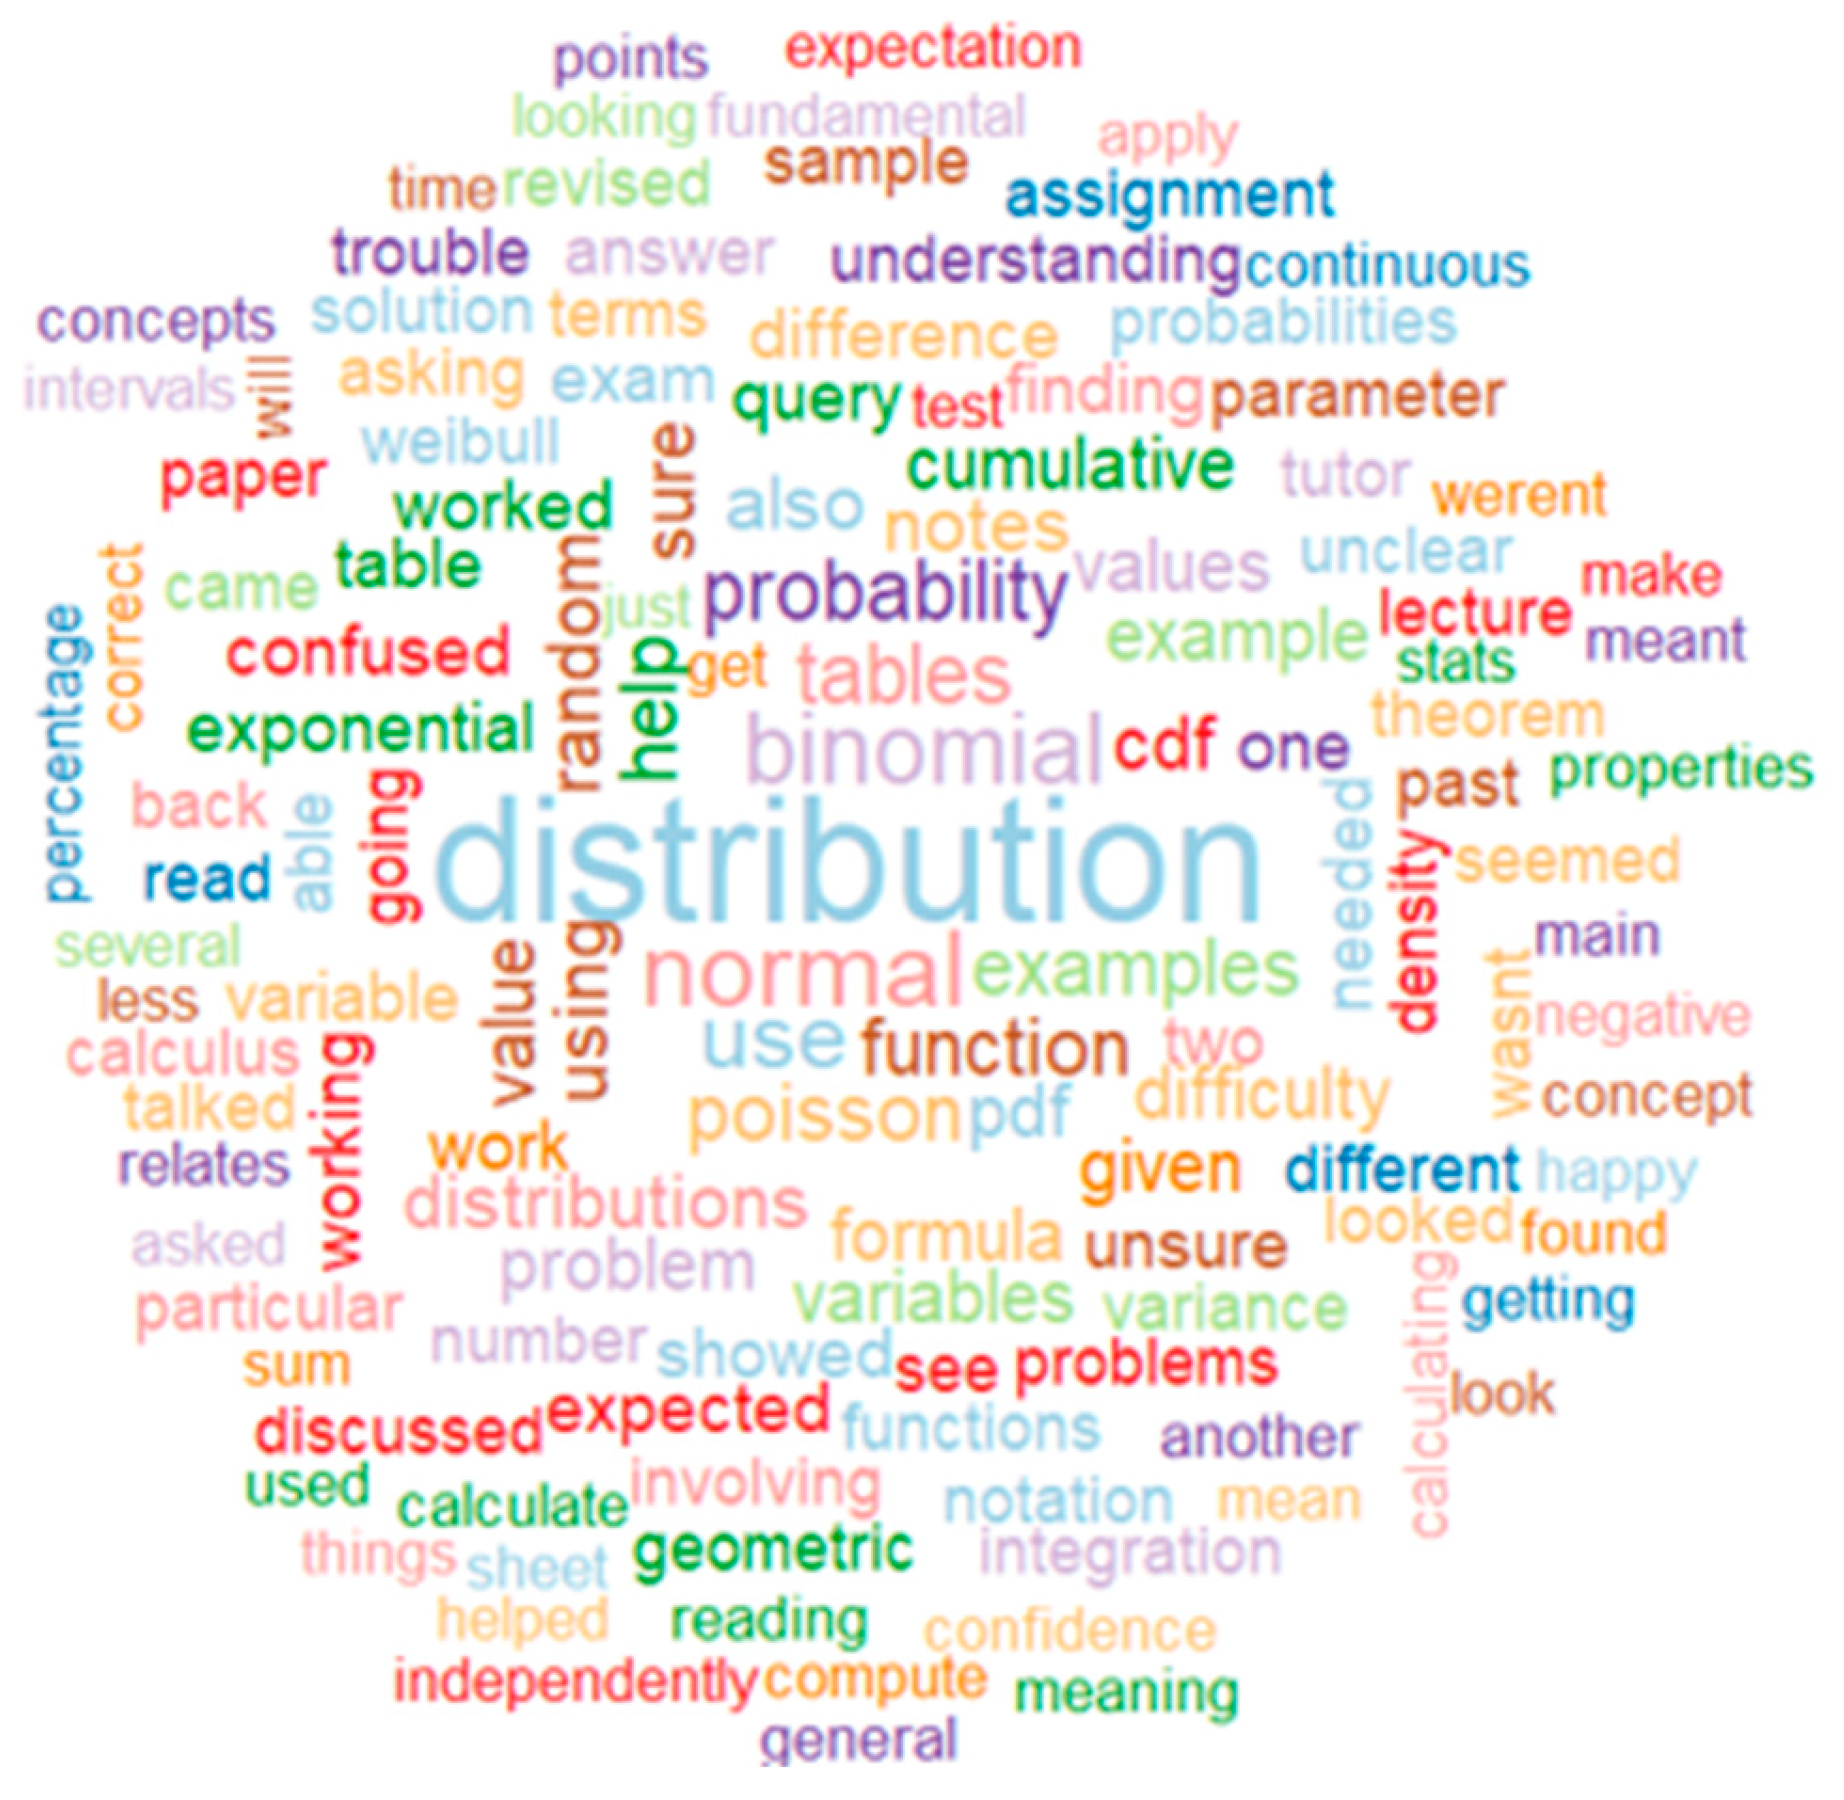
Figure 9.
Word cloud for Lesson 5.
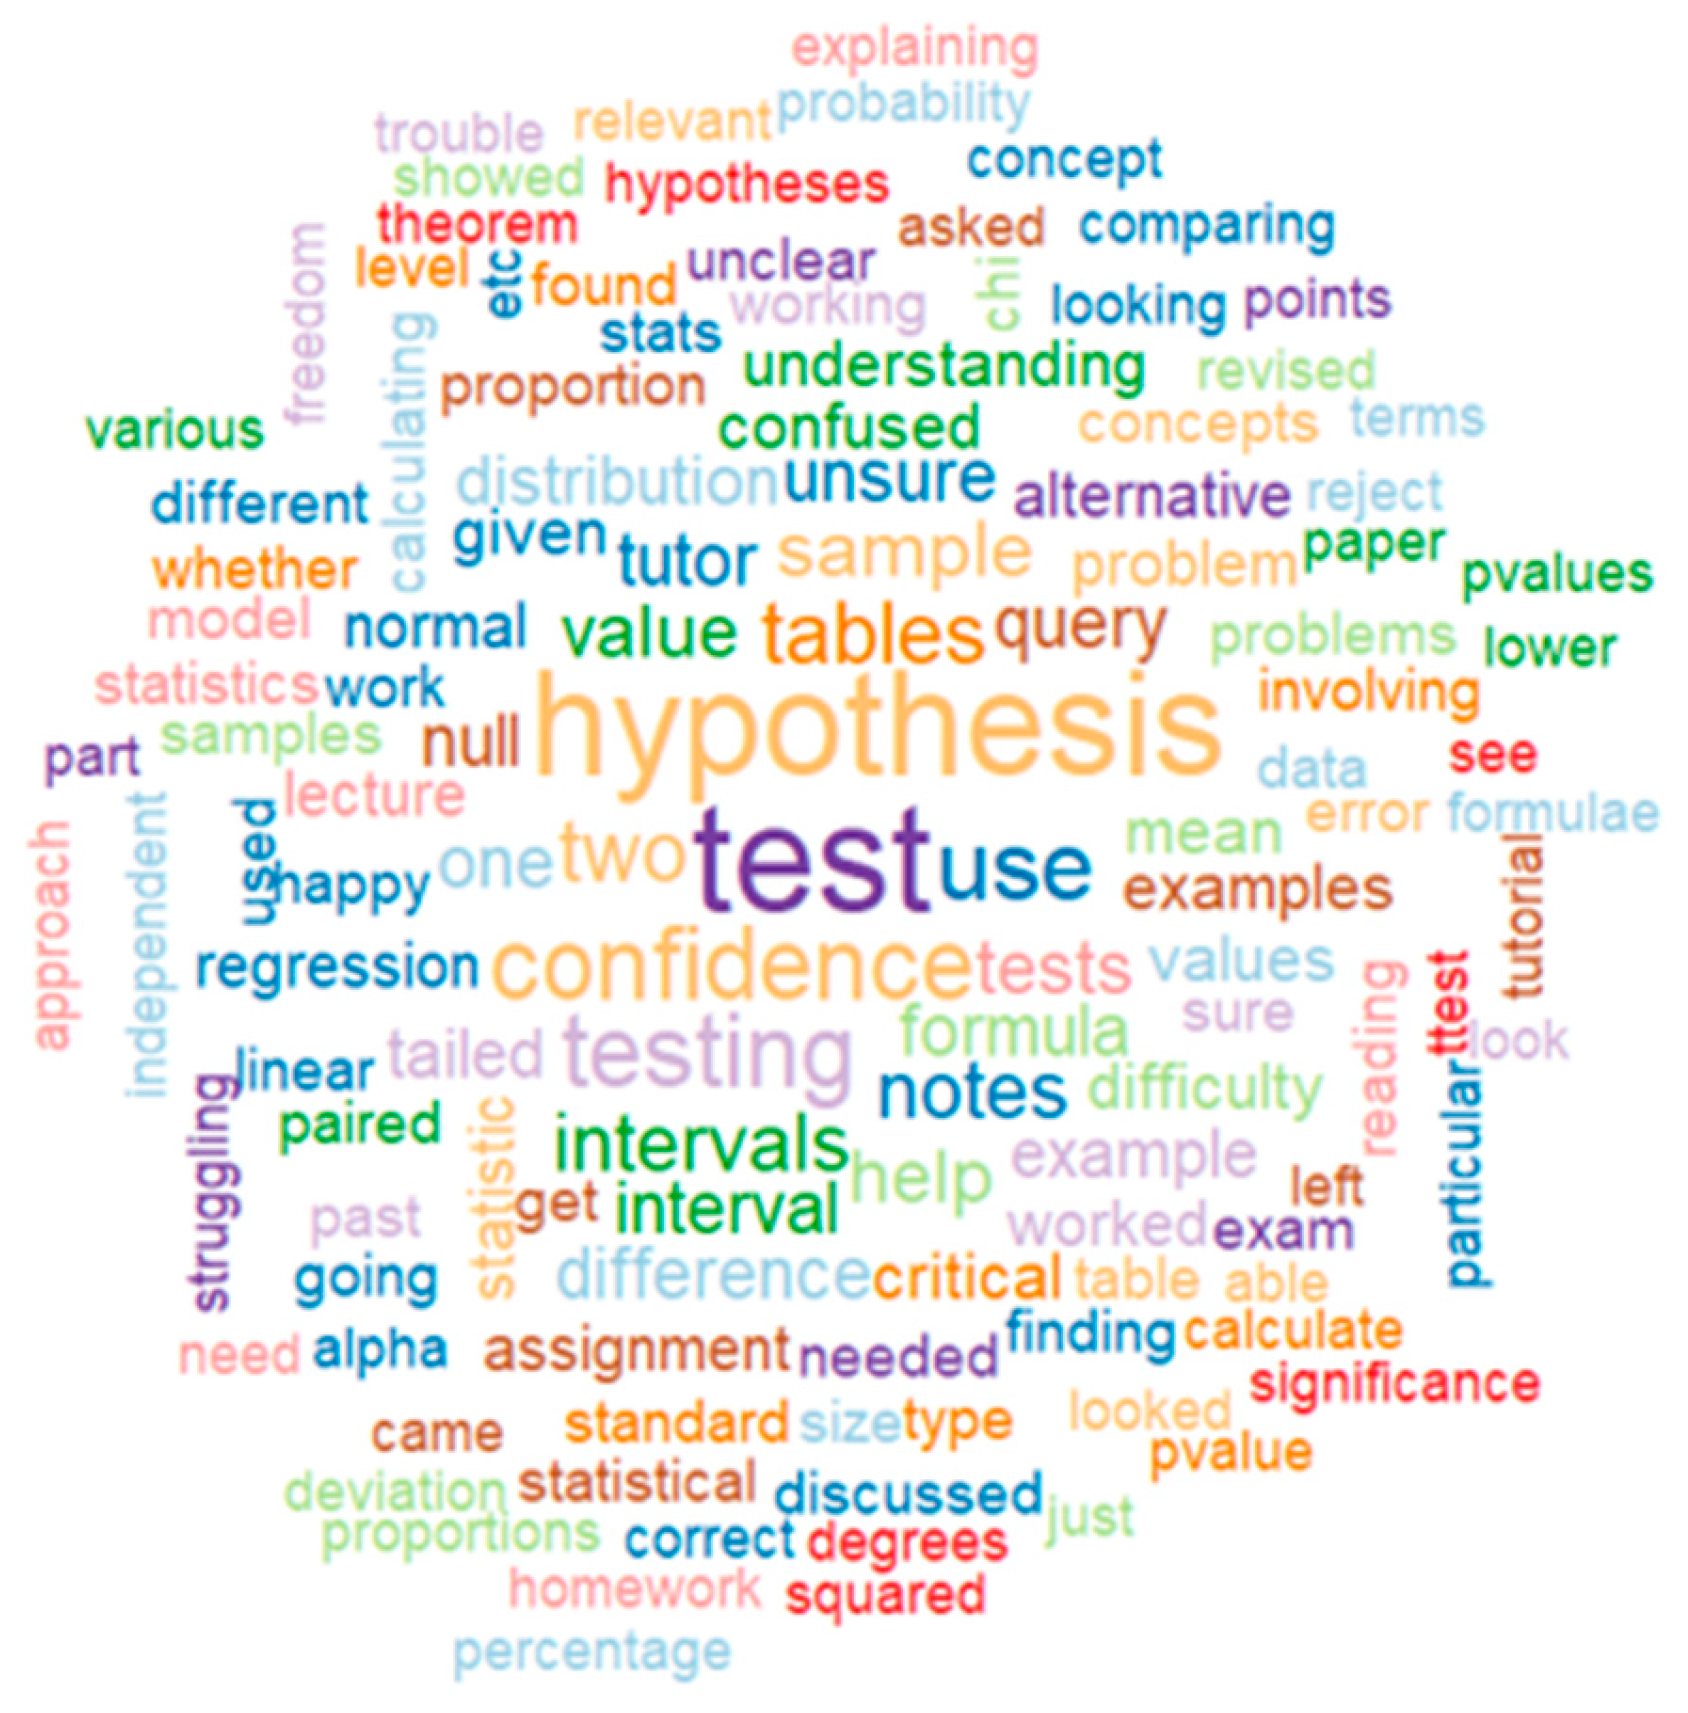
Figure 10.
Word cloud for Lesson 6.
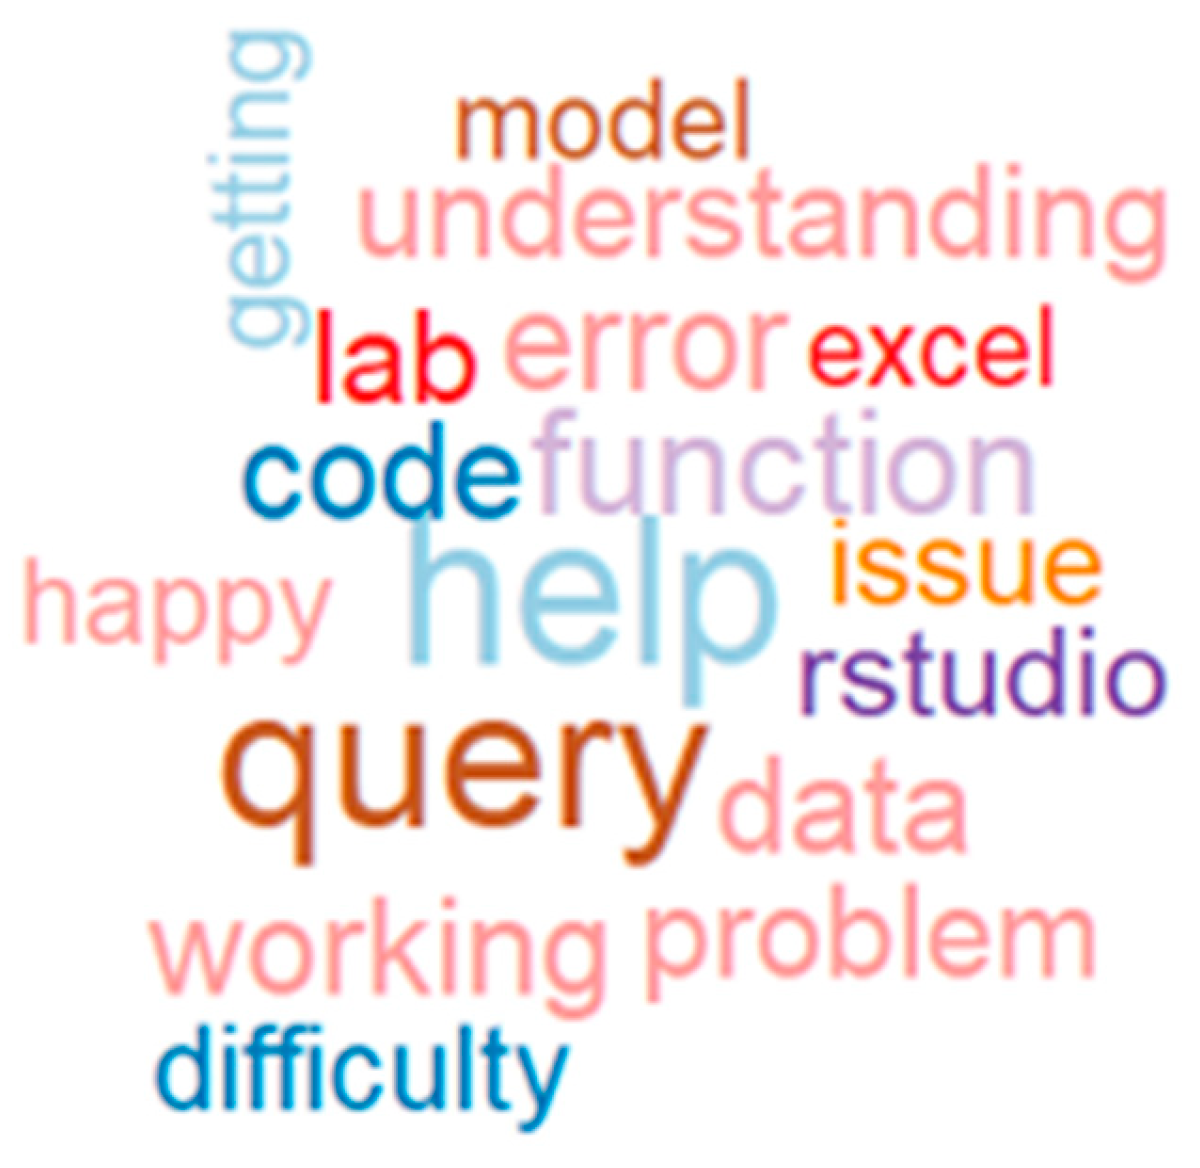
Table 1.
Topics, Lessons & descriptions of the original URJC categories.
| Topic | Lesson | Description |
|---|---|---|
| I. Descriptive Statistic | Lesson 1: Data Description | Basic Concepts. Variable Types. Summary of Graphical Data. Summary of Numerical Data. |
|
Lesson 2: Bivariate Data Description |
Summary of Bivariate Data. Covariance, Correlation. Regression Line. |
|
| II. Probability | Lesson 3: Probability | Random Success. Probability Definition and Intepretation. Conditional Probability. Success Independent. Law of total Probability and Bayes’ Theorem) |
| Lesson 4: Random Variables. Special Random Variables |
Random Variable Definition. Types of Variables. Probability Mass Function & Density Function. Distribution Function. Expectancy and Variance. Some Distributions. |
|
| III. Statistic Inference | Lesson 5: Statistic Inference | Introduction. Sampling. Definition of Statistical. Central Limit Theorem. Point Estimation and Intervals for Average, Proportions and Variances. Statistical Hypothesis Testing and Decision Making. |
Table 2.
Sample of UCD MSC data.
| Code | Name | Description | Time | Comment |
|---|---|---|---|---|
| STAT1xxxx | Basic Statistics | Basic Statistics | 23/02/2015 12:28:01 | Student was unsure of a formula for a small sample t test that involved getting the pooled sample standard deviation, after explaining what the pooled sample s.d was and giving them the formula they were happy to continue. The also wanted to know the difference between a two same t test and a two sample paired t test. I explained this using simple examples of datasets where it would be better to use one over the other |
| STAT2xxxx | Other | Other | 19/02/2015 14:36:00 | Student was doing a probability question relating to testing positive for a disease and having the disease. After showing how to draw a probability tree the student was able to finish the problem. |
| STAT2xxxx | Basic Probability | Basic Probability | 23/02/2015 15:00:00 | Explained the difference between a continuous and discrete random variable. How to find the cumulative distribution function by integrating the probability distribution function - did an example with the exponential distribution. |
| STAT1xxxx | Continuous distributions (normal, exponential, uniform) | Continuous distributions (normal, exponential, uniform) | 10:25.2 | Student Query: “sampling distributions” Student didn’t understand what a sampling distribution was |
Table 3.
Final Topics, Lessons & descriptions of the URJC categories.
| Topic | Lesson | Description |
|---|---|---|
| I. Descriptive Statistic | Lesson 1: Data Description | Basic Concepts. Variable Types. Summary of Graphical Data. Summary of Numerical Data. |
|
Lesson 2: Bivariate Data Description |
Summary of Bivariate Data. Covariance, Correlation. Regression Line. |
|
| II. Probability | Lesson 3: Probability | Random Success. Probability Definition and Intepretation. Conditional Probability. Success Independent. Law of Total Probability and Bayes’ Theorem) |
| Lesson 4: Random Variables. Special Random Variables |
Random Variable Definition. Types of Variables. Probability Mass Function & Density Function. Distribution Function. Expectancy and Variance. Some Distributions. |
|
| III. Statistic Inference | Lesson 5: Statistic Inference | Introduction. Sampling. Definition of Statistical. Central Limit Theorem. Point Estimation and Intervals for Average, Proportions and Variances. Statistical Hypothesis Testing and Decision Making. |
| IV. Software | Lesson 6: Statistic Software | Statistical Computing. R Programming Languages . |
| Other | Other | Comments with Limited Information, Students who work alone, etc. |
| High Level (Advanced Statistic) | High Level (Advanced Statistic) | Higher Courses, Content beyond that of Introductory or Service Level. |
| Module II | Lesson 3 & Lesson 4 | See Descriptions for Lesson 3 & Lesson 4. |
| Module I & Module II & Module III | Lesson 1 & Lesson 2 & Lesson 3 & Lesson 4 & Lesson 5 | See Descriptions for All Lessons (except Lesson 6). |
Disclaimer/Publisher’s Note: The statements, opinions and data contained in all publications are solely those of the individual author(s) and contributor(s) and not of MDPI and/or the editor(s). MDPI and/or the editor(s) disclaim responsibility for any injury to people or property resulting from any ideas, methods, instructions or products referred to in the content. |
© 2024 by the authors. Licensee MDPI, Basel, Switzerland. This article is an open access article distributed under the terms and conditions of the Creative Commons Attribution (CC BY) license (http://creativecommons.org/licenses/by/4.0/).
Copyright: This open access article is published under a Creative Commons CC BY 4.0 license, which permit the free download, distribution, and reuse, provided that the author and preprint are cited in any reuse.


