1. Introduction
Criegee intermediates (CIs) are highly reactive zwitterionic species [
1] that play a crucial role in atmospheric chemistry. These intermediates are primarily formed during the ozonolysis of alkenes [
2] and contribute significantly to atmospheric oxidation processes, including reactions with volatile organic compounds (VOCs), nitrogen oxides (NO
x), and sulfur dioxide (SO
2).[
3,
4,
5] Their high reactivity makes them key participants in secondary organic aerosol (SOA) formation [
6,
7] and radical chemistry.[
8,
9,
10] In addition, CIs have attracted interest in synthetic chemistry because they can promote oxidation reactions under relatively mild conditions. While the reactivity of Criegee intermediates has been extensively investigated with common atmospheric molecules such as water and carbonyl compounds,[
11,
12,
13,
14] the chemistry of halogenated CIs has received comparatively less attention.
Halogenated CIs may be generated from the ozonolysis of halogenated alkenes of anthropogenic origin,[
15] such as those emitted from industrial activities in the petrochemical, semiconductor, and refrigerant sectors.[
16] In these industries, chlorinated and fluorinated alkenes (haloalkenes) such as chloroethylene (CH
2=CHCl), tetrachloroethylene (CCl
2=CCl
2), fluoroethylene (CH
2=CHF), tetrafluoroethylene (CF
2=CF
2), and hydrofluoroolefins (HFOs; e.g., HFO-1234yf and HFO-1234ze) are widely used as monomers, solvents, or working fluids.[
17,
18,
19,
20,
21,
22,
23] Their ozonolysis can generate a variety of halogenated Criegee intermediates—including CHClOO, CCl
2OO, CHFOO, CF
2OO, and CF
3CHOO—that exhibit distinct electronic effects and substitution patterns. These structural features can markedly influence their reactivity toward atmospheric oxidants and thereby contribute to secondary pollution processes such as oxidant formation and aerosol generation.[
24,
25] Investigating halogenated CIs is thus essential for understanding the chemical impacts of industrial emissions and for assessing their broader environmental risks.[
26,
27,
28,
29,
30,
31,
32] Recent laboratory advances in producing and detecting Criegee intermediates [
33,
34,
35,
36] have made it possible to examine reactions of simple CIs with atmospheric molecules, motivating further theoretical investigations.
Alkanes, including methane, ethane, and higher hydrocarbons, are major components of natural gas and anthropogenic emissions.[
37,
38,
39,
40,
41,
42] Among them, methane and ethane are of particular concern owing to their high global warming potential.[
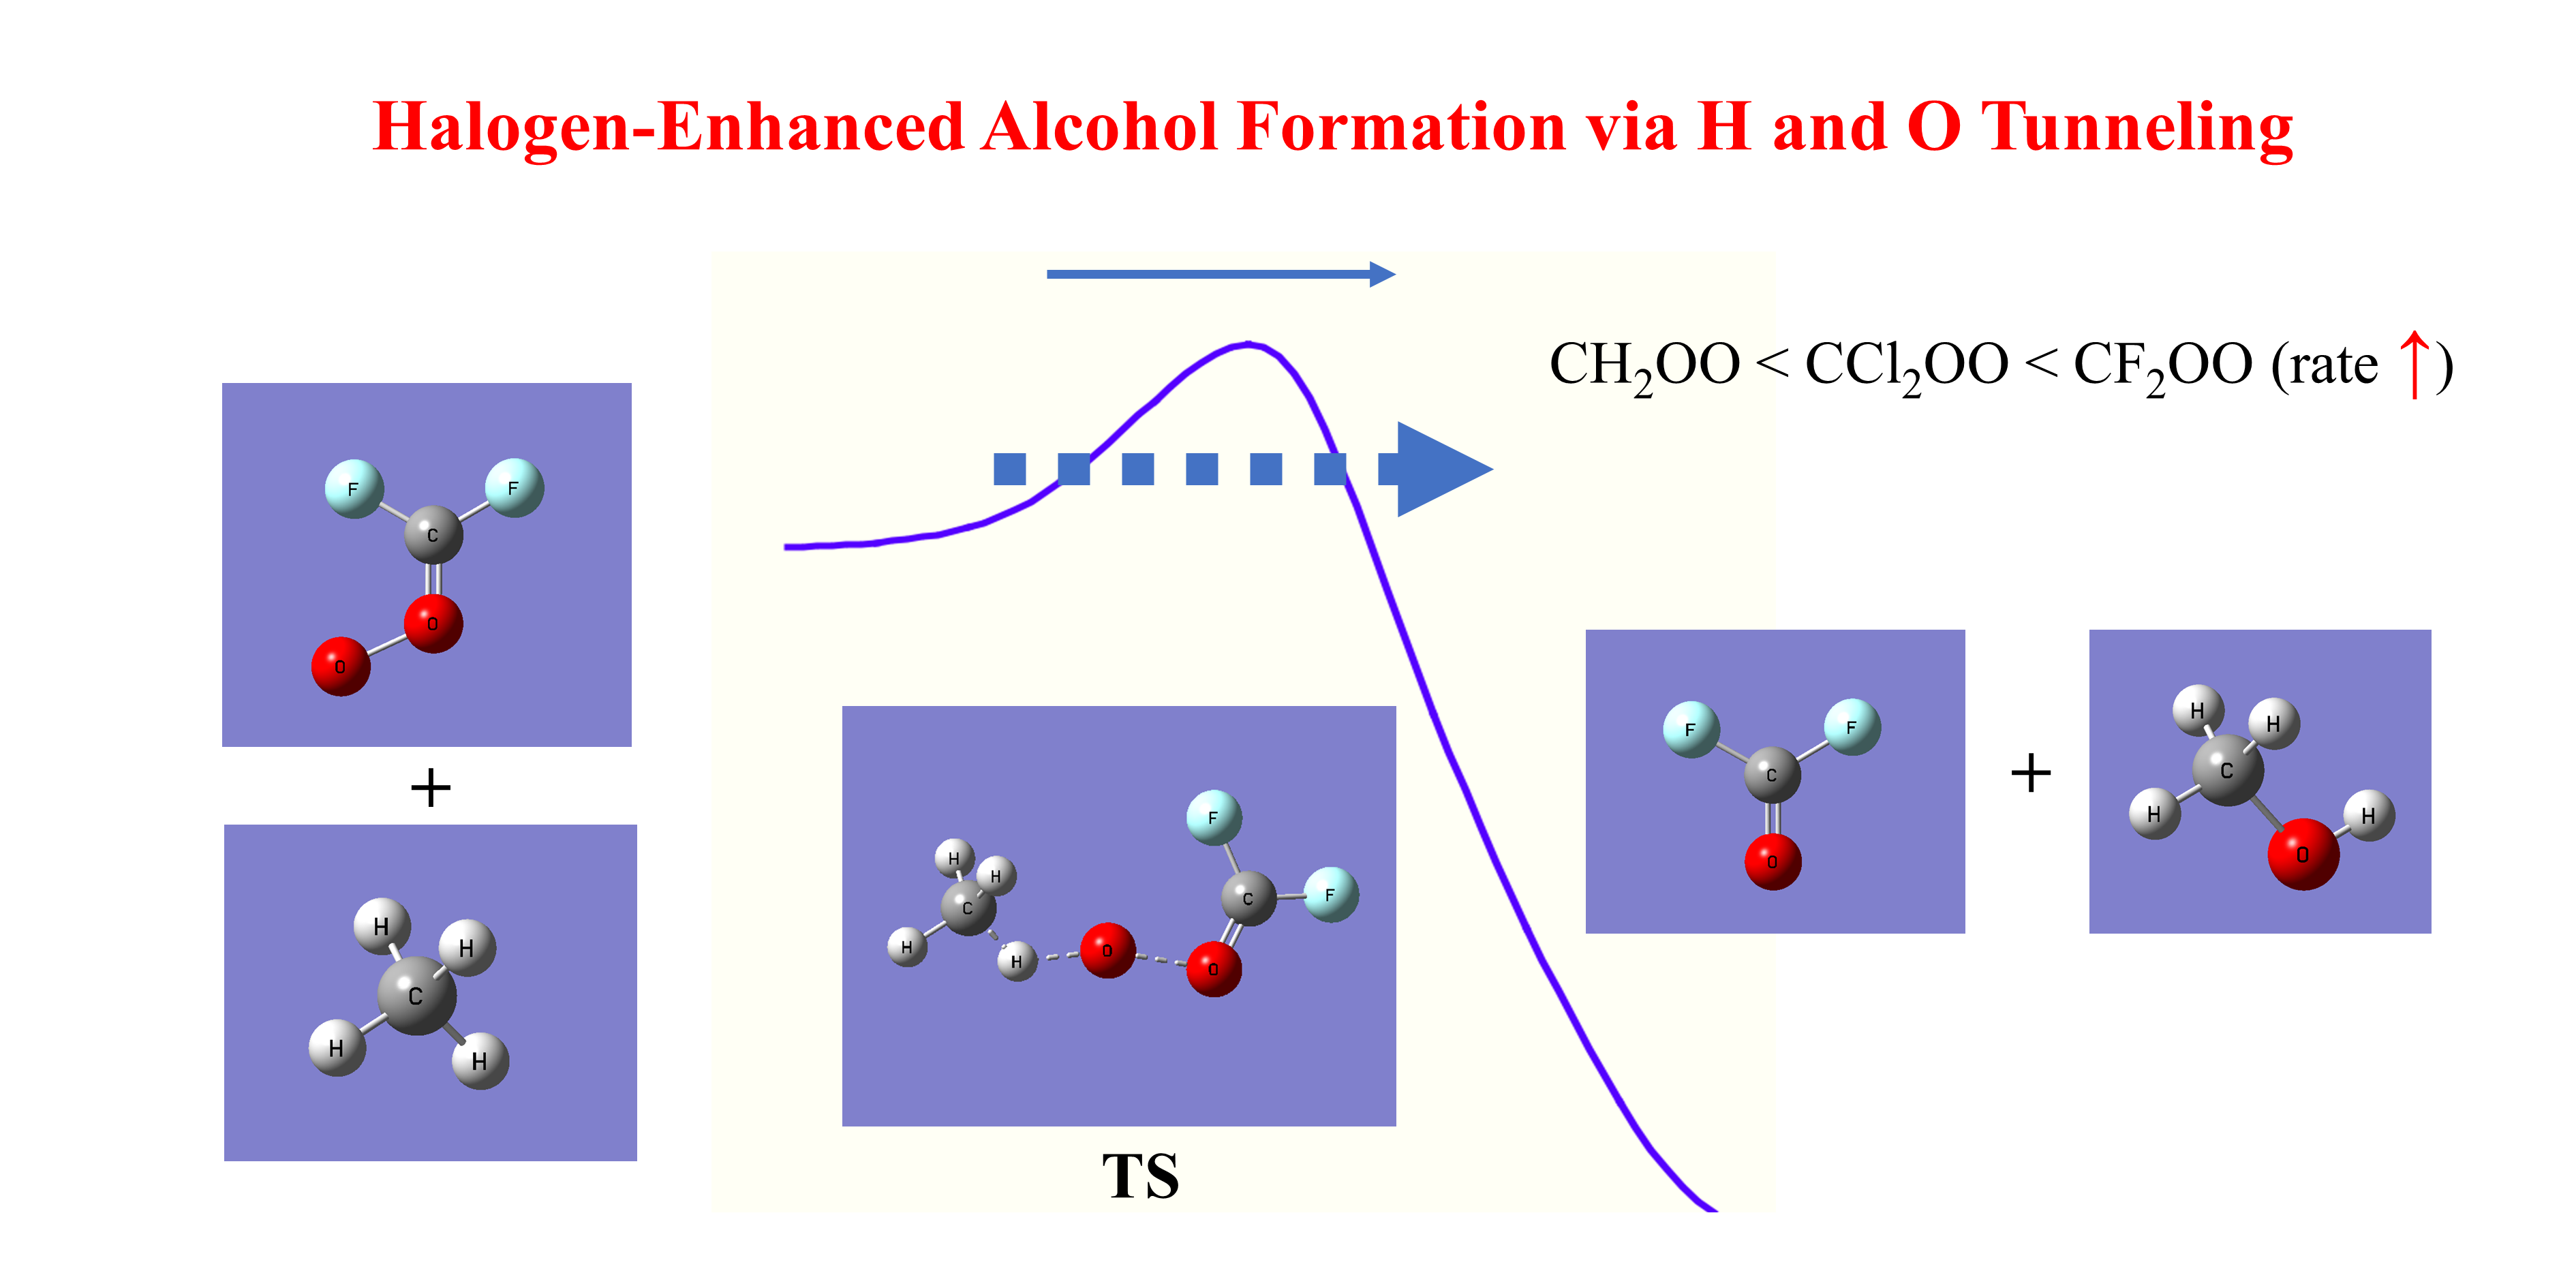
43] Reactions of CIs with methane and ethane offer possible atmospheric oxidation pathways that may affect the lifetimes of these alkanes as well as the formation of secondary oxidation products. Elucidating these reactions at the molecular level is therefore important for a more complete understanding of atmospheric oxidation chemistry. Furthermore, reactions between CIs and alkanes may contribute to the formation of alcohols in the atmosphere.
Beyond their atmospheric relevance, such CI alkane reactions also suggest a potential green-chemistry route for producing methanol and ethanol—key platform chemicals used as fuels, industrial solvents, and feed–stocks for chemical synthesis. Conventional industrial methods for methanol production, such as syngas conversion,[
44] typically require high temperatures and pressures, resulting in substantial energy consumption and associated carbon emissions. Similarly, ethanol is mainly produced via fermentation [
45] or ethylene hydration,[
46] both of which present environmental and energy-related limitations. CI-mediated oxidation of alkanes may thus offer an alternative pathway to alcohols under near-ambient conditions, potentially reducing both the carbon footprint and reliance on traditional fossil-based processes.
The reactions between the simplest CI, formaldehyde oxide (CH
2OO), and simple alkanes have been investigated by Xu
et al.[
47] using electronic structure calculations combined with conventional transition state theory (TST). Their results revealed substantial barrier reductions for reactions involving halogenated CIs. However, for reactions that involve significant hydrogen motion along the reaction coordinate, tunneling effects must be taken into account,[
48,
49] especially when the reaction barriers are appreciable. Moreover, the alcohol-forming reactions considered here also involve transfer (or insertion) of oxygen atoms, so oxygen tunneling [
50] may further enhance the reaction rate constants at lower temperatures.
In the present study, we apply dual-level variational transition state theory [
51,
52,
53] with multidimensional tunneling [
54,
55,
56] (VTST/MT) to investigate the rate constants of the alcohol-forming reactions of formaldehyde oxide and halogenated formaldehyde oxides (CF
2OO and CCl
2OO) with methane and ethane over the temperature range of 100–600 K. Kinetic isotope effects (KIEs) are powerful probes of reaction mechanisms and tunneling contributions.[
57,
58] Accordingly, we calculate and analyze both deuterium KIEs, using deuterated alkanes, and
18O KIEs arising from isotopically substituted formaldehyde oxide.
2. Computational Details
Geometry optimizations and harmonic vibrational frequency calculations for all reactants, products, and transition states were carried out using the MP2[
59] theory with the aug-cc-pVDZ basis set.[
60,
61] Single-point energies at these stationary points were computed using CCSD(T)/aug-cc-pV
nZ (
n = T, Q), followed by extrapolation to the complete basis set (CBS) limit. [
62,
63,
64,
65] The CBS-extrapolated energies (by the two-point extrapolation formula of Helgaker
et al.[
62]) were used as the “high-level” energetic reference. The minimum-energy paths (MEPs), including geometries, energies, gradients, and Hessians, were calculated at the MP2/aug-cc-pVDZ level, which served as the “low-level” potential energy surface (PES). Step sizes of 0.002 and 0.010 bohr were used for gradient and Hessian stepping, respectively, in mass-scaled coordinates using the Page–McIver algorithm [
66,
67] with a scaling mass of 1 amu. Cartesian coordinates and the harmonic approximation were used to compute vibrational frequencies and zero-point energies of the generalized transition states along each MEP.
To balance accuracy and efficiency, bimolecular rate constants were calculated using a dual-level variational transition state theory approach based on the Seckart interpolation scheme.[
68,
69,
70] In this method, molecular geometry, vibrational properties, and reaction-path curvature are obtained from the low-level PES, while the energetics along the reaction path are corrected using the high-level energies at the reactants, transition states, and products. Energy values between stationary points are interpolated using the differences between low- and high-level data to produce a smooth corrected PES. This protocol preserves the reliable low-level description of the reaction coordinate while incorporating high-accuracy barrier heights and reaction energies, which is especially important when tunneling plays a major role.
Canonical variational transition state theory (CVT)[
71] was employed to locate the optimal free-energy bottleneck at each temperature. Quantum tunneling effects were accounted for using the microcanonical optimized multidimensional tunneling (μOMT) method,[
72] which selects the dominant tunneling contribution from both small-curvature tunneling (SCT)[
73] and large-curvature tunneling (LCT)[
74] (restricted to the vibrational ground state) at each energy grid.
Electronic structure calculations were performed using Gaussian [
16,
75] while VTST/MT rate constant calculations were carried out using Polyrate 17[
76] in combination with Gaussrate 17-B [
77] program.
3. Results and Discussion
3.1. Structures and Energetics
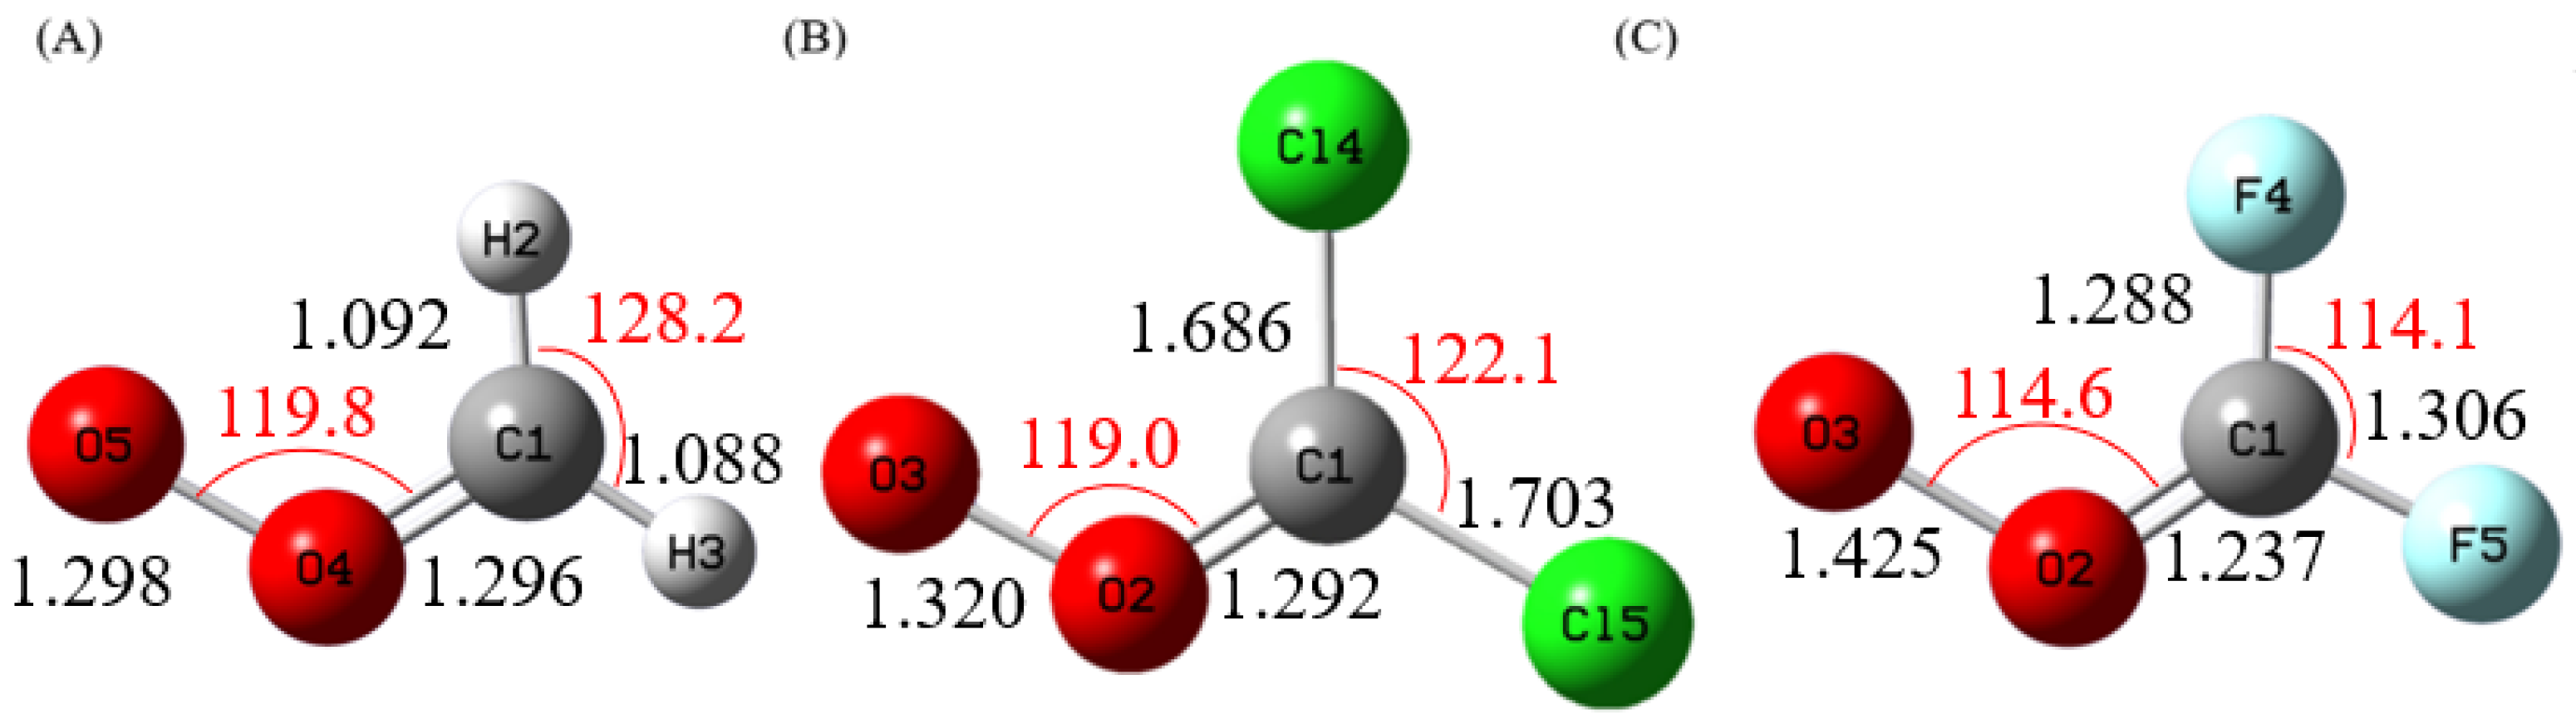
Figure 1 shows the optimized geometries of the Criegee intermediates CH
2OO, CCl
2OO, and CF
2OO, whereas
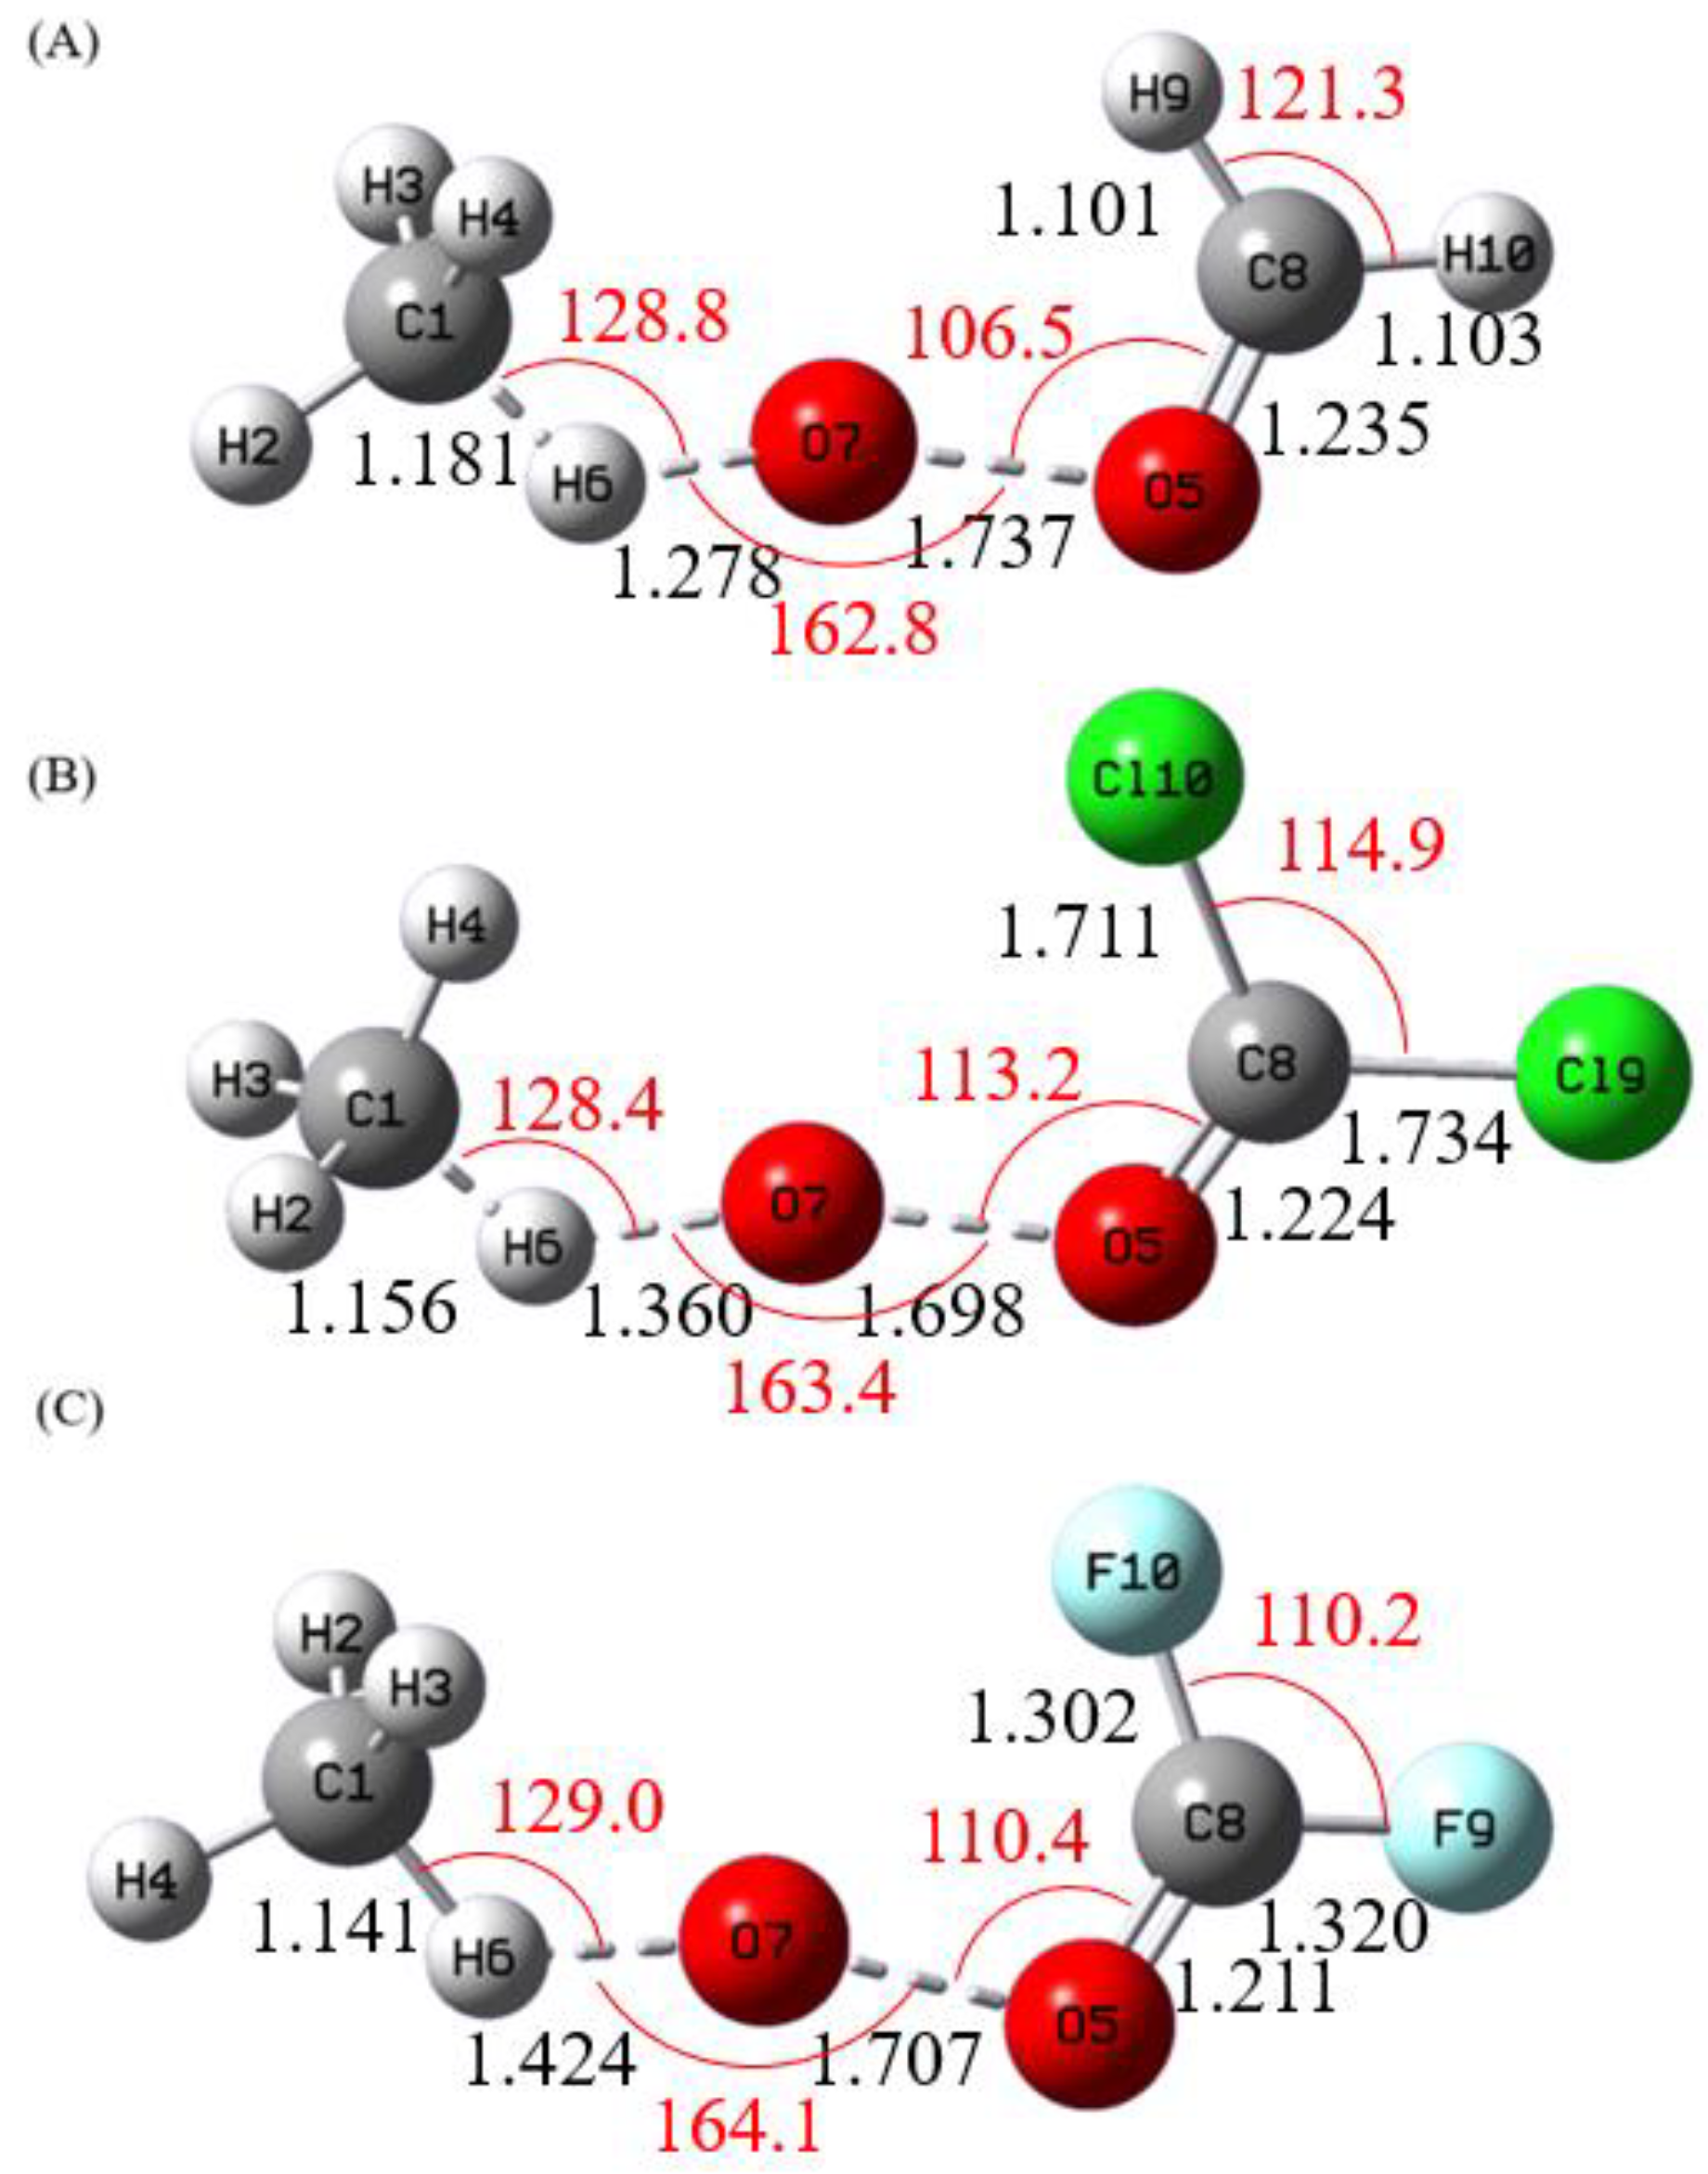
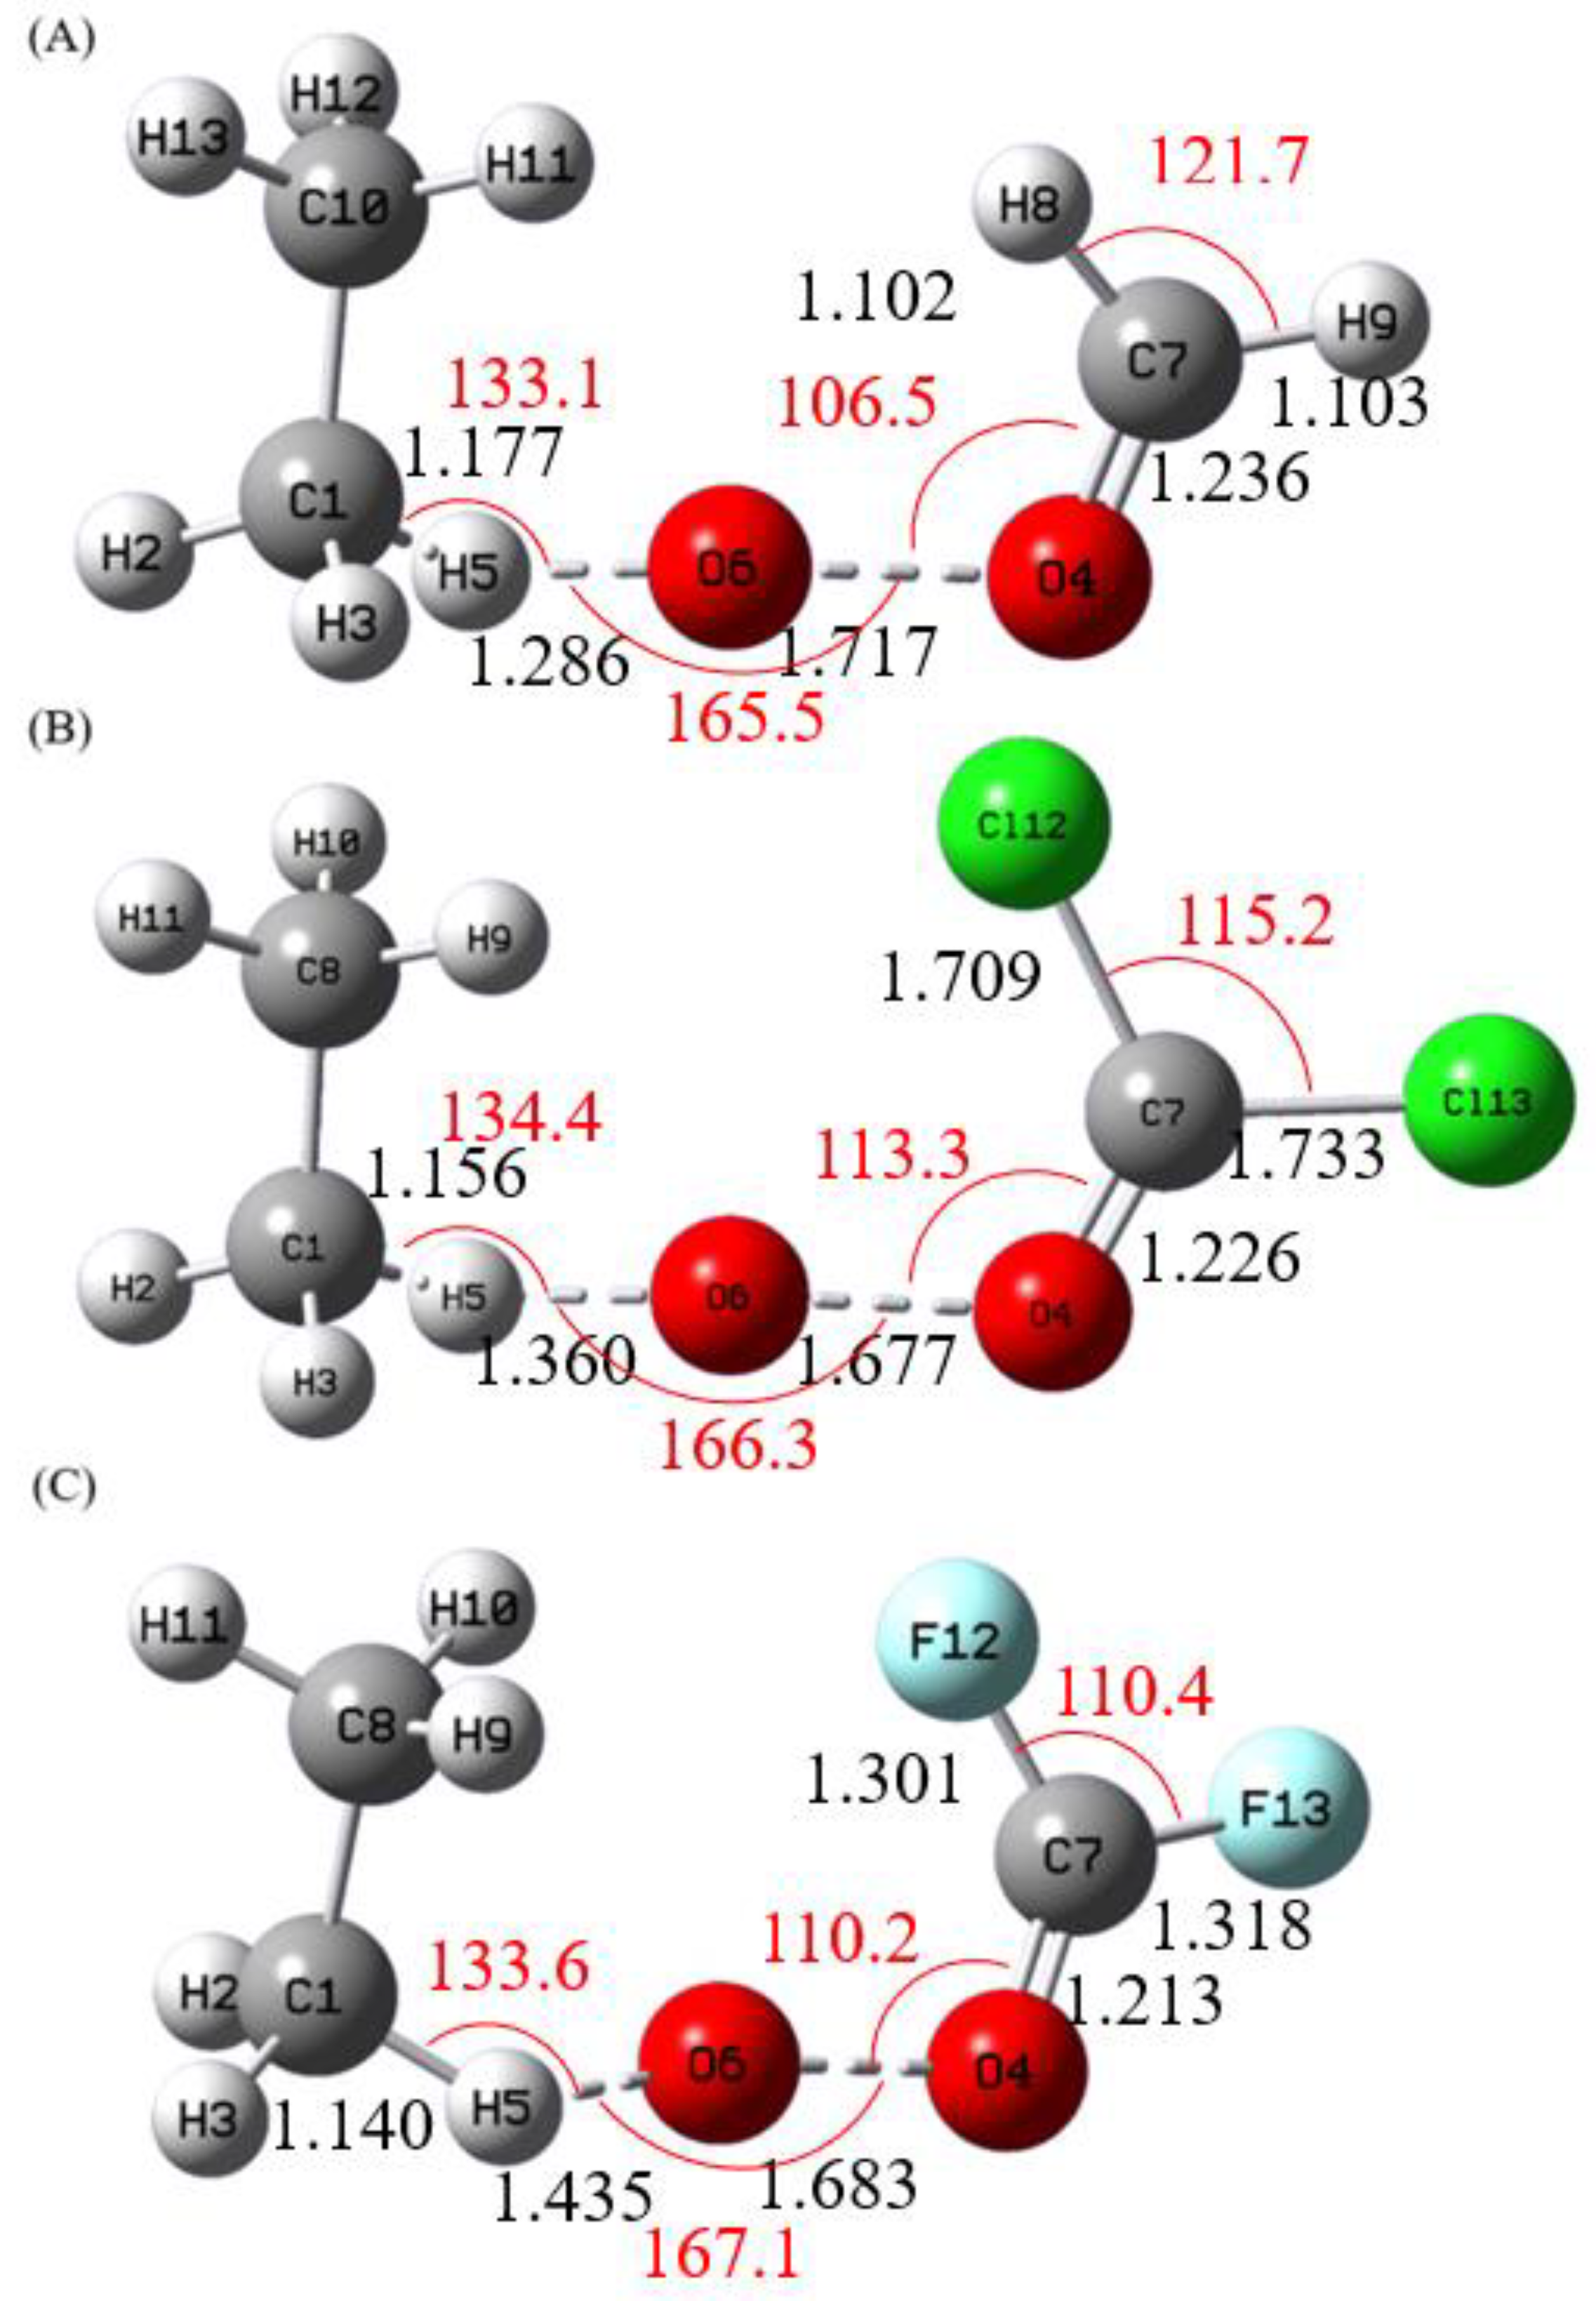
Figure 2 and
Figure 3 depict the alcohol-forming transition states for their reactions with methane and ethane, respectively. All transition states exhibit incipient C–H bond cleavage in the alkane and partial O–O bond breaking in the Criegee species. Intrinsic reaction coordinate (IRC) calculations confirm a concerted but highly asynchronous insertion mechanism: immediately after the transition state, an O–H bond is formed, followed by the attachment of the newly formed OH group to the carbon atom from which hydrogen was abstracted. These computed structures show good agreement with previous studies.[
47,
78,
79] Additional optimized structures are provided in the
Supplementary Materials.
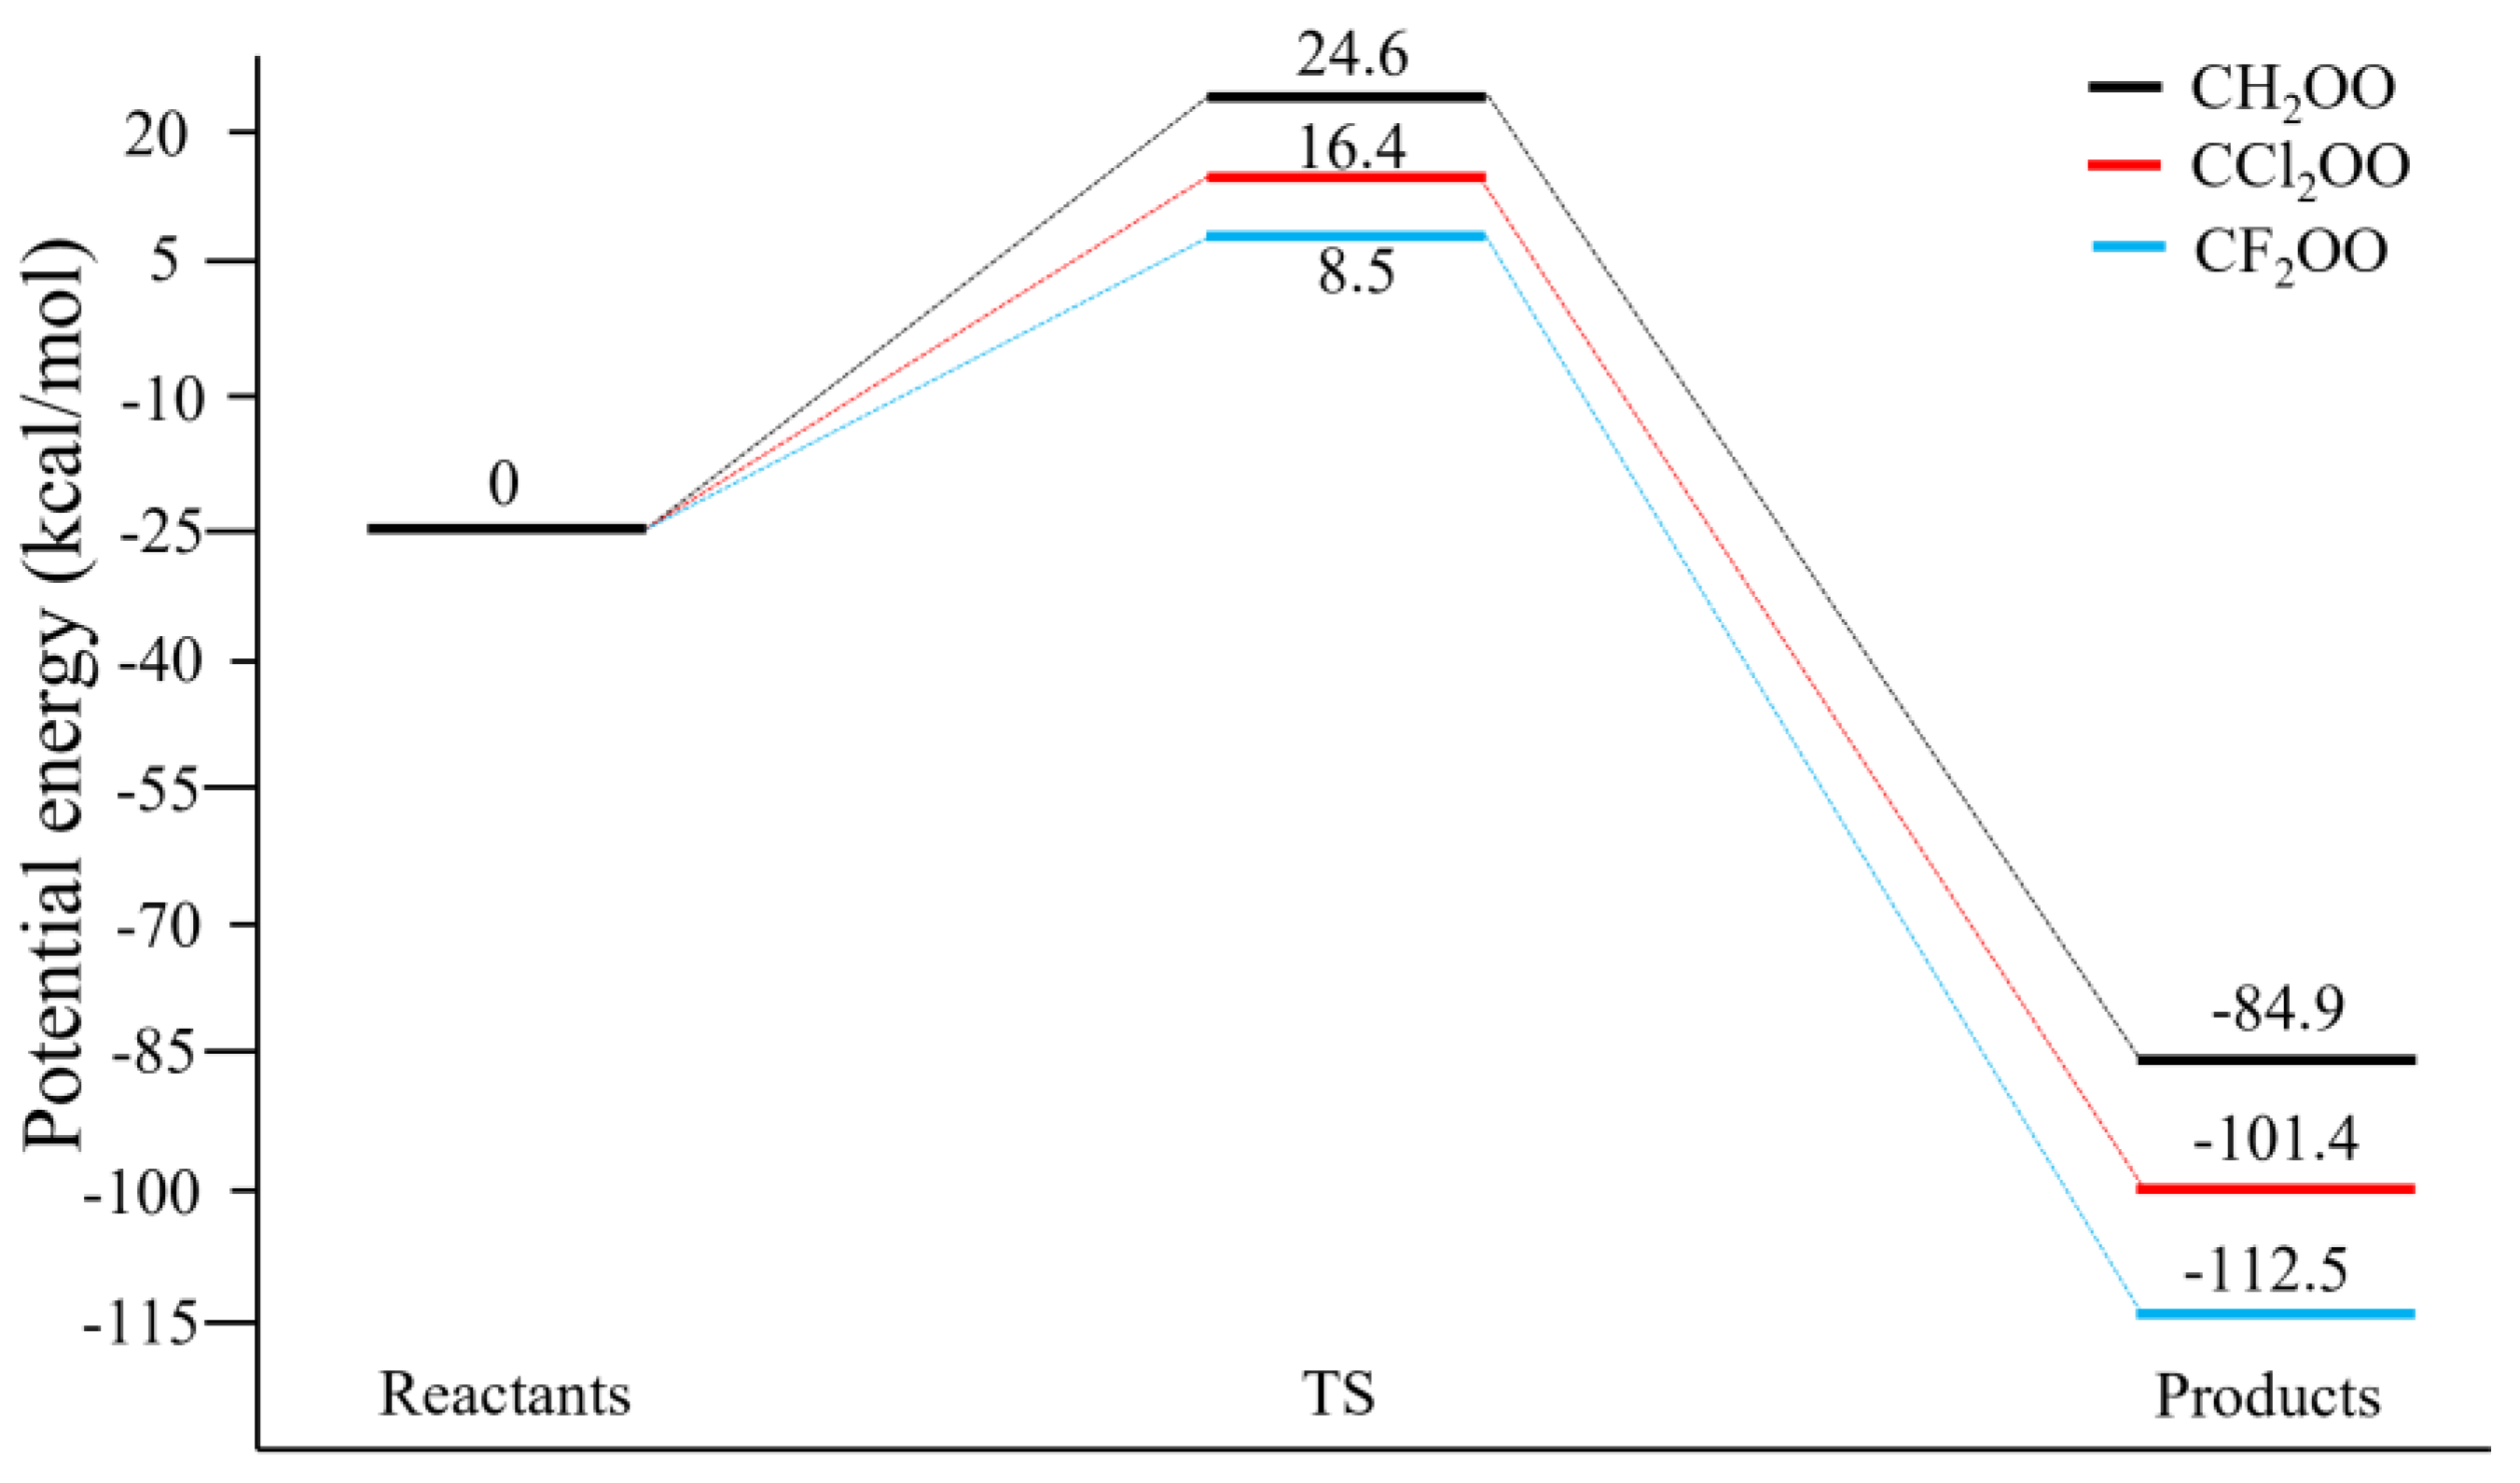
The reaction energy profiles are presented in
Figure 4 and
Figure 5 for the methane and ethane reactions, respectively. For CH
2OO + CH
4 (
Figure 4), the Born–Oppenheimer barrier heights are 24.6, 16.4, and 8.5 kcal/mol for CH
2OO, CCl
2OO, and CF
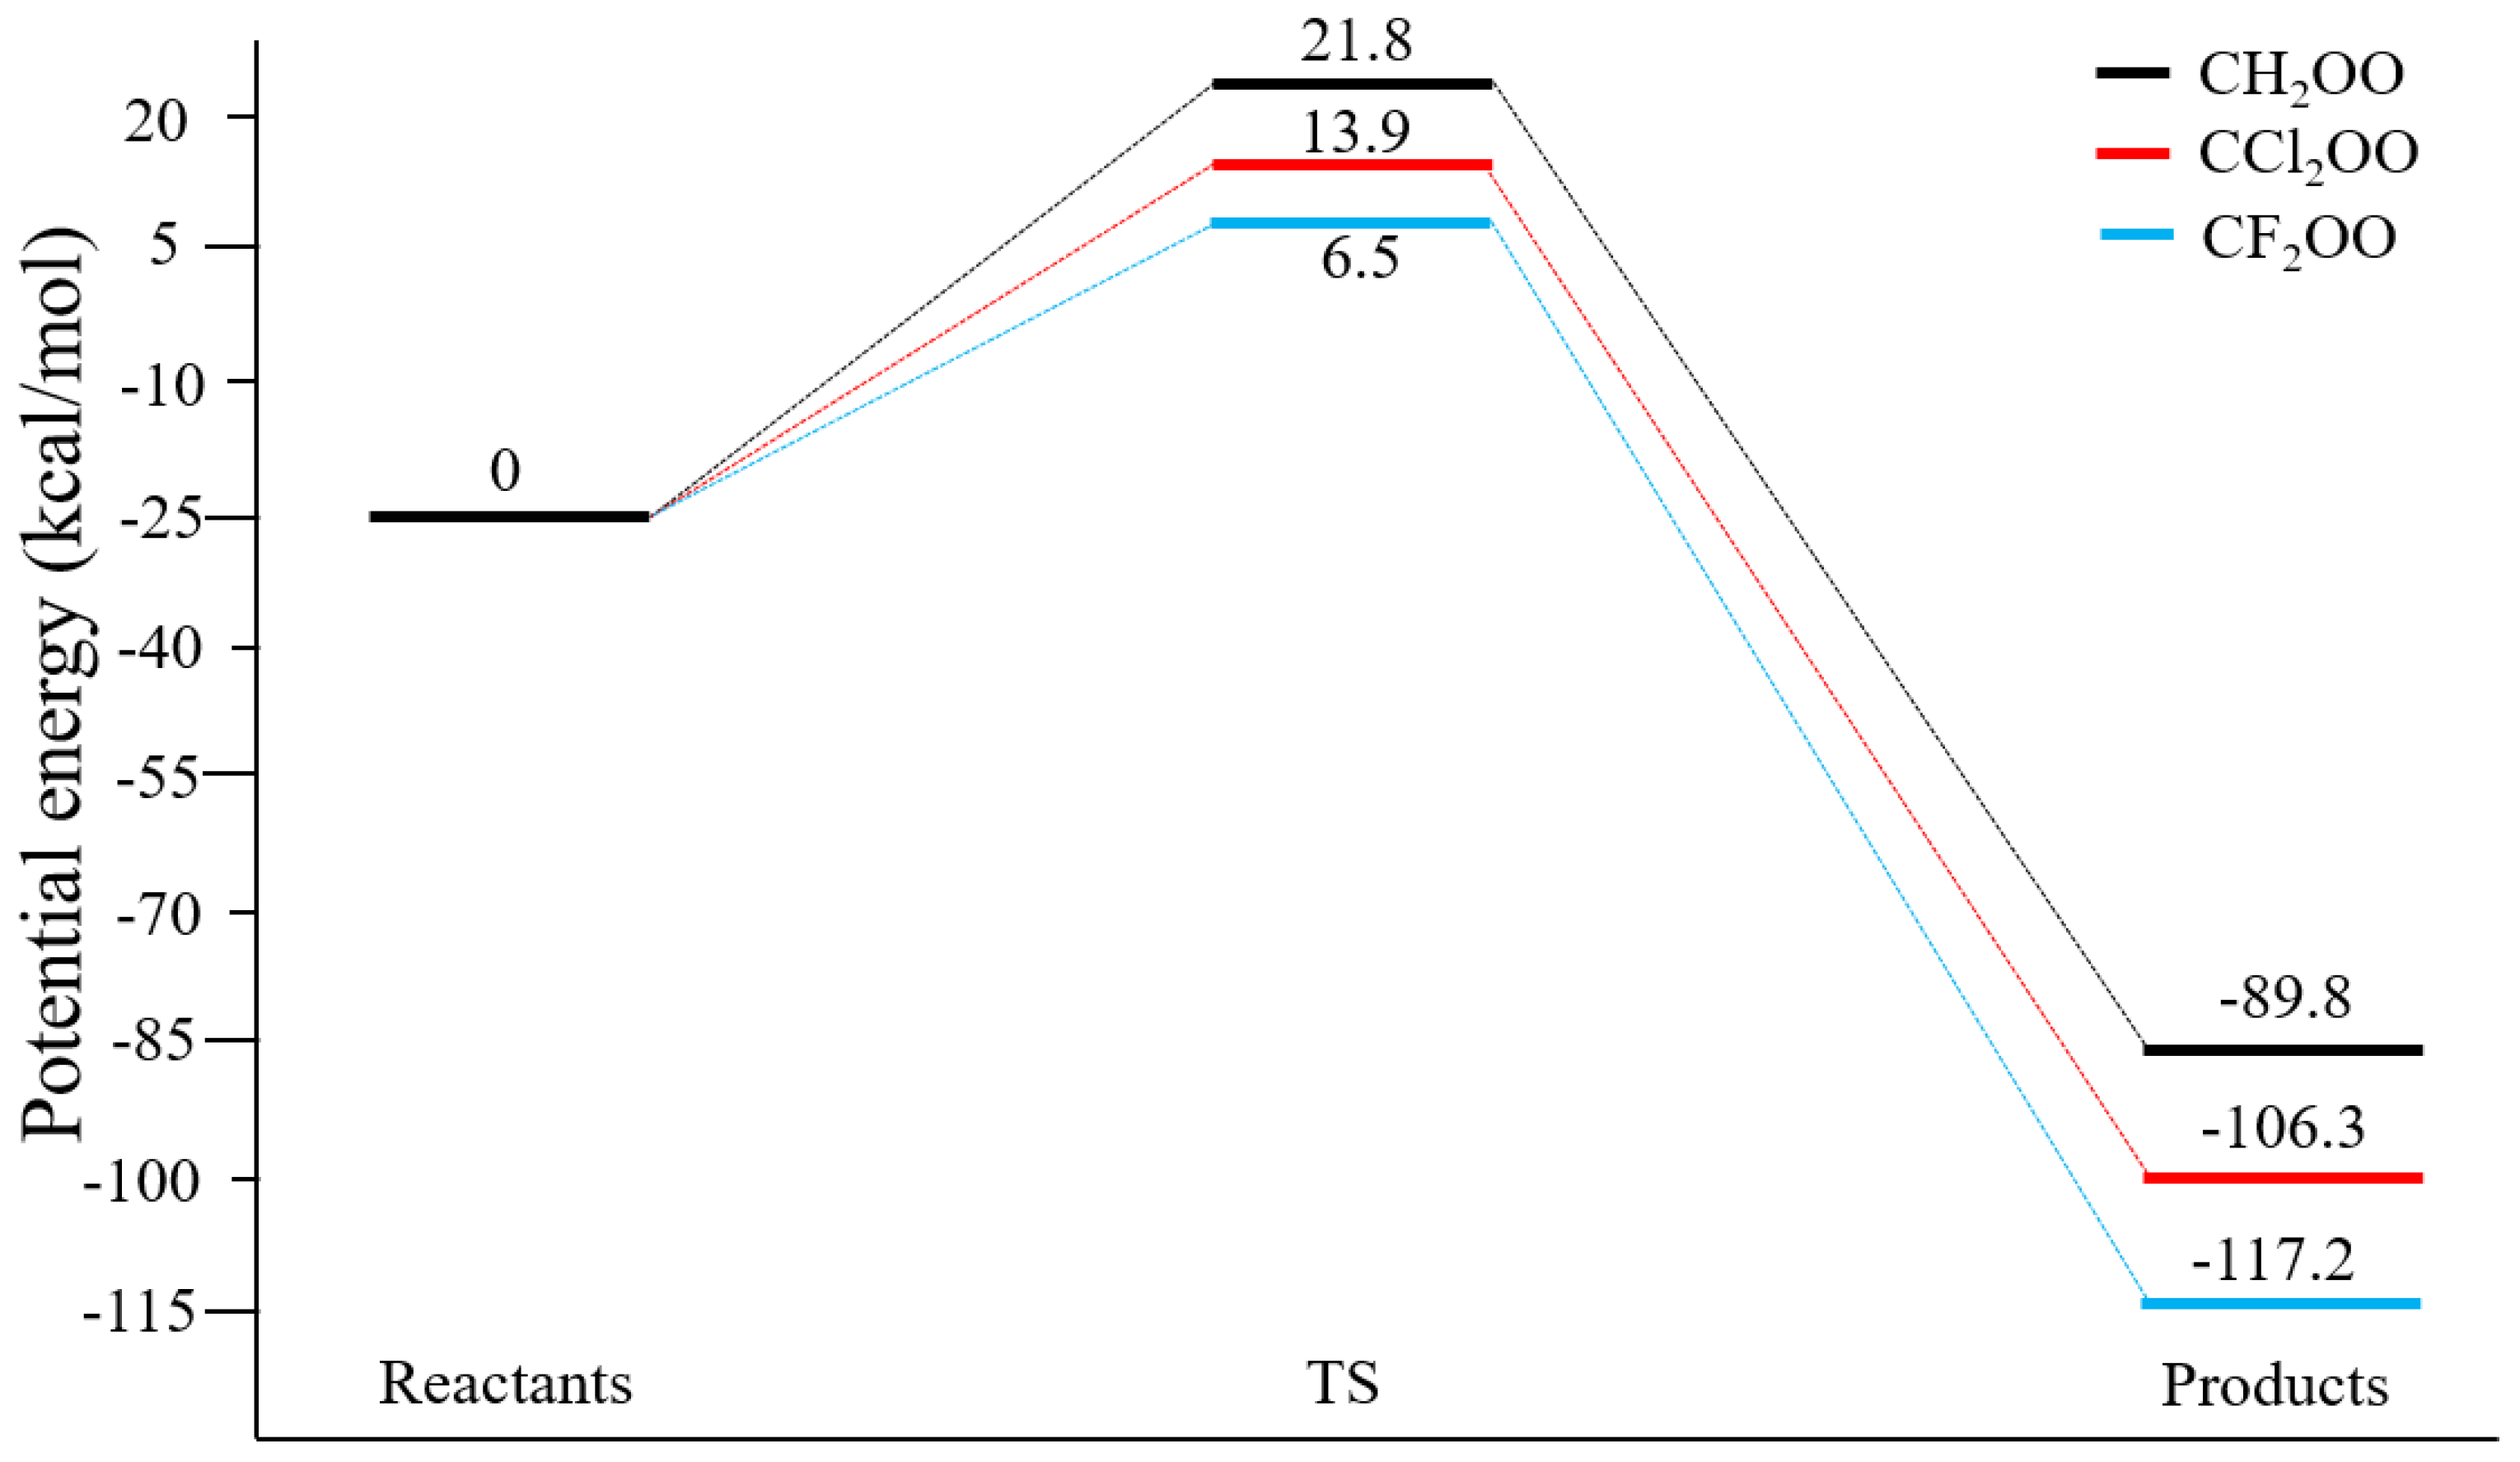
2OO, respectively, with corresponding reaction energies of −84.9, −101.4, and −112.5 kcal/mol. Thus, halogen substitution substantially lowers the barrier and increases the reaction exothermicity. The same trend is observed for the ethane reactions (
Figure 5), where all barriers are 2–3 kcal/mol lower than those for methane. The barrier for CF
2OO + C
2H
6 is as small as 6.5 kcal mol
−1. The current barrier heights are 2–5 kcal/mol higher than those reported by Xu
et al.,[
47] who used lower-level electronic structure methods.
These energetic trends are consistent with structural changes induced by halogen substitution. As seen in
Figure 1, replacing H with Cl or F shortens the carbonyl C=O bond and weakens the peroxidic O–O bond. The O–O bond strengths were calculated to be 58.3, 41.8, and 30.9 kcal/mol for CH
2OO, CCl
2OO, and CF
2OO, respectively. The systematic weakening of the O–O bond directly accounts for the reduction in insertion barriers upon halogen substitution, consistent with the trend in calculated bond dissociation energies. The stronger product stabilization also contributes to increasingly exothermic reaction energies upon halogenation, reflecting the greater thermodynamic stability of CX
2O (X = H, Cl, F). Energetics for partially halogenated formaldehyde oxides show similar trends and are provided in the
Supplementary Materials.
3.2. Rate Constants of CH2OO + CH4
All rate constants discussed below are based on the dual-level VTST/MT calculations.
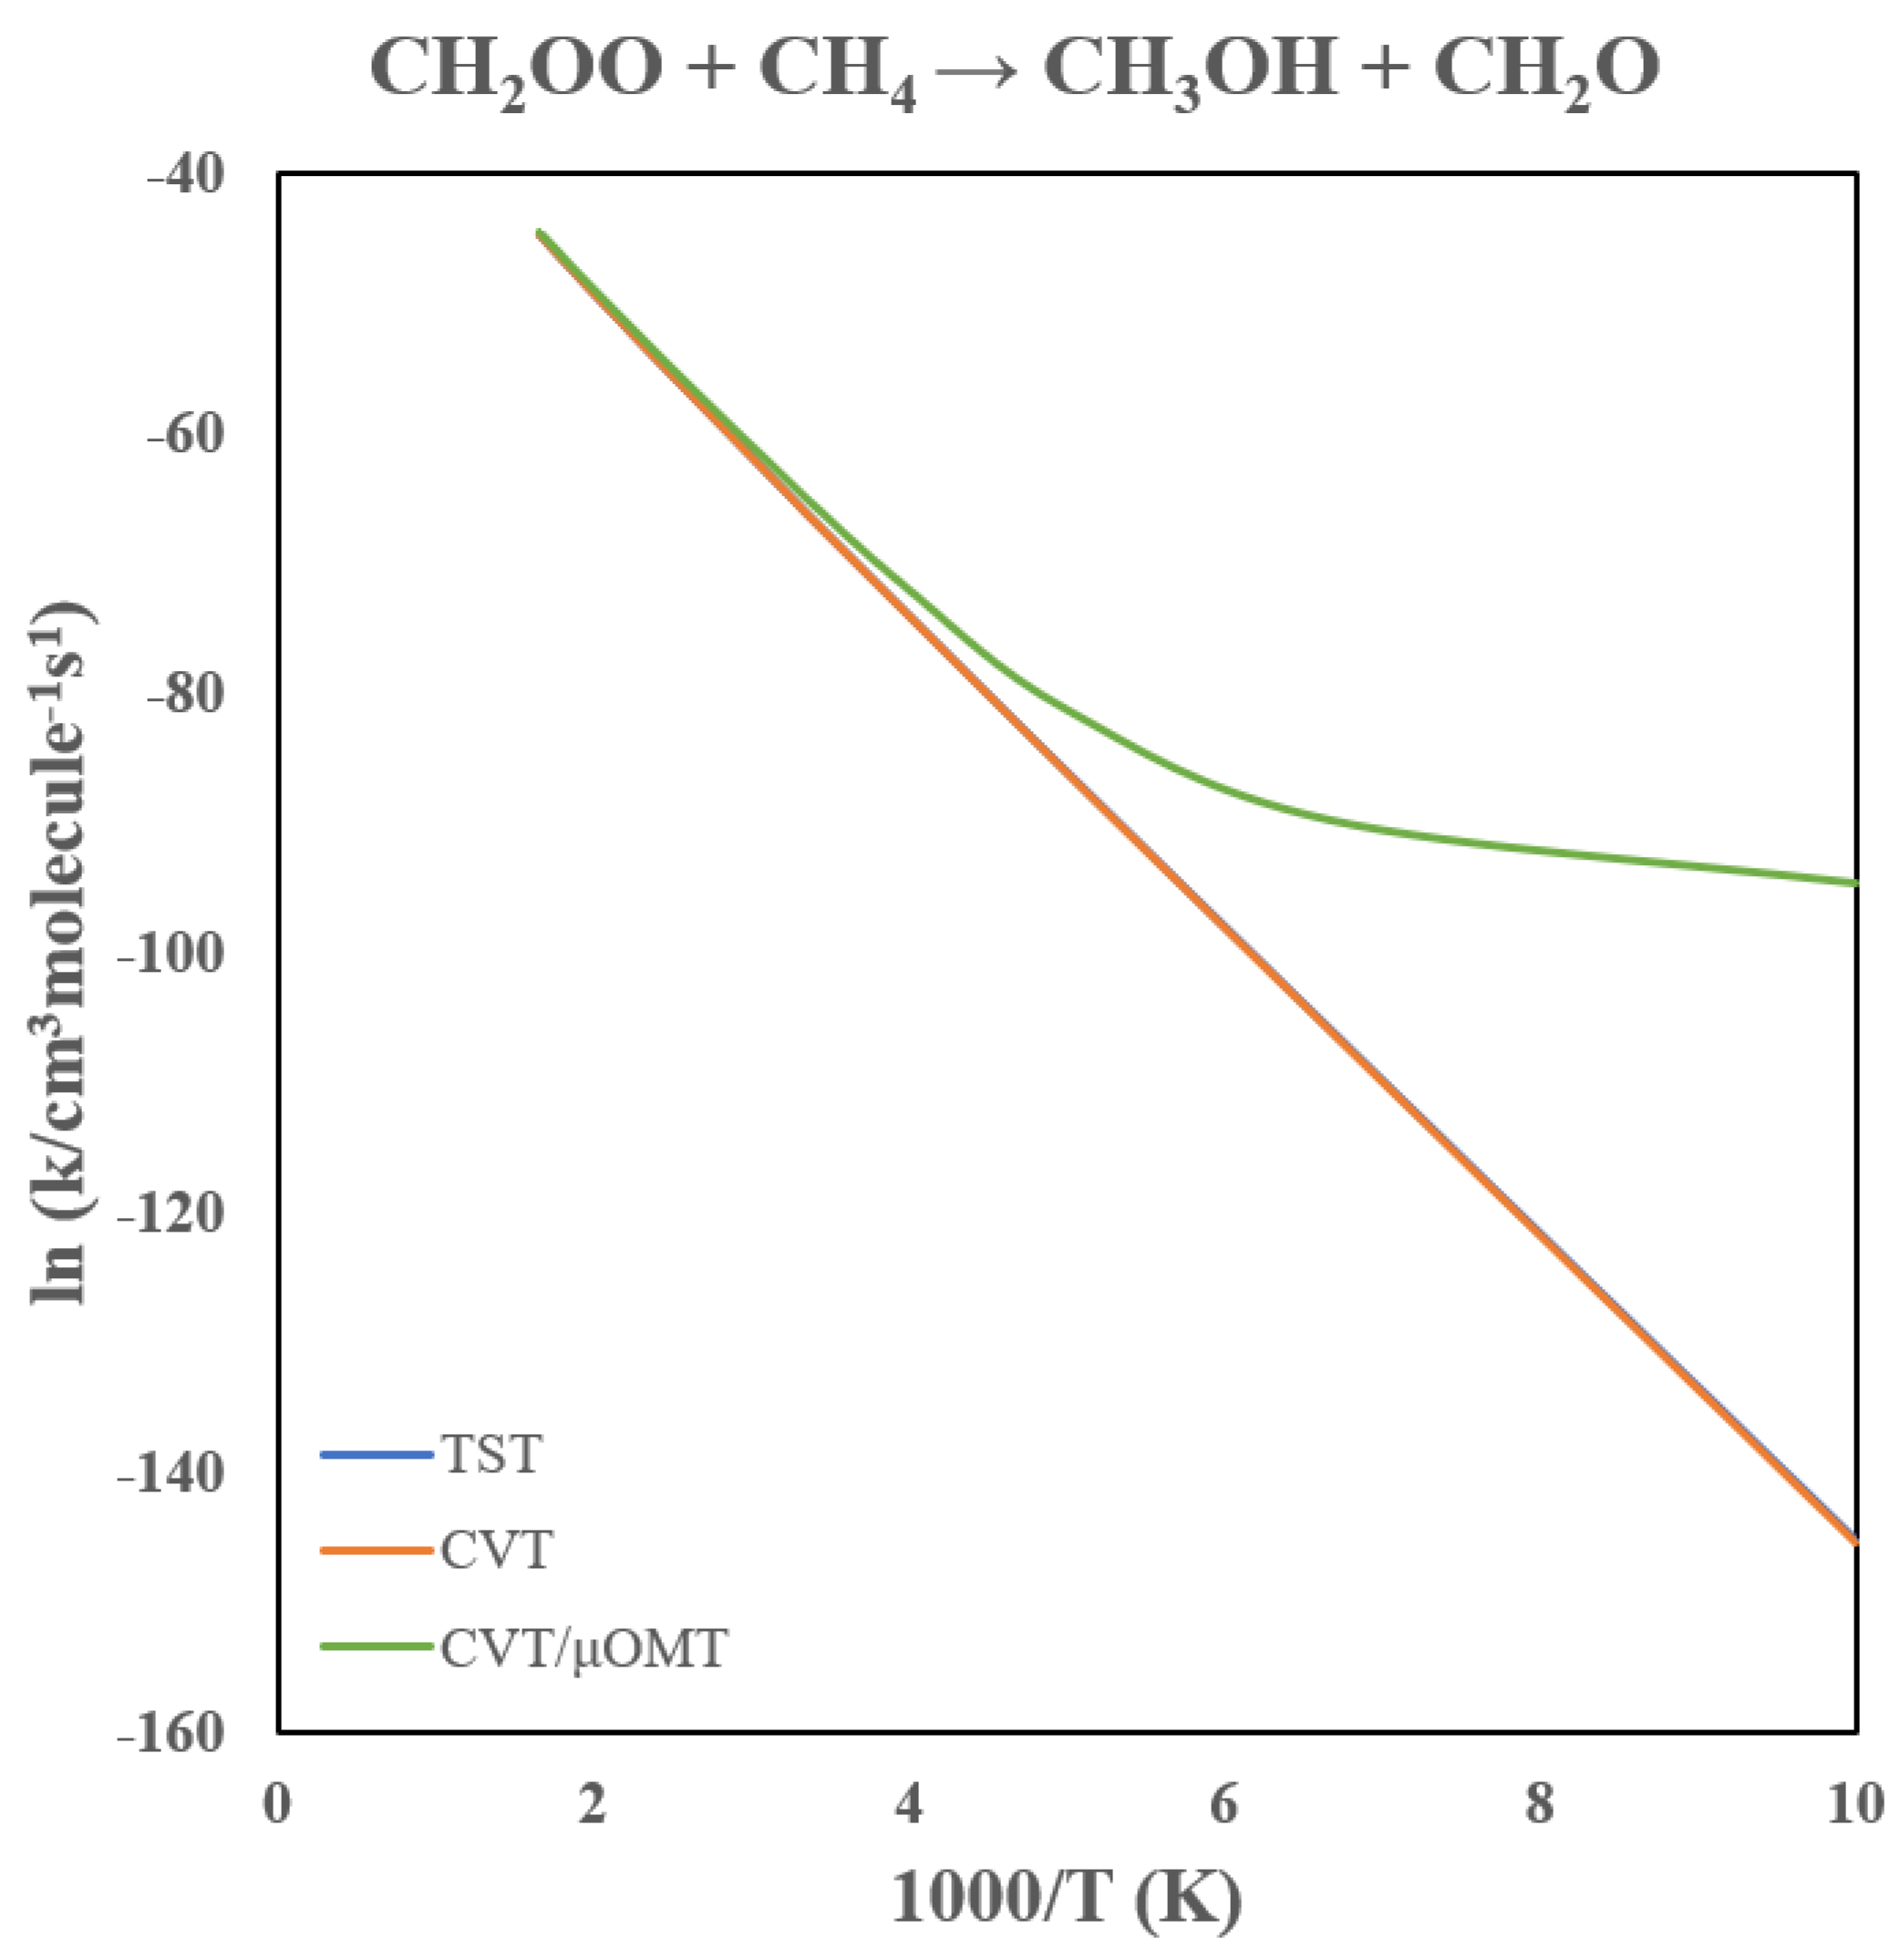
Table 1 lists the computed rate constants, and
Figure 6 shows the corresponding Arrhenius plot. Because this reaction has a relatively high barrier, the rate constant at 300 K is only on the order of 10
−29 cm
3 molecule
−1 s
−1. Despite the small magnitude, tunneling effects are substantial. At 300 K, tunneling enhances the CVT rate constant by a factor of about 3, and the enhancement reaches two orders of magnitude at 200 K. As seen in
Figure 6, the Arrhenius curve displays pronounced curvature below 250 K and becomes nearly temperature independent below ~150 K, characteristic of tunneling-dominated kinetics.
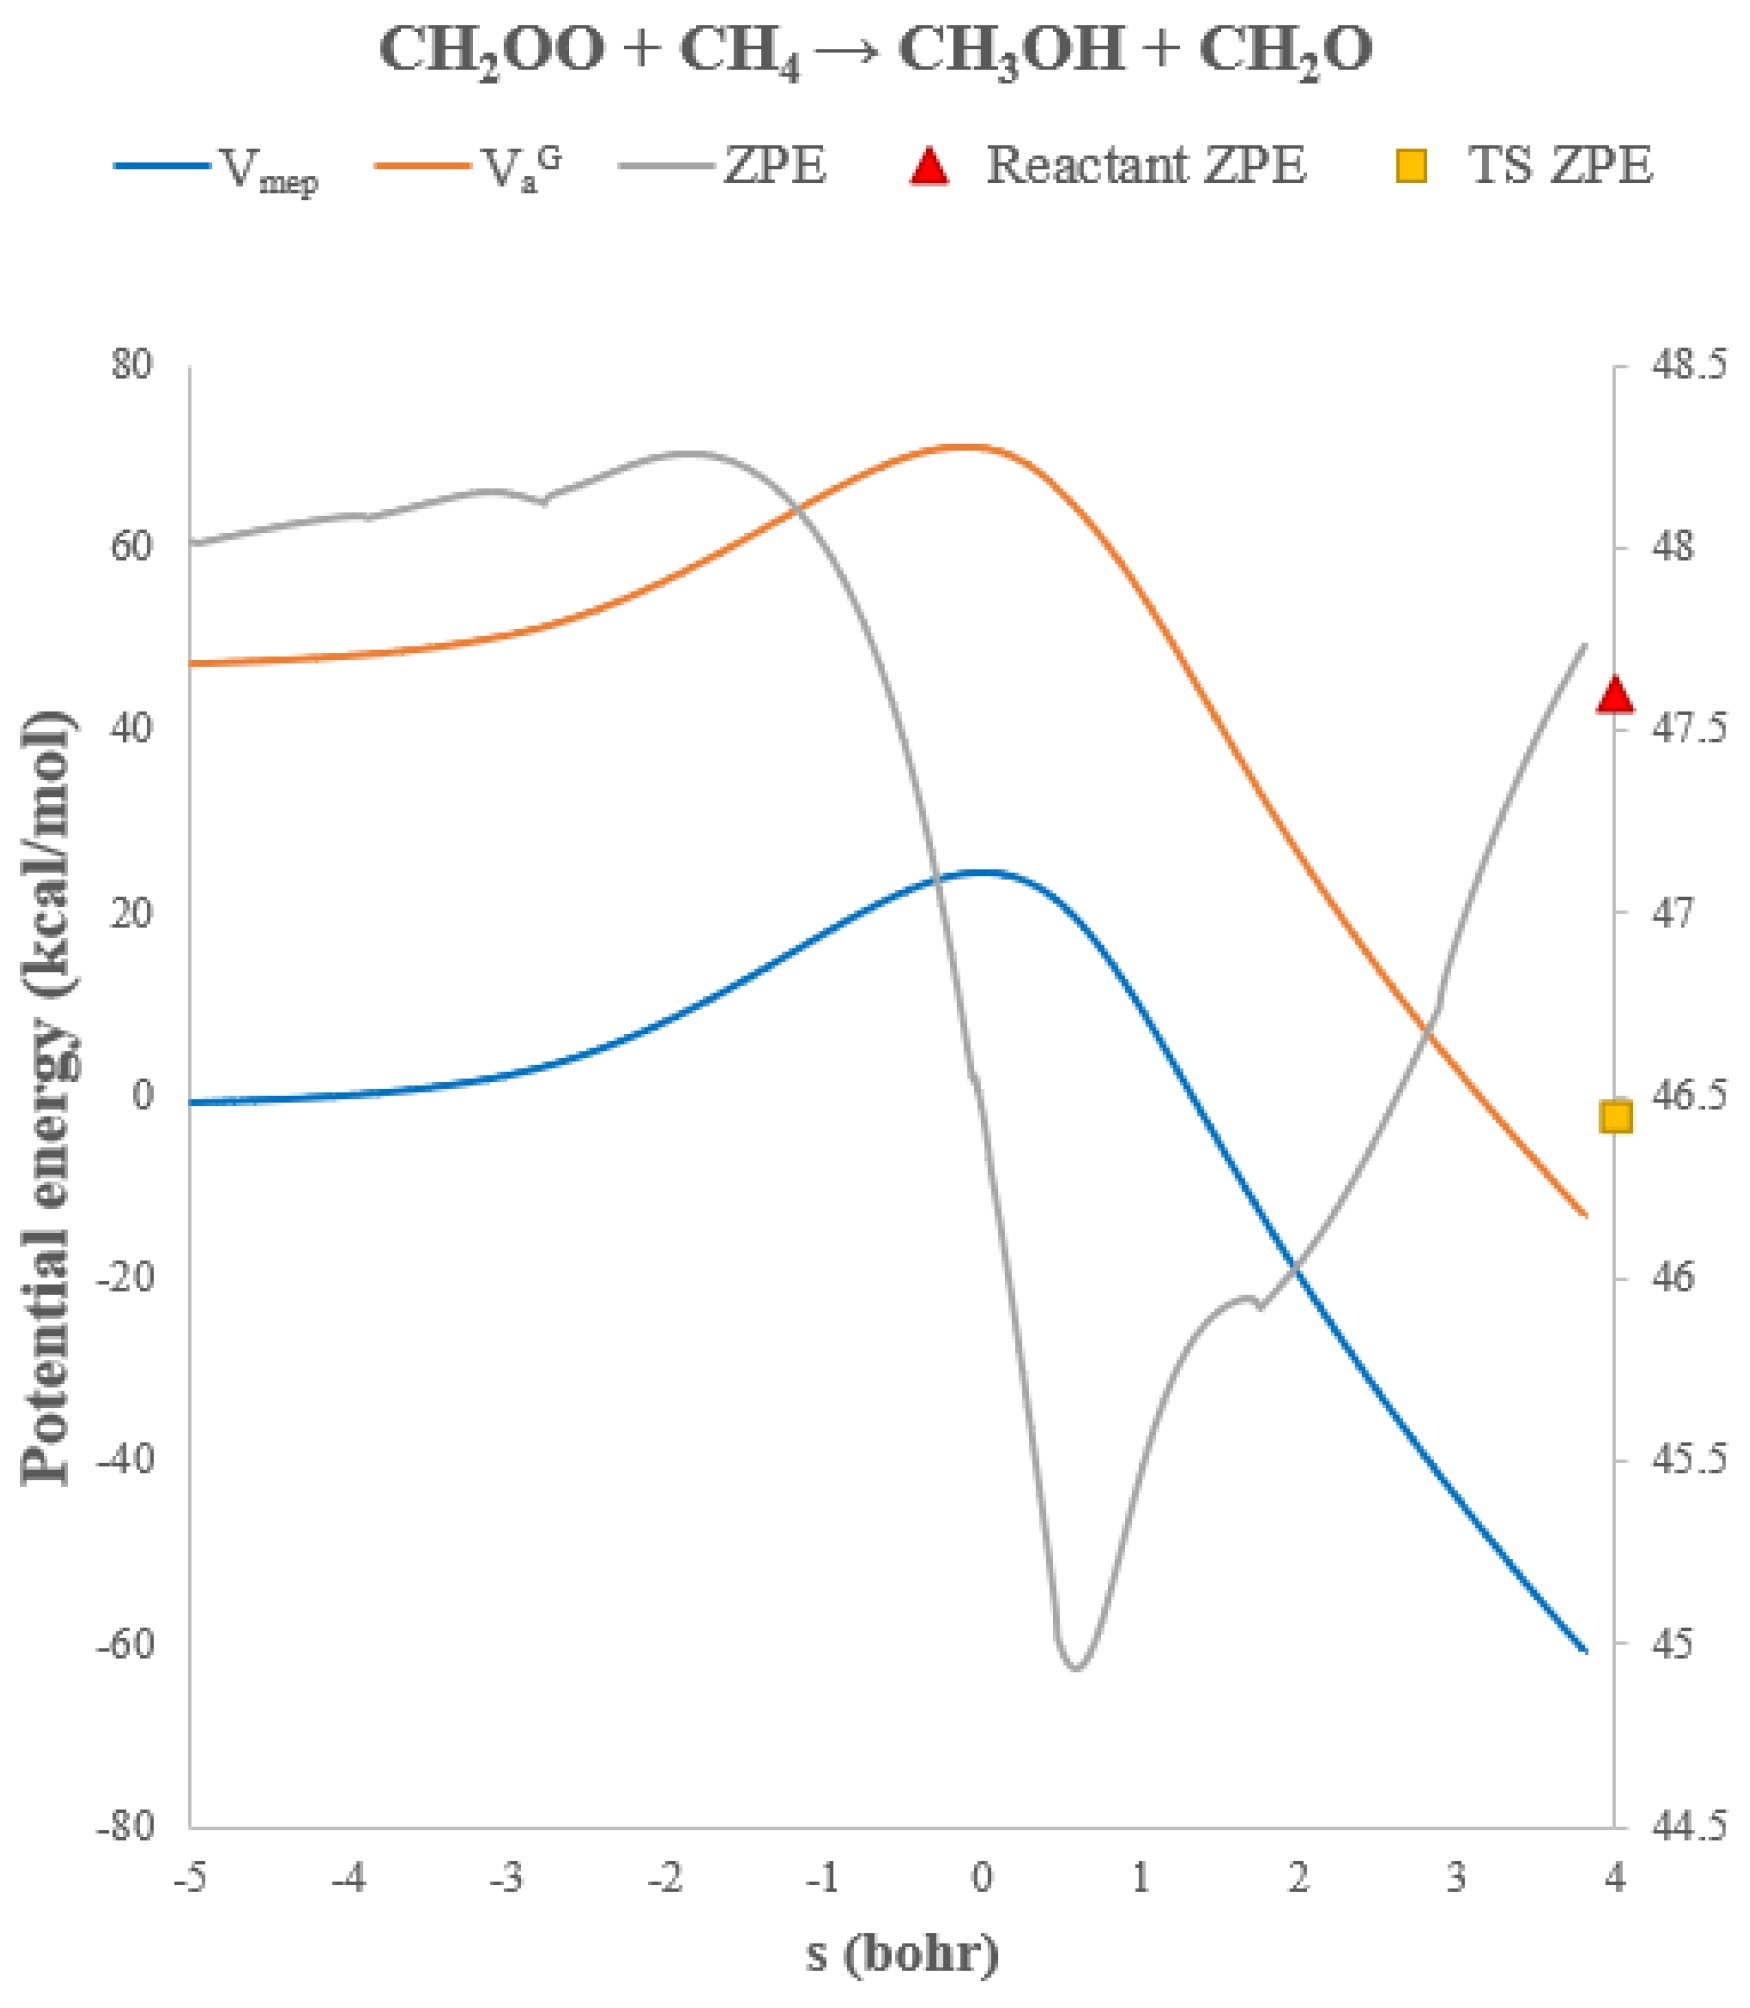
The origin of this strong tunneling behavior can be traced to the hydrogen-atom transfer step: the terminal oxygen of CH
2OO abstracts an H atom from methane before the newly formed OH group attaches to carbon. All nuclear motions involved in this step are confined to a very limited spatial region, resulting in a narrow tunneling barrier. The classical and vibrationally adiabatic reaction-path energies (
VMEP and
VaG) are shown in
Figure 7, together with the corresponding zero-point energies (ZPE). The ZPE decreases by 1.2 kcal/mol from reactants to the transition state, resulting in an effectively lower barrier height along the
VaG surface. The variational effect of this reaction is relatively small because the reaction bottleneck remains close to the transition state due to the high barrier. Accordingly, the CVT and TST values remain similar across the entire temperature range.
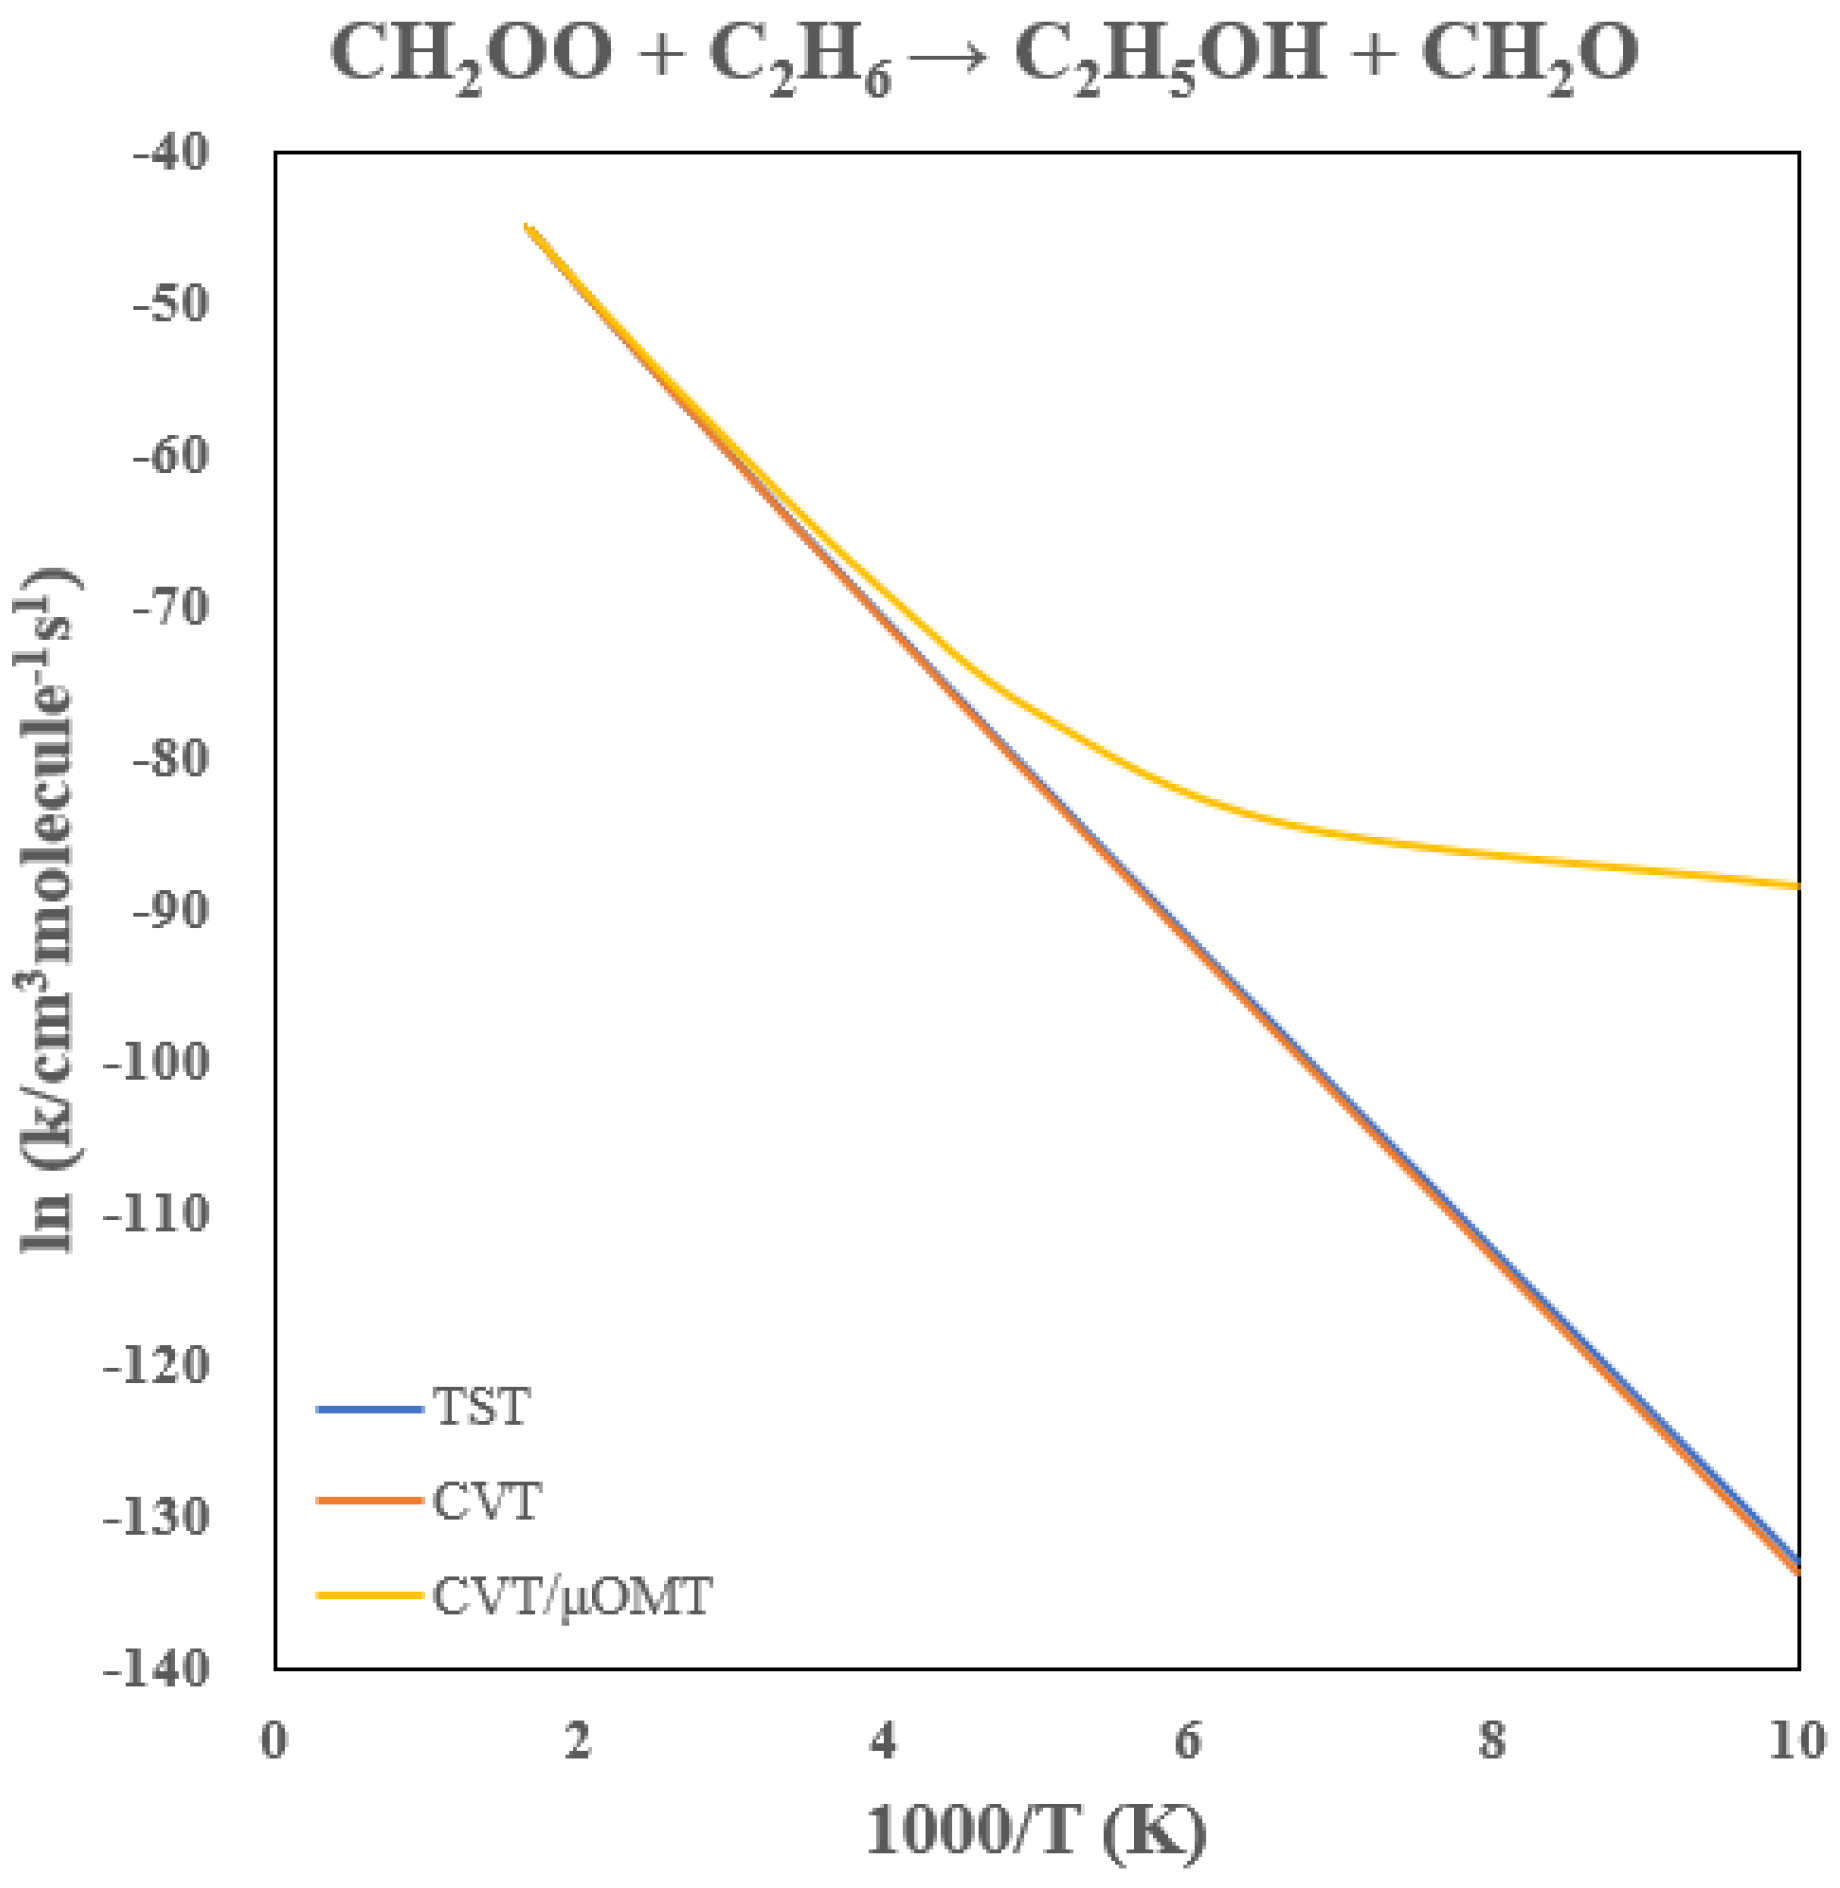
3.3. Rate Constants of CH2OO + C2H6
Table 2 summarizes the calculated rate constants, and
Figure 8 shows the Arrhenius plot. Compared with the methane reaction, the TST rate constants near 300 K increase by roughly a factor of 20, consistent with the 2.8 kcal/mol lower barrier predicted for ethane. Despite this reduced barrier, tunneling remains comparably important: at 300 K and 200 K, tunneling enhances the rate constants by factors of approximately 3 and 100, respectively. The strong curvature in the Arrhenius behavior below 250 K again signals dominant tunneling contributions, mirroring the behavior observed for methane.
The variational contributions are modest in this case as well. Above 250 K, the CVT correction reduces the TST value by < 10%. Thus, for both methane and ethane, the CH2OO insertion chemistry proceeds through a hydrogen-transfer-dominated mechanism in which quantum tunneling is the primary origin of the observed low-temperature reactivity.
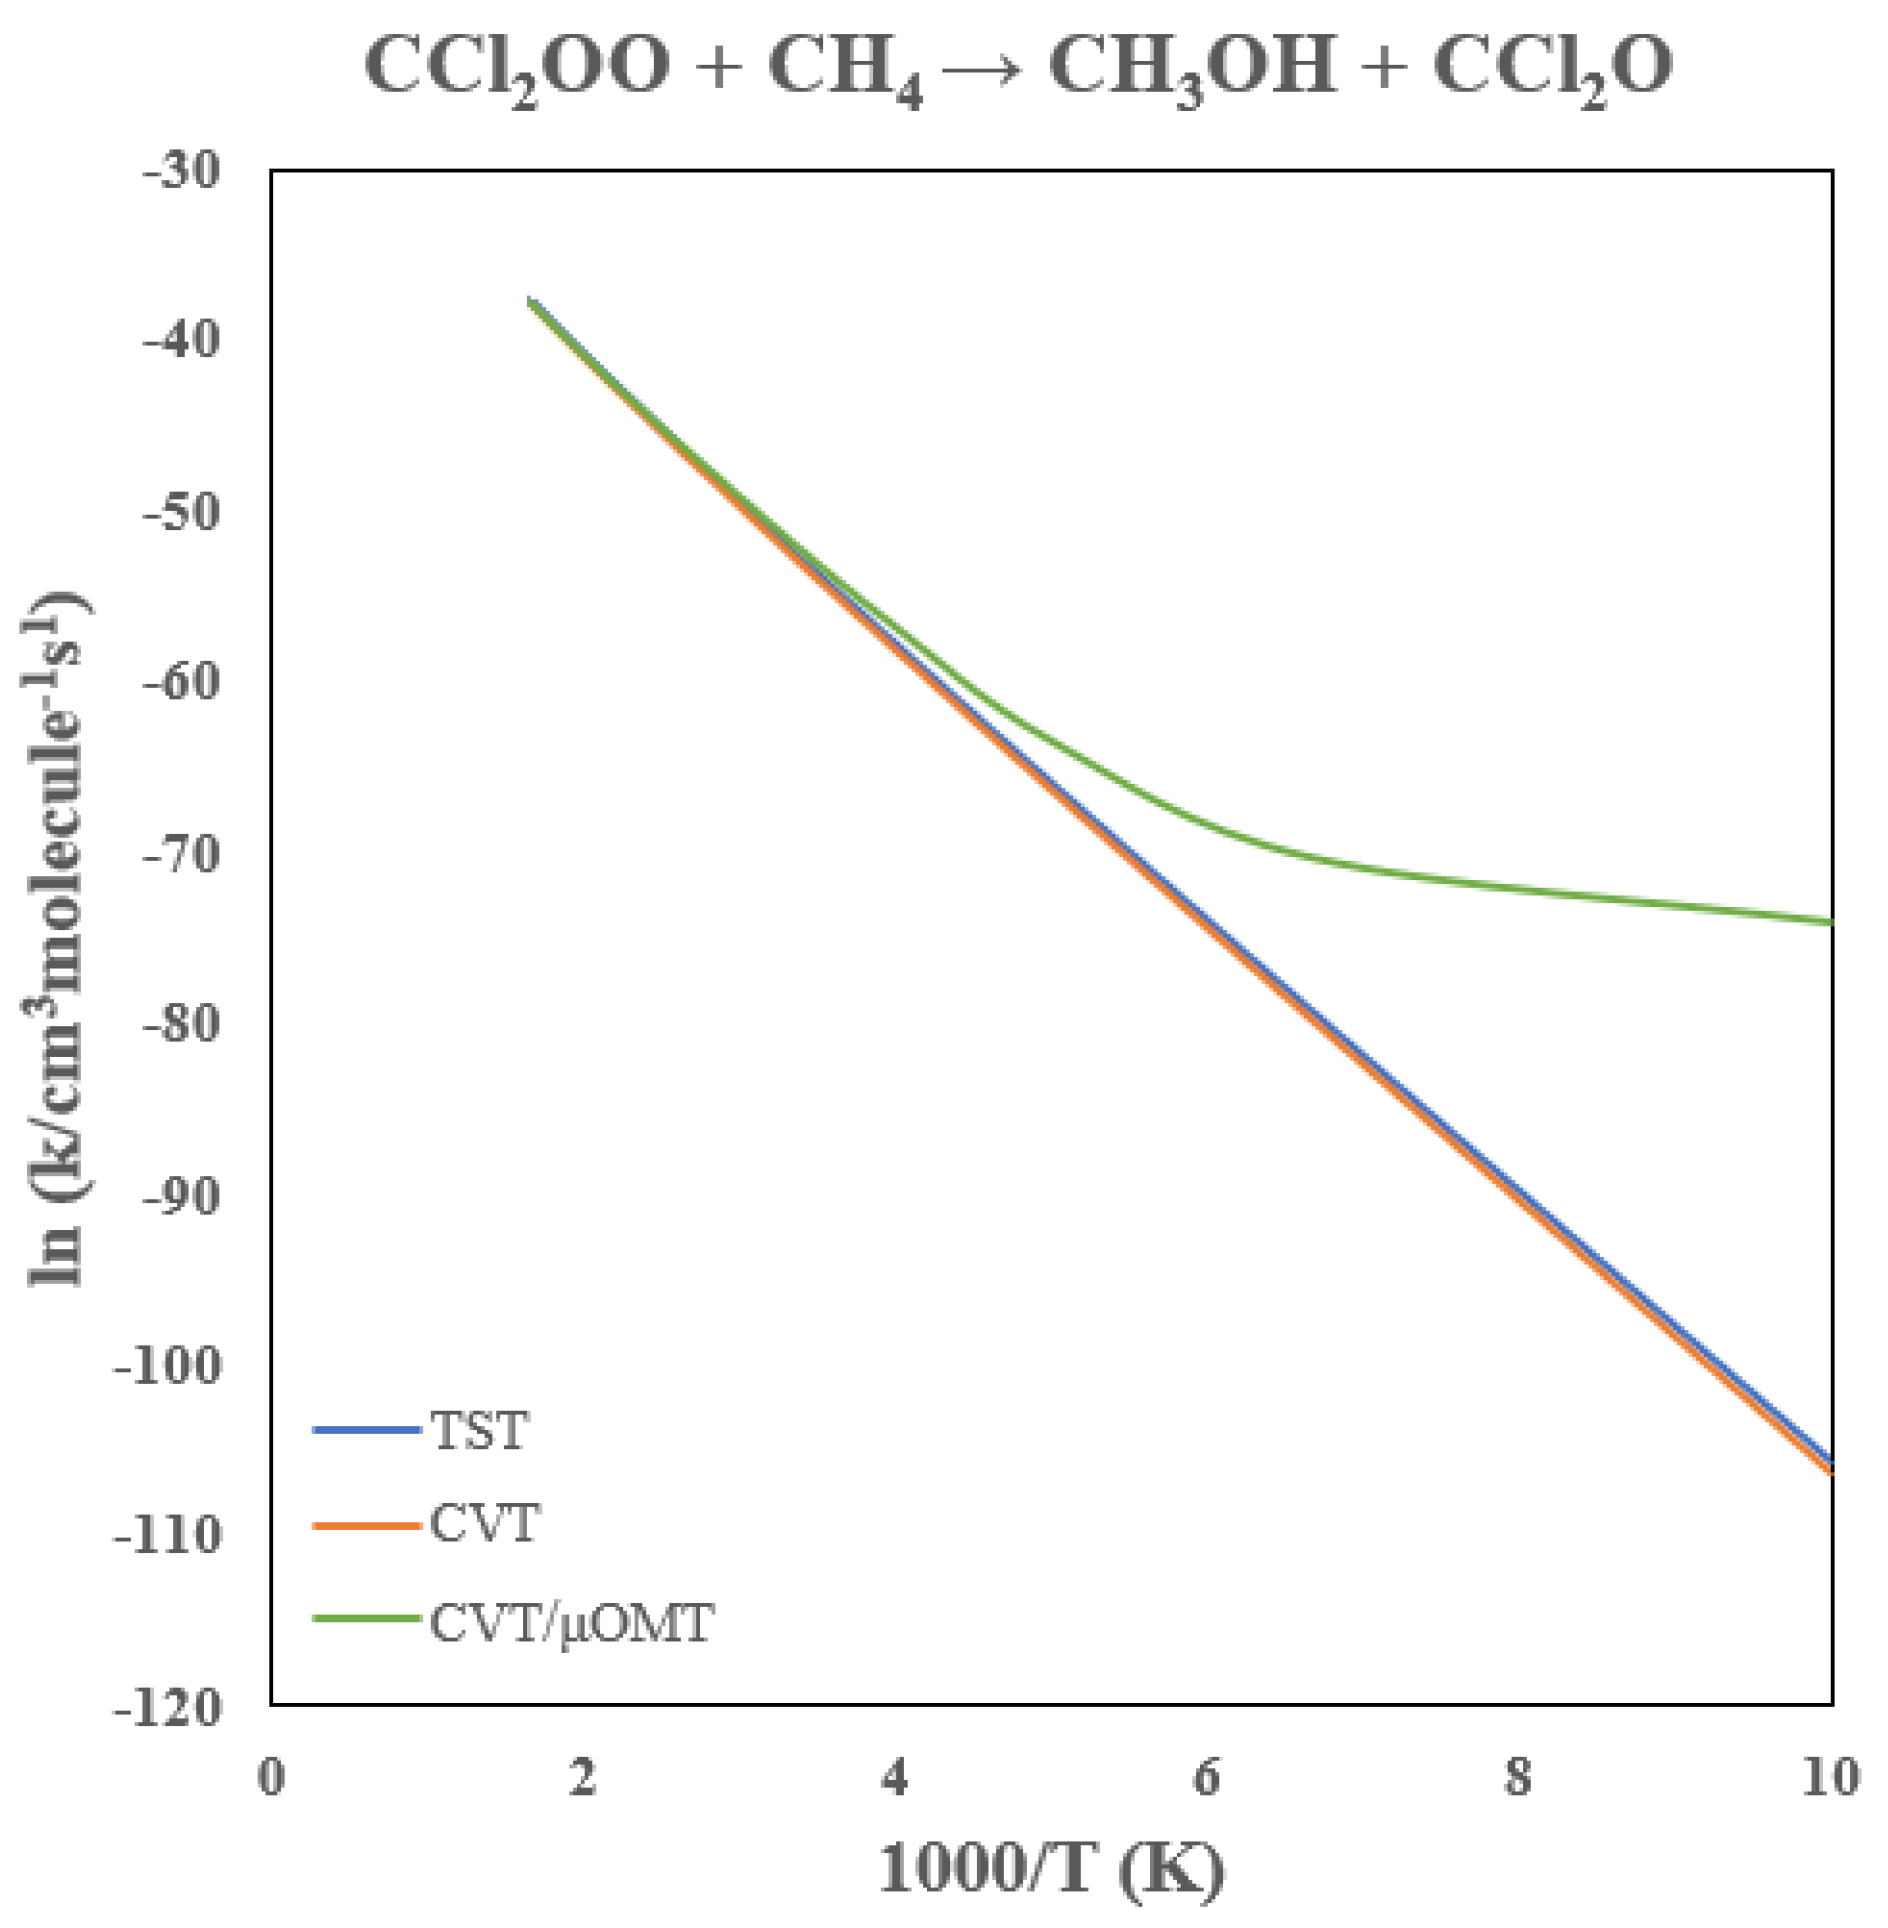
3.4. Rate Constants of CCl2OO + CH4
The calculated rate constants for the CCl
2OO + CH
4 reaction are presented in
Table 3, with the Arrhenius plot shown in
Figure 9. Chlorination lowers the reaction barrier by 8.2 kcal/mol relative to CH
2OO, leading to a dramatic enhancement in reactivity: the predicted rate constant at 300 K is 10
−23 cm
3 molecule
−1 s
−1, approximately six orders of magnitude larger than the unsubstituted case.
Tunneling remains important despite the reduced barrier. At 300 K and 200 K, tunneling enhances the CVT rate constant by factors of 2.4 and 18, respectively, with pronounced curvature in the Arrhenius behavior below ~200 K. In contrast to CH2OO + CH4, the variational contribution becomes more significant. The CVT correction lowers the TST rate constant by ~35–40% at 300–200 K, reflecting a shift of the reaction bottleneck away from the saddle point. As the barrier becomes smaller and broader, tunneling and variational effects coexist, while tunneling still dominates the low-temperature kinetics.
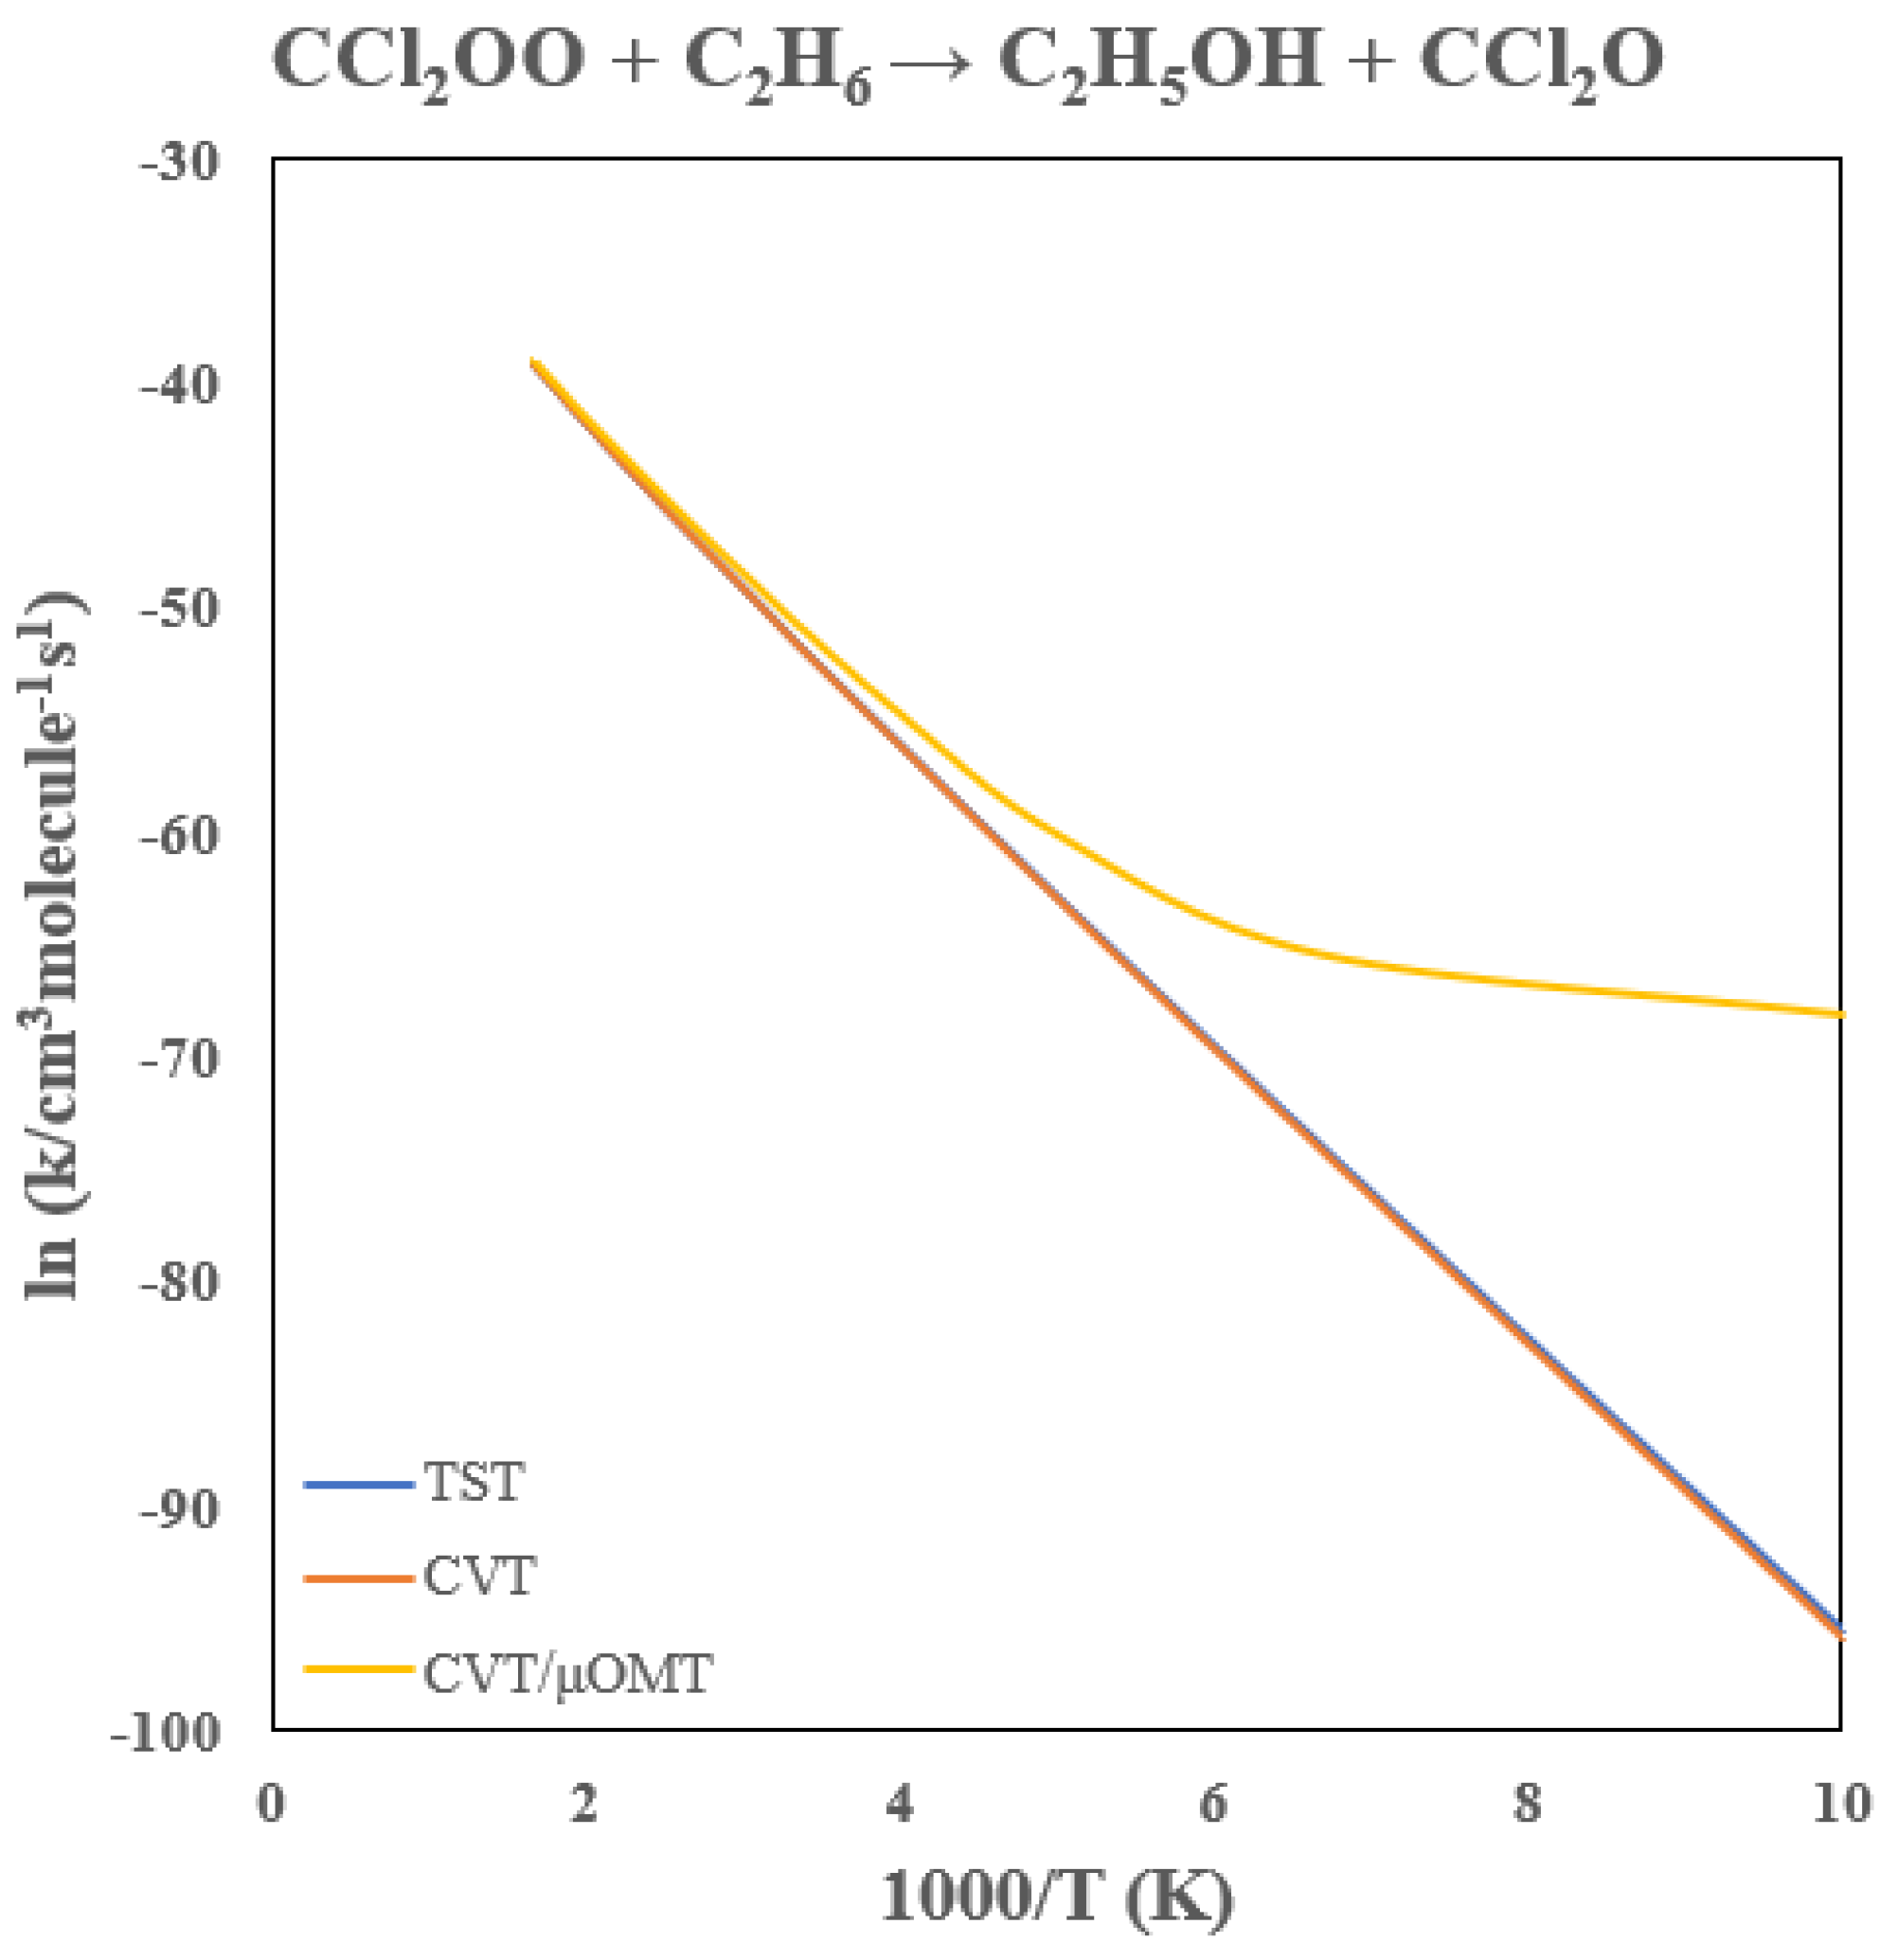
3.5. Rate Constants of CCl2OO + C2H6
Table 4 provides the calculated rate constants for the CCl
2OO + C
2H
6 reaction, and
Figure 10 illustrates the Arrhenius plot. Chlorination lowers the reaction barrier by 7.8 kcal/mol, yielding a 300 K rate constant near 10
−22 cm
3 molecule
−1 s
−1, roughly five orders of magnitude higher than the corresponding CH
2OO reaction and comparable to the chlorinated methane case above.
Tunneling enhancements mirror those of the methane reaction, increasing the rate constant by roughly factors of 2.4 and 18 at 300 K and 200 K, respectively. The variational correction is modest above 200 K, reducing TST values by <10%. Thus, similar to the methane system, chlorination significantly accelerates CI reactivity with ethane, while tunneling remains a persistent contributor to the rate enhancement under atmospheric and especially low-temperature conditions.
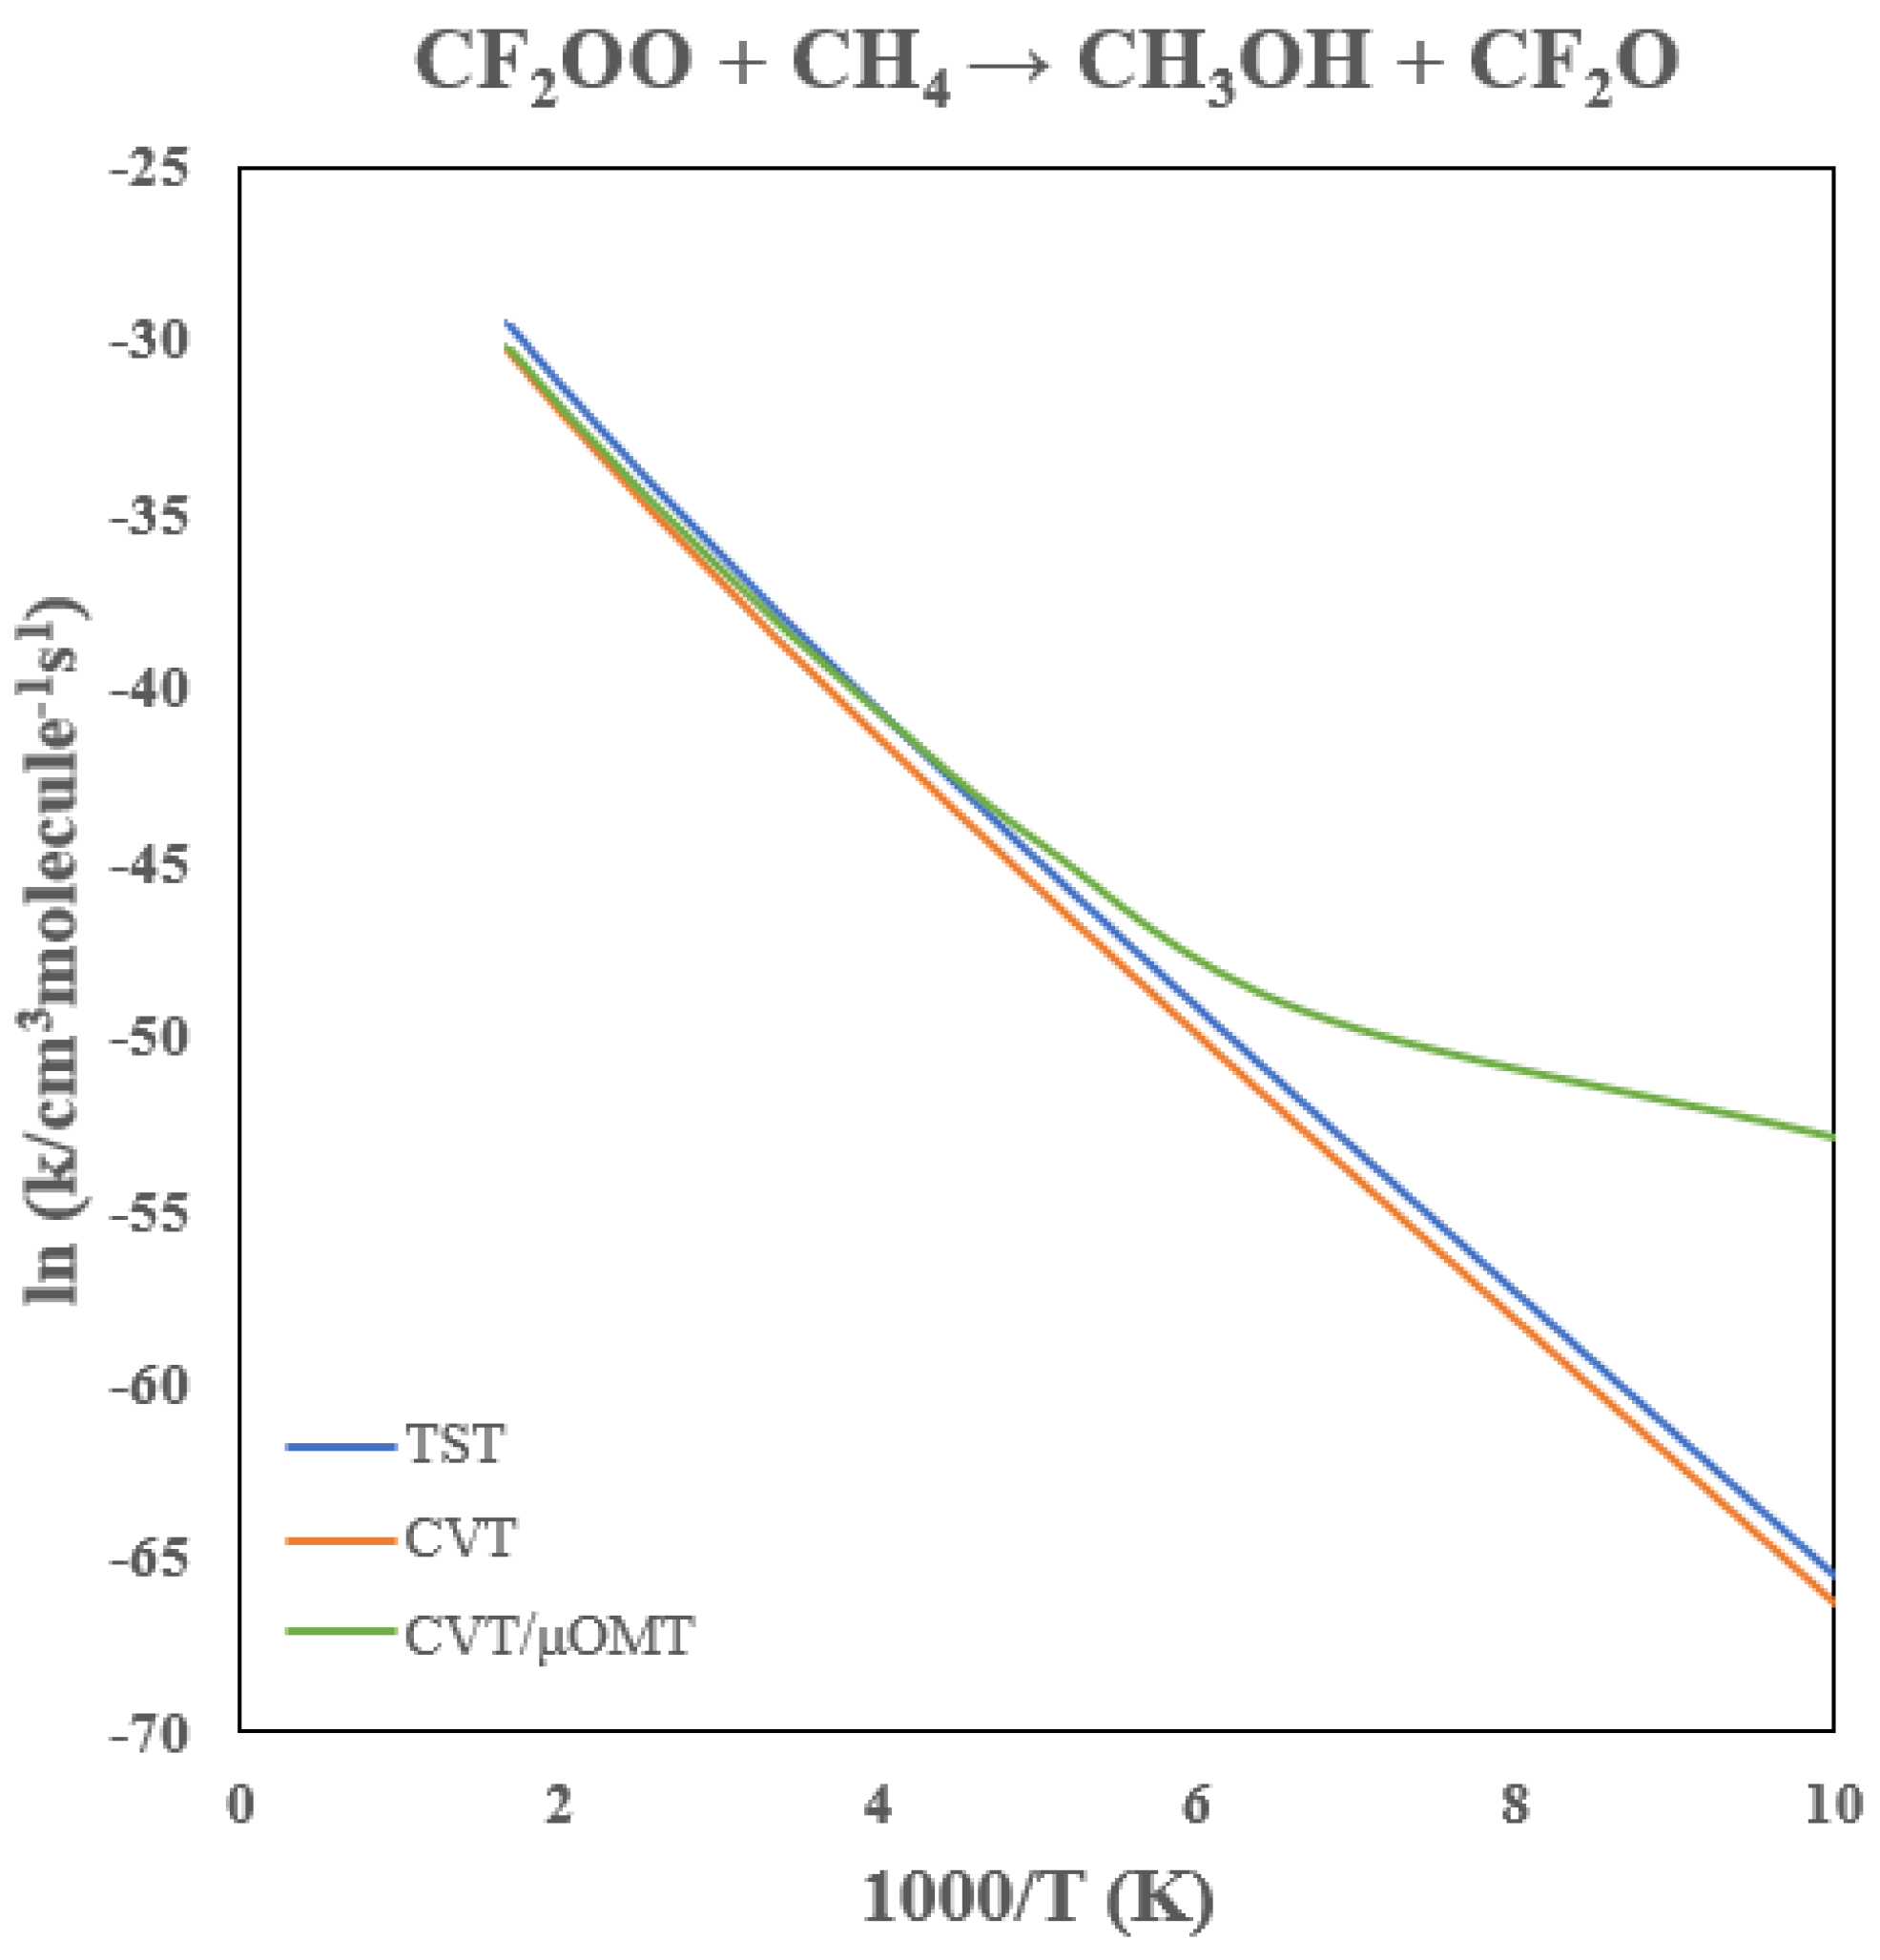
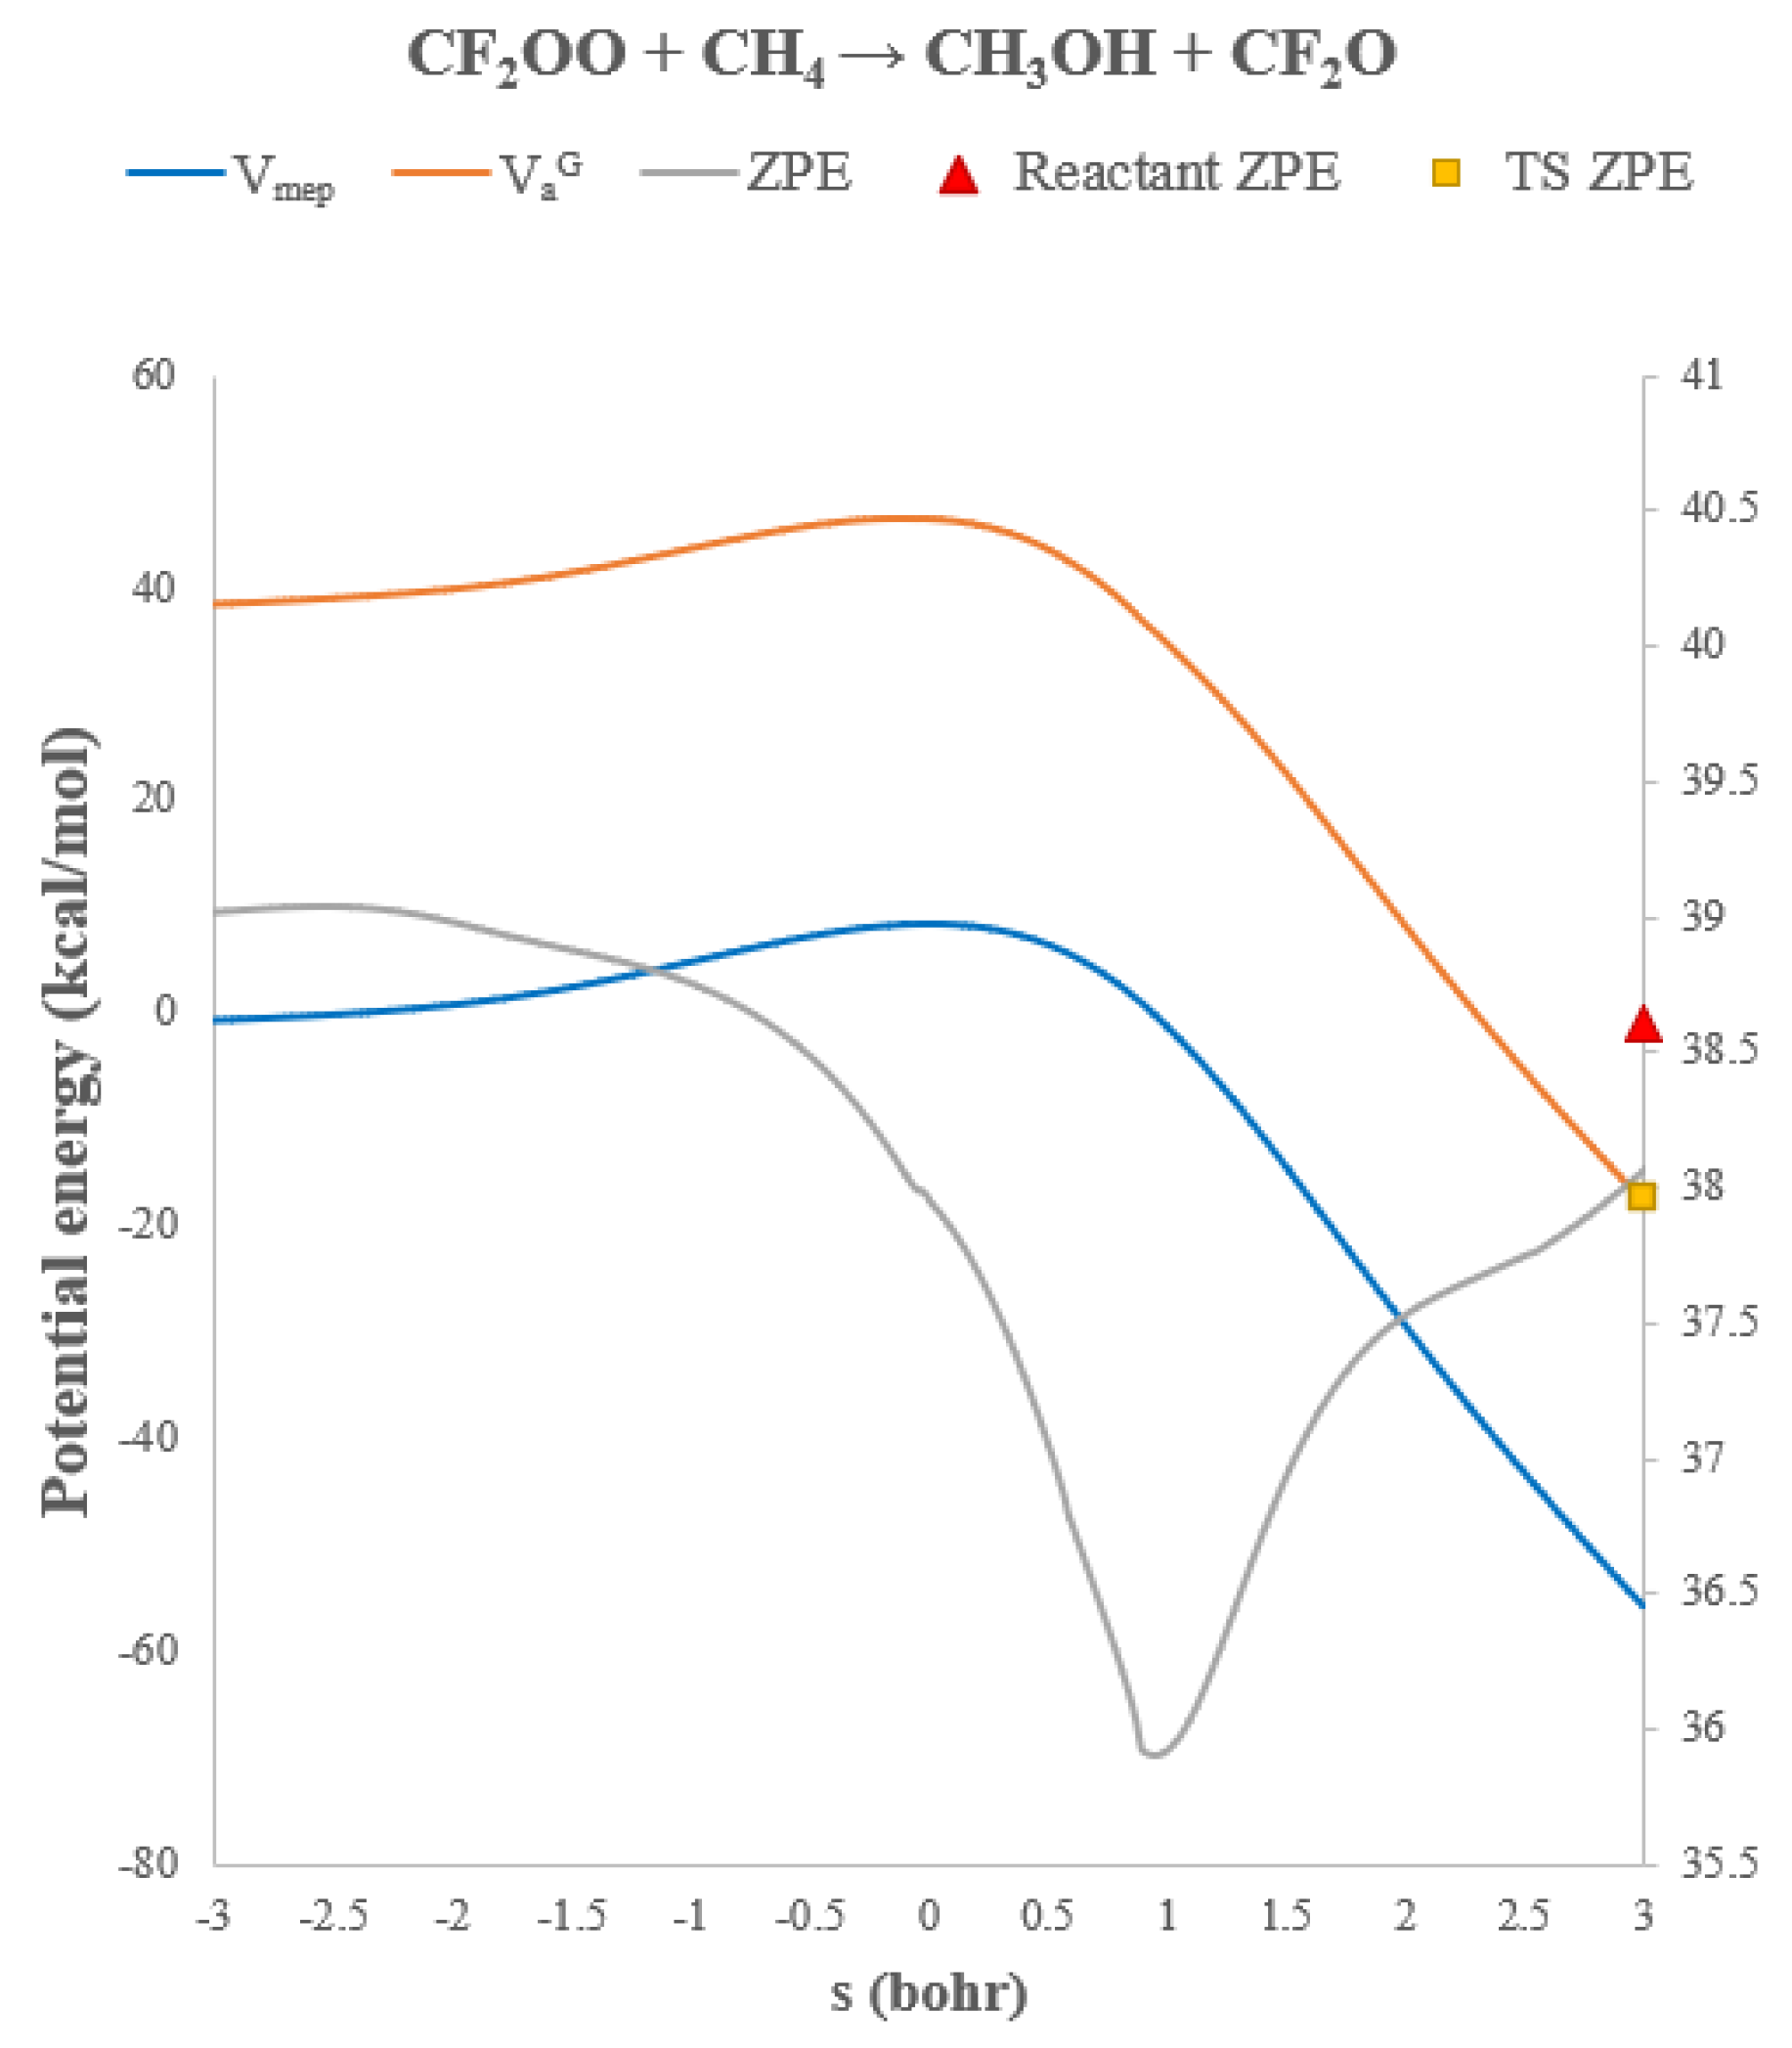
3.6. Rate Constants of CF2OO + CH4
The predicted rate constants for the CF
2OO + CH
4 reaction are listed in
Table 5 and plotted in
Figure 11. The
VMEP,
VaG, and ZPE curves are plotted in
Figure 12. Fluorination has an even more dramatic effect than chlorination, lowering the barrier by 16.1 kcal/mol. As a result, the 300 K rate constant reaches ~10
−17 cm
3 molecule
−1 s
−1, approximately twelve orders of magnitude higher than that of CH
2OO.
Because the barrier is so small, tunneling effects are less prominent relative to the chlorinated and unsubstituted cases. Tunneling enhances the rate constant by only factors of 1.6 and 3.8 at 300 K and 200 K, respectively, although noticeable curvature remains below ~150 K, where tunneling can increase the rate by over an order of magnitude. Interestingly, variational effects become more important here than in the CH2OO system. The classical barrier is sufficiently shallow that the optimal dividing surface shifts away from the transition state. CVT reduces the TST rate constant by ~50% across 200–600 K. Notably, the predicted 300 K rate constant is comparable to that of the OH + CH4 reaction (~10−15 cm3 molecule−1 s−1),80-82 suggesting that CF2OO could act as a minor methane sink during nighttime or low-[OH] atmospheric conditions.
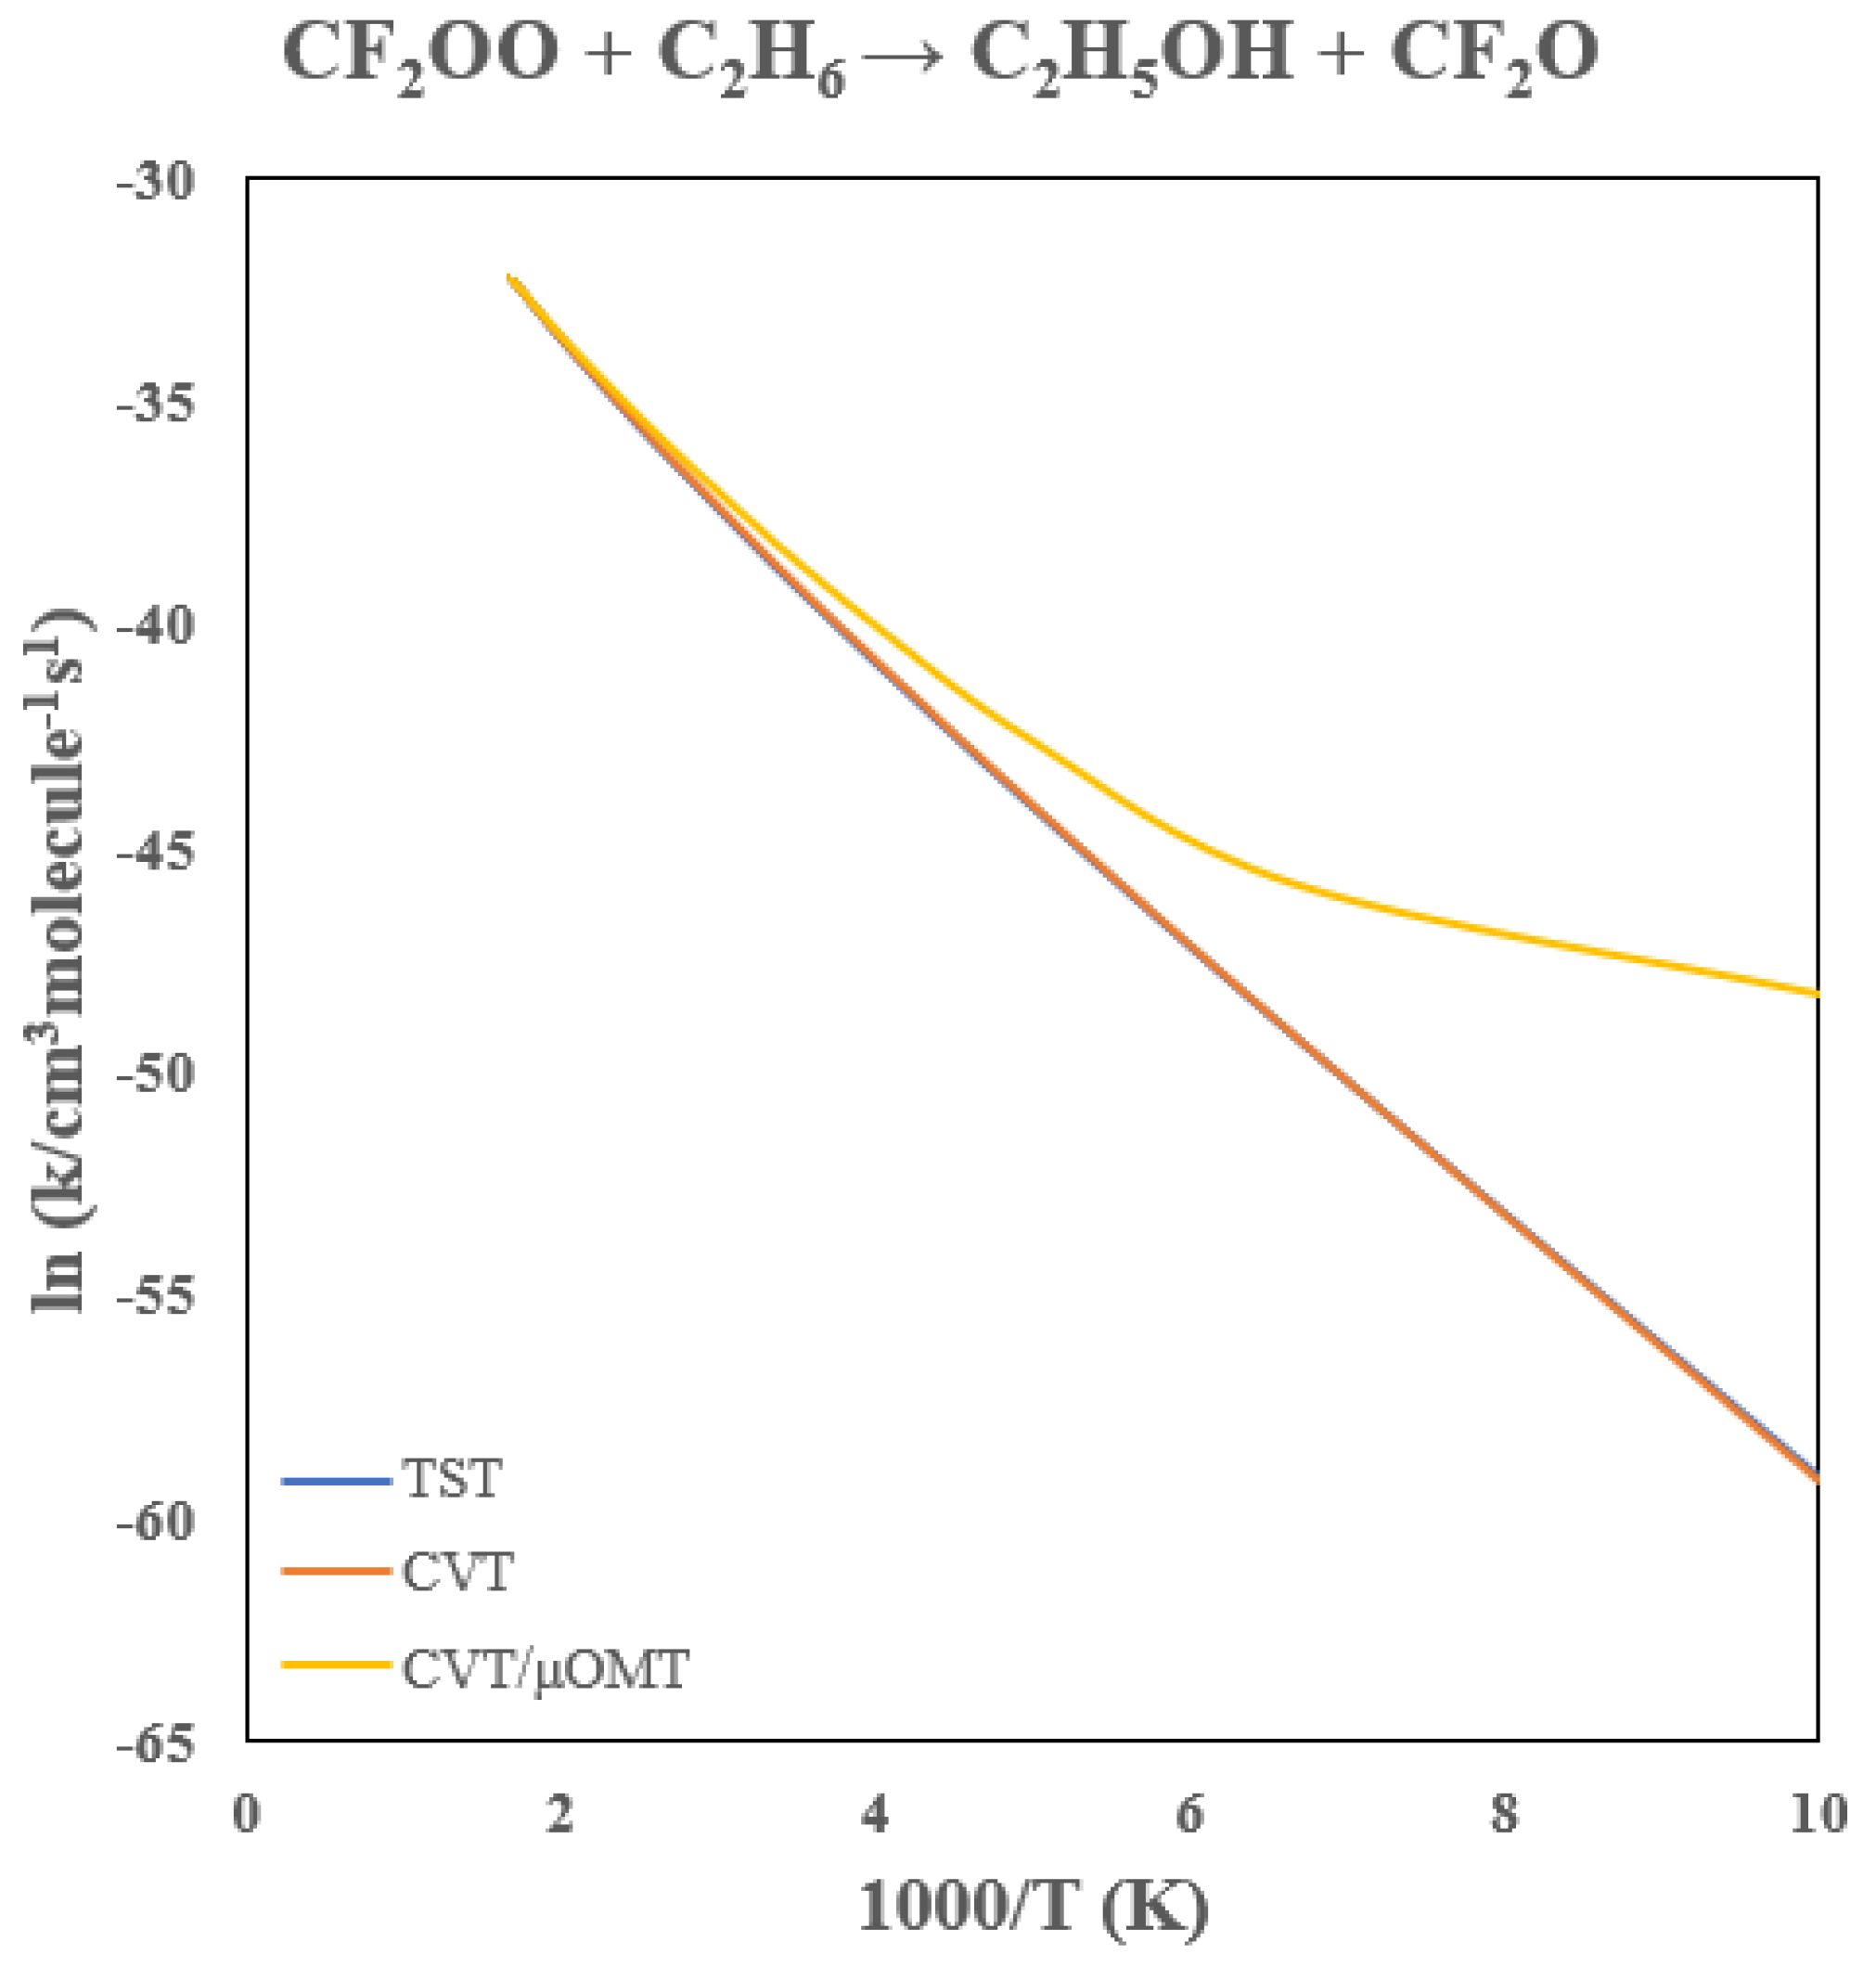
3.7. Rate Constants of CF2OO + C2H6
Table 6 summarizes the rate constants for the CF
2OO + C
2H
6 reaction, with the Arrhenius behavior shown in
Figure 13. Fluorination lowers the barrier by 15.3 kcal/mol, yielding a 300 K rate constant near 10
−17 cm
3 molecule
−1 s
−1, again about ten orders of magnitude larger than the unsubstituted CH
2OO system and comparable to the CF
2OO + CH
4 reaction.
Tunneling effects are modest due to the low barrier, increasing the CVT rate constant by factors of approximately 1.6 and 4.1 at 300 and 200 K, respectively, with notable tunneling curvature only below ~150 K. Variational effects are small, reducing the TST rate constants by < 5% above 200 K. Interestingly, while the barrier is lower for ethane than for methane, the room-temperature rates are nearly identical. This originates from the much larger pre-exponential factor in the methane reaction due to its higher symmetry and smaller rotational partition function. The symmetry number for the CH4 reaction (σ = 12) is also twice that for ethane, making entropic factors important in determining the overall bimolecular rate.
3.8. Kinetic Isotope Effects
Kinetic isotope effects (KIEs) provide valuable mechanistic signatures for reactions that involve tunneling through a barrier. The reactions studied here involve transfer of either a hydrogen atom or a terminal oxygen atom from the Criegee intermediate to the alkane; therefore, both H/D and
16O/
18O isotope substitutions can reveal the characteristics of the reaction mechanism and the extent to which tunneling shapes the dynamics.[
72,
73] It is often informative to factorize the KIEs into the translational, rotational, vibrational, variational, and tunneling contributions for analysis [
83,
84,
85]:
where the first two contributions are temperature independent.
Table 7,
Table 8,
Table 9 and
Table 10 list the predicted isotope effects and their decomposed contributions.
3.8.1. Deuterium Kinetic Isotope Effects (H/D)
Table 7 and
Table 8 show that the CH
2OO + CH
4 and CH
2OO + C
2H
6 reactions both exhibit large deuterium KIEs that increase sharply with decreasing temperature. At room temperature, CVT/μOMT predicts KIEs of 2.84 for methane and 3.42 for ethane. Although these magnitudes are similar to typical hydrogen-transfer reactions, the decomposed contributions indicate strong tunneling control. The temperature dependence of the deuterium KIEs is primarily due to the tunneling contribution below room temperature, and is due to the vibrational contribution above room temperature. Interestingly, the vibrational contributions of the ethane reaction are significantly higher due to the zero-point energy effects. The temperature-independent rotational contributions are also important. The zero-point energy (ZPE) and tunneling effects make the rate constants of the unsubstituted reactions much higher than those of the deuterated reactions at low temperature. The calculated rate constants and Arrhenius plots of the isotopically substituted reactions are included in the
Supplementary Materials.
At temperatures below 250 K, tunneling becomes the dominant contributor to the KIE, exceeding factors of 30 (CH4) and 23 (C2H6) at 150 K. At 200 K, tunneling elevates the KIE to 10.7 for methane and 14.0 for ethane. Below ~150 K, the KIEs increase by two to three orders of magnitude, reflecting barrier penetration on a narrow tunneling path.
Notably, the variational contribution to the KIE is small for both reactions, showing that tunneling enhancement primarily originates from the transmission coefficient rather than shifts in the dynamical bottleneck. Therefore, these alcohol-forming reactions proceed by highly quantum-mechanical hydrogen transfer even when the overall rate is slow at room temperature. These results further suggest that accurate deuterium KIE calculations should explicitly account for tunneling contributions.
3.8.2. Heavy-Atom Kinetic Isotope Effects (16O/18O)
Because the forming O–H bond is accompanied by a concerted insertion of the terminal oxygen into the C–H bond, oxygen motion also contributes to the reaction coordinate.
Table 9 and
Table 10 show that the
18O KIE is close to unity at high temperature but grows as temperature decreases. For example, at 298 K, CVT/μOMT predicts
18O KIEs of 1.19 (CH
4) and 1.24 (C
2H
6), while at 200 K, tunneling raises the KIE to 2.09 (CH
4) and 2.15 (C
2H
6). Such magnitudes are unusually large for heavy-atom substitution [
86] and represent clear kinetic signatures of heavy-atom tunneling.[
50,
87,
88,
89,
90] Evidence for oxygen tunneling in O–O bond activation and oxygen-transfer reactions has also been reported in peroxide bond cleavage and ozone-related rearrangements, further supporting the presence of heavy-atom tunneling in systems with weak or strained O–O linkages.[
50,
90] Heavy-atom tunneling is often masked experimentally due to competing reaction pathways and slow intrinsic kinetics, implying that these isotope effects may be most relevant for low-temperature modeling or laboratory studies employing cryogenic techniques rather than ambient experimental kinetics.
3.8.3. Mechanistic Implications
Together, the H/D and 16O/18O KIE data demonstrate that the reactions do not proceed only by classical over-the-barrier hydrogen abstraction. Both hydrogen and oxygen atoms participate in quantum tunneling through a constrained geometry. The transition state represents a concerted, asynchronous O-insertion process in which H and O motion are strongly coupled. These features reinforce the mechanistic picture derived from IRC results: the reaction path becomes narrow and steep at the point of O–H formation, creating favorable conditions for deep tunneling.
Figure 1.
Calculated Geometries of (A) CH2OO, (B) CCl2OO, and (C) CF2OO at MP2/aug-cc-pVDZ level. The Bond Lengths (black) are in Angstroms, and Bond Angles (red) are in Degrees.
Figure 1.
Calculated Geometries of (A) CH2OO, (B) CCl2OO, and (C) CF2OO at MP2/aug-cc-pVDZ level. The Bond Lengths (black) are in Angstroms, and Bond Angles (red) are in Degrees.
Figure 2.
Calculated Transition State Geometries of (A) CH2OO, (B) CCl2OO, and (C) CF2OO with CH4 at MP2/aug-cc-pVDZ level. The Bond Lengths (black) are in Angstroms, and Bond Angles (red) in Degrees.
Figure 2.
Calculated Transition State Geometries of (A) CH2OO, (B) CCl2OO, and (C) CF2OO with CH4 at MP2/aug-cc-pVDZ level. The Bond Lengths (black) are in Angstroms, and Bond Angles (red) in Degrees.
Figure 3.
Calculated Transition State Geometries of (A) CH2OO, (B) CCl2OO, and (C) CF2OO with C2H6 at MP2/aug-cc-pVDZ level. The Bond Lengths (black) are in Angstroms, and Bond Angles (red) in Degrees.
Figure 3.
Calculated Transition State Geometries of (A) CH2OO, (B) CCl2OO, and (C) CF2OO with C2H6 at MP2/aug-cc-pVDZ level. The Bond Lengths (black) are in Angstroms, and Bond Angles (red) in Degrees.
Figure 4.
Calculated Potential Energy Profile of CX2OO + CH4 (X = H, Cl, F) at CCSD(T)/CBS//MP2/aug-cc-pVDZ Level.
Figure 4.
Calculated Potential Energy Profile of CX2OO + CH4 (X = H, Cl, F) at CCSD(T)/CBS//MP2/aug-cc-pVDZ Level.
Figure 5.
Calculated Potential Energy Profile of CX2OO + C2H6 (X = H, Cl, F) at CCSD(T)/CBS//MP2/aug-cc-pVDZ Level.
Figure 5.
Calculated Potential Energy Profile of CX2OO + C2H6 (X = H, Cl, F) at CCSD(T)/CBS//MP2/aug-cc-pVDZ Level.
Figure 6.
Arrhenius Plot of the CH2OO + CH4 → CH2O + CH3OH Rate Constants.
Figure 6.
Arrhenius Plot of the CH2OO + CH4 → CH2O + CH3OH Rate Constants.
Figure 7.
Potential energies (VMEP and VaG, left axis) and vibrational zero-point energies (ZPE, right axis) along the reaction path for CH2OO + CH4 → CH2O + CH3OH.
Figure 7.
Potential energies (VMEP and VaG, left axis) and vibrational zero-point energies (ZPE, right axis) along the reaction path for CH2OO + CH4 → CH2O + CH3OH.
Figure 8.
Arrhenius Plot of the CH2OO + C2H6 → CH2O + C2H5OH Rate Constants.
Figure 8.
Arrhenius Plot of the CH2OO + C2H6 → CH2O + C2H5OH Rate Constants.
Figure 9.
Arrhenius Plot of the CCl2OO + CH4 → CCl2O + CH3OH Rate Constants.
Figure 9.
Arrhenius Plot of the CCl2OO + CH4 → CCl2O + CH3OH Rate Constants.
Figure 10.
Arrhenius Plot of the CCl2OO + C2H6 → CCl2O + C2H5OH Rate Constants.
Figure 10.
Arrhenius Plot of the CCl2OO + C2H6 → CCl2O + C2H5OH Rate Constants.
Figure 11.
Arrhenius Plot of the CF2OO + CH4 → CF2O + CH3OH Rate Constants.
Figure 11.
Arrhenius Plot of the CF2OO + CH4 → CF2O + CH3OH Rate Constants.
Figure 12.
Potential energies (VMEP and VaG, left axis) and vibrational zero-point energies (ZPE, right axis) along the reaction path for CF2OO + CH4 → CF2O + CH3OH.
Figure 12.
Potential energies (VMEP and VaG, left axis) and vibrational zero-point energies (ZPE, right axis) along the reaction path for CF2OO + CH4 → CF2O + CH3OH.
Figure 13.
Arrhenius Plot of the CF2OO + C2H6 → CF2O + C2H5OH Rate Constants.
Figure 13.
Arrhenius Plot of the CF2OO + C2H6 → CF2O + C2H5OH Rate Constants.
Table 1.
Calculated Rate Constants (in cm3 molecule−1 s−1) for the CH2OO + CH4 → CH2O + CH3OH Reaction.
Table 1.
Calculated Rate Constants (in cm3 molecule−1 s−1) for the CH2OO + CH4 → CH2O + CH3OH Reaction.
| T(K) |
TST |
CVT |
CVT/μOMT |
| 100 |
8.29 × 10−64
|
6.33 × 10−64
|
7.65 × 10−42
|
| 150 |
1.06 × 10−46
|
8.99 × 10−47
|
9.97 × 10−40
|
| 200 |
4.55 × 10−38
|
4.06 × 10−38
|
5.12 × 10−36
|
| 250 |
7.91 × 10⁻³³
|
7.25 × 10⁻³³
|
5.43 × 10⁻³²
|
| 298.15 |
2.11 × 10⁻²⁹
|
1.97 × 10⁻²⁹
|
6.31 × 10⁻²⁹
|
| 300 |
2.73 × 10⁻²⁹
|
2.54 × 10⁻²⁹
|
7.98 × 10⁻²⁹
|
| 350 |
9.87 × 10⁻²⁷
|
9.30 × 10⁻²⁷
|
1.97 × 10⁻²⁹
|
| 400 |
8.66 × 10⁻²⁵
|
8.22 × 10⁻²⁵
|
1.40 × 10⁻²⁴
|
| 500 |
5.09 × 10⁻²²
|
4.88 × 10⁻²²
|
6.65 × 10⁻²²
|
| 600 |
3.97 × 10⁻²⁰
|
3.83 × 10⁻²⁰
|
4.67 × 10⁻²⁰
|
Table 2.
Calculated Rate Constants (in cm3 molecule−1 s−1) for the CH2OO + C2H6 → CH2O + C2H5OH Reaction.
Table 2.
Calculated Rate Constants (in cm3 molecule−1 s−1) for the CH2OO + C2H6 → CH2O + C2H5OH Reaction.
| T(K) |
TST |
CVT |
CVT/μOMT |
| 100 |
3.62 × 10−58
|
2.02 × 10−58
|
8.85 × 10−39
|
| 150 |
2.70 × 10−43
|
1.98 × 10−43
|
5.01 × 10−37
|
| 200 |
9.10 × 10−36
|
7.60 × 10−36
|
8.68 × 10⁻³⁴
|
| 250 |
3.48 × 10⁻³¹
|
3.12 × 10⁻³¹
|
2.60 × 10⁻³⁰
|
| 298.15 |
3.52 × 10⁻²⁸
|
3.28 × 10⁻²⁸
|
1.15 × 10⁻²⁷
|
| 300 |
4.40 × 10⁻²⁸
|
4.11 × 10⁻²⁸
|
1.41 × 10⁻²⁷
|
| 350 |
7.82 × 10⁻²⁶
|
7.49 × 10⁻²⁶
|
1.69 × 10⁻²⁵
|
| 400 |
4.03 × 10⁻²⁴
|
3.93 × 10⁻²⁴
|
6.92 × 10⁻²⁴
|
| 500 |
1.14 × 10⁻²¹
|
1.12 × 10⁻²¹
|
1.52 × 10⁻²¹
|
| 600 |
5.44 × 10⁻²⁰
|
5.42 × 10⁻²⁰
|
6.43 × 10⁻²⁰
|
Table 3.
Calculated Rate Constants (in cm3 molecule−1 s−1) for the CCl2OO + CH4 → CCl2O + CH3OH Reaction.
Table 3.
Calculated Rate Constants (in cm3 molecule−1 s−1) for the CCl2OO + CH4 → CCl2O + CH3OH Reaction.
| T(K) |
TST |
CVT |
CVT/μOMT |
| 100 |
1.30 × 10−46
|
6.91 × 10−47
|
6.01 × 10⁻³³
|
| 150 |
3.80 × 10⁻³⁵
|
2.22 × 10⁻³⁵
|
2.71 × 10⁻³¹
|
| 200 |
2.48 × 10⁻²⁹
|
1.52 × 10⁻²⁹
|
2.69 × 10⁻²⁸
|
| 250 |
8.74 × 10⁻²⁶
|
5.53 × 10⁻²⁶
|
2.22 × 10⁻²⁵
|
| 298.15 |
1.87 × 10⁻²³
|
1.21 × 10⁻²³
|
2.90 × 10⁻²³
|
| 300 |
2.23 × 10⁻²³
|
1.44 × 10⁻²³
|
3.40 × 10⁻²³
|
| 350 |
1.25 × 10⁻²¹
|
8.19 × 10⁻²²
|
1.49 × 10⁻²¹
|
| 400 |
2.72 × 10⁻²⁰
|
1.80 × 10⁻²⁰
|
2.80 × 10⁻²⁰
|
| 500 |
2.28 × 10⁻¹⁸
|
1.53 × 10⁻¹⁸
|
2.00 × 10⁻¹⁸
|
| 600 |
4.85 × 10⁻¹⁷
|
3.28 × 10⁻¹⁷
|
3.95 × 10⁻¹⁷
|
Table 4.
Calculated Rate Constants (in cm3 molecule−1 s−1) for the CCl2OO + C2H6 → CCl2O + C2H5OH Reaction.
Table 4.
Calculated Rate Constants (in cm3 molecule−1 s−1) for the CCl2OO + C2H6 → CCl2O + C2H5OH Reaction.
| T(K) |
TST |
CVT |
CVT/μOMT |
| 100 |
6.40 × 10−42
|
4.46 × 10−42
|
5.72 × 10⁻³⁰
|
| 150 |
1.67 × 10⁻³²
|
1.39 × 10⁻³²
|
8.50 × 10⁻²⁹
|
| 200 |
1.05 × 10⁻²⁷
|
9.51 × 10⁻²⁸
|
1.73 × 10⁻²⁶
|
| 250 |
9.25 × 10⁻²⁵
|
8.73 × 10⁻²⁵
|
3.70 × 10⁻²⁴
|
| 298.15 |
8.14 × 10⁻²³
|
7.88 × 10⁻²³
|
1.93 × 10⁻²²
|
| 300 |
9.41 × 10⁻²³
|
9.12 × 10⁻²³
|
2.20 × 10⁻²²
|
| 350 |
2.76 × 10⁻²¹
|
2.72 × 10⁻²¹
|
4.91 × 10⁻²¹
|
| 400 |
3.70 × 10⁻²⁰
|
3.67 × 10⁻²⁰
|
5.59 × 10⁻²⁰
|
| 500 |
1.58 × 10⁻¹⁸
|
1.58 × 10⁻¹⁸
|
1.95 × 10⁻¹⁸
|
| 600 |
2.16 × 10⁻¹⁷
|
2.16 × 10⁻¹⁷
|
2.45 × 10⁻¹⁷
|
Table 5.
Calculated Rate Constants (in cm3 molecule−1 s−1) for the CF2OO + CH4 → CF2O + CH3OH Reaction.
Table 5.
Calculated Rate Constants (in cm3 molecule−1 s−1) for the CF2OO + CH4 → CF2O + CH3OH Reaction.
| T(K) |
TST |
CVT |
CVT/μOMT |
| 100 |
3.56 × 10⁻²⁹
|
1.58 × 10⁻²⁹
|
1.08 × 10⁻²³
|
| 150 |
2.69 × 10⁻²³
|
1.25 × 10⁻²³
|
4.06 × 10⁻²²
|
| 200 |
2.87 × 10⁻²⁰
|
1.37 × 10⁻²⁰
|
5.26 × 10⁻²⁰
|
| 250 |
2.15 × 10⁻¹⁸
|
1.04 × 10⁻¹⁸
|
2.19 × 10⁻¹⁸
|
| 298.15 |
3.84 × 10⁻¹⁷
|
1.87 × 10⁻¹⁷
|
3.05 × 10⁻¹⁷
|
| 300 |
4.21 × 10⁻¹⁷
|
2.06 × 10⁻¹⁷
|
3.33 × 10⁻¹⁷
|
| 350 |
3.78 × 10⁻¹⁶
|
1.86 × 10⁻¹⁶
|
2.61 × 10⁻¹⁶
|
| 400 |
2.07 × 10⁻¹⁵
|
1.03 × 10⁻¹⁵
|
1.32 × 10⁻¹⁵
|
| 500 |
2.50 × 10⁻¹⁴
|
1.25 × 10⁻¹⁴
|
1.45 × 10⁻¹⁴
|
| 600 |
1.47 × 10⁻¹⁴
|
7.35 × 10⁻¹⁴
|
8.14 × 10⁻¹⁴
|
Table 6.
Calculated Rate Constants (in cm3 molecule−1 s−1) for the CF2OO + C2H6 → CF2O + C2H5OH Reaction.
Table 6.
Calculated Rate Constants (in cm3 molecule−1 s−1) for the CF2OO + C2H6 → CF2O + C2H5OH Reaction.
| T(K) |
TST |
CVT |
CVT/μOMT |
| 100 |
4.55 × 10⁻²⁶
|
3.85 × 10⁻²⁶
|
2.10 × 10⁻²¹
|
| 150 |
8.54 × 10⁻²²
|
8.09 × 10⁻²²
|
2.45 × 10⁻²⁰
|
| 200 |
1.47 × 10⁻¹⁹
|
1.45 × 10⁻¹⁹
|
6.00 × 10⁻¹⁹
|
| 250 |
3.72 × 10⁻¹⁸
|
3.72 × 10⁻¹⁸
|
7.92 × 10⁻¹⁸
|
| 298.15 |
3.31 × 10⁻¹⁷
|
3.31 × 10⁻¹⁷
|
5.20 × 10⁻¹⁷
|
| 300 |
3.56 × 10⁻¹⁷
|
3.56 × 10⁻¹⁷
|
5.54 × 10⁻¹⁷
|
| 350 |
1.92 × 10⁻¹⁶
|
1.91 × 10⁻¹⁶
|
2.50 × 10⁻¹⁶
|
| 400 |
7.21 × 10⁻¹⁶
|
7.12 × 10⁻¹⁶
|
8.35 × 10⁻¹⁶
|
| 500 |
5.16 × 10⁻¹⁵
|
5.00 × 10⁻¹⁵
|
5.19 × 10⁻¹⁵
|
| 600 |
2.13 × 10⁻¹⁴
|
2.03 × 10⁻¹⁴
|
1.98 × 10⁻¹⁴
|
Table 7.
Calculated Deuterium Kinetic Isotope Effects and Contributions of CH2OO + CH4/CH2OO + CD4.
Table 7.
Calculated Deuterium Kinetic Isotope Effects and Contributions of CH2OO + CH4/CH2OO + CD4.
| T(K) |
TST |
CVT |
CVT/μOMT |
|
|
|
|
|
| 100 |
10.4 |
9.34 |
1.95 × 10³
|
|
|
3.63 |
0.897 |
209 |
| 150 |
5.39 |
5.06 |
159 |
|
|
1.88 |
0.939 |
31.4 |
| 200 |
3.80 |
3.64 |
10.7 |
|
|
1.32 |
0.958 |
2.95 |
| 250 |
3.04 |
2.95 |
3.91 |
|
|
1.06 |
0.969 |
1.33 |
| 298.15 |
2.61 |
2.55 |
2.84 |
1.27 |
2.26 |
0.909 |
0.976 |
1.12 |
| 300 |
2.60 |
2.53 |
2.82 |
|
|
0.904 |
0.976 |
1.11 |
| 350 |
2.31 |
2.26 |
2.37 |
|
|
0.803 |
0.980 |
1.05 |
| 400 |
2.10 |
2.03 |
2.11 |
|
|
0.731 |
0.984 |
1.02 |
| 500 |
1.82 |
1.80 |
1.80 |
|
|
0.635 |
0.989 |
0.998 |
| 600 |
1.65 |
1.64 |
1.62 |
|
|
0.575 |
0.991 |
0.991 |
Table 8.
Calculated Deuterium Kinetic Isotope Effects and Contributions of CH2OO + C2H6/CH2OO + C2D6.
Table 8.
Calculated Deuterium Kinetic Isotope Effects and Contributions of CH2OO + C2H6/CH2OO + C2D6.
| T(K) |
TST |
CVT |
CVT/μOMT |
|
|
|
|
|
| 100 |
17.0 |
12.2 |
1.00 × 10³
|
|
|
8.86 |
0.714 |
82.8 |
| 150 |
7.13 |
5.92 |
137.5 |
|
|
3.71 |
0.831 |
23.2 |
| 200 |
4.55 |
4.06 |
14.0 |
|
|
2.37 |
0.894 |
3.45 |
| 250 |
3.44 |
3.20 |
5.03 |
|
|
1.79 |
0.931 |
1.57 |
| 298.15 |
2.85 |
2.72 |
3.42 |
1.17 |
1.64 |
1.49 |
0.953 |
1.26 |
| 300 |
2.84 |
2.71 |
3.38 |
|
|
1.48 |
0.954 |
1.25 |
| 350 |
2.46 |
2.39 |
2.71 |
|
|
1.28 |
0.970 |
1.14 |
| 400 |
2.20 |
2.16 |
2.33 |
|
|
1.15 |
0.980 |
1.08 |
| 500 |
1.88 |
1.87 |
1.91 |
|
|
0.979 |
0.992 |
1.02 |
| 600 |
1.69 |
1.68 |
1.68 |
|
|
0.878 |
0.998 |
0.999 |
Table 9.
Calculated Deuterium Kinetic Isotope Effects and Contributions of CH216O16O + CH4/CH218O18O + CD4.
Table 9.
Calculated Deuterium Kinetic Isotope Effects and Contributions of CH216O16O + CH4/CH218O18O + CD4.
| T(K) |
TST |
CVT |
CVT/μOMT |
|
|
|
|
|
| 100 |
1.23 |
1.24 |
6.40 |
|
|
1.13 |
1.00 |
5.18 |
| 150 |
1.16 |
1.16 |
4.57 |
|
|
1.07 |
0.999 |
3.94 |
| 200 |
1.12 |
1.12 |
2.09 |
|
|
1.03 |
0.998 |
1.87 |
| 250 |
1.10 |
1.10 |
1.35 |
|
|
1.01 |
0.997 |
1.23 |
| 298.15 |
1.08 |
1.08 |
1.19 |
1.03 |
1.05 |
0.997 |
0.997 |
1.10 |
| 300 |
1.08 |
1.08 |
1.19 |
|
|
0.997 |
0.997 |
1.10 |
| 350 |
1.07 |
1.07 |
1.14 |
|
|
0.987 |
0.997 |
1.06 |
| 400 |
1.06 |
1.06 |
1.11 |
|
|
0.980 |
0.997 |
1.04 |
| 500 |
1.06 |
1.05 |
1.08 |
|
|
0.971 |
0.998 |
1.03 |
| 600 |
1.05 |
1.05 |
1.07 |
|
|
0.967 |
0.998 |
1.02 |
Table 10.
Calculated Deuterium Kinetic Isotope Effects and Contributions of CH216O16O + C2H6/CH218O18O + C2H6.
Table 10.
Calculated Deuterium Kinetic Isotope Effects and Contributions of CH216O16O + C2H6/CH218O18O + C2H6.
| T(K) |
TST |
CVT |
CVT/μOMT |
|
|
|
|
|
| 100 |
1.23 |
1.27 |
10.1 |
|
|
1.11 |
1.04 |
7.91 |
| 150 |
1.16 |
1.19 |
5.84 |
|
|
1.05 |
1.03 |
4.92 |
| 200 |
1.12 |
1.14 |
2.15 |
|
|
1.01 |
1.02 |
1.89 |
| 250 |
1.10 |
1.11 |
1.42 |
|
|
0.991 |
1.01 |
1.27 |
| 298.15 |
1.08 |
1.09 |
1.24 |
1.05 |
1.06 |
0.978 |
1.01 |
1.14 |
| 300 |
1.08 |
1.09 |
1.24 |
|
|
0.977 |
1.01 |
1.14 |
| 350 |
1.07 |
1.08 |
1.17 |
|
|
0.968 |
1.01 |
1.08 |
| 400 |
1.06 |
1.07 |
1.13 |
|
|
0.961 |
1.01 |
1.06 |
| 500 |
1.06 |
1.06 |
1.09 |
|
|
0.953 |
1.00 |
1.03 |
| 600 |
1.05 |
1.05 |
1.08 |
|
|
0.948 |
1.00 |
1.02 |