
Submitted:
19 November 2025
Posted:
21 November 2025
You are already at the latest version
Abstract
The fall armyworm [Spodoptera frugiperda (Lepidoptera: Noctuidae)] is the most destructive pest of maize, and nonchemical insecticide control is required. In this study, the ethanolic extracts of neem (Azadirachta indica) and moringa (Moringa oleifera), as well as maize-associated bacterial isolates, were assessed for direct fumigant toxicity against FAW. GC-MS analysis revealed tissue-specific chemical diversity with eight important bioactive compounds, namely trimethyl fluorosilane and hexadecanoic acid from neem, whereas ethyl oleate and octadecanoic acid were detected in moringa. Eighty-nine bacterial isolates were tested for extracellular enzyme activities (cellulase, chitinase, glucanase, and protease) and siderophore production, among which 4 strains designated as DR-55 (Bacillus subtilis), HL-7 (Bacillus cereus), HL-37 (Bacillus cereus), and DR-63 (Enterobacter sp.) expressed >50% biocontrol activity under greenhouse conditions. Larval mortality of FAW varied depending on the stage, being higher (80-88%) in larvae, moderate (15-17%) in pupae, and low (6-7%) in adults, with LC₅₀ values of 2.16, 1.28, and 1.85, respectively. High relationships were found between in vitro antagonism and the efficacy under field conditions (r = 0.73-0.88), confirming the predictive performance of laboratory screening methods. These findings suggest that the addition of plant bioactive extracts to maize-associated microbial isolates offers a strong and non-hazardous stage-targeted integrated pest management practice, which can effectively suppress FAW while maintaining the good health of the maize plant, even with reduced application of synthetic insecticides.
Keywords:
bacterial isolates
; bio-extracts
; biocontrol agents
; fall armyworms
1. Introduction
The fall armyworm (FAW), Spodoptera frugiperda (Lepidoptera: Noctuidae), is a majorly polyphagous pest that can infest over 350 plant species from more than 70 families of plants [1]. This destruction is especially dire for autostaple crops, like maize, and has serious consequences on food security and the livelihoods of smallholder farmers. Upon its invasion into the Old World, FAW has quickly expanded across Africa, also among West African countries such as Liberia, with severe yield losses and disruption of local agricultural systems [2,3]. The knowledge of the effect of FAW on crop yield is crucial to the implementation of appropriate pest management tactics, such as the bio-extraction and biocontrol methods [4,5,6].
Traditional control strategies, such as synthetic chemical insecticides, are associated with environmental and public health issues, thus increasing demand for an eco-friendly and sustainable alternative [7]. Under certain circumstances, the plant-based biopesticides, especially neem (Azadirachta indica) and moringa (Moringa oleifera), have gained popularity as they are insecticidal in action, have historical usage, and are relatively safe to use [8,9,10]. Neem has active compounds, which include nimbidin that disrupts insect life cycles; the same can be recommended for moringa alongside its nutritional and therapeutic uses as well, due to its pesticide potential that will kill or cause pest host death [11,12]. Even though neem and moringa have been reported to be effective, there are restricted reports on their combined effects against FAW, and this signifies a research gap towards sustainable pest management strategies.
This study seeks to assess the potential of bio-extract from neem and moringa in combination with naturally occurring bacteria exhibiting FAW biocontrol potential as an alternative and sustainable option for controlling this pest. Isolate bioactive compounds in neem and moringa extracts using GC-MS. The isolates were biochemically characterized for activity of extracellular hydrolytic enzymes and antagonistic spectrum; genetic diversity was analyzed by ARDRA (amplified rDNA restriction analysis) and BOX-PCR, while 16S rDNA sequencing was used to determine the phylogeny. Field studies were carried out to investigate relationships among FAW mortality, crop growth, yield performance, and biocontrol efficiency. By filling a knowledge gap for the IPM, comprehensive evidence on an eco-friendly, effective, and sustainable biopesticide strategy is offered against FAW.
2. Materials and Methods
2.1. Site and Experiment Design
The experiments were carried out at the Central Agricultural Research Institute (CARI), Bong County, Liberia (7°00’ N 9°34’ W; altitude 245 m) with a tropical climate (mean annual rainfall of 2,195 mm and temperature of 20.7 °C). The soil was slightly acidic (pH 6.0-6.5), loamy, and with a moderate content of organic matter (2.7%). Maize (Zea mays) was sown in RCBD design with blocks at 120 cm apart and plots at 90 cm apart, having an intra-row spacing of 60 cm.
2.2. Preparation of Plant Bio-Extracts
Neem (Azadirachta indica) and moringa (Moringa oleifera) leaves were air-dried at 22-28 °C for 48-72 h, powdered, and extracted with methanol-water mixtures to provide five extracts of varying concentrations (T1-T5; 20-100 mg powder/100 mL). Controls were water (T6) and solvent-only treatments. After solubilization, the extracts were kept at 4 °C and characterized for bioactive components (azadirachtin, for instance) using HPLC/GC-MS.
2.3. Bacterial Isolation and Preparation
Maize tissues (leaflet, stem, and root) were surface-sterilized, ground, diluted, and then plated on R2A. The colonies were purified and stored at -70°C in 48-50% glycerol and cultured in LB medium (28 °C, 180 rpm for 24 hours); then the bacterial suspensions were adjusted to a density of CDH cells equal to 5 × 10⁵ CFU/mL in sterile 0.85% NaCl solution for other studies.
2.4. Bioactive Compound Profiling (GC-MS)
Neem and moringa were also GC-MS analyzed in a Thermo GC-Trace Ultra with DSQ II MS, column DB-35-MS (30 m × 0.25 mm × 0.25 μm), helium carrier gas (1 mL/min), injector 250°C, and oven ramp 60-280°C. Compound identification was based on NIST and Wiley libraries as triplicate (GC-Wiley).
2.5. Exoenzyme and Siderophore Screening
The extracellular amylase enzyme was assayed using the agar plate method, i.e., (1%) Congo red and (1%) starch. For cellulase, chitinase, glucanase, protease, and siderophore production, bacterial isolates were tested on specific selective media. Activity was determined by the presence of hyaline zones around colonies.
2.6. Biocontrol Assessment
Scores were assigned from 0-3 for each enzyme/siderophore and totaled (maximum value 15), describing the biocontrol potential. Percent antagonists per origin:
Isolates were scored 0-3 for each enzyme/siderophore, with total scores (max 15) indicating biocontrol potential. Percent antagonists per origin:
2.7. ARDRA and BOX-PCR Fingerprinting
Total genomic DNA was isolated with Mini BEST kits. 16S rDNA was amplified (U8-27 and L1494-1514), digested with AluI+MspI, and analyzed by agarose-Synergel gels. Genomic fingerprinting was performed using BOX-PCR with the BOX A1R primers. Each PCR reaction was carried out in triplicate.
2.8. Greenhouse Experiment
Maize uniformly in the vegetative stage was sprayed with bio-extracts and bacterial suspensions in three replicas (9 plants/replicate, 1 m² per treatment). FAW (S. frugiperda) damage was rated 0-5 (0 = no damage; 5 = complete defoliation). FAW mortality rates and biocontrol effectiveness relative to FAW were calculated:
2.9. Field Experiment
RCBD was used for maize (blocks 1 m apart, plots 70 cm apart, intra-row 50 cm, 12 plants/replicate). Vegetative-stage applications consisted of six bioactive phytochemical suspensions and a water control. FAW density was measured weekly as larvae per plant, considering larval migration between the plots.
2.10. Data Collection and Analysis
FAW densities and biocontrol effectiveness were evaluated through standard scoring sheets. Densitometric analysis of ARDRA and BOX-PCR fingerprints was investigated by Pearson correlation. Clustering of isolates used UPGMA. The obtained representative 16S rRNA sequences were analyzed based on the NCBI database using BLAST. Mortality and Effectiveness Contrasts for mortality and efficacy were performed using ANOVA (DPS v7.03) for mean separation by Fisher’s LSD (p < 0. Relationships between the potential efficacy of biocontrol were calculated using JMP Pro 14 (Figure 2).
Figure 1.
Graphical Abstract Concept.
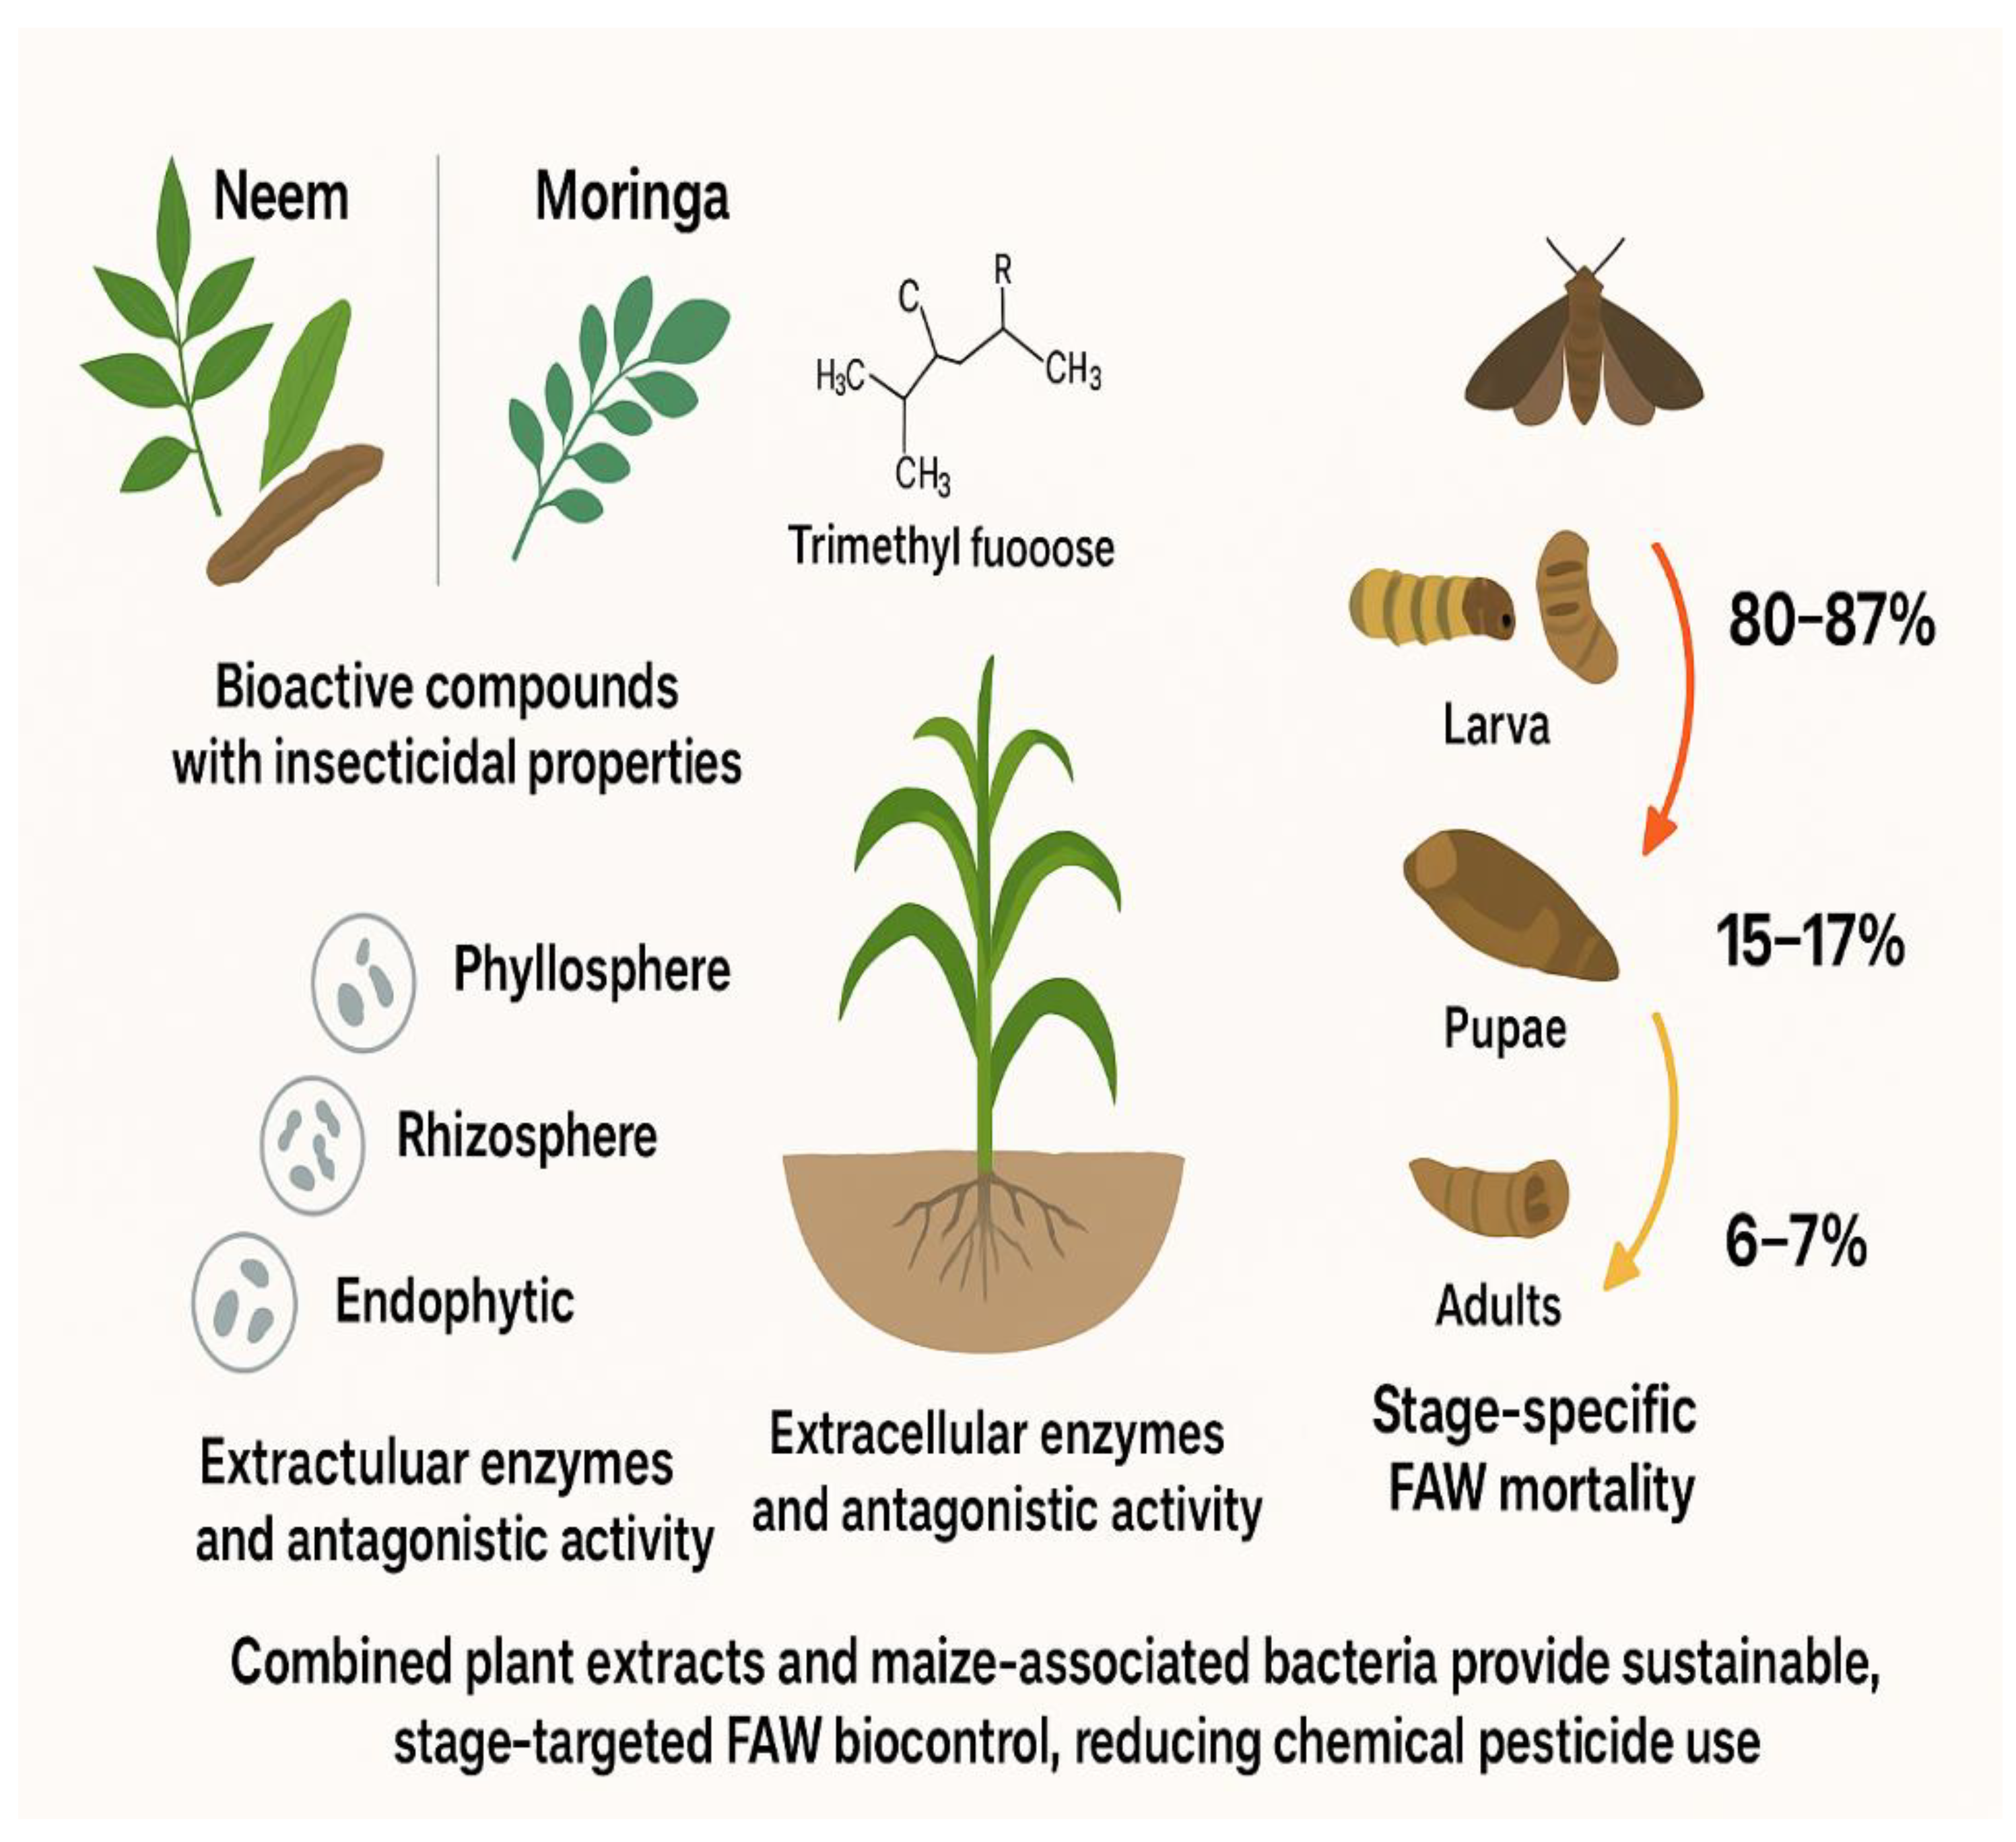
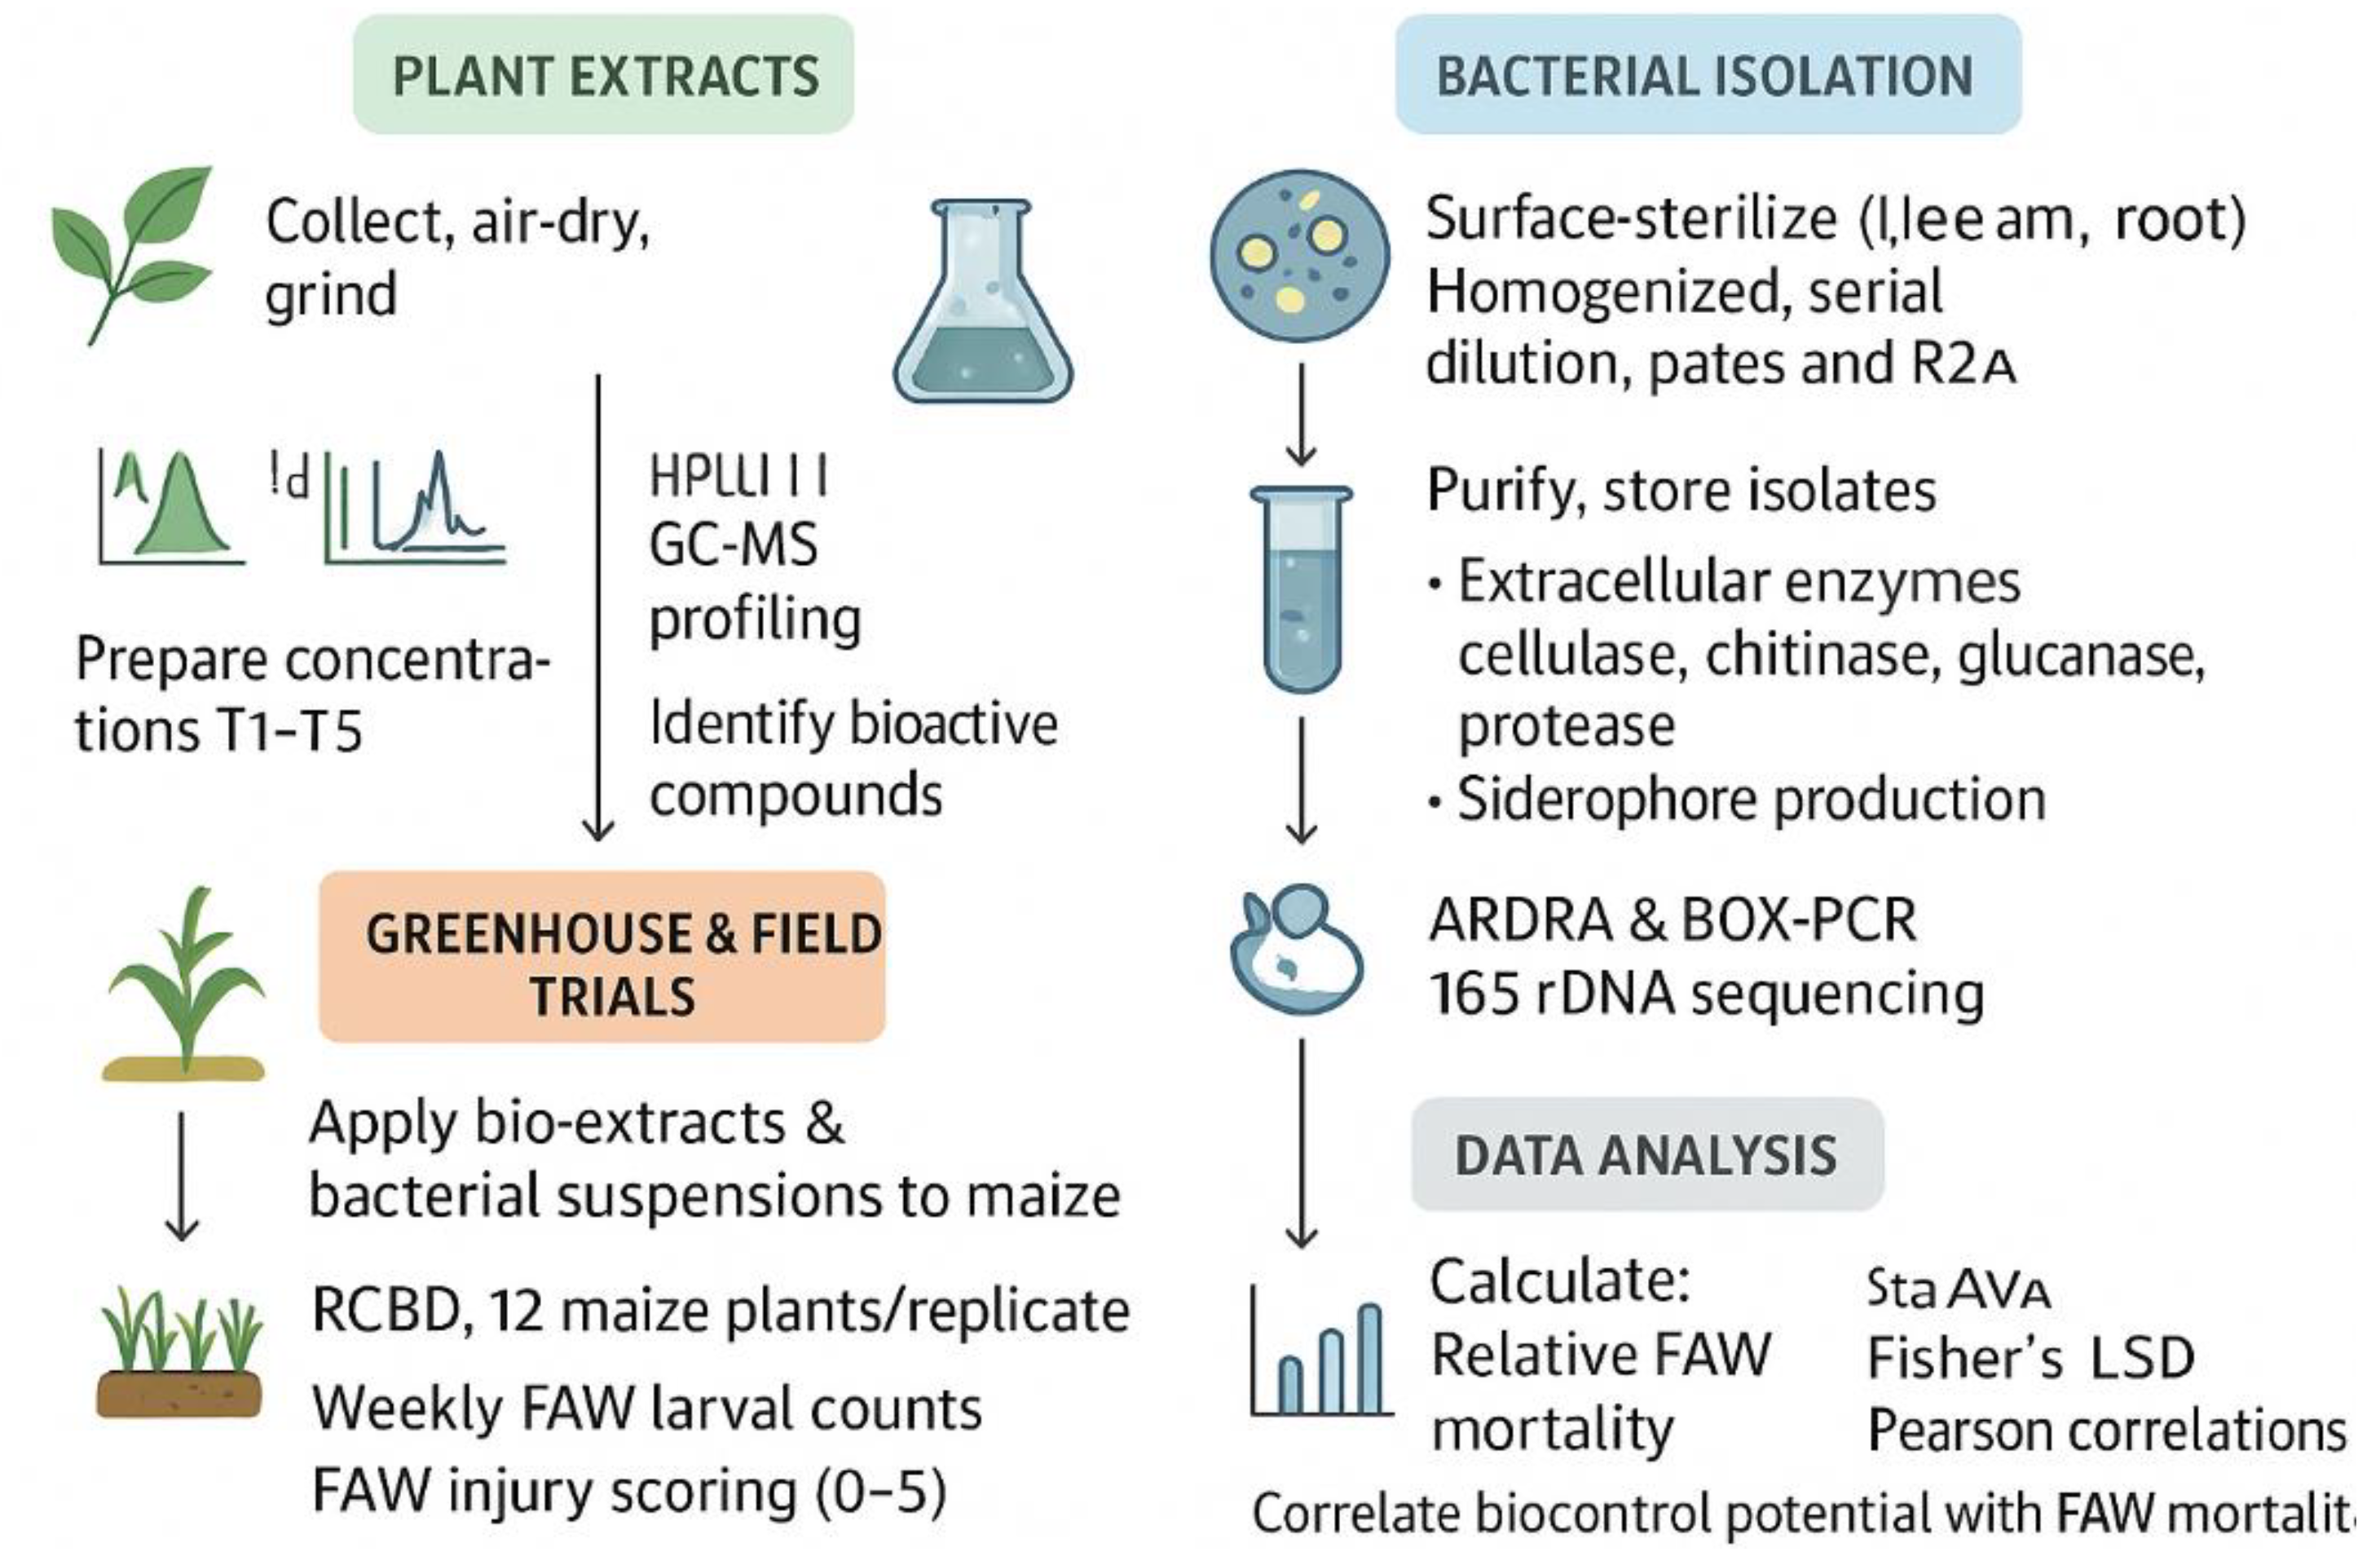
Figure 2.
Integrated Workflow for Neem/Moringa and Biocontrol Agent-Based FAW Management.
3. Results
3.1. GC-MS Analysis of Bio-Extracts
In neem (Azadirachta indica) and moringa (Moringa oleifera), 3 plant parts (root, bark, and leaf) were investigated for bioactive compounds. GC-MS profiling revealed several phytochemicals, of which eight principal bioactive compounds were identified in the ethanolic extracts of both species (Table 1). Five compounds originated from Moringa oleifera, and three from neem. For each compound, the retention time (RT), molecular formula, molecular weight (MW), concentration (peak area%), and reported biological activities were recorded, thus emphasizing the potential pharmacological significance of these extracts.
The GC-MS data of Moringa oleifera and Azadirachta indica (Neem) ethanolic extracts were used to conduct a hierarchical clustering analysis (Ward's method, Euclidean distance). The C1-C6 clusters in which the eight compounds were detected were categorized by retention time, peak intensity, and percentage area (Figure 3). Compounds of the same cluster presented closer chromatographic and quantitative characteristics. It was observed that trimethyl fluorosilane obtained from neem bark (C1) and hexadecanoic acid obtained from neem root (C2) were placed in separate clusters, which reflects their intensity and relative peak area as compared to others. A similar pattern was observed from the Moringa leaves for ethyl oleate and trimethyl fluorosilane, grouped in cluster C3 due to similarities in spectral behavior and bioactivity profile. On the other hand, participants of Moringa bark (ethyl(9Z,12Z) and octadecanoic acid) were together in C5, showing a similar constitution or operation. The corresponding dendrogram unambiguously separates the interspecific and intratissue variation for the different metabolites, emphasizing the biochemical diversity of both types.
3.2. Measurement of Extracellular Hydrolytic Enzyme and Siderophore Productions
The highest enzymatic potential was seen for phyllosphere and soil isolates (Table 2) due to their exposure to and interaction with a wide array of microbes. On the other hand, endorhizal and stem interior isolates were moderate enzyme producers, which might reflect a more specialized role for these fungi in colonizing internal tissues of plants. These findings are reminiscent of other studies that emphasized the role of extracellular enzymes in microbial interactions and plant health. Four potential isolates (DR-55, DR-63, HL-7, and HL-37) with a population of bacteria between 5.3 × 10⁵ to 6.5 × 10⁶ CFU/g on maize tissue were further evaluated in vivo (Table 2). These isolates showed the potential to be an effective biocontrol agent and were chosen for additional investigations.
Profiles of enzyme activities differed markedly across bacterial isolates from different maize tissues (Table 3). Antagonistic activities of selected bacterial isolates were determined based on the amount of extracellular hydrolytic enzymes such as cellulase-chitinase-glucanase-protease-siderophore (Table 4). Taken together, these patterns indicate that maize-associated bacteria have various biochemical traits that could be beneficial for biological control and plant health.
A total of 720 isolates tested had a score above 2, from which subsequently those over the cut-off were submitted to ARDRA and BOX-PCR analysis (to remove redundancy). A range of 65% similarity based on distance, ten clusters were determined (Figure 4A), clusters containing 1 to 89 isolates. The other thirty top strains were analyzed by genotyping using BOX-PCR, and six groups of genetically heterogeneous isolates were found (Figure 4B). PCR amplification of the 16S rRNA gene was performed to confirm the taxonomic identity of these strains.
3.3. Effectiveness of Biocontrol Agents Against Fall Armyworm (FAW) Under Greenhouse
Out of 35 bacterial isolates tested, four strains (DR-55, DR-63, HL-7, and HL-37) exhibited more than 50% biocontrol activity against FAW (Table 5). Based on 16S rDNA sequences, strain DR-55 was Bacillus subtilis, whereas HL-7 and HL-37 were identified as B. cereus, and strain DR-63 belonged to Enterobacter sp. These identifications were supported by physiological and biochemical characterization. These findings highlight the potential of using maize-colonizing bacteria in IPM, especially with respect to major insect pests such as FAW.
3.4. Correlation Between Assessment Scores and Biocontrol Efficacy
Pearson correlation analysis showed highly significant correlations between in vitro antagonistic tests and field efficacy (Figure 5). In particular, the correlation coefficients of antagonistic tests and assessment scores (and greenhouse tests) were 0.76 and 0.88, respectively, indicating that higher assessment scores could predict biocontrol potency better (Figs. 6 and 7).
(Figure 6) Pearson correlation analysis also showed a significant moderate positive correlation between antagonism and biocontrol efficacy (). The regression model accounted for approximately 33.2% of the variation in biocontrol efficacy ()). These results show that isolates that have a higher antagonism potential cause a better pest suppression in greenhouse conditions.
(Figure 7) recognized that biocontrol activity also increased in relation to the level of assessment score. Thus, higher scores in the assessment are presumably correlated with highly efficient biocontrol performance. The red solid line is a linear fit with r = 0.76, showing a positive correlation between the two measurements. In conclusion, the graph shows that biocontrol performance is better as scores are higher; there is therefore a strong correlation between biological assessment metrics and effective control.
3.5. Fall Armyworm Mortality Rate
The stage-dependent efficacy of the treatments was observed for S. frugiperda (Table 6). Mortality was the highest in larval, moderate in pupal, and lowest in adult stages, revealing that the larvae are more sensitive to the tested extract or compounds. Mortality induced by all concentrations of T3, T4, and T5 was found to be significantly higher at different stages (larval 80%, pupal 15-17%, and adult 6-7%). These treatments are obviously the most effective and may be considered as the first choice in pest management. Moderate larvicidal activity (13-31%) of T1 and T2, with low effect provided to pupae and adults (8-10% housing 2-3%, respectively). Control (T6): Mortality was very close to zero through all stages, validating a low-level natural mortality and species-specific effect of the exposure (Table 6).
In general, the model fitted very well (R² = 0.985), indicating that larval mortality was highly dose dependent (Figure 8). The LC₅₀ value was estimated to be 2.16 (the concentration at which there would be 50% mortality). At higher concentrations of extract, mortality rose rapidly beyond this level, resulting in a predicted maximum response of 85%. In addition, (Figure 9 ) demonstrated a good fit (R² = 0.952). The LC₅₀ value for pupae was 2.24, indicating that pupae were more susceptible and had lower tolerance to the insecticide compared to larvae, demanding a lower concentration and thus being more sensitive to produce the desired point at 50% mortality compared with larvae. The estimated highest mortality response was predator pupae susceptibility at 15.97%. In summary, (Figure 9) admitted the model was also fitted well (R² = 0.972), with an estimated LC₅₀ of 2.24. Even where adults had the lowest overall estimated mortality, the effect was still seen to be dose-dependent, and a maximum predicted mortality of 6.97% occurred.
Taken together, these results indicate that bioactive compounds of the neem and moringa combination apply to efficiently control FAW and improve maize growth and yield (Figure 10). The high correlation between in vitro assays, FAW mortality, and crop yield indicates that these natural extracts and microorganisms could be used in sustainable pest control strategies.
4. Discussion
This research shows the combined efficacy of neem (Azadirachta indica) and moringa (Moringa oleifera) bio-extracts with maize bacteria isolates against Spodoptera frugiperda, or FAW. Results are consistent with and complement prior studies on plant bioactive compounds and microbial biocontrol agents.
GC-MS analysis (Table 1) showed eight major bioactive compounds: five from moringa and three from neem. Trimethyl fluorosilane and hexadecanoic acid were clustered distinctly, presumably due to higher abundance and a possible bioactive compound profile (Figure 3). These findings agreed with some previous studies, which also indicated the presence of azadirachtin in neem, nimbolide in moringa, and phytosterols in neem and phenolic compounds present in moringa [10,12,14]. It is worth mentioning that in this study, we also found compounds such as ethyl oleate clustering with trimethyl fluorosilane, which has not been frequently reported by previous studies, implying that the tissue-specific extraction may unveil new or less studied metabolites.
Isolates from leaf and soil (Table 2) showed the highest enzymatic potentials, as they were exposed to thousands of microorganisms. On the other hand, endorhizal and stem interior isolates exhibited moderate enzymatic activity levels, which may suggest that they have a more specialized function for internal plant colonization. This agrees with the results of [15] concerning the significance of extracellular enzymes on interspecific microbial interactions and plant health. Subsequent in vivo tests on sets of maize tissues revealed four promising isolates (DR-55, DR-63, HL-7, and HL-37) with cell densities from 5.3 × 10⁵ to 6.5 × 10⁶ CFU/g (Table 2). These isolates showed high levels of antagonistic potential and were chosen for further analysis.
The enzyme activity patterns were quite different among the bacterial isolates of maize tissues (Table 3). The maize-associated bacterial isolates exhibited various extracellular enzyme activities (cellulase, chitinase, glucanase, protease, and siderophore production). The phyllosphere and soil isolates showed the maximum enzymatic activity, suggesting they could be involved in pathogen antagonism (Table 3). These results agree with [16,17], who noted that actinobacteria in the rhizosphere and endophytic bacteria support plant health by hydrolytic enzymes and secondary metabolites. In contrast to some previous studies that analyzed single tissue isolates, these data demonstrate variation in enzyme activity between maize tissues and developmental stage, which may inform a new paradigm in host-microbe interactions.
Four bacterial strains (Figure 4A,B), identified as DR-55 (Bacillus subtilis), HL-7 and HL-37 (both Bacillus cereus), and DR-63 (Enterobacter sp.), exhibited >50% biocontrol of FAW (Table 4 and Table 5). The high degree of relationship between antagonistic activity in vitro and greenhouse efficacy (r = 0.76-0.88) (Figure 5) demonstrates (Figure 6 and Figure 7) that the in vitro performance measurements can successfully predict the in vivo behavior, which is also reported by [20,21], who determined that Bacillus sp. reached high FAW control suppression. strains. The current report includes Enterobacter sp. (DR-63), which has been infrequently reported as an agent for FAW biocontrol. It also indicates that endophytes of maize appear to be an underexplored source of effective biocontrol agents.
The FAW death patterns (Table 6) indicated that the larvae were highly susceptible (>80%), followed by pupae (15-17%), and adult mortality was low (6-7%). Logistic modeling confirmed (Figure 8 and Figure 9) that those effects are stage dependent, with lower LC₅₀ values from larvae to pupae. Similar trends have been reported in other studies on neem and moringa extracts against lepidopteran pests, where early developmental stages are more sensitive as they possess thinner cuticles and higher metabolic activity [12,22,23]. Nevertheless, the combination of plant extracts with bacterial isolates in this study is more effective than single treatments observed elsewhere, and it demonstrates that synergism can be reached.
A combination of bioactive plant extracts (Figure 10) represents a promising and environmentally friendly approach for FAW control. We also found that young larvae fed on leaf tissue from one aspect of the lamina before damaging the other epidermal layer (Figure 10). Feeding damage was reduced significantly by neem and moringa treatments when compared to the control. Control plants inflicted long lesions, destroyed whorl leaves, and caused severe leaf drop on larvae, while neem and moringa treatments T3, T4, and T5 with high concentrations had not shown any visible damage. Previous investigations tend to be more concerned with plant-based insecticides or microbial biocontrol alone rather than in combination [13,20]. In contrast, our research shows that integrating both application methods not only increases effective control but also covers multiple pest generations, thereby creating an integrated management plan (IPM). The significant associations of in vitro antagonism, enzyme activity, and FAW mortality found in this study further validate the predictive potential of screening metrics for choosing efficient BCAs.
In conclusion, these results corroborate previous observations on the susceptibility of larvae and biocontrol potential exerted by microbes while contributing new elements on tissue phytochemical diversity, stage-dependent efficiency, and interaction between plant-microbe synergy. These findings are beneficial for integrated sustainable pest management and reducing the usage of chemical insecticides and are conducive to maize growth and production.
Author Contributions
Conceptualization: methodology, software, validation, formal analysis, investigation, resources, data curation, and writing original draft preparation were done by David P. Tokpah, and writing review editing, visualization, and supervision were done by Ovgu Isbilen. All authors have read and agreed to the published version of the manuscript.
Funding
No funding was received to assist with the preparation of this manuscript.
Institutional Review Board Statement
Not applicable.
Informed Consent Statement
Not applicable.
Data Availability Statement
Not applicable.
Acknowledgments
The authors would also like to thank the Department of Bioengineering, Cyprus International University, and CARI, Liberia, for their warmest assistance during this research.
Conflicts of Interest
The authors declare no conflict of interest.
References
- Malik, S.; Kumari, S.; Singh, R.; Kumar, R.; Chauhan, V. Worldwide Distribution and Management of Fall Armyworm: A Review. Environment and Ecology 2025, 43, 624–634. [Google Scholar] [CrossRef]
- Siaw, V.F.; Osae, M.; Larbi, J.A.; Baidoo, P.K.; Osei, M.A. Incidence, prevalence and severity of fall armyworm infestation in Ghana: a case of two maize enclaves in the Ashanti Region of Ghana. Cogent Food & Agriculture 2024, 10, 2325106. [Google Scholar] [CrossRef]
- Ahissou, B.R.; Sawadogo, W.M.; Sankara, F.; Brostaux, Y.; Bokonon-Ganta, A.H.; Somda, I.; Verheggen, F.J. Annual dynamics of fall armyworm populations in West Africa and biology in different host plants. Scientific African 2022, 16, e01227. [Google Scholar] [CrossRef]
- Koffi, D.; Agboka, K.; Adjevi, M.K.A.; Adom, M.; Tounou, A.K.; Meagher, R.L. The natural control agents of the fall armyworm, Spodoptera frugiperda in Togo: moderating insecticide applications for natural control of the pest? . Journal of Pest Science 2023, 96, 1405–1416. [Google Scholar] [CrossRef]
- Dassou, A.G.; Loko, Y.L.E.; Toffa, J.; Gbèmavo, C.; Adjahossou, N.; Tchakpa, C.; Brévault, T. Within-field crop diversity and landscape complexity decrease the abundance of fall armyworm larvae in maize cropping systems. Biological Control 2023, 183, 105260. [Google Scholar] [CrossRef]
- Ajam, A.L.; Karungi, J.; Ogwal, G.; Adumo, S.A.; Paparu, P.; Otim, M.H. Population Dynamics of Fall Armyworm (Lepidoptera: Noctuidae) in Maize Fields in Uganda. Insects 2024, 15, 301. [Google Scholar] [CrossRef]
- Henagamage, A.P. Bio Solubilization of Eppawala Rock Phosphate (ERP) by Fungal-Bacterial Biofilm Action and its Effect on Crop Enhancement of Chili (Capsicum annuum). Sri Lankan Journal of Applied Sciences 2024, 3, 56–64. [Google Scholar]
- Tulashie, S.K.; Adjei, F.; Abraham, J.; Addo, E. Potential of neem extracts as natural insecticide against fall armyworm (Spodoptera frugiperda (JE Smith)(Lepidoptera: Noctuidae). Case Studies in Chemical and Environmental Engineering 2021, 4, 100130. [Google Scholar] [CrossRef]
- Muhammad, A.; Idris, M.B.; Ishaq, A.A.; Abdullah, A.K. The butterfly effect and its implications for resilience in complex socio-ecological systems. Journal of Environmental Science and Economics 2023, 2, 38–49. [Google Scholar] [CrossRef]
- Ghada, B.K.; Marwa, R.; Shah, T.A.; Dabiellil, M.; Dawoud, T.M.; Bourhia, M.; Chiraz, C.H. Phytochemical composition, antioxidant potential, and insecticidal activity of Moringa oleifera extracts against Tribolium castaneum: a sustainable approach to pest management. BMC Plant Biology 2025, 25, 579. [Google Scholar] [CrossRef]
- Adusei, S.; Azupio, S. Neem: A novel biocide for pest and disease control of plants. Journal of chemistry 2022, 2022, 6778554. [Google Scholar] [CrossRef]
- Almadiy, A.A.; Al-Ghamdi, M.S.; Abd Al Galil, F.M.; Dar, S.A. Azadirachtin from Neem (Azadirachta indica): Efficacy and Mechanisms Against Insects and Diseases. In Natural Pesticides and Allelochemicals (pp. 261–278). CRC Press. 2025.
- Sarkar, S.; Singh, R.P.; Bhattacharya, G. Exploring the role of Azadirachta indica (neem) and its active compounds in the regulation of biological pathways: an update on molecular approach. 3 Biotech 2021, 11, 178. [Google Scholar] [CrossRef] [PubMed]
- Bachrouch, O.; Sriti, J.; Zarroug, Y.; Nefzi, H.; Mssada, K.; Maamouri, N.; Abderraba, M. Phenolic profile and biopesticidal potential of Moringa oleifera extracts: antioxidant and insecticidal activities against stored pests. International Journal of Environmental Health Research 2025, 1–12. [Google Scholar] [CrossRef]
- Jha, Y.; Mohamed, H.I. Enhancement of disease resistance, growth potential, and biochemical markers in maize plants by inoculation with plant growth-promoting bacteria under biotic stress. Journal of Plant Pathology 2023, 105, 729–748. [Google Scholar] [CrossRef]
- Tokpah, D.P.; Li, H.; Wang, L.; Liu, X.; Mulbah, Q.S.; Liu, H. An assessment system for screening effective bacteria as biological control agents against Magnaporthe grisea on rice. Biological Control 2016, 103, 21–29. [Google Scholar] [CrossRef]
- Ali, A.; Tabbasum, I.; Azeem, H.; Ölmez, F.; Deveci, G.; Khalid, B.; Mehtab, M. Bacterial endophytes, a resilient way toward sustainable agriculture: provide plant growth promotion and biocontrol of plant pathogens. Journal of Global Innovations in Agricultural Sciences 2023, 11, 153–174. [Google Scholar] [CrossRef]
- Cui, W.; Zhang, J.; Wang, W.; Wu, X.; Luo, X.; Zou, Y.; He, P. Screening native Bacillus strains as potential biological control agents against ginger bacterial wilt and for promoting plant growth. Biological Control 2024, 192, 105510. [Google Scholar] [CrossRef]
- Jena, R.; Choudhury, P.K.; Puniya, A.K.; Tomar, S.K. Efficacy of BOX-PCR fingerprinting for taxonomic discrimination of bifidobacterial species isolated from diverse sources. 3 Biotech 2021, 11, 270. [Google Scholar] [CrossRef]
- Zhang, Y.; Gao, W.; Zhang, H.; Sun, T.; Yang, H.; Liu, Y.; Xu, W. Antagonistic mechanism of Bacillus velezensis HX0039 as a biocontrol agent against Trichoderma virens-induced “Sanghuang” green mold. Applied and Environmental Microbiology 2025, 91, e00005–25. [Google Scholar] [CrossRef]
- Ghafar, M.A.; Ramzan, M.; Haq, I.U.; Akhtar, M.R.; Panhwar, W.A.; Abbas, D.; Wang, L. Sustainable biological control methods for managing fall armyworm (Spodoptera frugiperda) in maize cultivation. Biocontrol Science and Technology 2025, 35, 1088–1123. [Google Scholar] [CrossRef]
- Isman, M.B. Commercial development of plant essential oils and their constituents as active ingredients in bioinsecticides. Phytochemistry reviews 2020, 19, 235–241. [Google Scholar] [CrossRef]
- Devi, M.D.; Muthuswami, M.; Suganthi, A.; Rani, C.I.; Boopathi, N.M. INSIGHTS INTO ARTHROPOD PESTS OF Moringa oleifera: EMERGING THREATS AND MANAGEMENT STRATEGIES. JAPS: Journal of Animal & Plant Sciences 2024, 34. [Google Scholar]
Figure 3.
Hierarchical clustering dendrogram of GC-MS isolates from ethanolic extracts of Moringa oleifera and Azadirachta indica. Note: ● The dendrogram was generated using Ward’s linkage and Euclidean distance based on retention time, intensity, and peak area percentage. ● Each isolate is labeled with its source, plant part, and cluster number (C1-C6) at the base. ● Distinct clustering patterns reveal biochemical divergence between the leaf, bark, and root metabolites of both plant species.
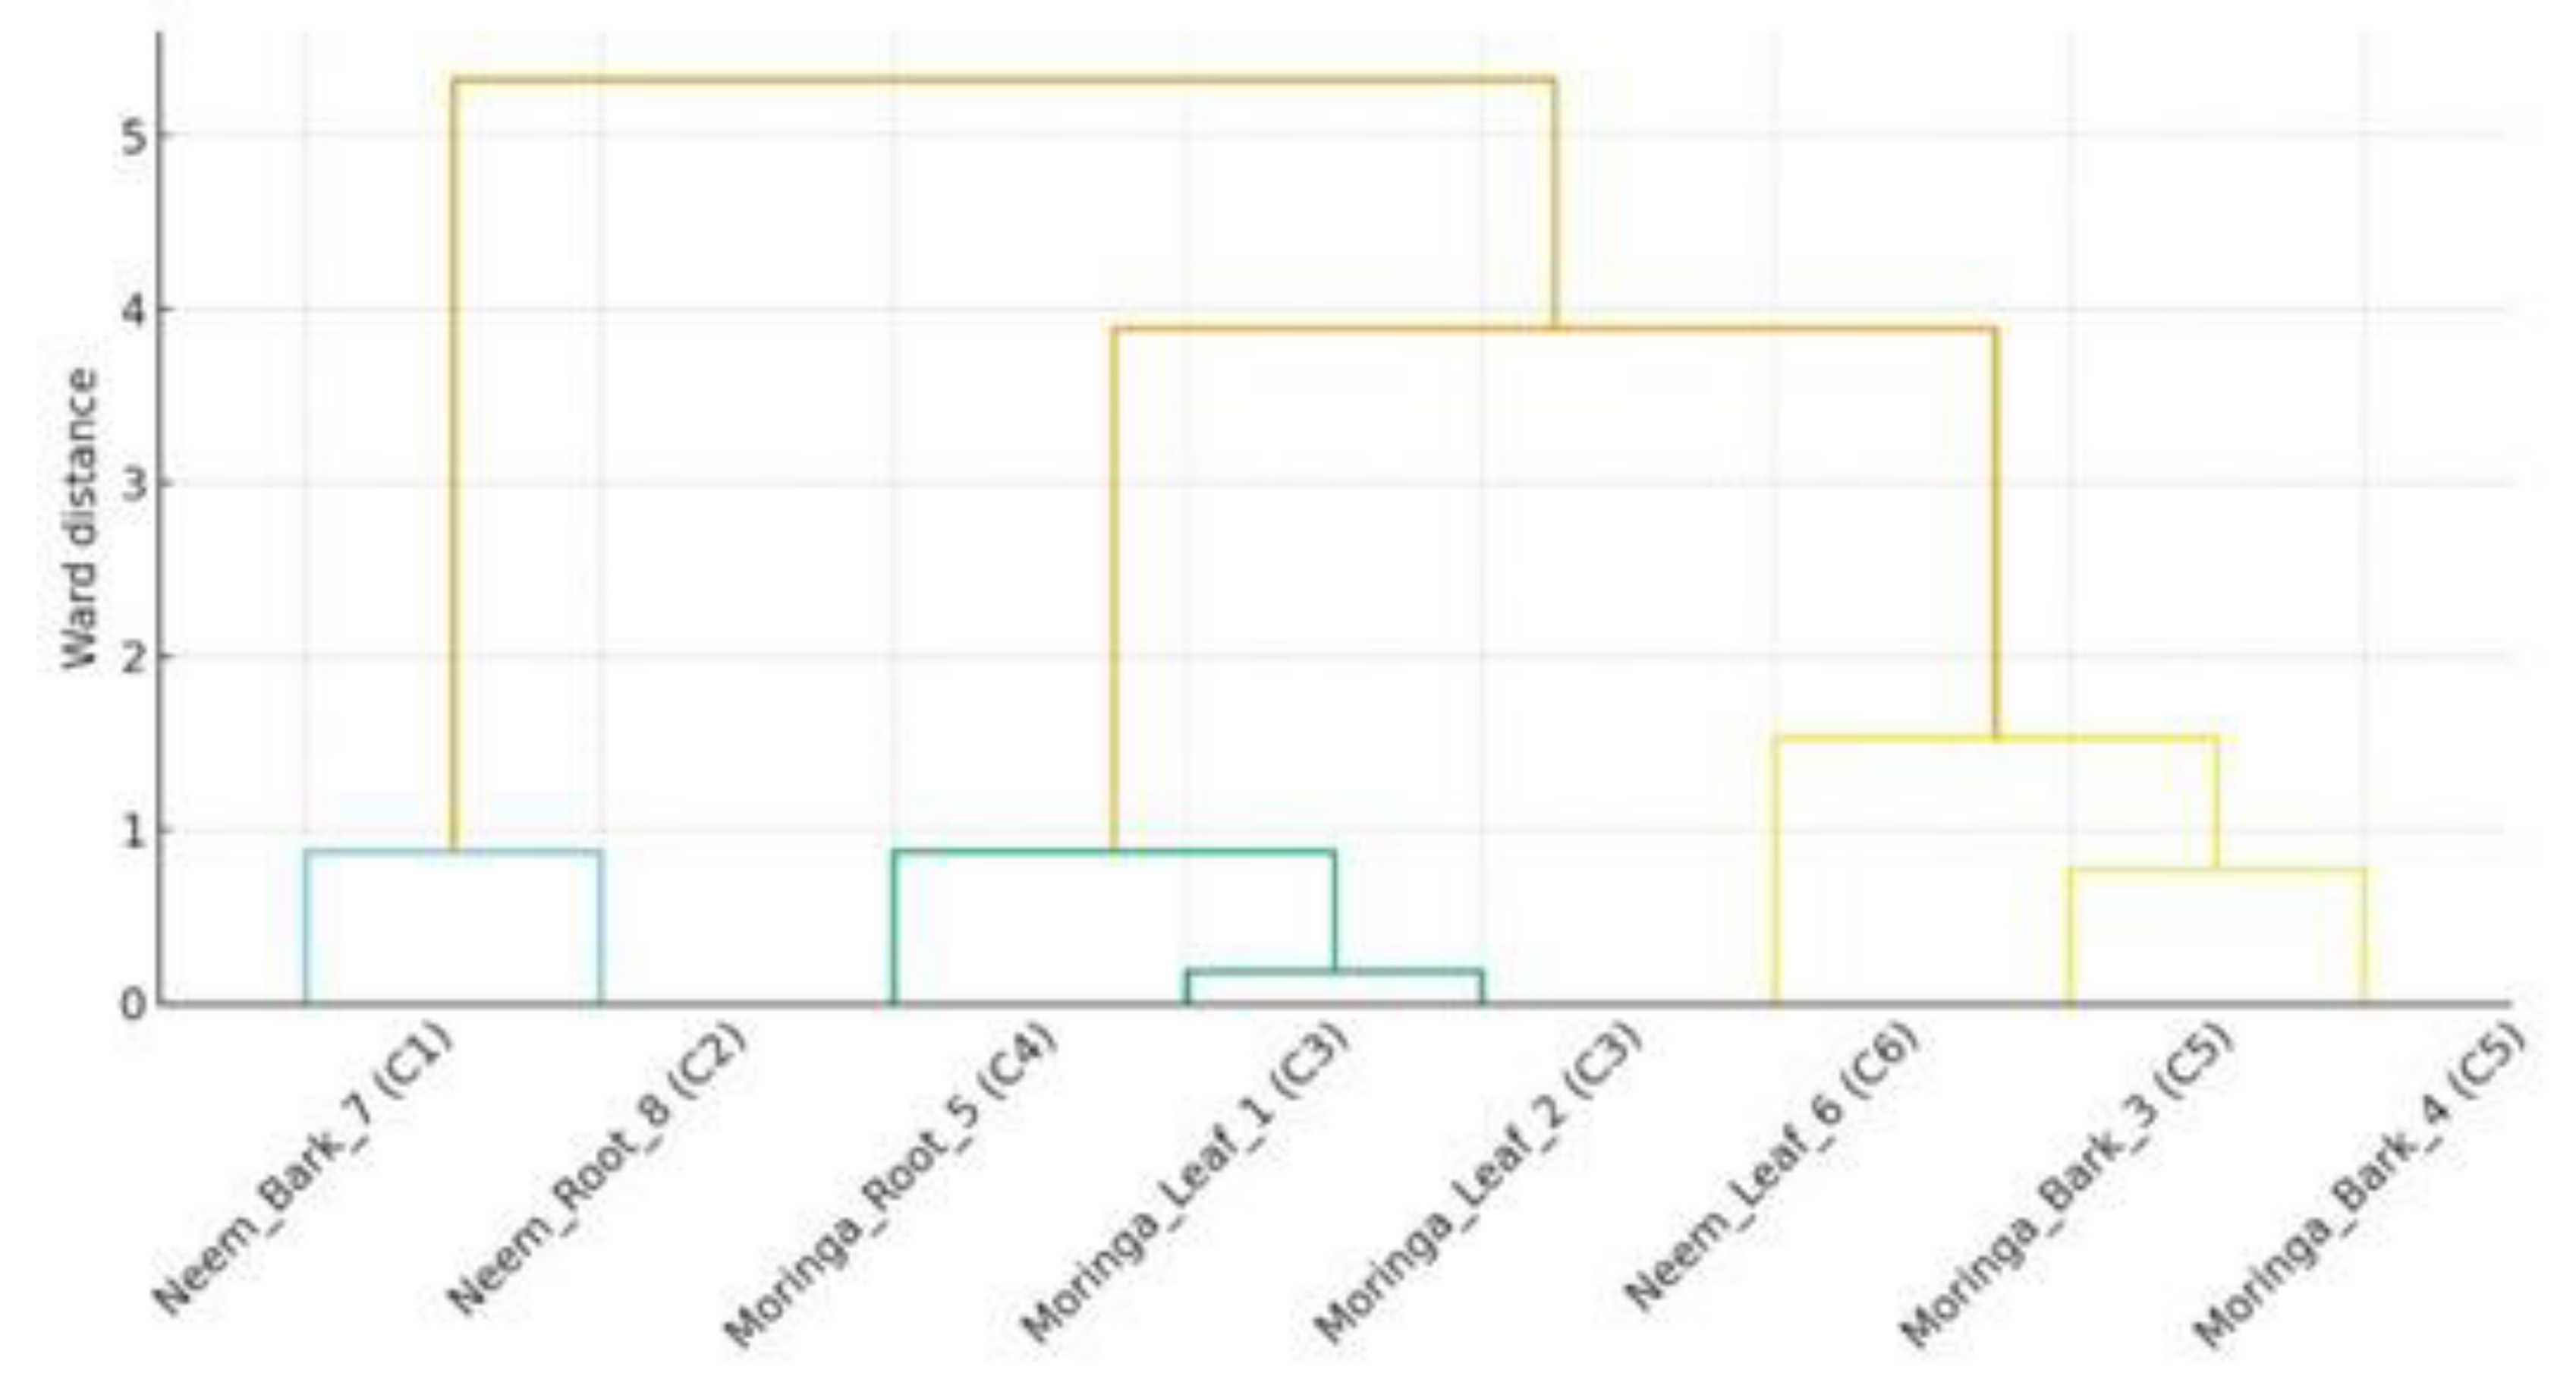
Figure 4.
A. Amplified rRNA restriction analysis and ARDRA fingerprints. Note: ● Displays ARDRA genomic fingerprints and enhanced rRNA restriction analysis. We created the dendrogram using GelCompar® II version 4.5 (Applied Maths BVBA). ● We applied Pearson correlation to the densitometric curves referred to by [18]. We then carried out the analysis using the unweighted pair-group method using arithmetic averages (UPGMA) for clustering analysis. B. Amplified rRNA restriction analysis and BOX-PCR genomic fingerprints. Note: ● Displays BOX genomic fingerprints and enhanced rRNA restriction analysis. We created the dendrogram using GelCompar® II version 4.5 (Applied Maths BVBA). ● We applied Pearson correlation to the densitometric curves referred to by [19]. We then carried out the analysis using the unweighted pair-group method using arithmetic averages (UPGMA) for clustering analysis.

Figure 5.
Correlation between Activity Score and Biocontrol Performance. Note: negative (red dashed line) and positive (green dashed line) linear styles of slope (-5.706) and (0.54), the former indicates higher enzyme scores with lower FAW severity, while the latter indicates progressive biocontrol activity increase with high enzyme richness. This demonstrates in a statistically supported way that enzymatic potential is one of the factors governing pest suppression capacity.
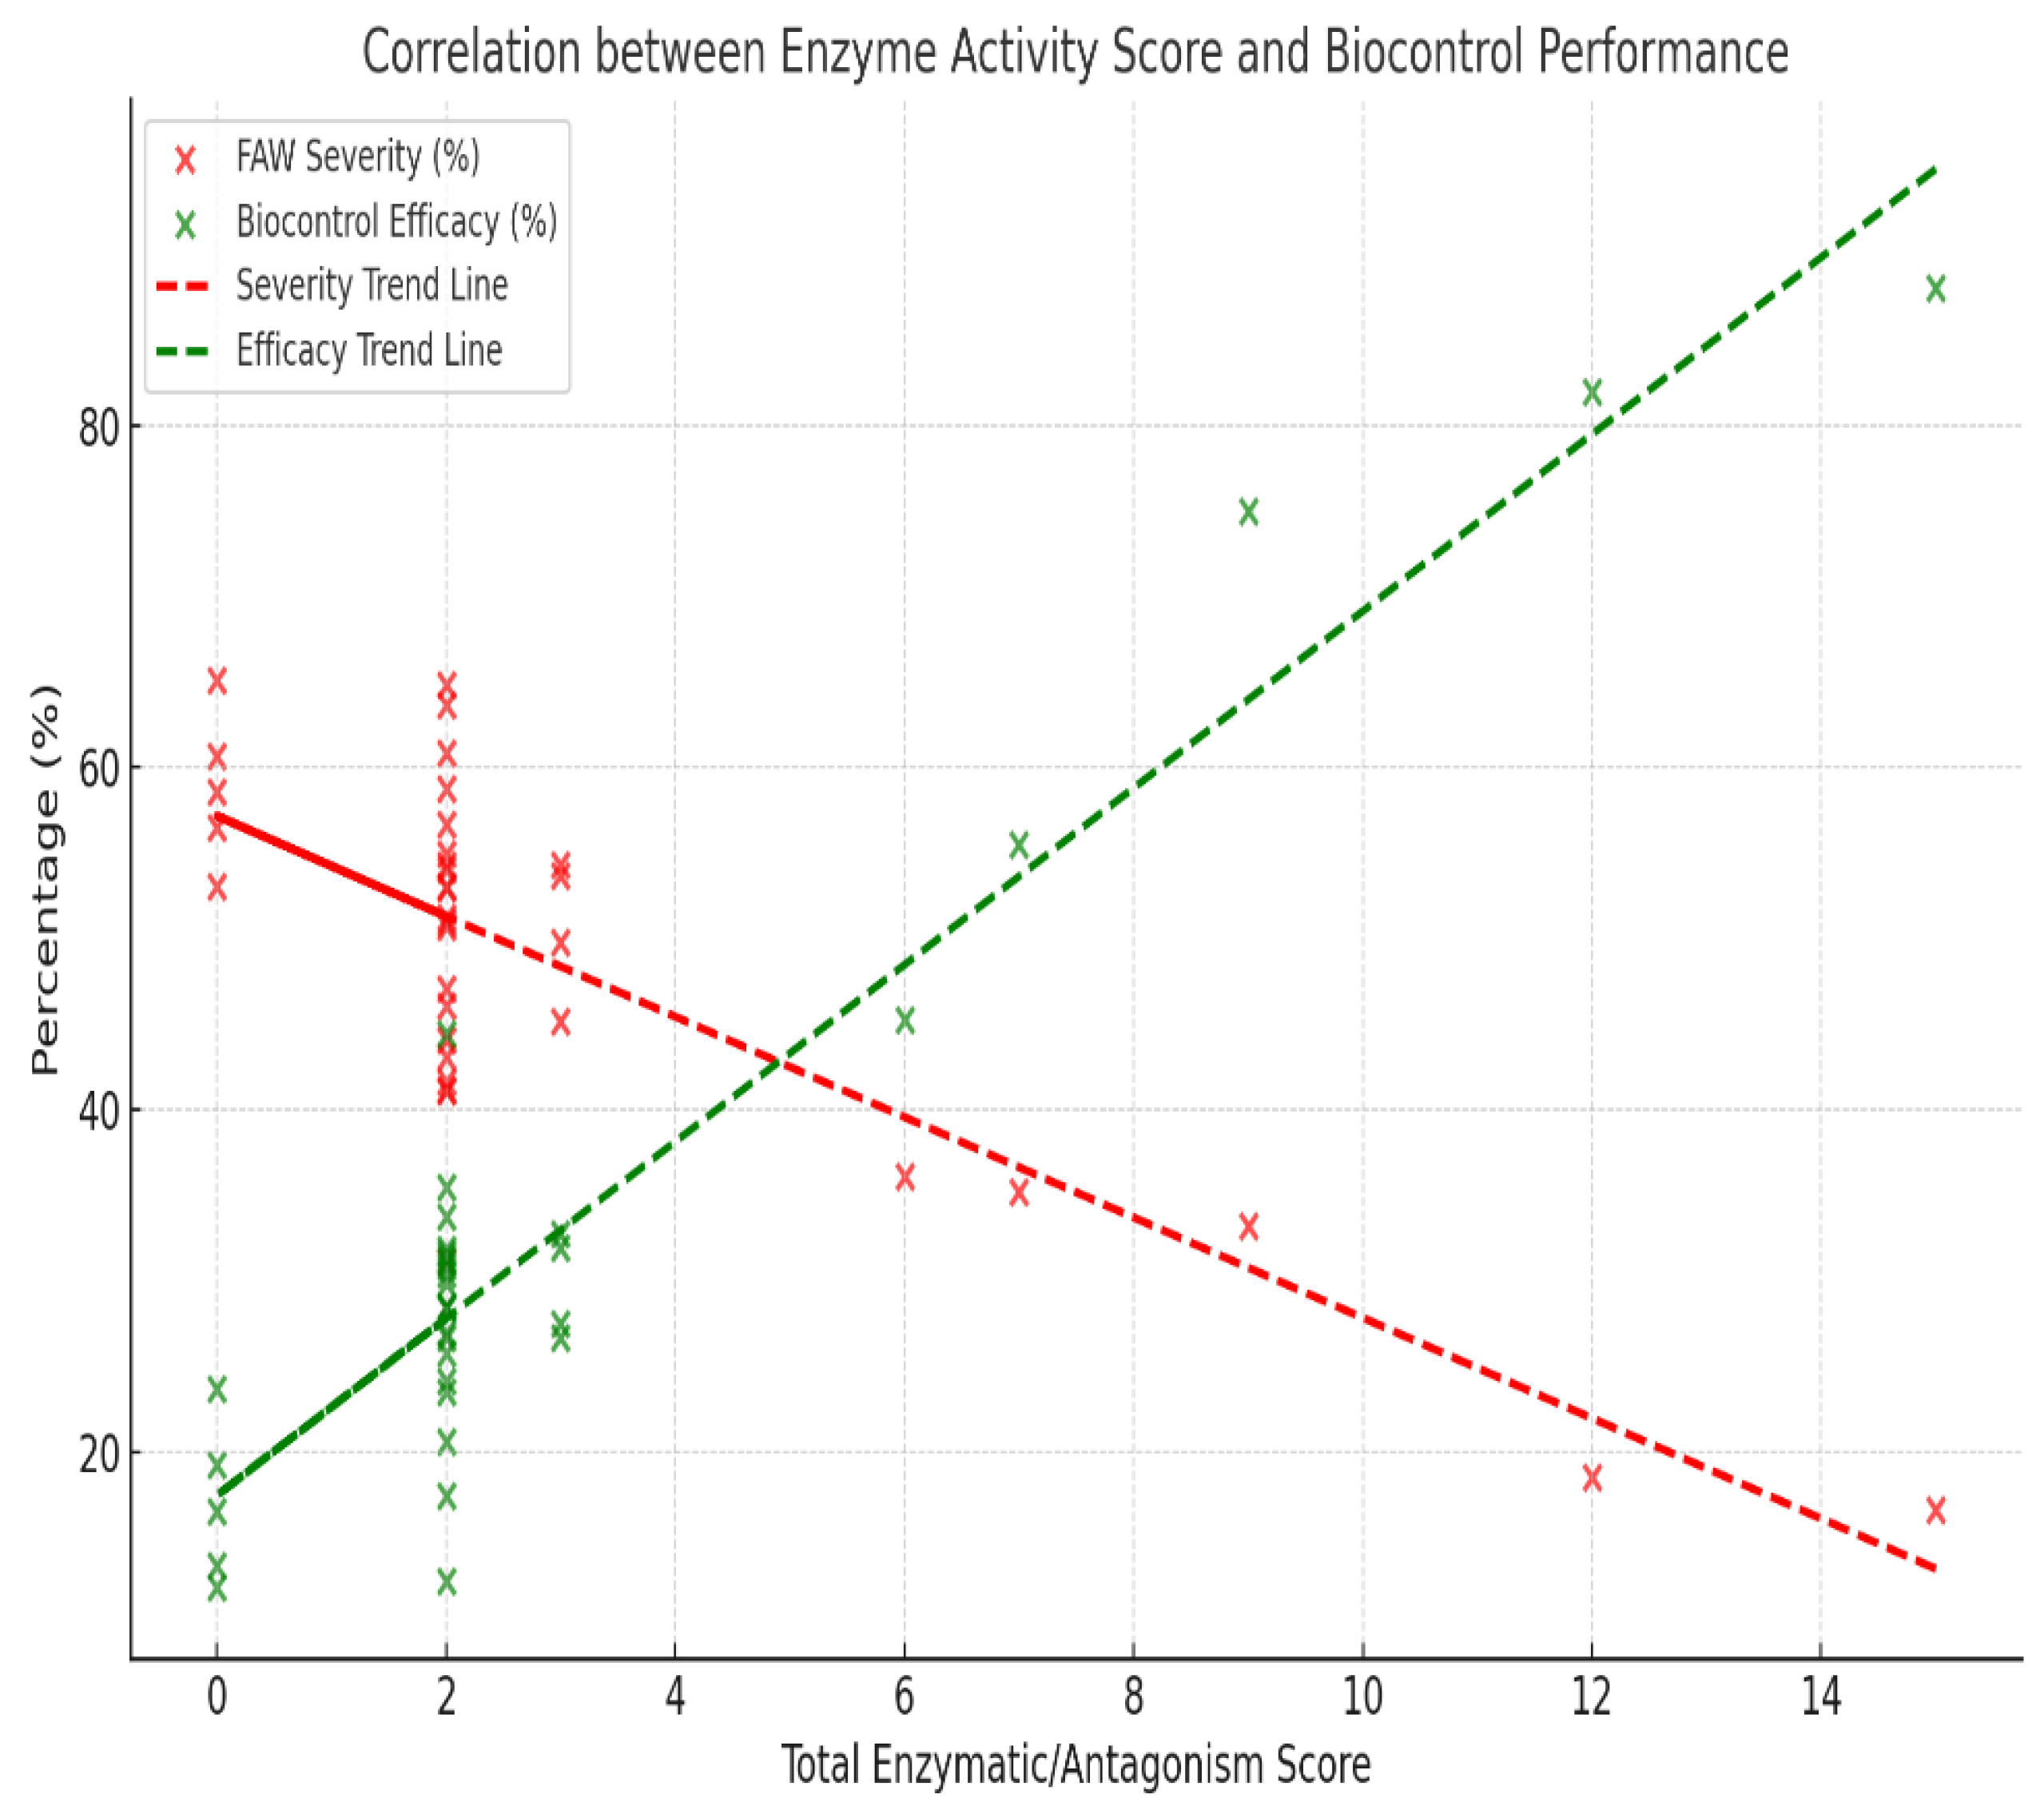
Figure 6.
Correlation between Antagonism score and Biocontrol Efficacy (%). Note: ● Each point represents an individual isolate, with the red line indicating the linear regression fit . ● A moderate positive correlation was observed (), suggesting that higher antagonistic activity is generally associated with improved biocontrol efficacy against Spodoptera frugiperda.
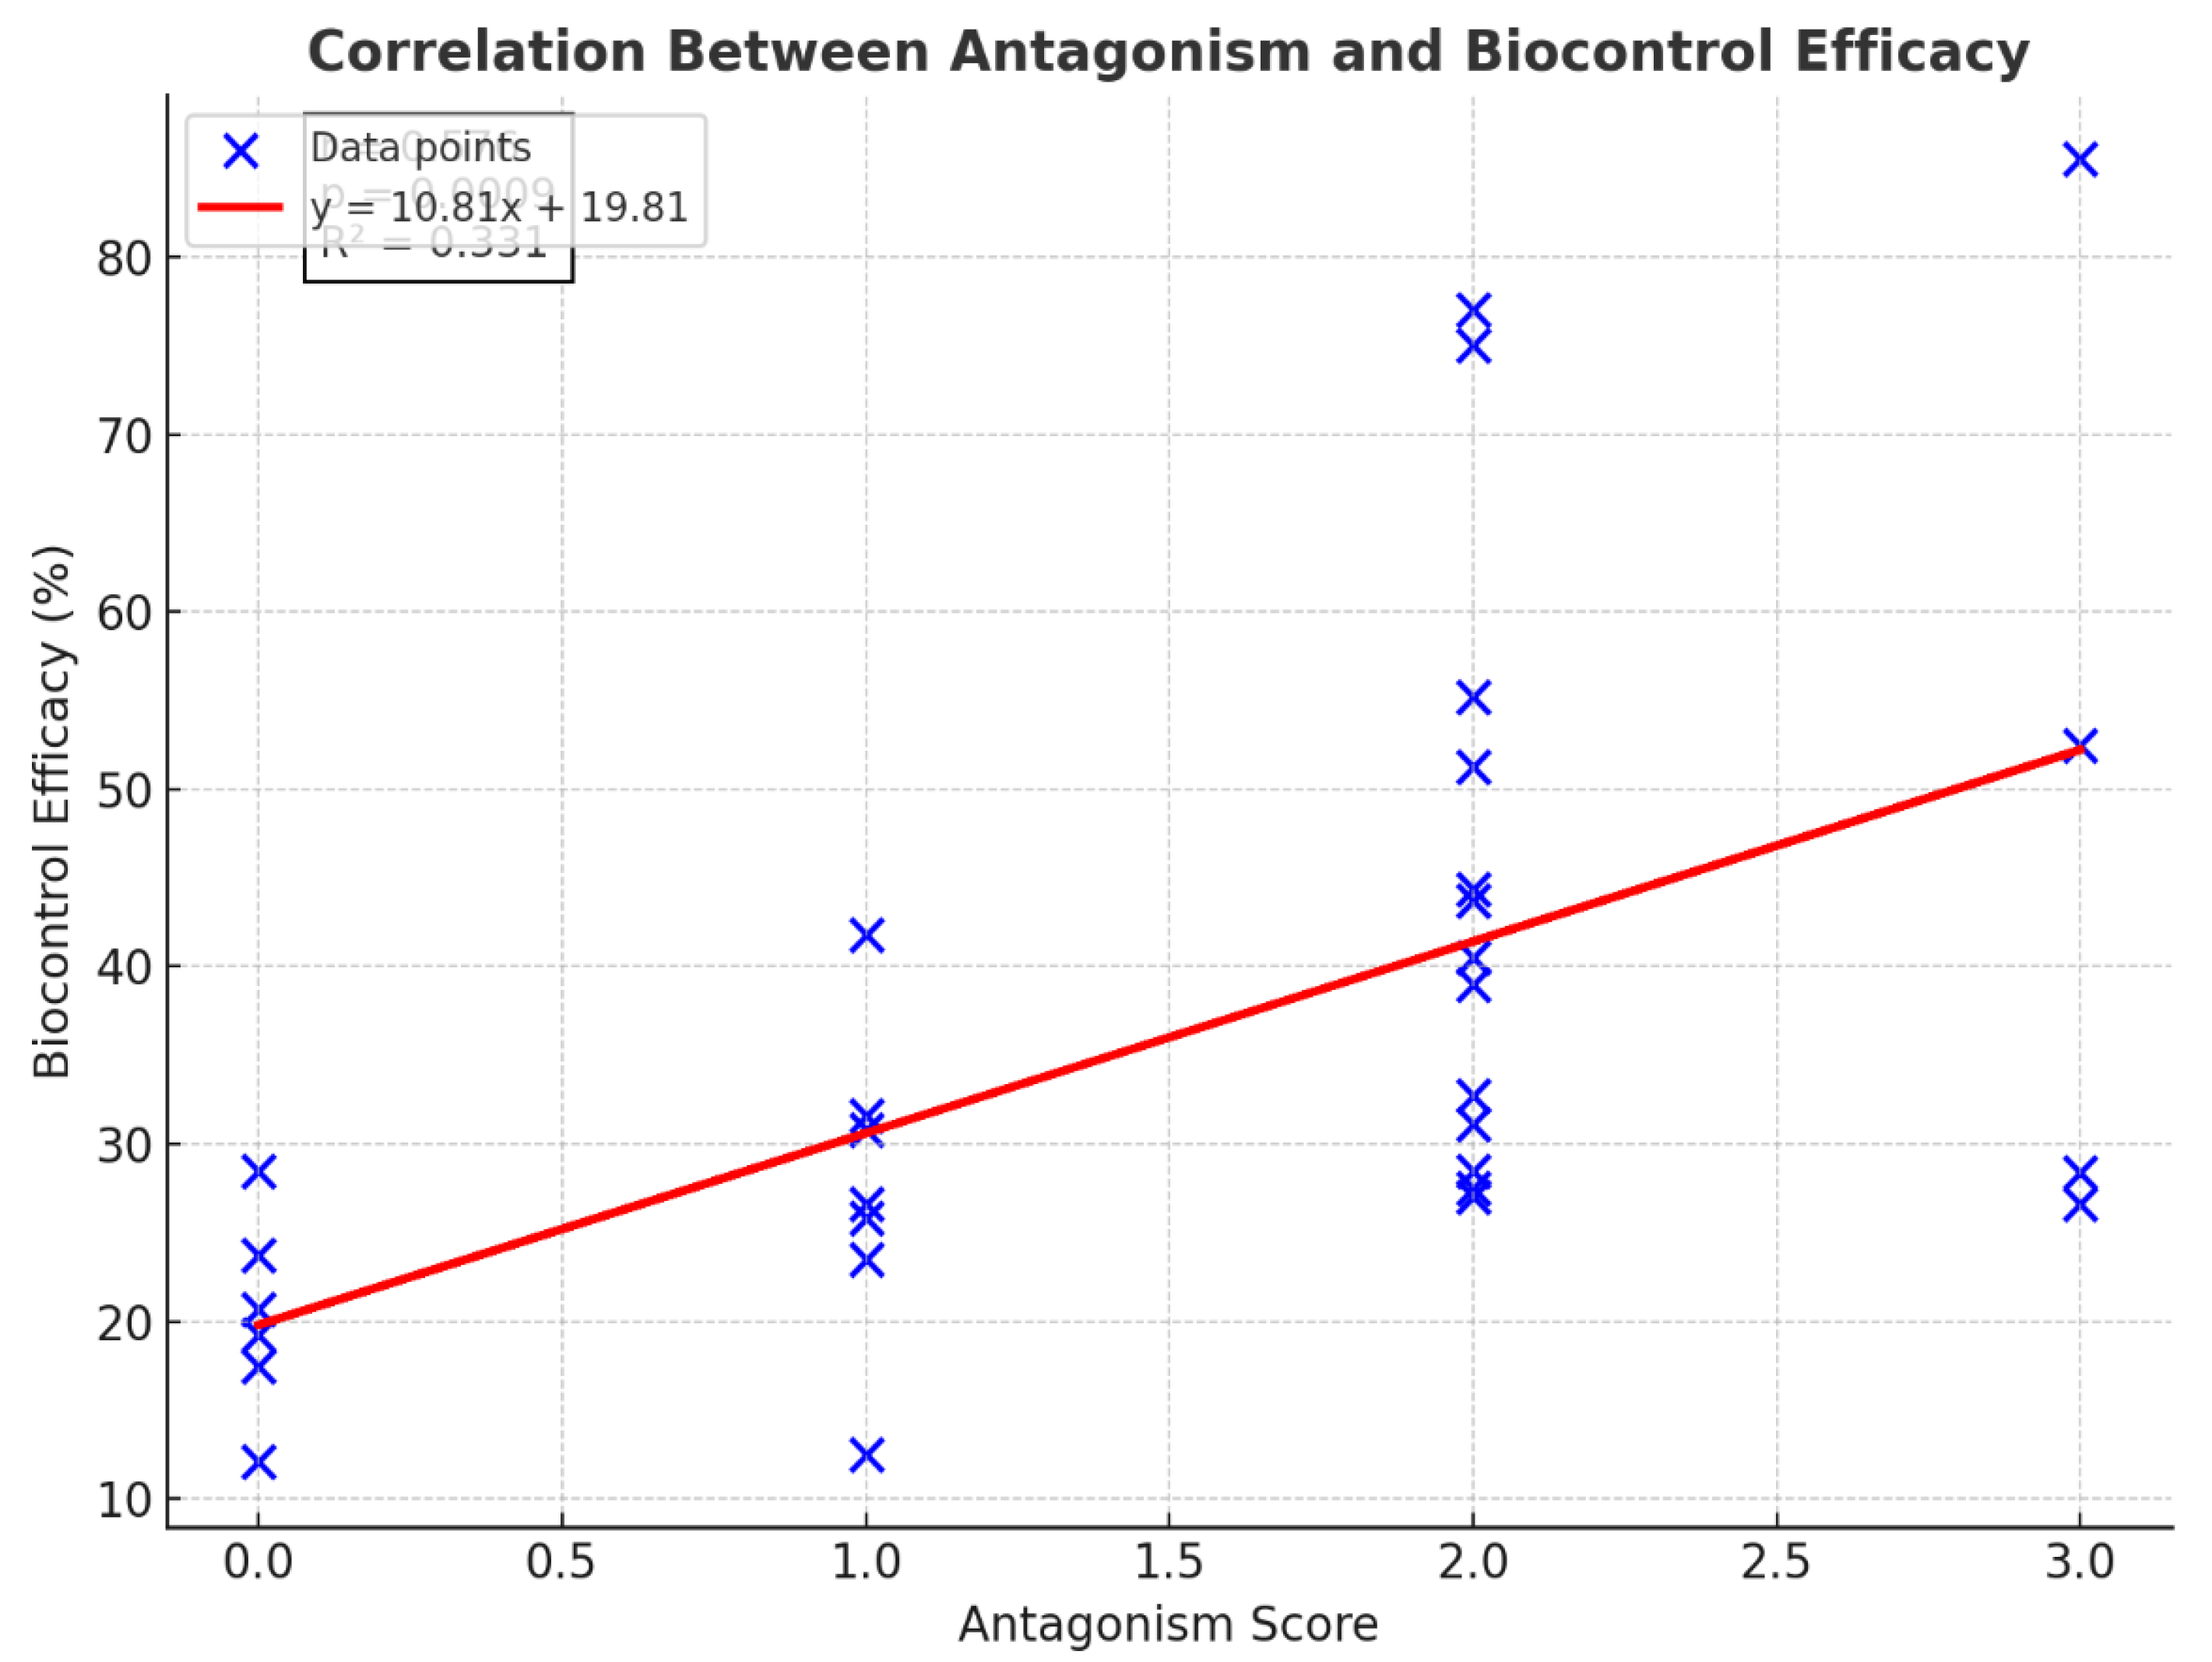
Figure 7.
Correlation between Assessment Scores and Biocontrol Efficacy (%). Note: ● The scatter diagram indicates good correlation between scores and biocontrol efficacy. The Pearson correlation coefficient is r ≈ 0.88 and a p−value ≈ of about 0.0018, suggesting a strong and statistically significant relationship. ● The slant blue line is a linear fit and indicates that biocontrol effectiveness increases with assessment score.
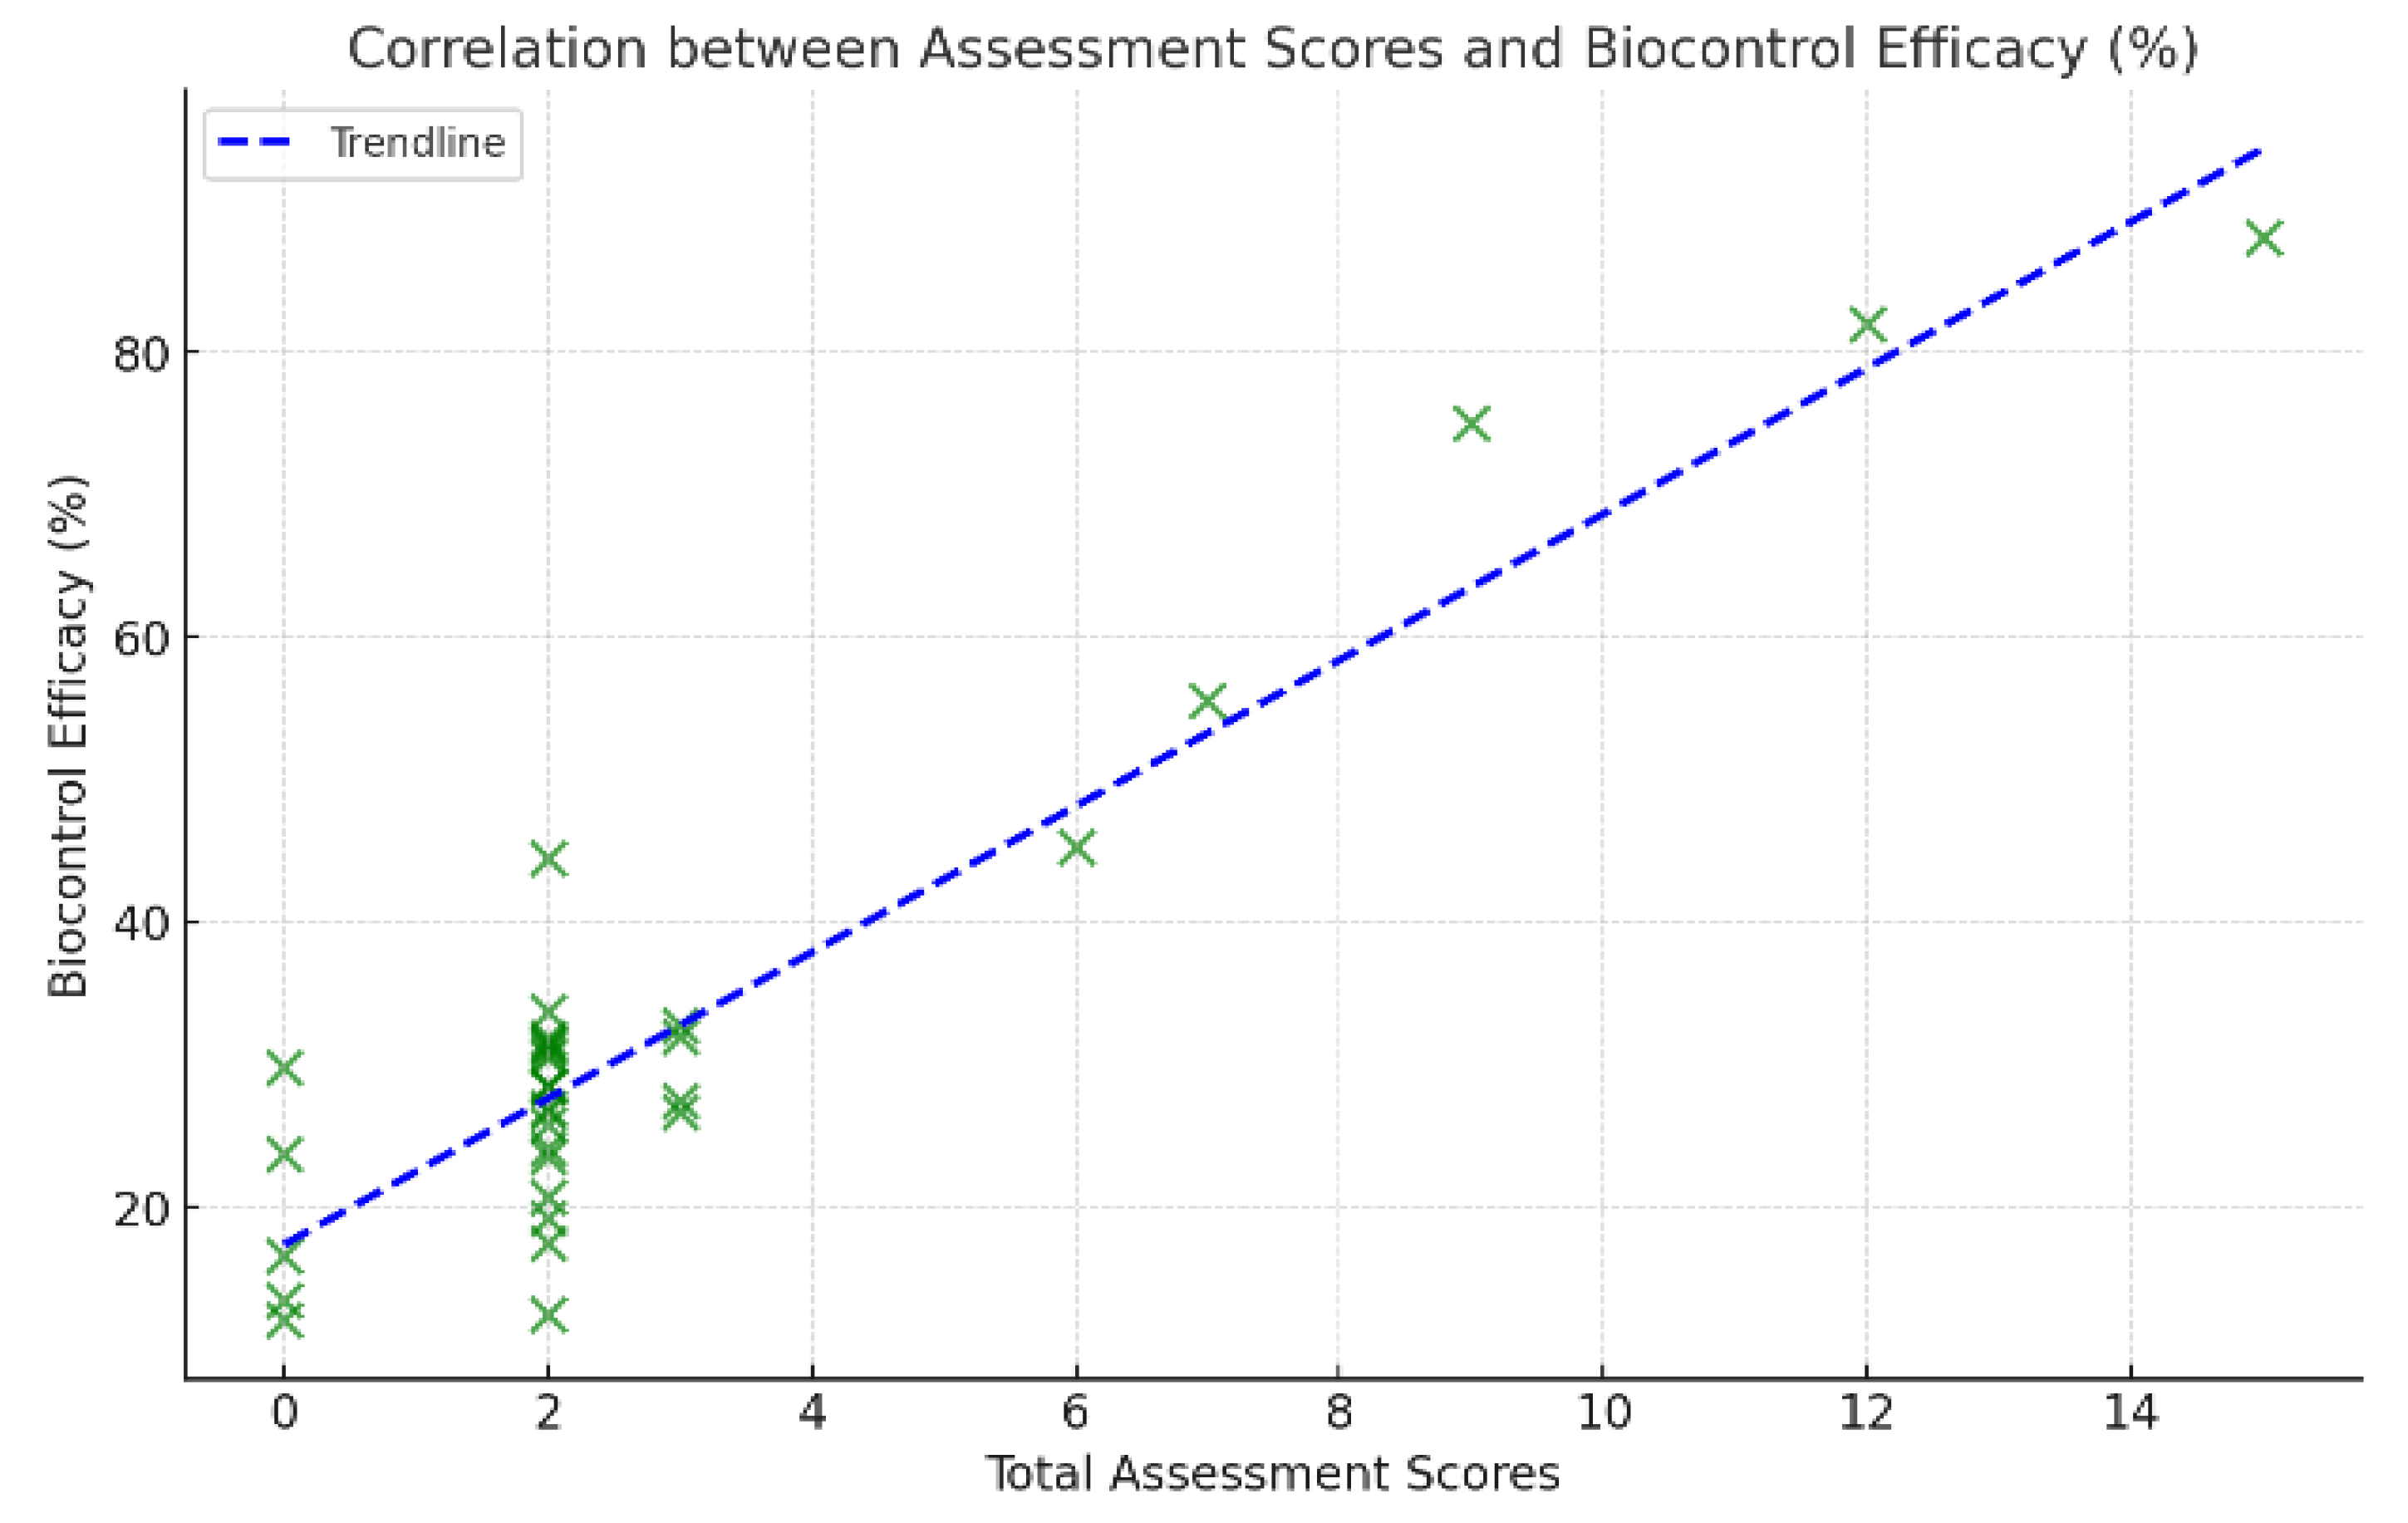
Figure 8.
Mortality Response of Fall Armyworm (FAW) to Neem and Moringa Extract Concentrations. Note: ● The fitted logistic dose-response curves for neem and Moringa extracts on FAW mortality rates. ● Each line represents the modeled response for larval, pupal, and adult stages, showing how mortality increases with extract concentration.
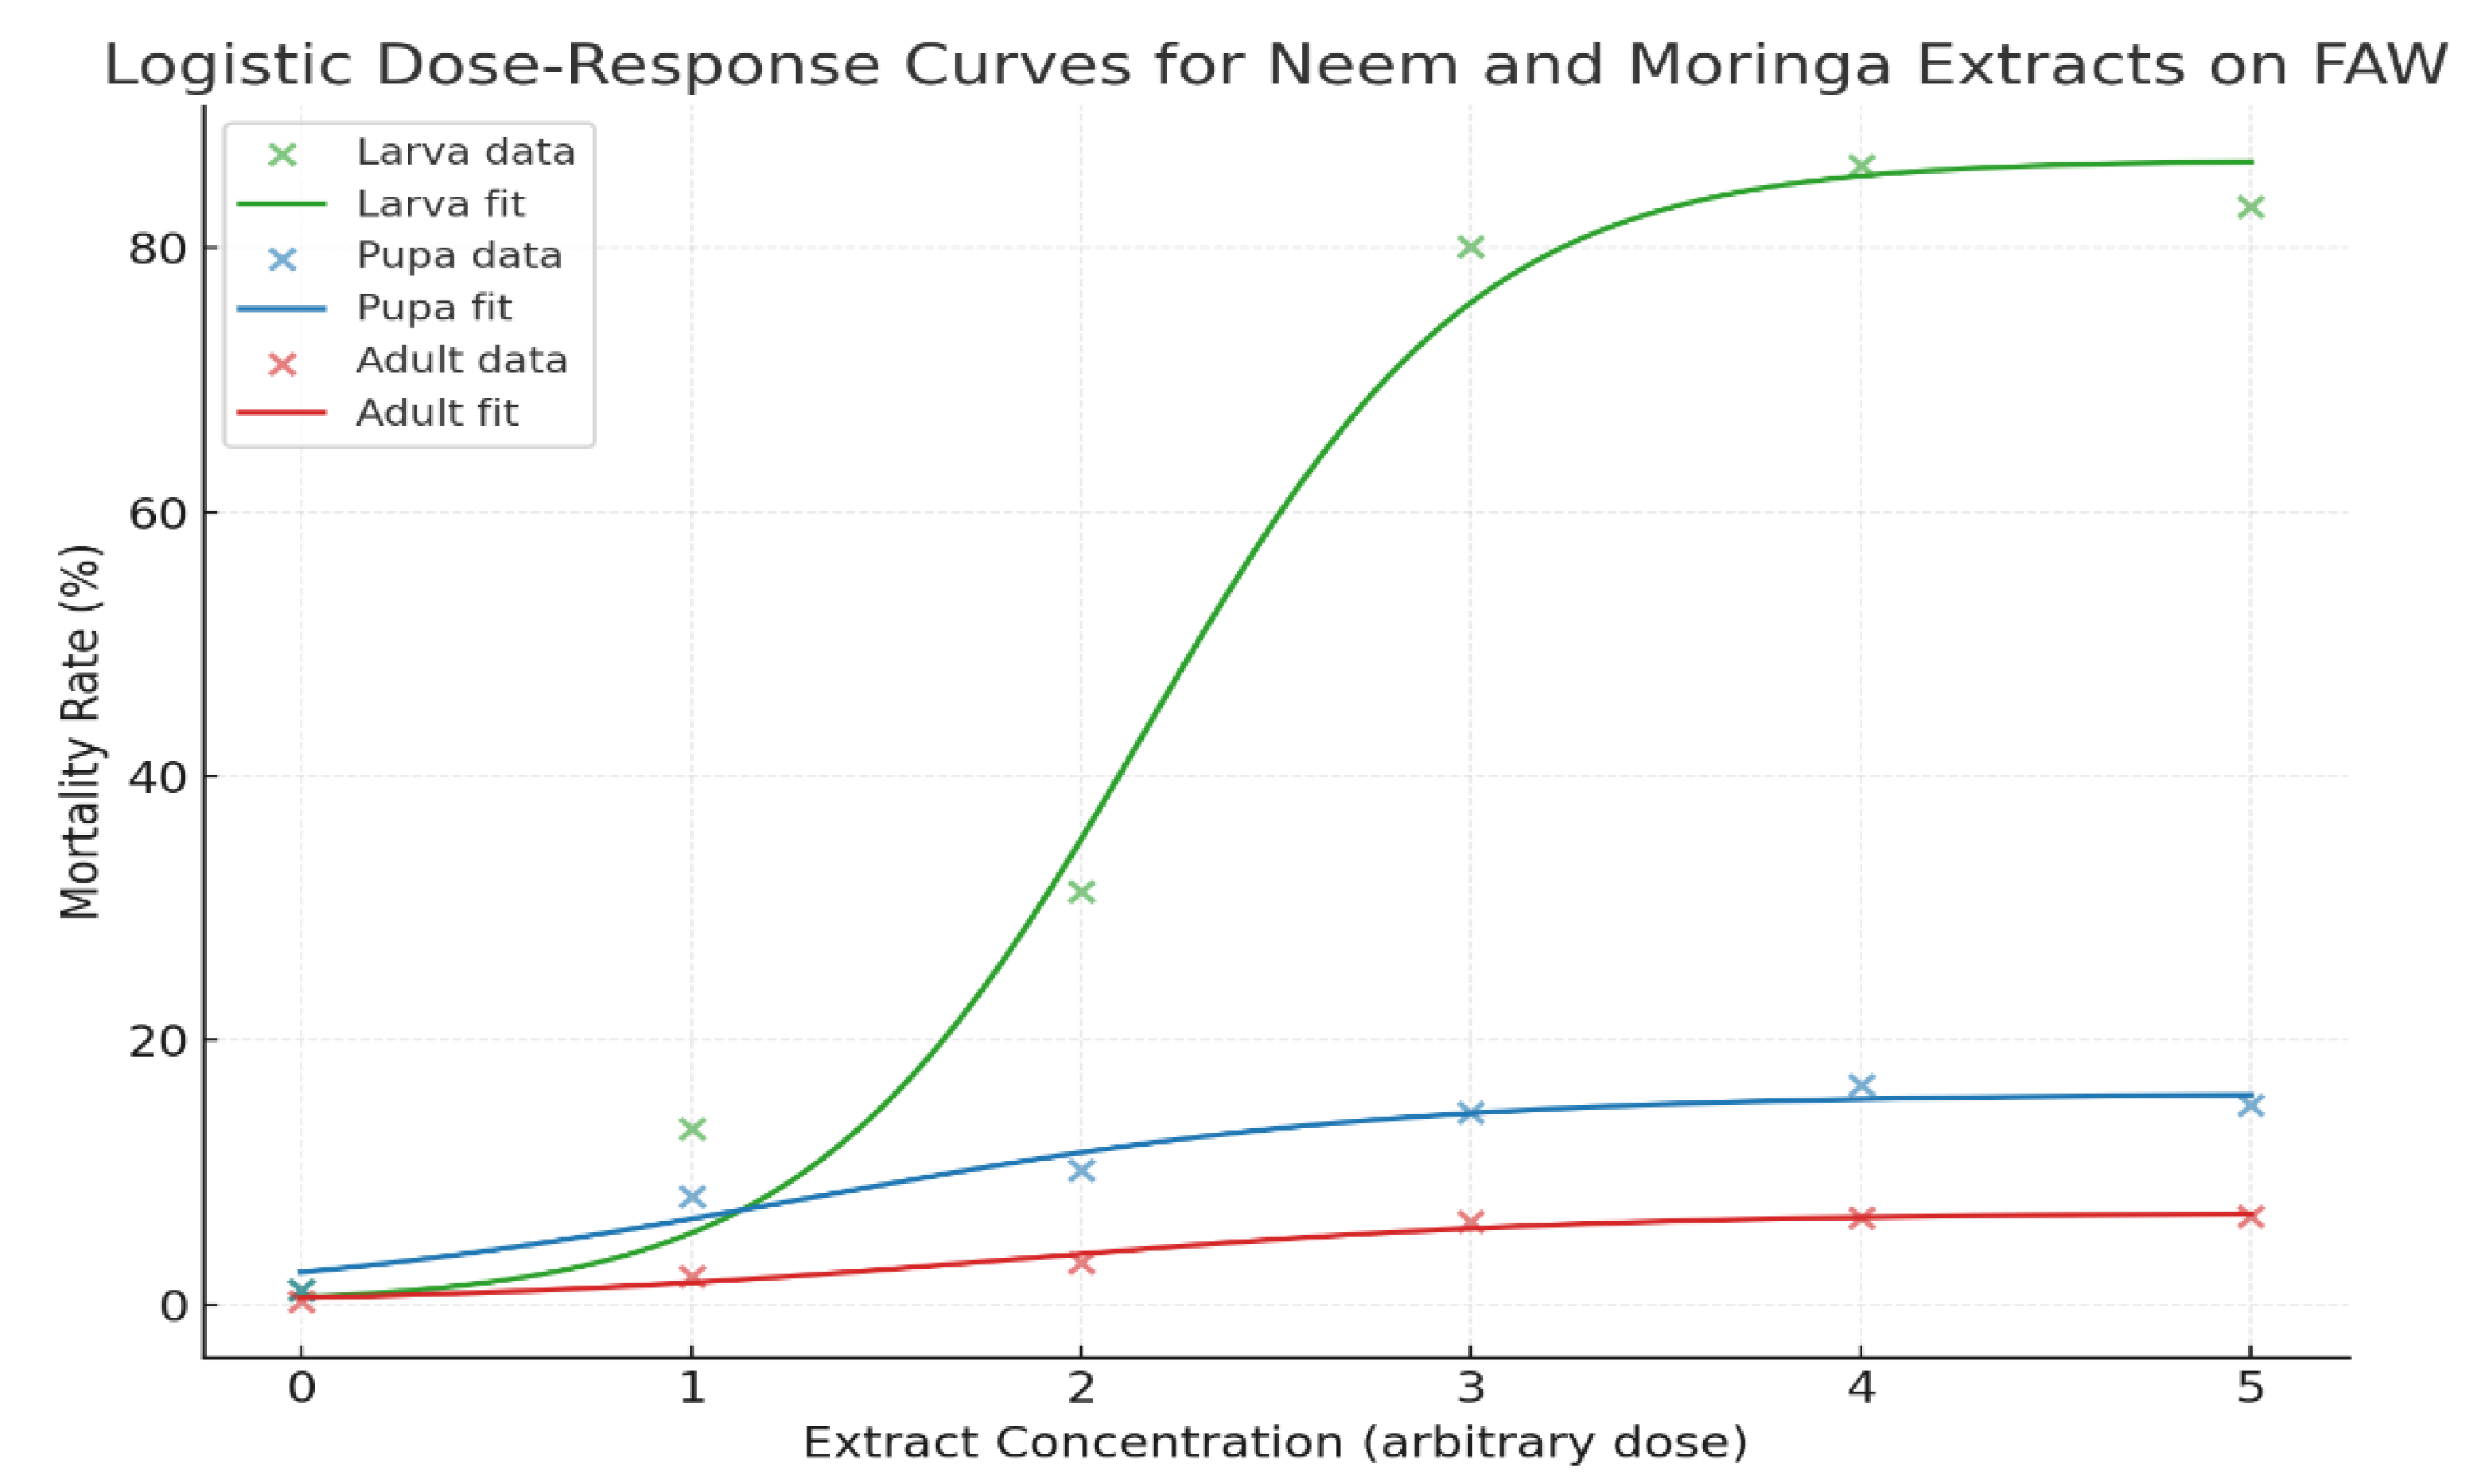
Figure 9.
Logistic regression models and LC₅₀ values for the larval stage. Note: Mortality climbs rapidly after T2 and stabilizes around T3-T5. This confirms that moderate concentrations of neem and moringa are sufficient for greater than 80% larval mortality, making higher doses unnecessary for field application.
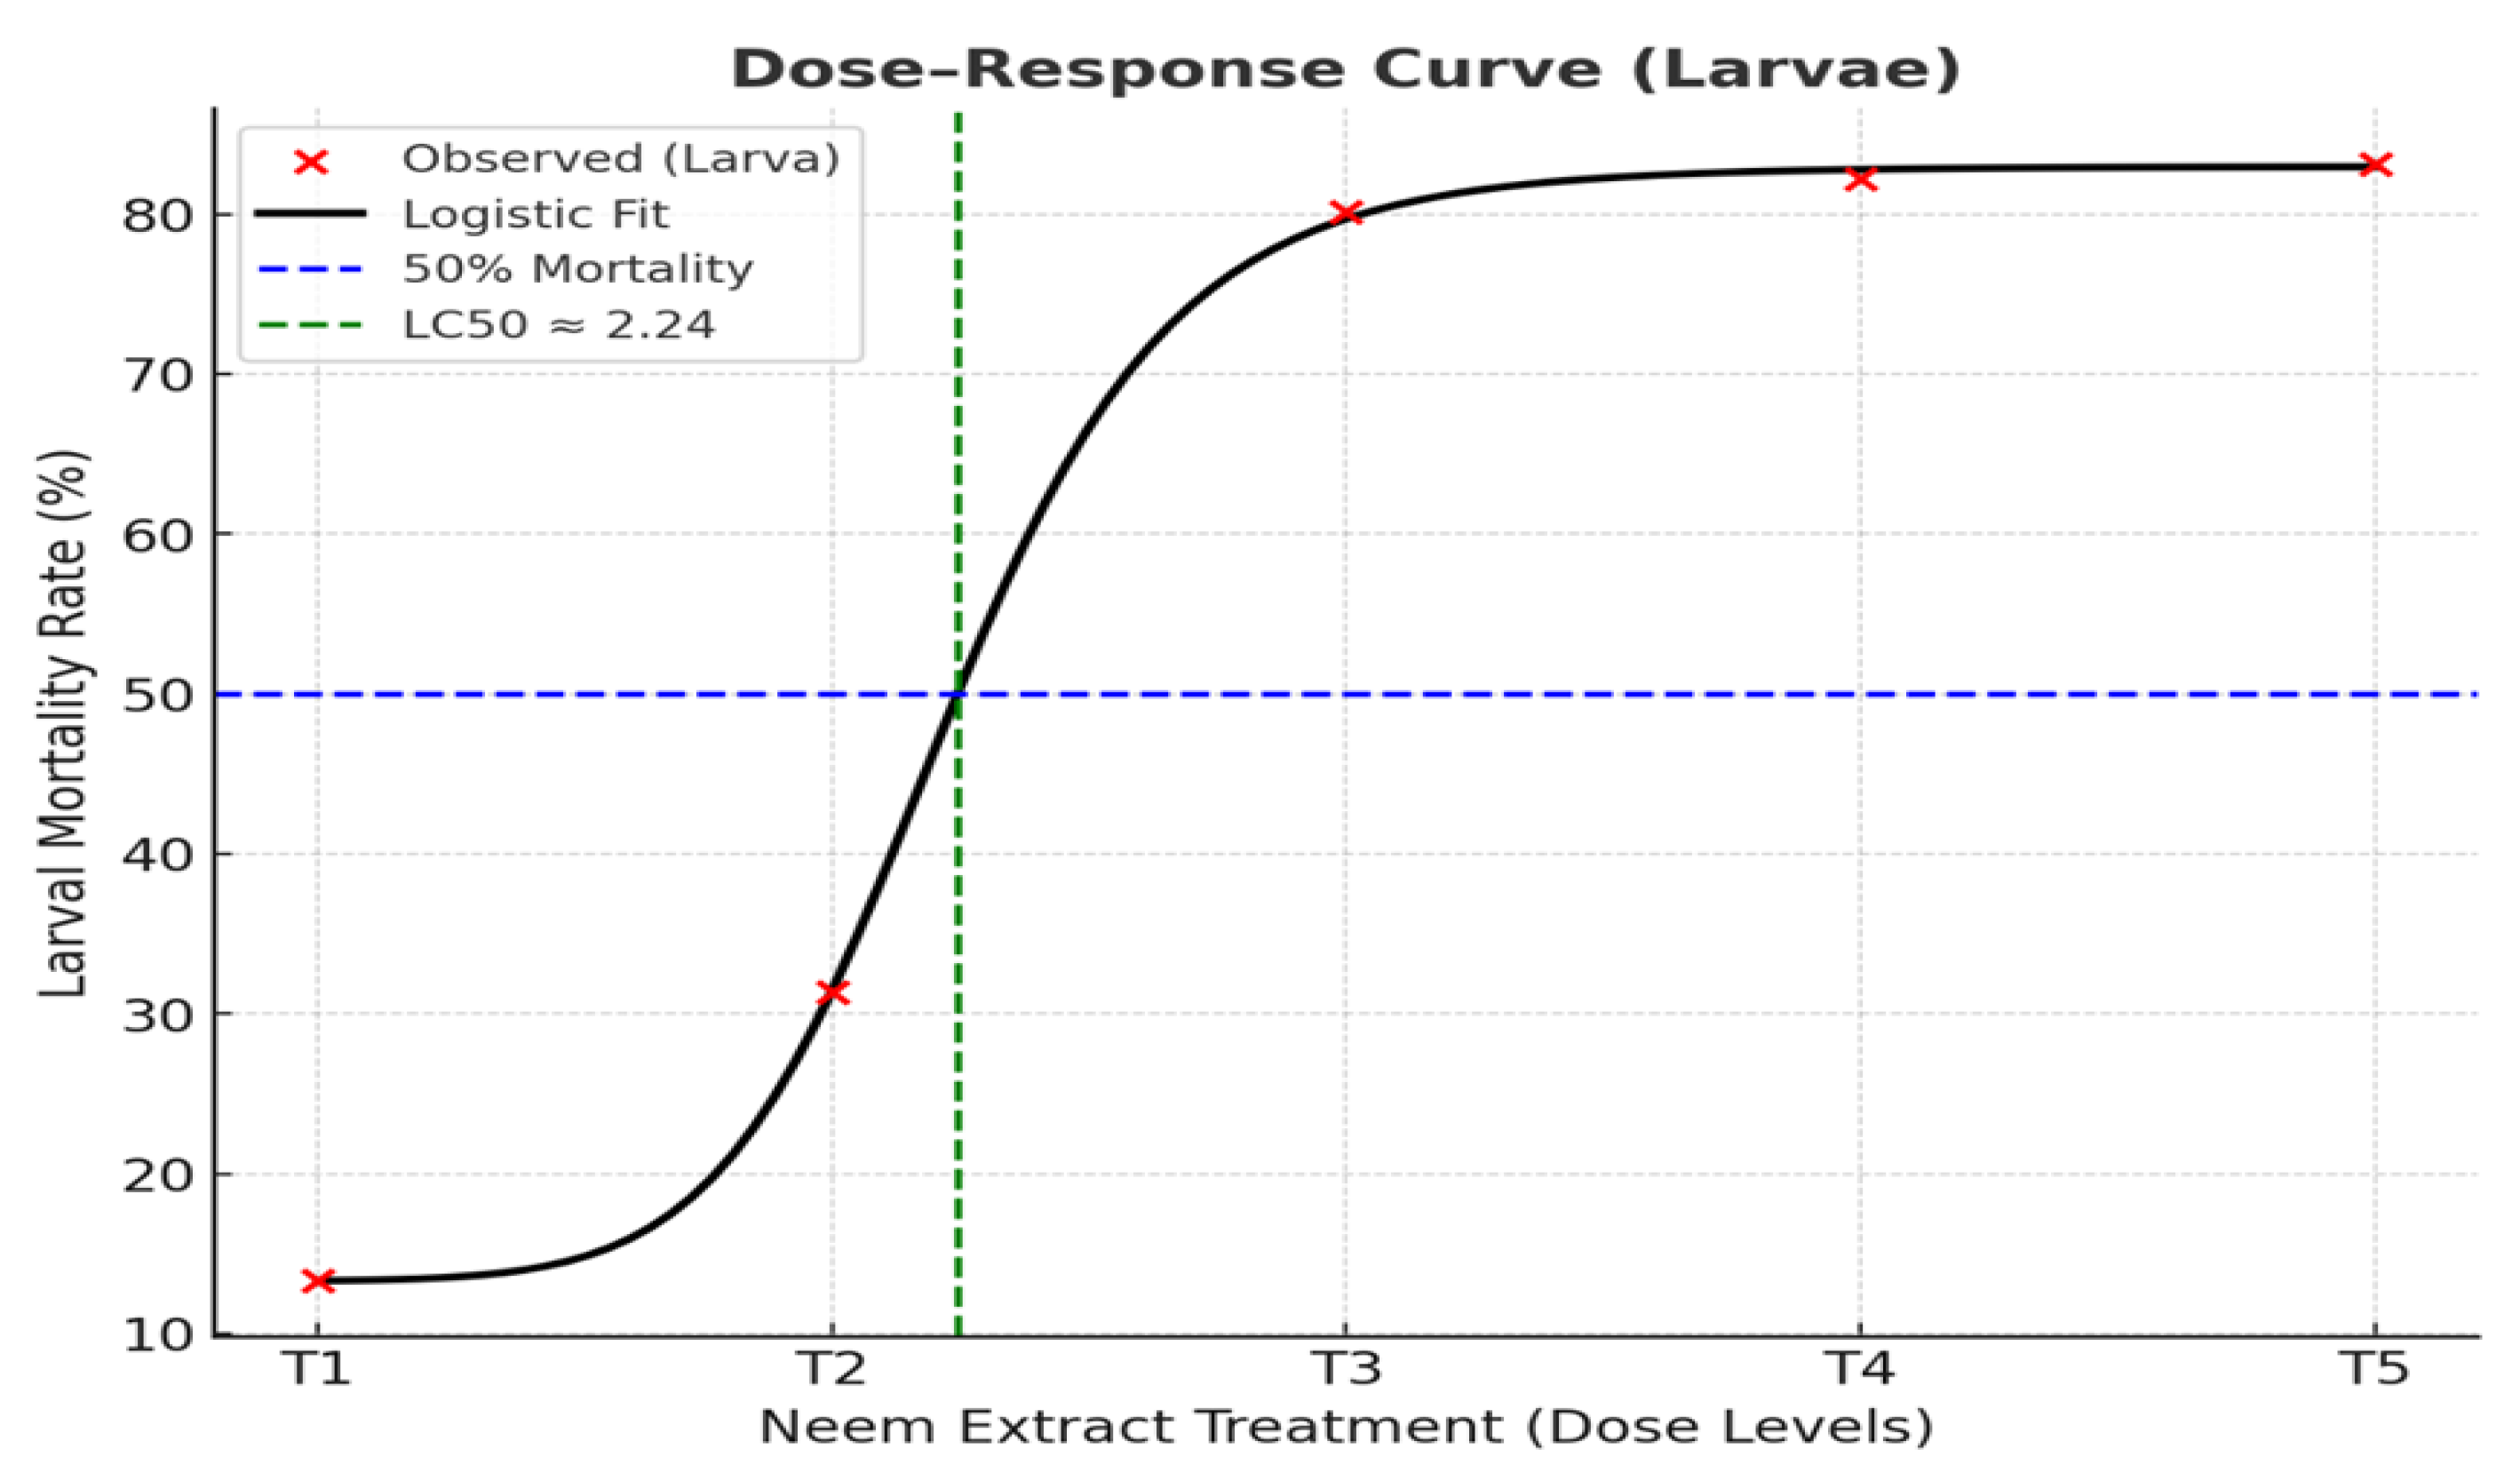
Figure 10.
Maize leaves infested by FAW in the field. ● T1 and T2 observed moderate to severe FAW pressure, with visible defoliation that could compromise crop yield if left unmanaged. Early intervention at the larval stage would likely be most effective in reducing further damage. ● T3, T4, and T5 acknowledged the highest, severe FAW pressure. The maize plants appear vigorous and healthy, with strong leaf development suggesting good growth conditions. ● T6 (Control): the damage appears extensively on multiple leaves, which reduces photosynthetic capacity and potentially affects plant growth.
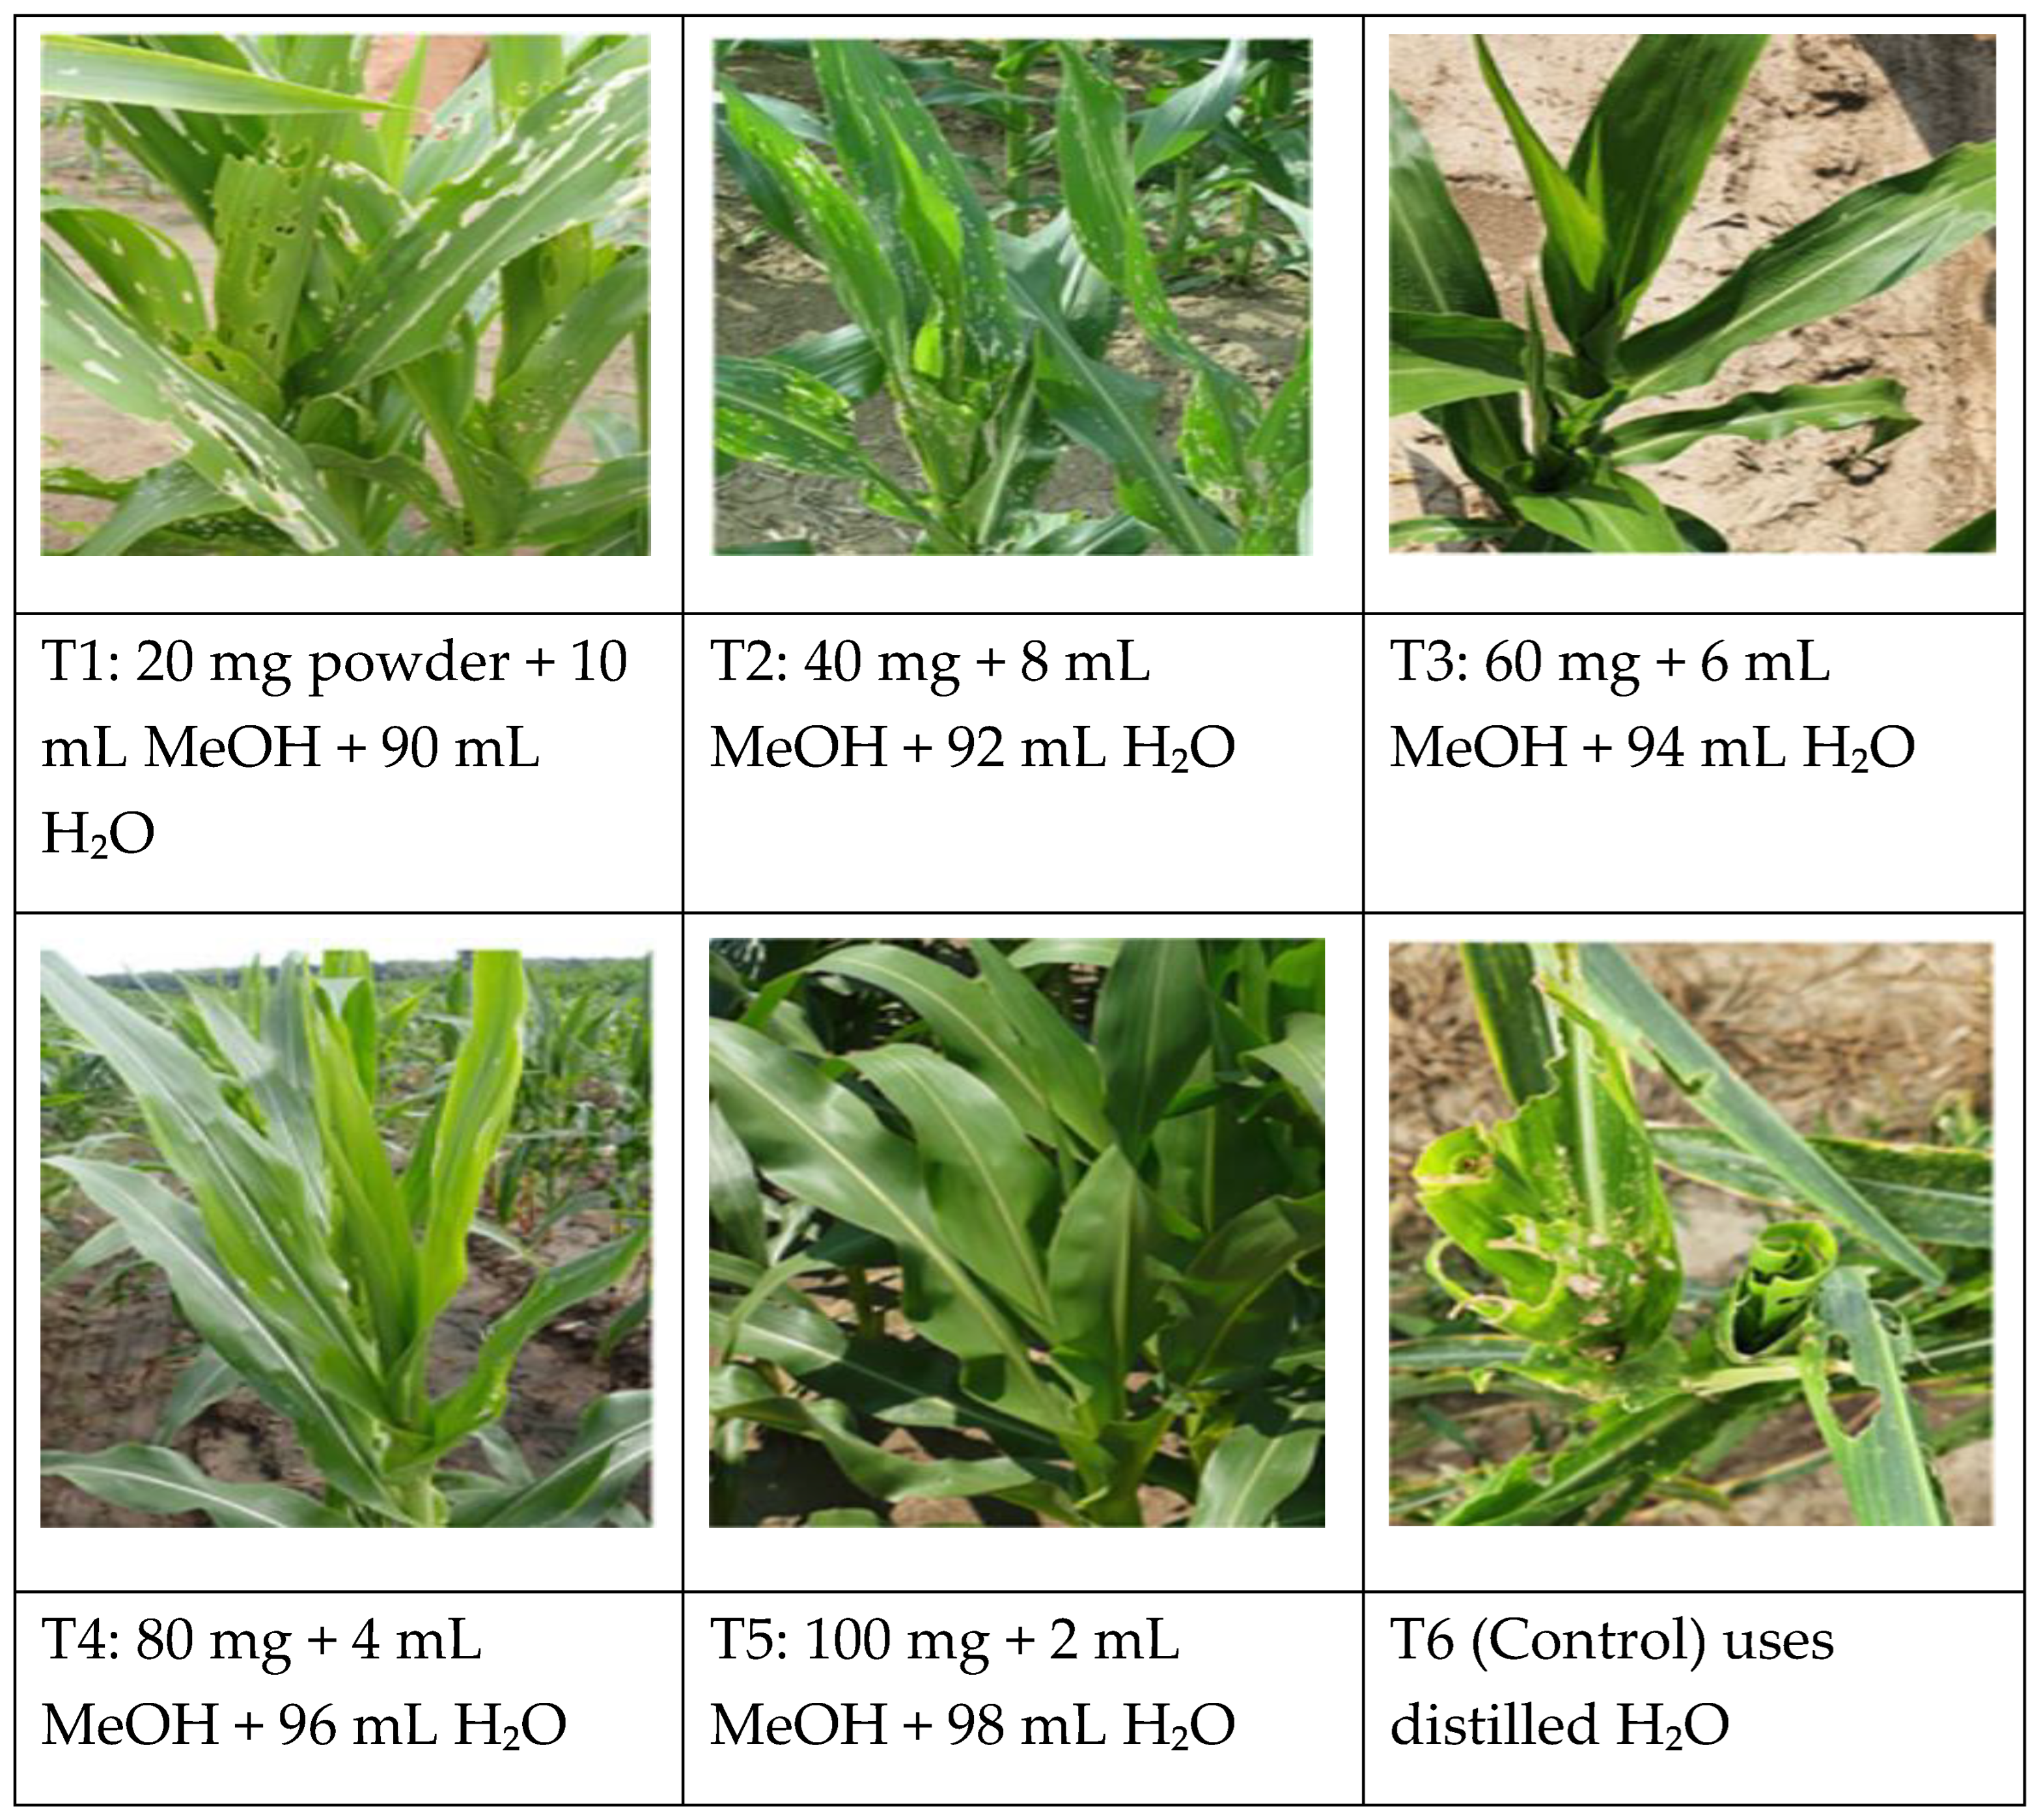

Table 1.
GC-MS spectral analysis of the ethanolic extract of Neem and Moringa.
| Source | Plant Part | RT (min) | Intensity | Compound Name | Molecular Formula | Molecular Weight (g/mol) | Peak Area (%) | Biological Activity |
|---|---|---|---|---|---|---|---|---|
| Moringa | Leaf | 35.42 | 216,950 | Trimethyl fluorosilane | C3H9FSi | 92.19 | 1.67 | Insecticidal |
| Moringa | Leaf | 36.25 | 216,950 | Ethyl oleate | C20H38O2 | 310.51 | 1.56 | Insecticidal |
| Moringa | Bark | 40.43 | 23,120 | Ethyl(9Z,12Z) | C20H36O2 | 308.50 | 1.64 | Insecticidal |
| Moringa | Bark | 41.45 | 2,365 | Octadecanoic acid | C18H36O2 | 284.48 | 1.00 | Antibacterial |
| Moringa | Root | 40.63 | 220,990 | Benzenedicarboxylic acid | C8H6O4 | 166.13 | 31.69 | Pesticidal |
| Neem | Leaf | 45.60 | 23,560 | Octadecanoic acid | C18H36O2 | 284.48 | 2.30 | Antibacterial |
| Neem | Bark | 50.00 | 25,432 | Trimethyl fluorosilane | C3H9FSi | 92.19 | 3.45 | Insecticidal |
| Neem | Root | 55.34 | 26,745 | Hexadecanoic acid | C16H32O2 | 256.43 | 3.66 | Pesticidal |
Note: ● Bio extracts evaluated by WILEY7. The LIB data library is present in the GC-MS. ● Cluster membership table interactive table showing each isolate, compound, RT, Intensity, Peak area%, and assigned cluster.
Table 2.
Antagonistic ability and metabolic enzyme activities of bacterial isolates screened from different parts of maize samples.
Table 2.
Antagonistic ability and metabolic enzyme activities of bacterial isolates screened from different parts of maize samples.
| Strain source | Timea | Bacteria concentration (CFU/g)b |
Number of bacteria Strains |
Number of isolates with antagonism ability and metabolite enzyme ability | |||||
|---|---|---|---|---|---|---|---|---|---|
| Antagonism testc |
Chitinased | Cellulase | Proteases | Glucanase | Siderophores | ||||
| Surface stem | Tillering | 5.5x10⁶ | 60 | 44 | 10 | 6 | 24 | 2 | 2 |
| Heading | 5.4x10⁶ | 40 | 23 | 5 | 4 | 8 | 2 | 4 | |
| Interior stem | Tillering | 5.5x10⁵ | 86 | 39 | 9 | 3 | 18 | 5 | 4 |
| Heading | 5.4x10⁵ | 30 | 21 | 8 | 3 | 10 | 0 | 0 | |
| Endorhiza | Tillering | 5.5x10⁵ | 41 | 34 | 10 | 4 | 12 | 4 | 4 |
| Heading | 5.4x10⁵ | 18 | 12 | 4 | 0 | 7 | 0 | 1 | |
| Endosphere | Tillering | 5.2x10⁵ | 22 | 18 | 6 | 2 | 8 | 1 | 1 |
| Heading | 5.5x10⁴ | 27 | 18 | 6 | 2 | 8 | 2 | 0 | |
| Phyllosphere | Tillering | 5.4x10⁵ | 80 | 64 | 20 | 9 | 26 | 4 | 5 |
| Heading | 5.6x10⁴ | 25 | 16 | 6 | 0 | 8 | 1 | 1 | |
| Rhizophere | Tillering | 5.3x10⁴ | 46 | 28 | 8 | 4 | 10 | 4 | 2 |
| Heading | 5.4x10⁵ | 20 | 4 | 1 | 2 | 10 | 1 | 2 | |
| Soil | Tillering | 5.3x10⁵ | 55 | 36 | 16 | 2 | 8 | 4 | 6 |
| Heading | 5.4x10⁵ | 23 | 16 | 5 | 2 | 7 | 1 | 1 | |
Notes: ᵃBCAs were screened at two maize growth stages: tillering and heading. ᵇ Bacterial concentration represents the total viable bacteria count (CFU g⁻¹) recovered from maize tissues. ᶜAntagonistic activity was tested using Magnaporthe grisea strain Guy11. Isolates producing a visible inhibition halo on WA medium were classified as antagonists; halo width was measured after incubation.
Table 3.
Summary of enzyme activities by strain source.
| Strain Source | Chitinase | Cellulase | Protease | Glucanase | Siderophore |
|---|---|---|---|---|---|
| Surface stem | 15 | 10 | 32 | 4 | 6 |
| Interior stem | 17 | 6 | 28 | 5 | 4 |
| Endorhiza | 14 | 4 | 19 | 4 | 5 |
| Endosphere | 12 | 4 | 16 | 3 | 1 |
| Phyllosphere | 26 | 9 | 34 | 5 | 6 |
| Rhizosphere | 9 | 6 | 20 | 5 | 4 |
| Soil | 21 | 4 | 15 | 5 | 7 |
Table 4.
Identification and biological control efficacy of bacterial strains isolated from maize samples.
Table 4.
Identification and biological control efficacy of bacterial strains isolated from maize samples.
| Strains | Identify resultsa | Similaraty (%)b | Atangonim | Proteae |
Cellulse |
Chitinse |
Glucanse |
Siderophores |
Scores | ||
|---|---|---|---|---|---|---|---|---|---|---|---|
| Value | value | Value | value | value | value | FAW severity (%)c |
Biological control efficacy (%) | ||||
| DR-55 | Bacillus subtilis | 100 | 3 | 3 | 1 | 5 | 2 | 1 | 15 | 16.67±5.56qr | 88.00% |
| DR-63 | Enterobacter sp. | 100 | 2 | 3 | 1 | 4 | 1 | 1 | 12 | 18.52±3.21qr | 82.00% |
| HL-7 | Bacillus cereus | 100 | 2 | 2 | 1 | 2 | 1 | 1 | 9 | 33.21±4.97op | 75.00% |
| HL-37 | Bacillus cereus | 99 | 2 | 2 | 0 | 2 | 1 | 0 | 7 | 35.19±8.49nop | 55.50% |
| HR-12 | Enterobacter sp. | 98 | 2 | 1 | 0 | 2 | 1 | 0 | 6 | 36.11±2.78mnop | 45.25% |
| DR-19 | Bacillus cereus | 99 | 1 | 1 | 0 | 1 | 0 | 0 | 3 | 45.19±7.14ghijklmn | 32.00% |
| DL-34 | Bacillus cereus | 99 | 1 | 1 | 0 | 1 | 0 | 0 | 3 | 49.81±3.16fghijkl | 32.75% |
| DR-15 | Bacillus cereus | 99 | 1 | 1 | 0 | 1 | 0 | 0 | 3 | 53.7±6.42defghij | 27.50% |
| DR-8 | Bacillus subtilis | 99 | 1 | 1 | 0 | 1 | 0 | 0 | 3 | 54.32±13.4defghi | 26.67% |
| HL-14 | Bacillus cereus | 99 | 1 | 0 | 0 | 1 | 0 | 0 | 2 | 53.02±9.92efghijk | 28.42% |
| HL-3 | Bacillus subtilis | 99 | 1 | 1 | 0 | 0 | 0 | 0 | 2 | 54.07±6.42defghi | 27.00% |
| HL-22 | Enterobacter sp. | 99 | 1 | 0 | 0 | 1 | 0 | 0 | 2 | 46.11±10.2ghijklmn | 24.17% |
| DR-42 | Bacillus pumilus | 99 | 1 | 0 | 0 | 1 | 0 | 0 | 2 | 44.07±5.01hijklmno | 44.50% |
| DL-26 | Bacillus cereus | 99 | 1 | 1 | 0 | 0 | 0 | 0 | 2 | 47.04±0.32ghijklm | 28.50% |
| DS-6 | Bacillus subtilis | 99 | 1 | 0 | 0 | 1 | 0 | 0 | 2 | 50.99±7.86fghijkl | 31.17% |
| DR-51 | Bacillus subtilis | 100 | 1 | 0 | 0 | 1 | 0 | 0 | 2 | 41.67±7.35klmno | 33.75% |
| DL-2 | Bacillus pumilus | 99 | 1 | 0 | 1 | 1 | 0 | 0 | 2 | 43.09±4.69ijklmno | 31.83% |
| DL-7 | Bacillus cereus | 99 | 1 | 0 | 0 | 0 | 1 | 0 | 2 | 41.23±2.04lmnop | 31.33% |
| DS-5 | Bacillus cereus | 99 | 1 | 0 | 0 | 1 | 0 | 0 | 2 | 58.77±7.46cdef | 20.67% |
| HR-11 | Bacillus cereus | 99 | 1 | 0 | 0 | 1 | 0 | 0 | 2 | 50.68±3.26fghijkl | 31.58% |
| DL-20 | Bacillus subtilis | 99 | 1 | 1 | 0 | 0 | 0 | 0 | 2 | 54.94±2.47defgh | 25.83% |
| DL-21 | Bacillus subtilis | 99 | 1 | 0 | 0 | 1 | 0 | 0 | 2 | 52.96±9.71efghijk | 28.50% |
| DR-3 | Bacillus subtilis | 99 | 1 | 0 | 0 | 1 | 0 | 0 | 2 | 64.81±8.49cdef | 12.50% |
| DL-45 | Bacillus cereus | 99 | 1 | 1 | 0 | 0 | 0 | 1 | 2 | 56.67±4.01cdefg | 23.50% |
| DL-33 | Bacillus cereus | 99 | 1 | 0 | 0 | 0 | 1 | 0 | 2 | 54.32±13.4defghi | 26.67% |
| DL-28 | Bacillus sp. | 99 | 1 | 0 | 0 | 1 | 0 | 0 | 2 | 51.23±4.66fghijkl | 30.83% |
| HR-19 | Bacillus cereus | 99 | 1 | 0 | 0 | 1 | 0 | 0 | 2 | 63.7±7.56bcde | 17.50% |
| HL-37 | Bacillus idriesis | 99 | 0 | 0 | 0 | 0 | 0 | 0 | 0 | 65.12±6.17bcd | 12.08% |
| DS-60 | Bacillus cereus | 99 | 0 | 0 | 0 | 0 | 0 | 0 | 0 | 56.51±2.2cdefg | 23.71% |
| HL-1 | Pantoea sp. | 99 | 0 | 0 | 0 | 0 | 0 | 0 | 0 | 53.02±9.92efghijk | 19.25% |
| HL-20 | Pantoea sp. | 99 | 1 | 0 | 0 | 1 | 0 | 0 | 2 | 41.13 ± 2.47 mn | 30.46% |
| HS-8 | Pantoea sp. | 99 | 0 | 0 | 0 | 0 | 0 | 0 | 0 | 60.66 ± 1.43b | 13.43% |
| DL-22 | Acinetobacter sp. | 99 | 1 | 1 | 0 | 0 | 0 | 0 | 2 | 60.89 ± 3.49bc | 29.83% |
| HR-14 | Bacillus cereus | 99 | 1 | 0 | 0 | 1 | 0 | 0 | 2 | 31.12 ± 3.35q | 35.51% |
| DL-26 | Bacillus cereus | 99 | 0 | 0 | 0 | 0 | 0 | 0 | 0 | 58.56 ± 3.52cde | 16.58% |
Note: ᵃ Identification based on 16S rRNA gene sequencing results. ᵇ Similarity (%) determined by BLAST sequence alignment. ᶜ FAW = Fall Armyworm; severity values represent mean ± standard error. Different superscript letters indicate significant differences (p < 0.05) according to Tukey’s test.
Table 5.
Bacterial Isolates Showing In Vivo Biocontrol Efficacy against FAW.
| Strain | Organism | Score | FAW Severity (% ± SE) | Biocontrol Efficacy (%) | Remarks |
|---|---|---|---|---|---|
| DR-55 | Bacillus subtilis | 15 | 16.67 ± 5.56 | 88.00 | Strong enzyme producer (high chitinase = 5); best control efficacy |
| DR-63 | Enterobacter sp. | 12 | 18.52 ± 3.21 | 82.00 | Moderate enzyme profile; excellent efficacy |
| HL-7 | Bacillus cereus | 9 | 33.21 ± 4.97 | 75.00 | Effective but lower enzyme activities |
| HL-37 | Bacillus cereus | 7 | 35.19 ± 8.49 | 55.50 | Moderate potential |
Note: ● The highest-scoring isolate (DR-55, Bacillus subtilis) exhibited the most comprehensive enzymatic arsenal (notably chitinase 5, protease = 3, glucanase = 2), translating to superior FAW suppression (88% efficacy). ● This suggests synergistic roles of multiple lytic enzymes in degrading insect cuticles and interfering with pest physiology.
Table 6.
Effects of Neem and Moringa extracts on Spodoptera frugiperda mortality (%) at different stages.
Table 6.
Effects of Neem and Moringa extracts on Spodoptera frugiperda mortality (%) at different stages.
| Treatments | Larva (Mean ± SEM) | Pupa (Mean ± SEM) | Adult (Mean ± SEM) |
|---|---|---|---|
| T1 | 13.36 ± 1.23ᶜ | 8.17 ± 0.11ᵇ | 2.19 ± 0.01ᵇ |
| T2 | 31.32 ± 0.24ᵇ | 10.24 ± 0.23ᵇ | 3.23 ± 0.01ᵇ |
| T3 | 80.13 ± 1.06ᵃ | 14.56 ± 1.53ᵃ | 6.29 ± 0.53ᵃ |
| T4 | 86.23 ± 1.12ᵃ | 16.67 ± 1.12ᵃ | 6.63 ± 0.49ᵃ |
| T5 | 83.11 ± 0.45ᵃ | 15.14 ± 0.64ᵃ | 6.67 ± 0.51ᵃ |
| T6 (Control) | 1.13 ± 0.13ᵈ | 1.10 ± 0.13ᶜ | 0.30 ± 0.06ᶜ |
Note: Means ± SEM followed by different superscript letters (a-d) within a column indicate significant differences among treatments according to one-way ANOVA followed by Tukey’s HSD test (p < 0.05).
Disclaimer/Publisher’s Note: The statements, opinions and data contained in all publications are solely those of the individual author(s) and contributor(s) and not of MDPI and/or the editor(s). MDPI and/or the editor(s) disclaim responsibility for any injury to people or property resulting from any ideas, methods, instructions or products referred to in the content. |
© 2025 by the authors. Licensee MDPI, Basel, Switzerland. This article is an open access article distributed under the terms and conditions of the Creative Commons Attribution (CC BY) license (http://creativecommons.org/licenses/by/4.0/).
Copyright: This open access article is published under a Creative Commons CC BY 4.0 license, which permit the free download, distribution, and reuse, provided that the author and preprint are cited in any reuse.


