
Submitted:
19 November 2025
Posted:
20 November 2025
You are already at the latest version
Abstract
This paper investigates the comprehensive energy profile and renewable energy solutions for a rural village comprising 30 houses. The study begins by analyzing the load demand distribution across day and night periods, with maximum daytime consumption recorded at 57.860 kWh and total daily usage of 509.040 kWh, while nighttime consumption peaks at 11.060 kWh with a total of 80.460 kWh. Detailed hourly consumption patterns are presented for various village components, including residential, water pumping, street lighting, medical facilities, and a supermarket, offering a granular view of energy use. To address the village’s energy requirements sustainably, a photovoltaic (PV) system with a capacity of 60 kW is proposed, supplemented by a solar thermal water heating system designed to meet hot water demands efficiently. The paper outlines the design and simulation of the solar water heating system, including calculations for water tube diameters, thermal resistance, and necessary tube length to transfer absorbed solar energy. MATLAB (V.22b) simulations further illustrate the performance of the integrated system, modeling energy production, battery charging/discharging cycles, and temperature fluctuations in water systems over a 24-hour period. Comparative analyses between standalone PV, PV/T hybrid, and combined PV plus solar thermal solutions reveal that the most cost-effective and maintenance-efficient strategy involves separate PV and thermal installations. The study highlights significant cost savings and environmental benefits over traditional diesel-based systems, positioning solar technologies as a reliable, sustainable, and economically viable solution for rural electrification and domestic hot water supply. Additional technical analysis confirms system sustainability and economic efficiency in real practice.
Keywords:
renewable energy
; photovoltaic system
; solar thermal energy
; rural electrification
; load demand analysis
; energy simulation
; renewable energy integration
1. Introduction
The increasing global emphasis on sustainable energy solutions has underscored the urgency for rural communities to transition away from conventional fossil fuel–based systems. Rural areas, often dependent on diesel generators and other traditional energy sources, face escalating operational costs, fuel supply challenges, and significant environmental repercussions. This study focuses on a rural village comprising 30 houses, where an in-depth analysis of energy consumption patterns was conducted to develop an integrated renewable energy solution capable of meeting both electrical and domestic hot water demands [1].
Detailed energy load assessments of the village revealed distinct diurnal consumption patterns. During daytime hours, the village experiences a maximum consumption of 57.860 kWh, with a total daytime energy usage of 509.040 kWh. In contrast, nighttime consumption is markedly lower, peaking at 11.060 kWh with a cumulative usage of 80.460 kWh over the night period. The analysis incorporated various components of village life, including residential energy use, water pumping, street lighting, medical facilities, and a local supermarket. These comprehensive measurements provided a robust understanding of the load distribution, thereby laying the foundation for the design of a renewable energy system that is both technically viable and economically sustainable [2].
Based on the load demand analysis, the proposed solution integrates a 60kW photovoltaic (PV) system with a solar thermal water heating system. The PV system is designed to generate the electricity needed to support the village’s daily activities, while the solar thermal component is tailored to supply domestic hot water efficiently. Detailed engineering calculations were performed to determine critical parameters such as the appropriate water tube diameters, thermal resistance values, and the necessary tube length to ensure efficient heat transfer from the solar collector to the water. These calculations confirm that under optimal operating conditions, the solar thermal system can effectively raise water temperature from an initial 10 °C to a final temperature of 55 °C, thereby meeting the household hot water requirements [3].
To validate the proposed design and assess its performance under real-world conditions, the study employed simulation techniques over a complete 24-hour cycle. MATLAB was utilized as the primary simulation tool to model the system’s behavior, accounting for dynamic variables such as solar radiation intensity, battery charge and discharge cycles, and the temperature fluctuations within the water heating system. The simulation results provided valuable insights into the energy production patterns, the efficiency of the battery storage system, and the overall thermal performance of the solar water heater. This comprehensive modeling approach has been instrumental in identifying potential operational challenges and optimizing the system’s design for maximum efficiency [4].
The objectives of this study are multifaceted. Primarily, the study aims to analyze the detailed load distribution within the village during both daytime and nighttime periods to accurately quantify the energy demand. Additionally, the research seeks to design an integrated renewable energy system that combines photovoltaic power generation with solar thermal water heating, ensuring that both electricity and hot water needs are met in a cost-effective manner. A further objective is to perform rigorous engineering calculations to determine the necessary specifications for the solar thermal system, ensuring optimal heat transfer and system performance. Finally, the study endeavors to evaluate the operational performance of the integrated system through simulation, providing a comparative analysis of various renewable energy configurations in terms of cost efficiency, technical feasibility, and maintenance requirements [5].
The simulation and data analysis were primarily executed using MATLAB, which served as the cornerstone for modeling the energy flow, battery dynamics, and thermal behavior of the system. Alongside MATLAB, additional computational tools were employed for data analysis to interpret simulation outputs and extract key performance indicators. These tools have enabled a detailed evaluation of the energy production and consumption trends, thereby facilitating a more accurate assessment of the integrated system’s performance [6].
In summary, this study presents a comprehensive examination of the load demand and renewable energy integration for a rural village. By leveraging detailed consumption data, advanced simulation techniques, and rigorous engineering analysis, the research demonstrates that an integrated solution comprising separate photovoltaic and solar thermal systems offers a sustainable, efficient, and economically viable alternative to conventional energy sources. The proposed approach not only enhances energy security and reduces environmental impact but also provides a replicable model for rural electrification and sustainable development [7].
2. Materials and Methods
2.1. System Configuration and Installation
The proposed photovoltaic (PV) power system is designed to operate as a standalone energy source capable of supplying electricity to an off-grid rural community. The workflow of the system involves multiple functional stages, beginning with solar energy collection and ending with power delivery to household and community loads. A simplified schematic of the operational process is presented in Figure 1.
Solar radiation is captured by the PV modules and converted into direct current (DC) electrical power. This electrical output is then routed through a charge controller, which regulates charging conditions and protects the battery bank from overcharging or excessive discharge. The stored energy ensures power availability during non-sunlight hours, especially overnight. When electricity is required for appliances and household loads, an inverter converts DC energy to alternating current (AC), making it compatible with conventional domestic electrical systems [8].
This step-wise configuration ensures continuous, stable, and clean energy generation suitable for remote communities that lack access to conventional grid infrastructure. The systematic breakdown of energy flow also aids in performance optimization, fault diagnosis, and long-term scalability [3].
2.2. Geographic and Environmental Context
The implementation site is a remote village situated in the Sharq Al-Nile region of Khartoum State, Sudan, an area characterized by low infrastructure development and limited access to centralized power networks. The community consists of approximately 30 households, supporting a population of nearly 250 residents. Essential services include a medical station and a small retail supply point. Agriculture is the primary economic activity, with each household cultivating roughly three feddans—considered the minimum for local food self-sufficiency [9].
Geographically, the village is positioned near latitude 16°N and longitude 32°E, placing it within a high solar-resource corridor. Sudan, particularly regions along the sub-Saharan belt, receives some of the highest annual solar irradiation levels worldwide. Recorded solar potential in the area reaches peak intensities of approximately 1100 Wh/m², as indicated in Figure 2.
Understanding the temporal fluctuation of incident solar radiation is essential when designing standalone renewable energy systems. Variations in sunlight directly influence PV generation, battery cycling, and storage requirements. The profile shown in Figure 2 reflects radiation dynamics throughout the daylight period, supporting optimal sizing and operational planning for the energy system.
3. Load Demand Requirements
The represented village has 30 houses with maximum energy at day 57.860 kWh and total consumption during day 509.040kWh while night maximum power is 11.060 kWh and total consumption is 80.460 kWh. Table 1 shows the distributions of this load [10].
Total load consumption of the village at night and day is represent at Figure 3.
From Figure 3 Shows the combined energy usage of the entire village over a 24-hour period amounts to 590 kWh. During the daytime, the village consumes 510 kWh of energy, while during the night, it uses 80 kWh. A photovoltaic system with a capacity of 60 kW is installed to cater to the daily energy needs [11].
4. Study of Production Hot Water Separates
Solar water heating systems in Figure 4 transfer heat to the load via a storage tank using a liquid handling mechanism and solar collectors. The liquid handling unit contains pumps to transfer the working fluid from the collectors to the storage tank in addition to the control and safety equipment. Well-made solar water heaters include safety features to keep them from overheating on bright, sunny days and can function efficiently even in below-freezing weather. Many systems include a backup heater built in to guarantee that customers will always have access to hot water, especially in the event of low sunshine. There are several uses for service hot water, the most common of which are for domestic hot water systems (DHWS) [12].
Main Components of solar water heating systems
Collector: Liquid is heated using solar thermal collectors, which take in and hold solar heat.
Pump: It makes the system’s water flow through force.
Tank: Usually insulated to prevent heat loss, the tank holds the hot water produced by the solar collectors [13].
Controller: The temperature differences between the water exiting the solar collector and the storage tank next to the heat exchanger are measured. The pump activates when the temperature difference between the water in the collection and the tank is 8–10 °C. On the other hand, it stops working when the temperature differential drops to 3-5 °C. During pump operation, this tactic guarantees that the stored water continuously gets heat and keeps the pump from cycling on and off too frequently [14].
Improved Method for Flat Plate Solar Water Heater Calculation:
All types of solar water heaters are sensitive to temperature (outside air temperatures) and sun irradiation (I), which is expressed in Wh/m2. The inner area and every part of the solar water heater cools down to the surrounding negative temperature at night in cold weather.
The solar irradiation I, (Wh/m2), and the outdoor air temperature rise in the morning at the same time after dawn. The temperature within the solar water heater rises because of solar radiation Qsol.in, W entering through the glass cover and being absorbed by the absorber sheet [15].
To precisely determine the conditional temperature tcond in tunnels based on radiation and absorbed solar heat, simultaneous changes in solar radiation intensity I, Wh/m2 and outside temperature tout Co must be considered. The sunrise Occurs at 07:30 a.m. in the local time zone. According to Armenia’s construction climatology guide, the wintertime irradiance for the village at 08:00 a.m. is approximately I=900 Wh/m2.
At 7:30 a.m., the ambient air temperature transitions from a nighttime low of tout=25 °C to a relatively cool tout=20 °C. This lower temperature is less conducive to water heating. Consequently, it becomes more likely that the flat solar heater will enter the water heating mode around 10:00 a.m., following sunrise when the solar radiation intensity reaches I=1000 Wh/m2, and the outside temperature rises to tout=35 °C. From 10:00 to 16:30, the average solar radiation intensity remains constant at I=900 Wh/m2. The thermal characteristics of the flat plate solar water heater are determined by the interplay of irradiance I=900 Wh/m2 and outside temperature tout=20 °C.
Flat Plate Solar Water Heater Thermal Characteristics Determination:
During the early morning before sunrise, the hotbox experiences a lack of solar irradiance, resulting in internal surface temperatures and ambient surroundings matching the outside air temperature tout. In the cold winter climate of Armenia, this temperature is tout=20 °C. Following sunrise, solar radiation permeates through the glass cover and gets absorbed by the dark-colored absorber sheet [16]. The quantity of solar energy (Qsol.in), measured in watts, that enters the confined hot tunnel is determined by the subsequent production equation:
In this context, represent the solar radiation intensity at a 32° northern latitude, where =0.45 is signifies the absorption rate of solar rays by the dark-colored interior surface of the narrow hot tunnel. Considering the partial reflection of incident solar rays from the glass cover and the presence of dust on its surface, the radiation penetration rate through a single-pane glass cover is denoted as =0.64. The assumed dimensions for the flat plate solar water heater hotbox are as follows: length (a) is 1m, width (b) is 0.5m, the height of the narrow air tunnel (hair.tun.) is 0.05m, the surface area of the transparent glass cover () is 0.5 m2, and the volume of the hotbox narrow air tunnel is Vtun = abhair.tun = 0.025m3.The subsequent equation determines the quantity of solar energy (Qsol.in), measured in watts, that has entered the hotbox using the specified formula. (1): = 460.8 W
As a result,
where: is the heat convection rate in the hot tunnel per W/(m2 Co) : Cold side temperature in Co, is the heat input (W/m²).
The heat convection rate on the internal surface of a narrow air gap, like a hot tunnel, is deemed acceptable at in = 2.9 W/ (m² Co) [17]. To determine the final temperature of the water (tw.fin.) Heated in the water meander tube, considering that all the absorbed solar heat Q(sol.in) = 460.8W transfers to the flowing water, the calculation can be done using the ensuing formula.
Here represents the initial temperature of tap water (= 10Co), notes the water flow rate in the tube (kg/s), and stands for the specific heat of water (=4180 J/kg) (kg Co).
For instance, if the daily demand for hot water is =200 kg/day or = /7 h=200/7=28.5 kg/h the water’s final temperature . increases from an initial value of =10 Co to the following value: Co.
The capability of the water to reach a temperature of Co the air temperature in the hot tunnel exceeds Co. This is evidenced by the radiation temperature of the absorption sheet, where free convection Occurs under conditions of a heat convection rate greater than =2.9 W/(m2 Co):
where = 25 Co outside air temperature at 7:30 a.m., =12 W/(m2 Co) - assumed value of free heat convection rate on the absorption sheet’s surface [18].
The value of = 41.7 Co is determined by equation. Substituting the following values for data in formula (2) I=900W/m2, X=0.64, P=0.45, =2.9W/(m2 Co), and tout= 20Co will yield the following conditional temperature tcold, Co of air in the hot tunnel: tcold is110Co.
Water Tube Diameters
The following formula is used to calculate the inferior diameter of a water tube.
where =0.0045kg/s –water flow rate in water tube, ω=0.015m/s– velocity of movement of the water in tube, =1000 kg/m3 – density of water [19].
Substituting the above data for the values in formula (5) yields the inferior diameter of a water tube = 0.02m. The outside diameter of the water tube is 3 mm larger than the inside diameter. That = 0.023m or 23 mm.
Calculating the Required Water Tube Length
The tube should have an appropriate length , m for complete transfer of the absorbed =460.8W of solar energy to the water, which can be determined using the following equation [20].
where is the average temperature of the water in the tube, is the thermal resistance to heat transfer from the hot tunnel air to the water in the tube, and m Co / W is the molecular weight.
The average water temperature represents the following fraction:
The following expression is used to calculate the thermal resistance (A) to heat transfer from hot tunnel air to water in a cylindrical meander tube and the average of the temperature at the outer surface of the tube while the temperature at the inner surface of the tube is .
where:
A represents the total thermal resistance.
is the external heat transfer coefficient 2.9 W/(m2 Co).
is the external diameter of the tube.
is the thermal conductivity of the tube material.
is the internal diameter of the tube.
intαint is the internal heat transfer coefficient.
= 80 W/(m2 Co) are the convective heat coefficients on the external and internal surfaces of the water tube, and =401 W/(m2 Co) (m Co) - Copper tube heat conductivity coefficient [21].
Substituting the above data for the values of formula (8) and calculating the following thermal resistance to heat transfer yields A =162 m Co/W.
When formulas (7) and (8) are substituted in formula (6) and some simplifications are made, the following equation is obtained.
The formula (9) is converted into the following equation to determine the required length , m of water tube:
The required length of water meander tube, calculated by (10) to transfer the penetrated solar energy to the flowing water in water tubes, is =8.6 m.
In this case, we will use solar panels to heat water and solar panels to generate electricity for the same village [22].
Figure 5.
Daily and Night Load Without Boiler.
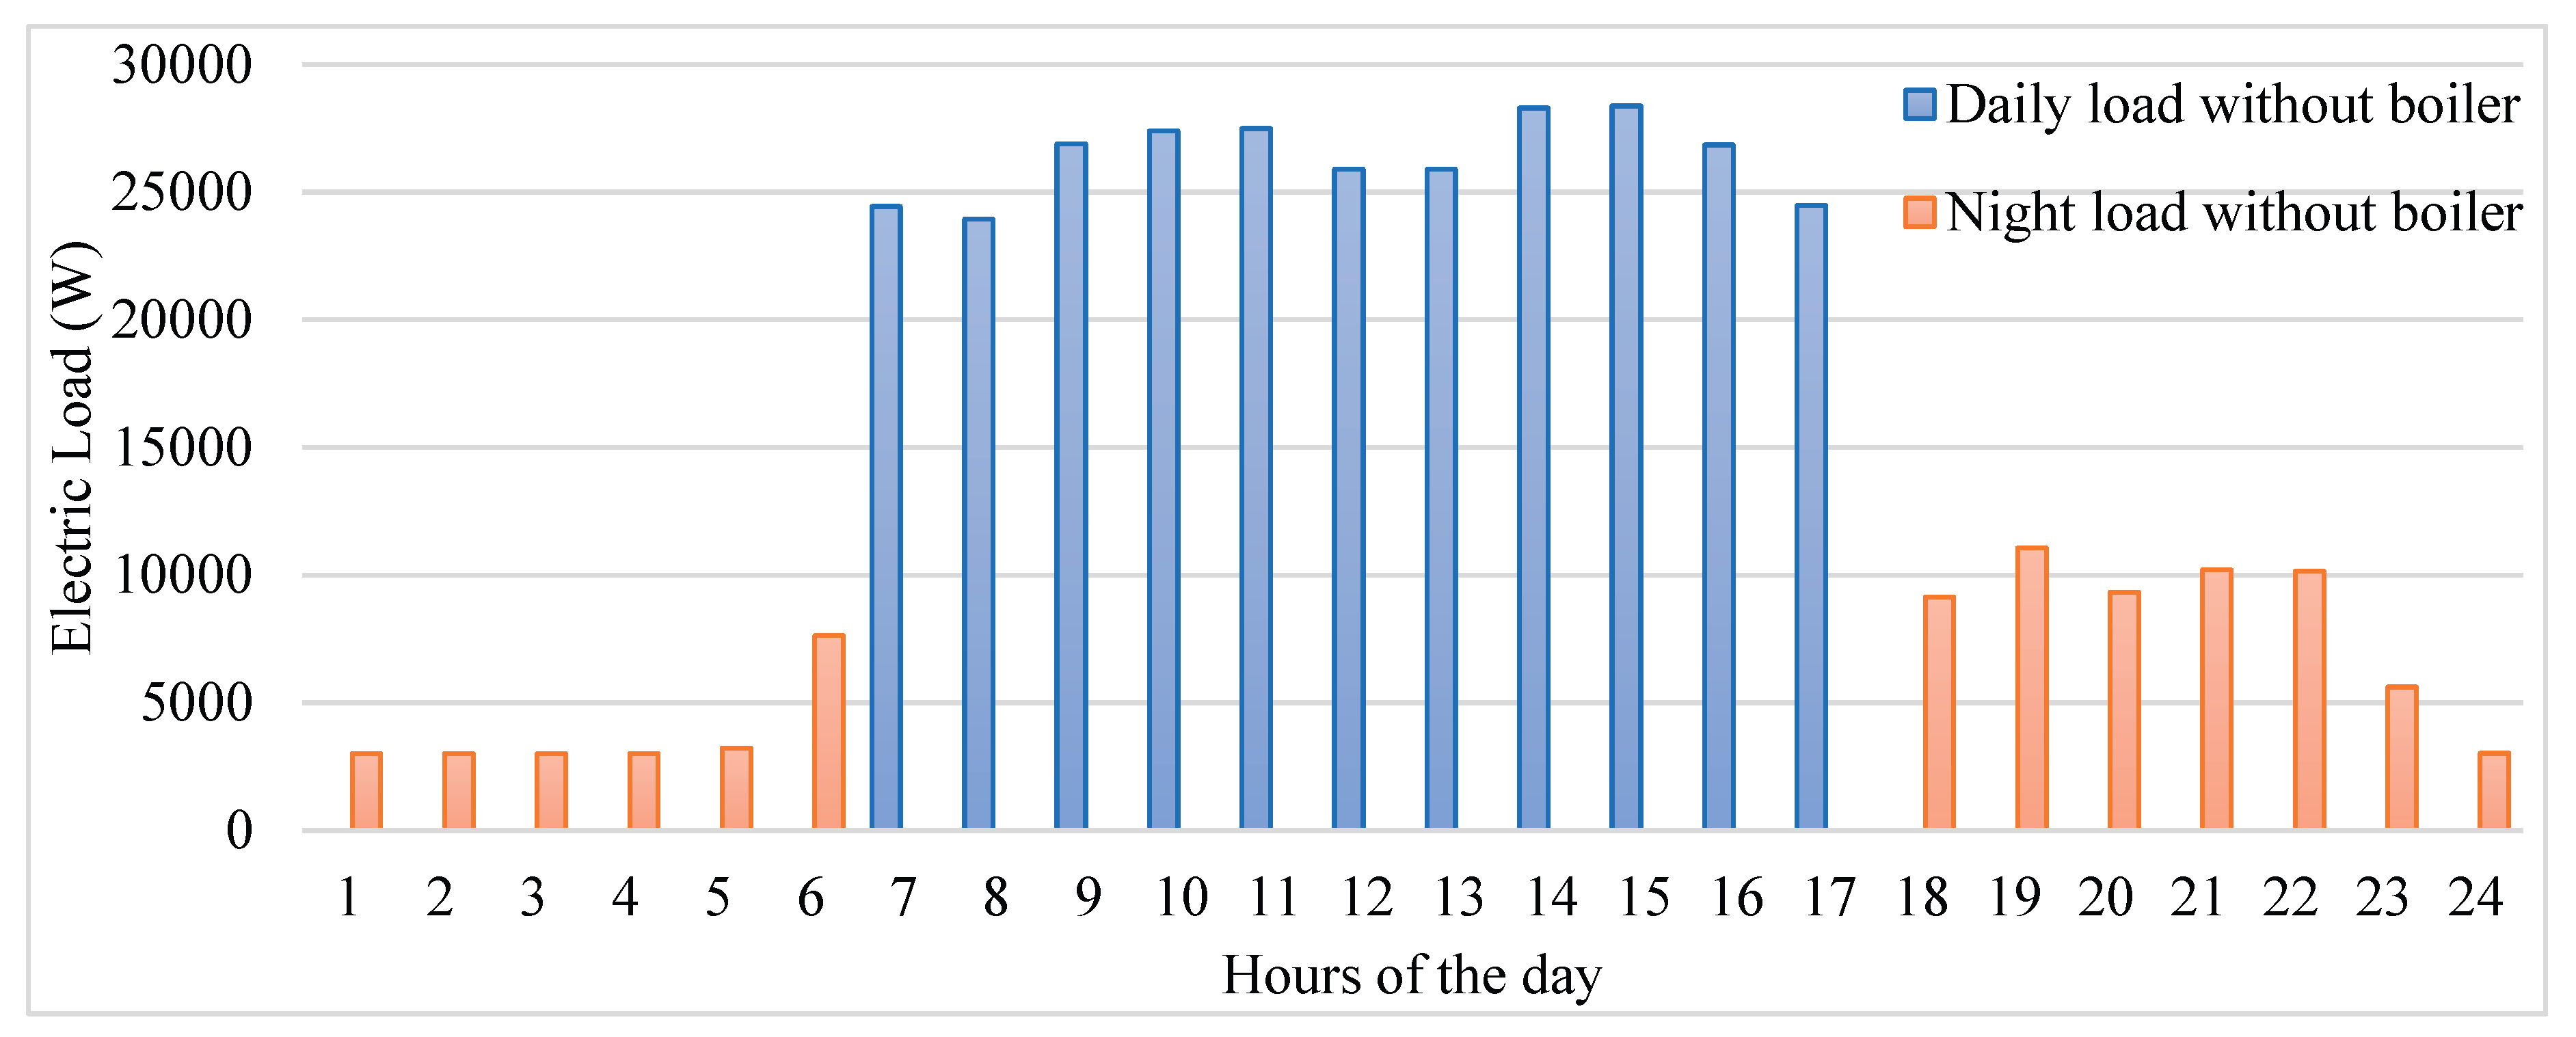
Figure 6 illustrates the daily and nighttime electricity demand profile in a scenario where a boiler is not utilized. The MATLAB code sets up system parameters and simulates a solar panel system’s performance across 24 hours. It computes the hourly distribution of boiler load and total consumption without the boiler, then generates curves for hot water production, energy production, and total hourly consumption. These results are displayed, showing the hour, hot water production, and electricity production for each hour, along with the total hot water and electricity production for the entire period [23].
The script initially generates random energy production data, adjusting it based on solar radiation levels. It models battery charging and discharging according to energy production and consumption patterns, ensuring the battery charge remains within defined limits. Additionally, it simulates temperature variations for hot water and inlet water, constraining them within reasonable ranges. Finally, various aspects of the simulation results, such as energy production, battery charge, temperature, solar radiation, and battery voltage, are visualized [24].
Figure 7 illustrates the fluctuation in water temperature at both the inlet and outlet of a system over a designated timeframe. It indicates that the lowest temperature, around 9 °C, was recorded at 1 o’clock, while the highest temperature, reaching 83 °C, Occurred around 16 o’clock. This data offers valuable insights into the thermal behavior and effectiveness of the system throughout the day, aiding in the assessment and optimization of its performance [25].
Figure 8 serves as a representation of solar radiation intensity, typically measured in kilowatt-hours per square meter (kWh/m2). The graph depicts the duration of solar irradiation from 6 AM to 6 PM, with the peak intensity of 1100 kWh/m2 Occurring at 2 PM. This data is crucial for assessing the availability of solar energy throughout the day, which is essential for designing and optimizing solar energy systems for various applications, including electricity generation, heating, and cooling [26].
Figure 9 represents the state of charge of a battery over a period. It typically shows a decrease in charge during nighttime when solar energy production is minimal or absent, followed by an increase in charge during daylight hours as the battery stores excess energy generated by solar panels. This pattern reflects the common practice in solar energy systems where batteries serve to store surplus energy during peak production periods for later use when solar energy generation is reduced or absent, ensuring a continuous and reliable power supply [27].
Figure 10 presents a comparative analysis of energy consumption, specifically focusing on different scenarios such as total boiler load distribution, total consumption excluding boiler usage, and total consumption when utilizing photovoltaic (PV) panels to generate electricity. This comparison provides valuable insights into the distribution of energy usage across various components of the system and the impact of integrating renewable energy sources like PV panels on overall energy consumption patterns [28].
Figure 11 provides a comprehensive comparison of total energy production and consumption, encompassing various sources such as total consumption, energy supplied from batteries, energy production from photovoltaic (PV) panels, energy production from a combination of water panels and photovoltaic (PV) systems, and energy production from standalone PV panels. This comparison is crucial for assessing the balance between energy generation and consumption within a system, facilitating the optimization and management of energy systems to ensure efficiency and sustainability [29].
Figure 12 illustrates a comparative analysis between energy consumption and generation, offering insights into the balance between energy demand and production within the system. This comparison might involve various sources of energy consumption, such as electrical appliances, heating systems, or industrial processes’, juxtaposed with energy generation from solar panels.
In this case we used the same battery, inverter in case one and the same panel (LR4-72HPH-455M, 144 cells, 455 W455M), the number of panels in every building is 4, and the total number of panels required is (4×33) = 132 panels. the price of single panel is 100 USD at total cost of panels is 13000 USD, the cost Reduction with 13000 USD [30].
Non-pressurized solar panel, 100 L, steel, 12 tubes. Sontec SP180 represented in Figure 13. The non-pressurized solar panel with a 100 L tank capacity will collect enough water to meet the needs of a family of 5 people. Having a maximum pressure of 6 bar, the integrated system of the Sontec solar panel will work in optimal parameters, the 12 tubes with a length of 18 cm will help the water to be collected in the bowl.
12 tubes diam. 50 mm and length 1800 mm, max pressure working: 6 bars. The set contains: a float, steel tank, support, empty tubes. The technical specifications for the product in Table 2.
Table 2 outlines the technical specifications of the SP180 solar panel by Sontec, including details such as product type, dimensions, material, and packaging information, with each packet priced at $300 USD and the total cost for 31 units reaching $9300 USD.
5. Study of Photovoltaic Panel and Thermal (PV/T) Panel
The hybrid solar panel serves a dual purpose by simultaneously generating electricity and heating water tanks. This is accomplished by integrating a photovoltaic module for electricity generation with a solar thermal collector dedicated to water heating. The front section of the PVT panel captures solar radiation, generating both electricity and heat simultaneously. A highly efficient absorber, incorporated into the upper region of the solar cells, captures heat and, using propylene glycol, heats the water. This heat absorption not only supplies hot water but also effectively maintains the cool temperature of the photovoltaic cells, thereby improving their productivity and operational efficiency [31].
By incorporating both electricity generation and water heating capabilities into a single panel, the hybrid solar panel offers increased efficiency and cost savings on both energy bills. This innovative panel combines the advantages of thermal and photovoltaic solar technologies, making it a versatile solution for sustainable energy production. The connections box with output cables, positive, and negative terminals is added to facilitate installation.
Advantages:
The hybrid solar panel offers several advantages:
1. Cost Savings: It is more cost-effective compared to installing separate solar and solar thermal panels.
2. Simplified Installation: The single-panel design simplifies the installation process, reducing the need for additional brackets and mounts.
3. Enhanced Efficiency: The photovoltaic part of the panel stays cooler during the summer, leading to increased efficiency and higher electricity production.
4. Versatility: Well-suited for a range of applications, encompassing grid systems, standalone configurations, and incorporation into established heating systems for both residential and office settings. Its adaptability extends to heating pool water and can even serve for cooling purposes using coolers.
Dual Functionality: The hybrid solar panel can simultaneously produce electricity and hot water, making it a versatile solution for meeting diverse energy needs [32].
In cases where the demand includes both electricity and hot water, the hybrid solar panel, such as the CPVT60P250 model with a capacity of 250W for both hot water and electricity production, becomes a suitable and efficient choice, the more specifications in Table 3.
Table 3 presents the electrical data of the PVT module CPVT60P250, including the number of cells, peak power, voltage at maximum power, open circuit voltage, short-circuit voltage, module efficiency, working temperature range, maximal system voltage, rated current of diode, and various temperature coefficients. The module consists of 60 cells arranged in a 6x10 configuration, with a peak power of 250 Wp and an efficiency of 13%. Additionally, it operates within a temperature range of -40 to 85 °C, with a maximal system voltage of 1000 V and a rated current of diode of 20 A [34].
Figure 14 provides information visual representation related to the design of a PVT (Photovoltaic Thermal) module with the model designation CPVT60P250.
Table 4 provides various thermal data for a PVT (Photovoltaic Thermal) module, including parameters such as aperture area, thermal efficiency, nominal thermal power, fluid volume, volume flow rate, coefficients α1 and α2, and effective thermal capacity.
Table 5 provides technical data for a PVT (Photovoltaic Thermal) module, including module dimensions, junction box specifications, glass type and thickness, frame material, hydraulic connection details, weight, and certification information.
The provided MATLAB code (Annex 4) simulates the performance of a PV/T panel system over a 24-hour period. It starts by defining system parameters such as tank capacity, number of people in the family, total hot water and electric energy required, and the total number of houses in the village [35].
Next, it uses provided data for solar radiation, boiler load distribution, total consumption without boiler, and total consumption. The code then generates random data for energy production and scales it based on solar radiation. The simulation includes battery charging and discharging based on the energy production and consumption profiles. Battery charge is updated throughout the day, ensuring it stays within defined bounds.
Temperature profiles for hot water and inlet water are simulated and constrained within reasonable bounds. Finally, the code plots various aspects of the simulation results, including energy production, battery charge, temperature, solar radiation, and battery voltage [36].
Figure 15 displays the variation in water temperature at the inlet and outlet of a system over a specified period, with the lowest temperature recorded at 9 °C around 1 o’clock and the highest temperature reaching 83 °C around 16 o’clock, providing insights into the thermal performance and efficiency of the system throughout the day [37].
Figure 16 illustrates the solar radiation intensity measured in kilowatt-hours per square meter, showing a duration of irradiation from 6 AM until 6 PM, with the maximum intensity reaching 1100 kWh/m2 Occurring at 2 PM. This data provides a comprehensive understanding of the solar energy availability throughout the day, aiding in the assessment of solar energy potential and system design for various applications [11].
Figure 17 depicts the state of charge of a battery over time, showing a low charge during nighttime and an increase in charge during the day, reflecting the typical pattern of energy storage and discharge in solar energy systems where batteries store excess energy generated during daylight hours for use during periods of low or no sunlight [18].
Figure 18 presents a comparison of total energy production and consumption, including various sources such as total consumption, energy supplied from batteries, energy production from photovoltaic-thermal (PV/T) panels, energy production from PV/T panels and photovoltaic (PV) systems combined, and energy production from standalone PV panels. This comparison is essential for evaluating the balance between energy generation and consumption, aiding in the optimization and management of energy systems for efficiency and sustainability [31].
The total cost of PVT system is 15500USD, this system can provide all the village with hot water and power 7.750kW we should add 22.5kW with PV normal that can cost 23000USD. That mean the best way is to use PV system to generate electricity and solar thermal panel to produce hot water because of cost and maintenances after that come the hybrid system, the cost of this system is high and its need more maintenance compare with simple PV. The initial cost of PV is going down every year and initial cost of diesel is going up with fuel and transportation of diesel and side effect to environments is very high and there is no side effect on solar energy its clean sustainable and cheapest [8].
6. Conclusions
This study provides an in-depth evaluation of how solar photovoltaic (PV) systems and solar thermal technologies can be effectively integrated to meet both the electrical and thermal energy needs of a rural village. The proposed system was specifically designed for a community of 30 households located in a remote, off-grid region of Sudan, where energy access has traditionally been limited to diesel generators—a costly, environmentally harmful, and logistically challenging option.
Through detailed hourly load assessments, the study captured the village’s energy consumption dynamics, revealing a significant disparity between daytime and nighttime energy use. The peak daytime demand reached nearly 58 kWh, with a total daily consumption of over 509 kWh, while nighttime usage was substantially lower. These consumption patterns shaped the foundation for a robust energy system tailored to the community’s specific needs.
A standalone 60 kW PV system, complemented by a solar thermal water heating setup, was found to be the most efficient and sustainable configuration. Advanced simulations using MATLAB revealed stable performance under varying solar irradiance and temperature conditions. The battery storage system was modeled to accommodate charge/discharge cycles over a 24-hour period, ensuring continuous energy availability. Meanwhile, the thermal system demonstrated its capability to heat water from an initial 10 °C to over 80 °C, addressing domestic hot water needs for all households.
From a technical standpoint, the solar water heating system was optimized by calculating accurate water tube dimensions, heat transfer coefficients, and thermal resistance values. The analysis showed that a water tube length of approximately 8.6 meters and an internal diameter of 20 mm would ensure efficient heat exchange. Furthermore, the system design accounted for fluctuations in solar radiation and air temperature, providing operational resilience throughout the day.
Economically, the study confirmed that using separate PV and solar thermal systems offers the best balance between initial investment, operational simplicity, and long-term maintenance. The total cost for PV panels and basic thermal systems was significantly lower than that of hybrid PV/T panels, which, although efficient, involve higher complexity and maintenance demands. For example, while a hybrid system covering both energy and hot water needs would cost around $15,500, a combination of standard PV ($13,000) and solar thermal systems ($9,300) offered a more flexible and modular solution.
Additionally, the research compared different system configurations—PV alone, hybrid PV/T, and PV + thermal—and concluded that the last approach delivers superior results in terms of system efficiency, maintenance requirements, and cost-effectiveness. The economic advantage is further reinforced by the global trend of decreasing PV prices and the increasing cost of fossil fuels, particularly in remote regions where transportation and logistics add to fuel expenses.
Environmentally, the proposed system drastically reduces greenhouse gas emissions and dependence on fossil fuels, contributing to a cleaner and more sustainable energy future for rural communities. The absence of combustion and fuel transport also eliminates air pollution and health risks often associated with diesel generators.
The study also underlines the importance of localized system design. Factors such as regional solar irradiance (reaching up to 1100 Wh/m²), ambient temperature patterns, and daily sunlight duration were carefully considered to maximize system performance. The chosen technologies are well-suited to the region’s climatic conditions, making them replicable in similar rural settings across sub-Saharan Africa and other sun-rich regions.
In conclusion, this work offers a viable model for rural electrification using renewable energy technologies. It illustrates that even in remote and underserved communities, it is possible to deliver clean, affordable, and reliable energy by integrating solar PV systems for electricity and solar thermal systems for hot water. This approach not only addresses immediate energy demands but also contributes to long-term sustainability, economic development, and improved quality of life. Policymakers, engineers, and development agencies can use this model as a blueprint for deploying decentralized energy systems in other rural and off-grid locations.
Author Contributions
All authors contributed equally to the creation of the article. All authors have read and agreed to the published version of the manuscript.
Funding
This work was supported by a grant of the Ministry of Research, Innovation and Digitalization, project number PNRR-C9-I8-760089/23.05.2023, COD CF 31/14.11.2022, and PNRR-C9-I8-760111/23.05.2023, code CF 48/14.11.2022.
Institutional Review Board Statement
Not applicable.
Informed Consent Statement
Not applicable.
Data Availability Statement
Not applicable.
Conflicts of Interest
The authors declare no conflict of interest.
References
- Osman, M.G.; Lazaroiu, G. Harnessing Solar Energy for Sustainable Development in Rural Communities. Agriculture 2025, 15, 2021. [CrossRef]
- Sarbu, I. and Adam, M., 2011. Applications of solar energy for domestic hot-water and buildings heating/cooling. international journal of energy, 2(5), pp.34-42.
- Nagaraja, M.R.; Biswas, W.K.; Selvan, C.P. Advancements and challenges in solar photovoltaic technologies: enhancing technical performance for sustainable clean energy – A review. Sol. Energy Adv. 2024, 5. [CrossRef]
- Ali, A.O.; Elgohr, A.T.; El-Mahdy, M.H.; Zohir, H.M.; Emam, A.Z.; Mostafa, M.G.; Al-Razgan, M.; Kasem, H.M.; Elhadidy, M.S. Advancements in photovoltaic technology: A comprehensive review of recent advances and future prospects. Energy Convers. Manag. X 2025, 26. [CrossRef]
- Lazaroiu, A.C.; Osman, M.G.; Strejoiu, C.-V.; Lazaroiu, G. A Comprehensive Overview of Photovoltaic Technologies and Their Efficiency for Climate Neutrality. Sustainability 2023, 15, 16297. [CrossRef]
- Panagoda, L.P.S.S., Sandeepa, R.A.H.T., Perera, W.A.V.T., Sandunika, D.M.I., Siriwardhana, S.M.G.T., Alwis, M.K.S.D. and Dilka, S.H.S., 2023. Advancements in photovoltaic (Pv) technology for solar energy generation. Journal of research technology & engineering, 4(30), pp.30-72.
- Rehman, T.-U.; Qaisrani, M.A.; Shafiq, M.B.; Baba, Y.F.; Aslfattahi, N.; Shahsavar, A.; Cheema, T.A.; Park, C.W. Global perspectives on advancing photovoltaic system performance—A state-of-the-art review. Renew. Sustain. Energy Rev. 2024, 207. [CrossRef]
- Breyer, C., Bogdanov, D., Khalili, S. and Keiner, D., 2021. Solar photovoltaics in 100% renewable energy systems. In Encyclopedia of sustainability science and technology (pp. 1-30). Springer, New York, NY.
- Hegedus, S.S. and Luque, A., 2003. Status, trends, challenges and the bright future of solar electricity from photovoltaics. Handbook of photovoltaic science and engineering, pp.1-43. [CrossRef]
- Strejoiu, C.V., Osman, M.G. and Cernat, A.C., 2023. Towards sustainable transportation: modeling and simulation of pv panel implementation on national highways for charging electric vehicles which leads to mitigate carbon emission. UPB Scientific Bulletin, Series C: Electrical Engineering and Computer Science, 85(4), pp.321-334.
- Abdel-Aziz, M.M.; ElBahloul, A.A. Innovations in improving photovoltaic efficiency: A review of performance enhancement techniques. Energy Convers. Manag. 2025, 327. [CrossRef]
- Osman, M.G., Strejoiu, C.V., Panait, C., Lazaroiu, G. and Lazaroiu, A.C., 2023. Renewable energy integration, climate analysis, and efficiency optimization for greener transportation-case study in Dobrogea. International Multidisciplinary Scientific GeCoonference: SGEM, 23(6.2), pp.675-687.
- Islam, M.R.; Sumathy, K.; Khan, S.U. Solar water heating systems and their market trends. Renew. Sustain. Energy Rev. 2013, 17, 1–25. [CrossRef]
- Murshid, S.; Singh, B. Analysis and Control of Weak Grid Interfaced Autonomous Solar Water Pumping System for Industrial and Commercial Applications. IEEE Trans. Ind. Appl. 2019, 55, 7207–7218. [CrossRef]
- Roy, J.N. and Bose, D.N., 2018. Photovoltaic Science and Technology. Cambridge University Press.
- Osman, M.G., Ciupagenau, D.A., Lazaroiu, G. and Pisa, I., 2022, September. Increasing Renewable Energy Participation in Sudan. In 2022 11th International Conference on Renewable Energy Research and Application (ICRERA) (pp. 169-173). IEEE.
- Osman, M.G., Ciupageanu, D. and Stan, A., 2022. Analysis of Solar Radiation in Sudan and Optimal LCoation of Photovoltaic Panels. UPB Sci. Bull. Series C, 84(4).
- Antonello, R.; Carraro, M.; Costabeber, A.; Tinazzi, F.; Zigliotto, M. Energy-Efficient Autonomous Solar Water-Pumping System for Permanent-Magnet Synchronous Motors. IEEE Trans. Ind. Electron. 2016, 64, 43–51. [CrossRef]
- Qi, W.; Liu, J.; Christofides, P.D. Supervisory Predictive Control for Long-Term Scheduling of an Integrated Wind/Solar Energy Generation and Water Desalination System. IEEE Trans. Control. Syst. Technol. 2011, 20, 504–512. [CrossRef]
- Arnaut, L.G., Barroso, M. and Serpa, C., 2013. Solar energy conversion. In Applied Photochemistry (pp. 267-304). Dordrecht: Springer Netherlands.
- Ahmed, S.F.; Khalid, M.; Vaka, M.; Walvekar, R.; Numan, A.; Rasheed, A.K.; Mubarak, N.M. Recent progress in solar water heaters and solar collectors: A comprehensive review. Therm. Sci. Eng. Prog. 2021, 25. [CrossRef]
- Osman, M.G.; Lazaroiu, G.; Hamad, S.A.; Messaoud, H.; Mohammed, D.; Stoica, D. Analysis of Photovoltaic Systems with Battery Storage, Electric Vehicle Charging, and Smart Energy Management. Sustainability 2025, 17, 3887. [CrossRef]
- Zhang, Y.; Tan, S.C. Best practices for solar water production technologies. Nat. Sustain. 2022, 5, 554–556. [CrossRef]
- Gong, J., Li, C. and Wasielewski, M.R., 2019. Advances in solar energy conversion. Chemical Society Reviews, 48(7), pp.1862-1864. [CrossRef]
- Verlinden, P.; Young, D.L.; Xiong, G.; Reese, M.O.; Mansfield, L.M.; Powalla, M.; Paetel, S.; France, R.M.; Chiu, P.T.; Haegel, N.M. Photovoltaic device innovation for a solar future. Device 2023, 1. [CrossRef]
- Breyer, C.; Bogdanov, D.; Gulagi, A.; Aghahosseini, A.; Barbosa, L.S.N.S.; Koskinen, O.; Barasa, M.; Caldera, U.; Afanasyeva, S.; Child, M.; et al. On the role of solar photovoltaics in global energy transition scenarios. Prog. Photovolt. Res. Appl. 2017, 25, 727–745. [CrossRef]
- Roudbari, F.N.; Ehsani, H.; Amiri, S.; Samadani, A.; Shabani, S.; Khodadad, A. Advances in photovoltaic thermal systems: A comprehensive review of CPVT and PVT technologies. Sol. Energy Mater. Sol. Cells 2024, 276. [CrossRef]
- Abdelfadeel, D.I.M.G.O., Științific, C. and LAZAROIU, G., Rezumatul Tezei de Doctorat.
- Markvart, T. and Castañer, L. eds., 2003. Practical handbook of photovoltaics: fundamentals and applications. Elsevier.
- Alayi, R.; Khalilpoor, N.; Heshmati, S.; Najafi, A.; Issakhov, A. Thermal and Environmental Analysis Solar Water Heater System for Residential Buildings. Int. J. Photoenergy 2021, 2021, 1–9. [CrossRef]
- Guo, Y.; Ming, B.; Huang, Q.; Liu, P.; Wang, Y.; Fang, W.; Zhang, W. Evaluating effects of battery storage on day-ahead generation scheduling of large hydro–wind–photovoltaic complementary systems. Appl. Energy 2022, 324. [CrossRef]
- He, Y.; Hamann, T.; Wang, D. Thin film photoelectrodes for solar water splitting. Chem. Soc. Rev. 2019, 48, 2182–2215. [CrossRef]
- Valdiserri, P. Evaluation and control of thermal losses and solar fraction in a hot water solar system. Int. J. Low-Carbon Technol. 2018, 13, 260–265. [CrossRef]
- Chowdhury, I.J.; Yusoff, S.H.; Gunawan, T.S.; Zabidi, S.A.; Bin Abu Hanifah, M.S.; Sapihie, S.N.M.; Pranggono, B. Analysis of Model Predictive Control-Based Energy Management System Performance to Enhance Energy Transmission. Energies 2024, 17, 2595. [CrossRef]
- Tan, Q.; Zhang, Z.; Wen, X.; Fang, G.; Xu, S.; Nie, Z.; Wang, Y. Risk control of hydropower-photovoltaic multi-energy complementary scheduling based on energy storage allocation. Appl. Energy 2024, 358. [CrossRef]
- Shrivastava, R.L.; Kumar, V.; Untawale, S.P. Modeling and simulation of solar water heater: A TRNSYS perspective. Renew. Sustain. Energy Rev. 2017, 67, 126–143. [CrossRef]
- Mertens, K., 2018. Photovoltaics: fundamentals, technology, and practice. John Wiley & Sons.
Figure 1.
Flow chart of PV system.
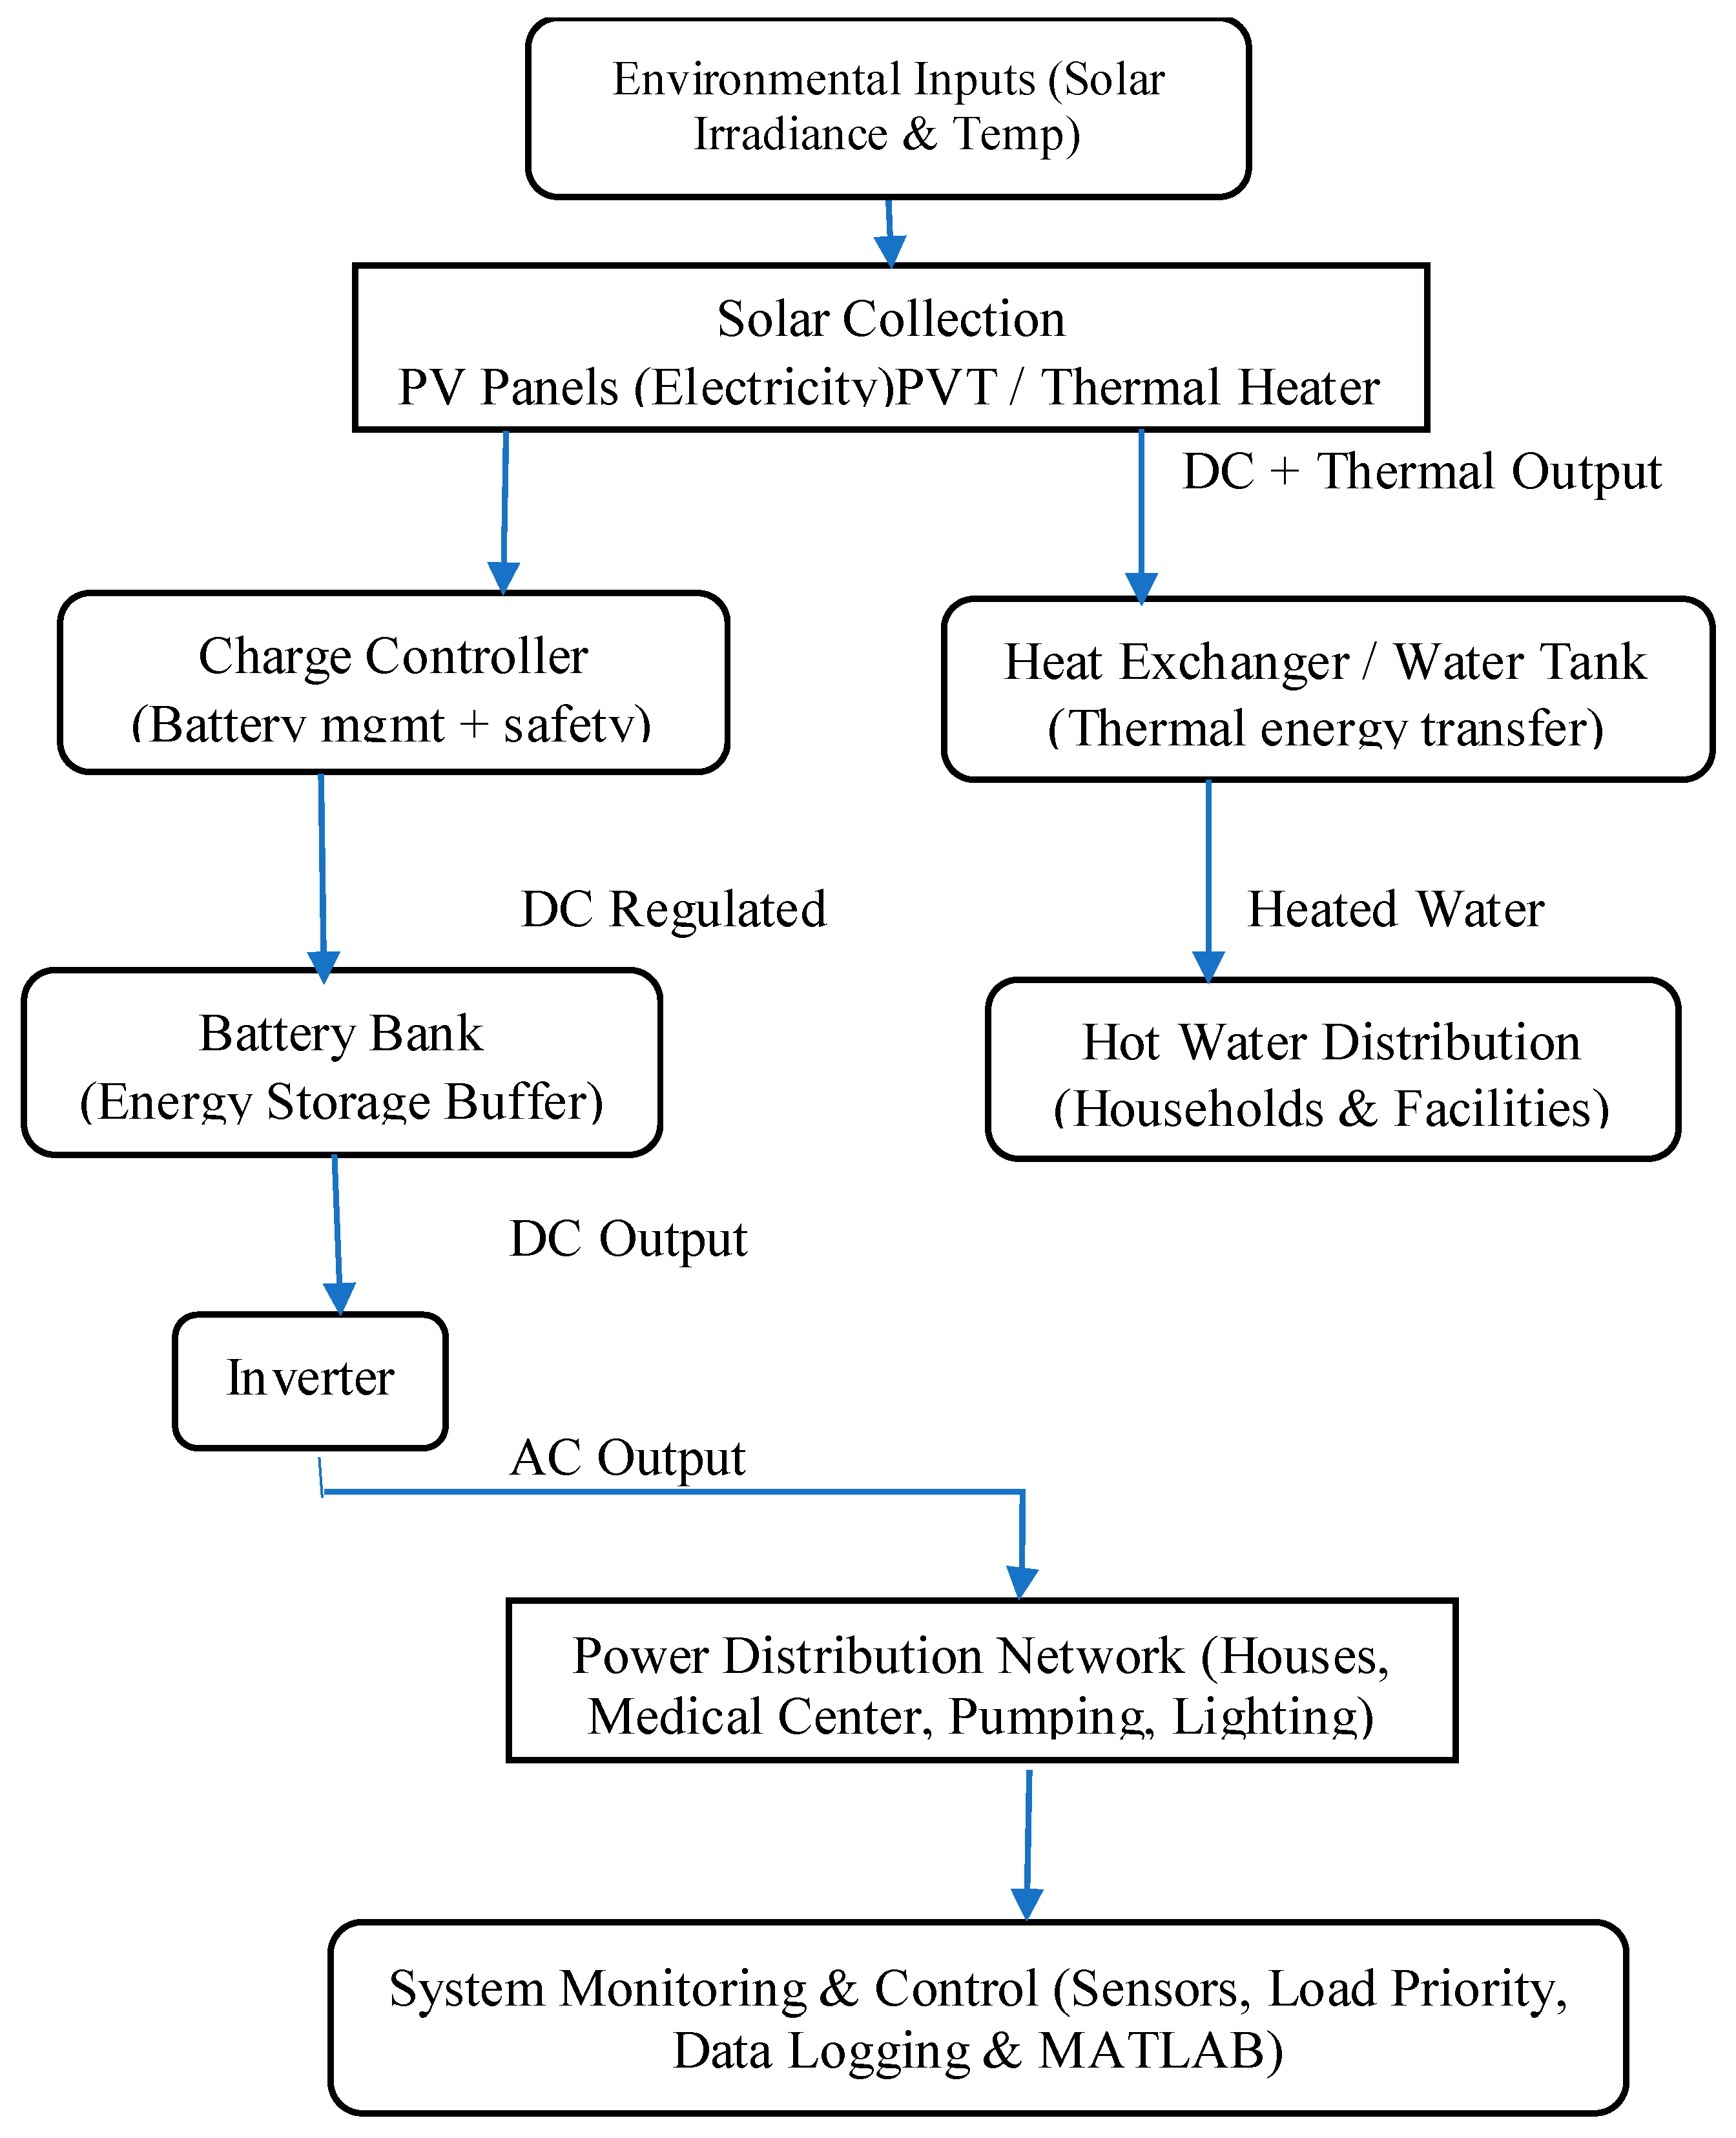
Figure 2.
Solar Energy Distribution (Wh/m²).
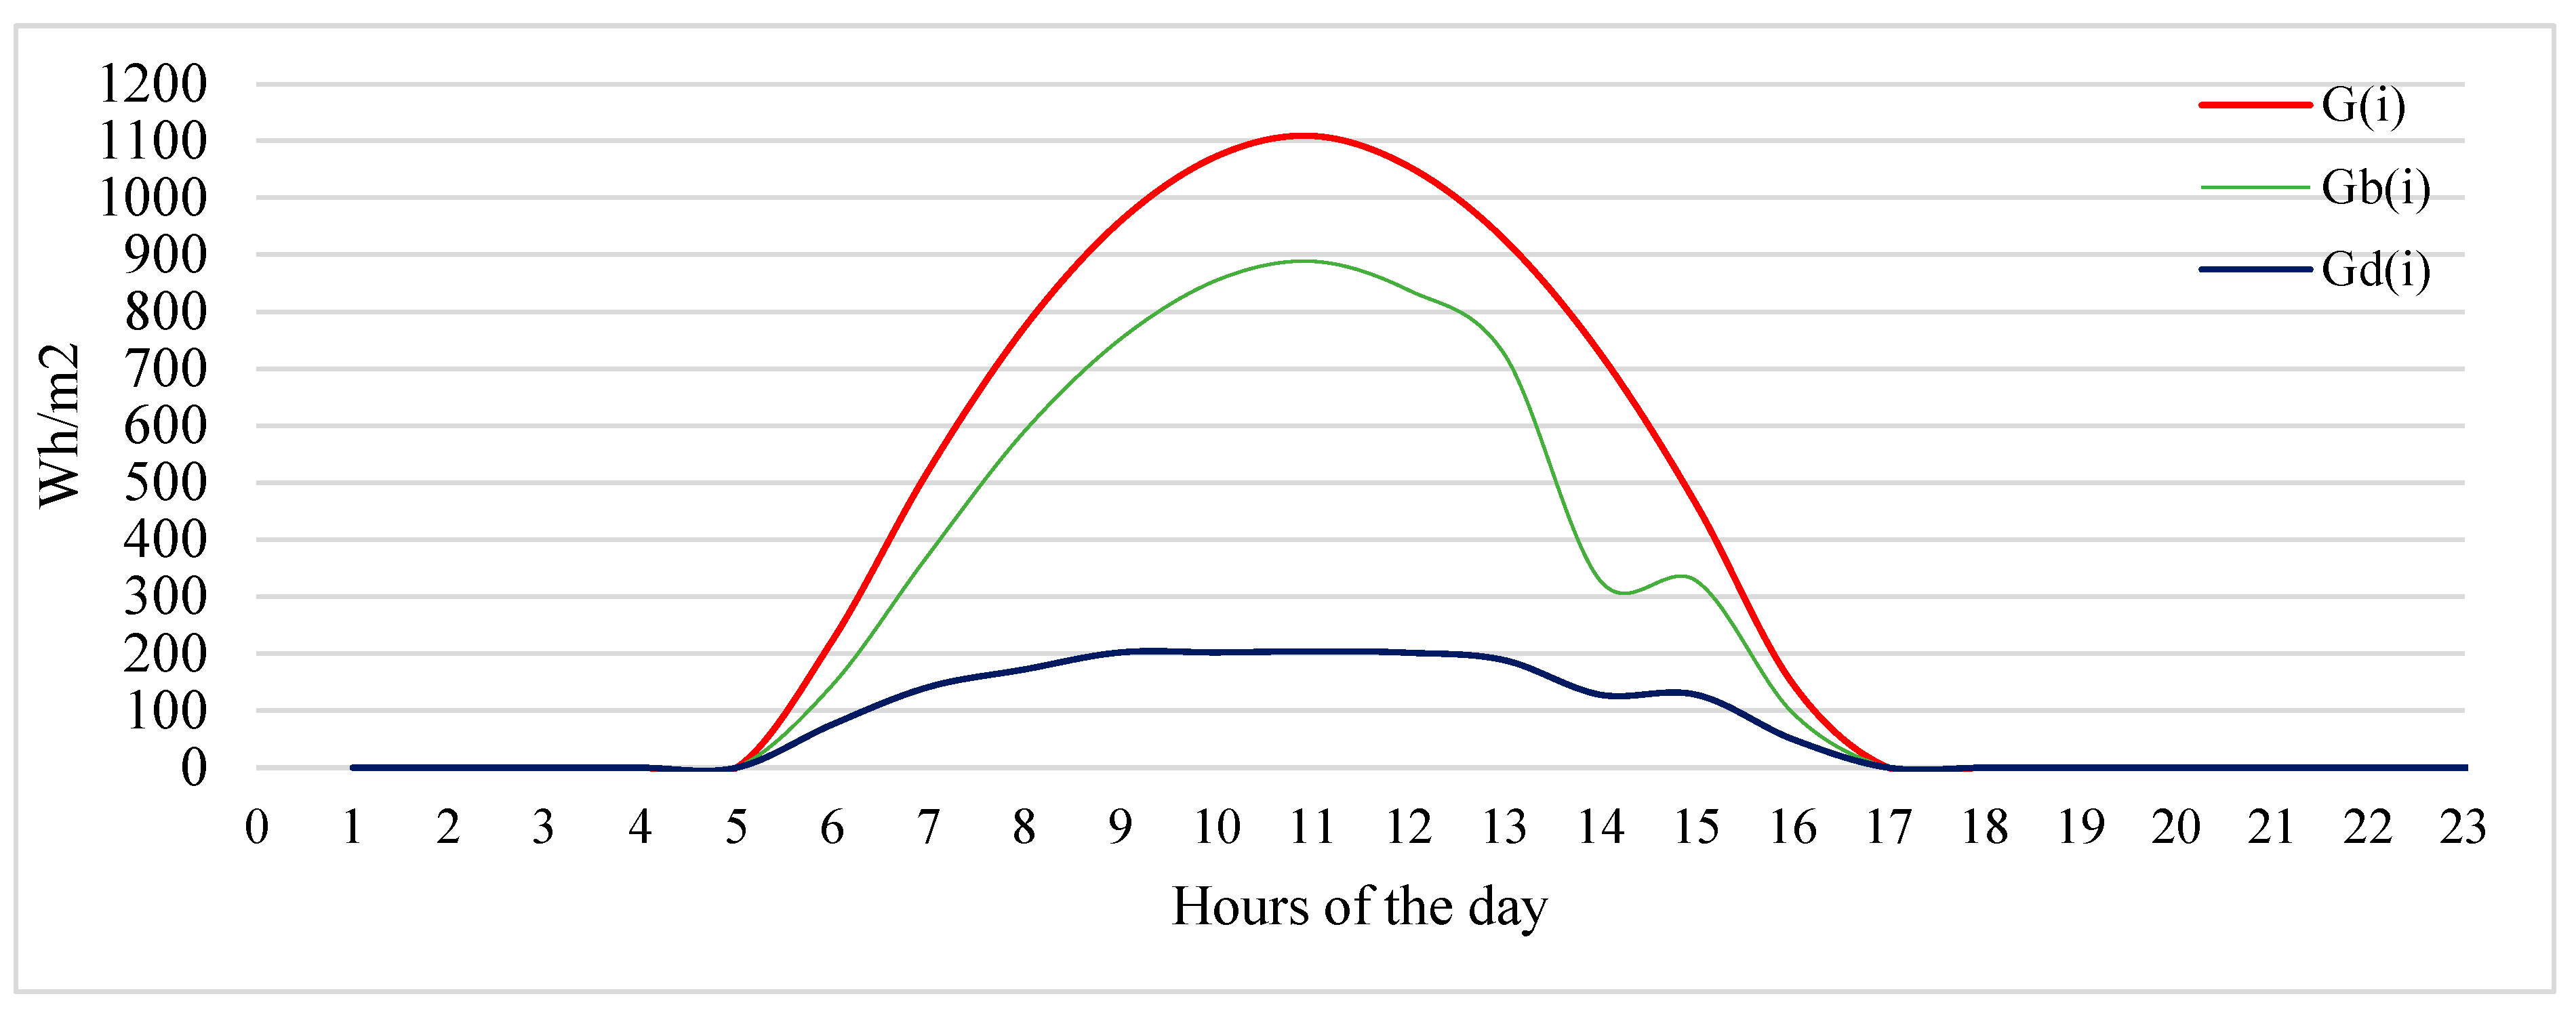
Figure 3.
Total Load At Night and Day.
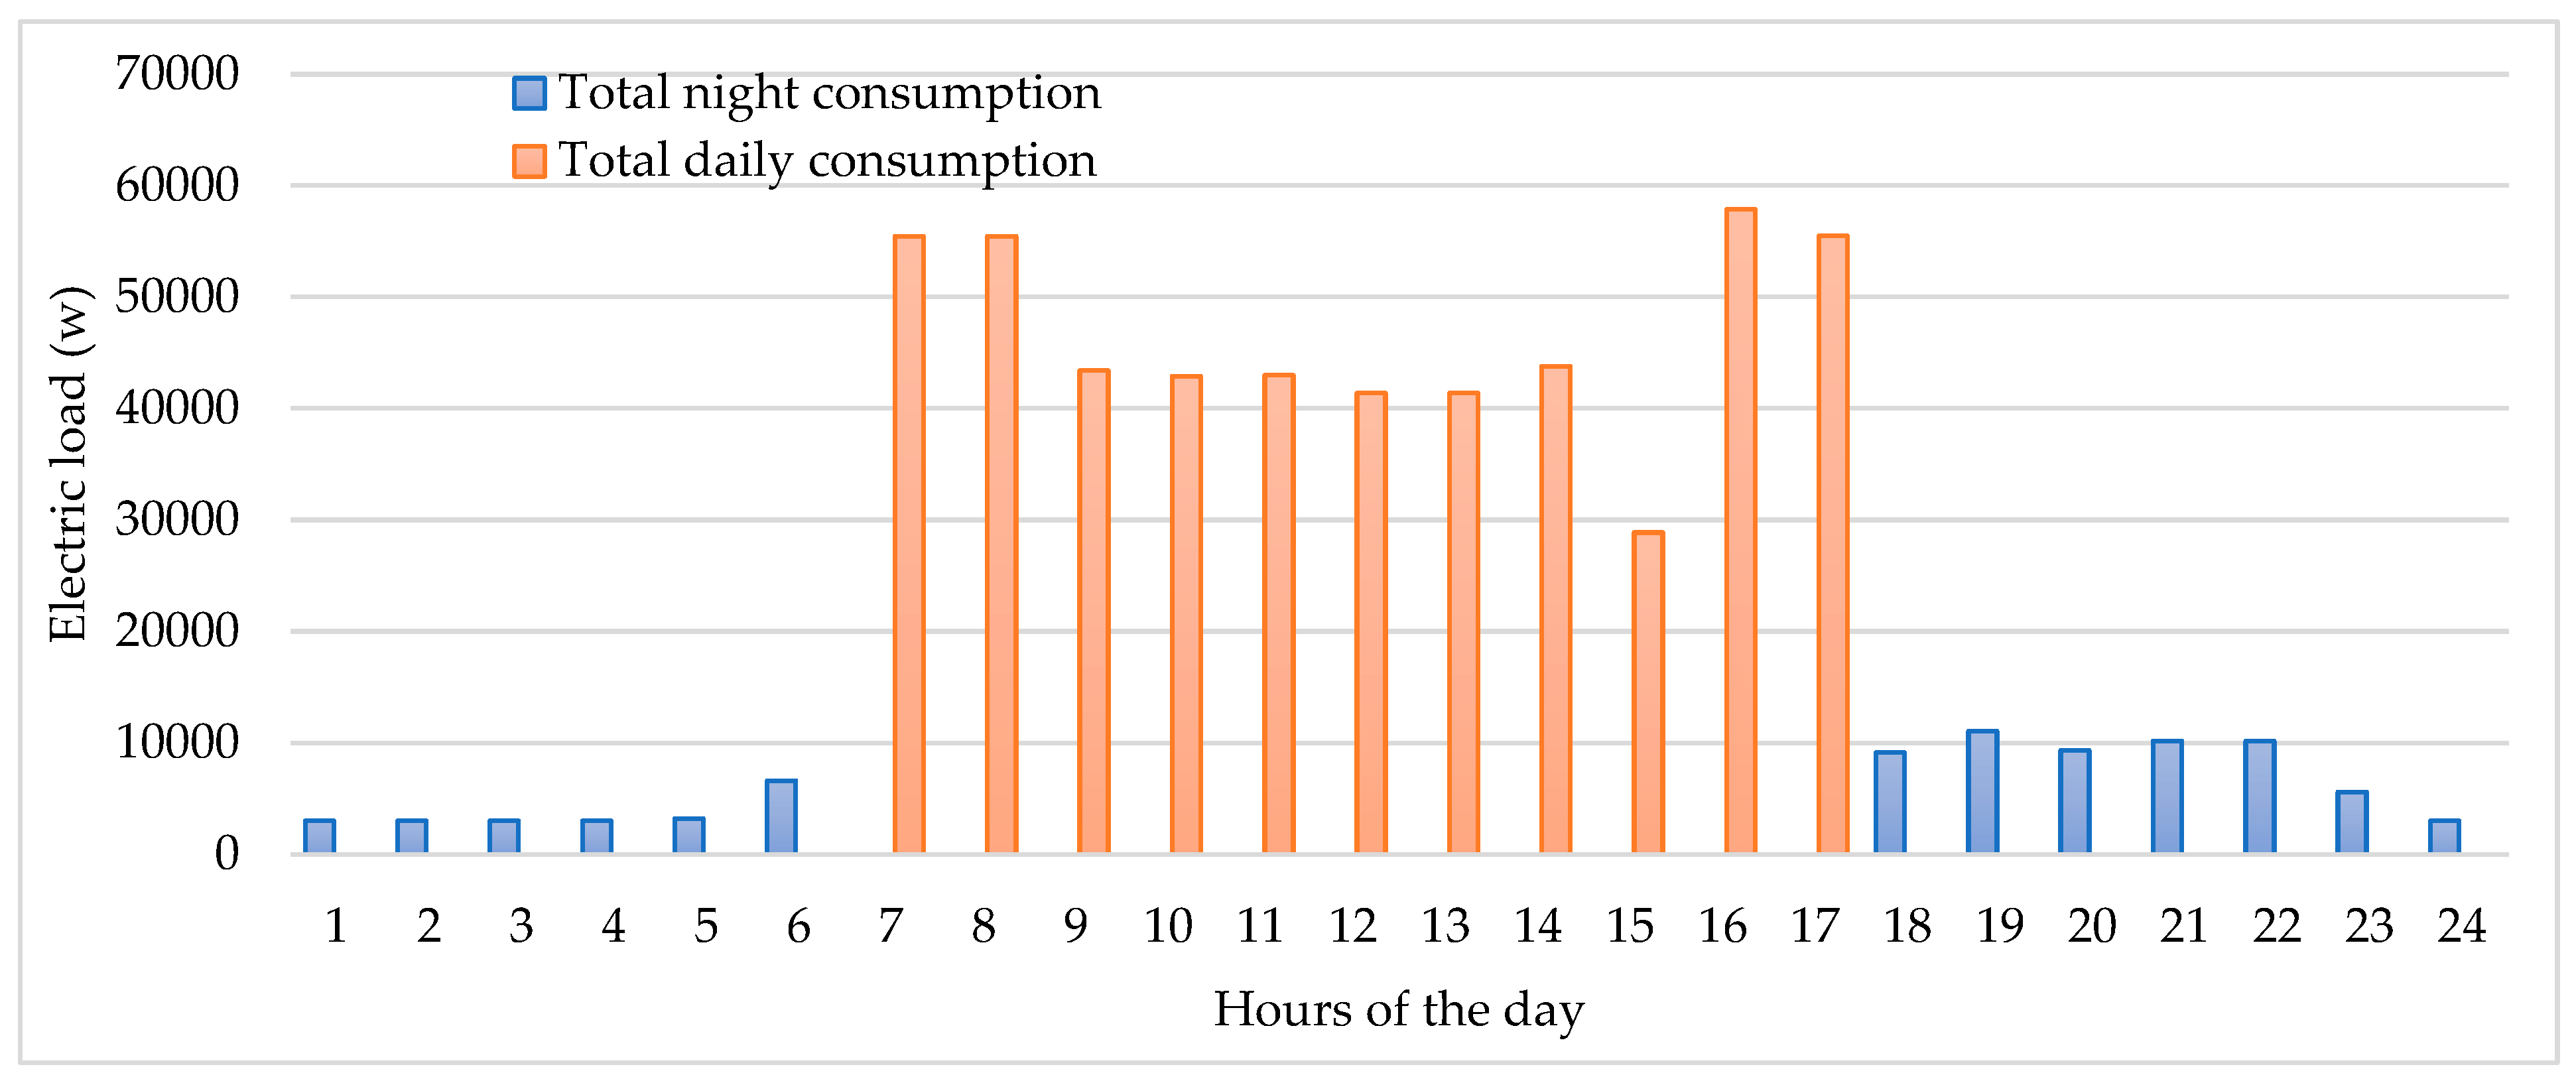
Figure 4.
Solar Domestic Hot Water (Thermosiphon tank) System.
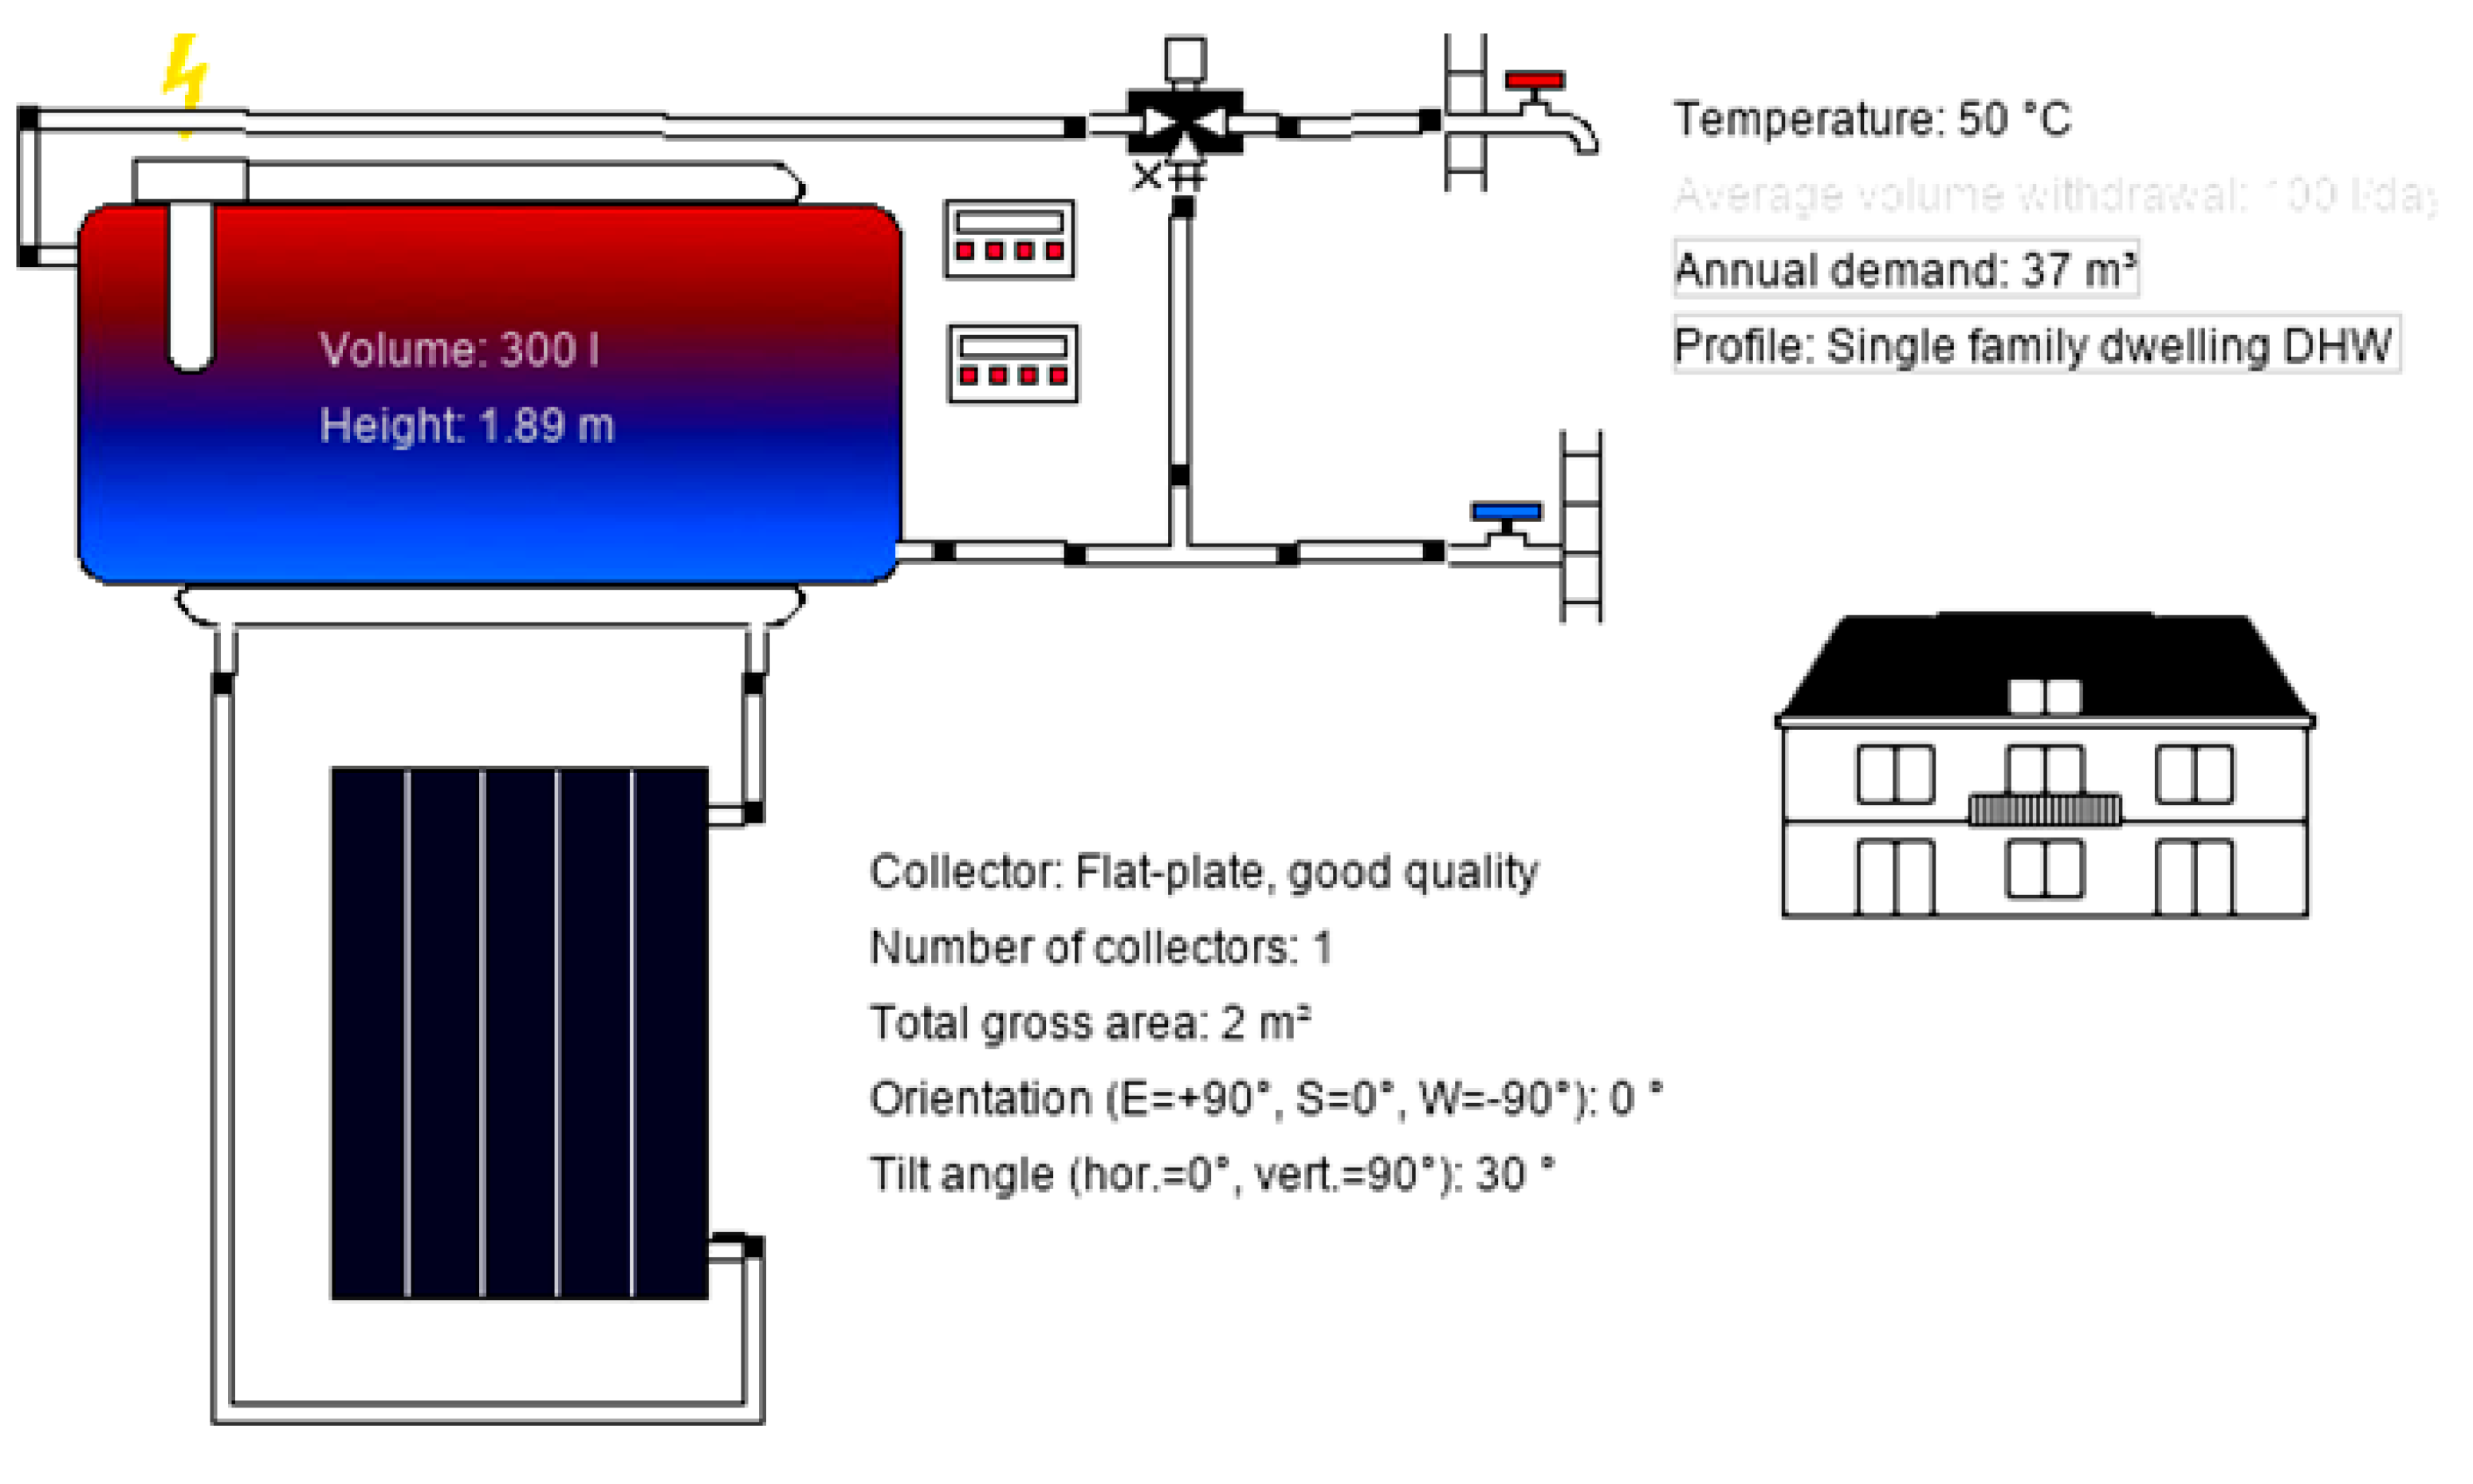
Figure 6.
Daily and Night Load Without Boiler.
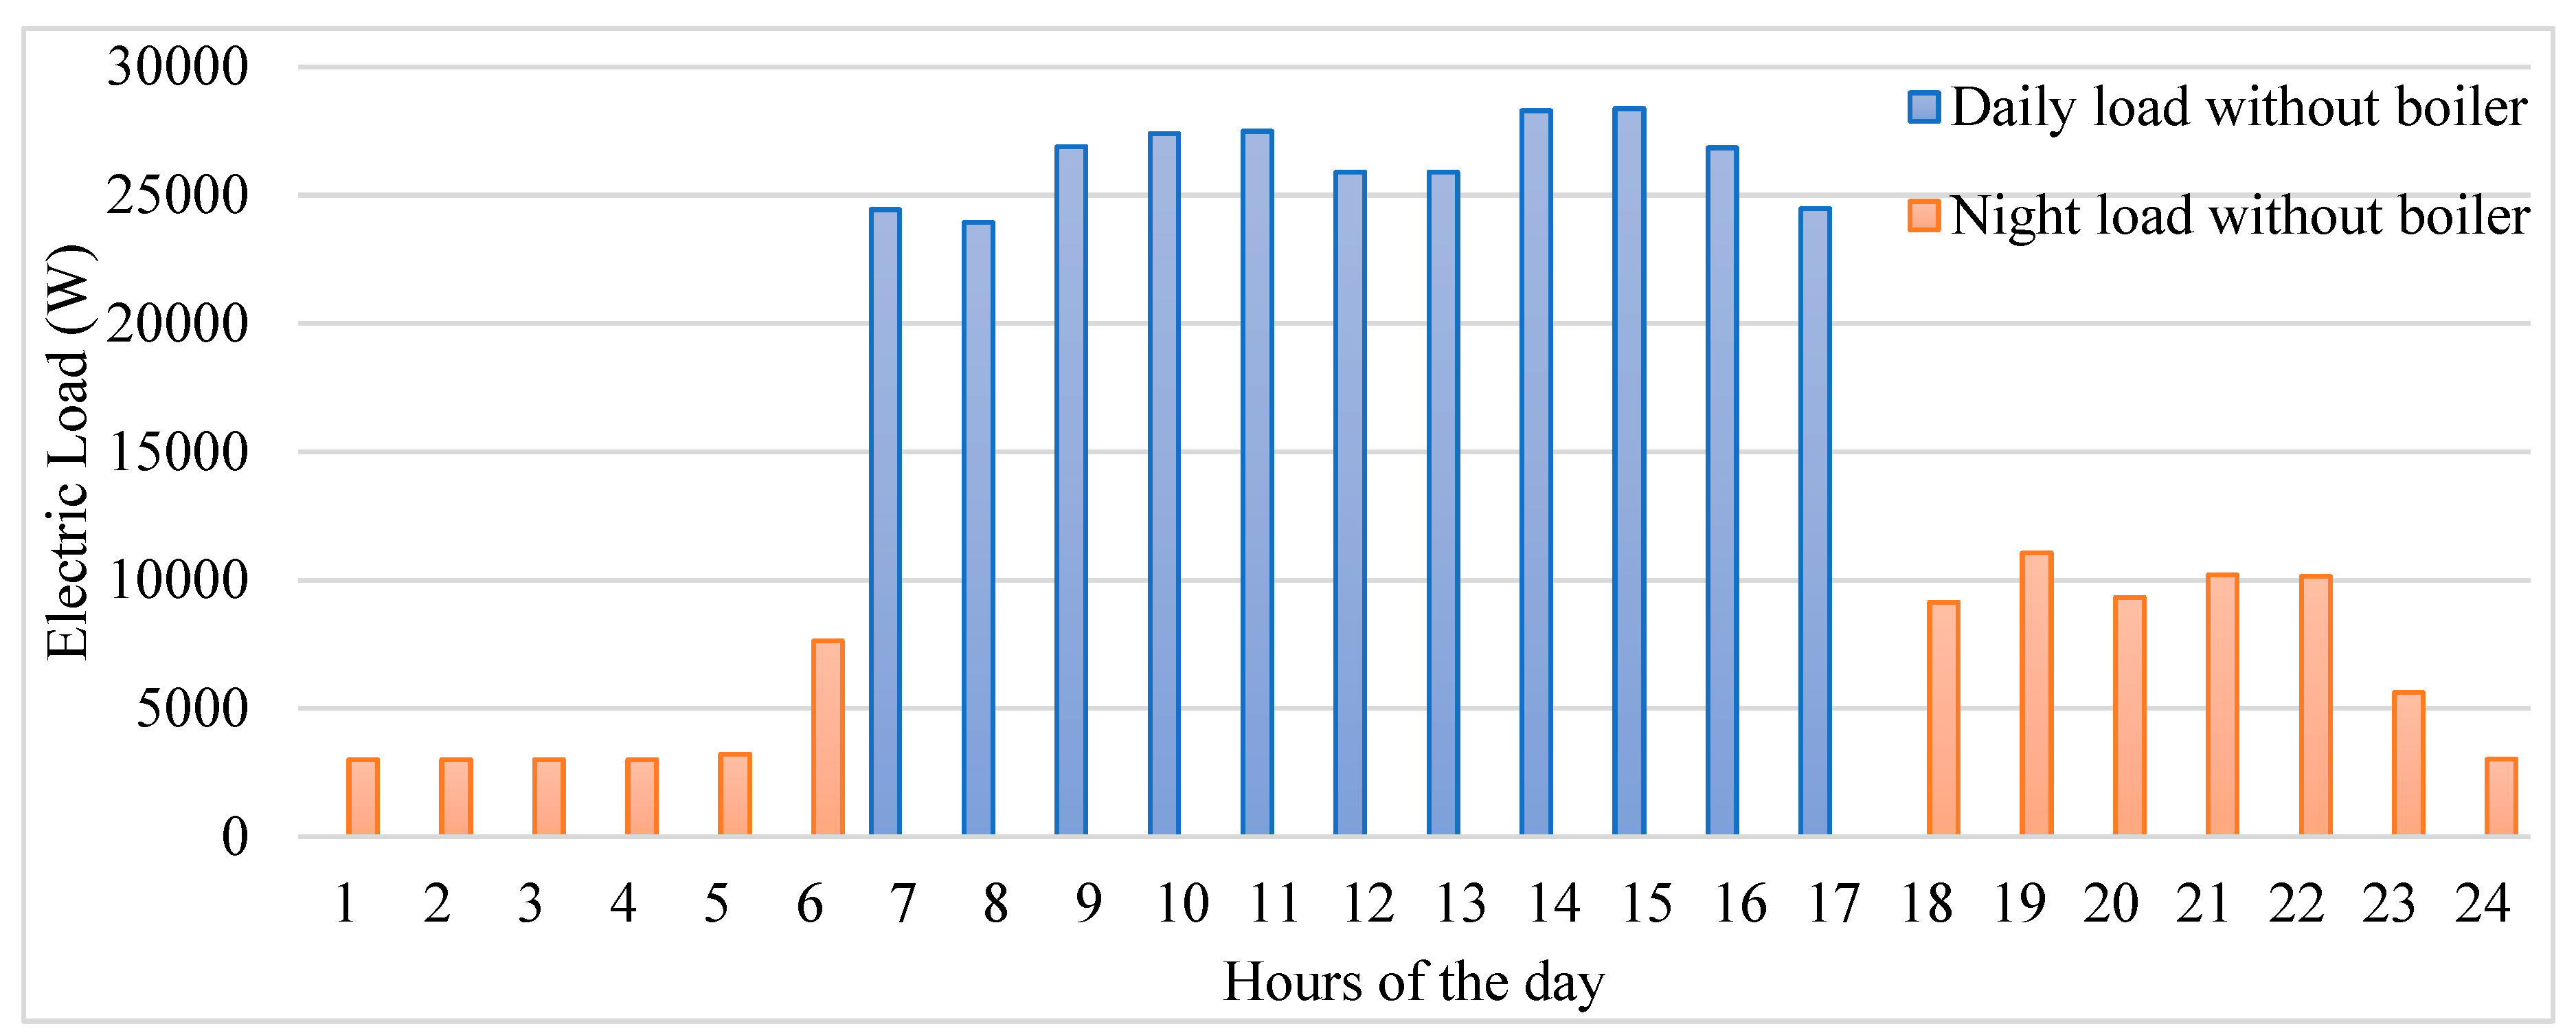
Figure 7.
Inlet and outlet temperature of water.
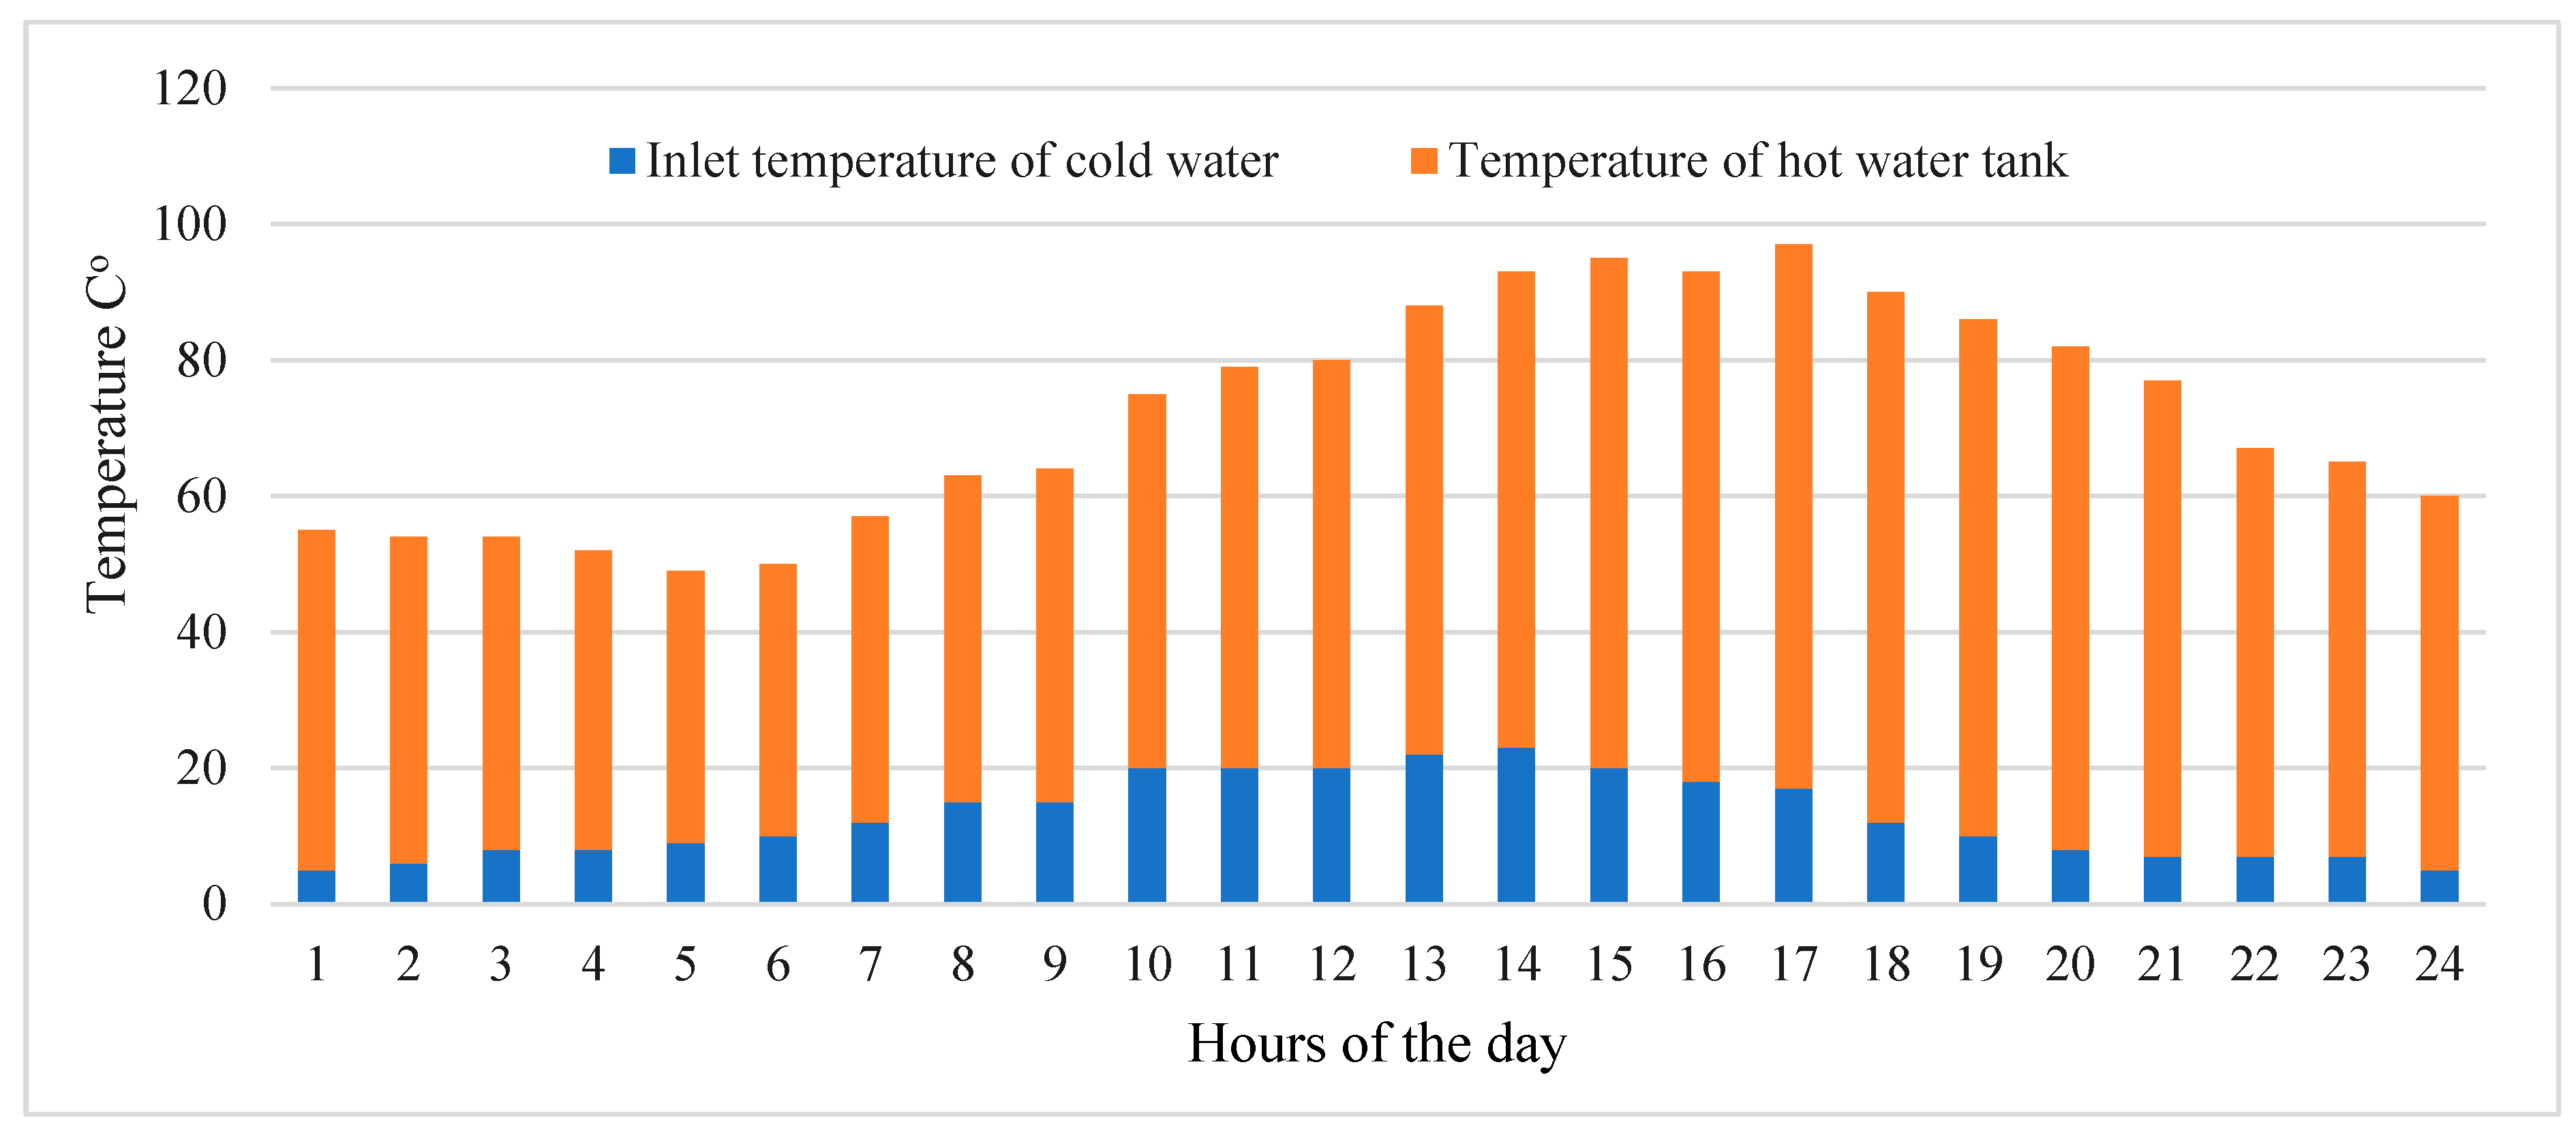
Figure 8.
Solar radiation kWh/m2.
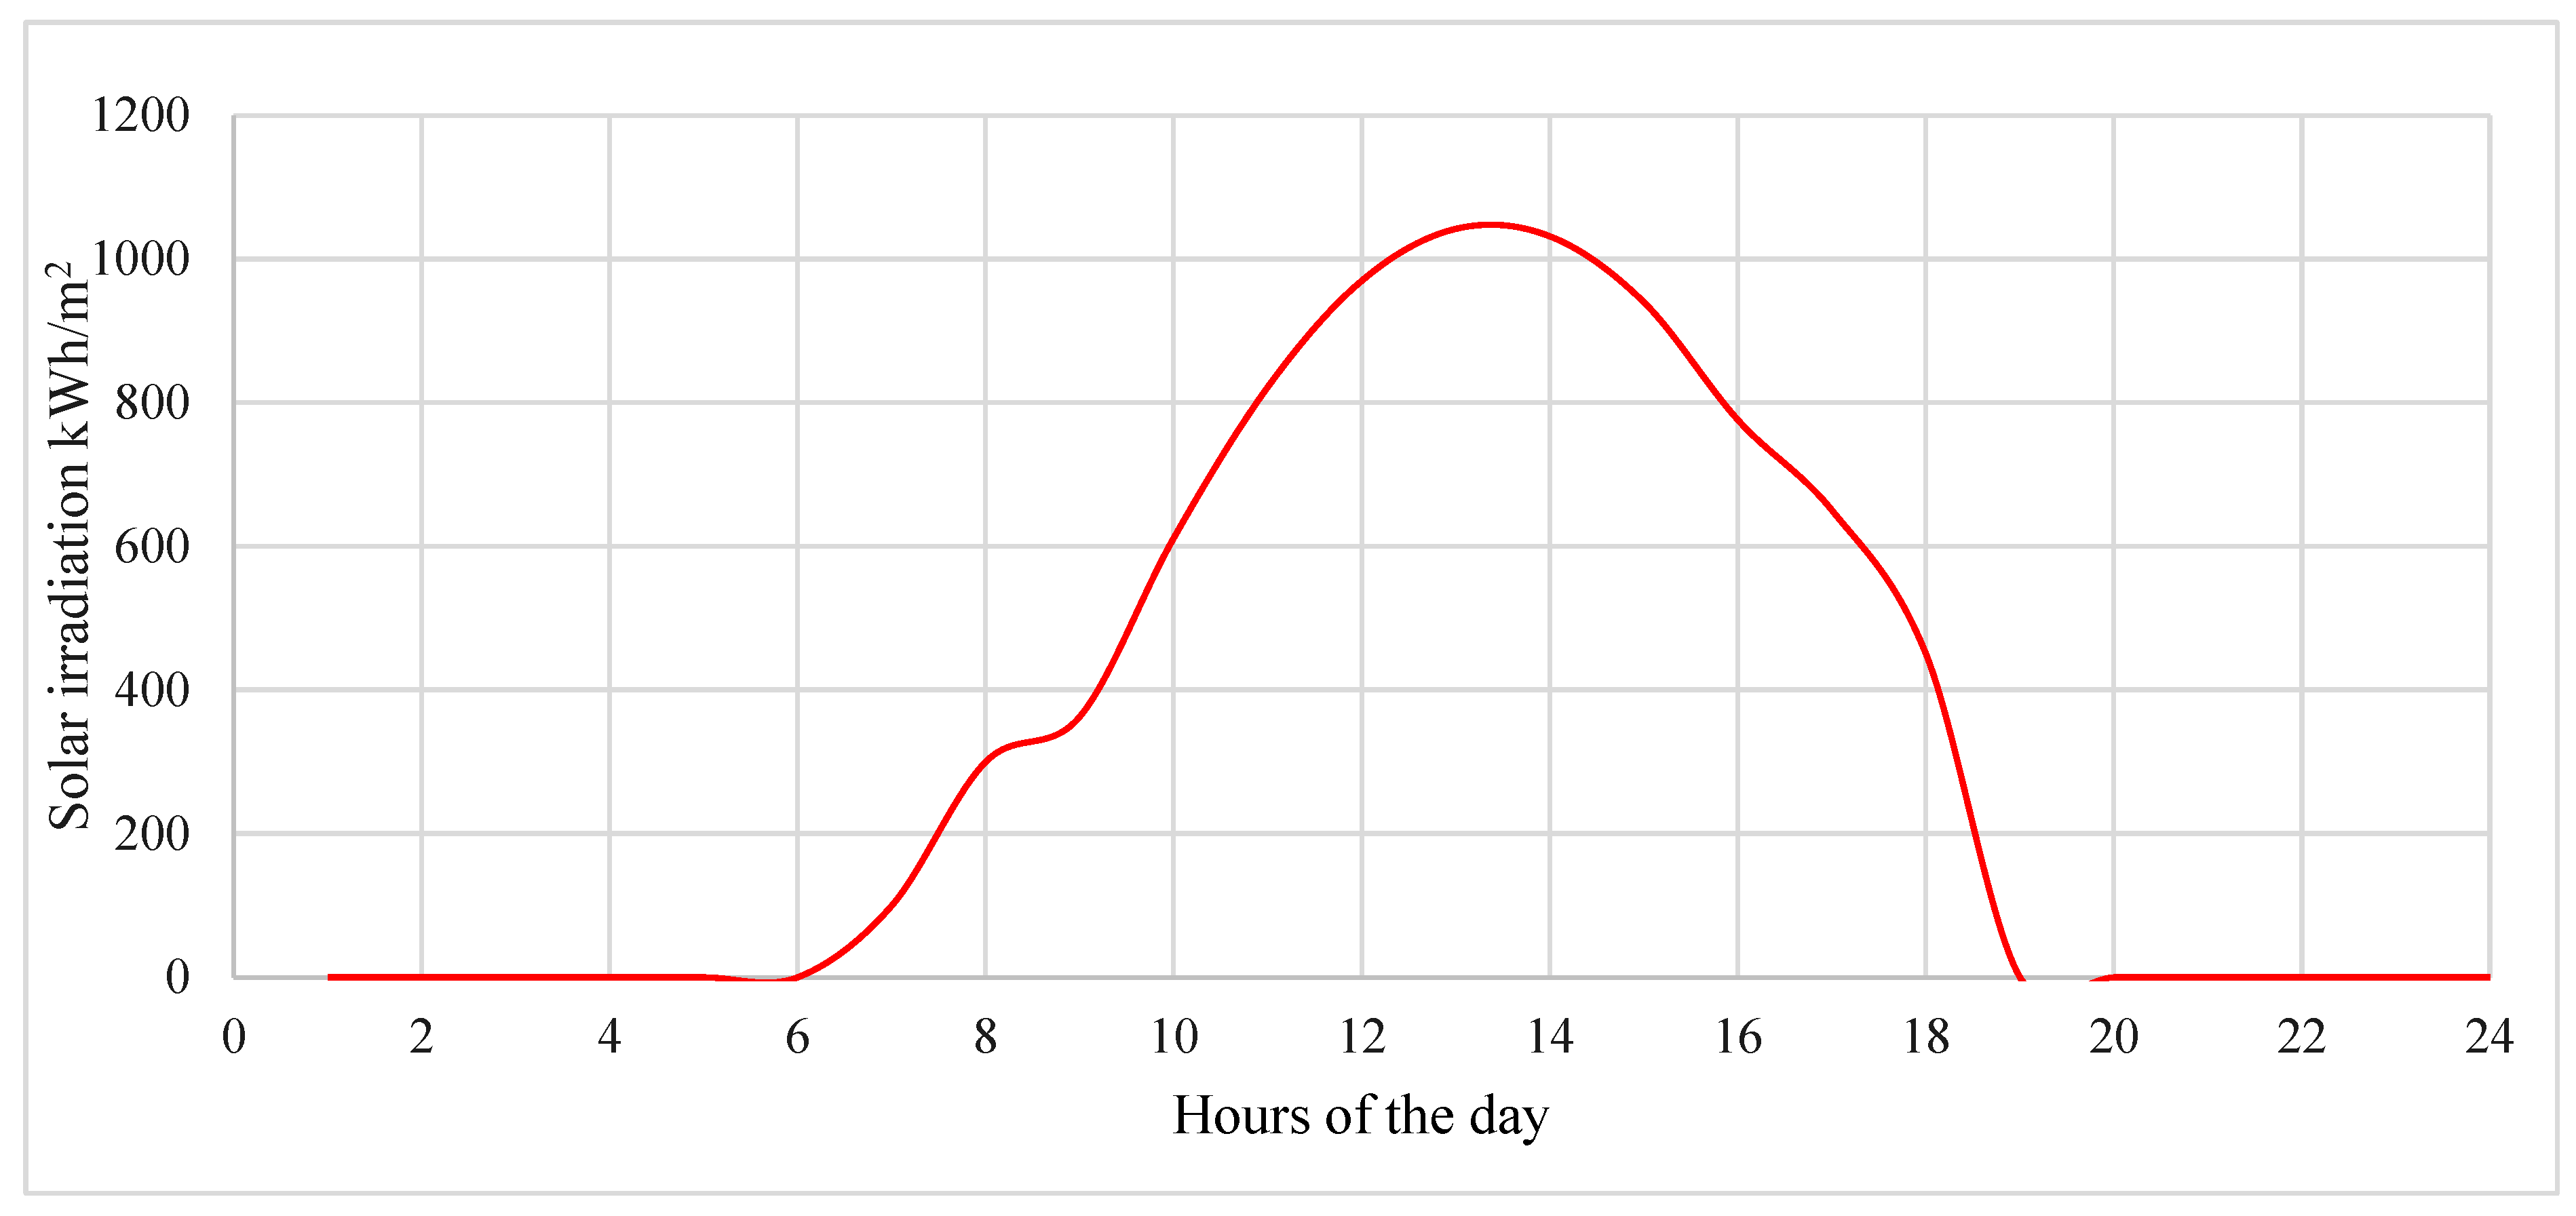
Figure 9.
State of battery charge.
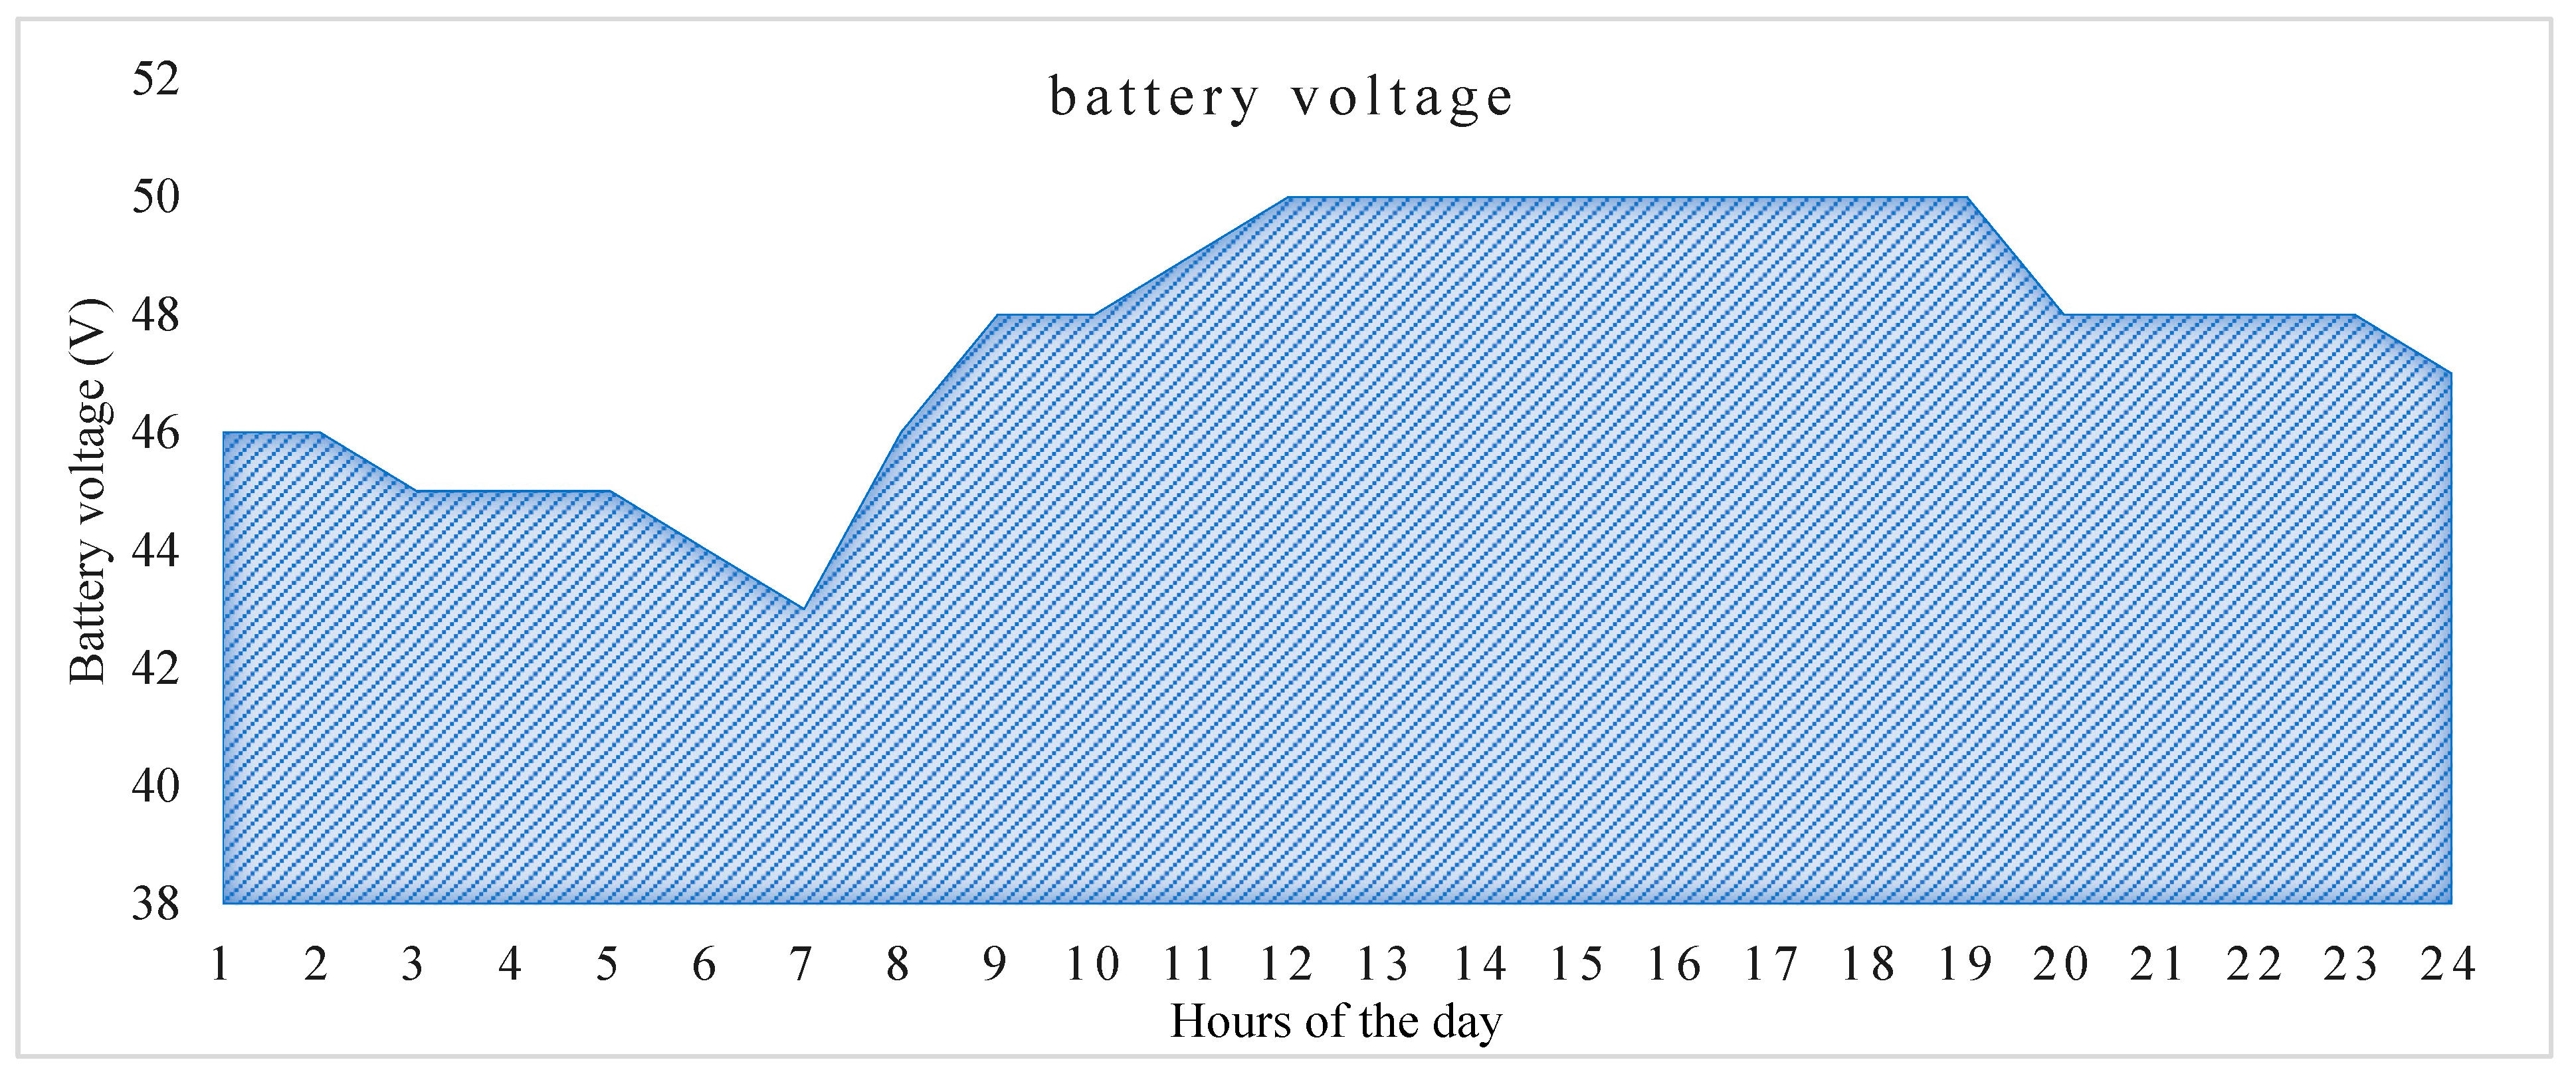
Figure 10.
Comparisons analysis between energy consumption.
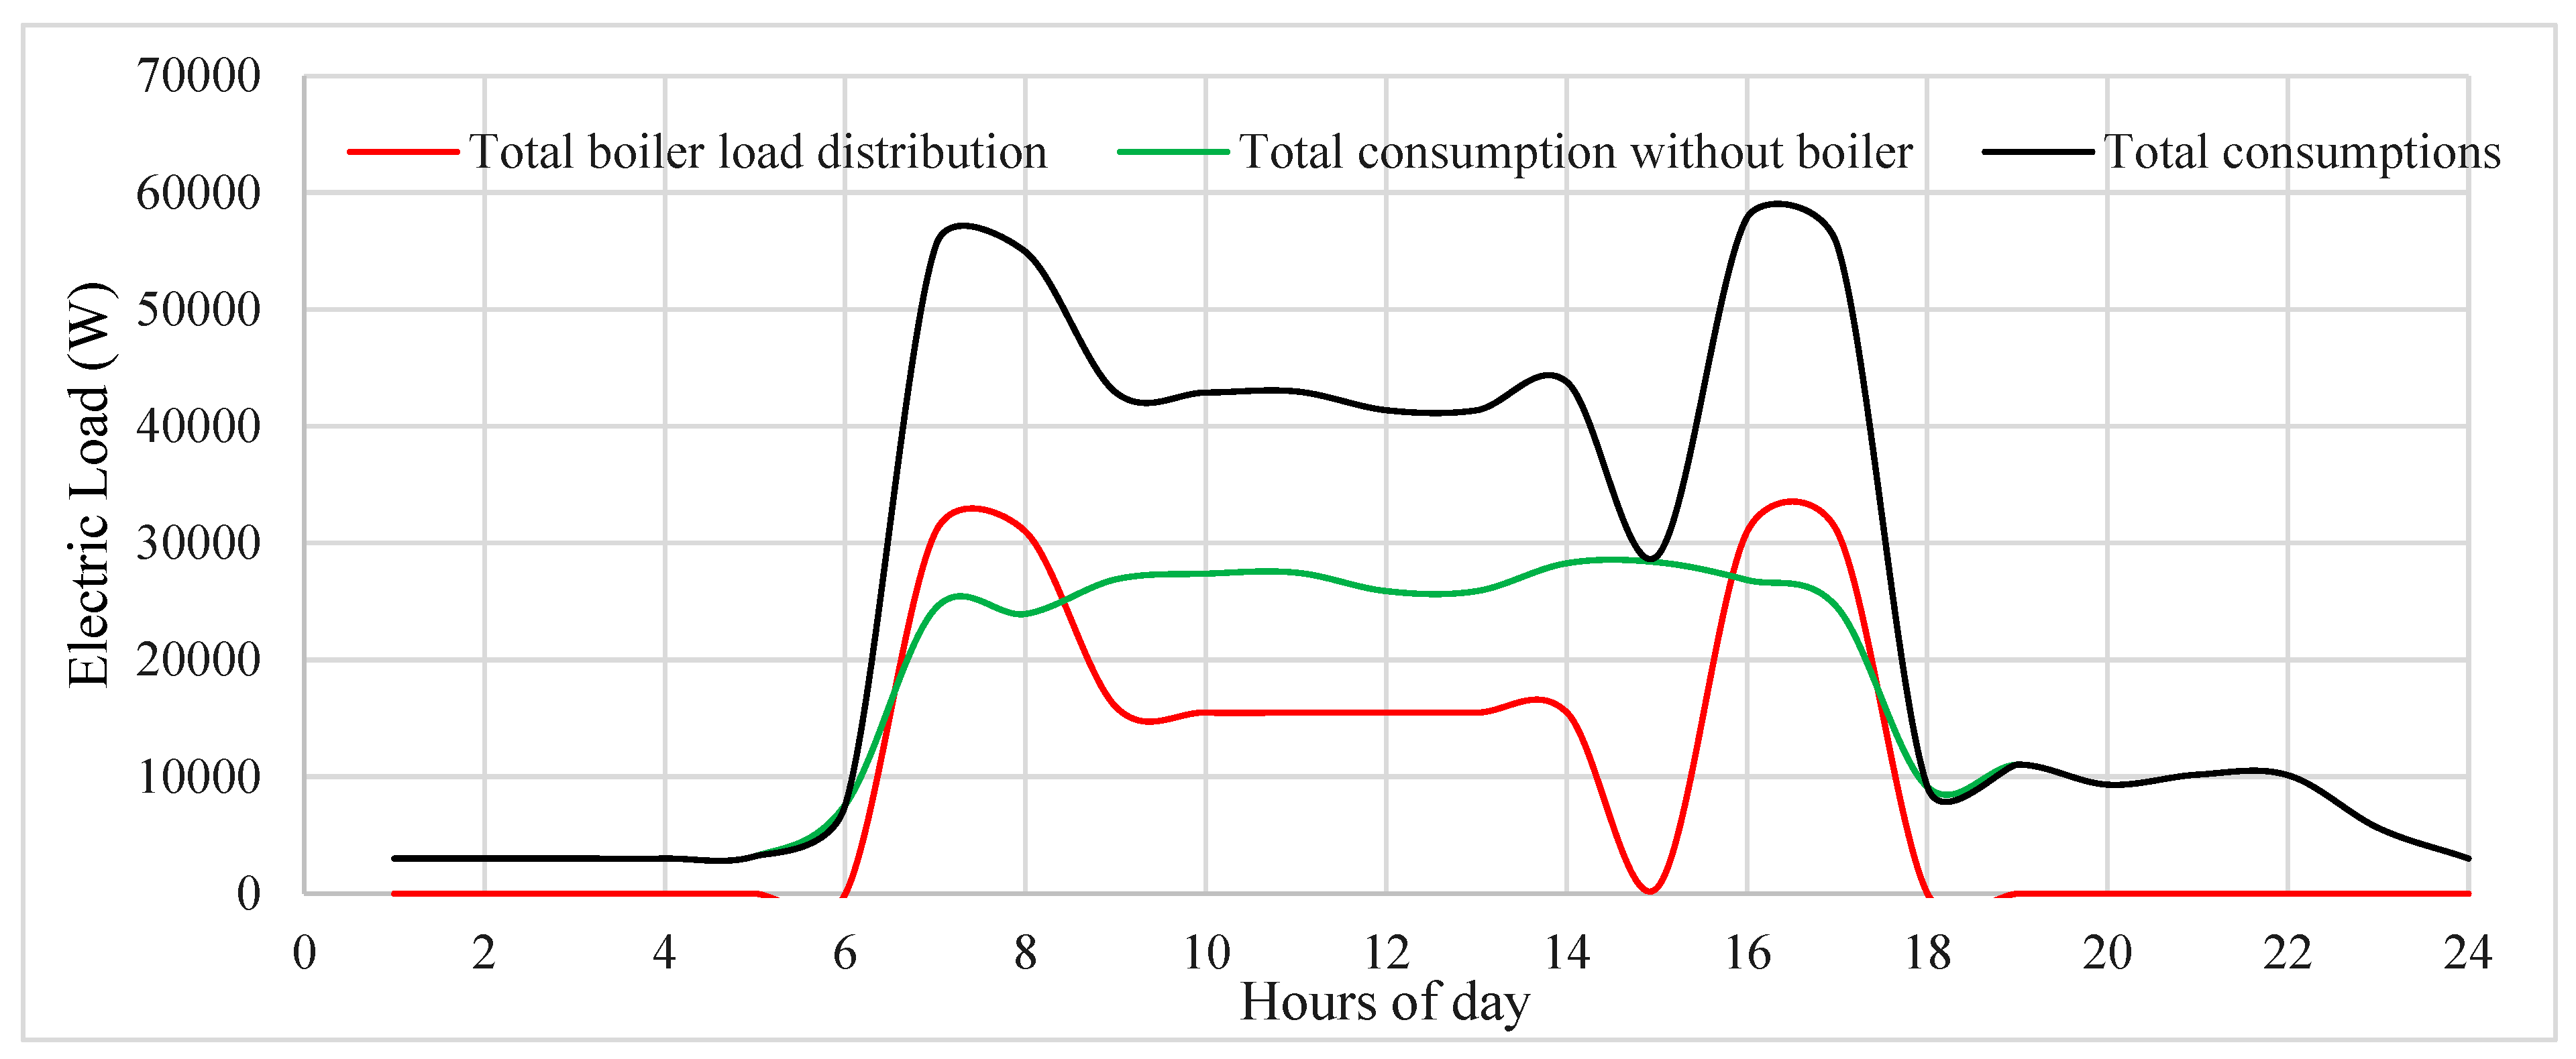
Figure 11.
Comparisons analysis between energy generation.
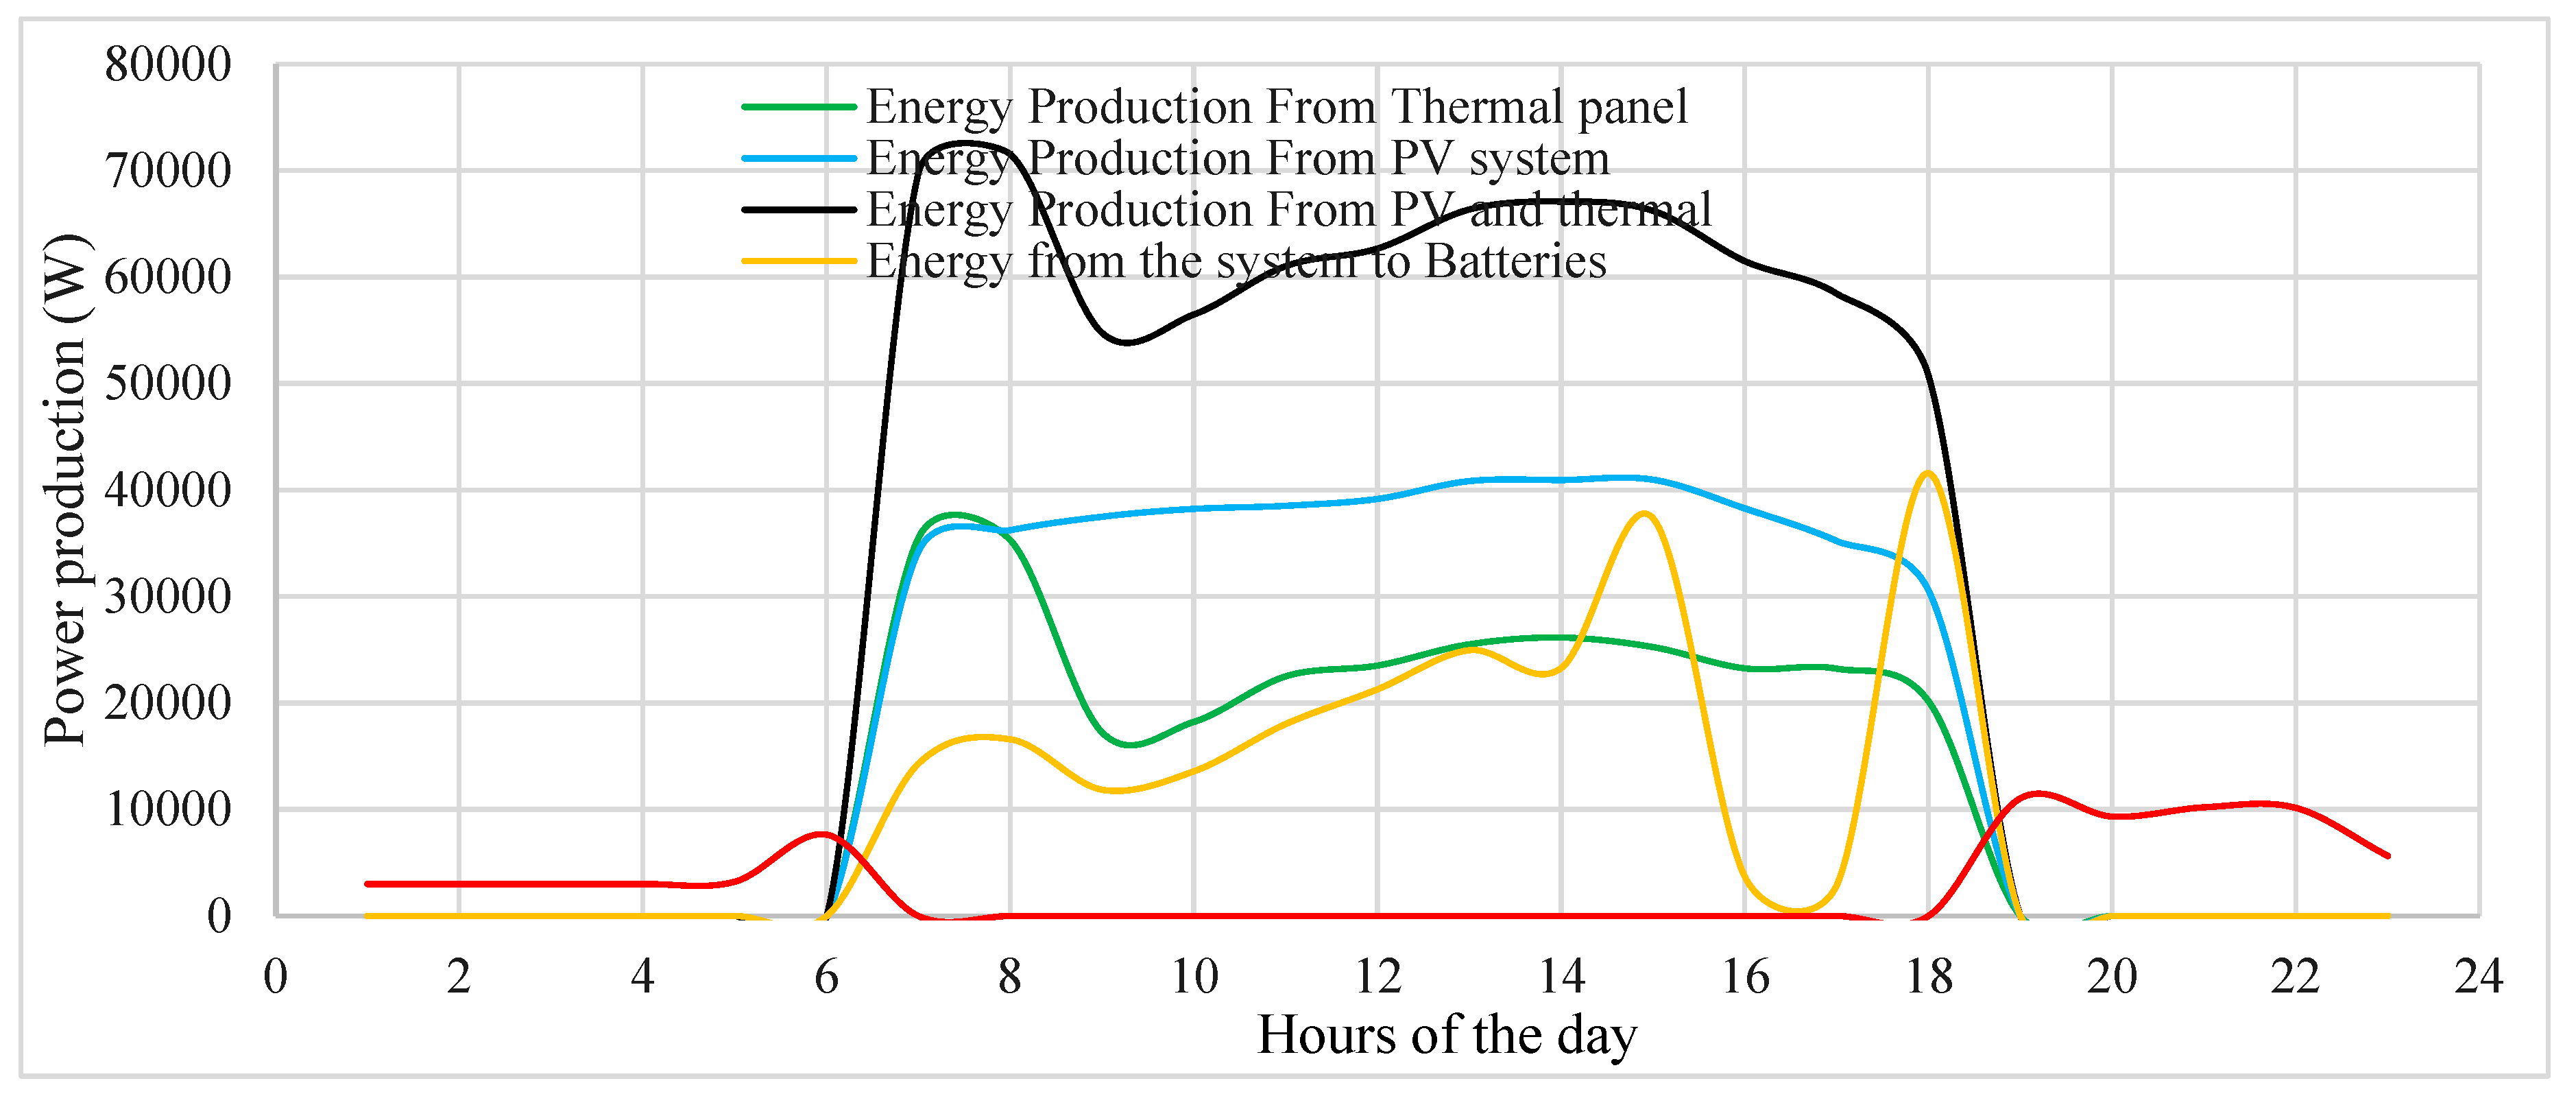
Figure 12.
Comparisons analysis between energy consumption and generation,.
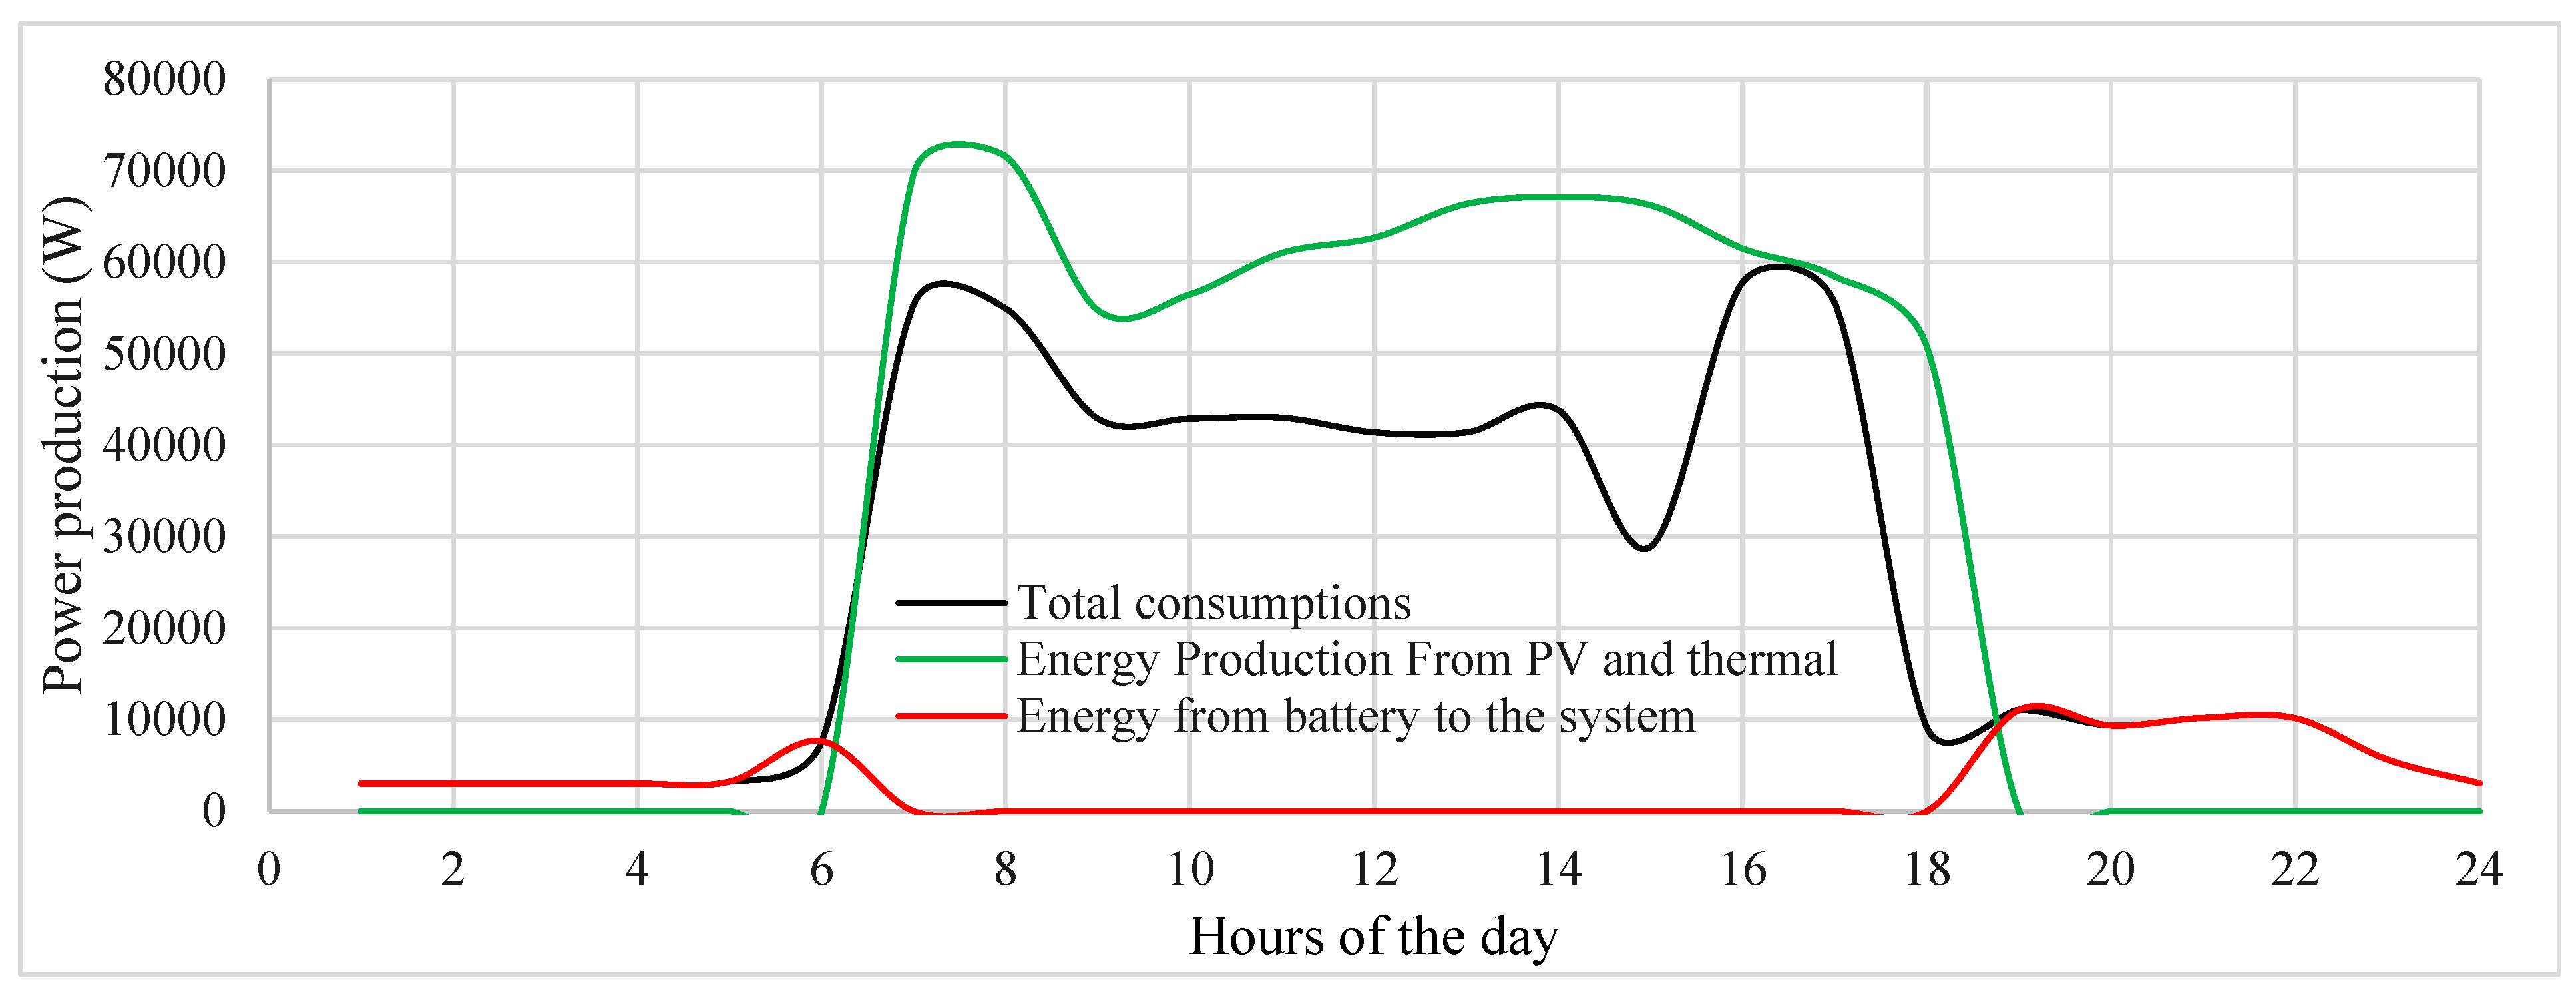
Figure 13.
Non-pressurized Solar Panel.
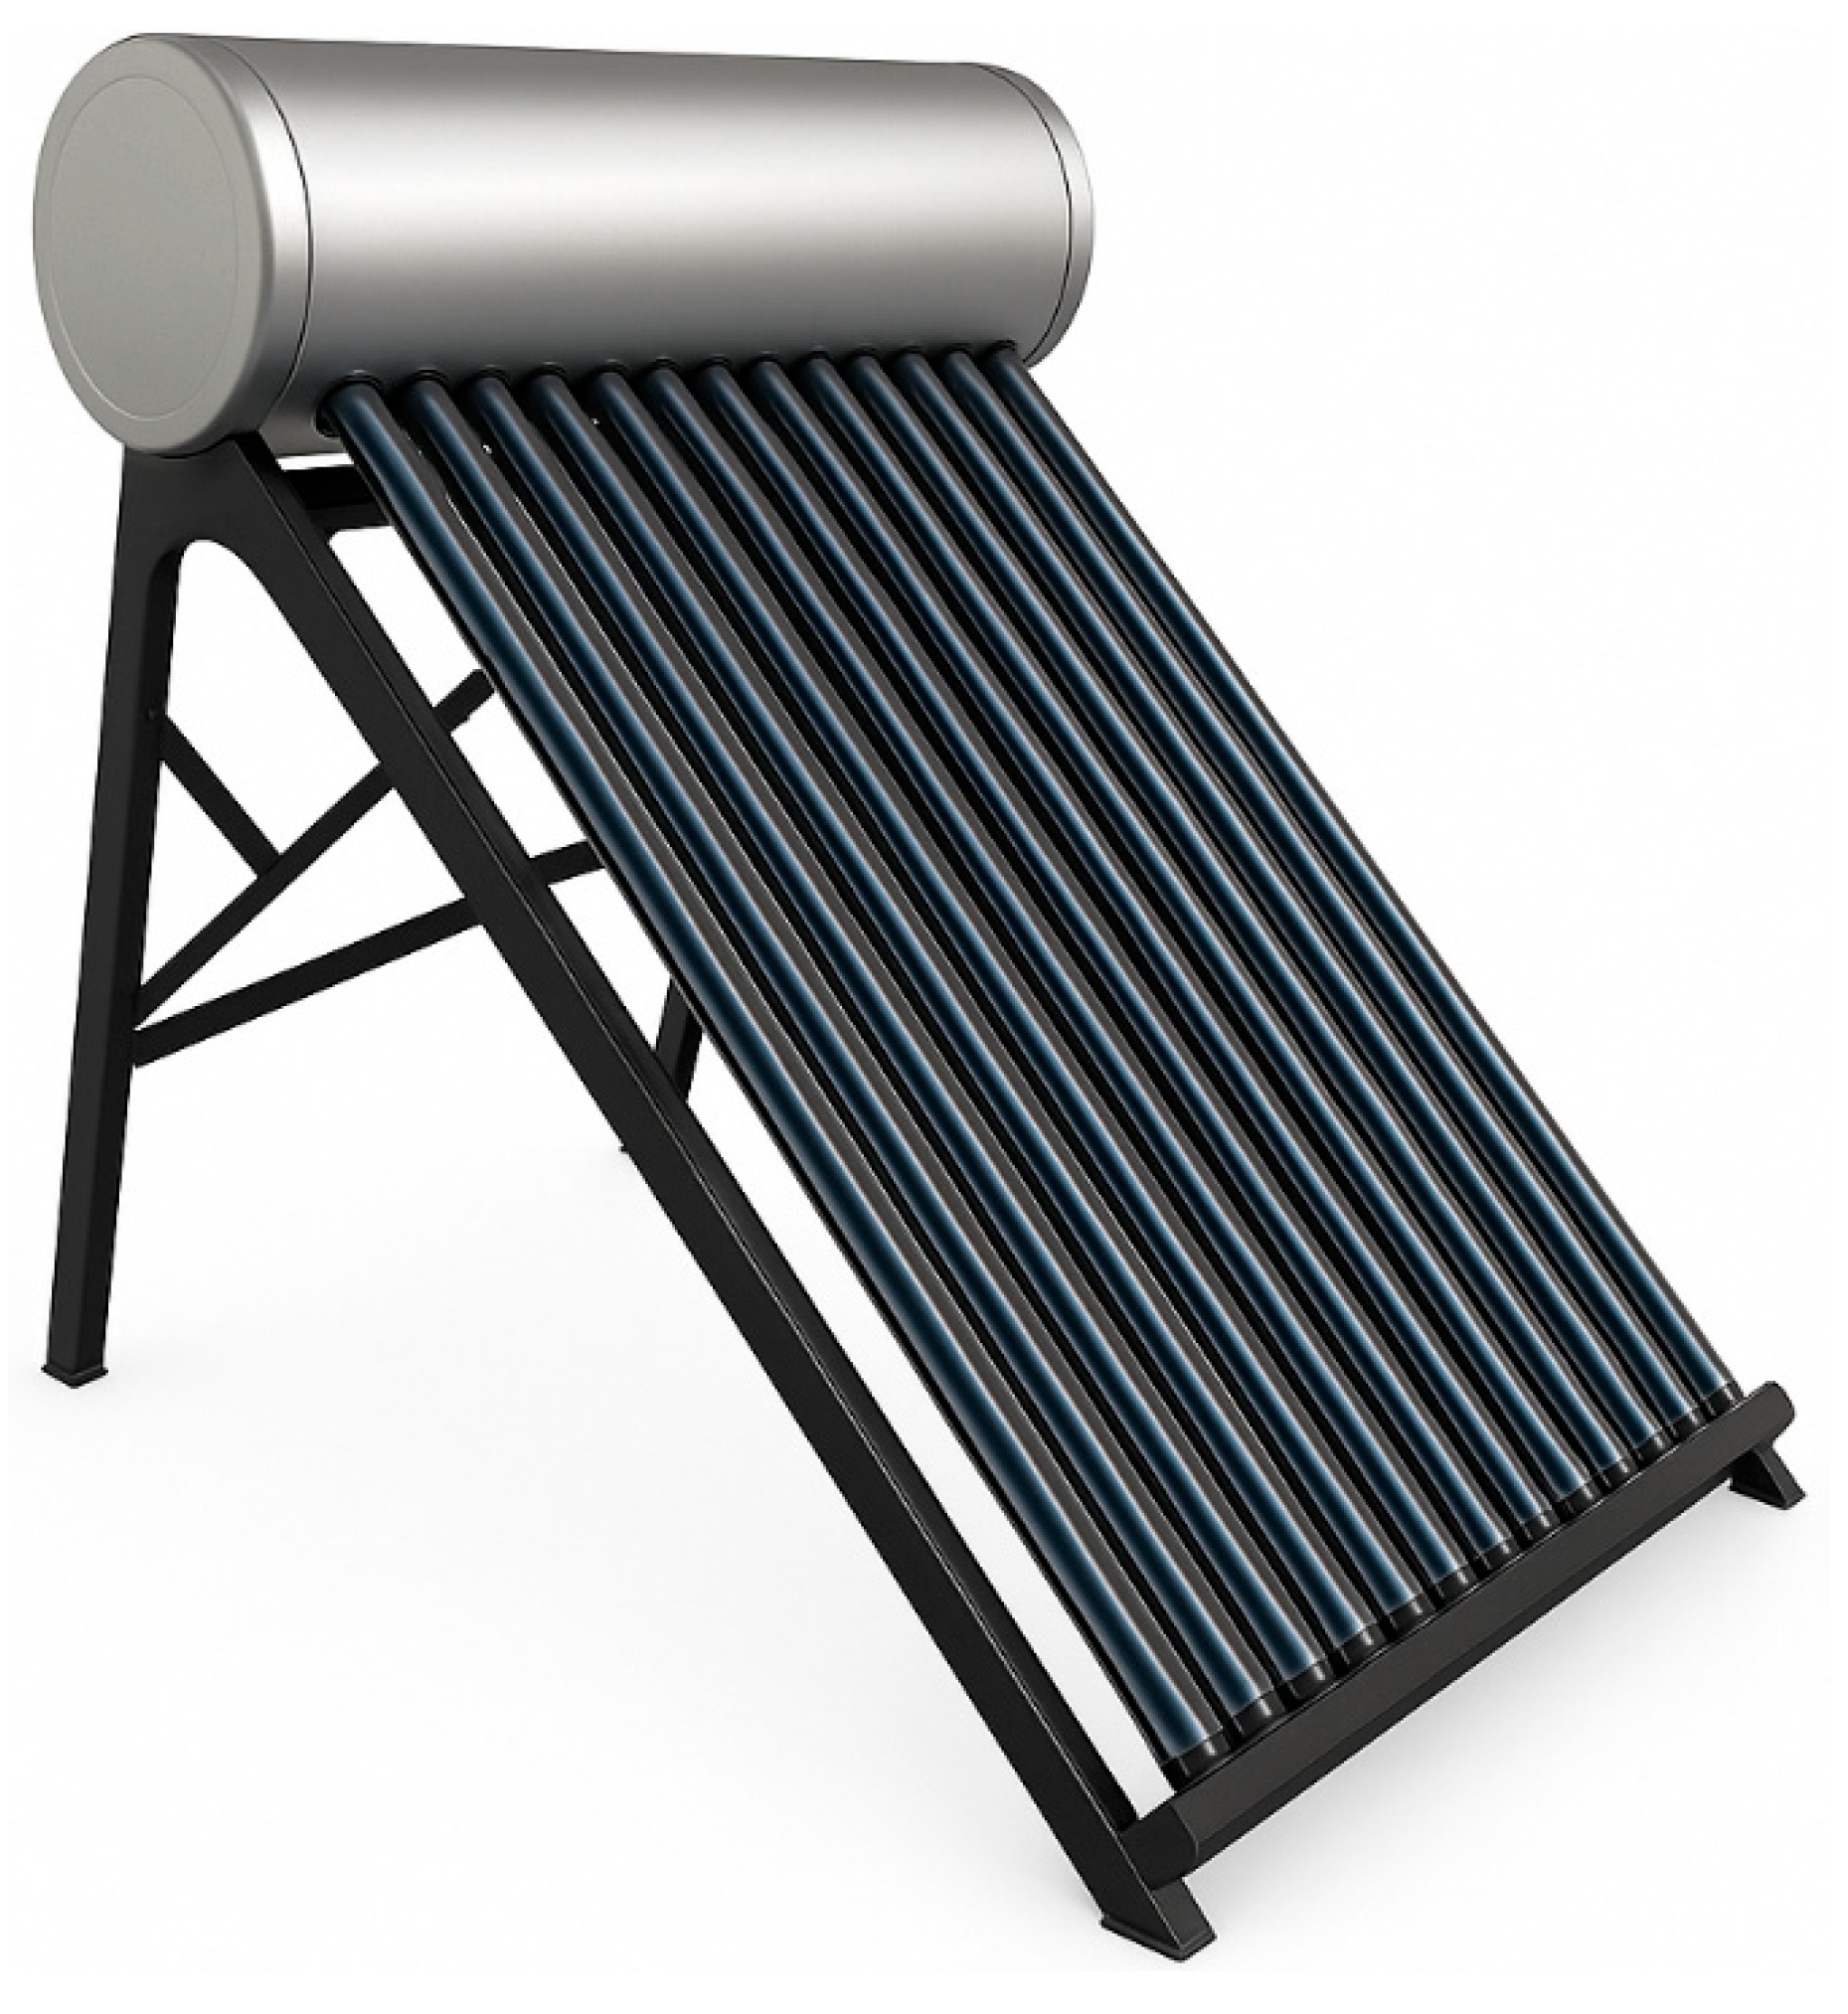
Figure 14.
PVT Module CPVT60P250 Design.
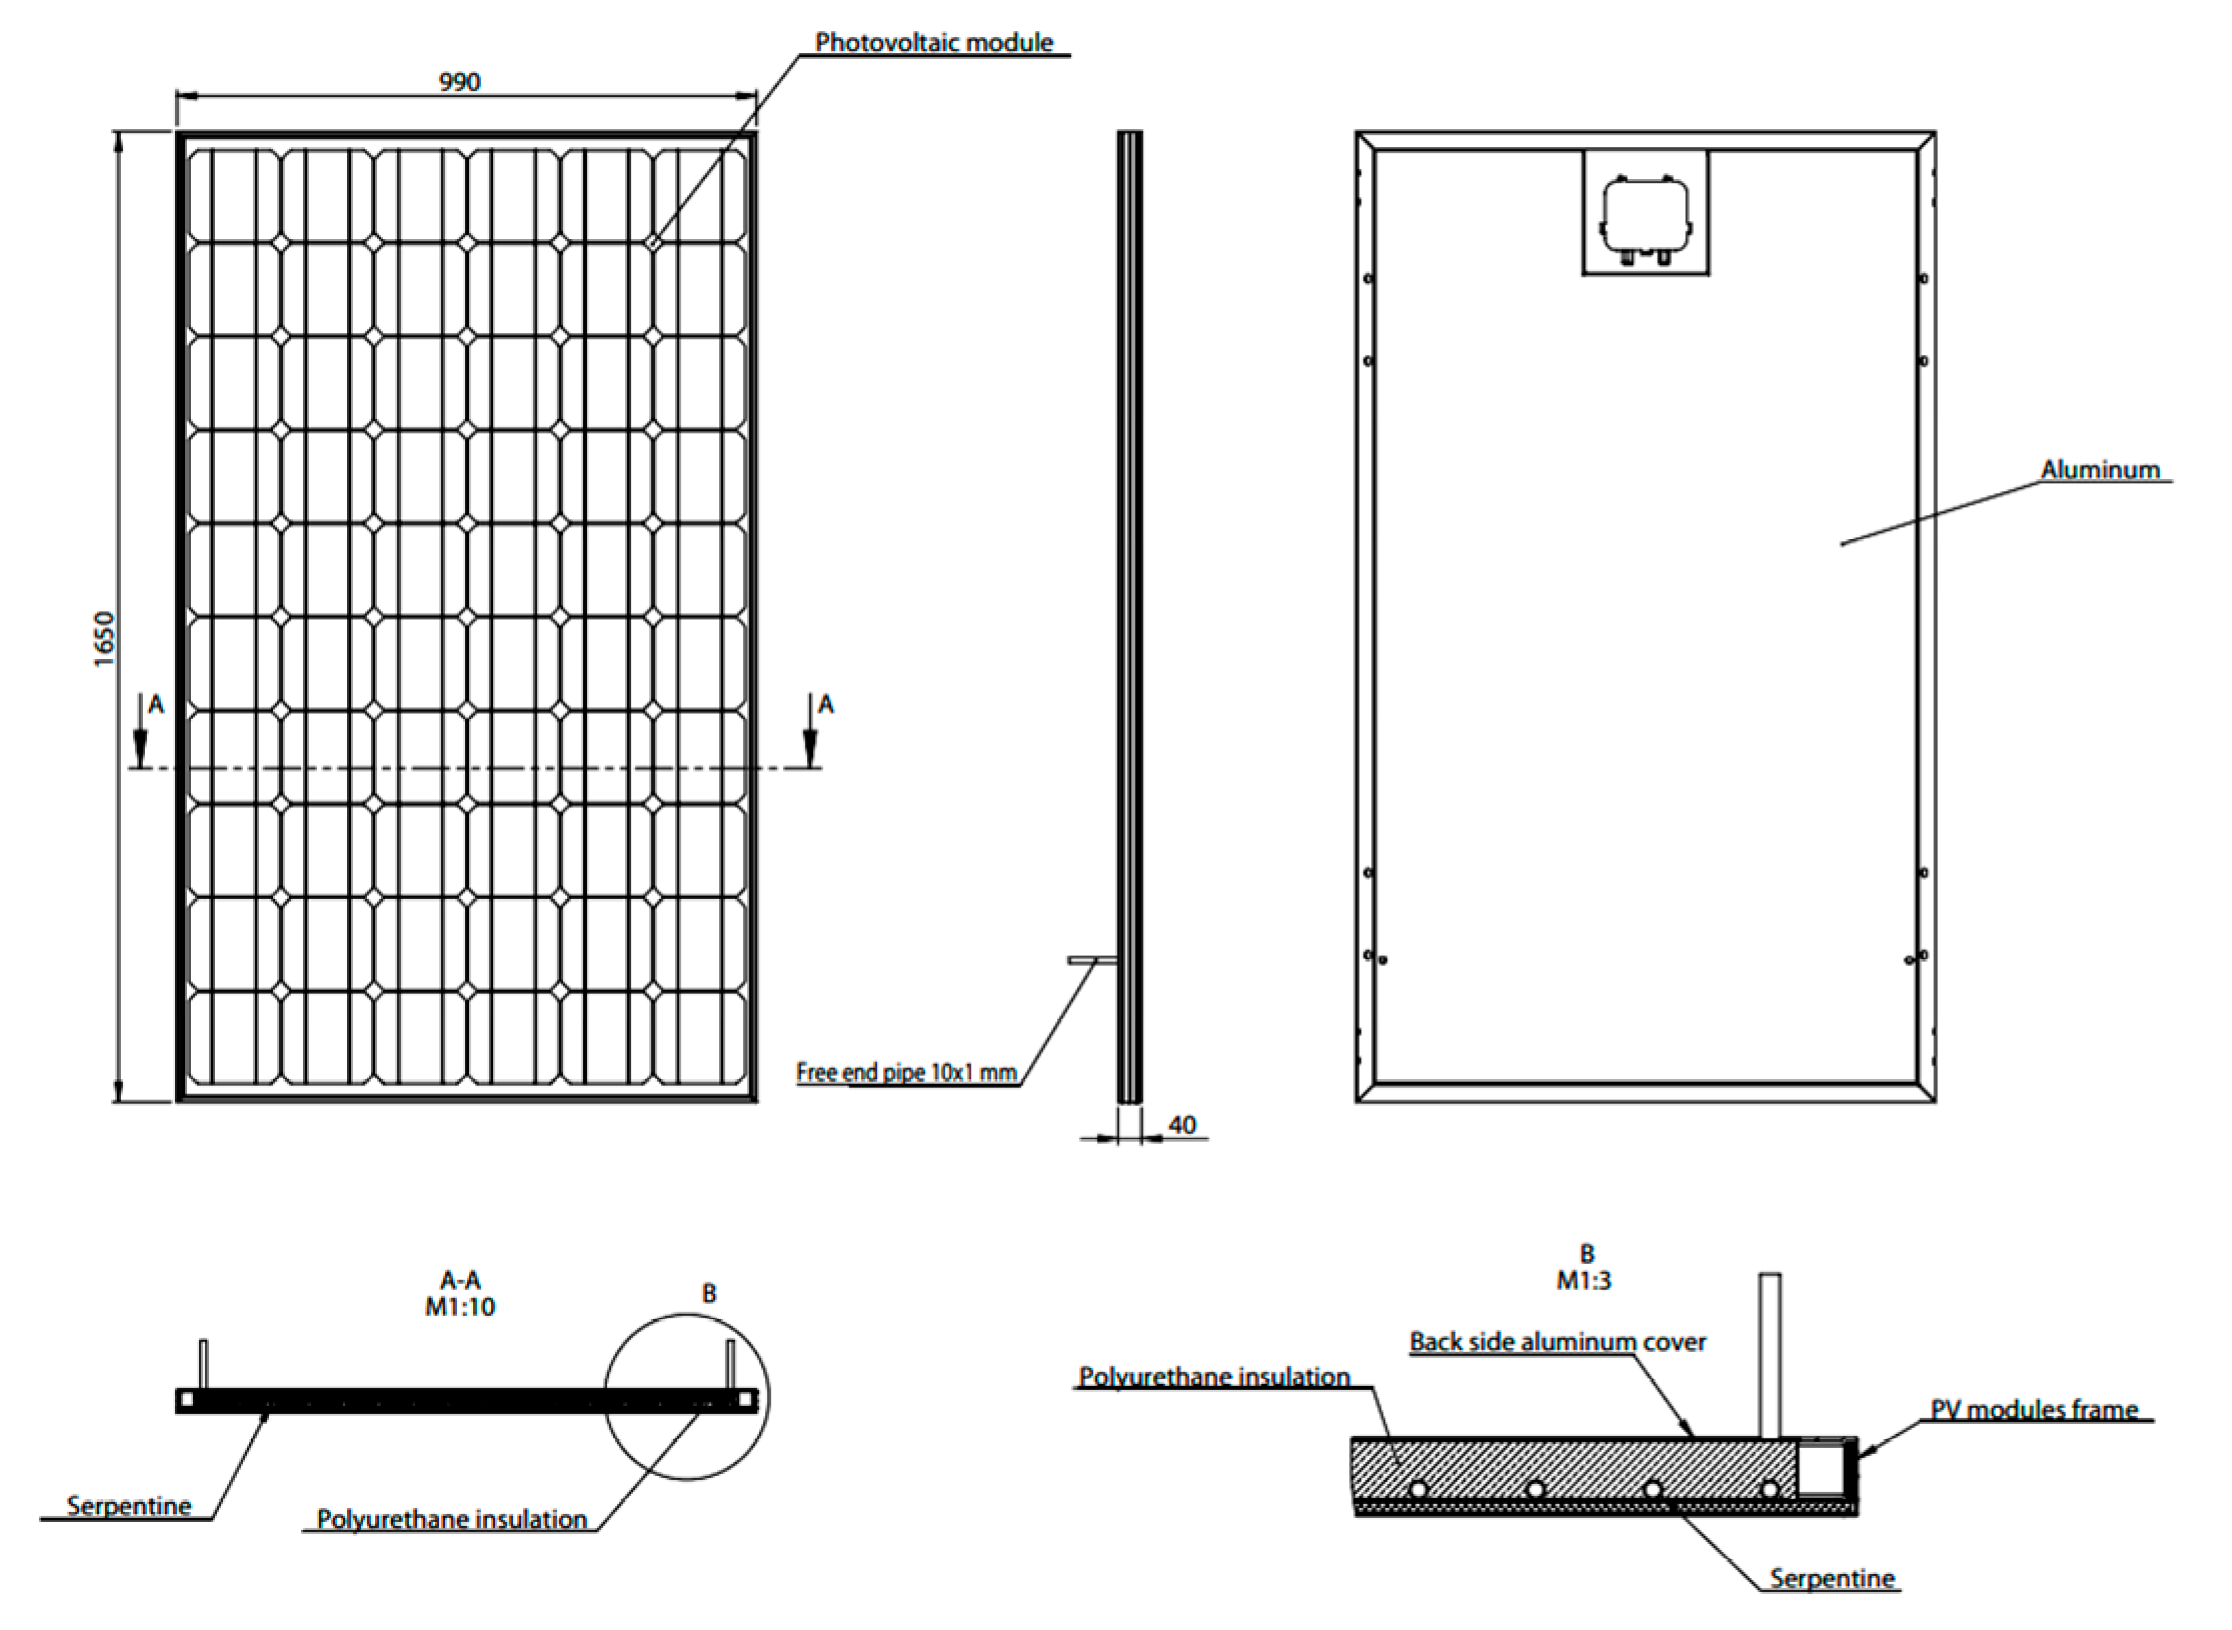
Figure 15.
Inlet and outlet temperature of water.
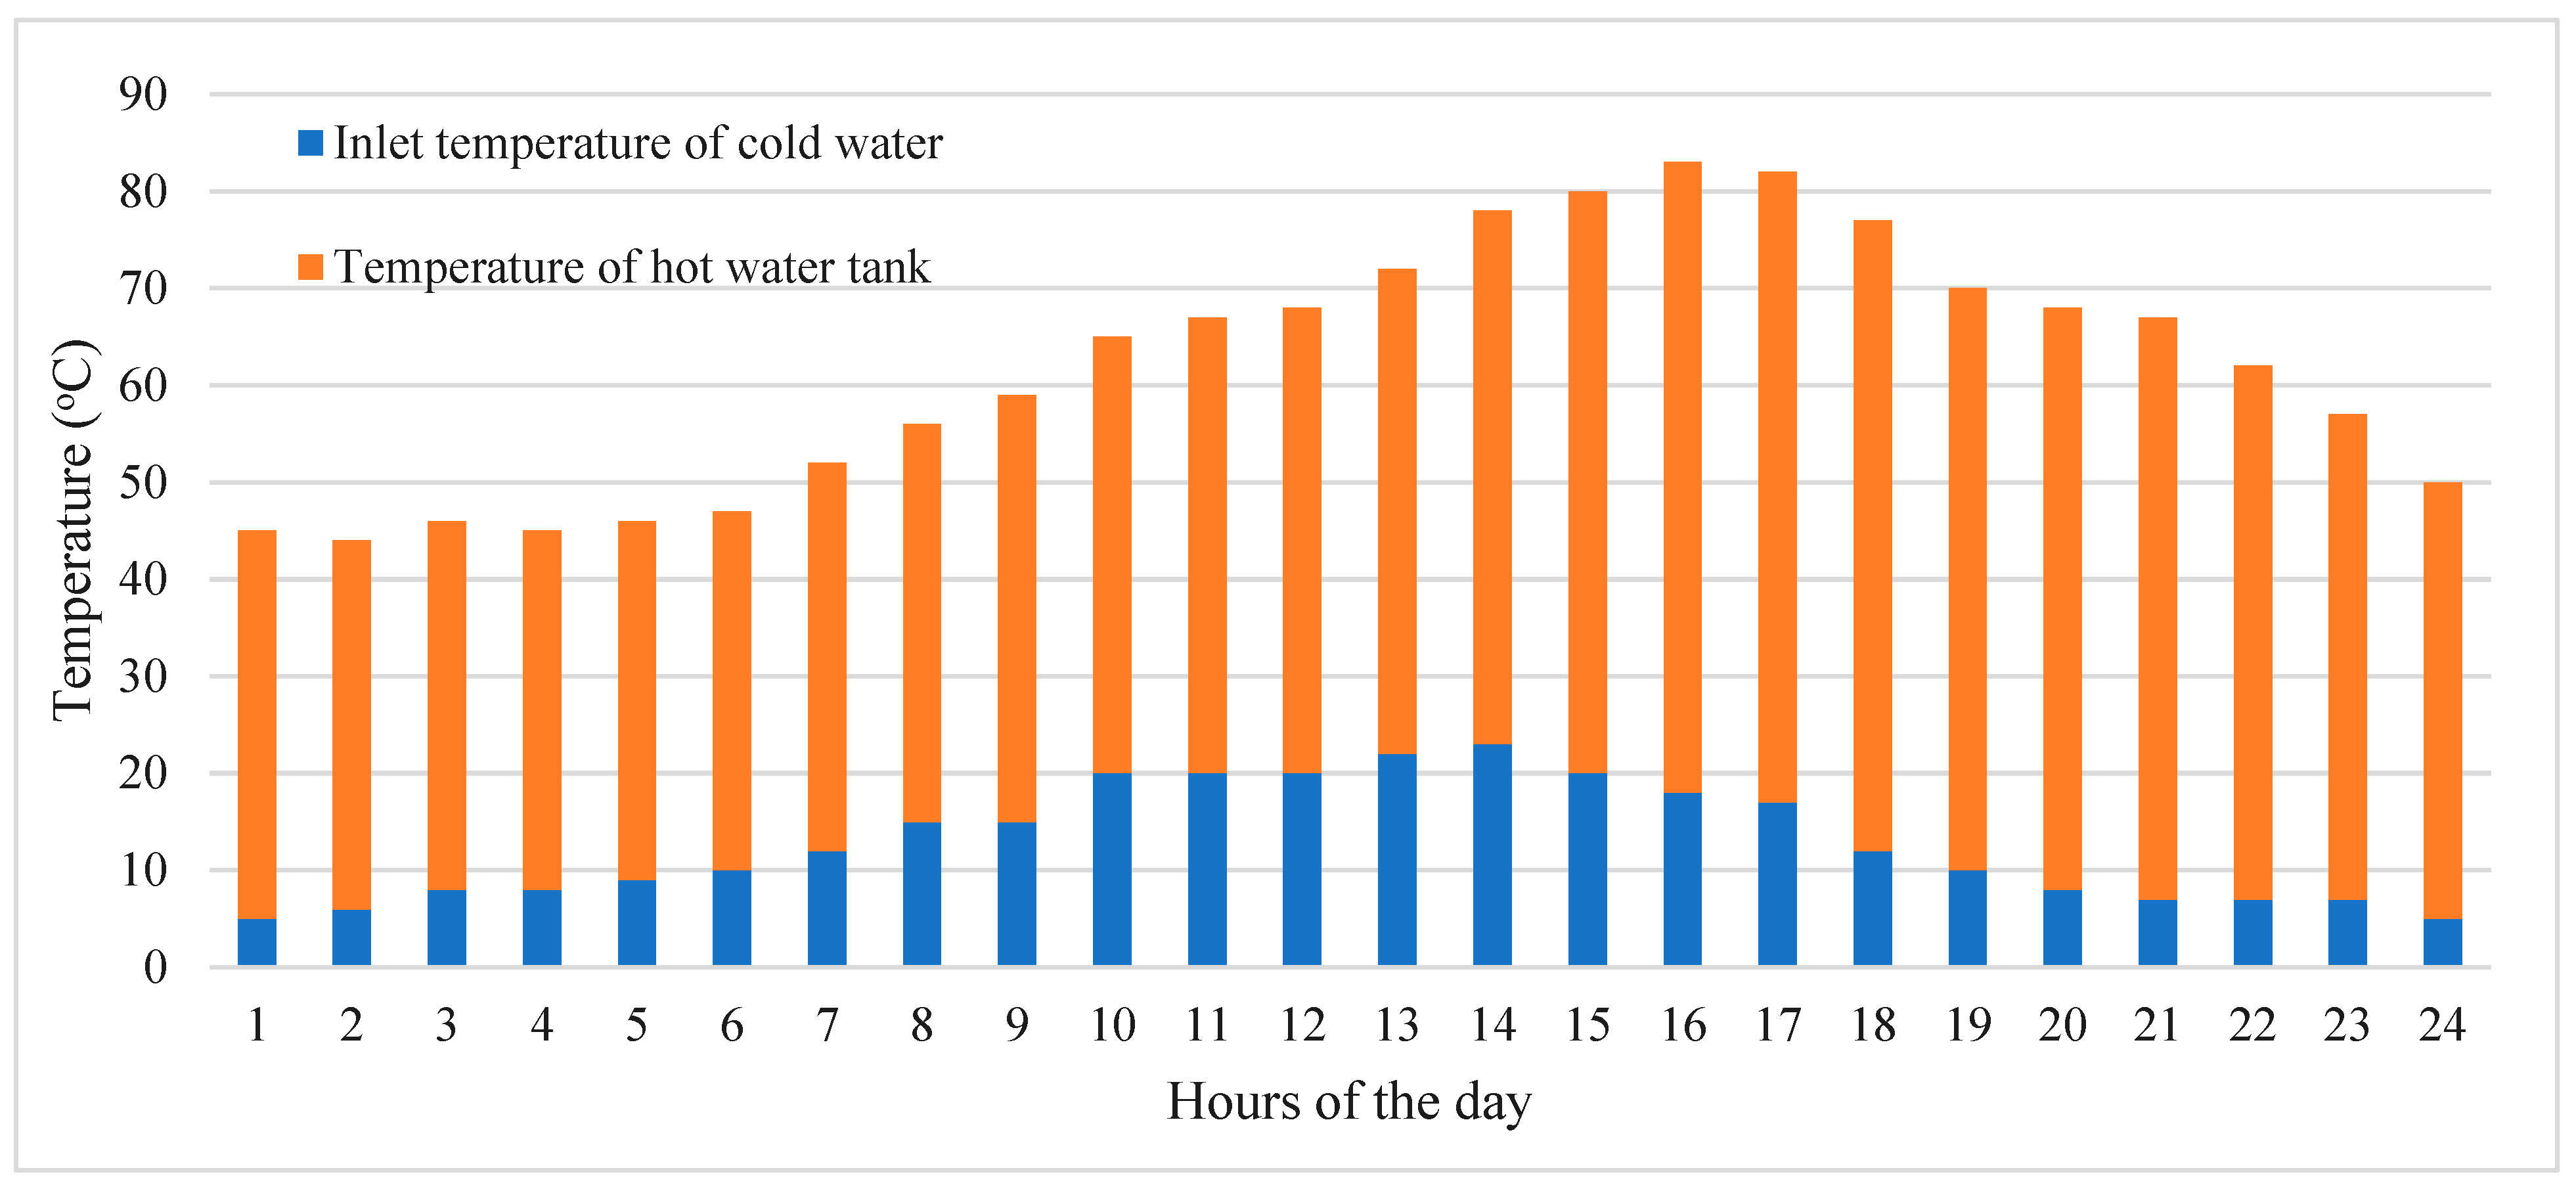
Figure 16.
Solar radiation per kWh/m2.
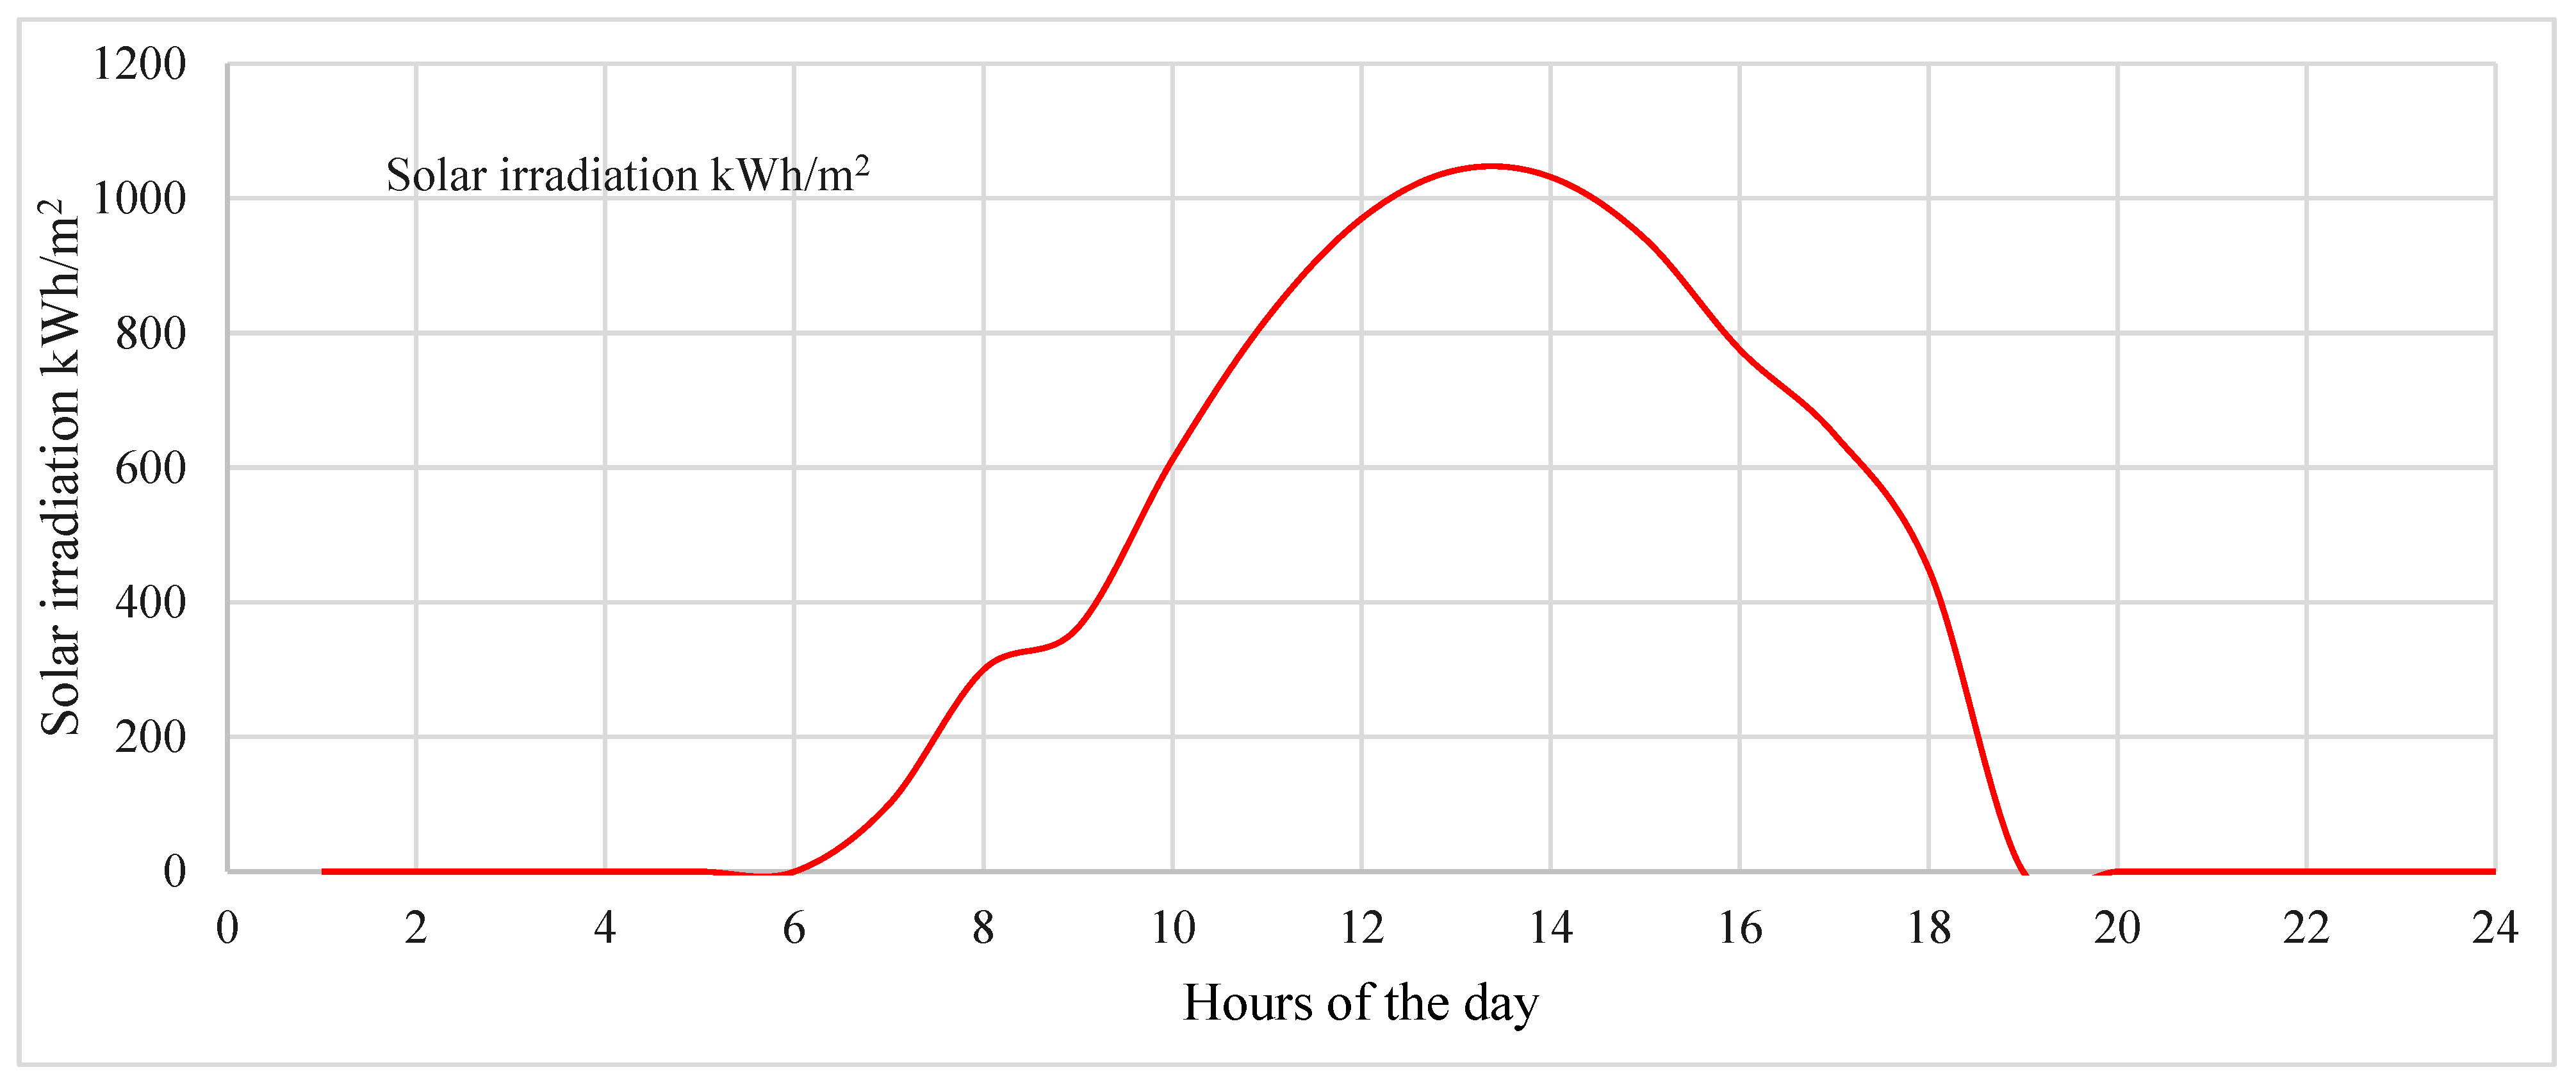
Figure 17.
State of battery charge.
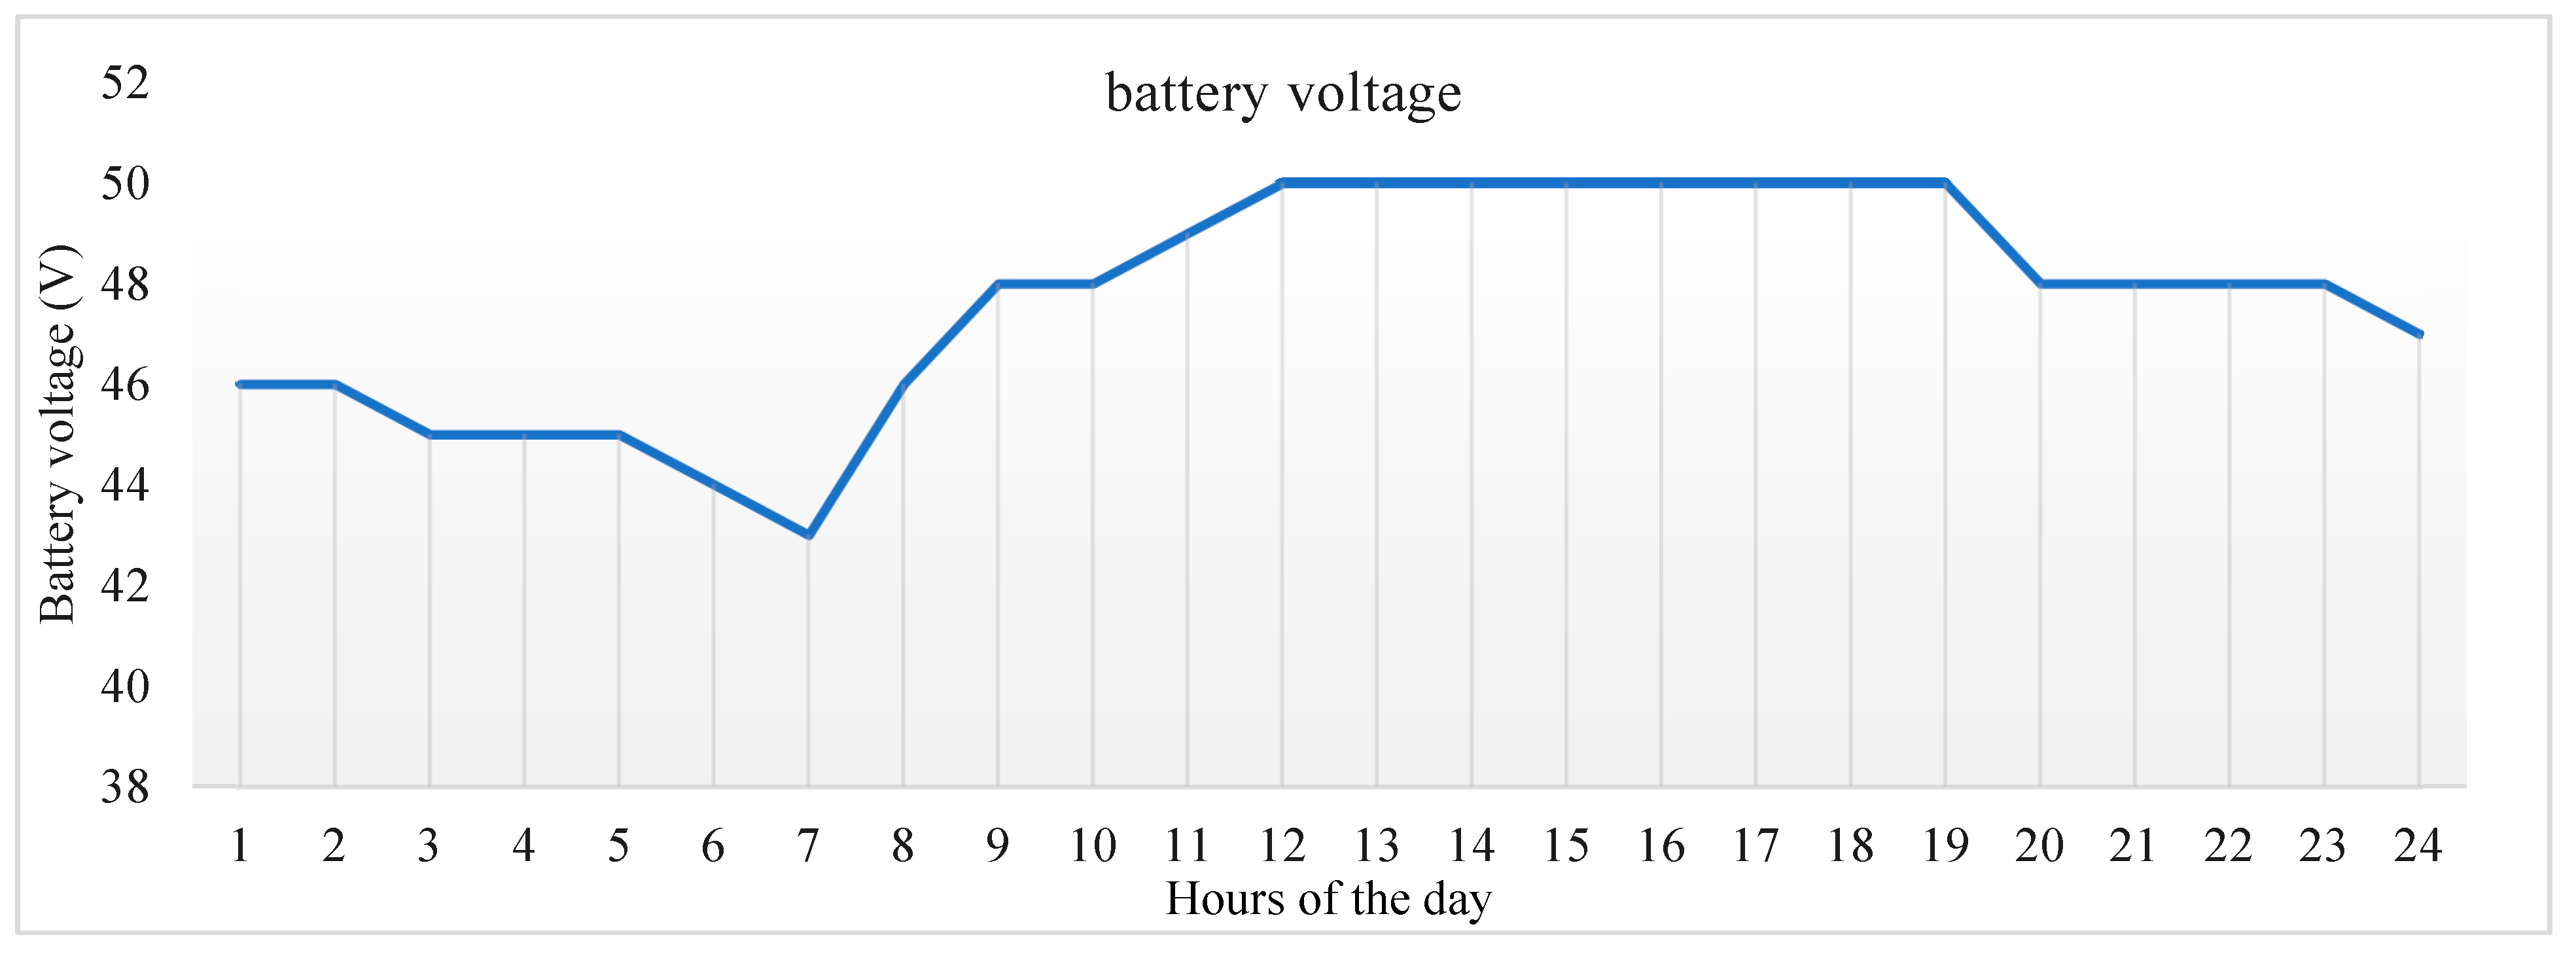
Figure 18.
Total energy production and consumption.
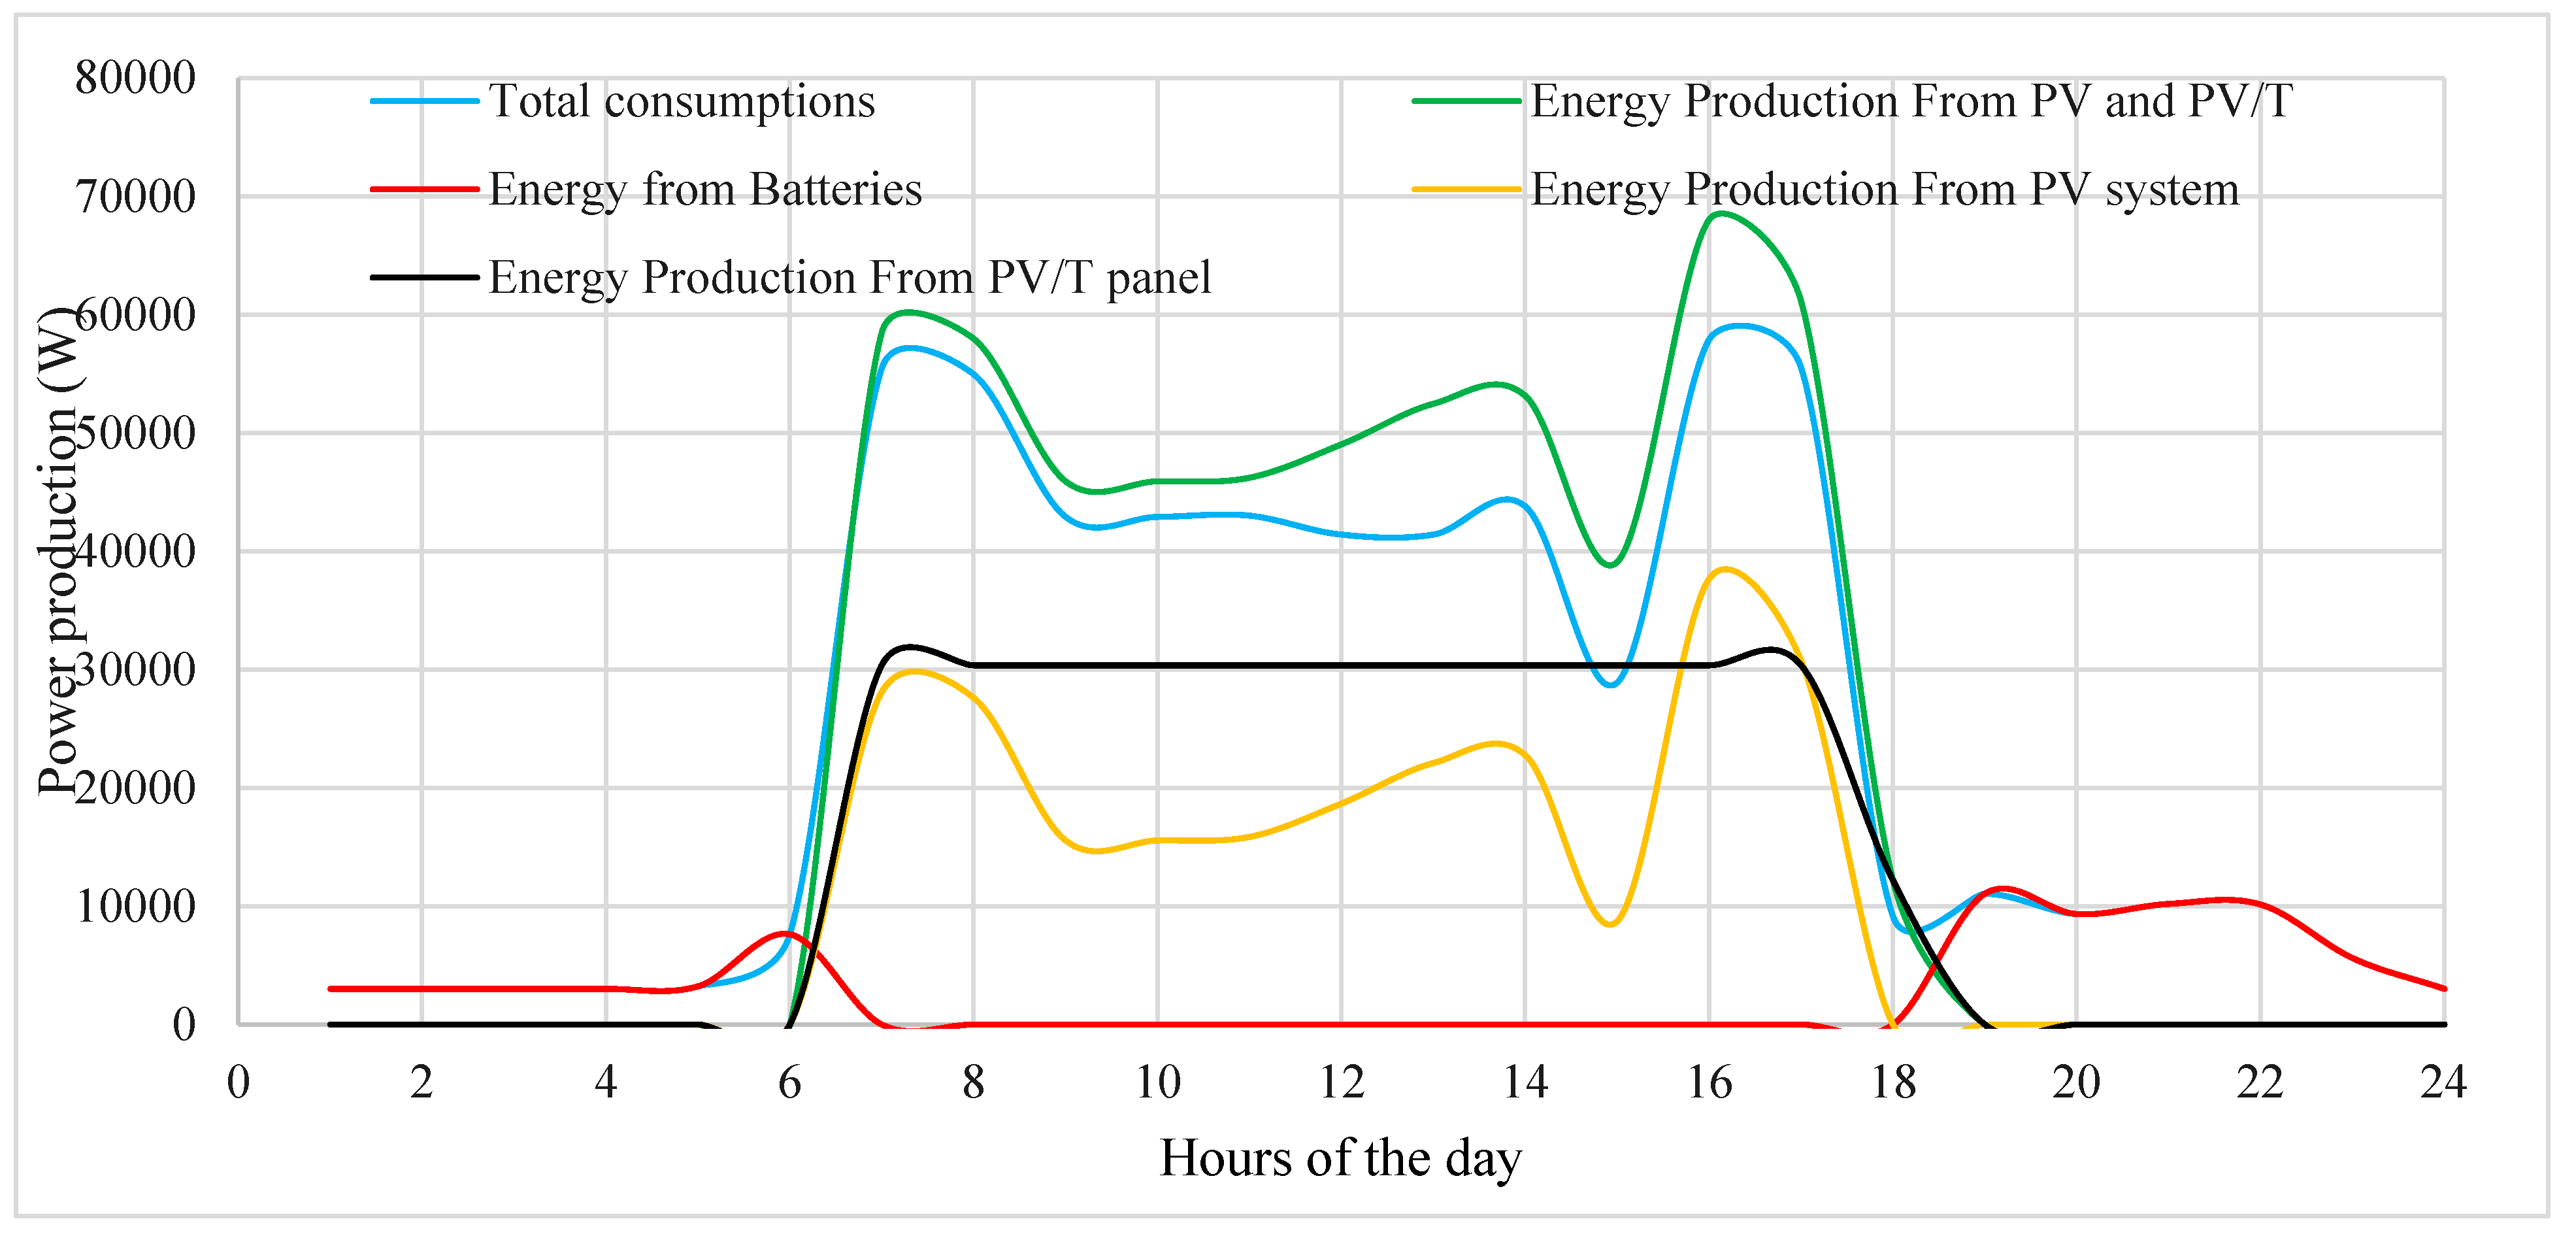

Table 1.
Load Demand distribution for the Village.
| Hours | Water Pump (W) | Total Houses (W) | Street (W) | Medical (W) | Super Market (W) | Total Consumption(W) |
| 1 | 0 | 2700 | 150 | 90 | 75 | 3015 |
| 2 | 0 | 2700 | 150 | 90 | 75 | 3015 |
| 3 | 0 | 2700 | 150 | 90 | 75 | 3015 |
| 4 | 0 | 2700 | 150 | 90 | 75 | 3015 |
| 5 | 0 | 2700 | 300 | 135 | 90 | 3225 |
| 6 | 0 | 6150 | 150 | 215 | 115 | 6630 |
| 7 | 22000 | 32250 | 0 | 1125 | 75 | 55450 |
| 8 | 22000 | 32250 | 0 | 1125 | 75 | 55450 |
| 9 | 22000 | 20250 | 0 | 1075 | 75 | 43400 |
| 10 | 22000 | 20250 | 0 | 575 | 75 | 42900 |
| 11 | 22000 | 20250 | 0 | 675 | 75 | 43000 |
| 12 | 22000 | 18750 | 0 | 575 | 75 | 41400 |
| 13 | 22000 | 18750 | 0 | 575 | 75 | 41400 |
| 14 | 22000 | 21150 | 0 | 575 | 75 | 43800 |
| 15 | 22000 | 6150 | 0 | 635 | 105 | 28890 |
| 16 | 22000 | 34650 | 0 | 1105 | 105 | 57860 |
| 17 | 22000 | 32250 | 0 | 1135 | 105 | 55490 |
| 18 | 0 | 8850 | 0 | 165 | 130 | 9145 |
| 19 | 0 | 10110 | 600 | 215 | 135 | 11060 |
| 20 | 0 | 8400 | 600 | 195 | 135 | 9330 |
| 21 | 0 | 9300 | 600 | 180 | 120 | 10200 |
| 22 | 0 | 9450 | 450 | 165 | 90 | 10155 |
| 23 | 0 | 5100 | 300 | 135 | 90 | 5625 |
| 24 | 0 | 2700 | 150 | 90 | 90 | 3030 |
| Sum | 242000 | 330510 | 3750 | 11030 | 2210 | 589500 |
| Night | 80460 | |||||
| Day | 509040 | |||||
Table 2.
Technical Specifications.
| Technical specifications | |||
| EAN Code | 5949106262460 | Brandi | Sontec. |
| Packaged product weight (kg) | 46.00 | Model | SP180 |
| Product type | Solar panel | Volume | 100 L |
| System type | unpressurised | Material | Steel |
| Number of tubes | 10 | Length | 180 cm |
| Mounting accessories included | Yes | Thickness | 5 cm |
Table 3.
Electrical data of PVT module [33].
Table 3.
Electrical data of PVT module [33].
| Electrical Data | PVT Module CPVT60P250 |
| Number of Cells | 60 (6×10) |
| Peak Power, Wp (Tolerance: -1 to +3%) | 250 |
| Voltage at Maximum Power, Vmp (V) | 30.4 |
| Open Circuit Voltage, VCo (V) | 37.6 |
| Short-Circuit Voltage, Isc (A) | 8.76 |
| Module Efficiency, % | 13 |
| Working Temperature, ºC | -40 to 85 |
| Maximal System Voltage, V | 1000 |
| Rated Current of Diode, A | 20 |
| Temperature Coefficient of Power, %/ºC | -0.37 |
| Temperature Coefficient of Voltage, %/ºC | -0.31 |
| Temperature Coefficient of Current, %/ºC | 0.06 |
| All Electrical Data (Standard Test Conditions) | (1000 W/m²; AM 1.5; Cells Temperature 25 °C) |
Table 4.
Thermal data of PVT module.
| Parameter | Value | Parameter | Value |
|---|---|---|---|
| Aperture Area, m² | 1.56 | Flow Losses, mm H₂O | 540-885 |
| Thermal Efficiency, η₀ | 58% | Fluid Volume, l | 1.2 |
| Nominal Thermal Power, W | 895 | Coefficient α1 | 6.3 |
| Volume Flow Rate, l/min | 1.5-2.4 | Coefficient α2 | 0.09 |
| Effective Thermal Capacity, kJ K⁻¹ | 13.2 |
Table 5.
Technical data of PVT module.
| Module Dimensions, mm | 1650×990×40 |
| Junction Box | IP-65, 2 diode, cables 2×1 m, connectors MC4 |
| Tempered Low-Iron Prismatic Solar Glass, mm | 3.4 |
| Frame | Anodized Aluminum |
| Hydraulic Connection | Free End Pipe 10×1mm |
| Weight, kg | 31 |
| Certificates | CE, IEC 61215, IEC 61730 |
Disclaimer/Publisher’s Note: The statements, opinions and data contained in all publications are solely those of the individual author(s) and contributor(s) and not of MDPI and/or the editor(s). MDPI and/or the editor(s) disclaim responsibility for any injury to people or property resulting from any ideas, methods, instructions or products referred to in the content. |
© 2025 by the authors. Licensee MDPI, Basel, Switzerland. This article is an open access article distributed under the terms and conditions of the Creative Commons Attribution (CC BY) license (http://creativecommons.org/licenses/by/4.0/).
Copyright: This open access article is published under a Creative Commons CC BY 4.0 license, which permit the free download, distribution, and reuse, provided that the author and preprint are cited in any reuse.


