
Submitted:
27 June 2025
Posted:
01 July 2025
You are already at the latest version
Abstract
Providing electricity to remote villages remains a major challenge, especially in off-grid areas. This study explores the feasibility of using photovoltaic (PV) solar energy as a sustainable alternative to diesel generators. A comparative analysis assesses energy accessibility, reliability, cost-effectiveness, and environmental impact. The study focuses on a village in the Shariq al-Nil Khartoum - Sudan, where the absence of a centralized grid has led to reliance on expensive and polluting diesel power. Using MATLAB for simulations, Global Solar Atlas for meteorological data, and Homer for Hybrid system optimization, the research demonstrates that solar energy offers a more reliable and cost-efficient solution. The findings highlight the long-term benefits of solar power in supporting rural electrification, improving healthcare, education, and water access while reducing environmental harm. This study underscores the need for investment in renewable energy to enhance energy security and drive sustainable development in off-grid communities.
Keywords:
renewable energy
; sustainability
; rural communities
; photovoltaic (PV) systems
; battery storage
; solar irradiance
1. Introduction
Sudan is in northeastern Africa, encompassing a vast geographical area between latitudes 8° and 22° North and longitudes 22° and 38° East. The country is predominantly characterized by arid and semi-arid climatic conditions, with consistent and intense solar radiation throughout the year. With an average solar irradiation ranging between 5–7 kWh/m² per day, Sudan possesses substantial potential for harnessing solar energy as a sustainable and renewable power source. Despite this abundant solar resource, access to reliable electricity remains a significant challenge, particularly in remote and rural regions [1].
The demand for electricity in rural communities has been steadily increasing due to population growth, the expansion of agricultural activities, and the growing need for essential services such as healthcare, education, and clean water supply. However, the availability of conventional energy sources—such as diesel generators and grid-connected electricity—remains severely limited. High fuel costs, logistical challenges in transporting fuel to remote areas, and ongoing economic instability exacerbate the energy crisis. Furthermore, recent armed conflicts and the ongoing civil war have resulted in the destruction of nearly all major power generation infrastructure, leaving many regions without electricity. The collapse of the national grid and chronic fuel shortages have rendered conventional energy generation increasingly unreliable [2].
Given these challenges, solar energy emerges as the most viable and sustainable solution for electrification in off-grid and rural areas. Unlike diesel generators, photovoltaic (PV) systems require minimal maintenance, entail lower operational costs, and are not dependent on fuel availability. Solar energy systems can be rapidly deployed in isolated communities, offering a decentralized and resilient energy solution. Moreover, advancements in solar technology, coupled with the declining costs of PV panels and batteries, make solar power more accessible and economically attractive than ever before [3].
To conduct a comprehensive and accurate analysis, this study utilized several software tools and datasets. MATLAB was employed to simulate and analyze the performance of energy systems, enabling precise modeling of generation, storage, and consumption patterns. High-resolution solar radiation and meteorological data for the selected village were obtained from the Global Solar Atlas, a World Bank-developed database, to ensure realistic assessments of solar energy potential. In addition, HOMER, a professional simulation software for renewable energy systems, was used to optimize the PV system design, evaluating parameters such as efficiency, battery storage capacity, and seasonal variations in energy production. Together, these tools enabled a detailed technical and economic comparison between solar energy and diesel-generated electricity [4].
The study focuses on a remote village in the Shariq al-Nil locality, characterized by scattered households and primarily agricultural livelihoods. The village currently relies on diesel generators, which are expensive to operate and frequently affected by fuel shortages. The lack of reliable electricity hampers the delivery of critical services, including healthcare, education, and water supply. By designing and simulating a PV system tailored to the village's specific energy requirements, this research aims to demonstrate the cost-effectiveness, reliability, and environmental sustainability of solar power solutions [5].
A key component of this analysis involved assessing energy consumption patterns and peak demand scenarios. MATLAB was used to generate load profiles based on estimated electricity usage for households, irrigation systems, and communal facilities. HOMER simulations provided insights into optimal PV system sizing, battery requirements, and projected energy output under various weather conditions. Meanwhile, seasonal solar data from the Global Solar Atlas was instrumental in evaluating solar energy availability throughout the year [6].
Beyond technical feasibility, the study also examines economic and environmental aspects. The Levelized Cost of Electricity (LCOE) was calculated for both solar and diesel systems, accounting for capital expenditures, operating costs, and maintenance. The environmental impact was analyzed by comparing CO₂ emissions from diesel generators with those from PV systems. The findings are intended to support policymakers, investors, and local authorities in implementing sustainable electrification strategies for rural Sudan [7].
This research presents a thorough comparison between solar PV systems and conventional diesel generators in a remote Sudanese village. By integrating advanced simulation tools and high-resolution climate data, the study offers valuable insights into the potential of solar energy as a reliable and economically viable solution for off-grid communities. The results contribute to ongoing efforts to expand rural electrification, improve energy access, and promote environmentally responsible energy solutions in Sudan [8].
In many rural communities, limited access to electricity continues to hinder economic development, healthcare services, and educational opportunities. Sudan, endowed with vast solar potential, stands at a pivotal juncture where renewable energy could transform rural electrification. As the country grapples with fuel shortages and the destruction of its traditional power infrastructure, solar energy emerges as a practical and sustainable alternative. Transitioning from diesel-based systems to PV solar power is not merely a technical upgrade—it represents a shift toward greater sustainability and economic resilience.
Several previous studies have examined the feasibility and advantages of solar energy in Sudan. For instance, Abdelgadir and Abdelrahman (2017) demonstrated through MATLAB modeling that solar power is a more sustainable and cost-effective alternative to diesel generators in the eastern and northern regions of the country. Ali et al. (2019) utilized Polysun software to design solar-powered systems for off-grid villages, highlighting their economic viability in areas with abundant sunlight. Mohamed and Osman (2020) conducted a comparative study using the Global Solar Atlas and MATLAB, concluding that solar PV systems significantly reduce energy costs and dependence on fuel [9].
Further research by El-Sayed and Hassan (2021) explored the use of solar-powered water pumping systems to support agriculture and improve access to water, with positive impacts on health and economic well-being. Abdallah and Mohamed (2022) confirmed that integrating PV systems in rural health clinics enhances the reliability of power supply for medical equipment. Mohamed Gmal (Osman, 2021) emphasized the role of solar energy in strengthening energy security and supporting sustainable development in rural communities, while his subsequent work (Osman, 2022) demonstrated the long-term financial advantages of PV systems despite their higher initial investment costs [10].
Additional studies, such as those by Khalil and Nasser (2018), Ibrahim et al. (2019), and Mohamed and Ahmed (2020), underscored the feasibility of solar energy for rural development, its reliability in the face of logistical fuel challenges, and its positive socio-economic impacts. Salah and Shamsuddin (2021) validated the effectiveness of solar energy in powering off-grid electrification projects, and Ahmed and El-Mahdi (2022) explored how solar access can empower rural women through improved business, education, and healthcare opportunities [11].
Collectively, these studies highlight the pivotal role solar energy can play in overcoming Sudan's rural electrification challenges and advancing sustainable development. However, the significance of this research lies in its focused comparative analysis of solar PV and diesel generators for a specific rural Sudanese village. By leveraging advanced tools such as MATLAB, HOMER, and the Global Solar Atlas, this study delivers a detailed assessment of technical feasibility, economic efficiency, and environmental impact. Its findings aim to guide stakeholders in adopting more sustainable, affordable, and reliable energy solutions tailored to the needs of Sudan’s off-grid communities [12].
2. Materials and Methods
2.1. System Configuration and Installation
A photovoltaic (PV) system functions through an organized process that ensures the efficient conversion of solar energy into usable electricity. Figure 1 presents a detailed flowchart illustrating this energy transformation cycle, which includes essential stages such as solar radiation absorption, energy conversion, storage, and final distribution for consumption.
The process begins with PV panels capturing sunlight and converting it into electrical energy. This generated electricity can then be stored in batteries or alternative storage systems to maintain a consistent power supply. Subsequently, the stored energy is distributed to various applications, thereby enhancing the overall efficiency and reliability of the system. By visually representing these interactions, the flowchart in Figure 1 serves as a valuable tool for understanding the functionality and operational dynamics of a PV system, highlighting its effectiveness in sustainable energy utilization [13].
2.2. Geographical Context
Khartoum, the capital city of Sudan, is administratively divided into six regions, one of which is Shariq al-Nil. This region is the largest in area yet remains the least developed, comprising numerous small agricultural villages that are not connected to the national electricity grid. These villages are modest in size, typically spread over an area no greater than 50 kilometers in diameter and rely mainly on local resources to meet their basic needs.
This study concentrates on one of these villages, which is currently unconnected to the national power grid and relies solely on diesel generators for electricity. However, the village’s geographic location and climatic conditions make it particularly suitable for photovoltaic energy solutions. It lies at approximately 15.61° latitude and 32° longitude.
The village is home to an estimated 250 people, distributed among 30 family households. The community also includes a small supermarket and a medical center. Each family cultivates around three feddans of land, amounting to a total agricultural area of approximately 3.8025 square kilometers. In this rural context, three feddans per household is considered the minimum land area necessary for self-sufficient living [14].
Located in the sub-Saharan belt, Sudan benefits from high levels of solar radiation, with values reaching up to 1100 Wh/m², as illustrated in Figure 2.
Figure 2 depicts the distribution of solar energy received per square meter over a specific period. In this context, G(i) represents the global irradiance, while Gb(i) refers to the direct irradiance. The figure illustrates the changes in solar radiation intensity, offering a clear understanding of how solar energy availability fluctuates throughout the day or during designated intervals. Such information is crucial for evaluating the practicality and performance of photovoltaic systems, as it directly influences their energy output and overall efficiency [15].
3. Load Demand Requirements
The energy demand in this remote village is largely determined by fundamental needs such as water pumping, household lighting, and climate control through cooling and heating. A detailed breakdown of power consumption for various facilities is presented in Table 1.
3.1. Pumping Loads
The water demand per feddan varies throughout the year, ranging from 13 cubic meters per day during the winter season to 25 cubic meters per day in the summer. This seasonal fluctuation is also reflected in solar insolation, which decreases in winter and increases in summer, with values ranging between 4.8 and 10 kWh/m²/day. Under the most critical conditions when water consumption is high and solar irradiance is at its minimum the total peak energy demand for the entire area is estimated at approximately 242 kWh, with a maximum power requirement of around 22 kW [16].
3.2. Household Loads
Household electrical loads play a vital role in determining the overall energy consumption within residential units. For this analysis, each household is assumed to have an estimated total load of 3 kW. Table 2 outlines the load distribution for a typical home, providing details on the number of appliances, their individual power ratings, and the total installed capacity for each category of usage [17].
As shown in Table 2, the total installed power amounts to 3010 watts. The highest hourly energy demand occurs during daytime hours, reaching approximately 1155 watt-hours. The total energy consumption over a full day is estimated at 11.017 kilowatt-hours. These figures are essential for accurately determining the required energy supply and distribution for each household. The load profile is illustrated in Figure 3.
3.3. Street Lighting Load
A total of fourteen light poles are installed along the village streets, each fitted with energy-efficient fluorescent or sodium lamps that deliver a minimum luminous output of 1200 lumens. These lamps function during both day and night, with an overall energy consumption of 600 watt-hours. During nighttime, an intelligent control system regulates their operation based on lighting needs, typically running for around 12 hours. Under these conditions, the maximum energy demand during the night reaches approximately 3.75 kilowatt-hours [18].
3.4. Medical Center
A small medical center serves as a vital facility within this remote community, providing essential healthcare services. The center's electrical load, outlined in Table 3, amounts to a total installed capacity of 1325 watts, consisting of a range of critical medical and support equipment necessary for its daily operations [19].
The 24-hour load demand profile reveals that the peak energy requirement reaches 1135 watt-hours, while the total energy consumption over the course of a day amounts to 11.03 kilowatt-hours. This distribution is visually represented in Figure 4.
3.5. Super Market
A small supermarket is considered an essential service within any village. In this study, it is represented with a total power load of 200 watts, comprising different categories of electrical appliances and equipment, as specified in Table 4.
The load distribution across a 24-hour period indicates that the highest hourly energy demand is approximately 135 watt-hours, while the total daily energy consumption is calculated to be around 2.210 kilowatt-hours.
3.6. Load Demand for All Village
The village under study comprises 30 residential homes. During daytime hours, the peak energy demand reaches approximately 57.860 kilowatt-hours, with a total daily consumption of 509.040 kilowatt-hours. At night, the peak demand is recorded at 11.060 kilowatt-hours, while the overall nighttime consumption amounts to 80.460 kilowatt-hours. Table 5 provides a detailed breakdown of the village’s total energy demand [20].
4. Determining the Size of the Solar Array and Designing the System
Designing a photovoltaic (PV) system involves careful planning and equipment selection based on factors such as location, solar radiation, and energy storage needs. In off-grid regions of Sudan, all electricity must be produced and stored locally to ensure a stable supply, especially during the night or cloudy periods. Therefore, the system must be sized to handle maximum demand during times of minimal solar generation. Proper system sizing establishes the required voltage and current ratings for each component, accounting for installation and operational costs [21].
Key Factors Influencing System Sizing:
Load Profile: Determined by listing all household appliances and their daily usage in watt-hours.
Panel Positioning: Affects tilt angle, orientation, and daily solar exposure.
Home Design: Optimizing sunlight exposure by clearing the southern side, orienting windows southward, and using good insulation reduces energy loss.
Energy Efficiency: Using low-consumption appliances such as CFLs helps minimize energy needs. Cooking and water heating can be handled separately using gas or thermal systems.
Appliance Type: Choosing low-voltage DC appliances reduces system cost and minimizes the need for high-rated inverters.
Startup Loads: High-surge appliances like refrigerators and pumps require special consideration due to their high initial current draw [22].
Solar Array Dimensioning
Calculate the average number of hours in the sun each day (Tmin) and the amount of energy used each day in Watt-hours (E) before designing the array. To determine losses and acquire the necessary energy, to avoid under-sizing, divide the total daily power consumption in watt-hours by the product of all individual efficiencies within the system .
Divide the preceding value by the mean number calculate the maximum available power by multiplying the number of sunlight hours per day for the geographical region by Tmin.[5].
To find the total required current, simply divide the maximum power by the system's DC voltage.
To get the required voltage and current, units should be linked in series and parallel as needed. Use the formula: Divide the total DC voltage of the system by the rated voltage (Vr) of each individual module to calculate the number of series modules.
Ultimately, the sum of the series and parallel modules equals the overall number of modules,
The PV module chosen in this study is Monocrystalline photovoltaic solar panel Longi LNGLR4-72HPH-455M, 144 cells, 455 W455M. It has 144 cells (6x24) monocrystalline type and provides an upper limit of 455 watts for the power output monocrystalline panel is a high one of approx. 20.9%, with very little energy loss. LNGLR4-72HPH-455M has a very big advantage compared to other photovoltaic panels, and this consists in the fact that it minimizes the impact of microcracks, showing a high tolerance to shading. The innovative technology offers superior performance and low radiation both mornings, evenings, and overcast days [6,7].
The panel is 209.4 cm x 103.8 cm x 3.5 cm, Also, the panel helps to increase energy production, increasing the general effectiveness of the PV system. The load borne for the snow is quite important, namely 5400 Pa (on the front of the panel), and the wind load is up to 2400 Pa (behind the panel). The degree of protection is guaranteed by the IP 68 standard, the panel being resistant to adverse weather conditions, such as water and dust. The frame of the panel is made of anodized aluminum, and the surface of 3.2 mm tempered glass. The dimensions are: 209.4 x 103.8 x 3.5 cm,
Figure 5.
Current- Voltage Curve.
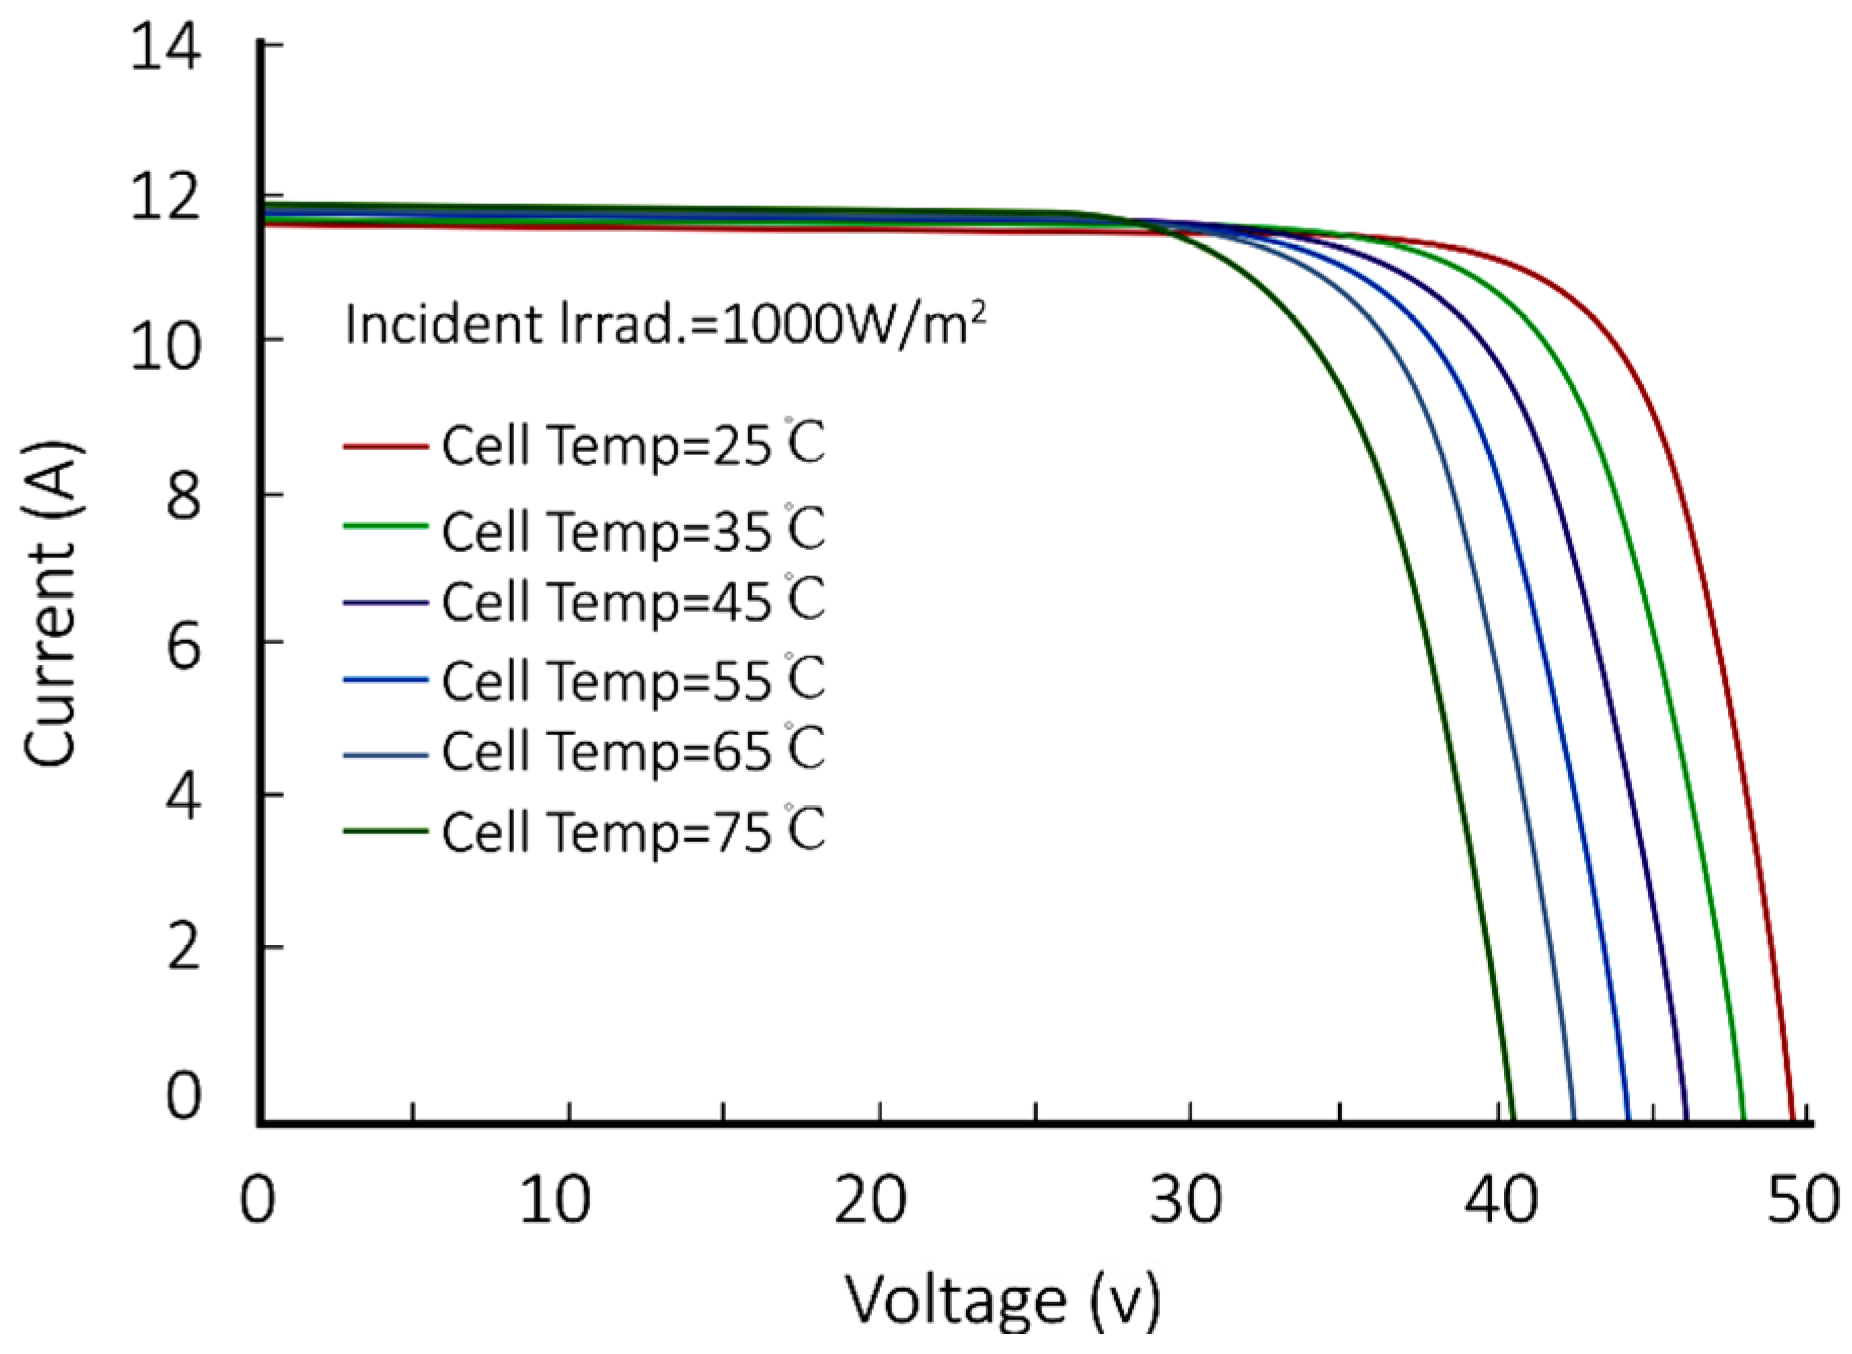
Figure 6.
Current- Voltage Curve.
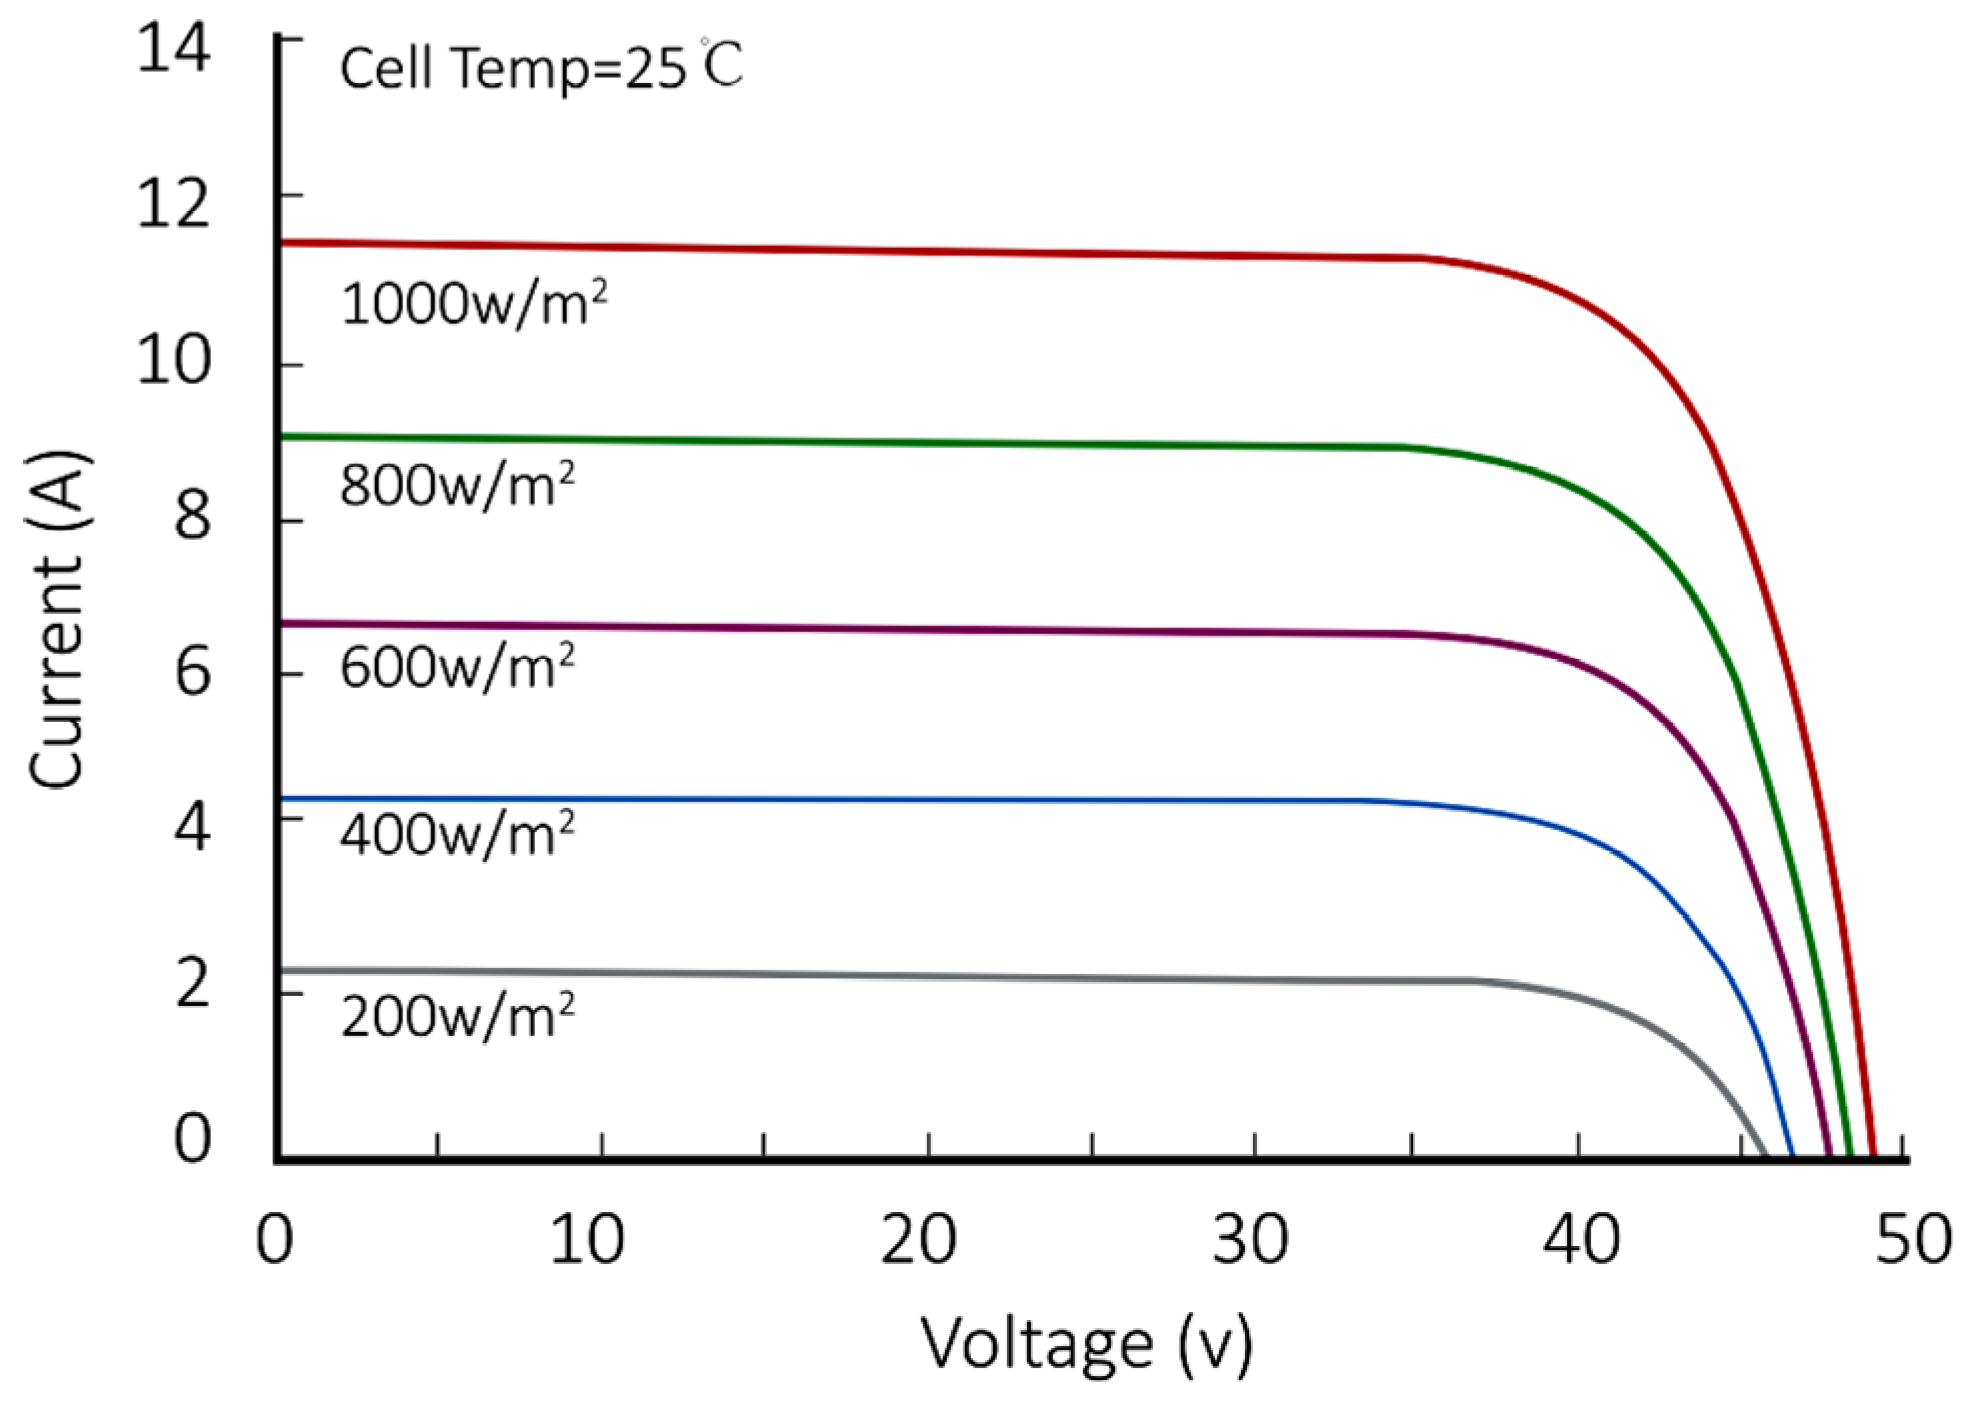
A Current-Voltage (I-V) curve is a graphical representation of the relationship between the current passing through panel and the voltage applied across it. Figure depicts a specific I-V curve relevant to a system [23].
Figure depicts the Current-Voltage (I-V) curve of a solar cell. This curve is crucial in understanding the behavior and performance of solar cells under different operating conditions. Error! Reference source not found. Represent the Electrical and mechanical characteristics of the panel [7].

Table 6.
Electrical and mechanical characteristics.
| Testing Condition | STC | NOCT |
| Power greatest (Pmax/W) | 455 | 339.8 |
| Voltage on an open circuit (Voc/V) | 48.5 | 46.4 |
| Current on a short circuit (Isc/A) | 12.66 | 9.43 |
| The highest possible voltage (Vmp/V) | 42.7 | 38.8 |
| current (Imp/A) at highest power | 11.92 | 8.75 |
| Efficiency of the module (%) | 20.9 | |
Standard Test and Operating Conditions:
Under Standard Test Conditions (STC), the panel operates at an irradiance of 1000 W/m², with a cell temperature of 25°C, and solar spectrum measured at AM1.5. Under Normal Operating Cell Temperature (NOCT), irradiance is 800 W/m², ambient temperature is 20°C, and the spectrum remains at AM1.5, with a wind speed of 1 m/s.
Panel Construction and Cable Specifications:
The module features a 4 mm² output cable, 1400 mm in length. Its frame is built from anodized aluminum alloy, while the front surface is made of 3.2 mm tempered glass. The panel operates within a temperature range of -40°C to +85°C and weighs 23.5 kg.
Panel Quantity and Cost:
Using the Longi LR4-72HPH-455M model (455W, 144 cells), each building requires 8 panels. For 33 buildings (30 houses, a clinic, a supermarket, and public lighting), the total number of panels is 264. At a cost of 100 USD per panel, the total investment in PV panels is approximately 26,000 USD.
Battery Bank Sizing:
The required battery storage capacity is calculated by multiplying the total daily energy consumption by the number of autonomy days (days without solar production). The result is then divided by the maximum allowable depth of discharge to ensure safe and efficient battery operation.
To determine the nominal voltage (Vb) of each battery to be used in the battery bank, we need to decide based on the required safe energy storage. This can be achieved by dividing the necessary safe energy storage by the DC voltage of one of the chosen batteries, resulting in the required capacity of the battery bank in ampere-hours (C)[9]
Once the capacity of the battery bank has been determined, the capacity (Cb) of each individual battery within the bank needs to be established. Based on the battery voltage rating and system requirements, the battery bank is constructed by connecting batteries in both series and parallel configurations [24]. To calculate the total number of batteries required, the capacity of the battery bank (C) in ampere-hours is divided by the capacity of one of the selected batteries ():
At that point, it is simple to ascertain the battery bank's arrangement[10]. The rating of the voltage of one selected battery is subtracted by the system's DC voltage to obtain the number of batteries linked in series:
The number of parallel paths Np is then calculated by dividing the total number of batteries by the number of batteries connected in sequence [11].
We will move on to the next system component as soon as the bank's battery size is known.
According to the system the battery size is approximative 80000 /12V = 6600Ah. In this system we can use 100Ah. Number of batteries = 66 batteries.
Lithium Battery 12V, 100Ah Storage Box Case Organizer Apply for Energy Solar, off grid, RV, etc.[12]. One battery cost $75, making the total cost of the purchase $5000.
Sizing of the Voltage Regulator
Its job is to control the flow of current. The highest current of the arrays and the maximum current of the load must both be tolerated by an effective voltage regulator. [13]. A safety factor can be used to double the short circuit current of the parallel modules. The rated current I of the voltage controller is the outcome:
where Np is the number of parallel modules, Isc is the short-circuit current of an individual module, and is the safety factor The safety factor is utilized to guarantee that the regulator can handle the highest current produced by the array, which could surpass the calculated amount. It also allows for the addition of new equipment or a larger load current than originally anticipated. This safety factor essentially permits a little system growth [25].
Sizing of the Inverter
Figuring out how much power the appliances that will be operating simultaneously actually need is a crucial first step in sizing the inverter [14]. Secondly, we must double the power of big motors by three to account for their beginning current. The two preceding numbers are then added together and multiplied by 1.25 as a safety precaution to allow for system growth[15]
Based on the load, a Solar Hybrid Inverter with an output power of 800W in each building is deemed suitable. The cost of each inverter is 100USD which included 33 inverters costing $3300 USD in total. The technical specification of the inverter as shown in Error! Reference source not found.
Table 7.
Technical specification Solar Hybrid Inverter.
| Nature of Source Flow: | Active Inverter |
| Model No. | VG1012 |
| Key Features | Energy-saving Solar Inverter and Hybrid Inverter |
| Application | Residential Solar Power Systems |
| Circuit Topology | Full-Bridge Type |
| Rated Power | 800W |
| Voltage | 220VAC |
| Frequency | 50/60Hz |
| Output Voltage Regulation | ±10% |
| Efficiency | >98% |
| Input/output Protection | Circuit Breaker |
| Low-Level Disconnect (Selectable) | 20V or 21V |
| PWM Controller Voltage | 30VDC−60VDC |
| Max PV Open Circuit Voltage | PWM: 60VDC, MPPT: 150VDC |
| Max Solar Charge Current | 60A |
| Protections | Overload, Over Temperature, Overcharging, Low Battery, Battery Reverse Connection, High AC Voltage, etc. |
| LCD Indicator Status | AC Input Voltage, AC Input Frequency, PV Voltage, PV Current, Output Voltage, Output Frequency, etc. |
| LED Indicator Status | AC Line In: Green/Inverter: Green/Charging: Yellow/Alarm: Red |
| Temperature | 0-40ºC |
| Humidity | −10ºC~90ºC Noncondensing |
| Packing Size (LWH) | 470335210mm |
Error! Reference source not found. outlines the technical specifications of the Solar Hybrid Inverter (Model No. VG1012), featuring key attributes such as rated power, voltage, frequency, efficiency, input/output protection, and various alarm indicators.
Diesel Generator Group
The same life cycle cost analysis is used to determine the cost of 80 kWh generated considering the following remarks:
- It is necessary to use five separate diesel units, one as reserve, which will increase the kWh cost of diesel [16]. At the same time, due to the minimum practical size for small loads, diesel generators are often oversized, as in our case. Due to oversizing, the diesel generator runs with low utilization, which in addition to the frequent need for spare parts and overhauls leads to an increase in maintenance and repair costs [26].
The five diesel it consists of 2 x 5 kW+3x20kW= 70kW
5kW diesel generator
Soundproof single-phase diesel generator 5kW, 18A, 3000rpm, engine YD186FAG, Stager YDE7000TD.
20kW diesel generator
Table 8.
Technical specification of 20 kW diesel generator.
| Nominal power | 20kVA | Dimensions (LxWxH) | 1890*910*1160 mm |
| Maximum power | 22kVA | Net weight | 830 kg |
| Nominal voltage | (AC) 230V | Starting system | 12V Electric |
| Power factor (cos Φ) | 1 | Compression ratio | 18.2:1 |
| Rated current | 86.9 A | Cylinder capacity | 2.672 L |
| Nominal frequency | 50 Hz | Oil bath capacity | 7.6 L |
| Tank capacity | 92 L | Insulation grade | H |
| Noise level (LWA) | 93 dB(A) | Product code | 1158000022S |
Error! Reference source not found. The technical specifications of the 20-kW diesel generator, priced at $10000 USD per unit, detail its rated power and fuel type as diesel. When considering the total cost for five generators, including the cost of diesel, the sum amounts to $34000 USD [27].
System Components Summary
The equipment needed to construct the standalone photovoltaic system for the hypothetical distant home mentioned above is included in Error! Reference source not found. together with certain specs and details. This is not the only equipment’s on the market, and there are many manufacturers who sell them.
Table 9.
Summary of the System Components.
| Component | Model | Component Rating | Size (inch) | Unit Price USD | Total Price | Warranty | ||
| W/Ah | A | V | ||||||
| Panels | Longi LNGLR4-72HPH-455M | 455 /339W | 10.92/8.75 | 41.7/38.8 | 209.4 x 103.8 x 3.5 cm | 100 | 26000 | 25 |
| Batteries | Lithium Battery | 100 Ah | ~ | 12 | 3.3x1.7x2.2 | 75 | 5000 | 2 |
| Inverter | VG1012 | 800W | ~ | 24/220 | 4.7x3.35x2.1 | 100 | 3300 | 5 |
| Wires | #02 AWG | Diameter= 6.54 mm, Area= 32.0 mm2 | 50 | 100 | ||||
| #10 AWG | Diameter= 2.59 mm, Area= 5.27 mm2 | 50 | 100 | |||||
| Diesel | Stager | 5000 | 18 | 230 | 9.50 x 5.50 x 7.65 | 2000 | 4000 | 2 |
| Diesel | Stager | 20000 | 86.9 | 230 | 18.9x9.1x11.6 | 10000 | 30000 | 2 |
This means that equipment ratings and prices will differ. However, to achieve optimal performance, equipment ratings, quality, and prices are used to select this equipment.
Cost estimate of the system
The equipment used in the system costs a total of 34300USD PV and 34000 USD diesel. Additional costs must be added for design, labor, wiring, metering, monitoring, disconnect devices, and shipment, this additional expense is estimated to cost 4000USD on diesel.
5. System Design and Simulation
The proposed system includes solar panels, inverters, and supporting components designed to convert solar energy into usable electricity for the village. The system’s size is based on local energy demand, available solar radiation, and other design considerations.
5.1. Battery Backup
The battery bank stores excess solar energy, ensuring a steady power supply during the night or cloudy conditions. It also serves as a backup during outages. Its capacity is determined by daily energy needs, surplus solar generation, and the desired level of energy autonomy [28].
5.2. Auto-Sizing Diesel Generator
An auto-sizing diesel generator is included to meet demand when solar output is insufficient. It adjusts its output based on the system's needs, improving efficiency and reducing fuel use. Generator sizing is based on the energy gap not covered by the PV system.
5.3. Hybrid System Optimization Using HOMER
HOMER software, developed by NREL, is used to design and optimize hybrid systems combining solar and diesel power. While solar panels provide clean energy during the day, diesel generators ensure reliability at night or in poor weather. HOMER helps balance performance, cost, and energy availability to create a reliable and sustainable system. Figure 7 illustrates the overall system design [29].
Using Homer, we can create a detailed model of our village's power system and optimize it to provide reliable and cost-effective electricity in Error! Reference source not found.. With this information, we can make informed decisions about the best way to power our village and ensure that it has access to electricity around the clock.
Figure 8.
Monthly Average solar Global Horizontal Irradiation Data.
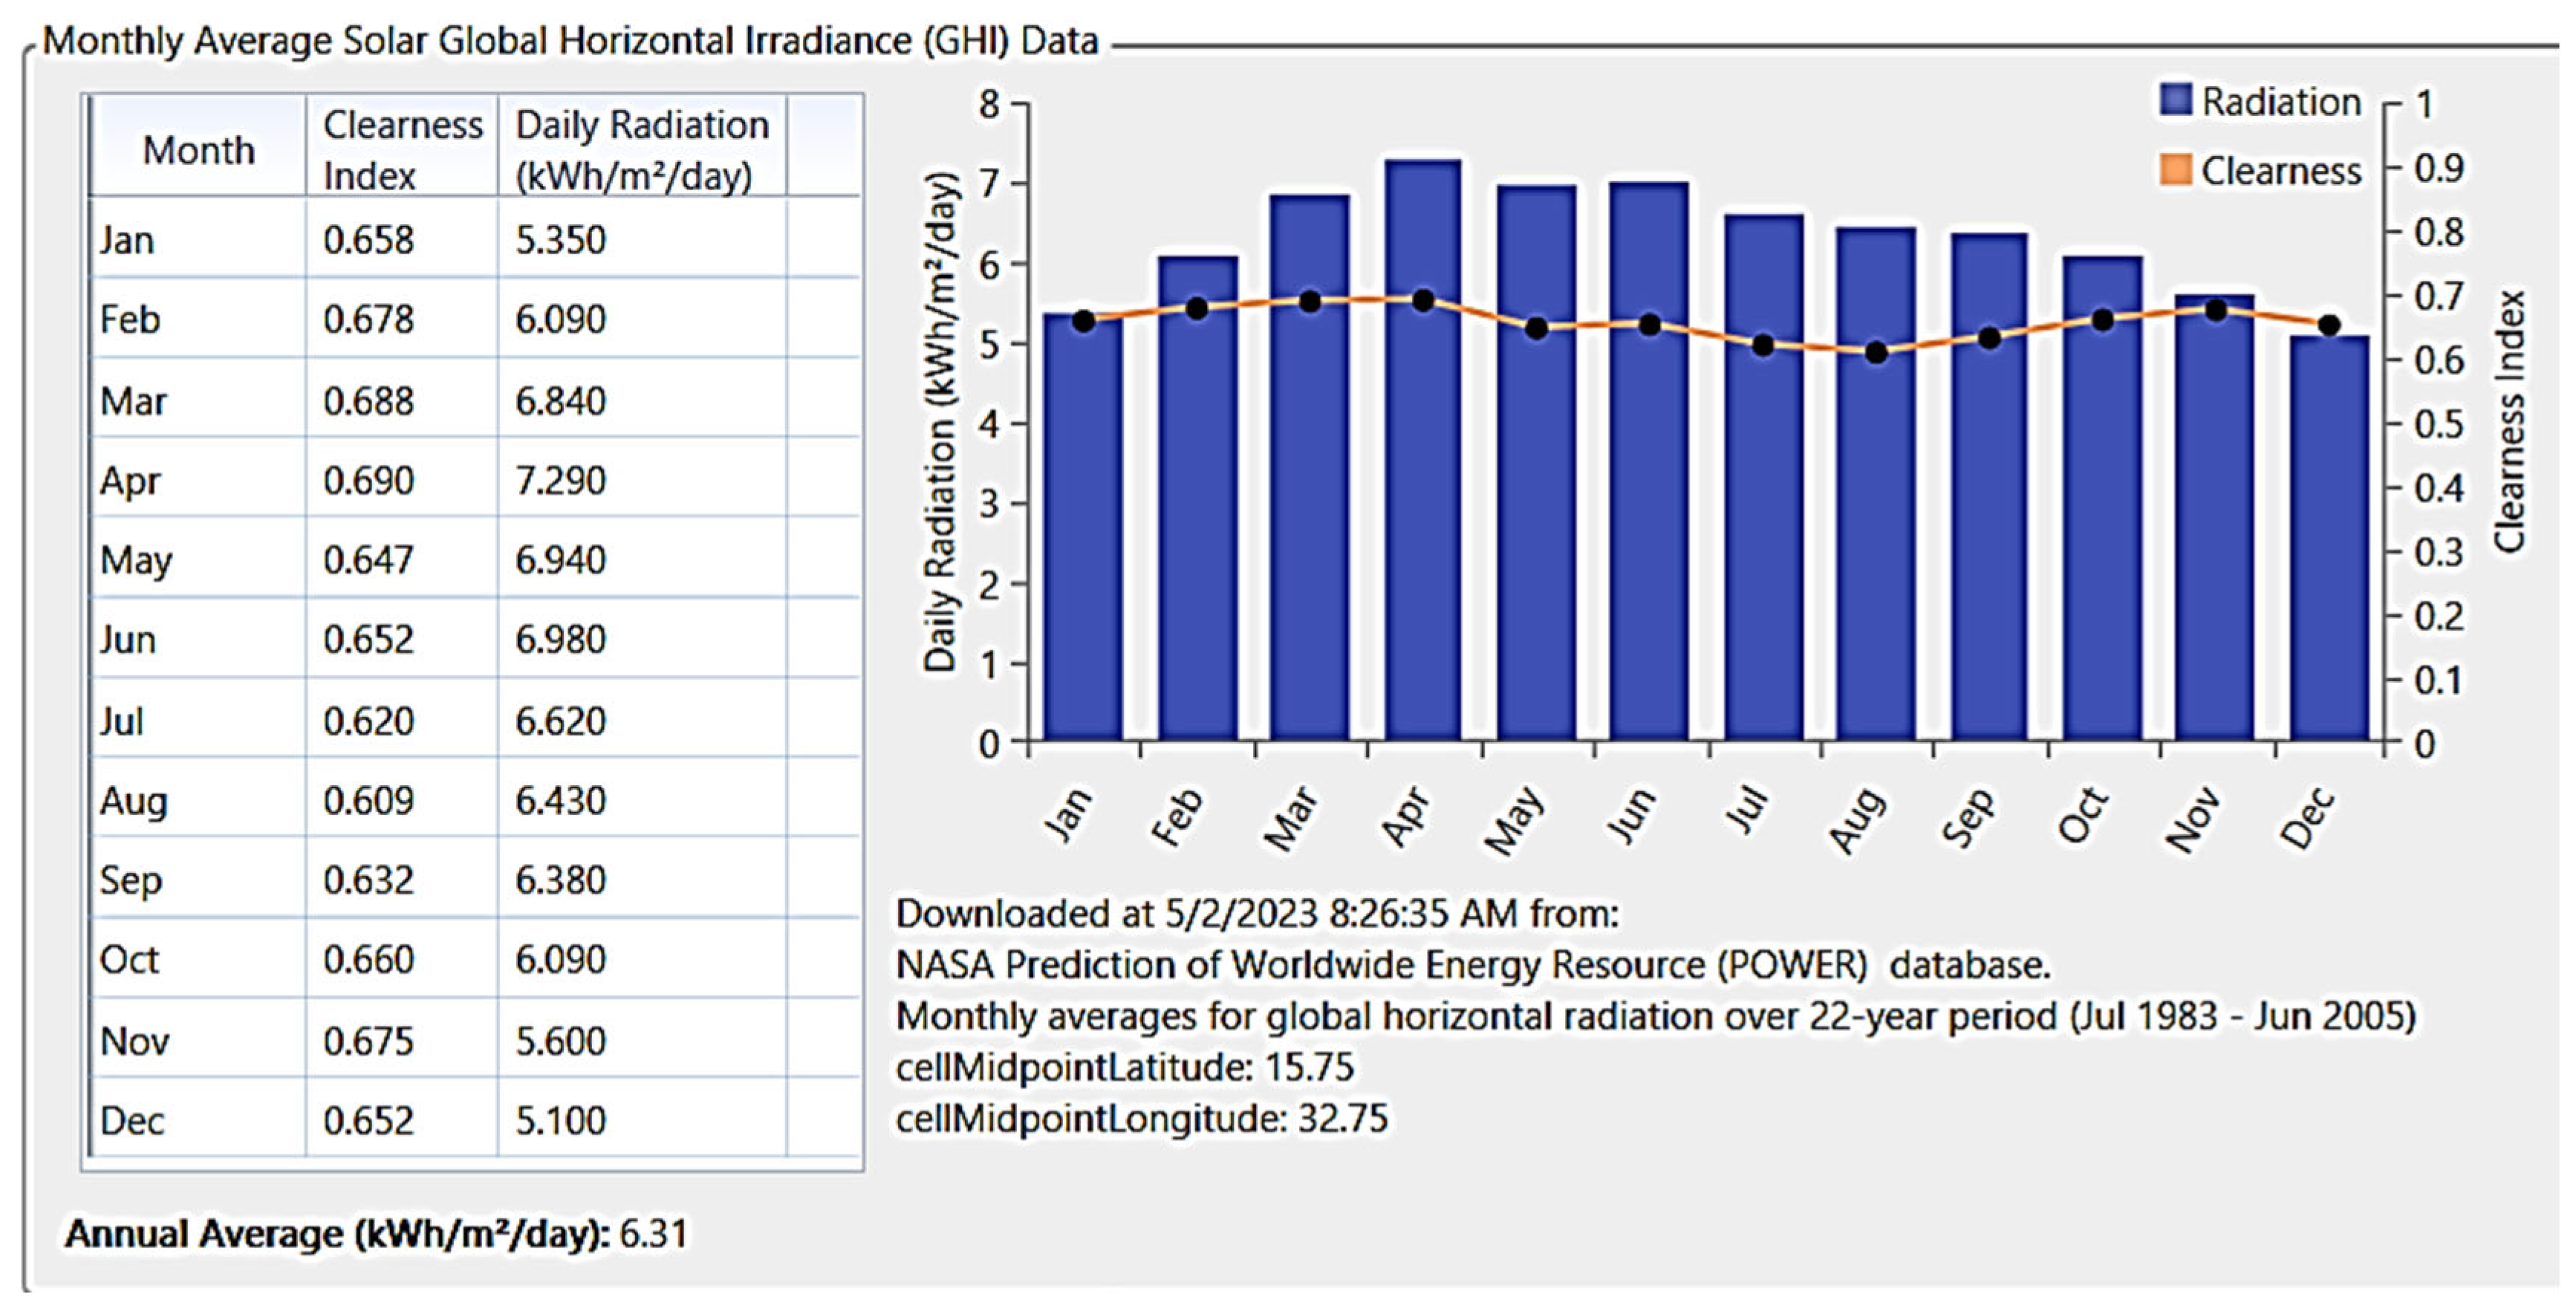
Error! Reference source not found. presents the monthly average solar global horizontal irradiation data. This data provides insights into the amount of solar radiation received on a horizontal surface over the course of each month. The values are typically measured in units (kWh/m²/day).
Figure 9.
Monthly Average Temperature Data of the system.
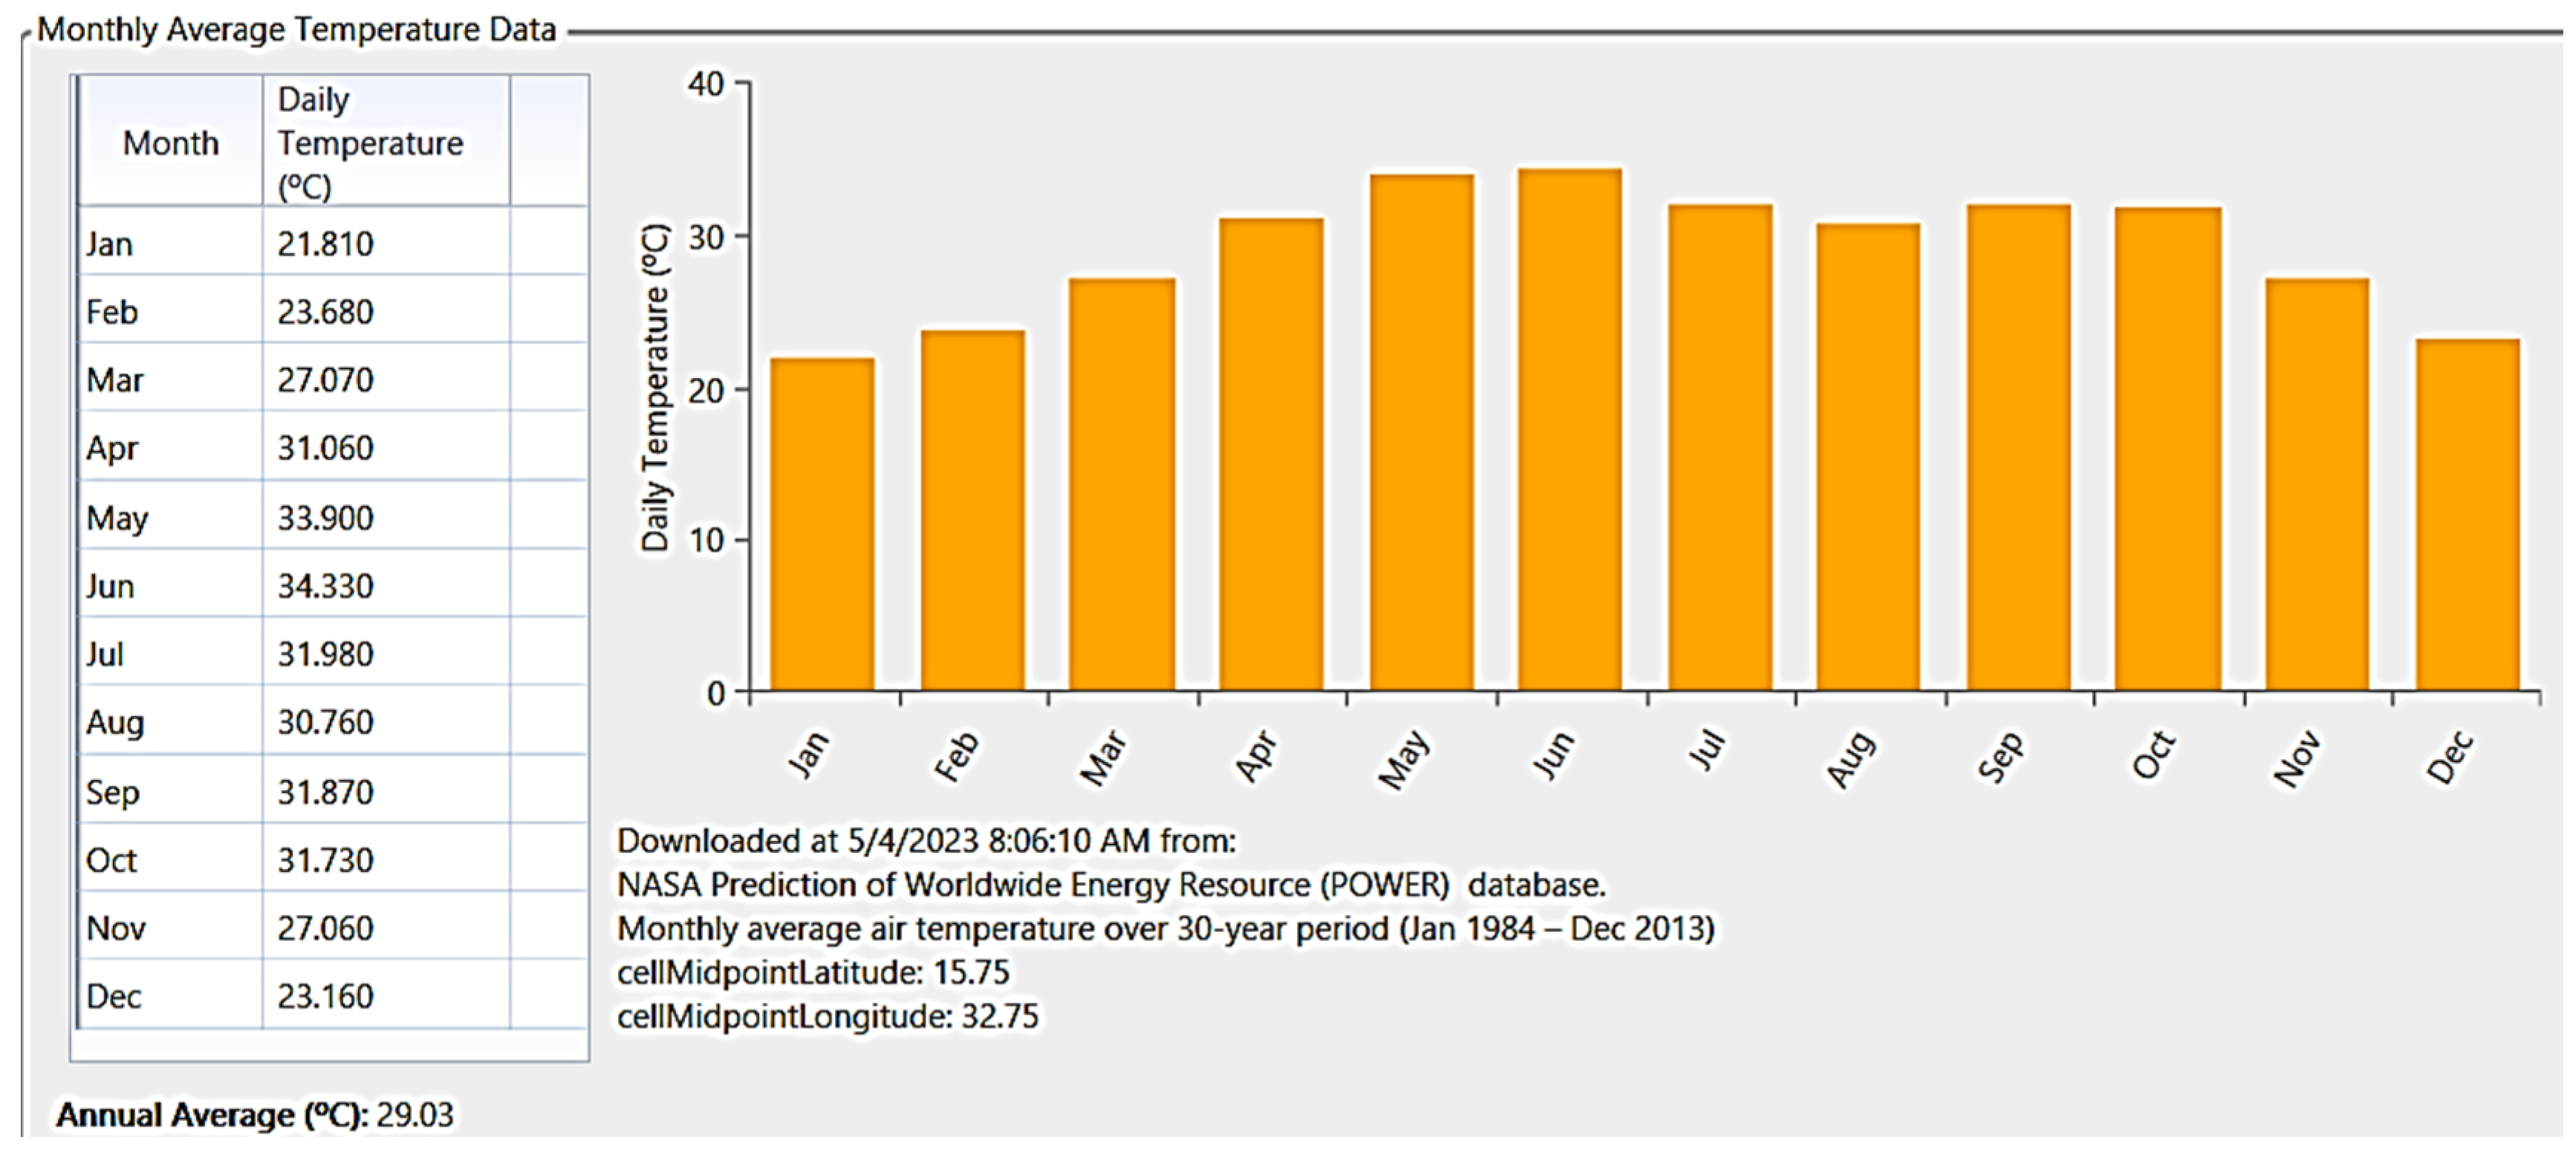
Error! Reference source not found. presents the monthly average temperature data. This data provides insights into the average temperature recorded for each month over a certain period, typically measured in degrees Celsius.
The software has simulated and optimized the five different configurations of the hybrid power system that are designed.
5.4. The First Configuration
In this configuration, solar panels generate daytime electricity for the village and charge batteries. At night, batteries power lights and appliances. With a COE of $0.673 per kWh and an NPC of $1.58 million, the system prioritizes sustainability by emitting no carbon. While the COE is relatively high, the NPC suggests a significant upfront investment, potentially leading to long-term cost-effectiveness. Striking a balance between financial viability and environmental impact is essential for a reliable and cost-effective power solution [17].
Figure 10 displays the outcomes of a simulation conducted on the converter, likely showcasing various performance metrics, efficiency levels, and other relevant data obtained through the simulation process. Displays the outcomes of a simulation conducted on the converter, showcasing various performance metrics, efficiency levels, and other relevant data obtained through the simulation process [30].
Table 10.
Specification of converter.
| Quantity | Inverter | Rectifier |
| Capacity | 35 kW | 35 kW |
| Mean output | 11.8 kW | 0 kW |
| Minimum output | 0 kW | 0 kW |
| Maximum output | 35.5 kW | 0 kW |
| Energy in | 109.172 kWh/Year | 0 kWh/Year |
| Energy out | 103.713 kWh/Year | 0 kWh/Year |
| Hours of operation | 8629 Hrs/Year | 0 Hrs/Year |
Based on the provided results in Error! Reference source not found. and Error! Reference source not found. we can conclude:
Capacity: The capacity of both the inverter and rectifier is 35kW. This indicates the maximum power they can handle.
Mean output: The mean output of the inverter is 11.8kW, while the rectifier does not provide any output.
Minimum output: Both the inverter and rectifier show a minimum output of 0kW.
Maximum output: The inverter's maximum output is 35.5kW, while the rectifier still shows 0kW. The inverter can generate up to its maximum capacity.
Energy in: The energy input is given as 109.172kWh per year. It indicates the amount of energy consumed by the system, possibly in the form of electricity supplied to the inverter and rectifier.
Energy out: The energy output is mentioned as 103.713kWh per year, it represents the amount of energy produced or delivered by the system.
Hours of operation: The system appears to operate for 8629 hours per year. This indicates the total duration of operation for both the inverter and rectifier [31].
Figure 11 provides a visual representation of the status of battery charging. This Figure likely includes information such as battery charge level, charging progress, and other associated indicators [32].
Table 11.
Specification of Batteries.
| Quantity | Value | Units |
| Bus voltage | 24 | V |
| Nominal capacity | 1613 | kW/h |
| Energy in | 37363 | kWh/Year |
| Energy out | 36706 | kWh/Year |
| Operation hours | 8473 | Hours |
From the results in Error! Reference source not found. and Error! Reference source not found. we can conclude:
The bus voltage is indicated to be 24 V.
The nominal capacity is defined as 1613 kW/h, representing the maximum capacity of the system's energy storage batteries.
The energy input is documented as 37363 kWh/year, reflecting the total energy consumed throughout the year.
The energy output is declared as 36706 kWh/year, representing the total energy delivered by the system over the year.
The system has been operational for 8473 hours.
Figure 12 depicts the annual performance of PV panels, showcasing their output or energy production throughout the year. Figure 12 presents data on the variation in solar energy generation across different seasons and months.
Table 12.
Specification of PV Panels.
| Quantity | Value | Quantity | Value |
| Rated capacity | 58.8 kW | Maximum output | 57.3 kW |
| Mean output | 307 kWh/day | PV penetration | 106 % |
| Total production | 112.017 kWh/Year | Hours of operations | Hours/Year |
| Minimum output | 0 kW |
From the results provided in Error! Reference source not found. and Error! Reference source not found. we can conclude: The rated capacity is specified as 58.8 kW. This indicates the maximum power output or capacity of the system, typically associated with a solar photovoltaic (PV) installation.
The mean output is mentioned as 307 kWh per day. This represents the average energy output of the system over a day. It indicates the amount of energy generated by the PV installation on average.
The total production is stated as 112017 kWh per year. This value represents the overall energy output of the system over the course of a year.
The minimum output is given as 0 kW.
The maximum output is mentioned as 57.3 kW. This represents the peak power output that the system can achieve.
The PV penetration is stated as 106%.
The system has operated for 4361 hours in a year. This indicates the total duration of operation over the given period [34].
5.5. The Second Configuration
It is a hybrid power system that uses solar panels during the day and a diesel generator at night to provide power to the village. During the day, the solar panels generate electricity from the sun and power the village. At night, when the solar panels are not generating electricity, the diesel generator starts up and provides the energy needed to keep the lights on and run other electrical appliances.
In this scenario, the fact that there are carbon emissions associated with the system would be a disadvantage compared to the first option, which utilizes renewable energy sources and does not produce any carbon emissions. The COE value of $0.935 per kWh and NPC of $3.51 million would still be relevant for this option, but the carbon emissions should also be taken into consideration when evaluating the overall environmental impact of the system [35].
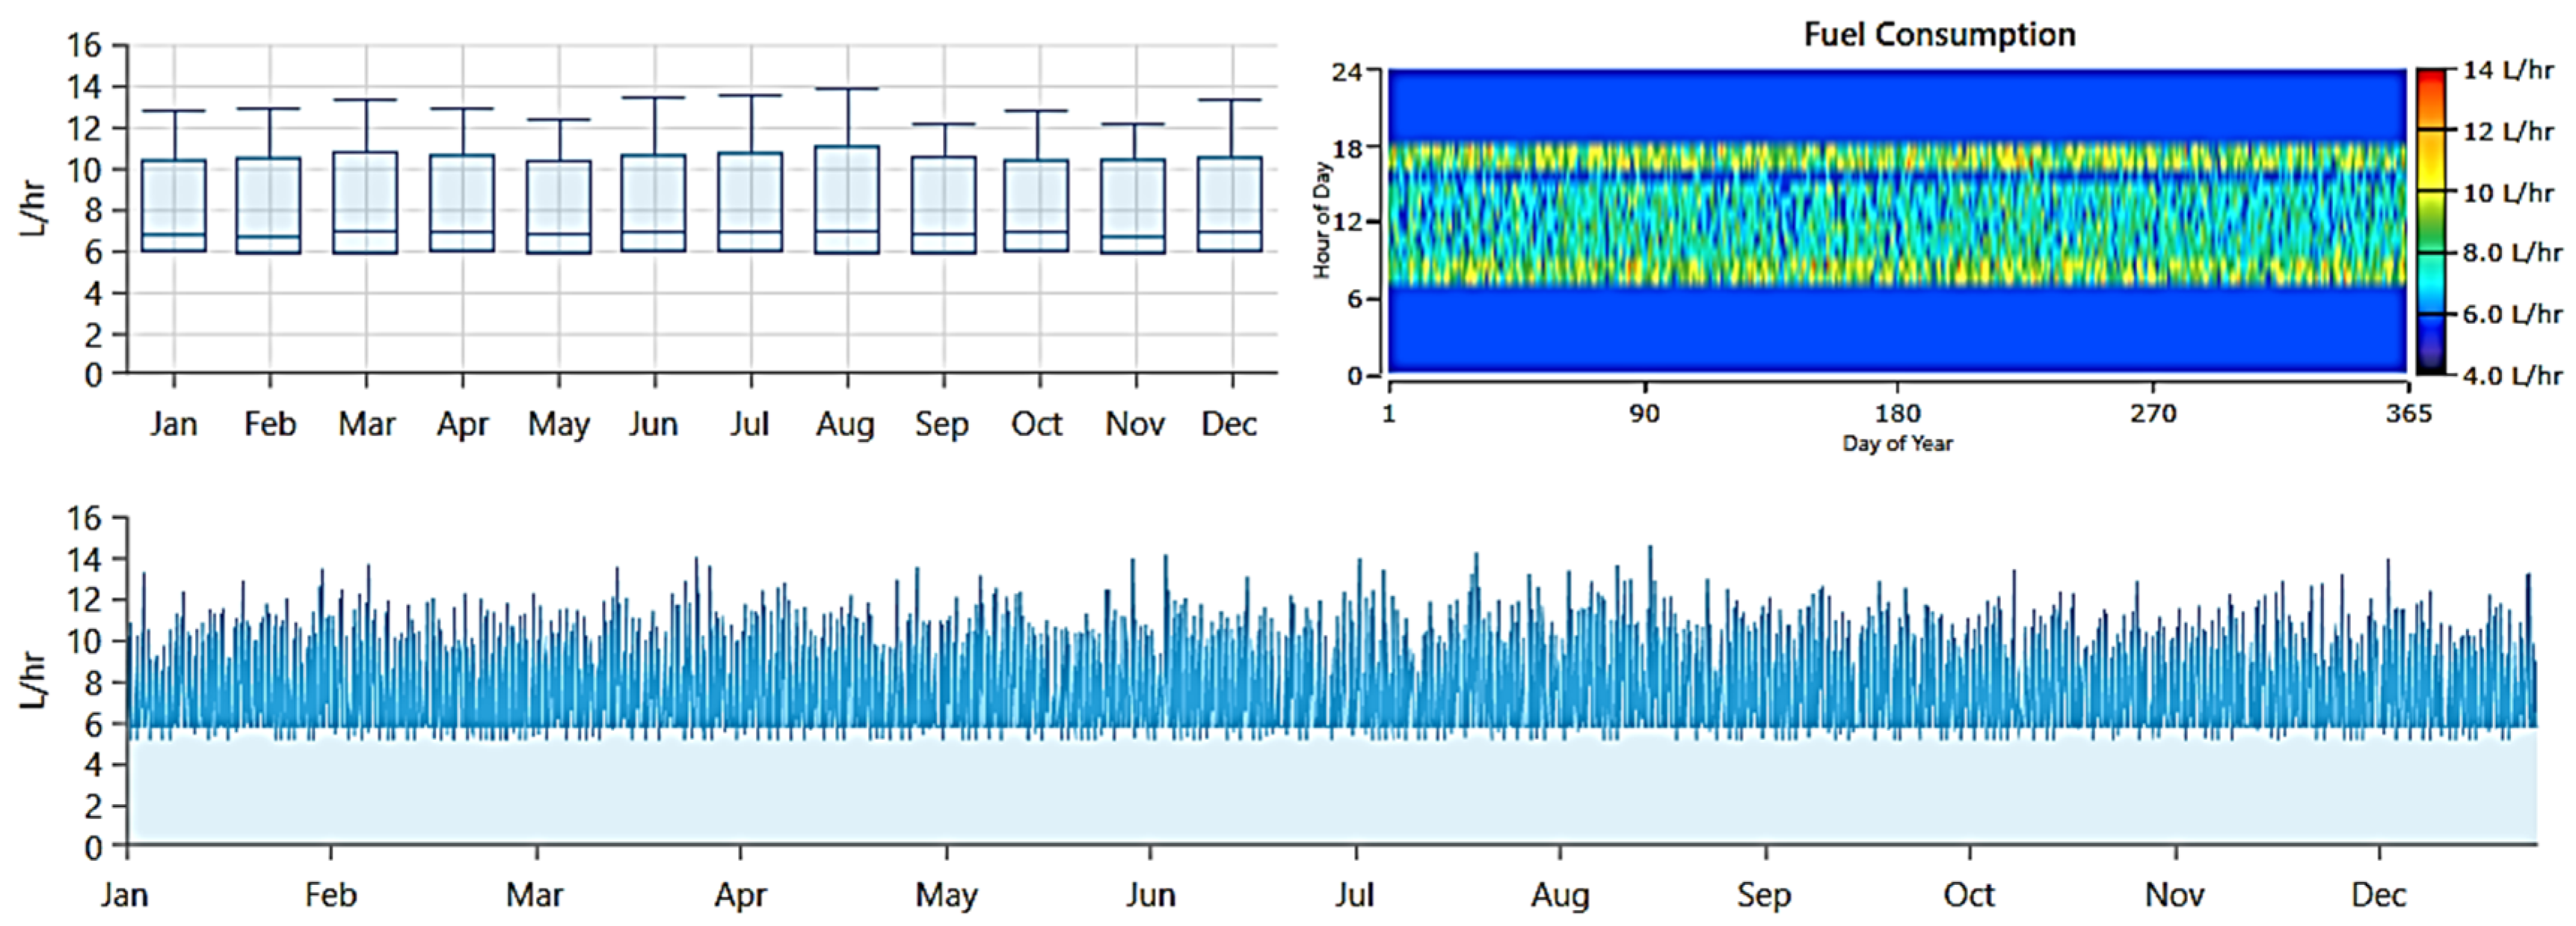
Figure 13 offers a concise overview of fuel consumption, potentially detailing usage patterns, total consumption, and other relevant metrics related to fuel usage.
Table 13.
Specification of fuel.
| Quantity | Value | Units |
| Total fuel consumed | 59780 | L |
| Avg. fuel per day | 164 | L/day |
| Avg. fuel per hours | 6.82 | L/hours |
Based on the data presented in Error! Reference source not found. and the information depicted in Error! Reference source not found., we can draw conclusions:
The total fuel consumed is stated as 59780 liters. This represents the overall amount of fuel that has been consumed over a given period.
The average fuel consumption per day is mentioned as 164 liters/day. This value indicates the average amount of fuel consumed daily.
The average fuel consumption per hour is stated as 6.82 liters/hour. This Figure represents the average rate at which fuel is consumed within a single hour.
The provided quantities and units describe the fuel consumption of a system. It provides insights into the total fuel consumed, as well as the average fuel consumption per day and per hour. These metrics can be helpful in evaluating fuel efficiency, estimating fuel costs, or analyzing the performance of the system or machinery in terms of fuel utilization [36].
5.6. The Third Configuration
In this configuration, batteries and a diesel generator provide village power. Batteries charge during the day with diesel, ensuring reliable electricity. While emitting fewer carbon emissions than a primary generator, it relies on diesel, making it less environmentally friendly than solar-based options. The COE is 0.952$ per kWh, lower than the second option. The NPC is $3.83 million, higher than the first but lower than the second option. Factors like fuel cost, generator efficiency, battery capacity, and electricity demand impact the financial and environmental aspects, necessitating careful consideration for the most suitable option [37].
Figure 14 visually represents the ongoing process of battery charging, offering insights into the current state of charge, charging progress, and another associated indicator.
Table 14.
Specification of Batteries.
| Quantity | Value |
| Batteries | 88 Qty |
| Bus voltage | 24 V |
| Nominal capacity | 23654 kW/h |
| Energy in | 72823 kWh/Year |
| Energy out | 70821 kWh/Year |
| Operation hours | 8760 Hours |
Based on the data presented in Error! Reference source not found. and the information depicted in Error! Reference source not found., we can draw conclusions:
The system utilizes a total of 88 batteries.
The nominal capacity is specified as 23654 kW/h, denoting the maximum capacity of the system or the energy storage capacity of the batteries.
The energy input is documented as 72823 kWh/year, reflecting the total energy consumed or supplied to the system throughout the year.
The energy output is indicated as 70821 kWh/year, representing the total energy generated or delivered by the system during the year.
The system has been in operation for 8760 hours, representing the total duration of operation over a given period [38].
Figure 15 provides a visual representation of the output performance of the converter. Figure 15 likely includes data on voltage, current, power, efficiency, and other relevant parameters, offering insights into the overall performance of the converter under various operating conditions [39].
Table 15.
Specification of converter.
| Quantity | Inverter | Rectifier | Units |
| Capacity power | 53 | 53 | kW |
| Mean output Power | 9.48 | 8.31 | kW |
| Minimum output Power | 0 | 0 | kW |
| Maximum output Power | 47.7 | 50 | kW |
| Energy in | 87450 | 76656 | kWh/Year |
| Energy out | 83078 | 72823 | kWh/Year |
We can derive conclusions from the data provided in Error! Reference source not found. and the insights portrayed in Error! Reference source not found..
The capacity of both the inverter and rectifier is 53 kW. This indicates the maximum power they can handle.
The mean output of the inverter is 9.48 kW, while the mean output of the rectifier is 8.31 kW.
Both the inverter and rectifier show a minimum output of 0 kW.
The inverter's maximum output is 47.7 kW, while the rectifier's maximum output is 50 kW. These values represent the peak power outputs that the components can achieve.
The energy input for the inverter is stated as 87450 kWh/year, while the rectifier's energy input is 76656 kWh/year. These values indicate the total amount of energy consumed by each component over the course of a year.
The energy output for the inverter is given as 83078 kWh/year, while the rectifier's energy output is 72823 kWh/year. These values represent the total amount of energy produced or delivered by each component over the course of a year [40].
Figure 16 provides an overview of the performance of the fuel, presenting data on parameters such as consumption rate, efficiency, emissions, and other relevant metrics related to the operation or utilization of the fuel source [41].
Table 16.
Specification of fuel.
| Quantity | Value | Units |
| Total fuel consumed | 28470 | L |
| Avg. fuel per day | 78 | L/day |
| Avg. fuel per hours | 3.25 | L/hours |
Conclusions can be drawn from the data in Error! Reference source not found. and the details illustrated in Error! Reference source not found..
The total fuel consumed is stated as 28470 liters. This value represents the overall amount of fuel that has been consumed over a given period.
The average fuel consumption per day is mentioned as 78 liters/day. This value indicates the average amount of fuel consumed daily.
The average fuel consumption per hour is stated as 3.25 liters/hour. Figure 16 represents the average rate at which fuel is consumed within a single hour.
The provided quantities and units describe the fuel consumption of a system, vehicle, or machinery. It provides insights into the total fuel consumed, as well as the average fuel consumption per day and per hour. These metrics are helpful in evaluating fuel efficiency, estimating fuel costs, or analyzing the performance of the system or machinery in terms of fuel utilization [42].
5.7. The Fourth Configuration
This hybrid power system combines solar panels, batteries, and a diesel generator for reliable and sustainable electricity in the village. Solar panels generate daytime electricity and charge batteries for nighttime use. A diesel generator serves as backup, auto-sized based on demand for efficiency. This balance of renewable and backup power minimizes carbon emissions, with a COE of 0.912$ per kWh and an NPC of 3.62$ million. Although requiring a larger initial investment, the long-term cost-effectiveness and reduced reliance on diesel make it an environmentally friendly and reliable option [43].
Table 17.
Specification of PV Panels.
| Quantity | Value | Units |
| Rated Power capacity | 58.8 | kW |
| Mean energy output | 291 | kWh/day |
| Total energy production | 106177 | kWh/Year |
| Minimum output Power | 0 | kW |
| Maximum output Power | 54.3 | kW |
| PV penetration | 100 | % |
| Hours of operations | 4361 | Hours/Year |
The specifications of the PV panels listed in Error! Reference source not found. include a rated capacity of 58.8 kW, with mean daily output reaching 291 kWh and total yearly production amounting to 106177 kWh, alongside a minimum output of 0 kW and a maximum output Power is 54.3 kW, achieving full PV penetration at 100%, operating for 4361 hours per year.
Figure 17 Illustrates the output of a photovoltaic (PV) panel over the course of a year, depicting variations in power generation influenced by factors such as solar irradiance, temperature, and daylight hours, which are crucial for understanding the performance and efficiency of solar energy systems.
5.8. The Fifth Configuration
Using only a diesel generator for power is not recommended due to its environmental impact, high operating costs, and lack of sustainability. Relying solely on non-renewable energy sources contributes to pollution and climate change. Diesel generators are noisy, emit pollutants, and require frequent maintenance. Fluctuating fuel costs make long-term predictions challenging, especially for financially limited villages. This option has a high COE of 0.986 USD and NPC of 3.91 million USD, making it less economical and environmentally friendly compared to options incorporating renewable energy sources.
Table 18.
Gas Emissions.
| Quantity | Value | Units |
| Carbon Dioxide | 156798 | kg/year |
| Carbon monoxide | 988 | kg/year |
| Unburned Hydrocarbons | 43.1 | kg/year |
| Particulate Matter | 599 | kg/year |
| Sulfur Dioxide | 384 | kg/year |
| Nitrogen Oxide | 928 | kg/year |
Shows the amount of carbon dioxide emitted is stated as 156798 kg/year. Carbon dioxide is a greenhouse gas primarily associated with the burning of fossil fuels. It is a major contributor to climate change.
The amount of carbon monoxide emitted is mentioned as 988 kg/year. Carbon monoxide is a toxic gas produced by incomplete combustion of carbon-based fuels. It is harmful to human health and can contribute to air pollution.
The quantity of unburned hydrocarbons emitted is provided as 43.1 kg/year. Unburned hydrocarbons are volatile organic compounds (VOCs) that are released during combustion processes. They can contribute to the formation of ground-level ozone and air pollution.
The amount of particulate matter emitted is stated as 5.99 kg/year. Particulate matter consists of solid or liquid particles suspended in the air. It includes fine particles (PM2.5) and coarse particles (PM10), which can have adverse effects on human health and contribute to air pollution [44].
The quantity of sulfur dioxide emitted is mentioned as 384 kg/year. Sulfur dioxide is a gas released during the combustion of fossil fuels, particularly those containing sulfur. It can contribute to respiratory issues, acid rain, and air pollution.
The amount of nitrogen oxide emitted is provided as 928 kg/year. Nitrogen oxides are produced during the combustion of fossil fuels and contribute to air pollution. They can react with other compounds in the atmosphere to form smog and contribute to the formation of acid rain.
Table 19 Represent the total fuel consumed is stated as 59901 liters. This value represents the overall amount of fuel that has been consumed over a given period.
The average fuel consumption per day is mentioned as 164 liters/day. This value indicates the average amount of fuel consumed daily.
Figure 18.
Fuel performance.
Error! Reference source not found. illustrates the performance of a fuel system over a certain period, providing insights into factors such as fuel consumption, efficiency, and emissions, which are essential for evaluating the effectiveness and sustainability of the fuel system.
The average fuel consumption per hour is stated as 6.84 liters/hour. Error! Reference source not found. represents the average rate at which fuel is consumed within a single hour of the generator output in one year.
Figure 19.
Generator output.
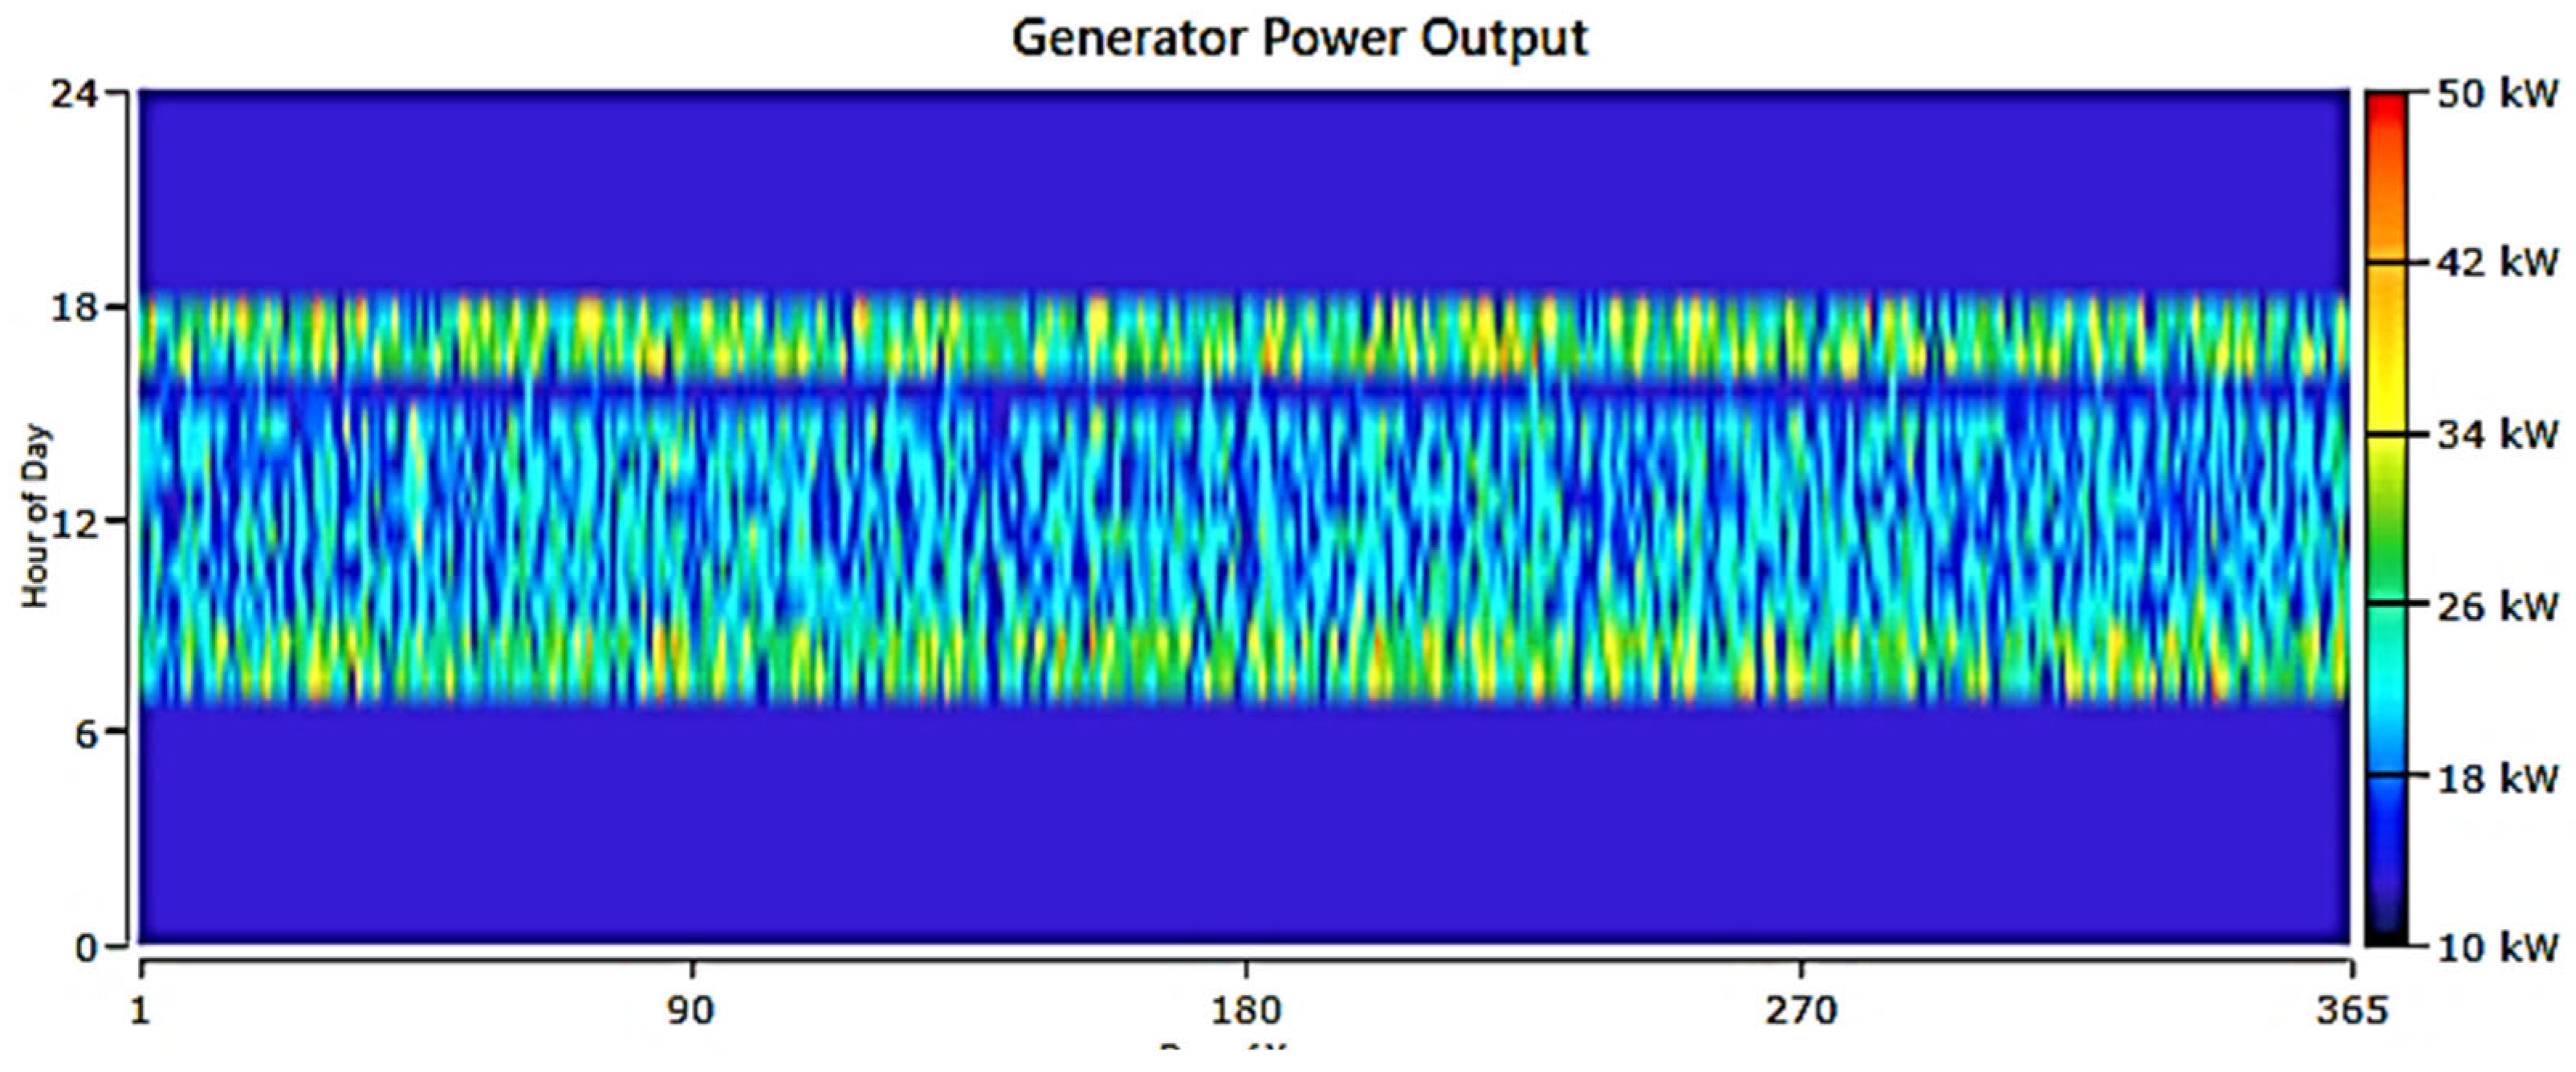
The evaluation using Homer software explored five options for village power. The most cost-effective and eco-friendly was the first option: a PV system with battery backup. However, the fourth option, combining PV panels and battery backup with diesel, also proved viable for emergency power. Other options had high costs or emissions. In our MATLAB code, parameters like energy demand and PV panel area were calculated. Costs for components like PV panels and batteries were factored in. Results showed a daily energy demand of 589.50 kWh, yearly demand of 215167.50 kWh, and system cost of 113500.00 USD. Solar energy emerged as a sustainable and cost-effective solution.
6. Conclusions
Our evaluation explored five distinct power generation options for a village, leveraging the capabilities of Homer software to assess feasibility. Among these alternatives, the standout choice was a photovoltaic (PV) system with battery backup—an option that proved to be both the most cost-effective and environmentally sustainable. As a secondary measure, the fourth option, which integrates PV panels, battery storage, and diesel backup, was identified as a reliable contingency plan, particularly in emergency situations. In contrast, the remaining options were marred by prohibitively high operational costs, excessive carbon emissions, or both, making them far less viable.
The study begins by analyzing the load demand distribution across day and night periods, with maximum daytime consumption recorded at 57.860 kWh and total daily usage of 509.040 kWh, while nighttime consumption peaks at 11.060 kWh with a total of 80.460 kWh. Detailed hourly consumption patterns are presented for various village components, including residential, water pumping, street lighting, medical facilities, and a supermarket, offering a granular view of energy use. To address the village’s energy requirements sustainably, a photovoltaic (PV) system with a capacity of 60 kW is proposed, supplemented by a solar thermal water heating system designed to meet hot water demands efficiently
To further refine our analysis, we developed a MATLAB Code to designed to calculate key parameters, including annual energy demand, required PV panel area, battery storage capacity, total system cost, and energy cost per kilowatt-hour (kWh). The model operated under predefined assumptions about solar radiation and daily energy consumption, ensuring accurate estimations. Additionally, it accounted for the costs associated with core components PV panels, batteries, and inverters—allowing for a precise breakdown of overall system expenditure and energy costs.
MATLAB calculations yielded illuminating insights. The village’s daily energy demand was estimated at 589.50 kWh, leading to an annual requirement of 215167.50 kWh. To meet this demand, the system would necessitate 34.6 m² of PV panel area, alongside a battery storage capacity of 6900 kWh. This setup would require 72 batteries to ensure uninterrupted operation. The total system cost was estimated at $113500, with an energy cost of $0.671 per kWh. Furthermore, the projected annual energy output stood at 12113.29 MWh, reinforcing the feasibility of the PV-based system.
Upon reviewing these findings, it became clear that the optimal solution for cost efficiency and sustainability is a combination of PV electricity generation and solar thermal panels for hot water supply. This hybrid configuration significantly reduces maintenance demands while maximizing energy output. The estimated initial investment for such a PVT system is $15500, providing enough hot water for the entire village alongside a power output of 7.75 kW. By supplementing this system with an additional 22.5 kW from conventional PV panels at an added cost of approximately $23000 the overall energy production capacity can be further enhanced.
This analysis highlights the clear advantages of solar energy, particularly when compared to hybrid or diesel-based alternatives. PV systems, coupled with solar thermal technology, not only offer lower operational costs and reduced maintenance requirements but also benefit from declining initial costs. In contrast, diesel-powered solutions face mounting challenges due to rising fuel costs, transportation logistics, and their negative environmental impact.
Ultimately, these findings underscore the viability of solar energy as a clean, sustainable, and economically sound alternative. With substantial cost savings, minimal environmental impact, and long-term reliability, solar energy emerges as the ideal solution for powering rural communities, ensuring a greener and more financially sustainable future.
Author Contributions
All authors contributed equally to the creation of the article. All authors have read and agreed to the published version of the manuscript.
Funding
This work was supported by a grant from the Ministry of Research, Innovation and Digitalization, project number PNRR-C9-I8-760111/23.05.2023, code CF48/14.11.2022. And project number PNRR-C9-I8-760089/23.05.2023, COD CF 31/14.11.2022
Institutional Review Board Statement
Not applicable.
Informed Consent Statement
Not applicable.
Data Availability Statement
Not applicable.
Conflicts of Interest
The authors declare no conflict of interest.
References
- Gmal Osman, M.; Strejoiu, CV.; Panait, C.; Lazaroiu, G.; Lazaroiu, A.C. Renewable energy integration, climate analysis, and efficiency optimization for greener transportation - case study in Dobrogea. International Multidisciplinary Scientific GeoConference-SGEM; 2023; (pp. 675-687).
- Chow, T.T. 2018. A review on photovoltaic/thermal hybrid solar technology. Renewable Energy, pp. Vol4_88-Vol4_119.
- Kane, M.; Larrain, D.; Favrat, D.; Allani, Y. Small hybrid solar power system. Energy 2003, 28, 1427–1443. [Google Scholar] [CrossRef]
- Badwawi, R.A.; Abusara, M.; Mallick, T. A review of hybrid solar PV and wind energy system. Smart Science 2015, 3, 127–138. [Google Scholar] [CrossRef]
- Moulé, A.J.; Chang, L.; Thambidurai, C.; Vidu, R.; Stroeve, P. Hybrid solar cells: basic principles and the role of ligands. Journal of Materials Chemistry 2012, 22, 2351–2368. [Google Scholar] [CrossRef]
- Brahim, T.; Jemni, A. Economical assessment and applications of photovoltaic/thermal hybrid solar technology: A review. solar Energy 2017, 153, 540–561. [Google Scholar] [CrossRef]
- Strejoiu, C.V.; Osman, M.G.; Cernat, A.C. Towards sustainable transportation: modeling and simulation of pv panel implementation on national highways for charging electric vehicles which leads to mitigate carbon emission. UPB Scientific Bulletin, Series C: Electrical Engineering and Computer Science 2023, 85, 321–334. [Google Scholar]
- Vorobiev, Y.; González-Hernández, J.; Vorobiev, P.; Bulat, L. Thermal-photovoltaic solar hybrid system for efficient solar energy conversion. Solar energy 2006, 80, 170–176. [Google Scholar] [CrossRef]
- Lau, D.; Song, N.; Hall, C.; Jiang, Y.; Lim, S.; Perez-Wurfl, I.; Ouyang, Z.; Lennon, A. Hybrid solar energy harvesting and storage devices: The promises and challenges. Materials Today Energy 2019, 13, 22–44. [Google Scholar] [CrossRef]
- Sheu, E.J.; Mitsos, A.; Eter, A.A.; Mokheimer, E.M.; Habib, M.A.; Al-Qutub, A. A review of hybrid solar–fossil fuel power generation systems and performance metrics. Journal of solar energy engineering 2012, 134, 041006.
- Zhou, W.; Lou, C.; Li, Z.; Lu, L.; Yang, H. Current status of research on optimum sizing of stand-alone hybrid solar–wind power generation systems. Applied energy 2010, 87, 380–389. [Google Scholar] [CrossRef]
- Ju, X.; Xu, C.; Hu, Y.; Han, X.; Wei, G.; Du, X. A review on the development of photovoltaic/concentrated solar power (PV-CSP) hybrid systems. Solar Energy Materials and Solar Cells 2017, 161, 305–327. [Google Scholar] [CrossRef]
- Zhengshan, J.Y.; Fisher, K.C.; Wheelwright, B.M.; Angel, R.P.; Holman, Z.C. PVMirror: a new concept for tandem solar cells and hybrid solar converters. IEEE Journal of Photovoltaics 2015, 5, 1791–1799. [Google Scholar] [CrossRef]
- Osman, M.G.; Strejoiu, C.V.; Panait, C.; Lazaroiu, G.; Lazaroiu, A.C. 2023. Renewable energy integration, climate analysis, and efficiency optimization for greener transportation-case study in Dobrogea. International Multidisciplinary Scientific GeoConference: SGEM, 23(6.2), pp.675-687.
- Amer, B.M.A.; Hossain, M.A.; Gottschalk, K. Design and performance evaluation of a new hybrid solar dryer for banana. Energy conversion and management 2010, 51, 813–820. [Google Scholar] [CrossRef]
- Bahramara, S.; Moghaddam, M.P.; Haghifam, M.R. Optimal planning of hybrid renewable energy systems using HOMER: A review. Renewable and Sustainable Energy Reviews 2016, 62, 609–620. [Google Scholar] [CrossRef]
- Ajao, K.R.; Oladosu, O.A.; Popoola, O.T. Using HOMER power optimization software for cost benefit analysis of hybrid-solar power generation relative to utility cost in Nigeria. International Journal of Research and Reviews in Applied Sciences 2011, 7, 96–102. [Google Scholar]
- Ekren, O.; Canbaz, C.H.; Güvel, Ç.B. Sizing of a solar-wind hybrid electric vehicle charging station by using HOMER software. Journal of Cleaner Production 2021, 279, 123615. [Google Scholar] [CrossRef]
- Osman, M.G.; Ciupagenau, D.A.; Lazaroiu, G.; Pisa, I. 2022, September. Increasing Renewable Energy Participation in Sudan. In 2022 11th International Conference on Renewable Energy Research and Application (ICRERA) (pp. 169-173). IEEE. [CrossRef]
- Barsoum, N.; Petrus, P.D. Cost optimization of hybrid solar, micro-hydro and hydrogen fuel cell using homer software. Energy and Power Engineering 2015, 7, 337. [Google Scholar] [CrossRef]
- Okedu, K.E.; Uhunmwangho, R. Optimization of renewable energy efficiency using HOMER. International Journal of Renewable Energy Research 2014, 4, 421–427. [Google Scholar]
- Khare, V.; Nema, S.; Baredar, P. Optimisation of the hybrid renewable energy system by HOMER, PSO and CPSO for the study area. International Journal of Sustainable Energy 2017, 36, 326–343. [Google Scholar] [CrossRef]
- Mishra, S.; Panigrahi, C.K.; Kothari, D.P. Design and simulation of a solar–wind–biogas hybrid system architecture using HOMER in India. International Journal of Ambient Energy 2016, 37, 184–191. [Google Scholar] [CrossRef]
- Osman, M.G.; Ciupageanu, D.; Stan, A. Analysis of Solar Radiation in Sudan and Optimal Location of Photovoltaic Panels. UPB Sci. Bull. Series C 2022, 84. [Google Scholar]
- Zahboune, H.; Zouggar, S.; Krajacic, G.; Varbanov, P.S.; Elhafyani, M.; Ziani, E. Optimal hybrid renewable energy design in autonomous system using Modified Electric System Cascade Analysis and Homer software. Energy conversion and management 2016, 126, 909–922. [Google Scholar] [CrossRef]
- Khan, A.; Khan, R. 2018, October. Cost optimization of hybrid microgrid using solar PV, fuel cell and diesel generator in HOMER. In 2018 2nd International Conference on Energy Conservation and Efficiency (ICECE) (pp. 14-18). IEEE. [CrossRef]
- Ebrahimi, S.; Jahangiri, M.; Raiesi, H.A.; Ariae, A.R. Optimal planning of on-grid hybrid microgrid for remote island using HOMER software, Kish in Iran. International Journal of Energy 2019, 3, 13–21. [Google Scholar]
- Osman, M.G.; Lazaroiu, G.; Hamad, S.A.; Messaoud, H.; Mohammed, D.; Stoica, D. Analysis of Photovoltaic Systems with Battery Storage, Electric Vehicle Charging, and Smart Energy Management. Sustainability 2025, 17, 3887. [Google Scholar] [CrossRef]
- Shahzad, M.K.; Zahid, A.; ur Rashid, T.; Rehan, M.A.; Ali, M.; Ahmad, M. Techno-economic feasibility analysis of a solar-biomass off grid system for the electrification of remote rural areas in Pakistan using HOMER software. Renewable energy 2017, 106, 264–273. [Google Scholar] [CrossRef]
- Lazaroiu, G.; Gmal Osman, M.; Strejoiu, C.V. Performance Evaluation of Renewable Energy Systems: Photovoltaic, Wind Turbine, Battery Bank, and Hydrogen Storage. Batteries 2023, 9, 468. [Google Scholar] [CrossRef]
- Babatunde, O.M.; Munda, J.L.; Hamam, Y. Hybridized off-grid fuel cell/wind/solar PV/battery for energy generation in a small household: A multi-criteria perspective. International Journal of Hydrogen Energy 2022, 47, 6437–6452. [Google Scholar] [CrossRef]
- Sinha, S.; Chandel, S.S. Review of software tools for hybrid renewable energy systems. Renewable and sustainable energy reviews 2014, 32, 192–205. [Google Scholar] [CrossRef]
- Çetinbaş, İ.; Tamyurek, B.Ü.N.Y.A.M.İ.N.; Demirtaş, M. Design, analysis and optimization of a hybrid microgrid system using HOMER software: Eskisehir osmangazi university example. International Journal of Renewable Energy Development-Ijred 2019, 8. [Google Scholar] [CrossRef]
- Ritu, K.R.; Wadhwani, A.K.; Rajoria, A. 2018, December. Techno-economic comparison of on grid and off grid hybrid WT/solar photo voltaic connected power generating unit using HOMER. In 2018 International Conference on Advanced Computation and Telecommunication (ICACAT) (pp. 1-9). IEEE. [CrossRef]
- Manmadharao, S.; Chaitanya, S.N.V.S.K.; Srinivasarao, G. 2019, March. Design and optimization of grid integrated solar energy system using HOMER GRID software. In 2019 Innovations in Power and Advanced Computing Technologies (i-PACT) (Vol. 1, pp. 1-5). IEEE. [CrossRef]
- Lazaroiu, A.C.; Gmal Osman, M.; Strejoiu, C.V.; Lazaroiu, G. A comprehensive overview of photovoltaic technologies and their efficiency for climate neutrality. Sustainability 2023, 15, 16297. [Google Scholar] [CrossRef]
- Cristian, H.; Bizon, N.; Alexandru, B. 2017, June. Design of hybrid power systems using HOMER simulator for different renewable energy sources. In 2017 9th International Conference on Electronics, Computers and Artificial Intelligence (ECAI) (pp. 1-7). IEEE. [CrossRef]
- Miah, M.S.; Swazal, M.A.M.; Mittro, S.; Islam, M.M. 2020, November. Design of a grid-tied solar plant using homer pro and an optimal home energy management system. In 2020 IEEE International Conference for Innovation in Technology (INOCON) (pp. 1-7). IEEE. [CrossRef]
- El-Maaroufi, A.; Daoudi, M.; Laamara, R.A. Techno-economic analysis of a PV/WT/biomass off-grid hybrid power system for rural electrification in northern Morocco using HOMER. Renewable Energy 2024, 231, 120904. [Google Scholar] [CrossRef]
- Lin, C.E.; Phan, B.C.; Lai, Y.C. 2019, April. Optimal design of hybrid renewable energy system using Homer: A case study in the Philippines. In 2019 SoutheastCon (pp. 1-6). IEEE. [CrossRef]
- Usman, M.; Malik, A.M.; Mahmood, A.; Kousar, A.; Sabeel, K. 2019, June. HOMER analysis for integrating solar energy in off-grid and on-grid SCO telecommunication sites. In 2019 1st Global Power, Energy and Communication Conference (GPECOM) (pp. 270-275). IEEE. [CrossRef]
- Abdelfadeel, D.I.M.G.O.; Științific, C.; LAZAROIU, G. Rezumatul Tezei de Doctorat.
Figure 1.
Flow chart of PV system.
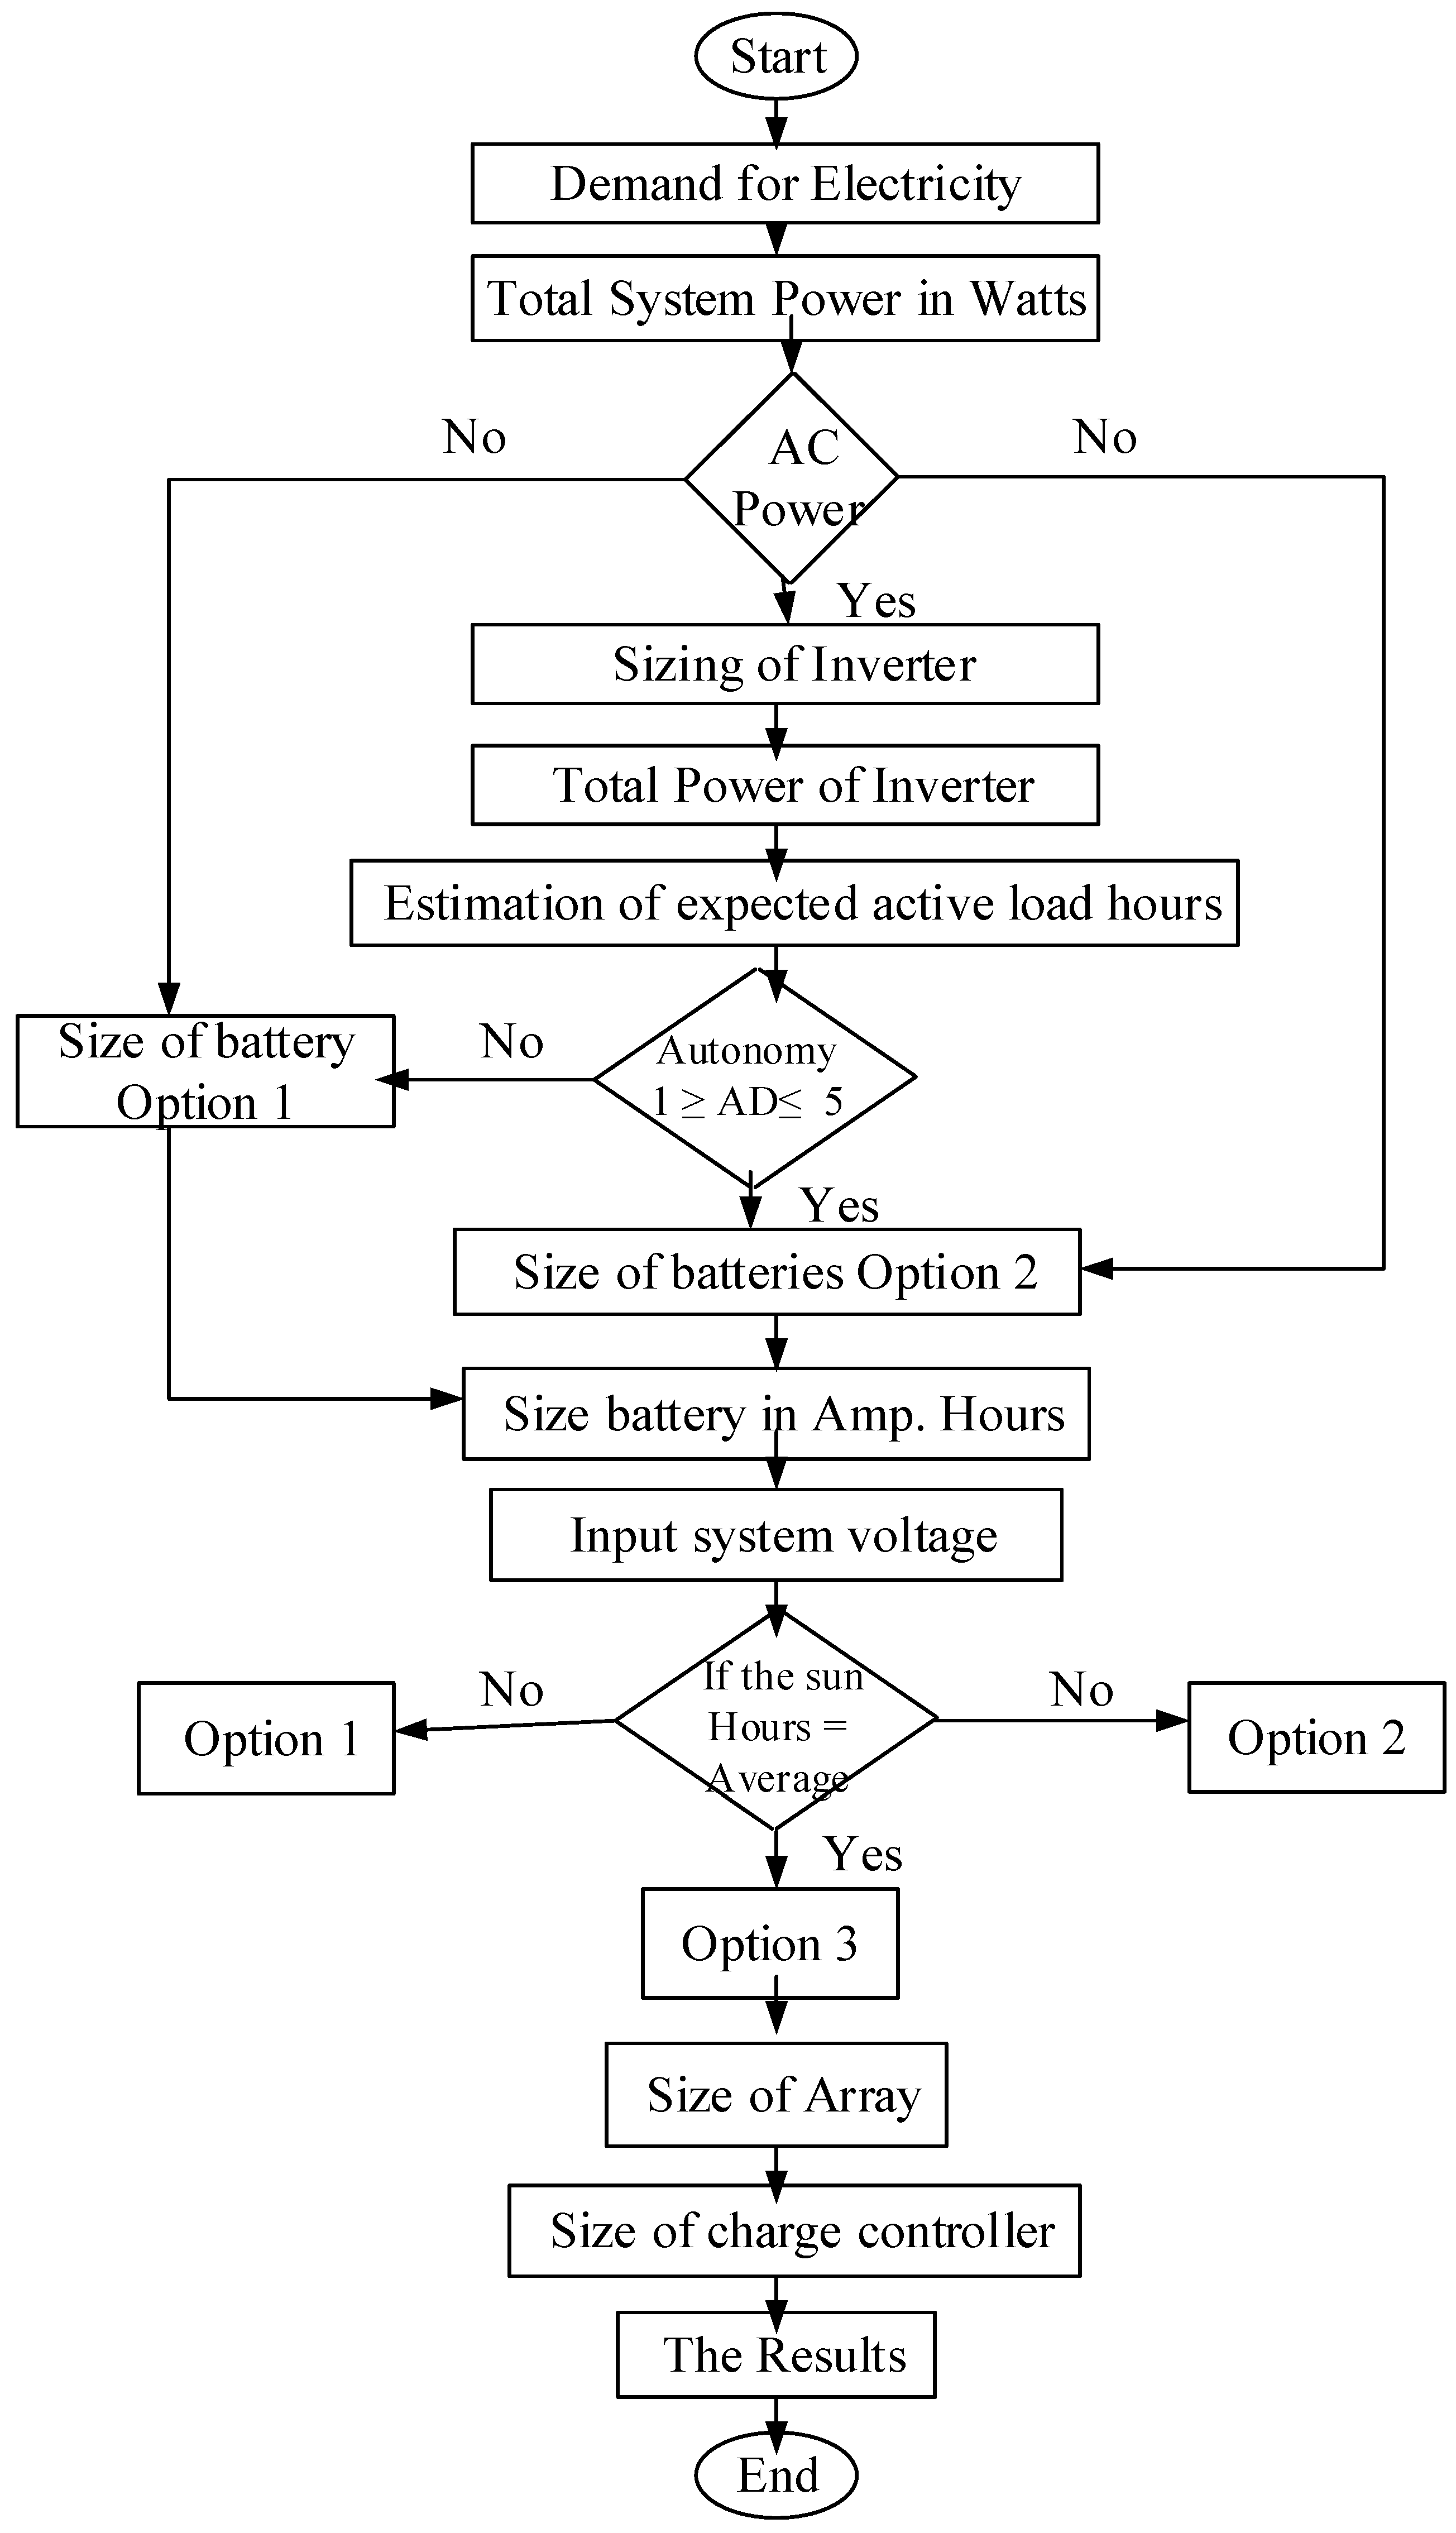
Figure 2.
Solar Energy Distribution (Wh/m²).
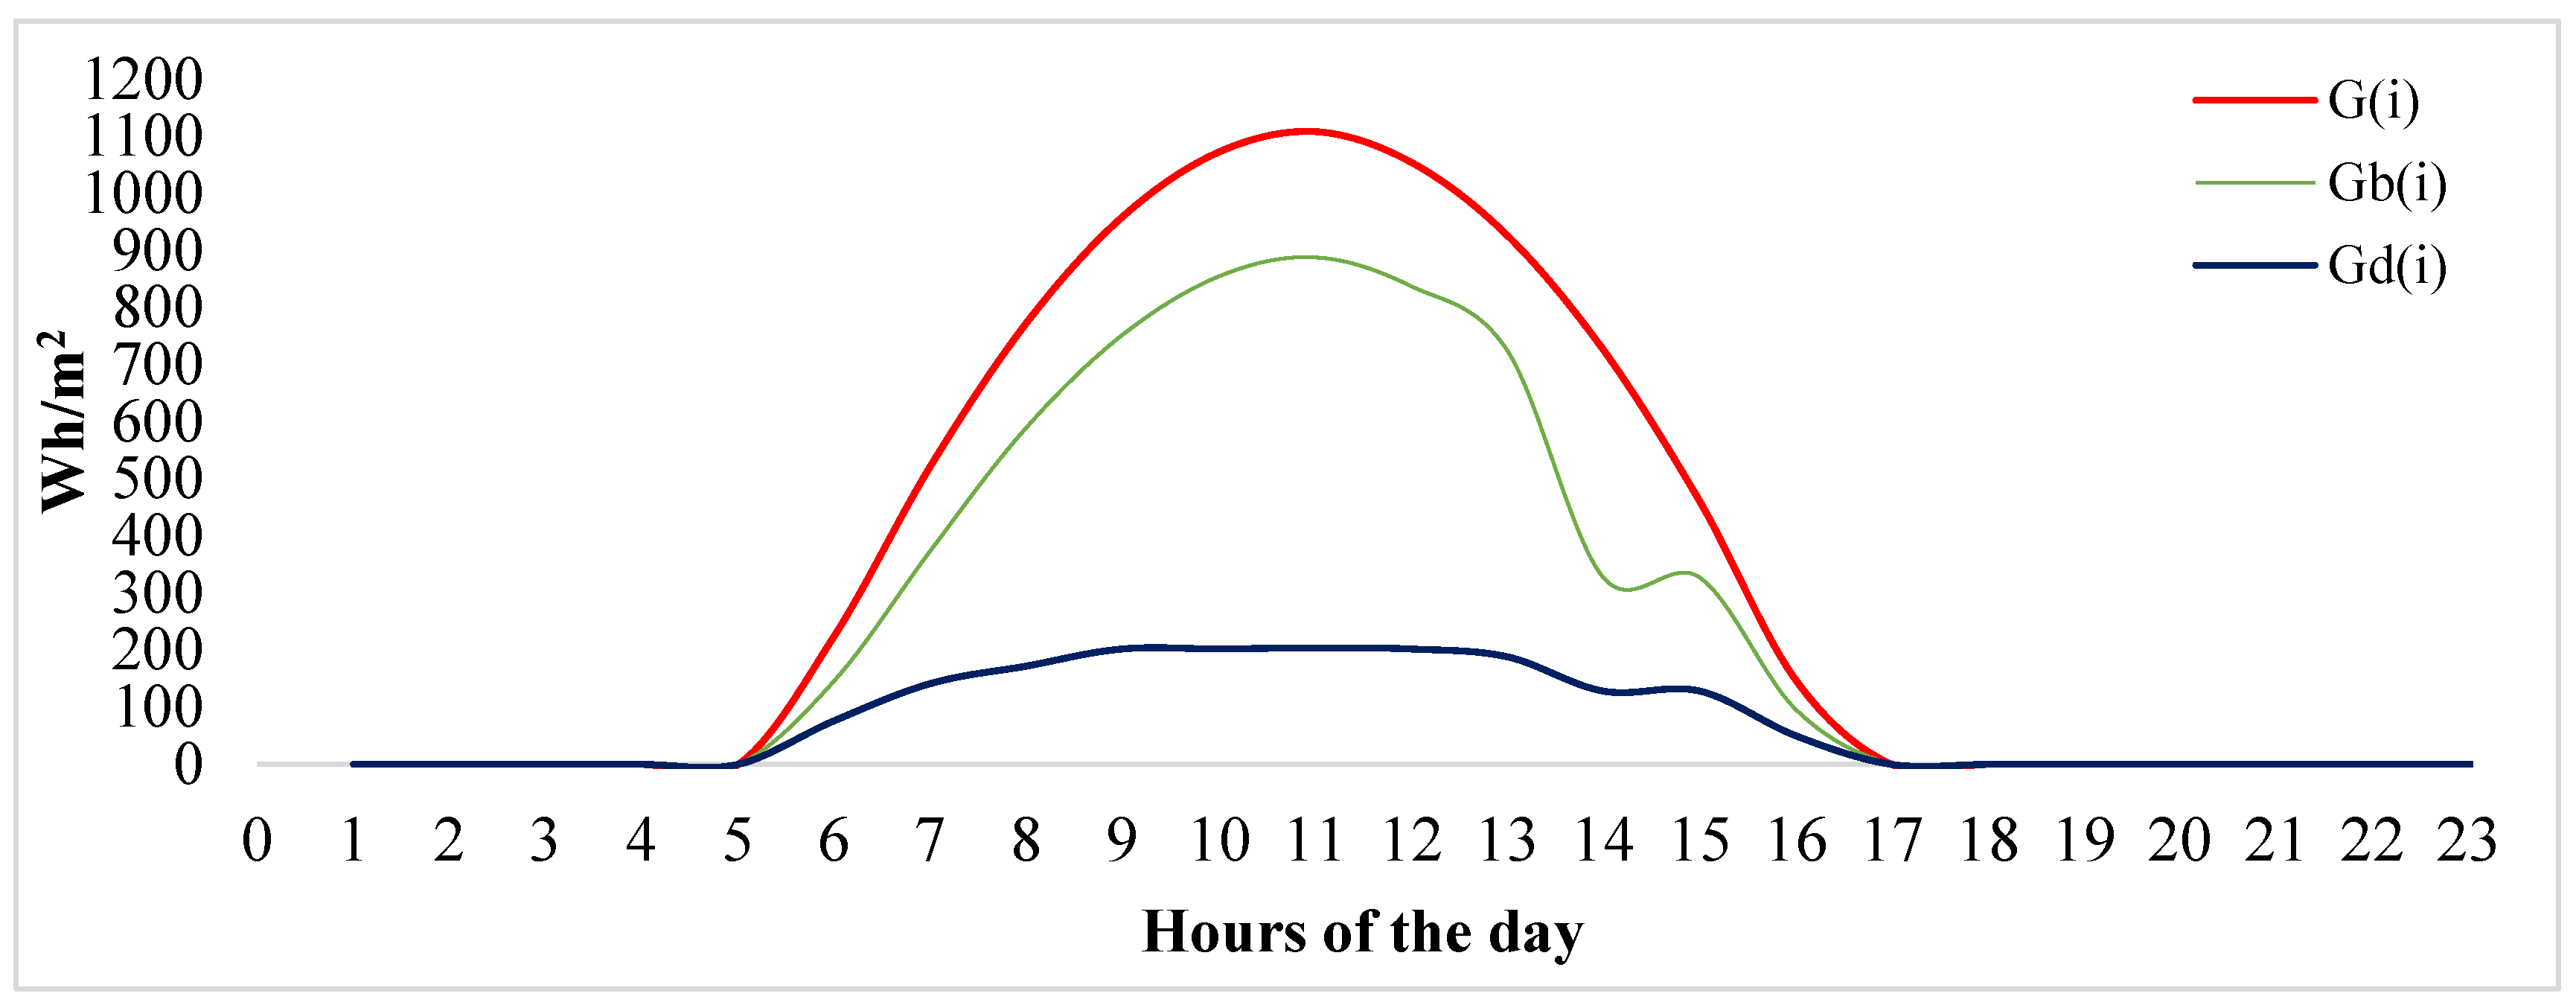
Figure 3.
Household Load Demand Distribution Over 24 Hours.
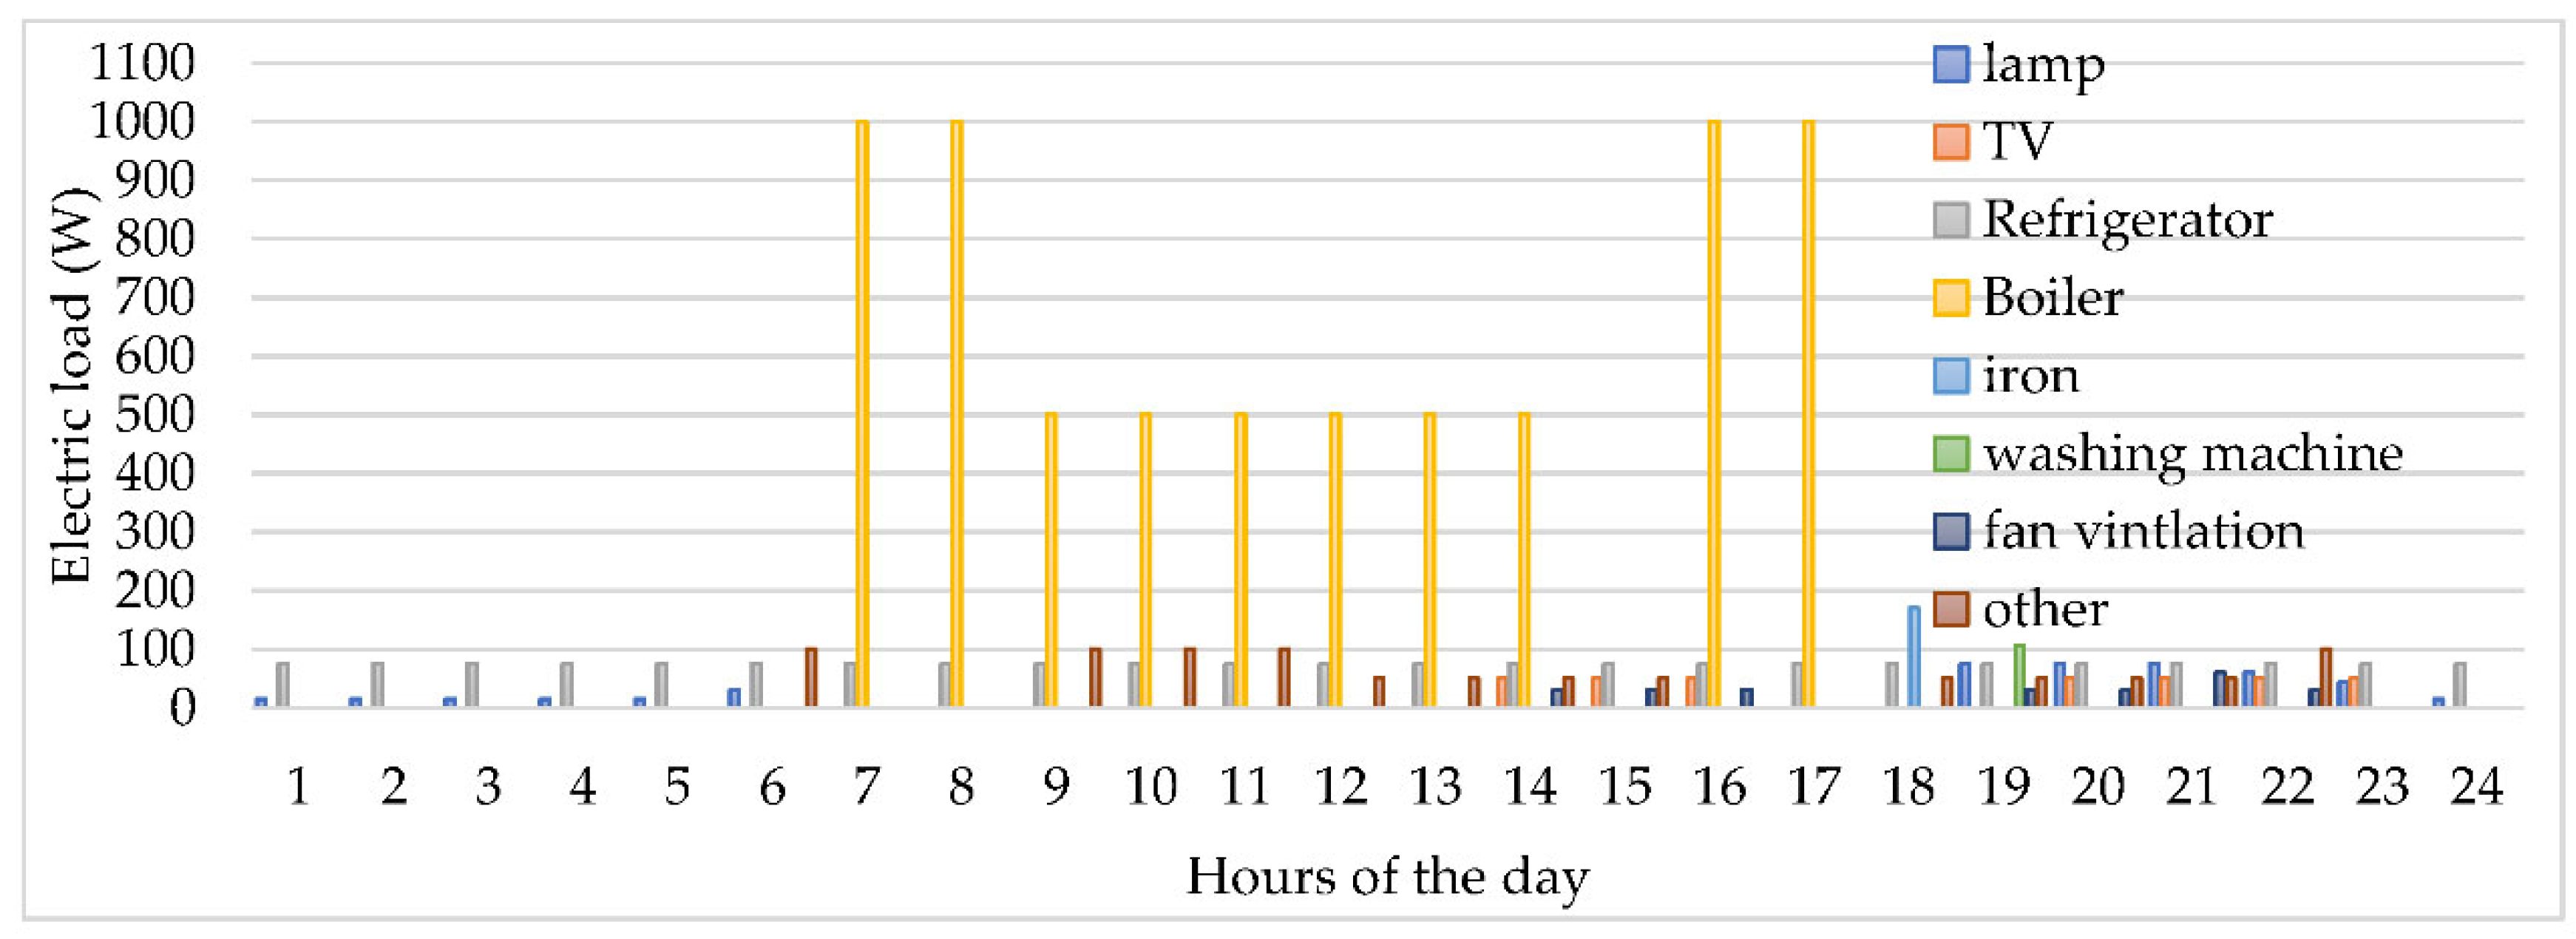
Figure 4.
Load Demand Consumptions Distributions Medical 24h.
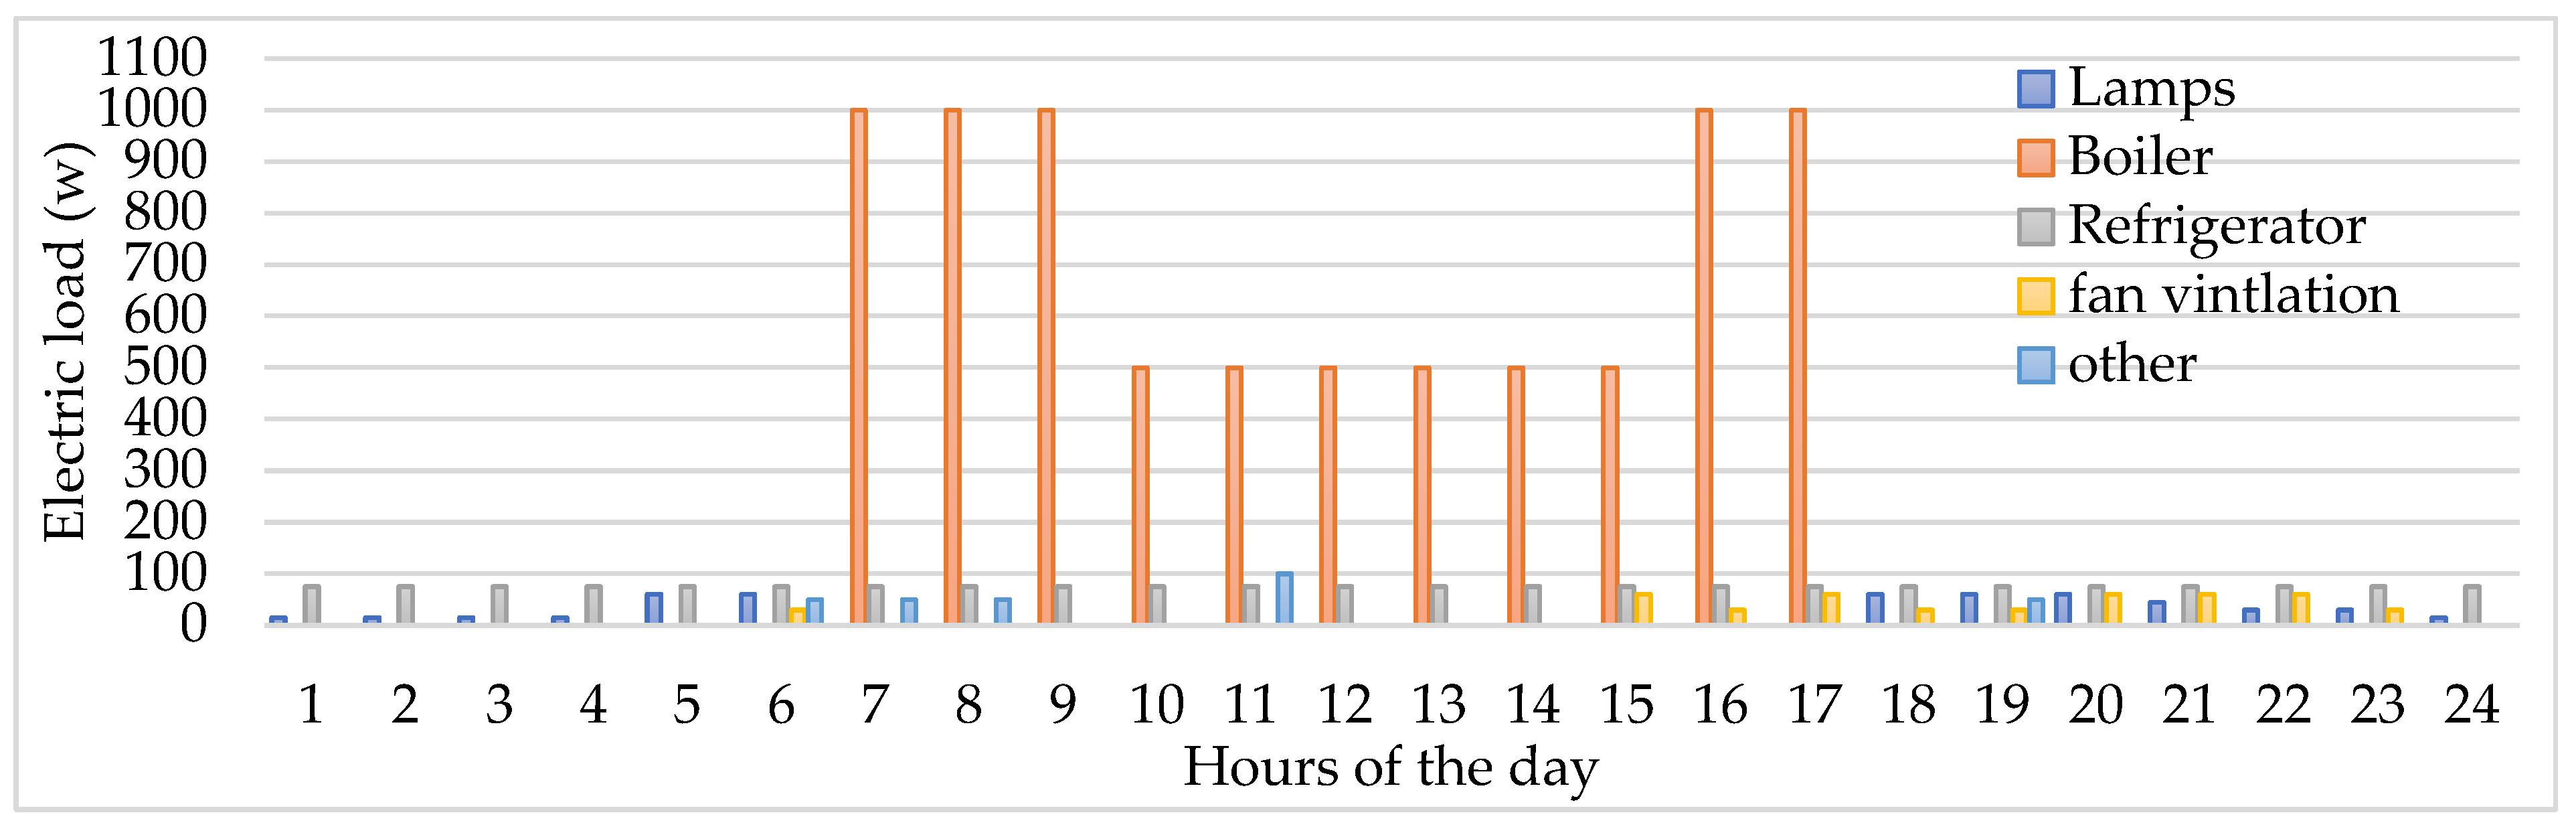
Figure 7.
Overall system design.
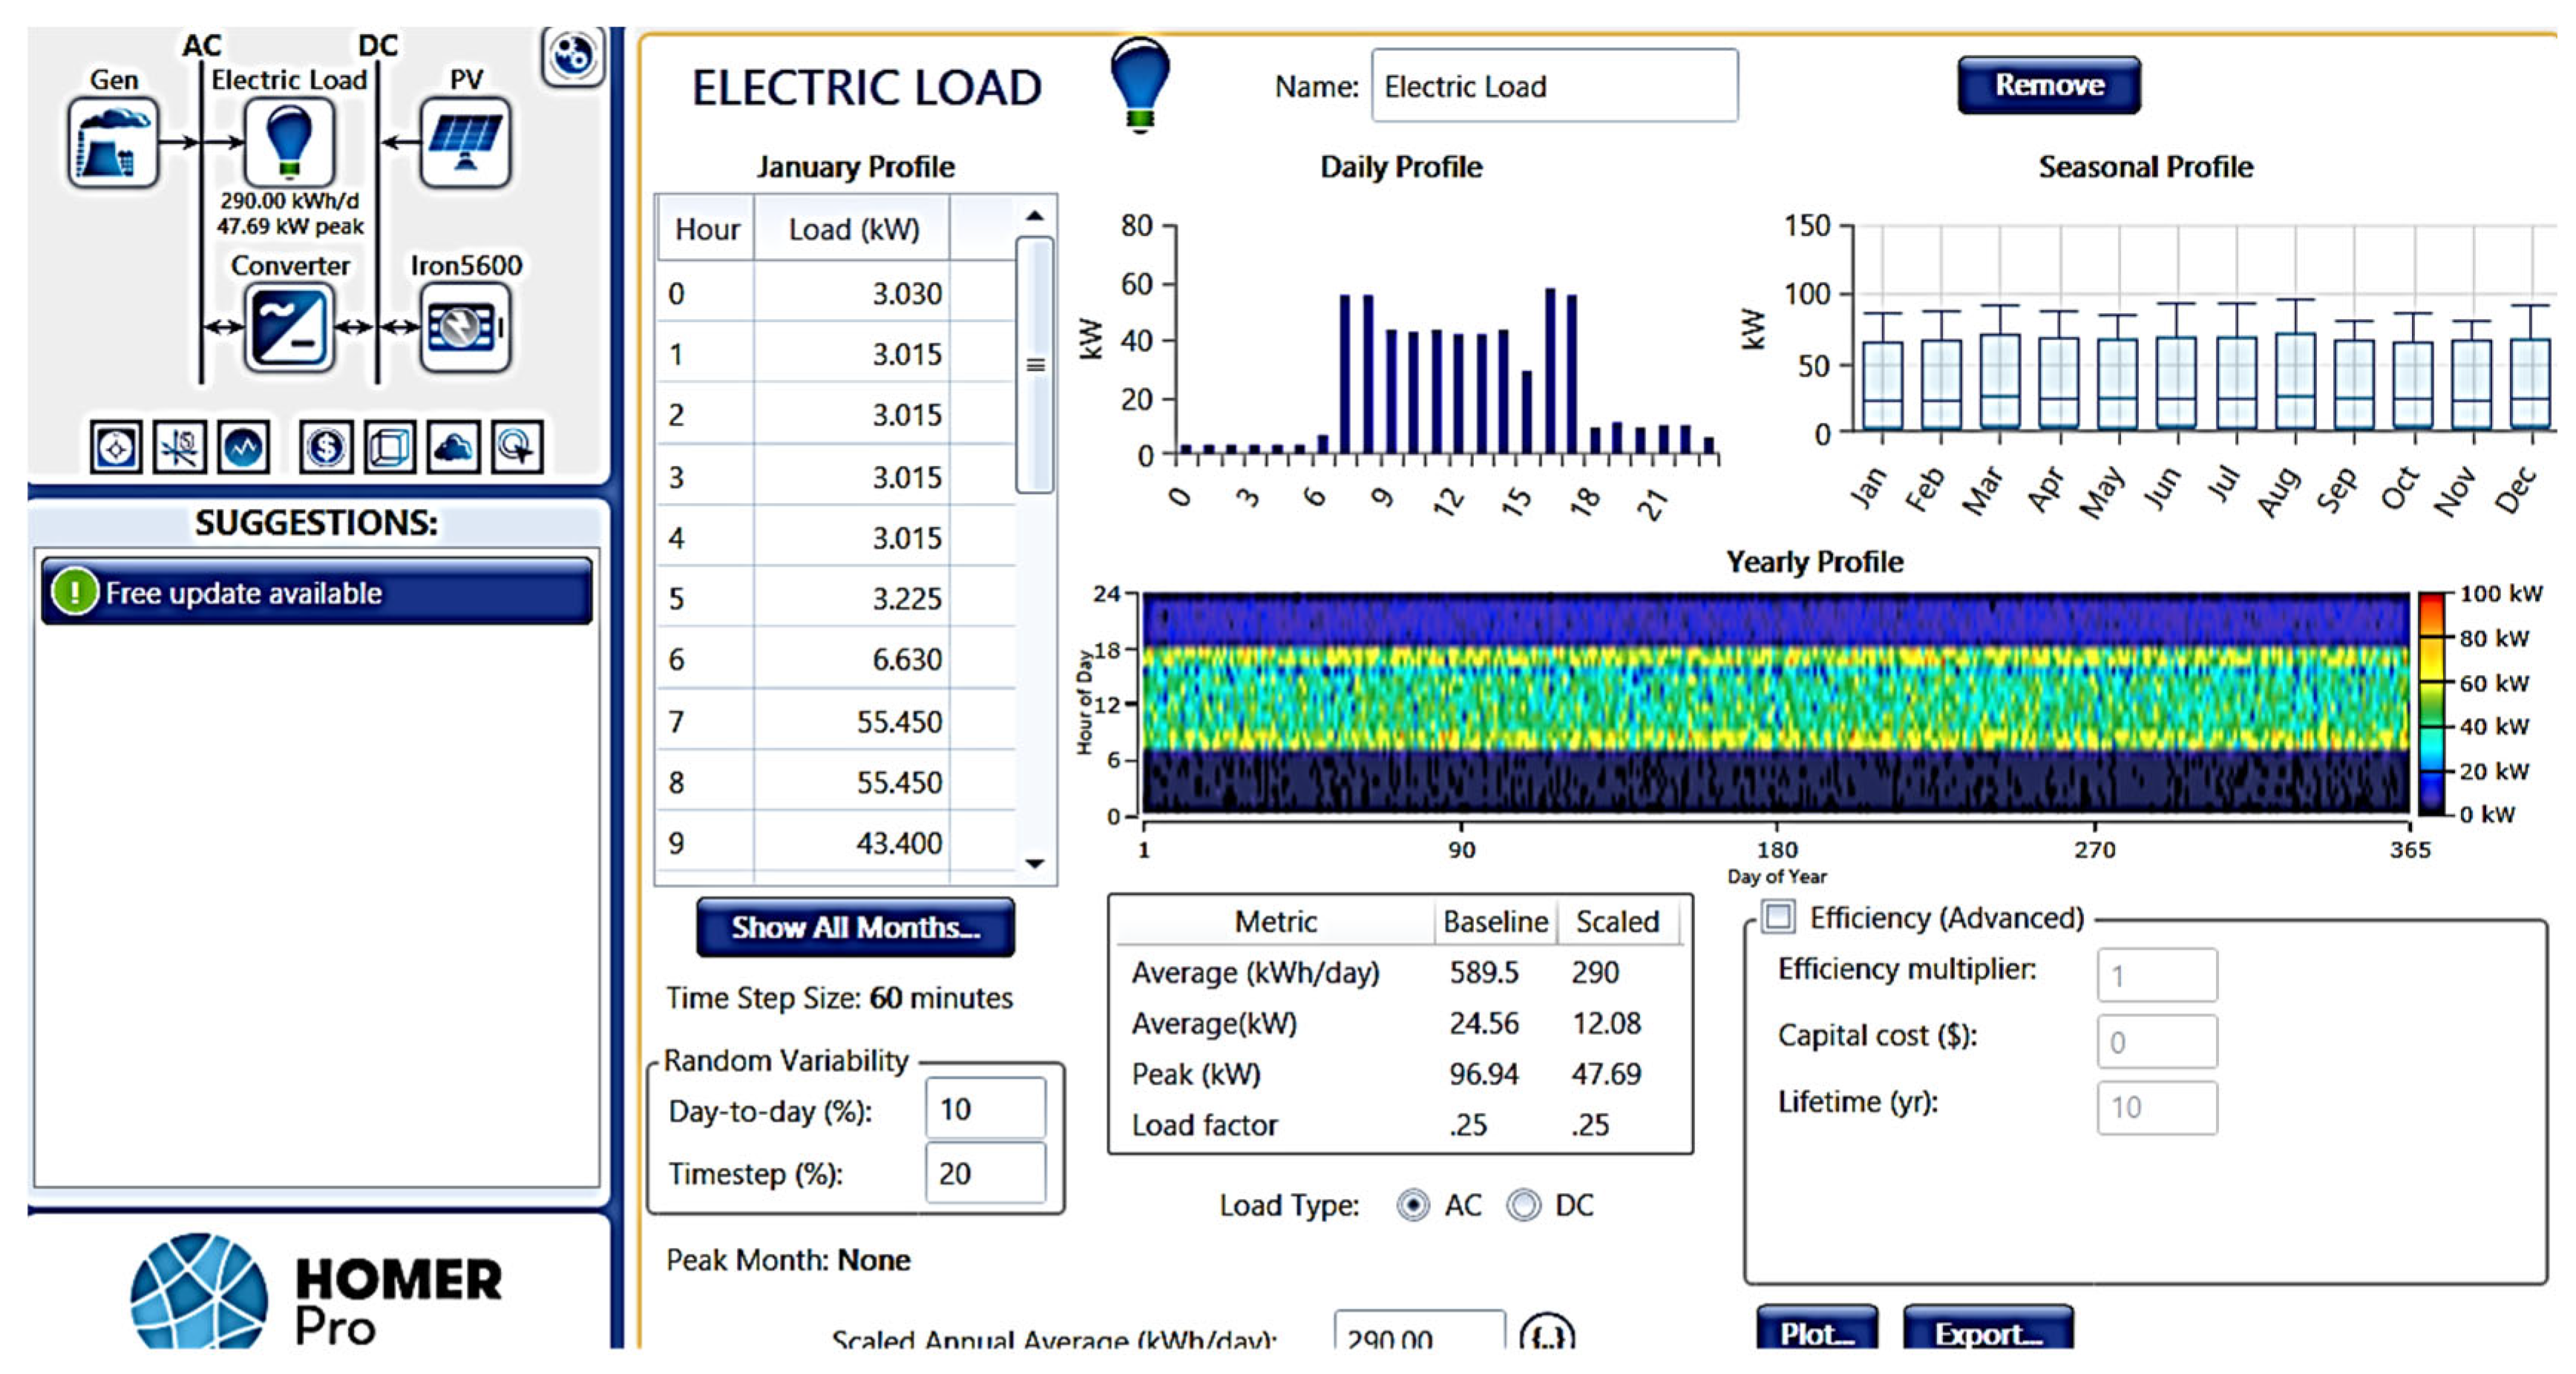
Figure 10.
Simulation results of Converter.
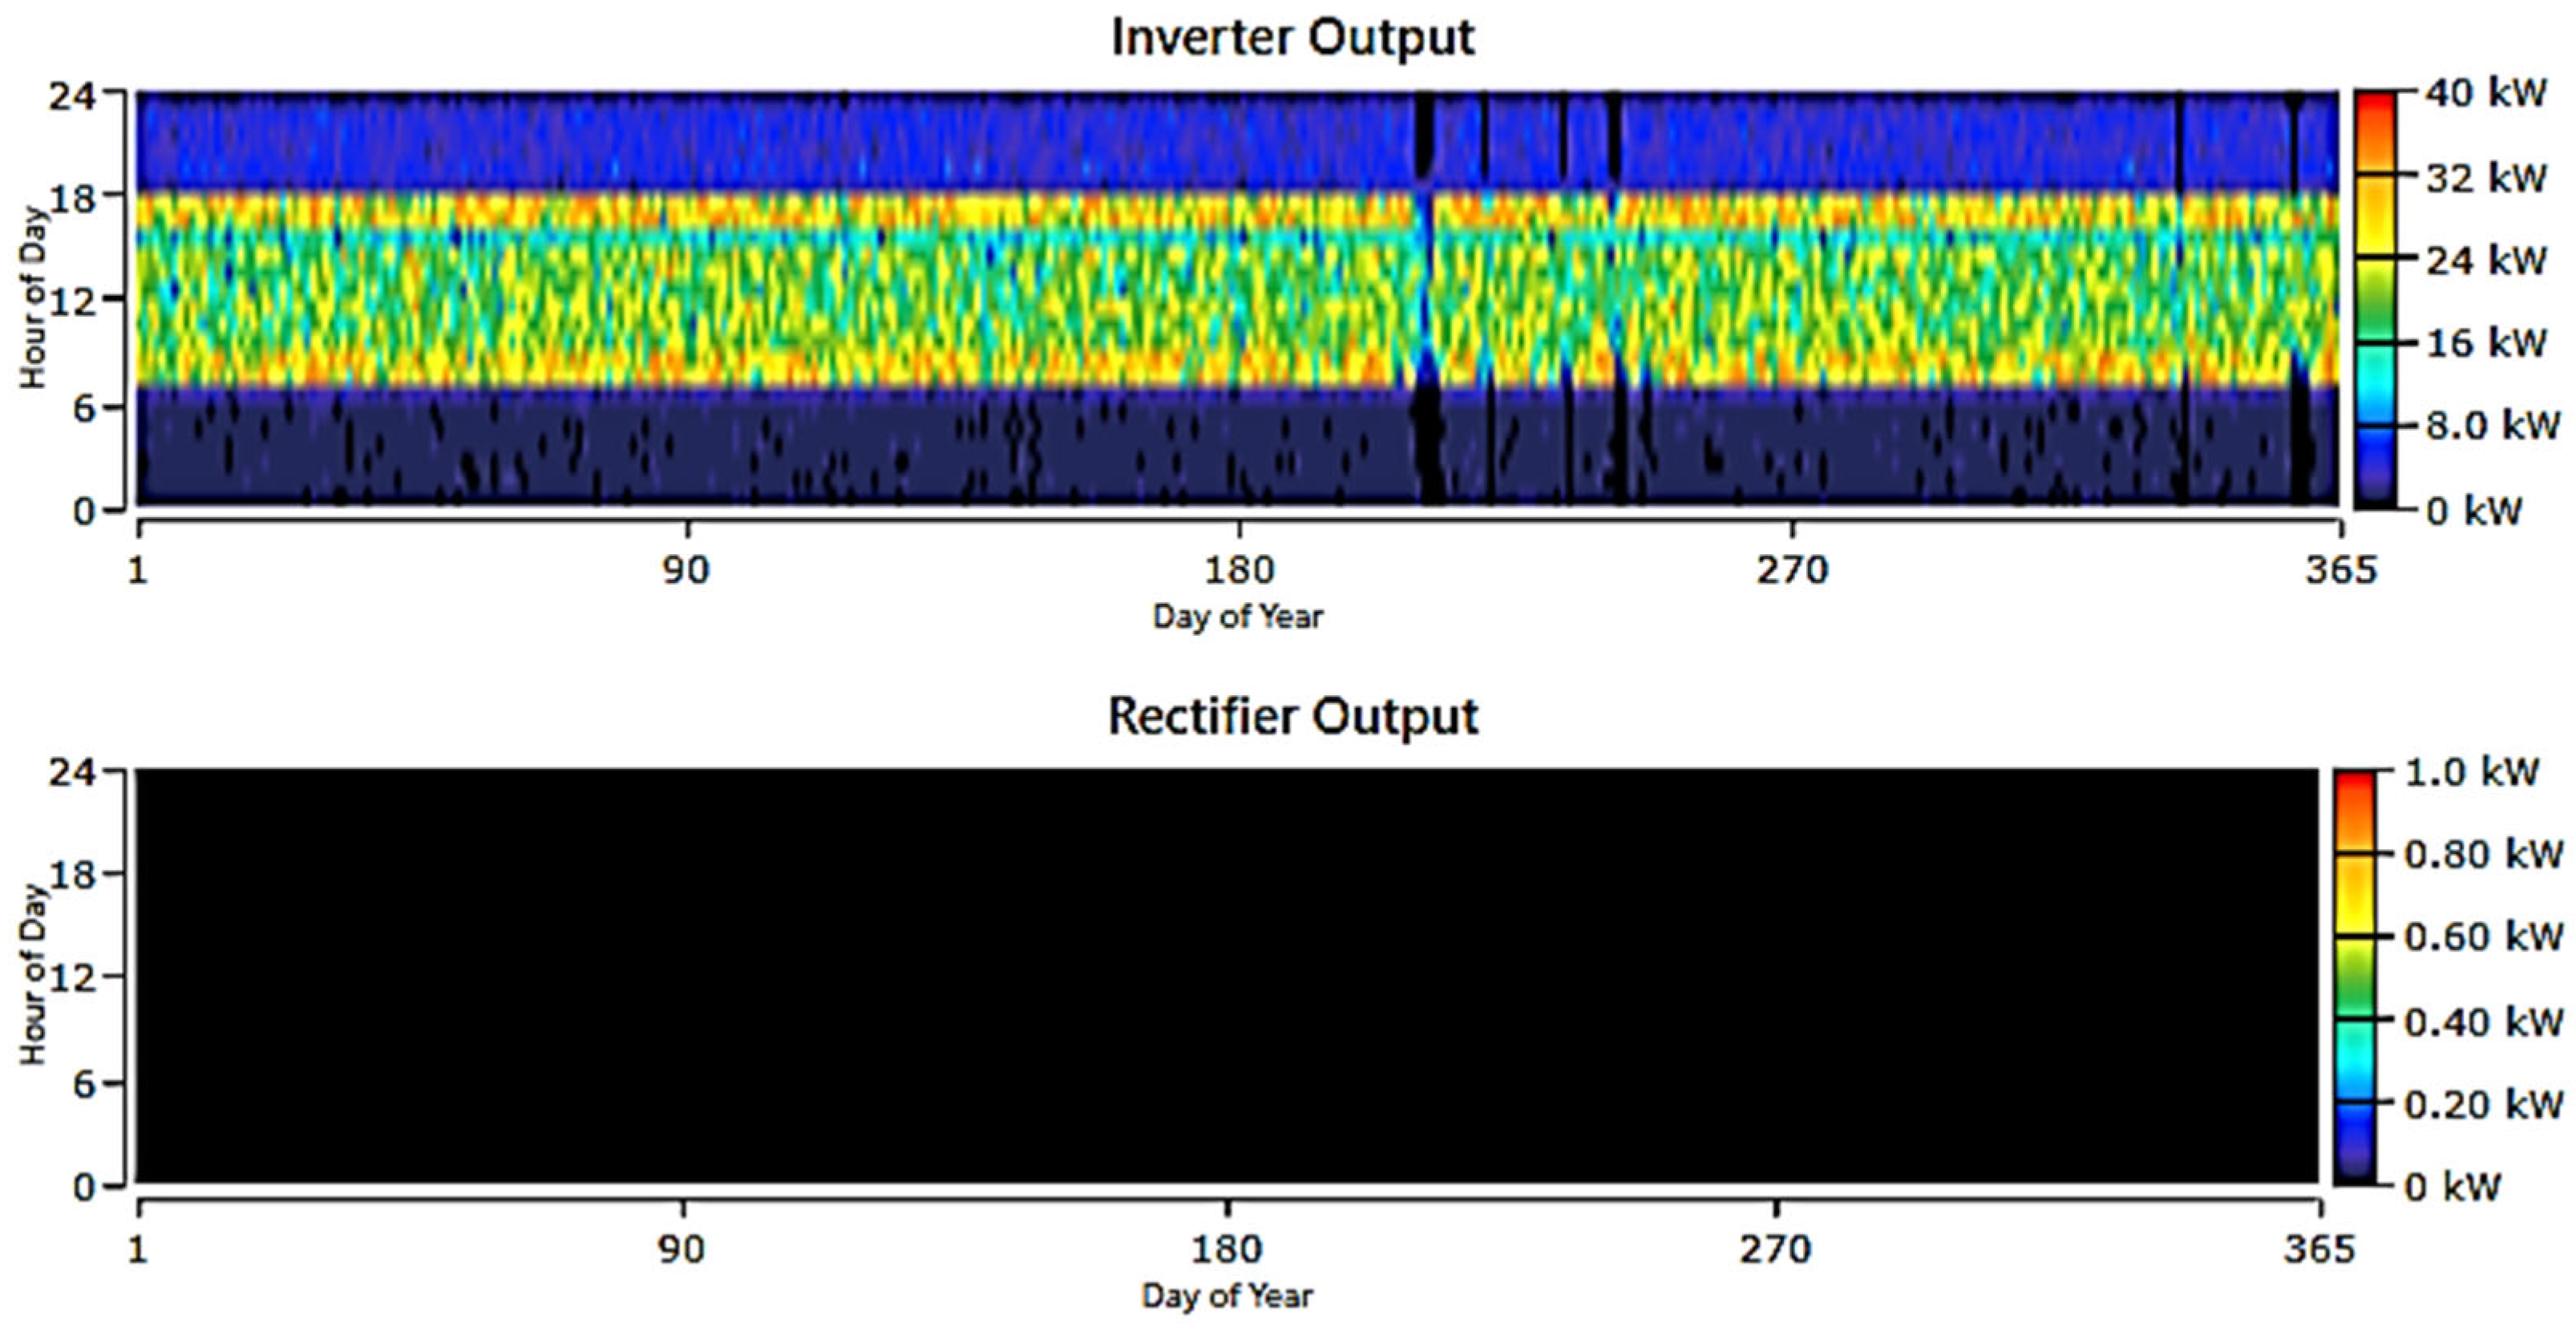
Figure 11.
Status of Batteries charging.
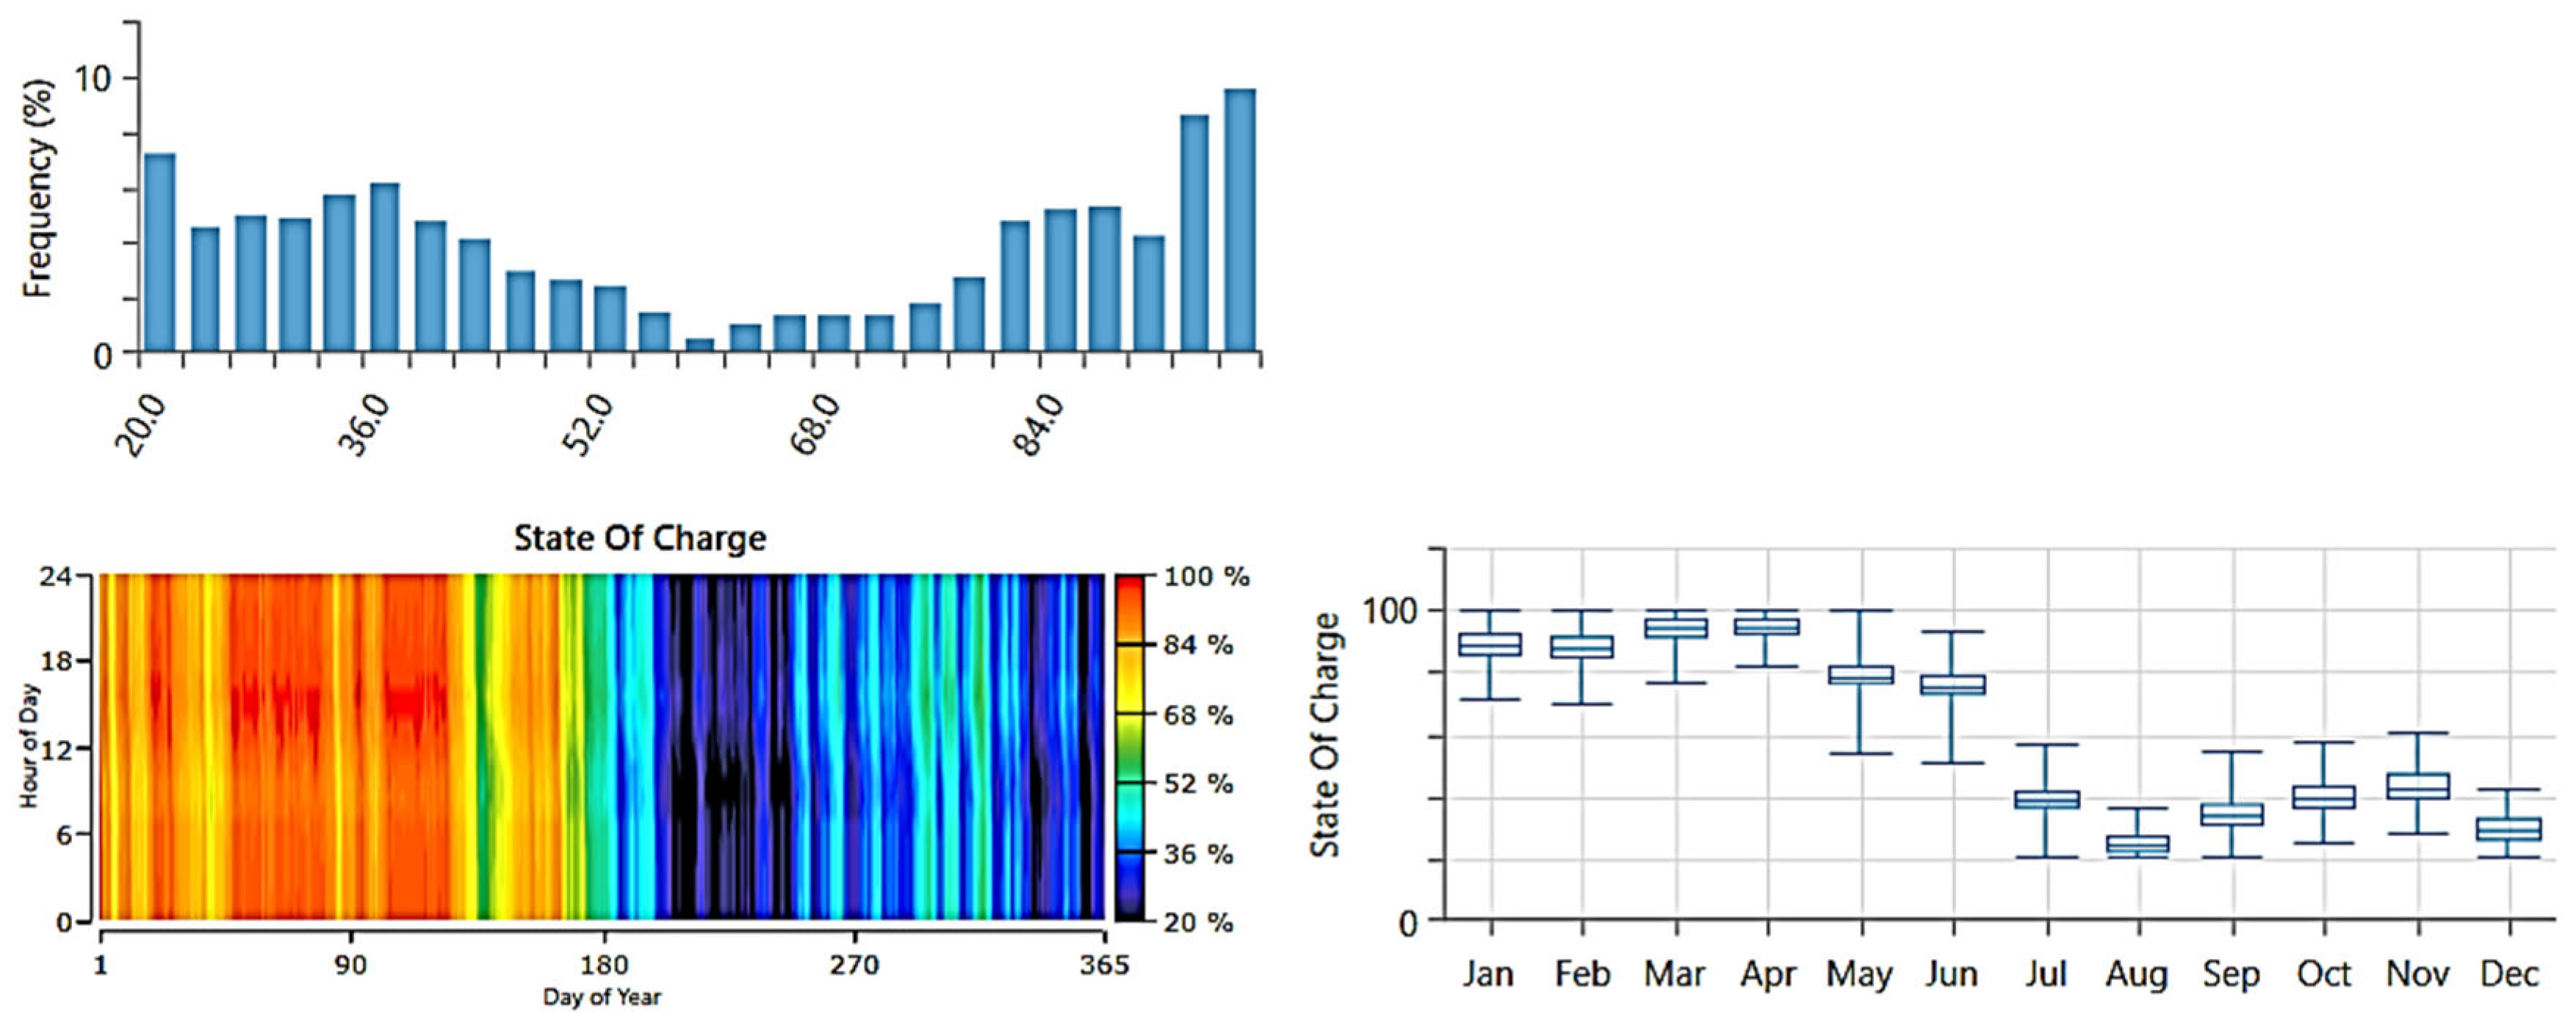
Figure 12.
PV panel output over year.
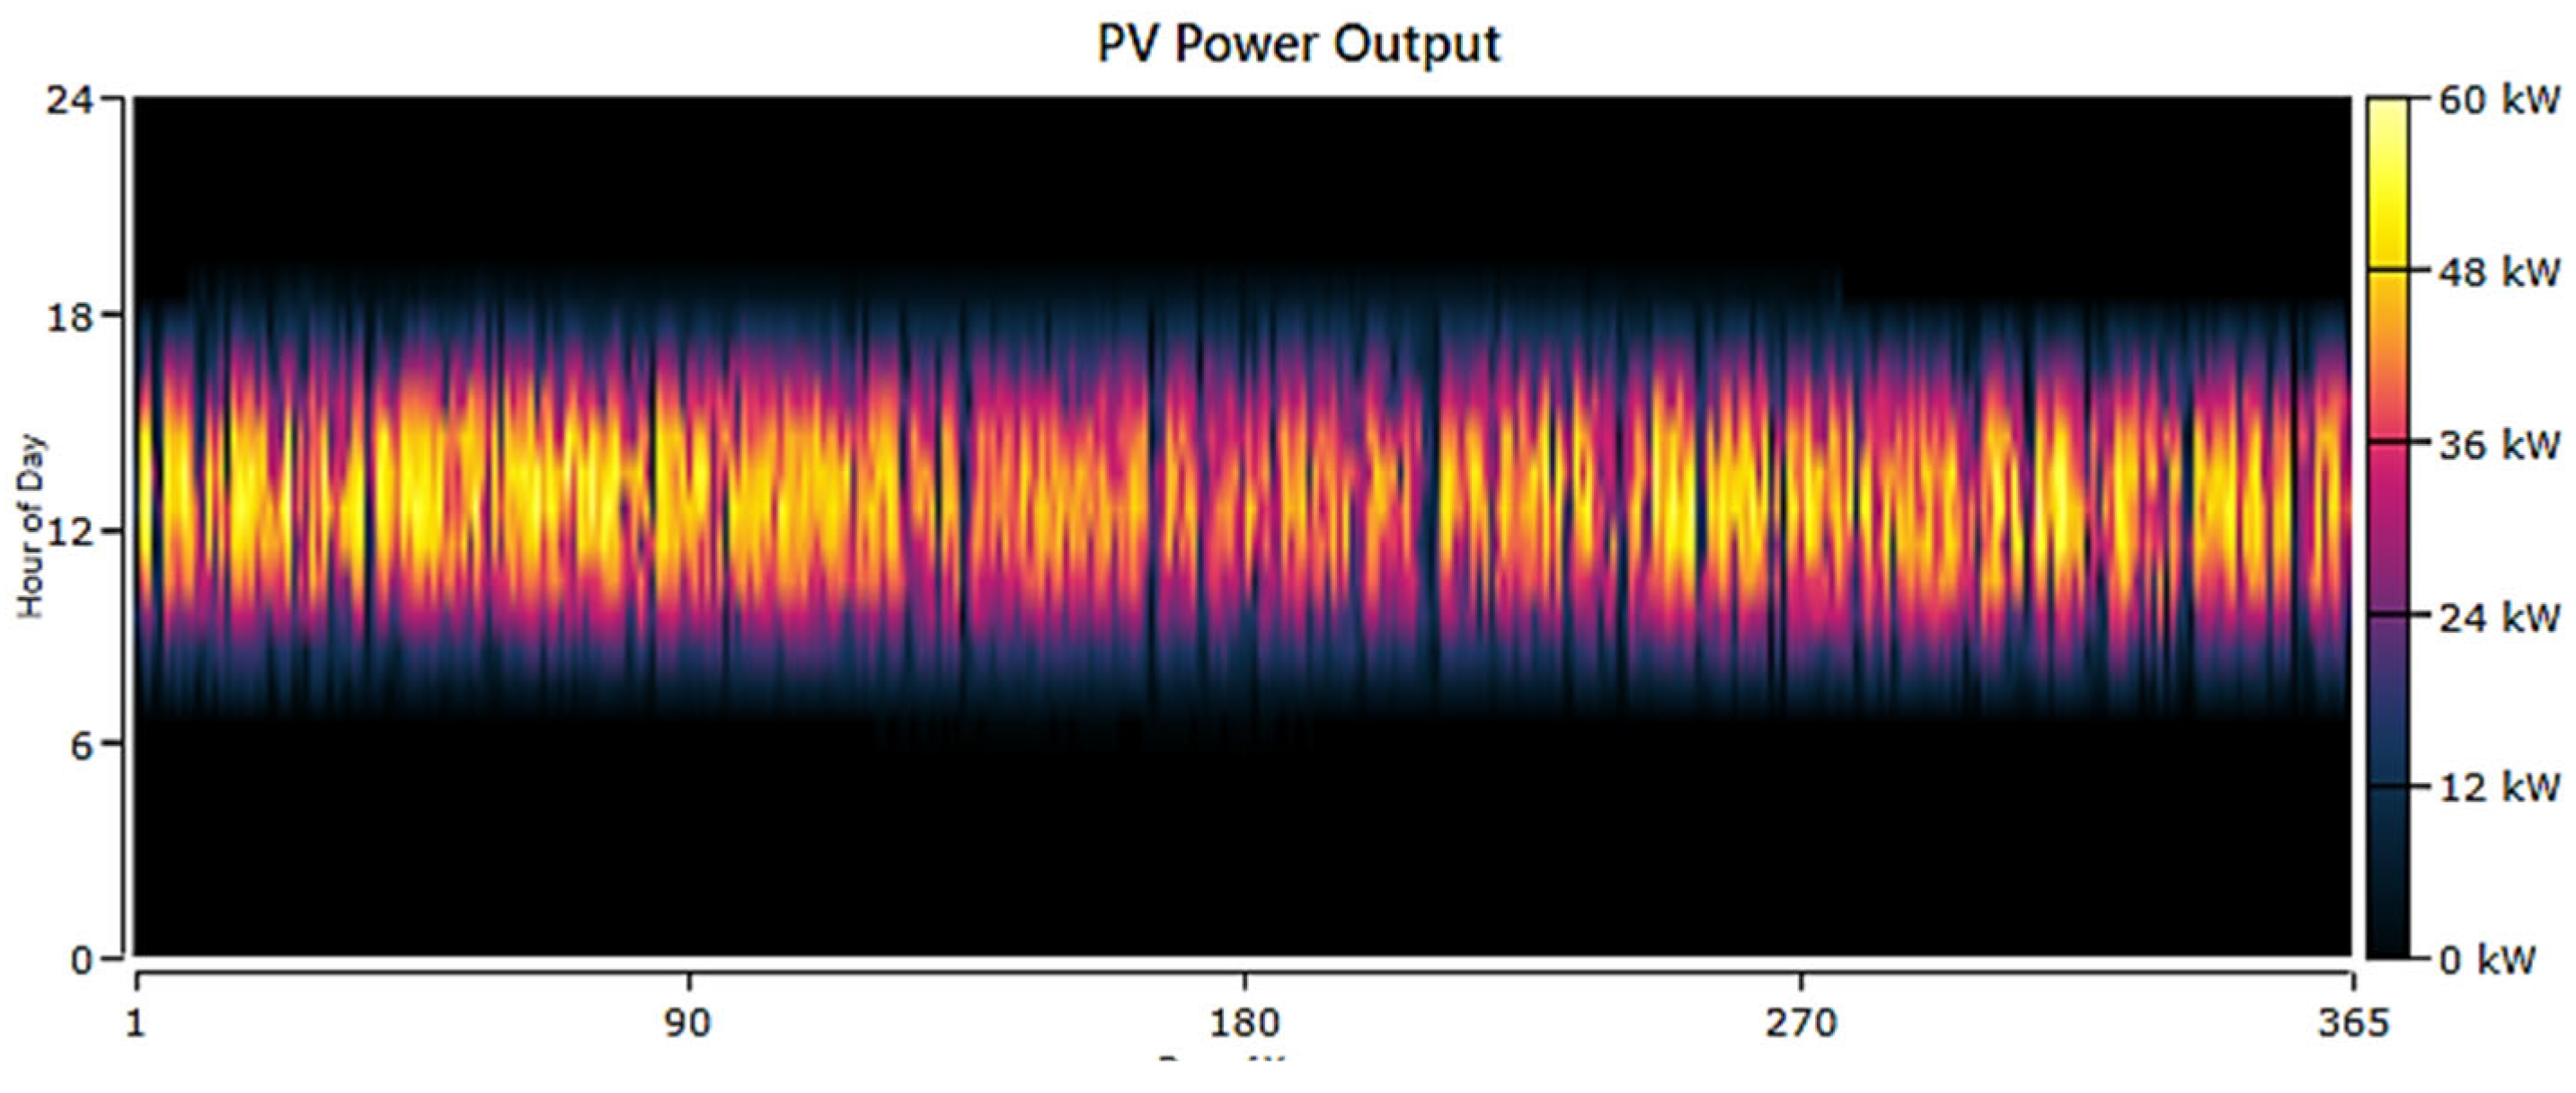
Figure 13.
Fuel summery.

Figure 14.
Status of Batteries charging.
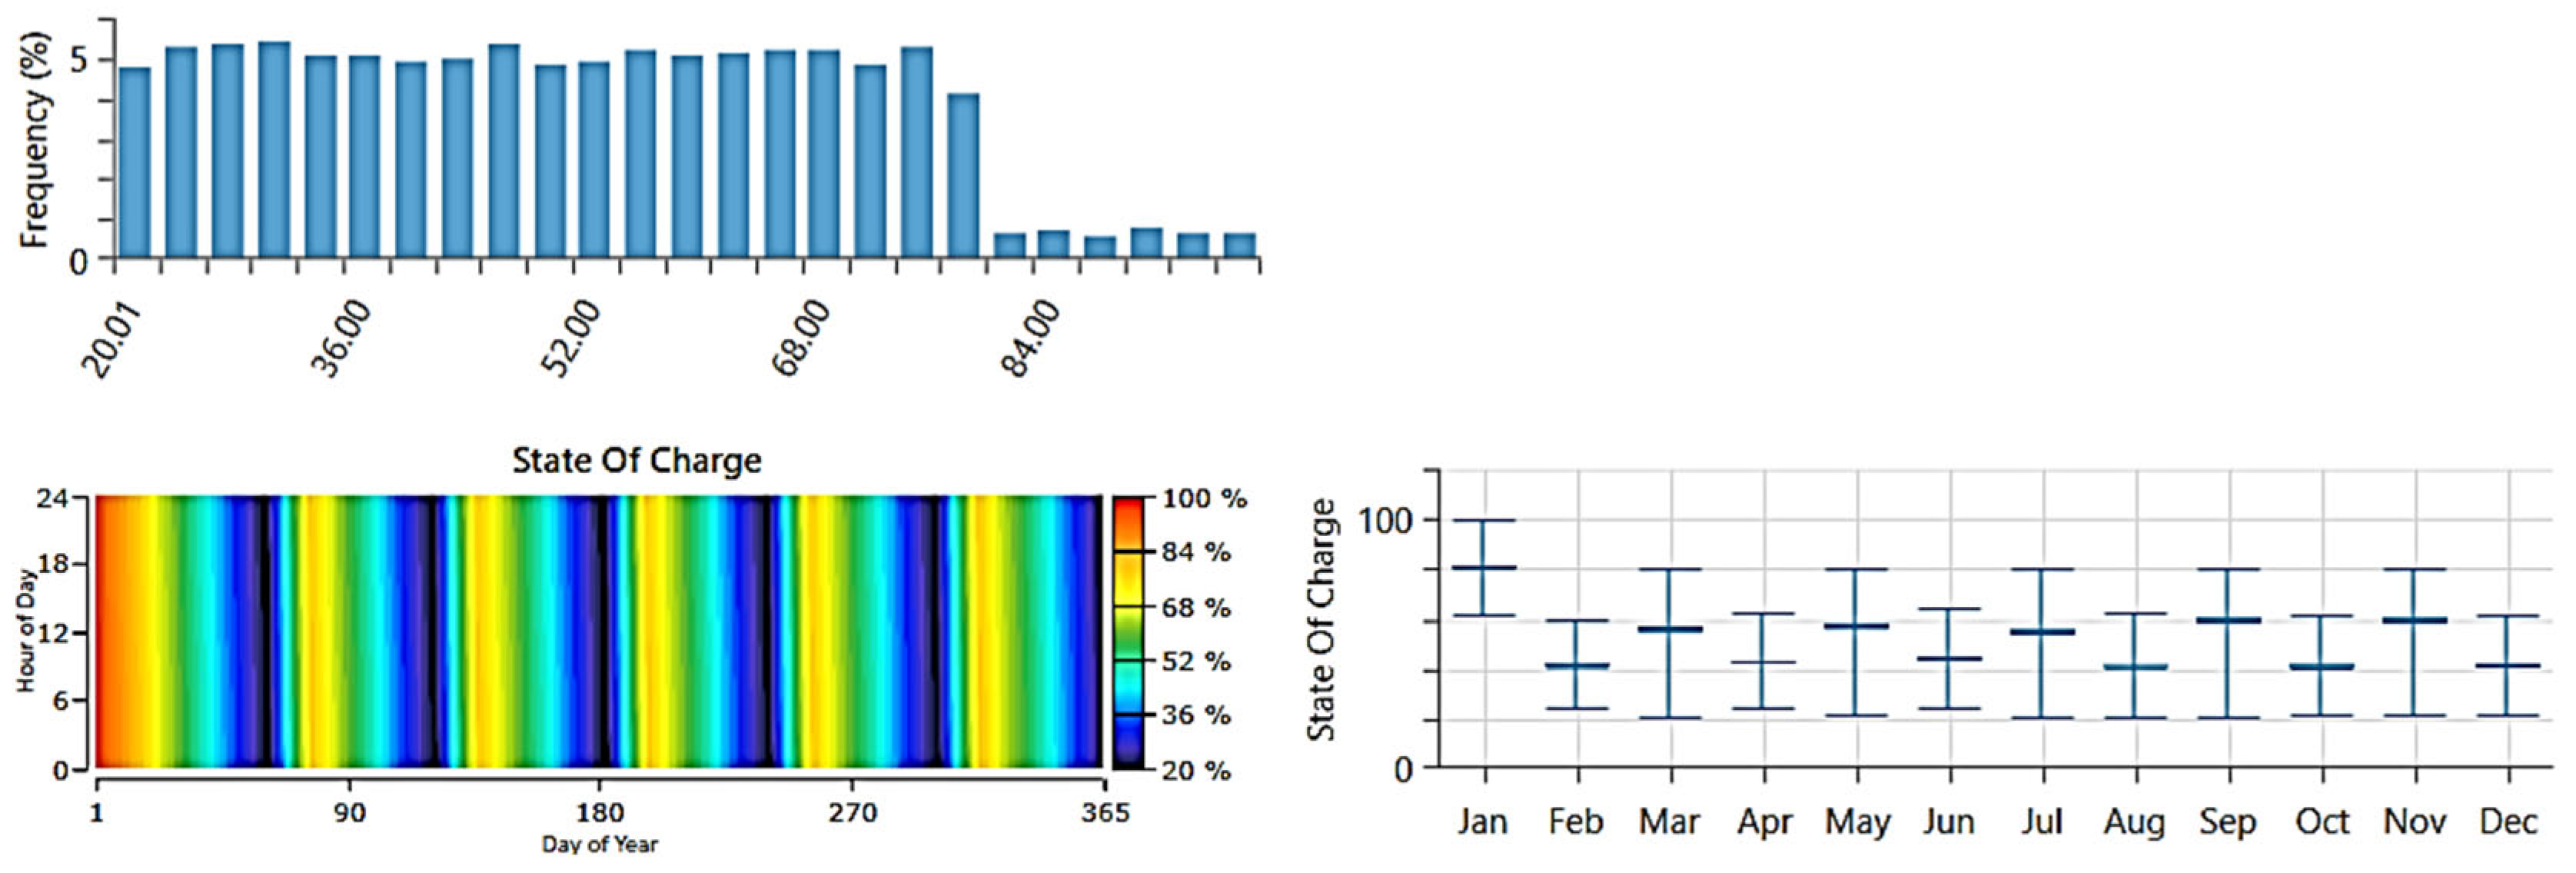
Figure 15.
Performance of converter output.
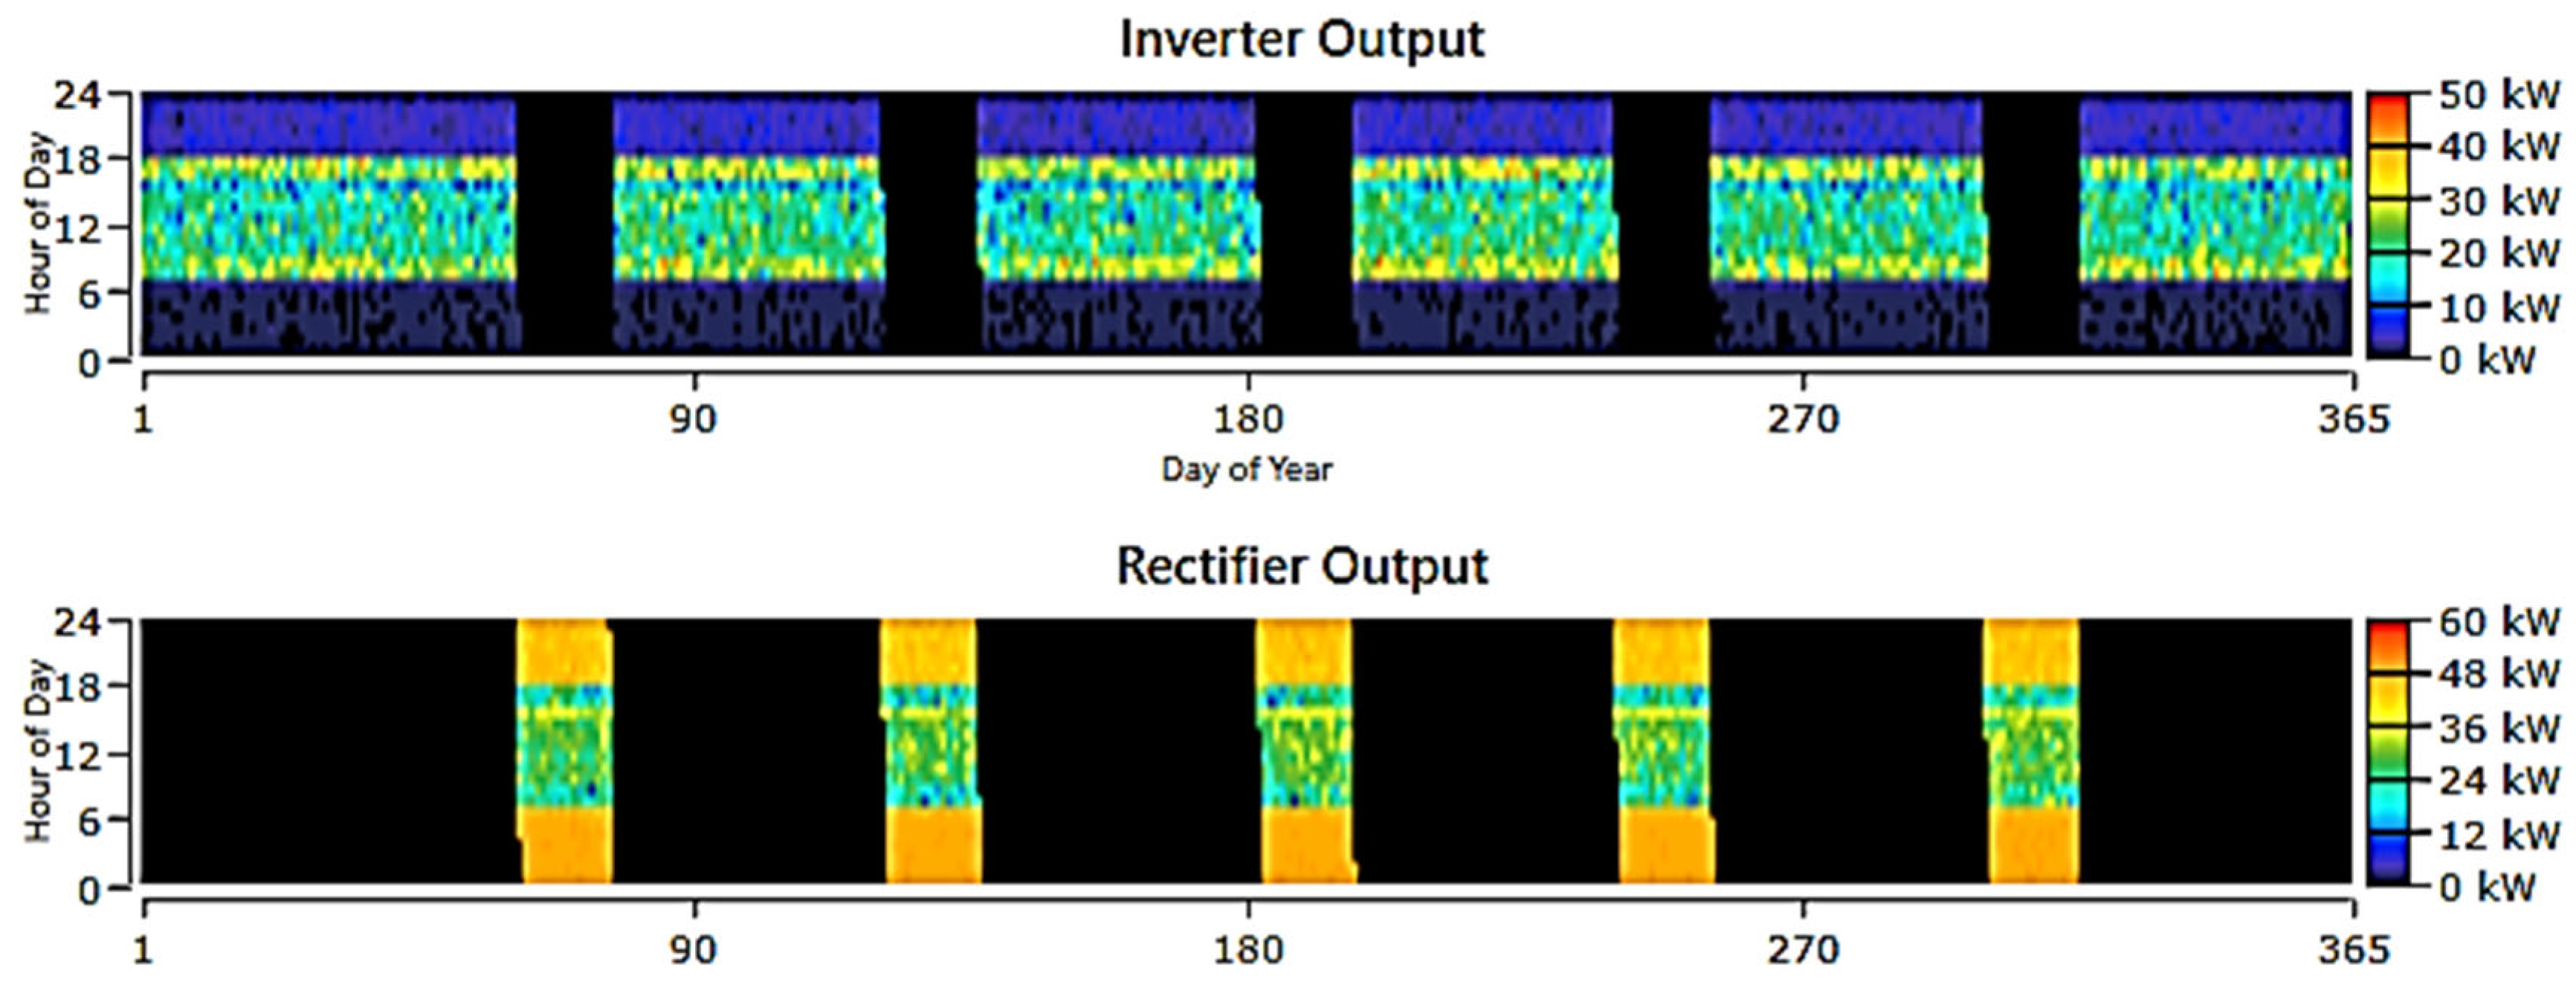
Figure 16.
Performance of Fuel.
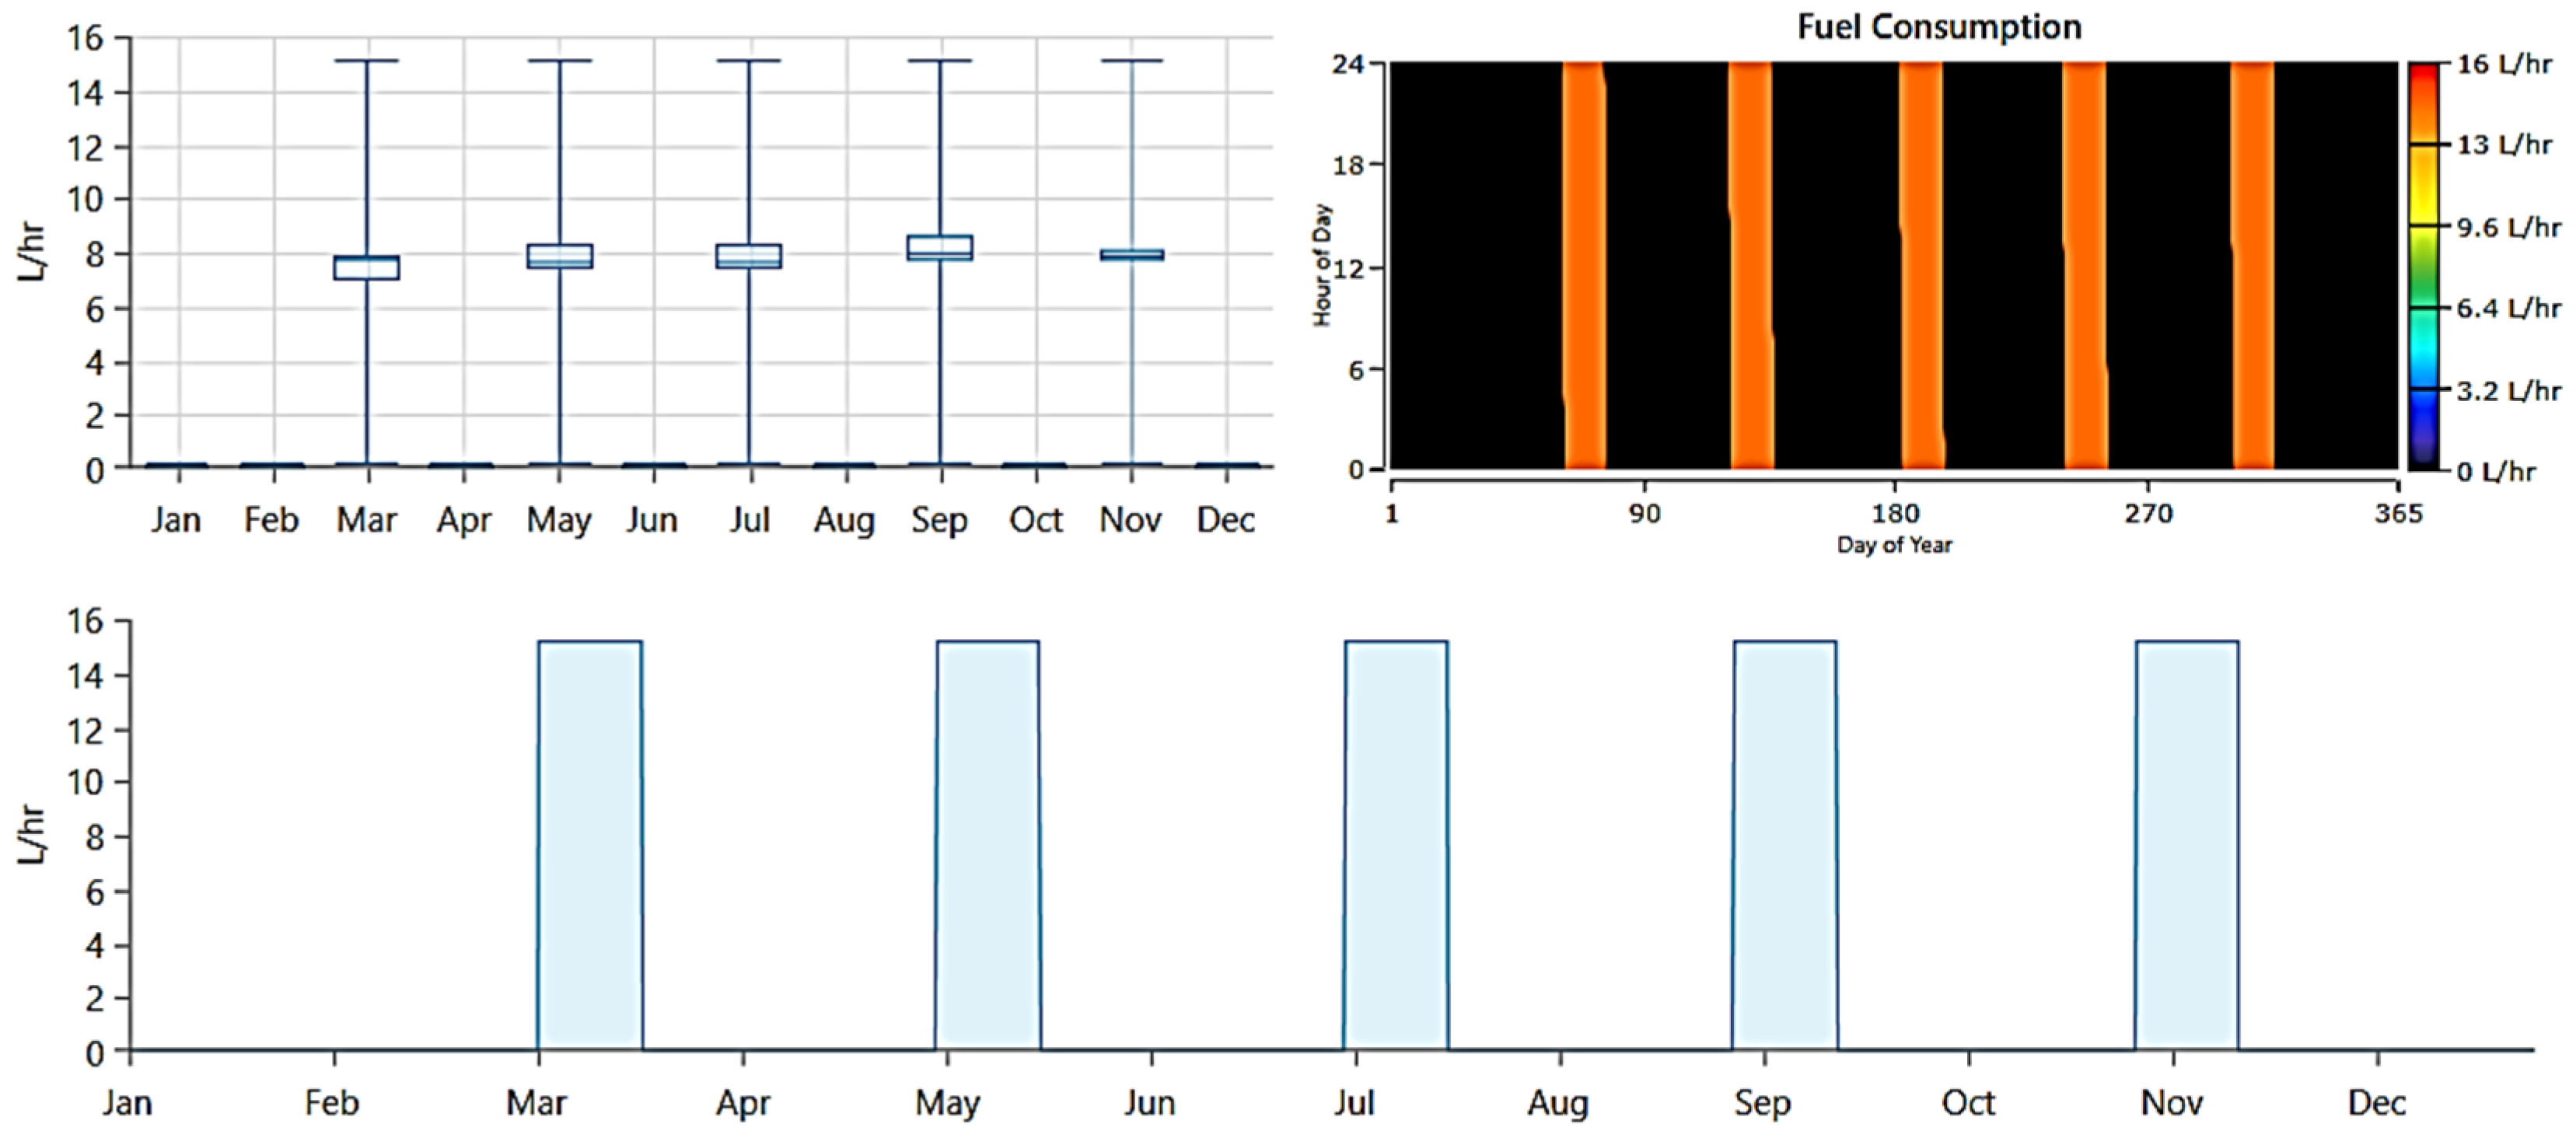
Figure 17.
PV Panel output over year.
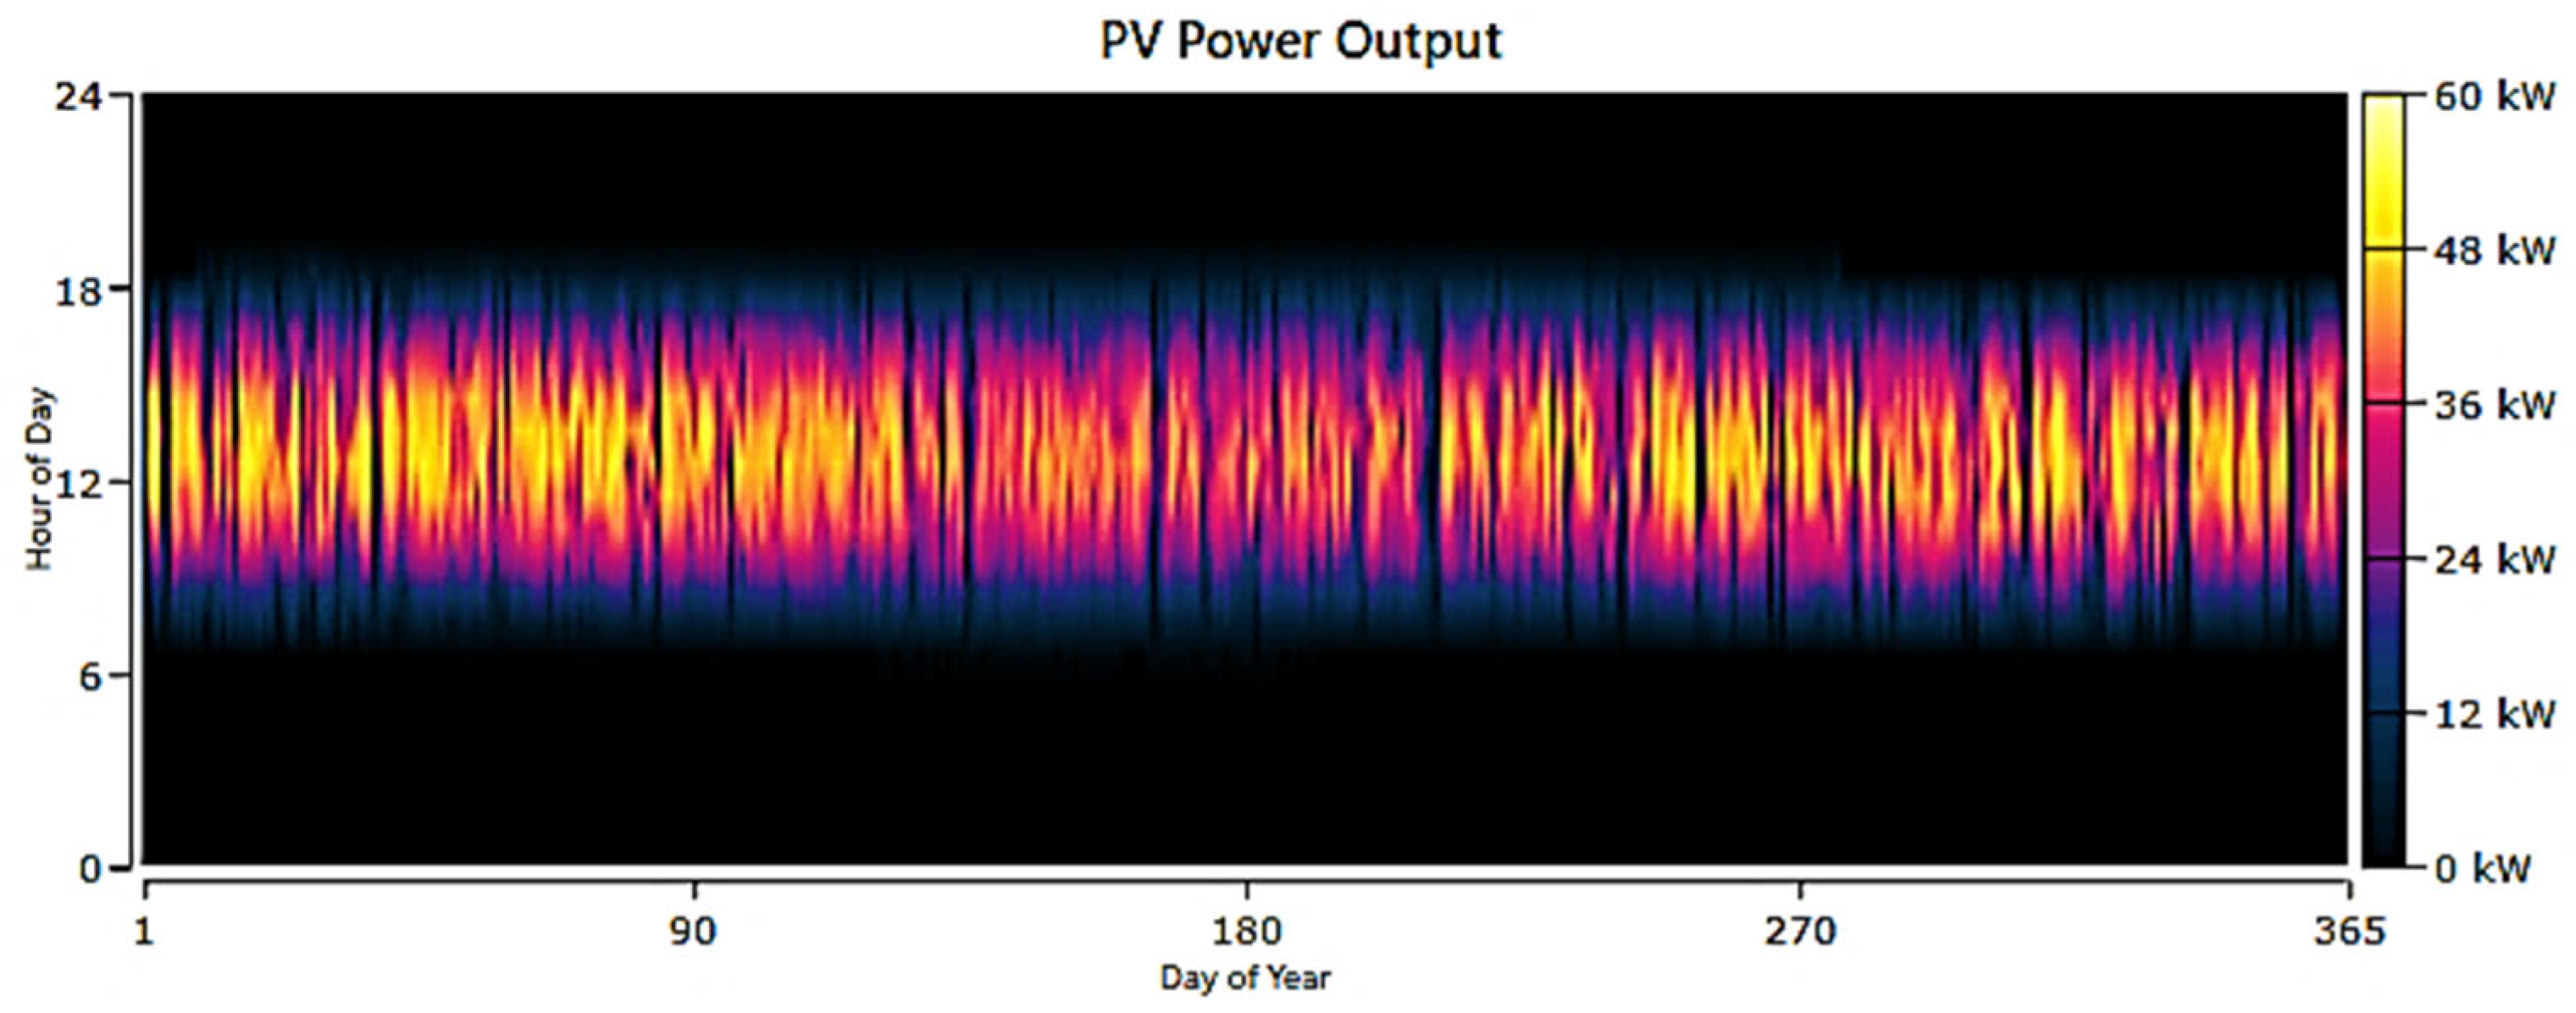
Table 1.
Total load of the village.
| Load | No | (W) | Total Installation Load (W) |
| House | 30 | 3000 | 90000 |
| Street | 1 | 600 | 600 |
| Medical | 1 | 1300 | 1300 |
| Supermarket | 1 | 200 | 200 |
| Pump Water | 2 | 11000 | 22000 |
| Total Load | 114100 | ||
Table 2.
Load Installations House.
| Load Type | No | (W) | Household Loads (W) |
| Boiler | 1 | 1000 | 1000 |
| Lamps | 5 | 15 | 75 |
| TV | 1 | 50 | 50 |
| Refrigerator | 1 | 75 | 75 |
| Iron | 1 | 600 | 600 |
| Washing Machine | 1 | 250 | 250 |
| Fan Ventilation | 2 | 30 | 60 |
| Other | 2 | 450 | 900 |
| Installation Power | 3010 | ||
Table 3.
Total Installations Power for Medical.
| Load Type | No | W | Total Installations Power for Medical (W) |
| Boiler | 1 | 1000 | 1000 |
| Lamps | 4 | 15 | 60 |
| Refrigerator | 1 | 75 | 75 |
| Fan Ventilation | 3 | 30 | 90 |
| Other | 1 | 100 | 100 |
| Sum | 1325 | ||
Table 4.
Total Installations Power for Super Market.
| Load Type | No | (W) | Total Installations Power for Medical (W) |
| Lamps | 2 | 15 | 30 |
| Refrigerator | 1 | 75 | 75 |
| Fan Ventilation | 1 | 30 | 30 |
| Other | 1 | 50 | 50 |
| 185 | |||
Table 5.
Load Demand distribution for the Village.
| Hours | Water Pump (W) | Total Houses (W) | Street (W) | Medical (W) | Super Market (W) | Total Consumption(W) |
| 1 | 0 | 2700 | 150 | 90 | 75 | 3015 |
| 2 | 0 | 2700 | 150 | 90 | 75 | 3015 |
| 3 | 0 | 2700 | 150 | 90 | 75 | 3015 |
| 4 | 0 | 2700 | 150 | 90 | 75 | 3015 |
| 5 | 0 | 2700 | 300 | 135 | 90 | 3225 |
| 6 | 0 | 6150 | 150 | 215 | 115 | 6630 |
| 7 | 22000 | 32250 | 0 | 1125 | 75 | 55450 |
| 8 | 22000 | 32250 | 0 | 1125 | 75 | 55450 |
| 9 | 22000 | 20250 | 0 | 1075 | 75 | 43400 |
| 10 | 22000 | 20250 | 0 | 575 | 75 | 42900 |
| 11 | 22000 | 20250 | 0 | 675 | 75 | 43000 |
| 12 | 22000 | 18750 | 0 | 575 | 75 | 41400 |
| 13 | 22000 | 18750 | 0 | 575 | 75 | 41400 |
| 14 | 22000 | 21150 | 0 | 575 | 75 | 43800 |
| 15 | 22000 | 6150 | 0 | 635 | 105 | 28890 |
| 16 | 22000 | 34650 | 0 | 1105 | 105 | 57860 |
| 17 | 22000 | 32250 | 0 | 1135 | 105 | 55490 |
| 18 | 0 | 8850 | 0 | 165 | 130 | 9145 |
| 19 | 0 | 10110 | 600 | 215 | 135 | 11060 |
| 20 | 0 | 8400 | 600 | 195 | 135 | 9330 |
| 21 | 0 | 9300 | 600 | 180 | 120 | 10200 |
| 22 | 0 | 9450 | 450 | 165 | 90 | 10155 |
| 23 | 0 | 5100 | 300 | 135 | 90 | 5625 |
| 24 | 0 | 2700 | 150 | 90 | 90 | 3030 |
| Sum | 242000 | 330510 | 3750 | 11030 | 2210 | 589500 |
| Night | 80460 | |||||
| Day | 509040 | |||||
Table 19.
Specification of fuel.
| Quantity | Value | Units |
| Total fuel consumed | 59901 | L |
| Avg. fuel per day | 164 | L/day |
| Avg. fuel per hours | 6.84 | L/hours |
Disclaimer/Publisher’s Note: The statements, opinions and data contained in all publications are solely those of the individual author(s) and contributor(s) and not of MDPI and/or the editor(s). MDPI and/or the editor(s) disclaim responsibility for any injury to people or property resulting from any ideas, methods, instructions or products referred to in the content. |
© 2025 by the authors. Licensee MDPI, Basel, Switzerland. This article is an open access article distributed under the terms and conditions of the Creative Commons Attribution (CC BY) license (http://creativecommons.org/licenses/by/4.0/).
Copyright: This open access article is published under a Creative Commons CC BY 4.0 license, which permit the free download, distribution, and reuse, provided that the author and preprint are cited in any reuse.


