Submitted:
10 July 2023
Posted:
11 July 2023
You are already at the latest version
Abstract
This paper focuses on designing and assessing Pumped Hydroelectric Energy Storage Systems (PHES), connected to the grid and PV system for self-consumption structured at Mutah university in an area of high solar potential. In focusing on PHES and PV literature was made to have data on the field, based on the grid code needed in Jordan. Next, a prospection to find the proper location for the installation was done. Afterward, a load profile was inserted to know the energy demand of the university. Then The productivity of the solar power plant of Mutah University was included. Finally, MATLAB software was used to realize the amount of energy to be stored, this data was used to implement the system which was chosen and sized. PHES layout was created to find the most accurate values for parameters to optimize the system performance, and to investigate the loss analysis. The system attains 9230.89 MWh/year. An annual load yields 4430 MWh/year, which covers the Mutah university demand with an estimated saving of 2039773 JD.
Keywords:
photovoltaic systems
; pumped hydroelectric
; energy storage systems
; annual energy production-energy demand.
1. Introduction
One of the most major concepts in the twenty-first century is energy. With increased fossil fuel consumption and rising air pollution, there is a strong demand for efficient energy and searching for clean renewable energy resources that can replace fossil fuels to support the growth of our economy and society. A renewable energy system, which produces energy by converting natural phenomena into useful forms of energy, is one of the options. Solar radiation, wind turbines, hydro-power, geothermal heat, and biomass energy are usually the most widely renewable energy sources, [1,2]. Solar energy, which is the radiation light, and heat from the sun that has already been collected by humanity using a variety of ever-evolving technology, accounts for most of the available renewable energy on Earth. PV technologies are one of the most efficient ways to harness solar energy to generate electricity, and they can range in size from small roofs or portable systems to large utility-scale producing plants. Geographically and climatically, Jordan offers some of the best wind and solar energy in the world. A major factor would be the requirement to use more renewable energy sources. Jordan is regarded as an exceptional nation due to its abundant solar energy resources, which can satisfy the majority of the nation’s energy needs. Jordan is also a sunbelt state, meaning that much of its territory is subject to exceptionally strong solar radiation. Jordan is located between latitudes 32o North and 36o East, [3,4]. Jordan experiences 3125 hours of sunshine annually, or nearly 300 bright days, with an average daily solar radiation of between 5 and 6.5 kWh/m2. The first private-sector solar PV project which has been conducted in 2013 was the Applied Science Private University (ASU) project, which has a capacity of 250 kW and fulfills 25% of the university’s energy requirements. In addition, with a 5.17 MW capacity, Al Azraq solar energy complex was finished in 2015. Future private and public sector solar PV plant development plans have been made for the 200 MW and 100 MW Almafraq and Al-Quweira solar PV plants, respectively, [5]. At Ma’an, Aqaba, and Almafrak, other projects with a combined capacity of 400 MW have also been assigned. The first solar project developed by the government was the 52.5 MW Shams Ma’an Solar PV power station. In line with the world record price of 5.89 US cents/kWh, the Shams Ma’an Solar PV power facility reportedly offered an unusually low tariff of 6 US cents/kWh, [6]. Jordan created an environment that encourages investment in renewable energy, primarily solar and wind energy, allowing public and private institutions, as well as homes, industry, and commerce, to rely on renewable energy systems for their consumption purposes and lower their electricity bills. These advances are following a national strategy targeted at increasing the amount of renewable energy to 10-11 percent by 2021, equating to 1.600 MW of renewable generating capacity. The plan was recently modified, reflecting the government’s progress in developing many of its sections. For example, initial plans planned for 600 MW of solar energy which has been installed by 2020, but significant advances in solar technology have prompted local governments to raise this goal to 1000 MW, [7]. The solar energy sector in Jordan will keep growing. As a result, if the electricity distribution company fails to employ an effective energy storage system, there will be an unbalance between the energy produced by PV solar plants and the amount of energy demand. A promising alternative approach to load balancing and energy storage is the use of PHES systems. By releasing energy during times of high demand and using it to pump water into a high-potential energy reservoir during times of low demand, they can also profit from daily variations in the price of energy. The amount of energy storage methods already exists, some of which have been around for centuries. The purpose is to make them stable, dependable, and cost-effective while applying the best technology to each energy source or location, [8]. The many technologies available for energy storage are frequently classified according to the purpose of the energy storage, with the most popular being the form of energy storage and the period of release. PHES stations for storing energy are one of the most important and well-known effective solutions for storing electrical energy. This type of station is similar in design to electrical resistive stations on dams but differs in the mechanism and of the objective operation, [9]. The electricity consumption may rise at specific times of each day or every year (based on the weather, operating air conditioners, and electric heaters). When the electricity consumption exceeds the amount of production, the electricity companies are forced to increase their output, to satisfy the customer demands and compensate for the lack. Therefore, using stored electrical energy when needed will be a great advantage. On either side, the electricity consumption may reduce throughout a single day, or the generation of electric energy may be larger than the demand at a specific point in time. Energy sources having difficult-to-control resources are usually the source of this excess output. This is why, electric providers try to store energy that is excess to the demands of the consumers so that it can be used when there is need for electricity rises, [10]. Future energy in Jordan will mostly depend on the storage system for non-distributable renewable electricity generation. Moreover, the quick management of electricity flow to power grids will be necessary due to the rapid proliferation of renewable energy systems, [11]. This the main objective of this study is to determine whether it is feasible to build a PHES system in Jordan that uses water pumping to a high-elevation reservoir to reduce the waste energy produced by solar panels during off-peak demand. On the other side, this high-potential energy water will be provided to hydropower turbines during periods of peak demand to meet the demand for electricity on the grid. Jordan also possesses several solar energy systems in its north and south regions, which
2. Methodology
2.1. Location survey
In general, the PHES system is made up of two reservoirs separated by a large elevation difference. High-elevated regions, such as a hill or mountain, should be considered for PHES construction. The lower reservoir is close to the power plant at the lower end of the hill, while the upper reservoir is at the top. At the top and bottom of the hill, there should be enough place for water storage.
2.2. Energy storage capacity
Determining the quantity of energy, the PHES system can store was the target. The procedures listed below can be used to estimate the volume of water required to determine the quantity of electrical energy that can be converted into potential energy in the high-elevation storage, [12]:
1. Estimate the rated pumping head.
2. Determine the volume flow rate of water in the higher reservoir when a pump with a 1 MW rated power is employed to raise the water level to the rated head.
where:
𝑄𝑃= PP×ɳP g×ρ×h
𝑄𝑃: Rated volume flow rate (𝑚3 /𝑠).
𝑃𝑃: Rated Pump Power (𝑊).
ɳ𝑃: Pump efficiency.
𝑔: Acceleration of gravity (9.8 𝑚⁄𝑠2).
𝜌: Density of water (1000 k𝑔/𝑚3).
ℎ: Head (𝑚).
3- Identify the number of hours a pump can run continuously at a given rated power in each period.
4- After calculating the rated flow rate in step 2 and the number of hours in step 3, estimate the volume of the upper reservoir that is needed.
where:
𝑉𝑅=𝑄𝑃×𝑇
VR: The upper reservoir’s volume. (m3).
T: Pumping time (s).
The system capacity can now be extended by multiplying the necessary rated pumping power by the volume of the top storage, which was previously used to only store energy for 1 MW rated pumping power.
2.3. Required site in Jordan
It is so important to remember that meeting the required site’s geographical specifications is not simple. Therefore, to lower the capital infrastructure total cost project, it is required to investigate and discover the best places that can meet the highest number of PHES installation requirements.
2.3.1. Mutah university
Mutah University is located in southern Jordan, where a solar energy project provides energy to the university. The PV solar project at Mutah University is shown in Figure 1. The University of Mutah has several colleges and sites outside its main campus, so the university was forced to link the solar power plant and operate it with the Wheeling system and in agreement with the Electricity Distribution Company. The maximum load of the University of Mutah is (6.4 MW). The solar power plant is designed with a nominal capacity of (5MW) and the actual capacity of the station is (4.4 MW). The Electricity Distribution Company collects (7 fils) for every kilowatt produced, and a transit cost allowance of (6%) as an allowance for electrical loss. Thus, the actual capacity of the solar energy project at the University of Mutah is 4.4 MWP.
Since the annual daily average of solar radiation received at a tilt angle of 22º is 6.27 kWh/m2, the location has a significant solar energy potential.
2.3.2. Candidate Reservoir Locations
The possible candidate reservoir locations are near the electric grid. This is beneficial in terms of the cost of construction (i.e., reducing the electrical transmission expenses). According to Figure 2, the height between the top and lower storage is approximately 85 m. Upper storage is at an elevation of 1130 m above sea level, while the powerhouse is at a height of 1045 m.
A comprehensive evaluation of the water balance for the storage volume, inflow, and outflow rate volume is required to estimate the amount of electrical energy that can be stored in the planned PHES system at Mutah University and to guarantee that the water level is available throughout the storage process. The methodology described in Section 2.2 can be used to calculate the amount of water needed to operate the PHES system in the potential locations. The rated discharge from the pump at the rated head is calculated to be 1.079 m3/s using equation 1 and the rated pumping head at the proposed site with a height difference of 85 m. Using equation 2 and the assumption that the pump will run continuously for 12 hours, a volume of upper storage of 46.627*103 m3 is needed. The upper storage, which was previously used to store water for only 12 hours at 1 MW rated pumping power, may now easily be expanded to increase system capacity by multiplying the required rated power pump by the volume of the storage. If a PV solar system with a 5 MW capacity is employed, 233.135 x 10³ m3 of upper reservoir space will be needed to store energy for 12 hours.
2.4. Design of PHES
Grid-scale energy storage technologies such as PHES systems can aid in the growth of the nation’s energy sector. They give grid stability, which ensures that electric supply reliably meets electrical demand in real-time. The biggest challenge in ensuring reliability is that the power source has no shelf life; it must be generated when required, and electricity demand is changing all the time. Electric energy is converted into hydraulic potential energy in PHES systems, which can be stored until needed and then converted back into electricity. This supports the electrical grid by assisting the balance of power flow across the distribution network by storing excess energy when electricity demand is low and releasing it when demand is high. These systems combine a hydropower generating set, a turbine, a generator, and an electric pump. The system may operate in one of two modes; where water is pumped into the higher reservoir in the pumping mode; and in the generating mode, where water is released into the lower reservoir and passes through turbines attached to the electric generators, [13].
2.4.1. Turbine selection for case study
In the initial stages of the design process, a few fundamental machine requirements should be addressed. For a hydraulic turbine, these would be the required head H, volumetric flow rate Q, and rotational speed N, [14]. Figure 3 illustrates the relationship between the primary hydraulic turbines’ total head H (m), flow rate Q (m3/s), and power capacity P (MW). In this research, P = 1 MW, Q = 1.07 m3/s, and the rated head H = 85 m were used to calculate each set’s capacity. It could be shown from Figure 3 that Francis turbines will perform well, but this is insufficient to make a choice.
The specific speed Ns is a non-dimensional parameter that is typically used to select the most suitable machine. The value of Ns provides a guide to the type of machine that will meet the specified typical demand of high efficiency. Equation 3 can be used to calculate it, [15]:
where N is the runner’s speed in RPM, P is the power output in hp, and H is the head’s height in feet. Figure 4, which represent a selection chart for Francis turbines and illustrates the relationship between the head (m), flow (m3 /s), power (MW), penstock diameter (m), and runner speed N, can be used to determine N in this study where P = 1 MW (1341.02 hp), H = 85 m (278.87), and (RPM). The optimum inlet diameter is decided to be 0.5 m, and the runner speed is found to be 1000 RPM after matching the values of H, P, and Q in the chart.
𝑁𝑠 = 𝑁×P 0.5 /H 1.25
Calculations are now feasible to 𝑁𝑠 by substituting N, P, and H in equation 4:
𝑁𝑠=𝑁×P 0.5 /H 1.25 = 1000×1341.02 0.5 /278.871.25 = 32.13
According to [14] the specific speed ranges over many models of hydraulic turbines. The range of Ns for a Francis turbine is shown below (20-100). As a result, Francis turbine will be the ideal turbine for this work.
2.4.2. Identification of PHES site for the case study in Jordan
There is a valley in the location that has all the properties described, and it is near the Mutah solar project, so it can be used in the PHES system design process. As a result, it is the ideal potential location for use as a case study in this research to design a PHES system. The topographical map for the suggested storage system region, which contains the system components: upper reservoir, powerhouse, and lower reservoir, is shown in Figure 2.
2.5. Specifications of storage system’s components
The upper reservoir, lower reservoir, powerhouse, and conduit are the four components of the storage system. They are described in the following sections.
2.5.1. Upper reservoir
It is a water pool at the top of a hill that creates a suitable height of water to flow into the low water reserve. The proposed upper reservoir will be located on the top proper hill, as seen in Figure 5. The hill’s crest is 1130 m above sea level, with a proper storage contour at 1045 m. The area of the upper reservoir that is available is 240× 103 𝑚2 with a dimension of 600 m length and of 400 m width.
2.5.2. Lower reservoir
It is a water pool for storing a volume of water in a low area compared to the high-water reserve and nearest to what is directly beneath it. The selected lower reservoir is located near the university at a height of 1045 m above sea level.
2.5.3. Powerhouse
The power plant would be at the lower reservoir, near the end of the water channel. In pumping mode, the power needed to pump the rated discharge into the higher reservoir is calculated as follows:
where:
𝑃𝑃 = 𝛒×𝐠×𝐡×𝐐𝐏/ɳ𝐏
𝑃𝑃: Rated Pump Power (𝑊).
𝑄𝑃: Rated volume flow rate (𝑚3/𝑠).
ɳ𝑃: Pump efficiency.
𝑔: Acceleration of gravity (9.8 𝑚⁄𝑠2).
𝜌: Density of water (1000k𝑔/𝑚3).
The suitable region of the upper storage, as mentioned earlier, has a contour at 1130 m above sea level, resulting in a minimum head of 1045 m and a rated head of 85 m. The top reservoir’s effective storage capacity, which can be used to produce energy, is thus decreased (233.130×10³ 𝑚3). It is suggested to add 5 reversible pump-turbine sets; each has a rated capacity of 1 MW. Equation 1 can be used to determine the rated discharge from each turbine at the rated head, rated power output, and 0.9 generator efficiency. This value is 6.66 m3/s. It is predicted that the lower reservoir’s water level will always be maintained at 1045 m above sea level. The amount of water that can be pumped into the higher reservoir from the lower reservoir is 1.079 m3/s using a pump that has a rated capacity of 1 MW, an average head of 85 m, and a pump efficiency of 0.9. The properties of the suggested PHES system are shown in Table 1.
2.5.4. Conduit
It consists of several pipes that are joined to each other and connect the higher reservoir to the lower reservoir. The 85-m-long water conduit uses the pump turbine to link the lower reservoir to the upper reservoir. As a result, the L: H ratio is computed to be 1.081 (1130/1045), which is within the allowable design range. A variety of fittings would be necessary (e.g., elbow fittings, pipe entrance fittings, and container exit fittings), which may raise friction losses in the piping system.
2.6. Piping design
Maintaining fluid velocities around 7 m/s through all piping connection joints is required. This is advised for a variety of reasons, [17] (Friction Loss, vibration and noise, erosion / corrosion, hydraulic shock, and extremely high velocity).
2.6.1. Pipe diameter calculation
As previously noted, calculating the right diameter of the piping system is critical to keep a volume flow-rate within the acceptable range. The following procedure can be used to determine its value, [18]:
1- Identify the rated volume flow-intended rate’s velocity v (m/s).
2- Identify the rated volume flow rate.
3- Calculate the pipe’s section area using the formula below.
where: A: section area (𝑚2), Q: volume flow-rate 𝑚3/𝑠, v: velocity (m/s).
𝐴= Q/v
4- As the pipe has a circular area, the suitable diameter may be calculated using the equation below.
𝐴=𝜋× 𝒅𝟐/𝟒
The designed velocity for pumping mode is 5.8 m/s, and the rated flow rate Q is 1.079 𝑚3/𝑠. The diameter of the piping system is 0.18 m after following the above procedure.
The volume flow rate in generating mode is larger than in pumping mode, even though both have the same diameter of 0.18 m. As a result, the velocity is 7.3 m/s, which is within the allowed limit.
3. Power System Modelling
3.1. Power system characteristics
The main components of the proposed configuration are represented in Figure 5.
3.1.1. PV solar power plant at Mutah University
The PV solar system consists of:
Solar photovoltaic modules (14738) and monocrystalline modules (type JA solar). The characteristics of the modules are shown in Table 2.
Solar Inverter: one of the most critical parts of a solar PV system. It changes PV direct current (DC) into alternating current (AC). The characteristics of the inverter utilized in the Mutah University project (type of SMA Solar Inverter) with several 84 are given in Table 3.
Two 1500 kVA and Two 1000 kVA transformers are used to step up the 0.48 kV voltage to the medium voltage to connect the PV power plant to the grid. In this work, the power system will simulate the addition of 5 MW of solar power and electrical load in 2020/2021 for the university, as well as the addition of PHES. As a reference percentage for the rating component, the actual hourly solar energy productivity data obtained from Mutah university solar energy will be used. Figure 6 shows daily figures for Mutah University’s solar PV system, which has a total capacity of 5 MW.
3.2.2. Defining PHES
The amount of energy to be stored will be determined by monitoring the load flow between electrical loads and solar energy output. The amount of energy stored in PHES is depends upon the behaviour of PV generation and demand energy, [19]. where the power generated (𝑃𝐺𝑒𝑛), must meet the power demand load, (𝑃𝐷𝑒𝑚) are shown in equations 8, and 9 respectively:
where 𝑃𝑃𝑉(𝑡), and 𝑃𝑃𝐻𝐸𝑆(𝑡) are the power produced by the PV, and PHES, respectively. It should be noted that:
𝑃𝐺𝑒𝑛(𝑡) = 𝑃𝑃𝑉(𝑡)
𝑃𝐷𝑒𝑚(𝑡) = 𝑃𝐺𝑒𝑛(𝑡) ± 𝑃𝑃𝐻𝐸𝑆(𝑡)
- -
- If 𝑃𝐷𝑒𝑚(𝑡) > 𝑃𝐺𝑒𝑛(𝑡), the extra power from the hydro-turbine, 𝑃𝑃𝐻𝐸𝑆(𝑡) > 0, and makes up the shortfall in the power generated from the 𝑃𝑃𝑉(𝑡).
- -
- If 𝑃𝐷𝑒𝑚(𝑡) = 𝑃𝐺𝑒𝑛(𝑡), 𝑃𝑃𝐻𝐸𝑆(𝑡) = 0; the power generated by the 𝑃𝑃𝑉(𝑡) is just sufficient to supply the demand.
- -
- If 𝑃𝐷𝑒𝑚(𝑡) < 𝑃𝐺𝑒𝑛(𝑡), PHES 𝑃𝑃𝐻𝐸𝑆(𝑡) < 0; and the excess power generated is stored by the PHES.
3.2.3. Defining the electrical load data
All of Mutah University’s energy loads will be included in the simulated power system. The characteristics of the load profile are obtained from Electrical Distribution Company (EDCO0. Taken from the Actual hourly load data consumption of electrical energy for a year (5/12/2020-14/9/2021).
3.2.4. Electrical power losses in distribution lines
The fact is that the unit of electric energy generated by power plants is different from the unit of electric energy provided to the customers. In the network, a certain percentage of the energy is lost. Distribution loss is the difference between the generated and distributed units.
3.3. Load flow
A purpose of a power flow study is to investigate whether current, voltage, active power, and reactive power are flowing through a system at any given load. The load flow study will investigate the voltage and power factor across all buses as well as the current or power flow across all feeds, [20]. To determine the steady-state operational characteristics of the power system for a specific load and generator real power and voltage settings, load flow calculations are utilized. Once we have this data, we can easily calculate the active and reactive power flow in each branch as well as the power losses. The power systems data are calculated using the Newton-Raphson approach in the Load Flow study. To start, a four-bus AC distribution system is used to test the suggested load flow computation approach. The first bus is a slack bus that represents the grade and has voltage values of "1 p.u." and "0.22728 degrees" in terms of phase angle. transmission lines are also connected to a step-down transformer that converts 33 kV to 11 kV and has a base value of 10 MVA. The university’s loads are supplied through a ring main electrical power distribution system by this transformer, which is connected to an AC substation. Renewable generation units are connected to a power frequency transformer that runs at 50 or 60 Hz and has a complex power of 10 MVA. This transformer is typically used to step up the output voltage, typically 11 kV, to the medium voltage level to achieve a compact and lightweight direct grid connection for solar PV (typically 33 kV). In the situation where the energy produced by the solar station is greater than the load that needs to be stored, the storage system is connected to the line so that it can sense changes in the load flow and utilize the extra energy. This stored energy is used at moments of peak load when the amount of energy generated is less than the amount consumed, as well as during times when there is no generation (at night), allowing the stored energy to be released and used to meet the demand.
4. Results and Discussions
The simulation results for the designed system will be displayed so that they can be compared and hence, valuable information on the design and dimensioning of the PHES for the real plant may be obtained.
4.1. PV Solar power results
Generated energy, like other electrical metrics, is a good predictor of an energy system’s efficiency, which is why it was the first to be plotted. Because solar energy is best seen in terms of time, a bar graph was created in which the solar energy generated by each software throughout the 10 months of 2020-2021 (plotted on the x-axis) was compared. Values for both active power in Kw and reactive power in k(VAR)as were plotted separately as shown in Figure 9 well as the PV system so that any differences could be seen and investigated. Figure 7 shows how the station’s productivity varies depending on the season, solar radiation, and other factors. The station had the highest production value, at 4800 kWh, and a productivity of 9280.61 MWh.
4.2. Load profile results
Figure 8 represents the load at Mutah University for a year, with no storage system. The change in university loads as a function of the seasons is shown in this Figure 10. The largest loads and energy use were found to be in the winter season, due to the use of a lot of energy, especially for university heating, while the consumption was nearly half in the summer.
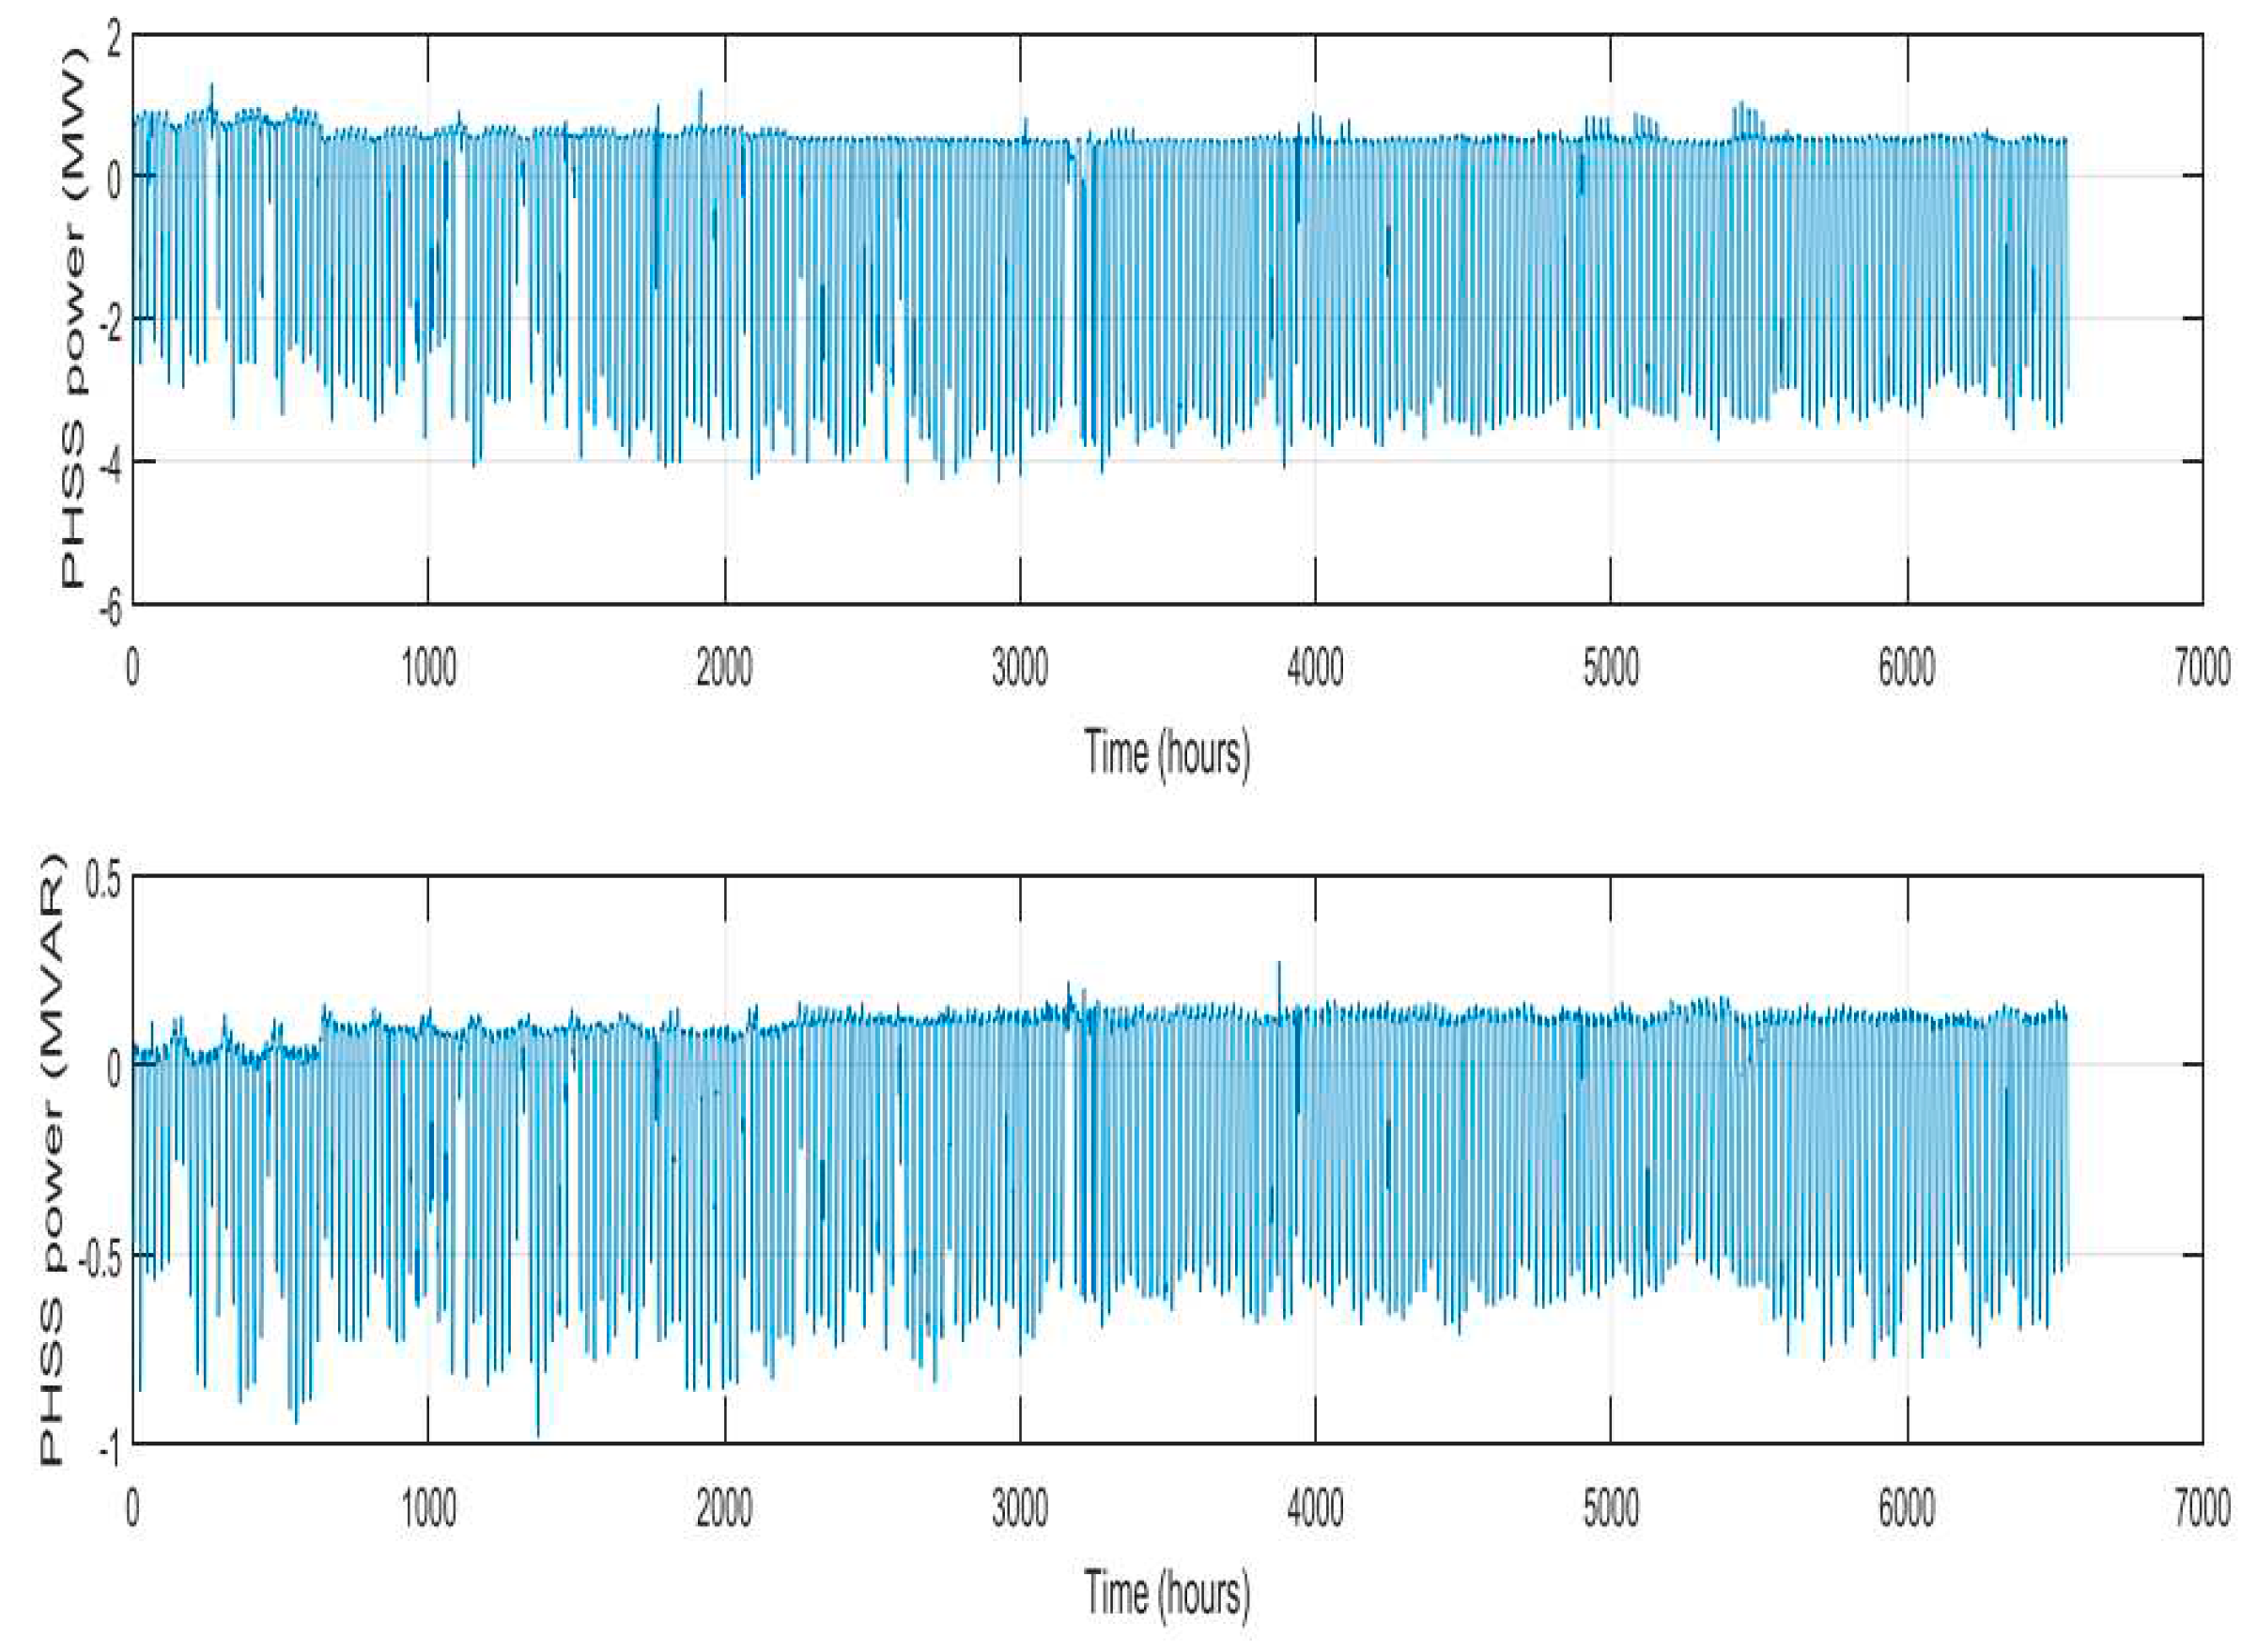
4.3. PHES results
Now, with the addition of the PHES unit and a complete system connection, it appears that the system has two operations: storage and pumping. The excess energy in the loads due to the energy productivity will be stored by operating the pumps and pumping the water into the high storage area, and this process will continue throughout the day until the loads exceed the energy productivity or the energy productivity values decrease, at which point the water will be fallen from the stored area to the low storage area. The turbines, in turn, drive the generators that give electricity to the university, so the storage and pumping process is largely determined by the solar station’s productivity and the greatest load for that day, as shown in Figure 9. It turns out that the PHSS Storage periods have negative sign energy, indicating that the system’s main energy is stored as Potential Energy. Positive sign energy indicates that the PHES pumps water from the stored area and produces electricity to feed the loads, indicating that the demand load and solar generation are matched. The PHES will only operate as a pump when there is a low demand load, and as a generator when there is a peak load. As a result, the system remains steady during its daily activity as a storage and power generation system. It will be reliable as a true grid alternative, allowing it to cover the university’s needs without relying on the grid. The values, results, and improvements presented thus far have been evaluated every year, but as mentioned earlier, the calculation tool can be optimized for other months of the year. This would allow the entire plant to produce more in addition to having a better understanding of how the item operates and what effects different factors have. Samples were taken for 48 hours to check the storage system’s behaviour.
Figure 9.
Annual PHSS power.
As shown in Figure 10, the load and productivity of the existing solar power plant were compared over the time. Samples were taken for 48 hours to check the storage system’s behaviour. It was found that during the production period of the solar power plant, the university load is fed from the PV-produced energy, and the excess energy is stored, until the peak period, when the PV energy produced decreases because of the decrease in the rate of solar radiation, the PHES system starts generating energy to feed the load, jointly with the PV solar energy production. When the plant stops producing power (at night), the PHES system continues to feed the university’s loads alone until the next morning day. Calculating the electrical maximum value that the design is based on PHES max 4.3089 MW, it was found that this value is close to the value that was mathematically imposed, which is (5 MW), therefore, good agreement between the mathematical assumption and the model was obtained a water storage system for PV system has been designed.
Figure 10.
PHSS power storage process and production process in 48 hours.
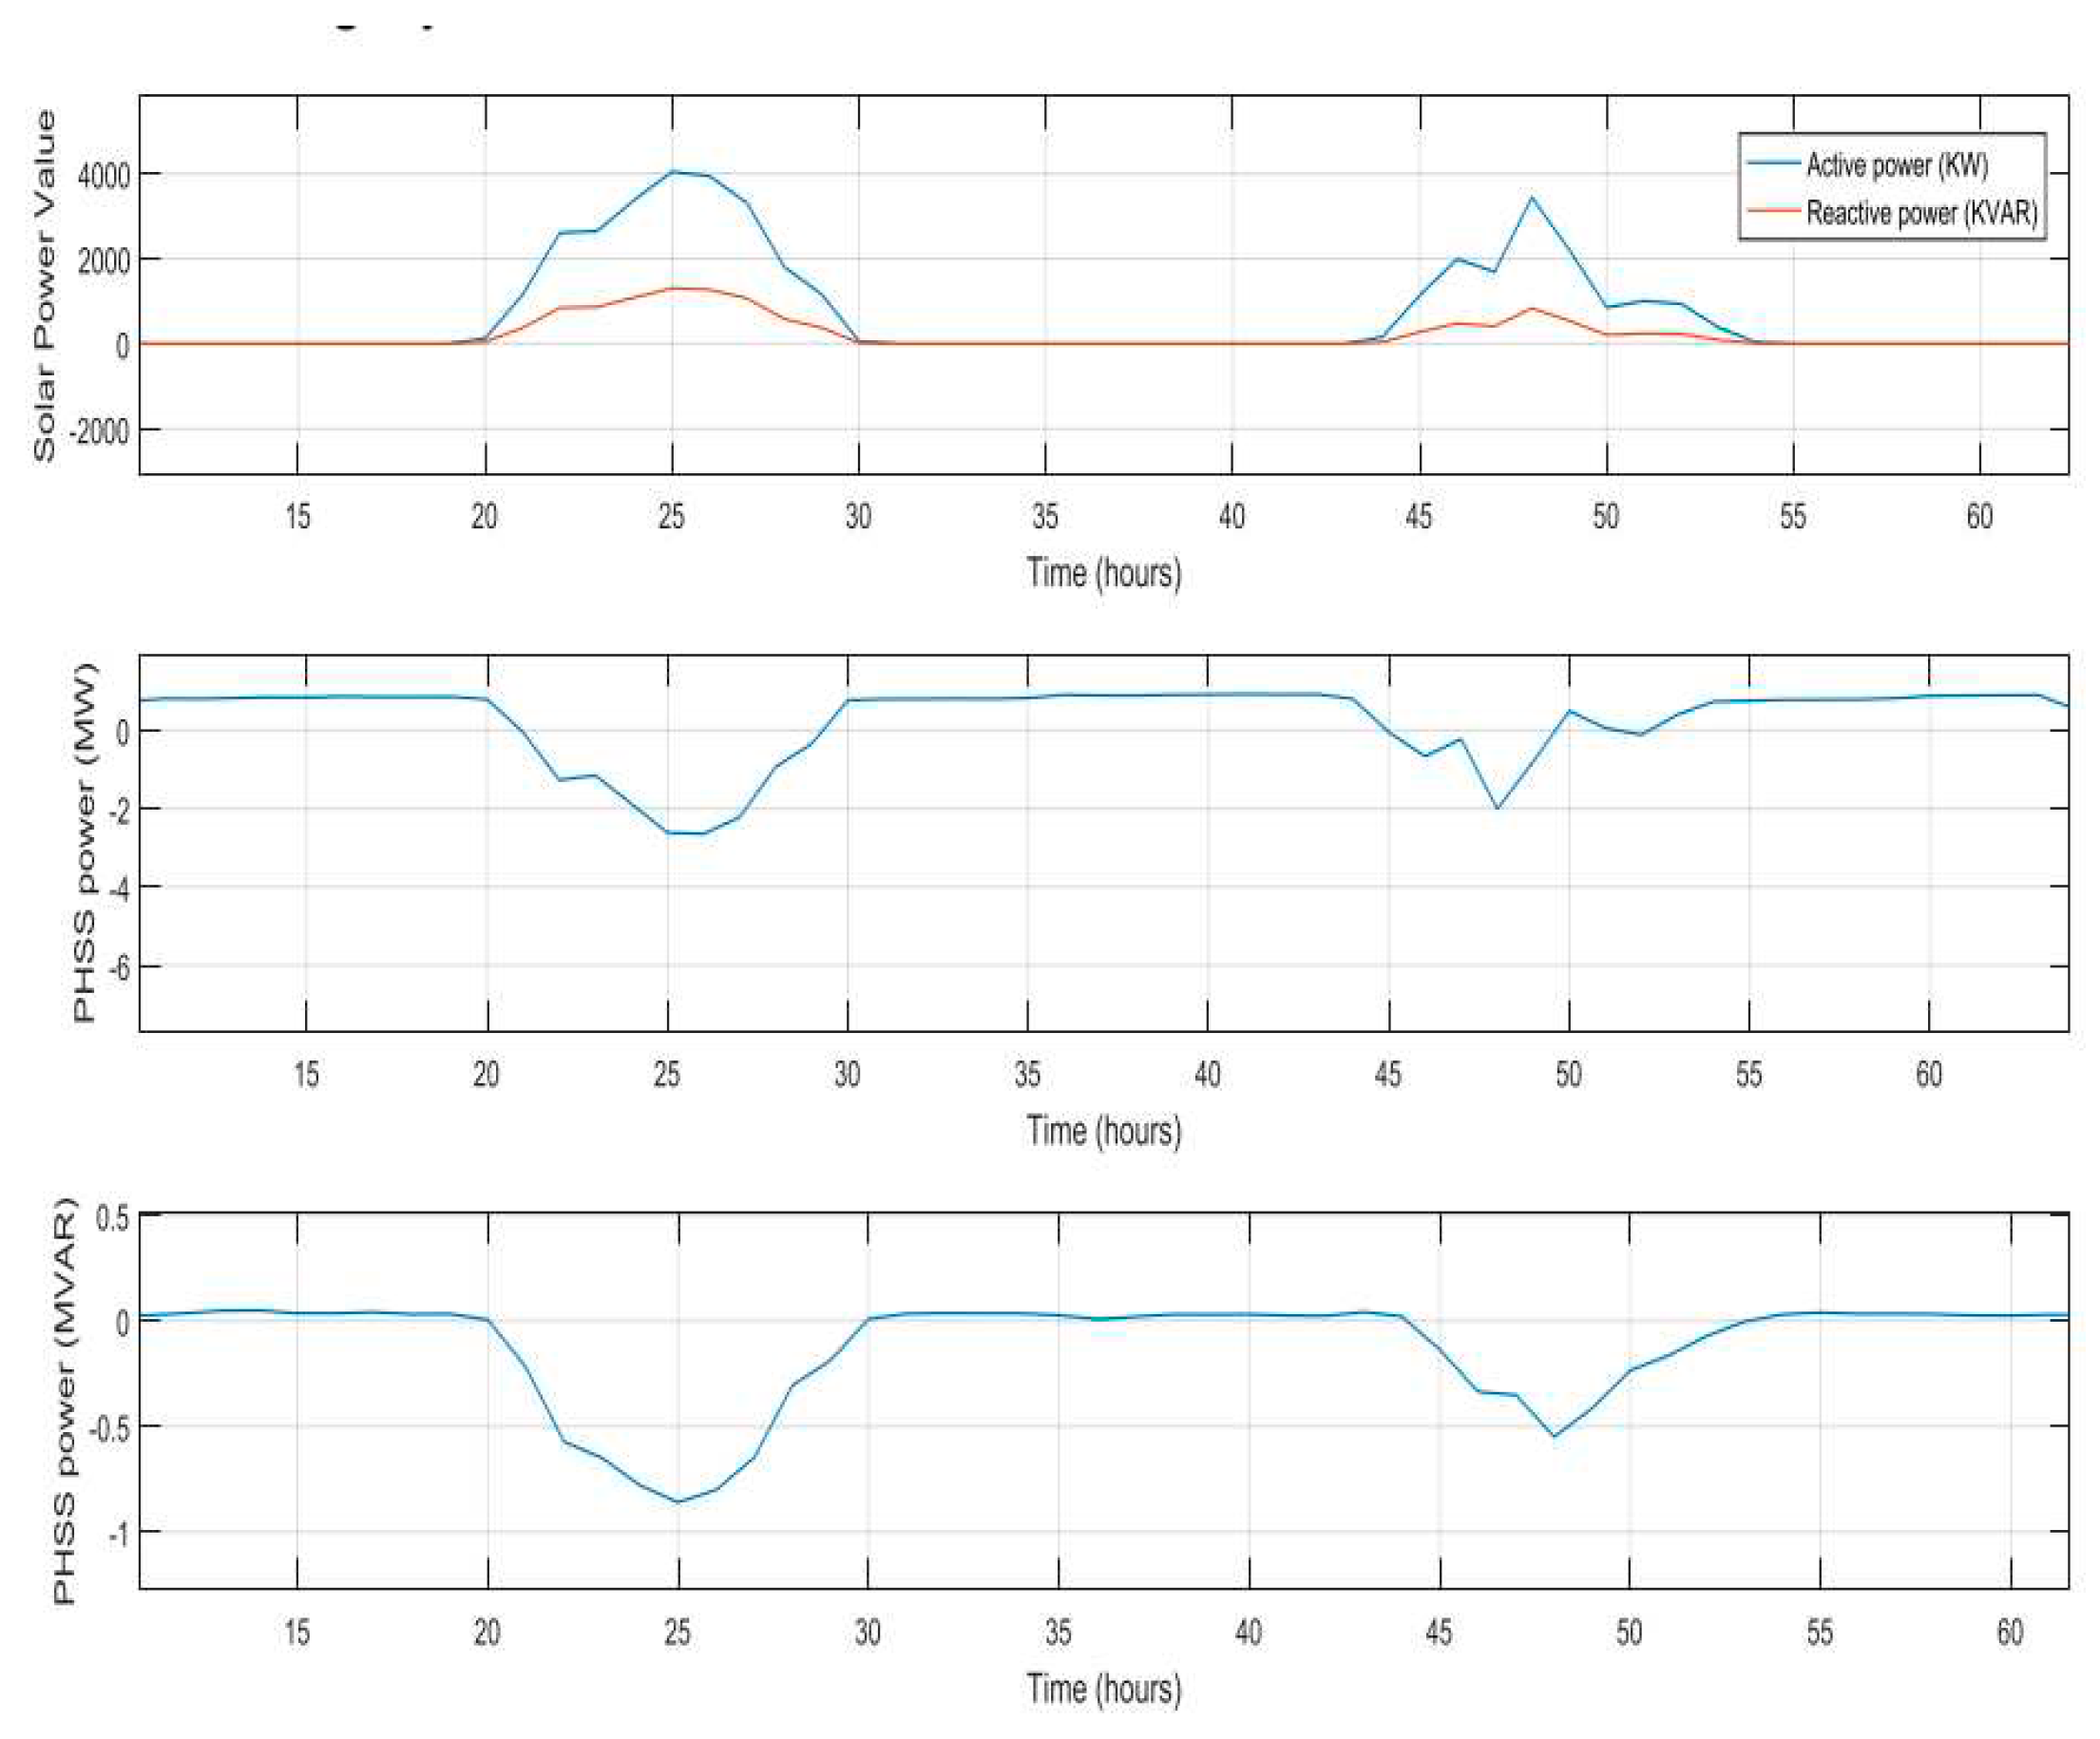
Figure 11 shows the power loss in the distribution network during the process of pumping and storing the required loads. These losses are caused by the distribution lines and their length, as opposed to the friction losses that occur in the pipes during the water flow in the system, and they are also caused by the distribution lines and their length.
Table 4 shows the average and maximum power losses of the proposed PHES system (in kW). As a result of the storage system’s operation on the network, total losses in the system were reduced, and the network became more stable and reliable.
5. Conclusions
Throughout this study, the effect of solar energy and PHES addition to Jordan’s electrical grid was investigated. Three main aspects of designing an energy storage system have been investigated: locating potential PHES installation sites at Jordan’s Mutah University; designing the PHES station; and simulating the actual power system module, which consists of solar generating units, loads, and PHES units. As a result of this research, we can conclude the following:
- Jordan has a significantly higher chance of installing PHES because all necessary prerequisites have been met.
- The system will run efficiently and independently of the national electric network, reducing the university’ transit costs to the electrical distribution company.
- The system renders an annual energy production of 9230.89 MWh/year, an annual load yield of 4430 MWh/year., which cover the Mutah university demand with an estimate saving of 2039773 JD.
References
- Alrwashdeh, S.S.; Alsaraireh, F.M.; Saraireh, M.A. Solar radiation map of Jordan governorates. Int. J. Eng. Technol. 2018, 7, 1664–1667. [Google Scholar] [CrossRef]
- Aboushi, A.; Hamdan, M.; Abdelhafez, E.; Turk, E.; Lbbini, J.; Abu Shaban, N. Water disinfection by solar energy. Energy Sources A: Recovery Util. Environ. Eff. 2021, 43, 2088–2098. [Google Scholar] [CrossRef]
- Hrayshat, E.S. , Al-Soud, M.S. Potential of solar energy development for water pumping in Jordan. Renew. Energ. 2004, 29, 1393–1399. [Google Scholar] [CrossRef]
- Al-Qawabah, S.; Al-Soud, M.; Althneibat, A. Assessment of hybrid renewable energy systems to drive water desalination plant in an arid remote area in Jordan. Int. J. Green Energy 2021, 18, 503–511. [Google Scholar] [CrossRef]
- Baniyounes, A.M. Renewable Energy Potential in Jordan. Int. J. Appl. Eng. Res., 2017, 12, 8323–8331. [Google Scholar]
- Hrayshat, E.S.; Al-Soud, M.S. Solar energy in Jordan: current state and prospects. Renewable Sustainable Energy Rev 2004, 8, 193–200. [Google Scholar] [CrossRef]
- Abu-Rumman, G.; Khdair, A.I.; Khdair, S.I. 2020. Current status and future investment potential in renewable energy in Jordan: An overview. Heliyon 2020, 6, 3346. [Google Scholar] [CrossRef] [PubMed]
- Hossain, E.; Faruque, H.M.; Sunny, M.S.; Mohammad, N.; Nawar, N. A Comprehensive Review on Energy Storage Systems: Types, Comparison, Current Scenario, Applications, Barriers, and Potential Solutions, Policies, and Future Prospects. Energies 2020, 13. [Google Scholar] [CrossRef]
- Thapar, O.D. Characteristics of large hydro generators of Dehar Power Plant. Proceedings 2nd world congress International Water Resources Association, New Delhi, India, December,1975, 17-24.
- Morley, J.; Widdicksb, K.; Hazas, M. Digitalization, energy and data demand: The impact of Internet traffic on overall and peak electricity consumption. Energy Res. Soc. Sci. 2018, 38, 128–137. [Google Scholar] [CrossRef]
- Sandri, S.; Hussein, H.; Alshyab, N. 2020. Sustainability of the Energy Sector in Jordan: Challenges and Opportunities. Sustainability, 2020; 12, 1–25. [Google Scholar] [CrossRef]
- Kabo-Bah, A.T.; Diawuo, F.A.; Antwi, E.O. Comprehensive Energy Systems, Pumped Hydro-Energy Storage System. 2023 Elsevier Inc.
- National Hydropower Association, Pumped Storage Report| National Hydropower Association. NHA. 2018.
- Dixon, S.L.; Hall, C.A. Fluid Mechanics and Thermodynamics of Turbomachinery, Hydraulic Turbines, CH9. 6th, 2010, pp. 303–355.
- Hatataab, A.Y.; El-Saadawia, M.M.; Saada, S. A feasibility study of small hydropower for selected locations in Egypt. Energy Strategy Rev. 2019, 24, 300–313. [Google Scholar] [CrossRef]
- Borges, C.L.T.; Pinto, R.J. Small Hydro Power Plants Energy Availability Modelling for Generation Reliability Evaluation. IEEE Trans. Power Appar. Syst. 2008, 23, 1125–1135. [Google Scholar] [CrossRef]
- Kolmetz, K. Piping hydraulics fluid flow line sizing and material selection. Kolmetz Handbook of Process Equipment Design, KLM Technology Group. 2018. [Google Scholar]
- Babajimopoulos, C.; Terzidis, G. Accurate explicit equations for the determination of pipe diameter. J Hydraul Eng 2013, 2, 115–120. [Google Scholar] [CrossRef]
- Nyeche, E.N.; Diemuodeke, E.O. Modelling and optimisation of a hybrid PV wind turbine-Pumped Hydro Storage Energy System for Mini-Grid Application in Coastline Communities, J. Clean. Prod. 2019, 250. [Google Scholar] [CrossRef]
- Afolabi, O.A.; Warsame, H.A.; Cofie, P.; Fuller, J.; Obiomon, P.; Kolawole, E.S. Analysis of the load flow problem in power system planning studies. J. energy power eng 2015, 7. [Google Scholar] [CrossRef]
Figure 1.
Mutah University solar project.
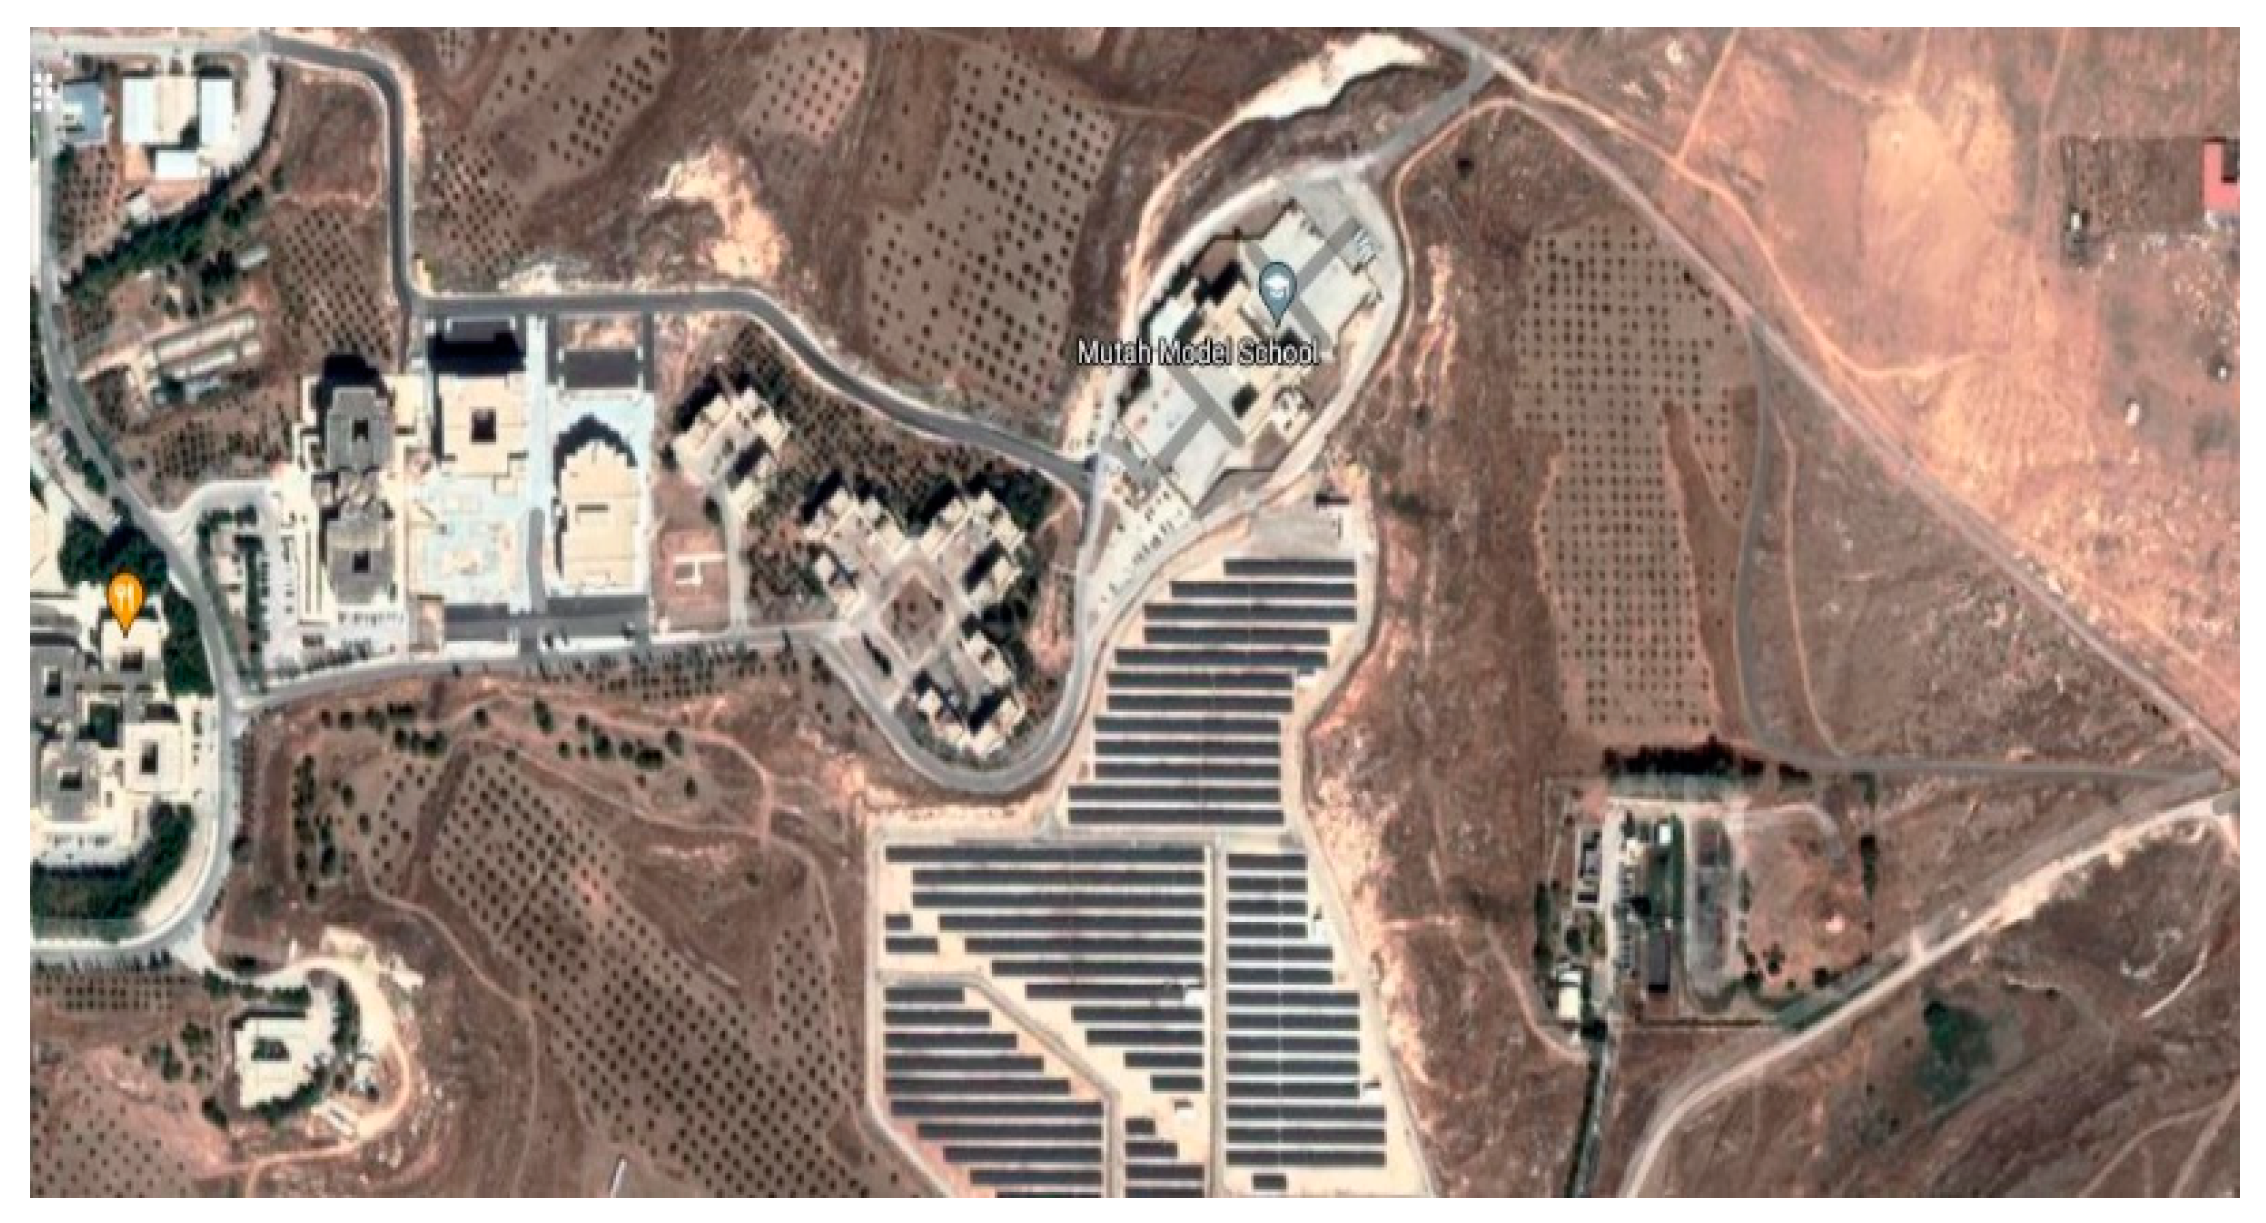
Figure 2.
Topography map for the proposed site.
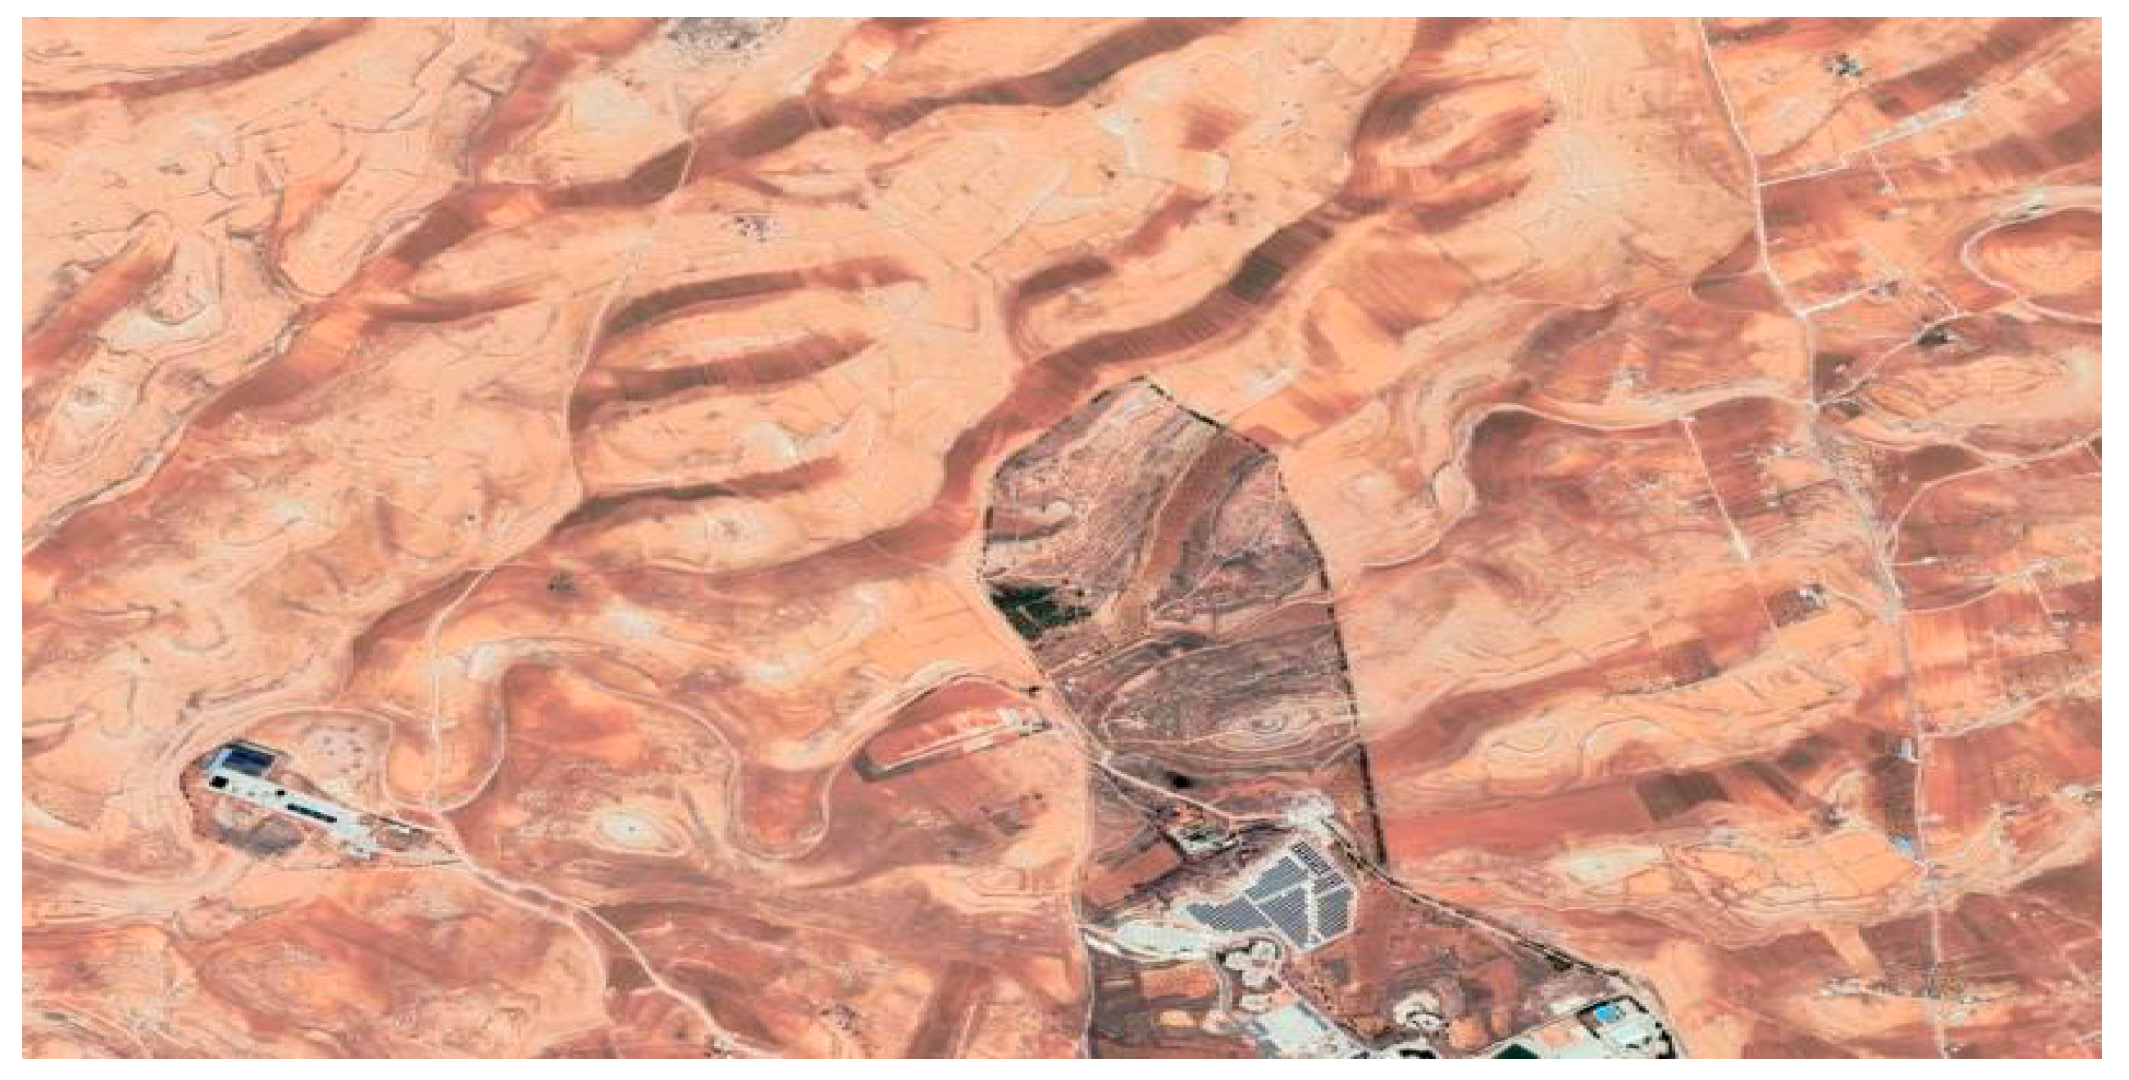
Figure 3.
Power capacity P (MW) of the main hydraulic turbines with head (m).
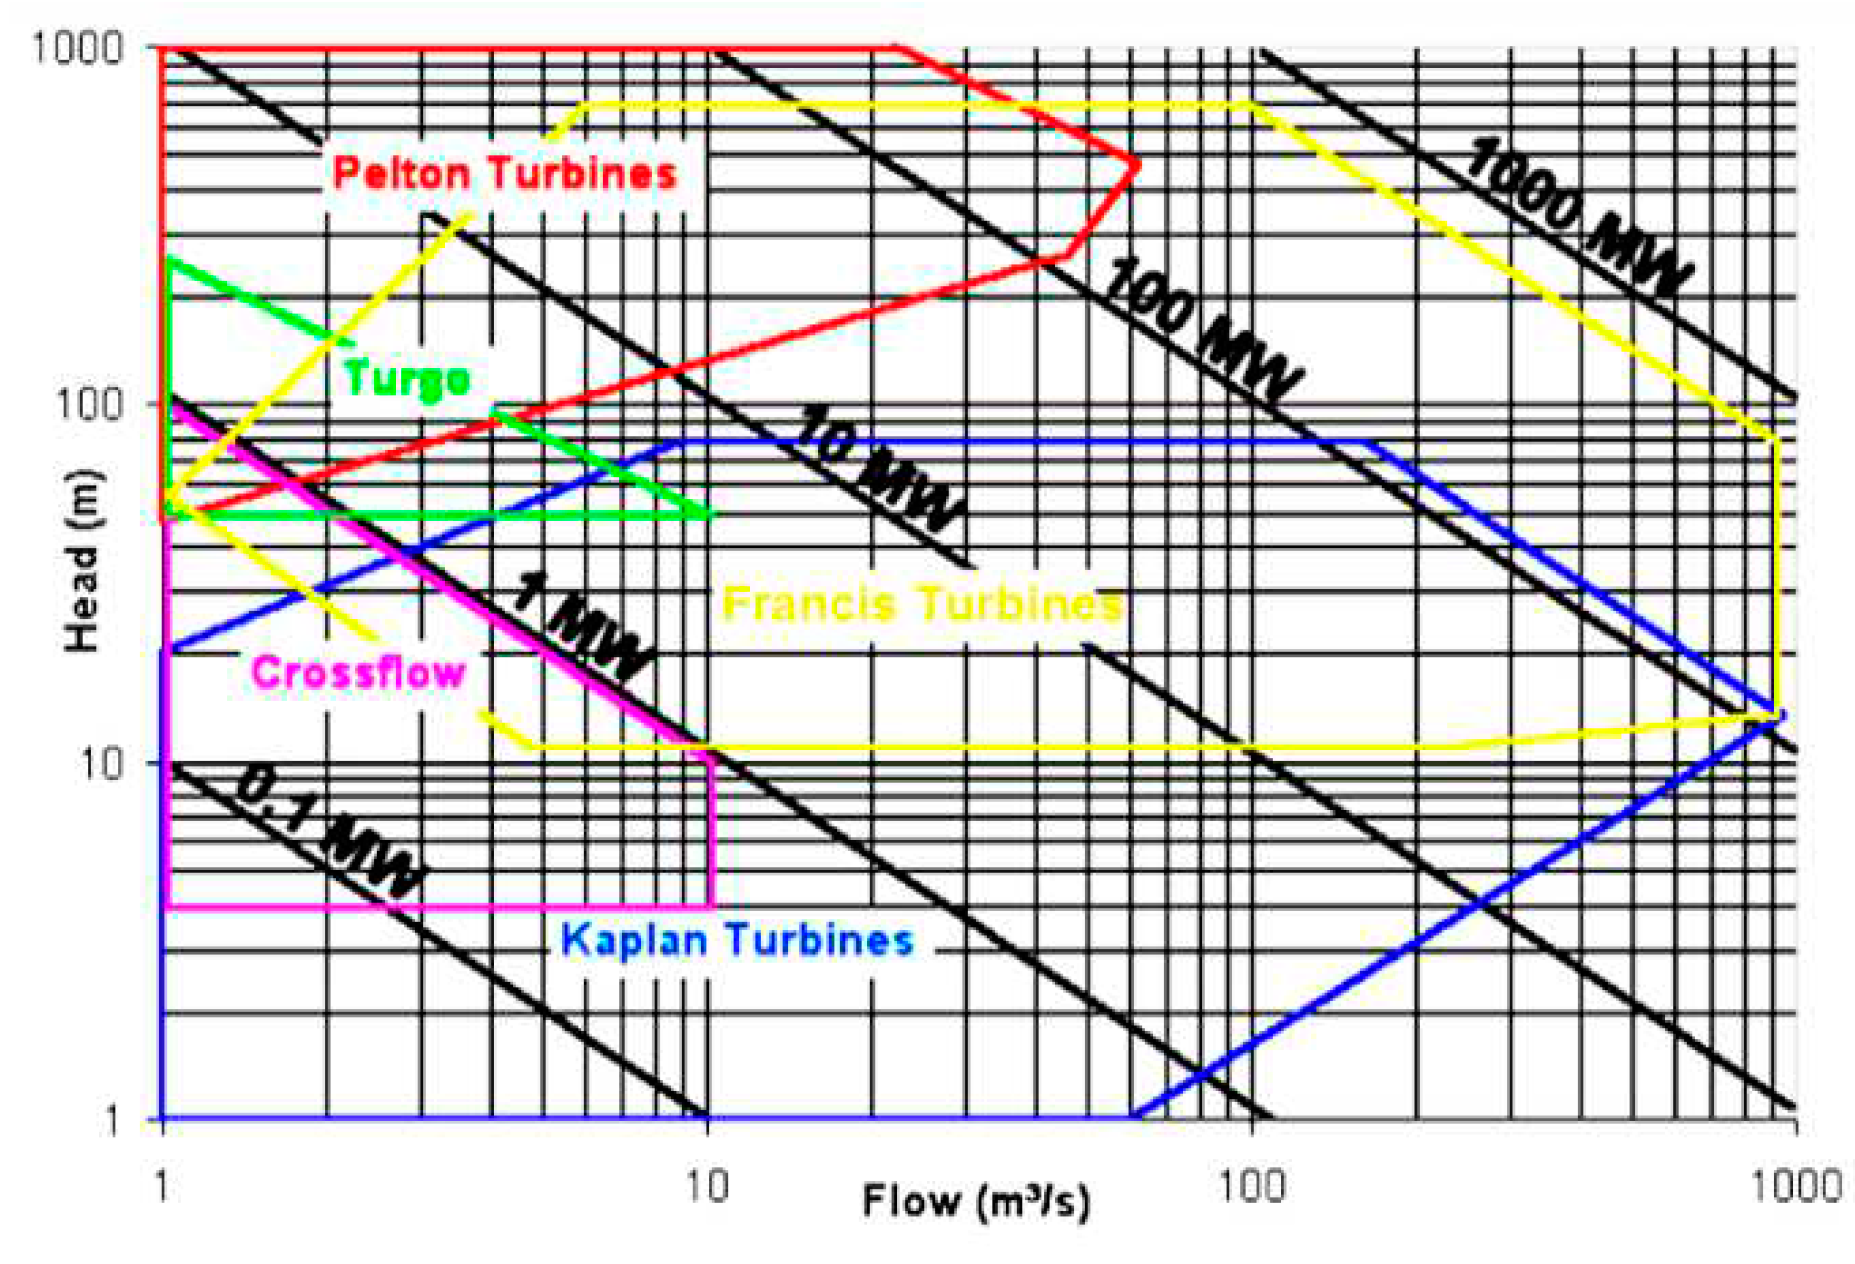
Figure 4.
Selection chart for Francis turbines, [16].
Figure 4.
Selection chart for Francis turbines, [16].
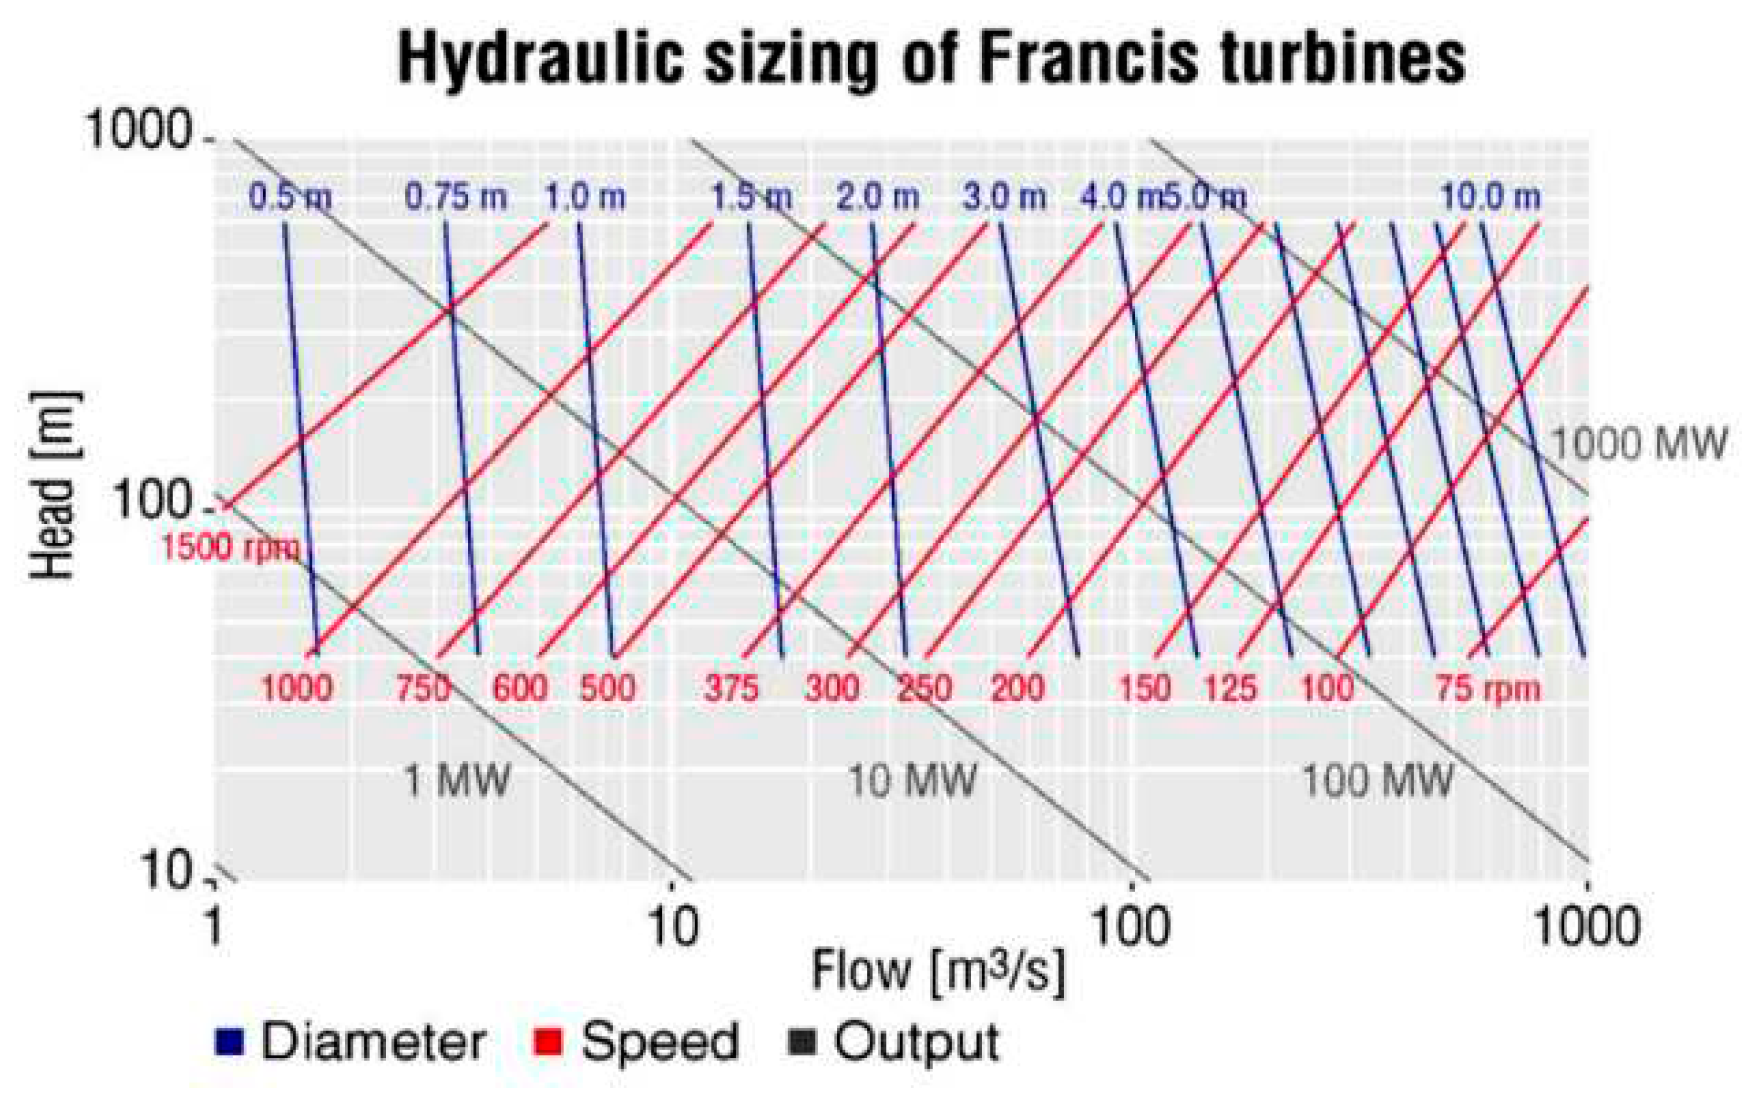
Figure 5.
Schematic of the system.
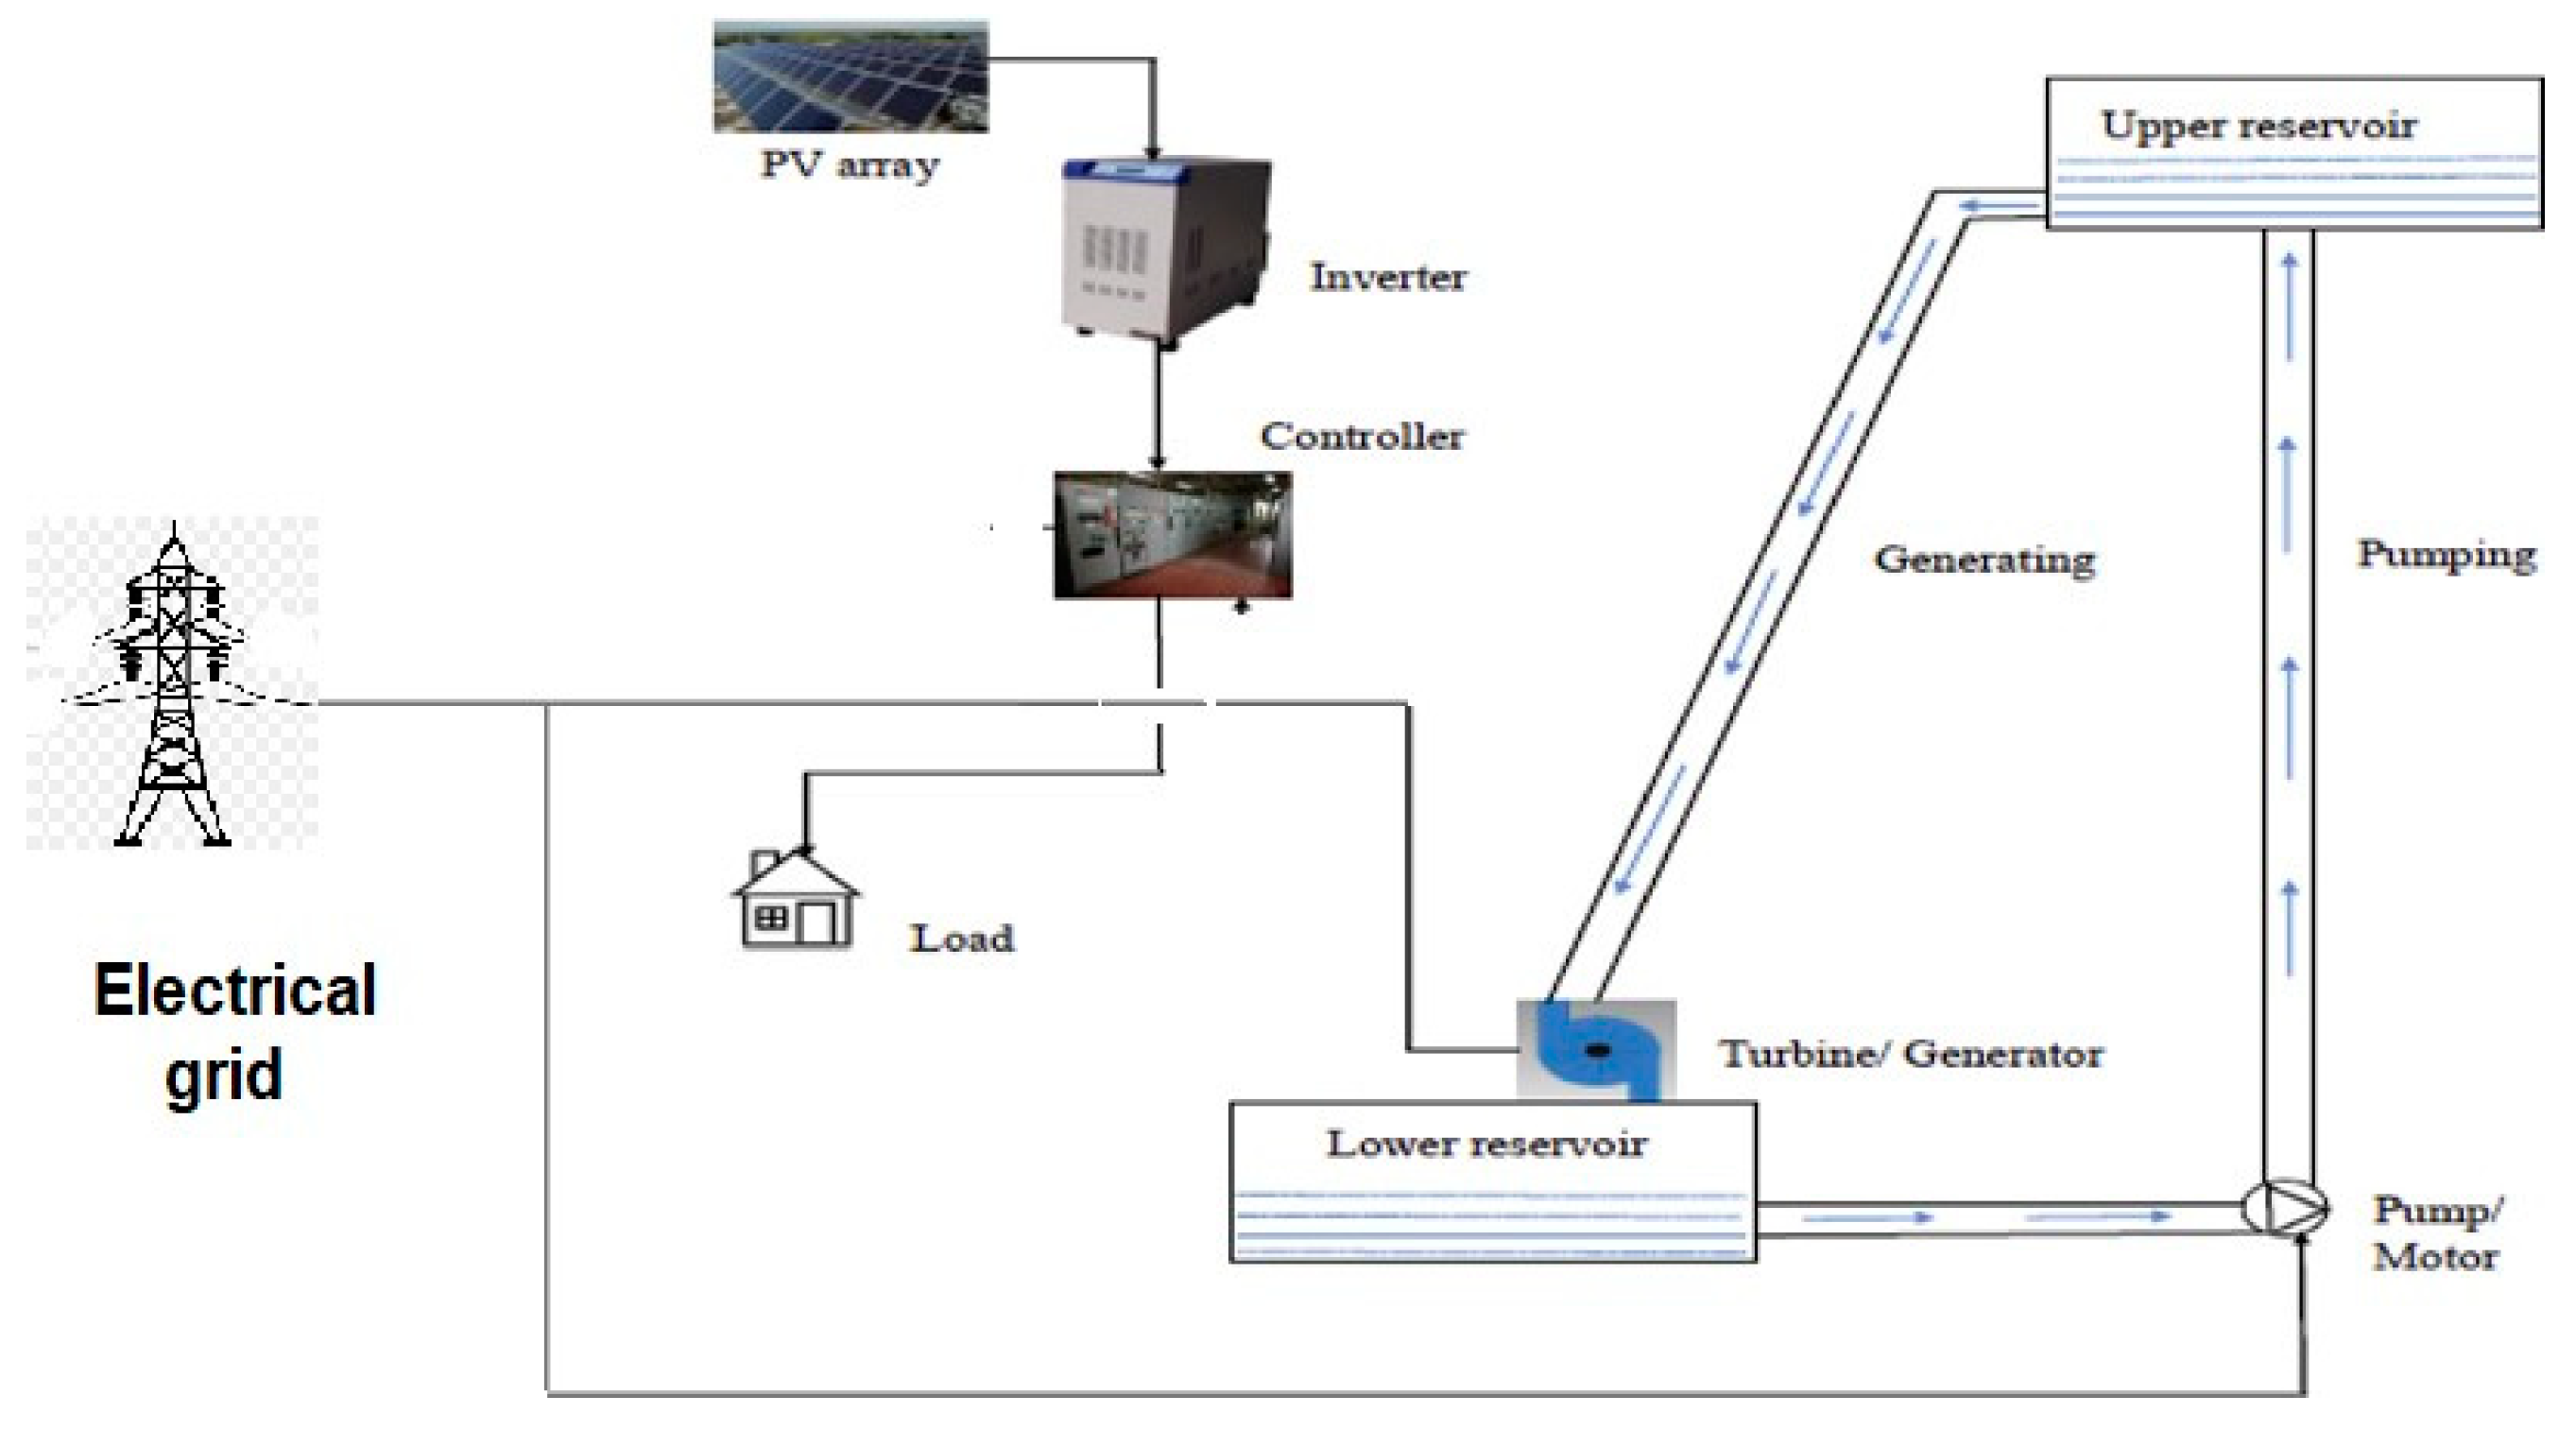
Figure 6.
Solar energy productivity data obtained from Mutah University per day.
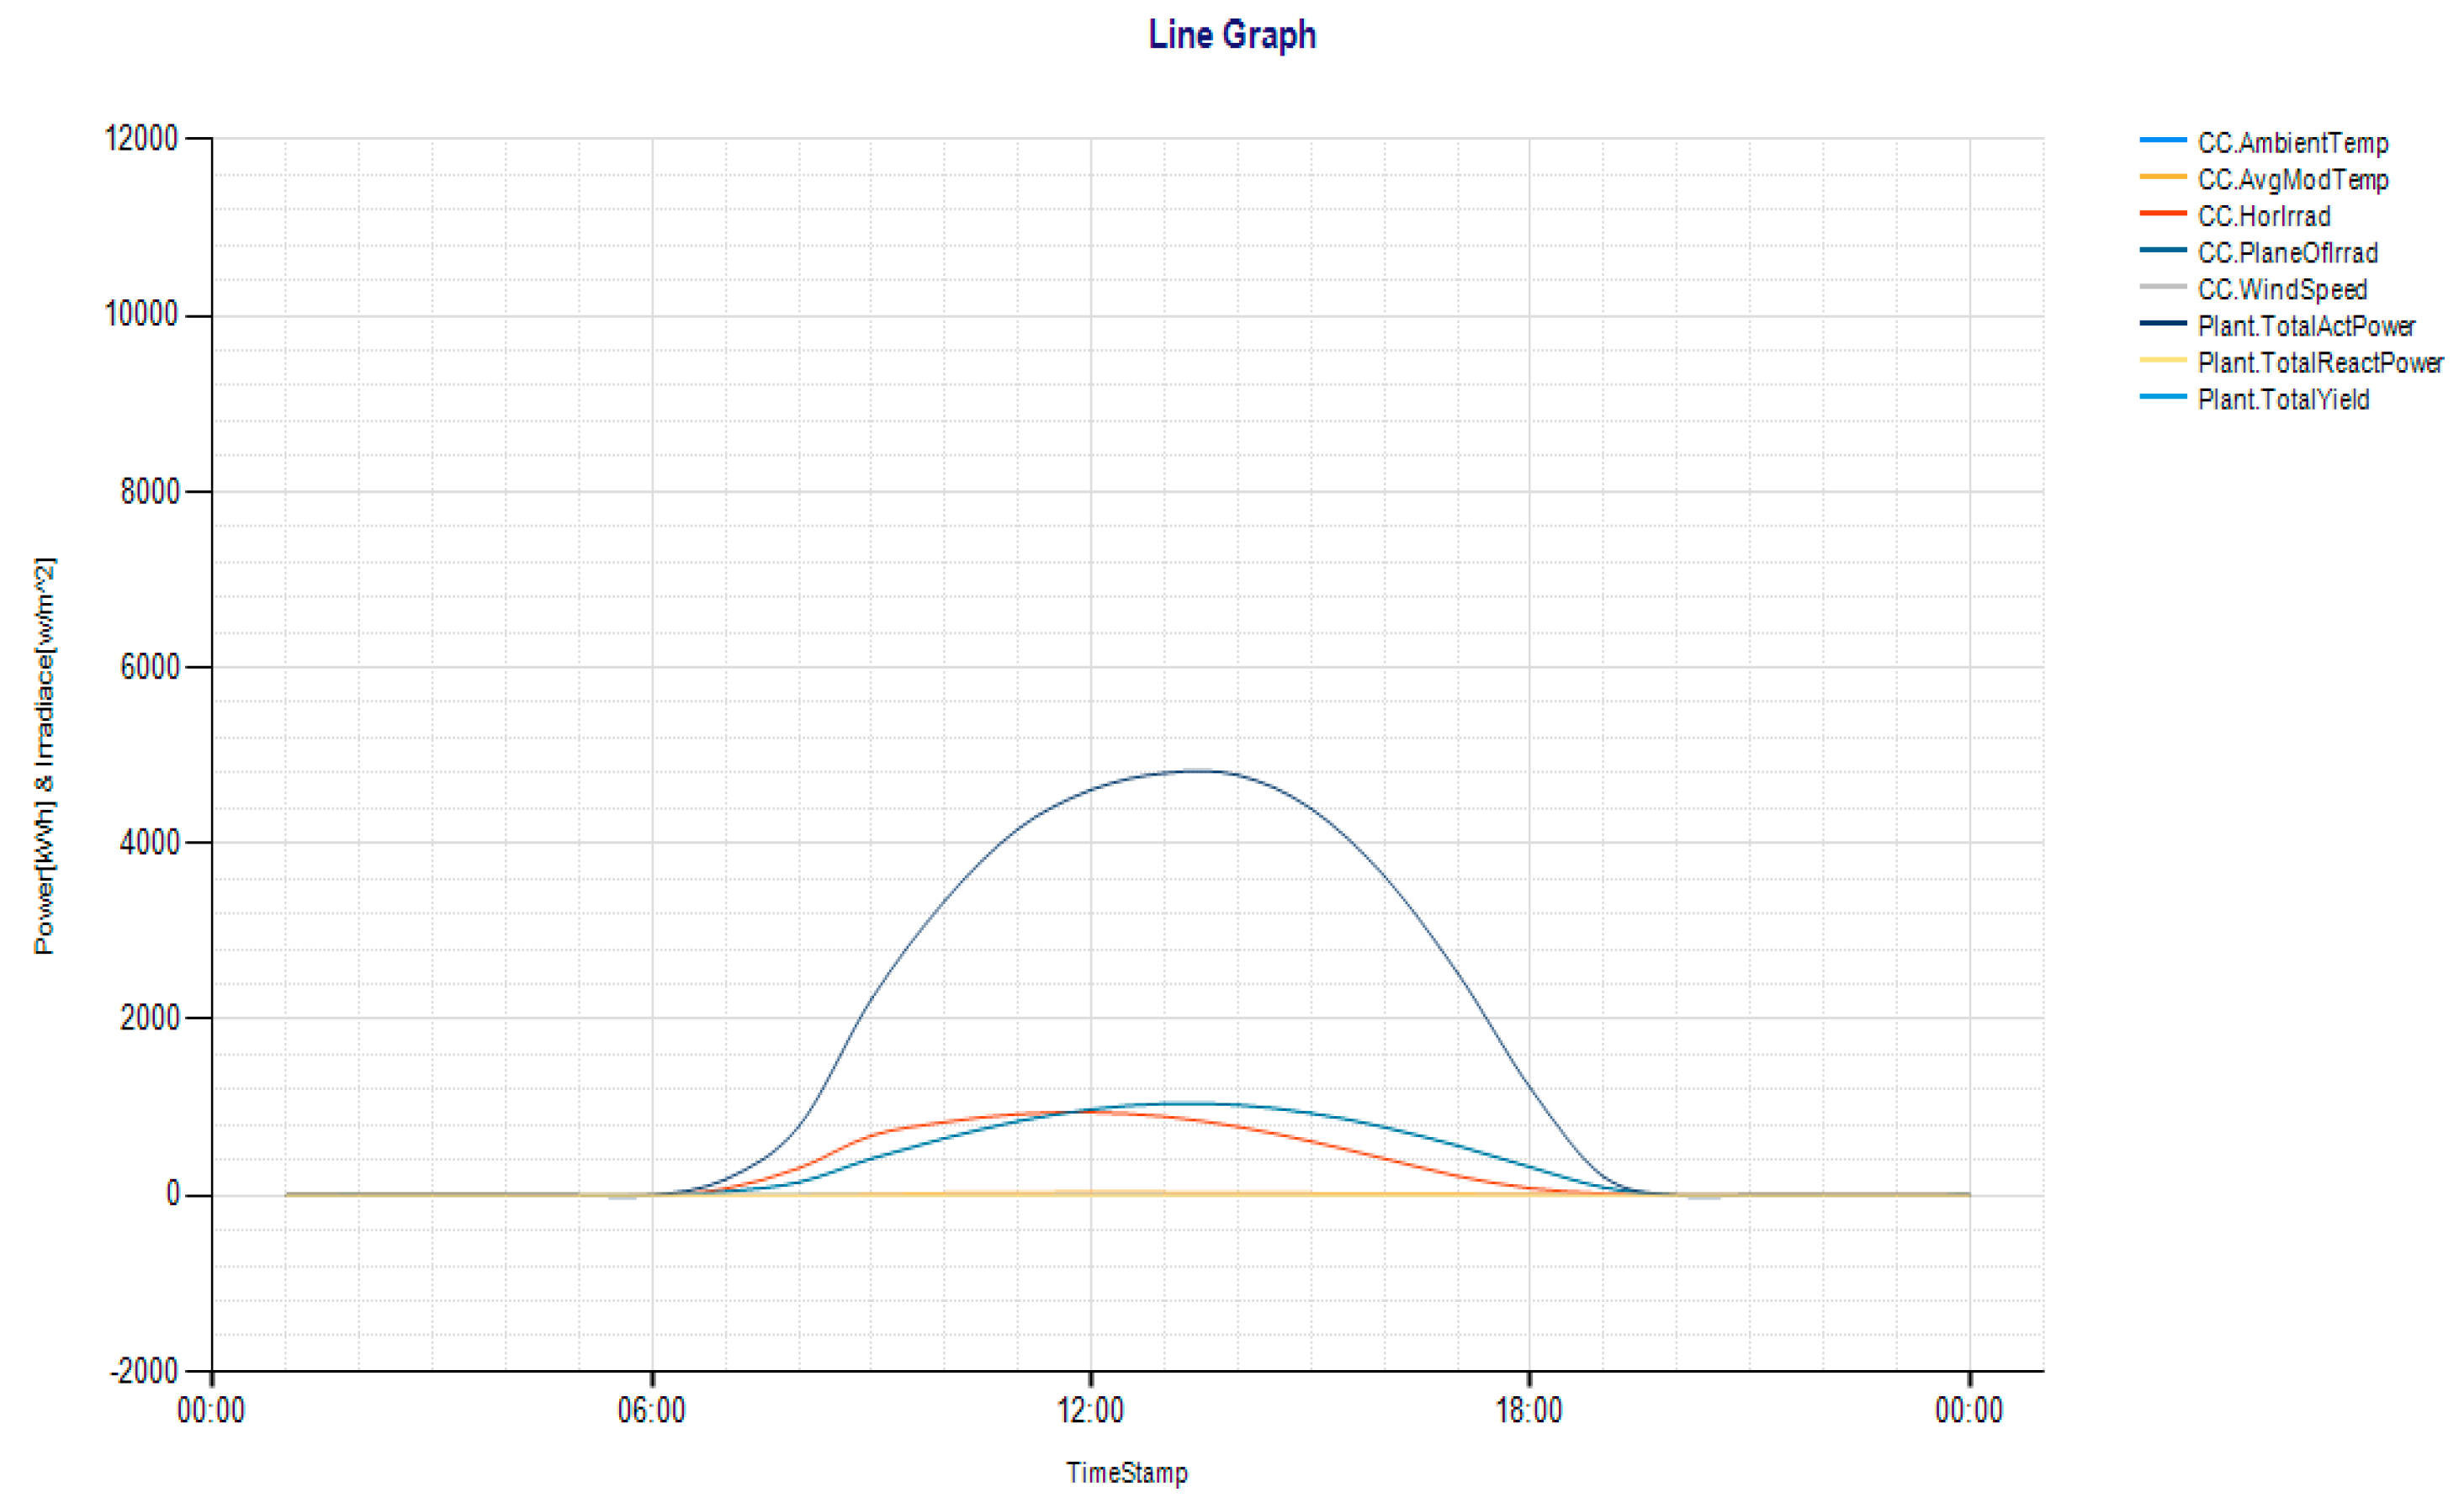
Figure 7.
Solar power plant productivity.
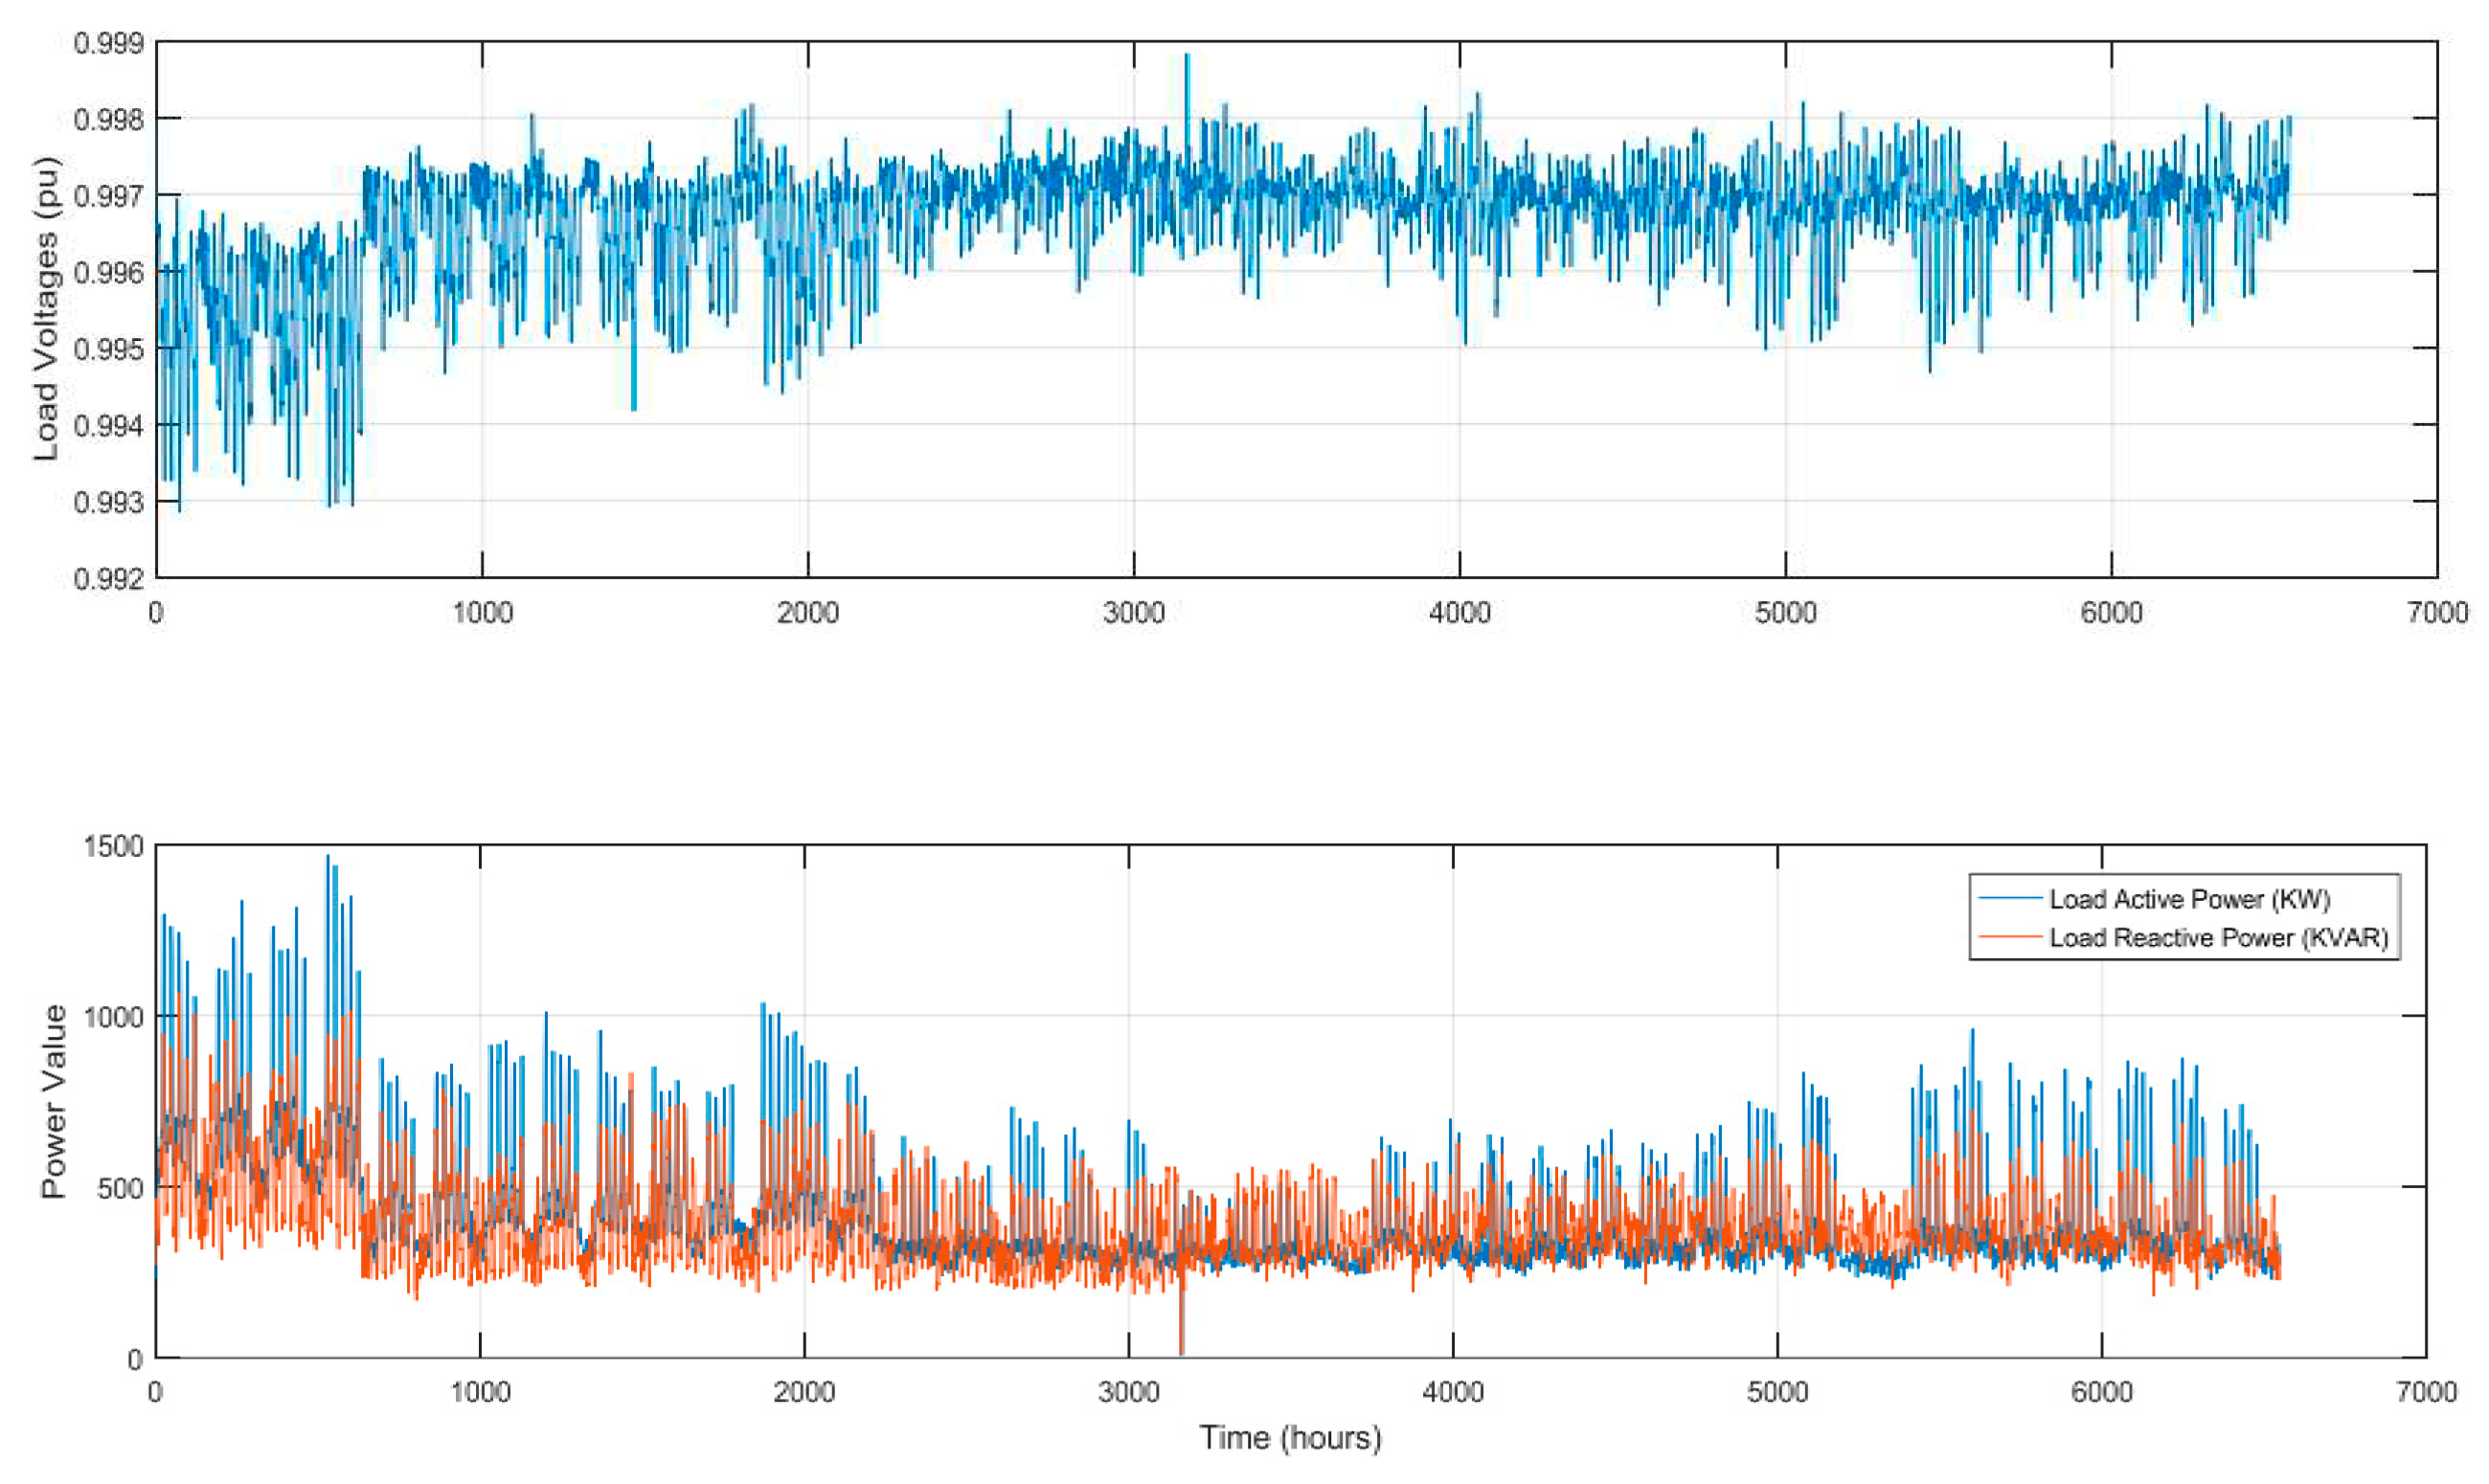
Figure 8.
Annual electricity load.
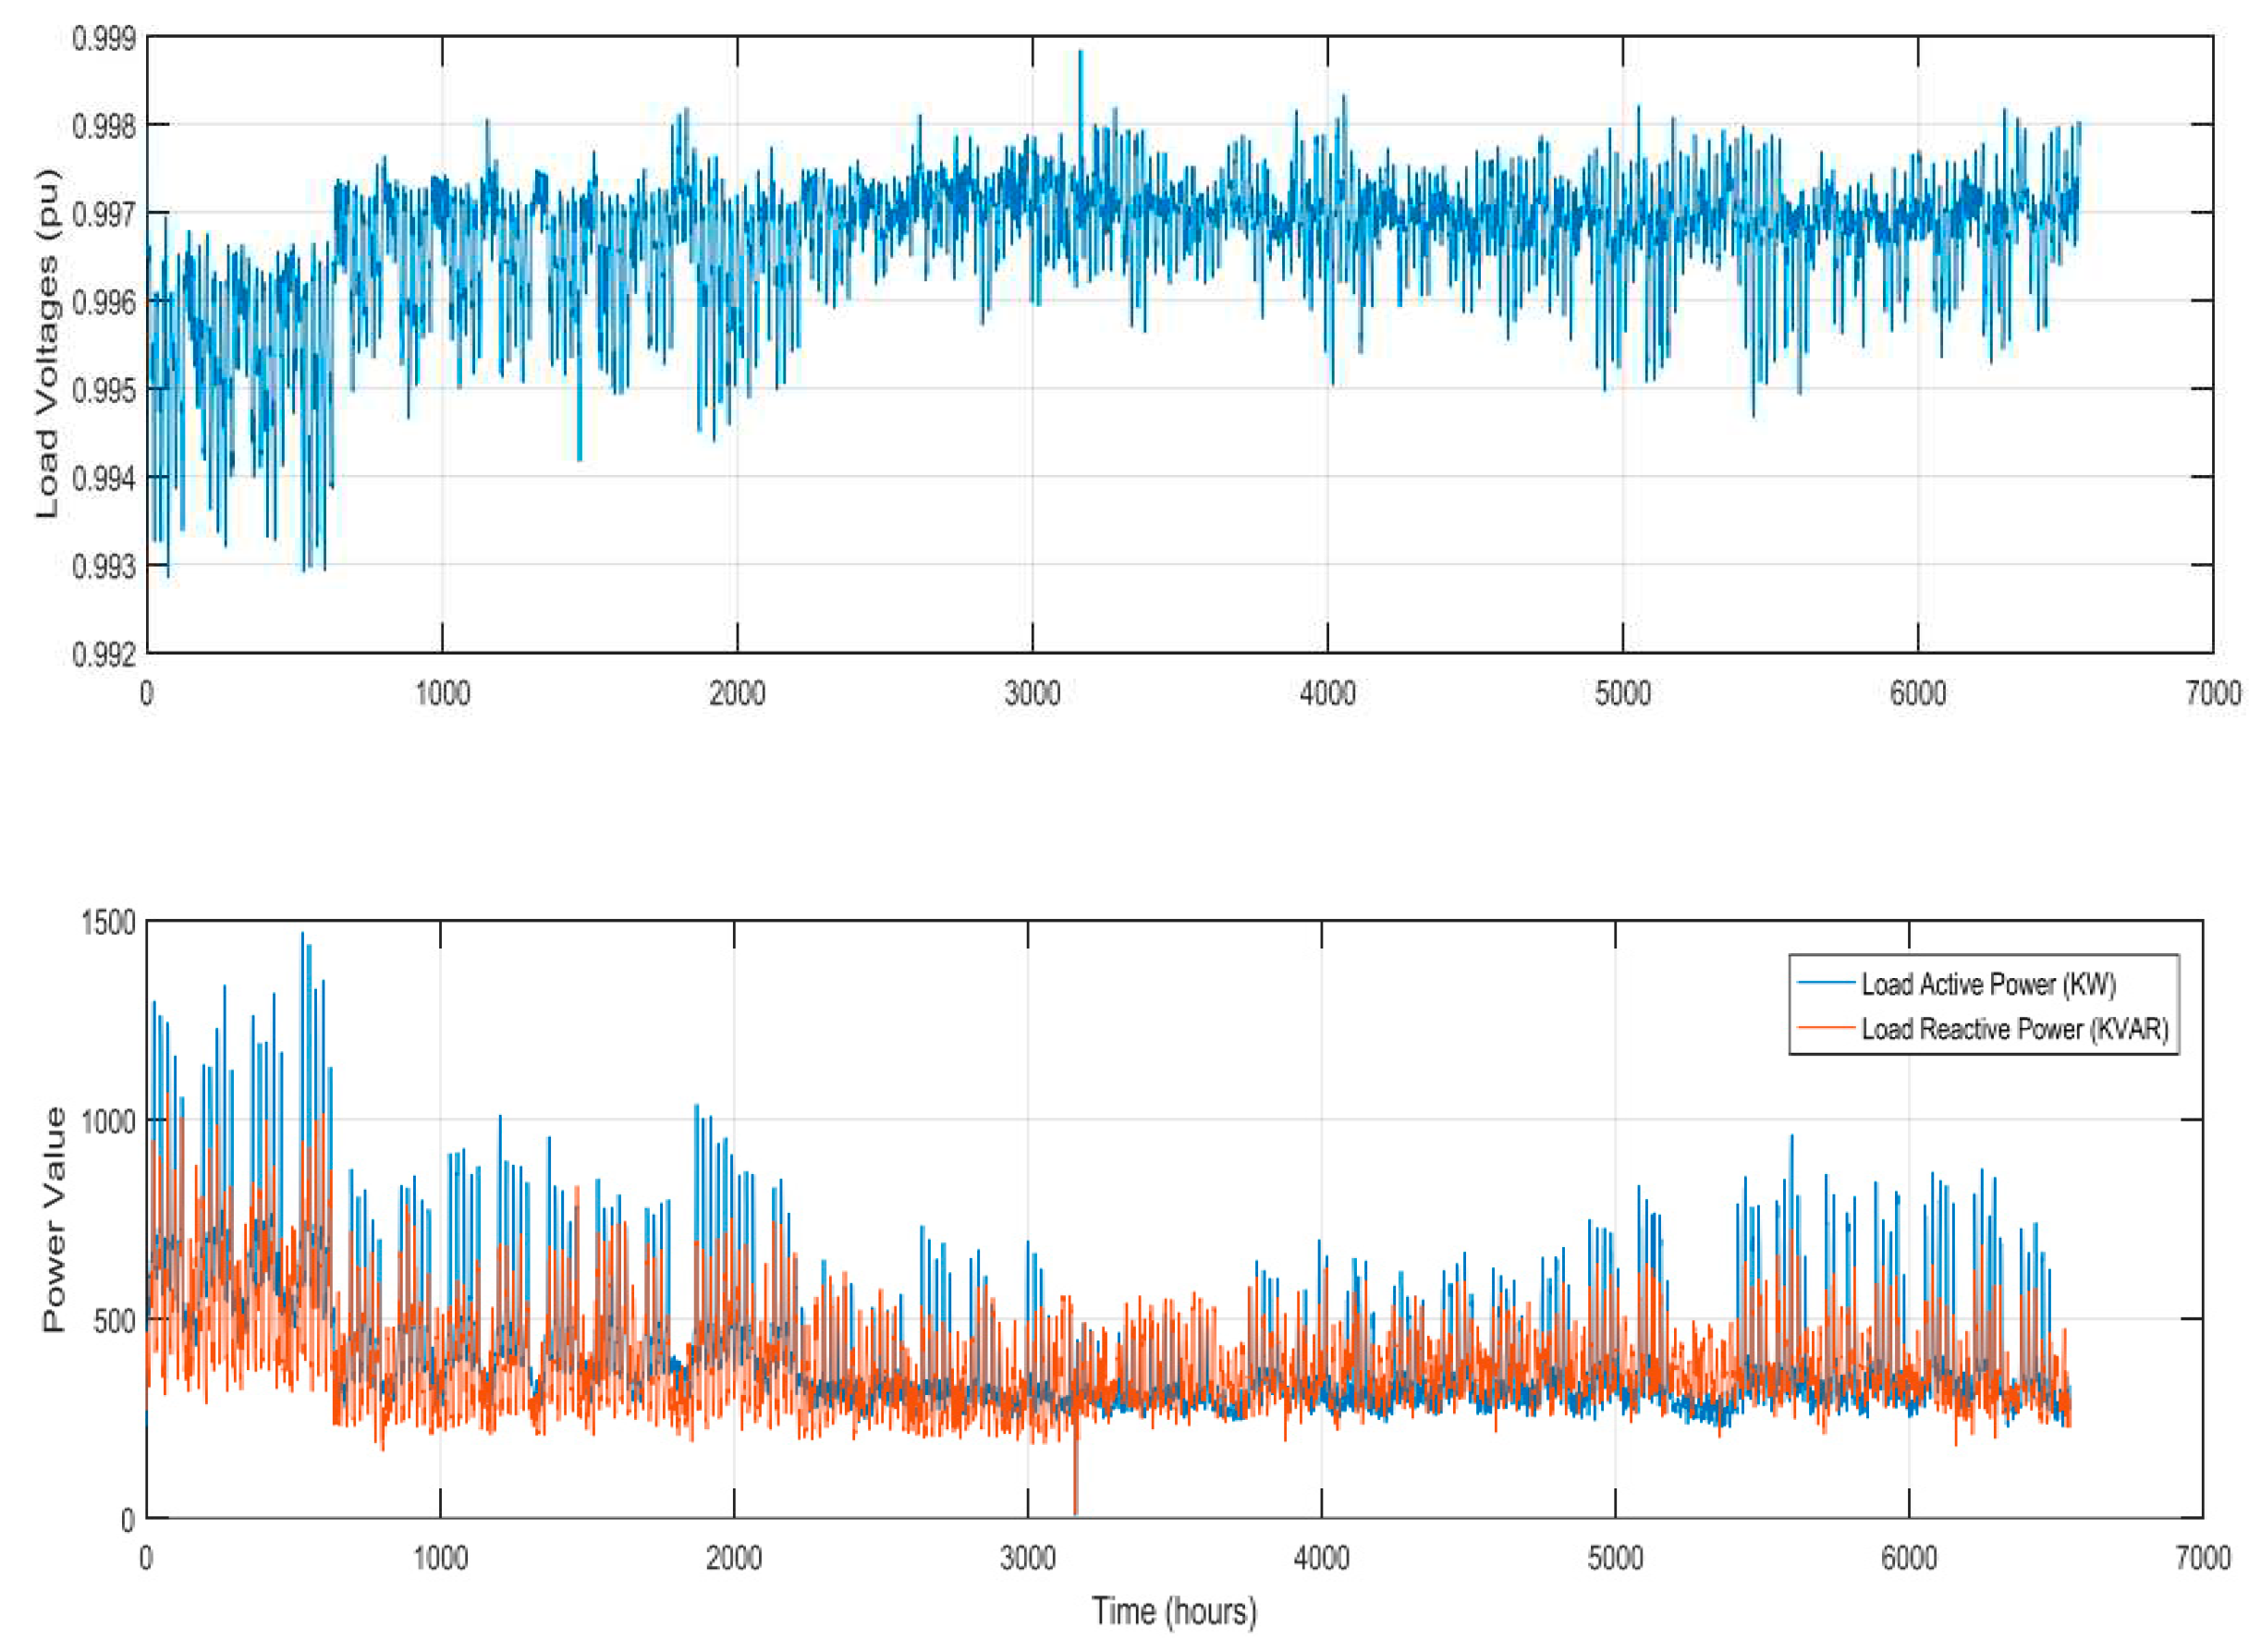
Figure 11.
Active and reactive power losses for several months.
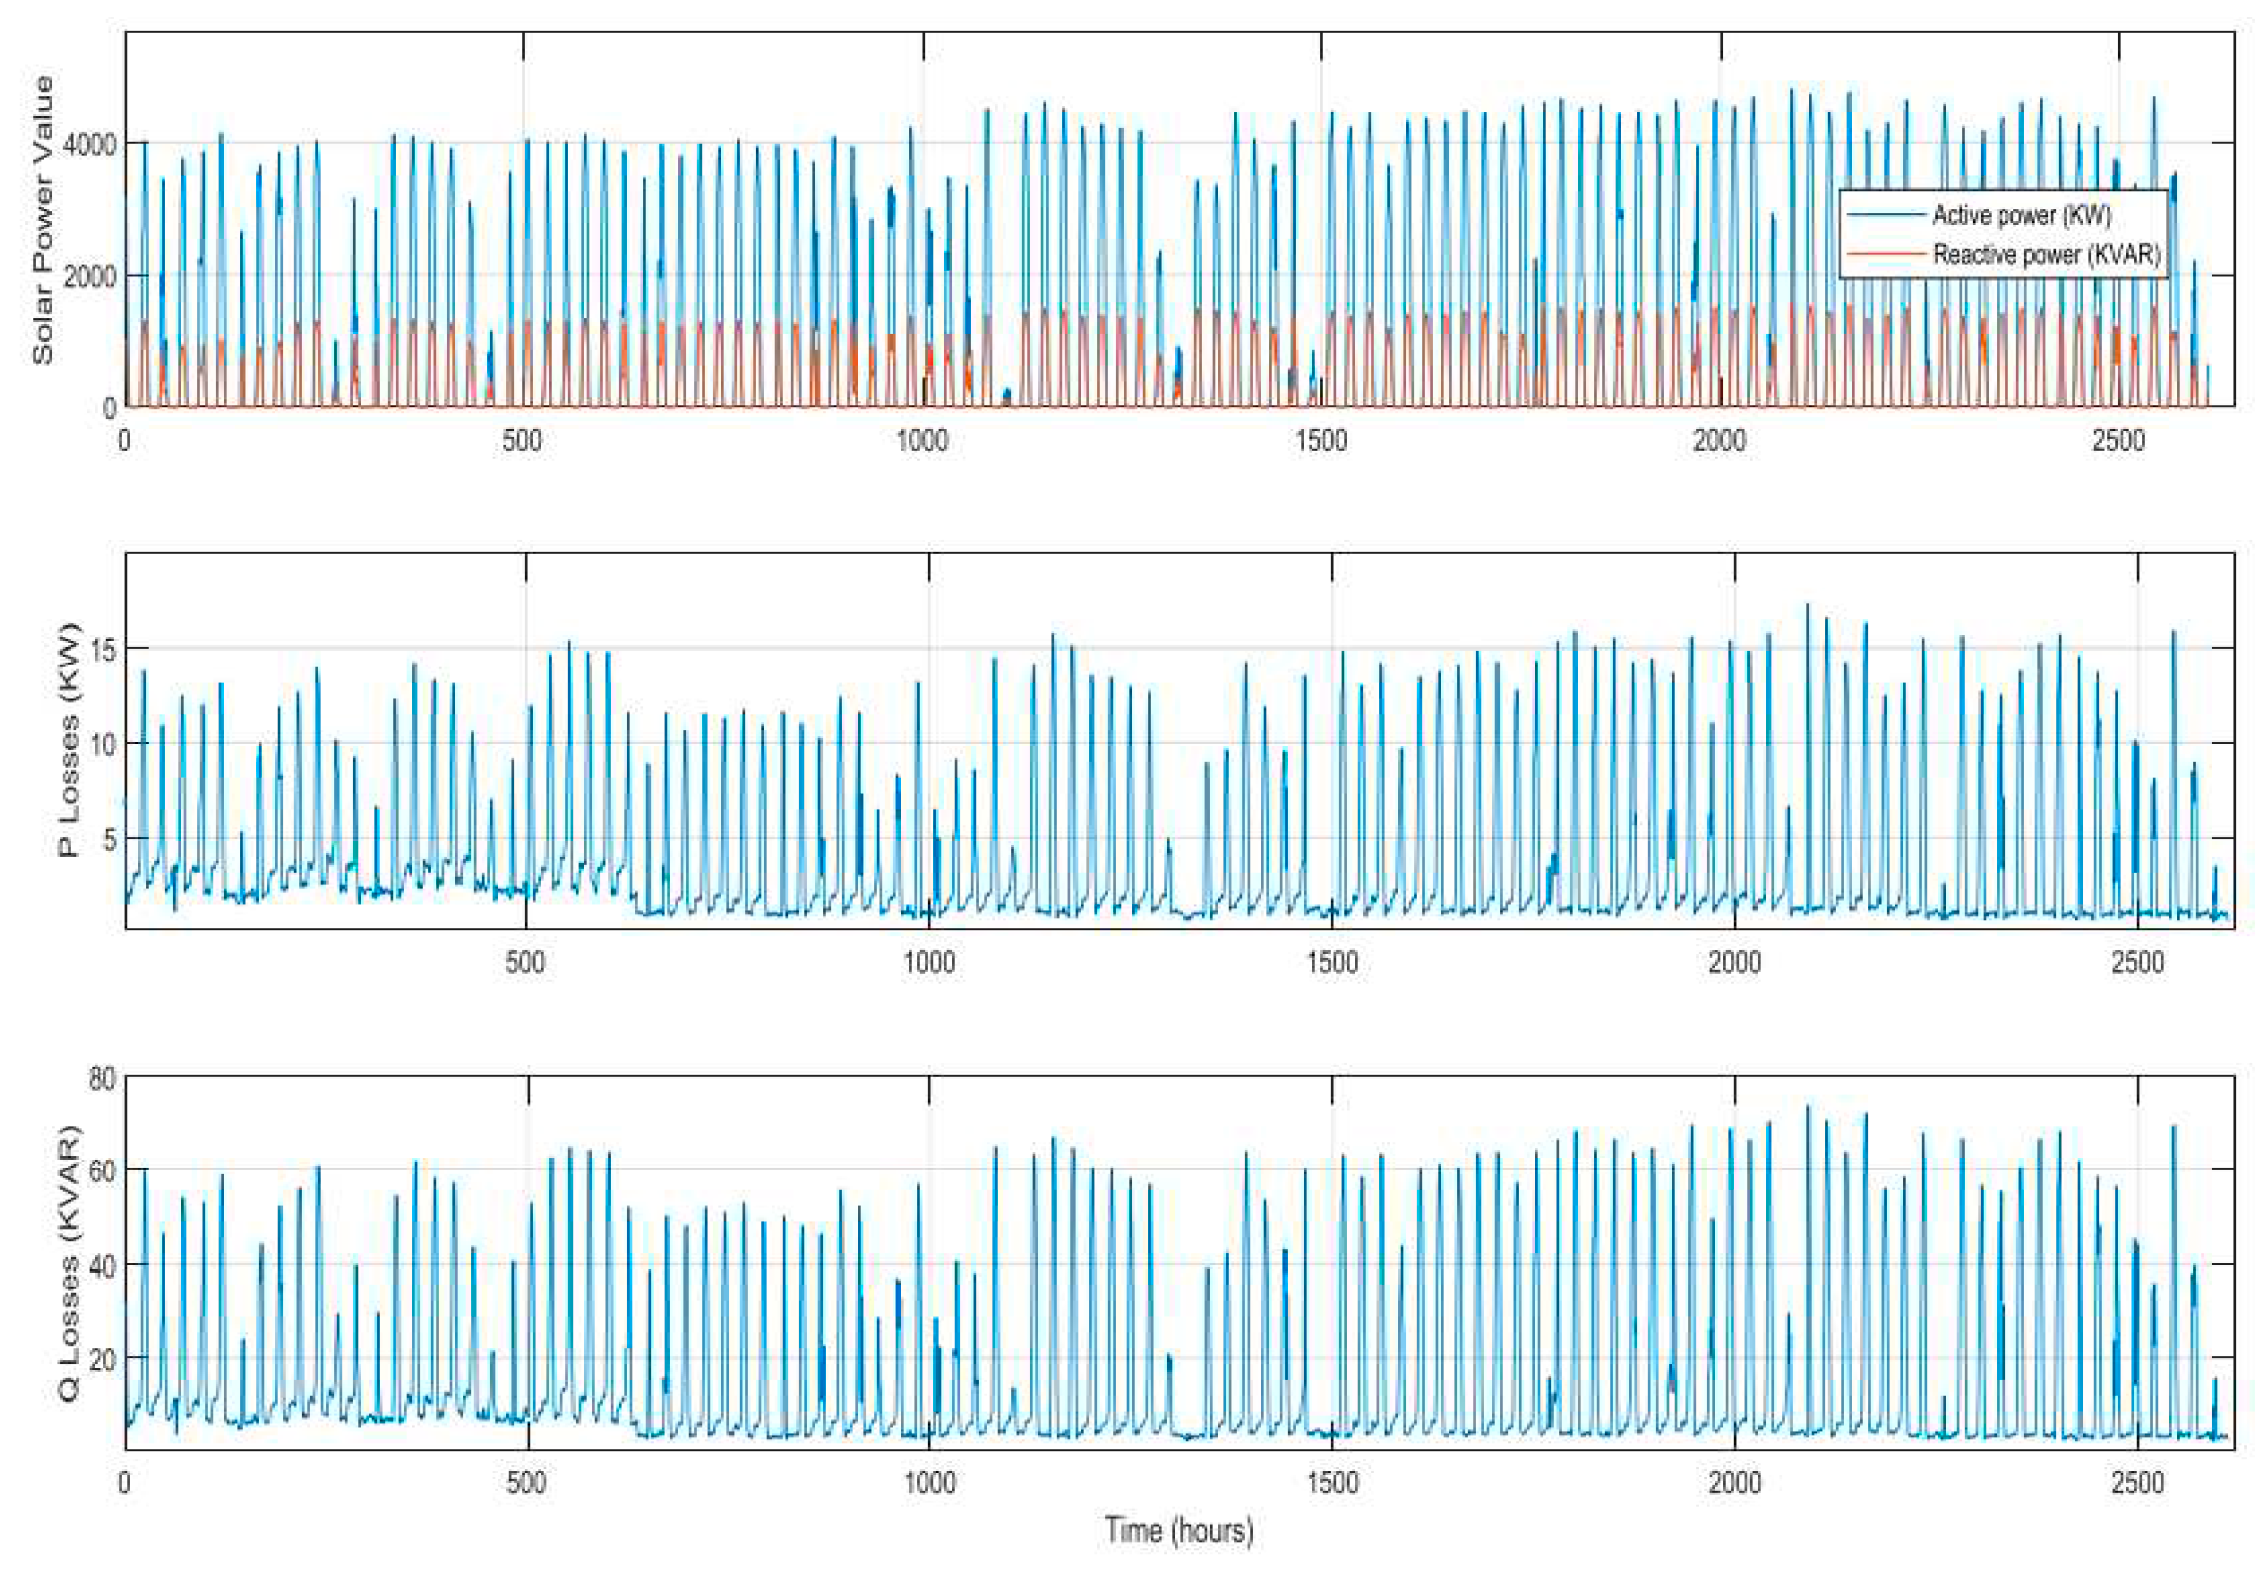

Table 1.
The proposed PHES plant parameters.
| Type of machine | Reversible pump-turbine unit (Francis) |
| Overall capacity | 5 MW |
| Unit capacity | 1 MW |
| Number of units | 5 units |
| Rated head | 85 m |
| Efficiency of generator | 90% |
| Efficiency of pump | 90% |
| Total Efficiency | 81% |
| Rated discharge of generator mode | 1.33 ( 𝑚3⁄𝑠) For each unit |
| Rated discharge of pump mode | 1.079 (𝑚3⁄𝑠) For each unit |
Table 2.
Characteristics of the modules.
| Type | JAM72S01-340/SC |
| Peak power (PMAX) | 340 W |
| Open circuit voltage(Voc) | 46.32V |
| Max. power voltage (Vmp) | 37.87 V |
| Short circuit current (Isc) | 9.60 A |
| Max power current (Imp) | 8.98 A |
| Power selection | 0--+5W |
Table 3.
Characteristics of the inverter utilized in the Mutah University project.
| PV input | 565 Vdc-1000Vdc 110 A/150A max. rated current/Isc |
| Output | 3P+PE,380/400 Vac delta 352-440 Vac @400 Vac, 87.0 A Cos(Phi):0.8…1 ..0.8 over/underexc. Max. output fault current:49.8 over ms |
| Power | 60 Kva@400 Vac, 45ºC/113ºF, Cos(Phi=1 |
| Freq. | 50/60 Hz(45-65) |
| Chassis | Outdoor IP65, Protective class I Temp. -25 ºC to 60 ºC/ -13 ºFto 140 ºF |
Table 4.
The average and Maximum power losses of the proposed PHES system.
| Average active losses (P) | 3.6062 kW |
| Maximum active losses (P) | 17.2833 kW |
| Average reactive losses (Q) | 14.4996 kVAR |
| Maximum reactive losses (Q) | 73.7099 kVAR |
Disclaimer/Publisher’s Note: The statements, opinions and data contained in all publications are solely those of the individual author(s) and contributor(s) and not of MDPI and/or the editor(s). MDPI and/or the editor(s) disclaim responsibility for any injury to people or property resulting from any ideas, methods, instructions or products referred to in the content. |
© 2023 by the authors. Licensee MDPI, Basel, Switzerland. This article is an open access article distributed under the terms and conditions of the Creative Commons Attribution (CC BY) license (http://creativecommons.org/licenses/by/4.0/).
Copyright: This open access article is published under a Creative Commons CC BY 4.0 license, which permit the free download, distribution, and reuse, provided that the author and preprint are cited in any reuse.


